1. Introduction
The Third Plenary Session of the 20th Central Committee of the Communist Party of China (CPC) explicitly proposed the need to “improve the system for promoting deep integration between the real economy and the digital economy” and to “enhance institutional mechanisms for developing new quality productive forces tailored to local conditions” [
1]. Meanwhile, the importance of promoting green and low-carbon economic and social development has become increasingly prominent. The Opinions of the State Council on Accelerating the Comprehensive Green Transformation of Economic and Social Development emphasize the necessity to “accelerate the comprehensive green transformation of economic and social development”, while adhering to innovative transformation and developing new quality productive forces [
2]. New quality productive forces represent an advanced state of productivity that emerges from enhanced quality and accelerated growth driven by scientific and technological innovation, as well as the deep integration of high-end industries. They are marked by scientific and technological innovation and constitute the core of the emerging productive momentum in China’s development process. For instance, industries such as artificial intelligence, biotechnology, and renewable energy technology, driven by technological innovation, are accelerating the advancement of new quality productive forces to a higher level, promoting the optimization and upgrading of the Chinese economy, as well as its high-quality development. The digital economy is characterized by high innovativeness, strong permeability, and broad coverage. It promotes profound changes in the structure of productivity through a multidimensional driving mechanism involving the innovative allocation of factors, revolutionary technological breakthroughs, and deep industrial transformation and upgrading. The digital economy can facilitate the transition of traditional industries toward high-end and intelligent levels, thereby contributing to the cultivation and development of new quality productive forces. The key to innovation-driven development lies in improving green innovation capability and efficiency. As a new economic driving force leading the Fourth Industrial Revolution, the digital economy presents new opportunities for improving green innovation efficiency.
Therefore, in the new era of a thriving digital economy and accelerating the comprehensive green transformation of economic and social development, exploring the impact of the digital economy on new quality productive forces and further clarifying the relationships and effects among the digital economy, green innovation efficiency, and new quality productive forces contribute to a deeper understanding of the era’s value in the deep integration of digitization and green transformation. This provides benefits for fostering new quality productive forces and promoting high-quality economic development in China with significant theoretical and practical significance.
Numerous domestic and international literatures have explored the direct impact mechanisms and effects of the digital economy. Jing Wenjun et al. (2019) [
3] analyzed theoretically how the digital economy influences economic growth and emphasized that the digital economy can contribute to optimizing and constructing China’s modern economic system, thereby promoting high-quality economic development in China. Yang Huimei et al. (2021) [
4] conducted an empirical analysis and concluded that the development of the digital economy has a positive impact on total factor productivity. They also found that the digital economy can significantly promote the enhancement of total factor productivity, providing insights for assessing the impact of the digital economy and China’s high-quality development. Zhang Yunping et al. (2023) [
5] believed that the rapidly developing digital economy is the core driving force behind all-round high-quality economic and social development and that it promotes rural construction, which will be an important direction for rural revitalization. Tian Pei et al. (2024) [
6] pointed out that the digital economy can significantly enhance the level of common prosperity. An empirical analysis by Ma Xiaoyu et al. (2024) [
7] based on China’s inter-provincial panel data shows that the digital economy can significantly promote sustainable development. In addition, several other literature have analyzed the impact of the digital economy in various fields, such as enhancing the competitiveness of trade in services [
8], driving the upgrading of industrial structures [
9], promoting the optimization of employment structure [
10], facilitating carbon emission reduction [
11], and supporting green development [
12]. As new quality productive forces represent a frontier research topic in Chinese academia, Zhou Wen et al. (2023) [
13] clarified the relationship between new quality productive forces and traditional productivity, production relations, and high-quality development by interpreting the connotative characteristics of these forces. Wang and Wang Jue et al. (2024) [
14] proposed three major components of productivity and used them to construct a comprehensive evaluation index system for new quality productive forces. On this basis, Luo Shuang et al. (2024) [
15] found that the agglomeration of core industries in the digital economy has a positive impact on the development of new quality productive forces. Currently, there is a wealth of research exploring the direct impact of the digital economy across various domains, with some scholars having already confirmed its positive effects on economic growth, rural development, and common prosperity. Among these studies, some literature has constructed indicators for the digital economy from different dimensions; however, these indicators are characterized by a limited number of sub-indicators and an incomplete scope of coverage. Furthermore, research concerning the digital economy and new quality productive forces predominantly consists of theoretical analyses, with empirical explorations being relatively scarce. Moreover, the primary dimensions for constructing indicators of new quality productive forces focus on laborers, objects of labor, and means of production, which indicates a certain perspective limitation and insufficient consideration of the comprehensive impacts, particularly on the environment.
In recent years, a number of domestic and international studies have explored the spatial effects and regional heterogeneous effects of the digital economy. Firstly, in terms of the spatial effect of the digital economy, Zhang Yinghao et al. (2022) [
16] analyzed that the impact of the digital economy varies across different regions and types of cities, and it may create a certain degree of digital isolation in terms of promoting high-quality economic development in neighboring areas. Sun Aijun et al. (2024) [
17] found that the development of a digital economy in a local region can significantly narrow the urban-rural gap within that region through the “agglomeration effect”. Meanwhile, due to the existence of the “siphon effect”, the development of a digital economy in a local region can significantly widen the urban-rural gap in adjacent regions. A study by Zhang Xing et al. (2023) [
18] revealed the spatial spillover effect of the digital economy on environmental pollution, meaning that when the digital economy mitigates environmental pollution in one region, it often leads to similar impacts in neighboring regions. Zou Shaohui et al. (2024) [
19] conducted an empirical analysis and found that the digital economy has a spatial spillover effect on urban total factor productivity. Secondly, in terms of the regional heterogeneous effect of the digital economy, Kong Fangxia et al. (2023) [
20] pointed out that the impact of the digital economy development on industrial green transformation exhibits regional heterogeneity, specifically with more significant effects in developed eastern regions compared to less developed central and western regions. Zhang Shibin et al. (2024) [
21] found that the promotion effect of the digital economy on urban-rural integrated development shows the trend of “megacities > supercities > large, medium, and small cities” and “high administrative level > low administrative level”. Sui Shumin et al. (2025) [
22] focused on the differentiated impacts of digital economy development on the employment quality of laborers across different regions. Specifically, they found that the digital economy significantly narrows the employment quality gap between regions with high human capital and those with low human capital, but it has no significant impact on the Chengdu-Chongqing Economic Zone or Northeast China. The existing literature indicates that the digital economy exhibits significant spatial effects in terms of economic development, urban-rural disparities, environmental pollution, and urban total factor productivity, with varying impacts on different regions and cities. However, current research on the spatial spillover effects and regional heterogeneity effects of the digital economy on new quality productive forces remains relatively scarce.
Some literature has also explored the indirect impact effects and threshold characteristics of the digital economy. Firstly, in terms of the indirect impact effects of the digital economy, Zhao Tao et al. (2023) [
23] and Ding Chenhui et al. (2021) [
24] empirically tested and found that the digital economy can promote high-quality economic development by enhancing entrepreneurship and technological innovation, respectively. Chen Xinxin et al. (2022) [
25] examined the mediating effect of the agglomeration economy and found that the digital economy can promote the formation of an agglomeration economy, thereby driving coordinated urban-rural development. Wu Yu et al. (2024) [
26] showed that industrial structure plays a positive mediating role in the process of the digital economy enhancing regional green innovation efficiency. Yu Wei et al. (2025) [
27] found that the digital economy can promote the development of new quality productive forces through two pathways: accelerating the process of market-oriented reforms and advancing the upgrading of industrial structures. Secondly, in terms of the threshold characteristics of the digital economy, Du Chuanzhong et al. (2021) [
28] found that the digital economy can enhance the technological complexity of the manufacturing industry’s exports, and this enhancement effect is influenced by the digital and intelligent upgrading of the manufacturing industry itself, which demonstrates the threshold characteristics. Peng Wenbin et al. (2024) [
29] argued that the development of the digital economy in the Yangtze River Delta region has facilitated the improvement of carbon emission efficiency. However, this facilitating effect exhibits significantly different threshold characteristics for different types of industrial agglomerations. Zhang Yongqiang et al. (2023) [
30] the digital divide can widen urban-rural consumption, and the impact of the digital economy on the urban−rural consumption gap exhibits an inverted U-shaped nonlinear relationship. Zhang Yongqiang et al. (2023) [
30] believed that the digital divide exacerbates the urban-rural consumption disparities, but as the scale effect of the digital economy becomes prominent, the inclusiveness of the digital economy is further enhanced, which helps to narrow the urban-rural consumption gap. In other words, the impact exhibits a nonlinear relationship with an inverted U-shape. Wang Shijin et al. (2024) [
31] indicated that with further increases in openness, the digital economy would better promote the high-quality development of China’s manufacturing industry, whereas with the continuous intensification of environmental regulation, the digital economy exhibits nonlinear characteristics of diminishing marginal impact on the high-quality development of China’s manufacturing industry. The literature on the indirect impact effects of the digital economy primarily focuses on pathway research on how the digital economy promotes high-quality economic development, coordinated urban-rural development, and the development of new quality productive forces. However, from the perspective of transmission mechanisms, there is a lack of relevant research on the indirect relationship between the digital economy and new quality productive forces from the perspective of green innovation efficiency. Additionally, the indicators constructed for green innovation efficiency consider only a single dimension and are thus not comprehensive enough. In terms of threshold characteristics, there is a considerable amount of existing research on threshold characteristics or nonlinear relationships associated with the digital economy. However, there is limited literature exploring the threshold characteristics between the digital economy and new quality productive forces.
By reviewing the aforementioned domestic and international literature, several observations can be made: Firstly, in recent years, there has been a wealth of research on the digital economy, primarily focusing on its direct and indirect impact mechanisms and effects, spatial and regional heterogeneity effects, as well as nonlinear effects. Research on new quality productive forces has mainly centered on their basic connotations and the construction of indicator systems. Secondly, current literature exploring the relationship between the digital economy and new quality productive forces primarily focuses on the direct impacts and theoretical analyses, with a limited number of publications, incomplete framework systems, inadequate transmission mechanisms, and incomplete research hierarchies. Thirdly, there is a lack of research that comprehensively considers the establishment of integrated indicator systems, multidimensional relationships, mechanisms of action, transmission mechanisms, and effect measurements for the digital economy, green innovation efficiency, and new quality productive forces. Fourthly, there is a lack of empirical evidence and countermeasures regarding how the development of the digital economy influences new quality productive forces by promoting green innovation efficiency. Based on this, the marginal contributions of this paper are mainly manifested in four aspects: Firstly, it integrates the digital economy, green innovation efficiency, and new quality productive forces into a unified framework for analysis, deeply revealing their theoretical transmission mechanisms and relationships, thereby broadening the research perspectives and methodologies on the digital economy. Secondly, by utilizing the entropy method and the unexpected output super-efficiency model to construct an indicator system, it offers a more systematic, comprehensive, and rational reflection of the development levels of the digital economy, green innovation efficiency, and new quality productive forces across various regions, thereby enriching the hierarchy of variable indicators and comprehensive evaluation systems. For example, differing from the indicator construction in existing research, this study measures new quality productive forces from three dimensions: scientific and technological productive forces, digital productive forces, and green productive forces; evaluates the digital economy from four aspects: infrastructure, development environment, digital industrialization, and industrial digitization; and assesses green innovation efficiency from three perspectives: input indicators, expected output indicators, and unexpected output indicators. Thirdly, it quantitatively analyzes the multidimensional effects of the digital economy on new quality productive forces, deeply revealing its fixed effects, heterogeneity effects, spatial effects, mediation effects, moderated mediation effects, and threshold effects, encompassing both direct and indirect impact effects, as well as linear and nonlinear dynamics, thereby expanding the research hierarchy of this topic. Fourthly, by providing countermeasures and suggestions for accelerating the construction of digital infrastructure, vigorously enhancing green innovation efficiency, promoting the deep integration of digitalization and greenization, and facilitating industrial upgrading and coordinated development, it offers valuable empirical insights for China’s transformation path selection and sustainable, high-quality development.
2. Theoretical Mechanisms and Research Hypotheses
The progression of digital economic development will spawn innovation, facilitate industrial upgrading, and foster new modes of production, with the application of digital technology serving as a precursor and scientific and technological innovation acting as an engine, thereby driving the high-quality development of new quality productive forces. Firstly, digital transformation empowers technology-driven innovation and development. By leveraging the advantages of data as a factor of production, the digital economy facilitates the flow and allocation of various production factors, effectively enhancing traditional production efficiency and innovation capabilities, significantly accelerating the pace of technological innovation, and fostering the gestation and formation of new quality productive forces. Secondly, the integration of digital and real economies empowers industrial convergence and development. The digital economy can optimize industrial structures through digital technology, promote the digital transformation and upgrading of industries, improve production and service efficiency upstream and downstream of industrial chains, facilitate comprehensive changes in the quality and efficiency of traditional productivity, and accelerate the development of new quality productive forces. Thirdly, digital transformation empowers societal operations. The integration of digital and real economies resulting from digital technology has brought profound changes to productivity, production relations, modes of production, and value distribution, creating new growth drivers for economic and social development and driving the transformation of traditional productivity into new quality productive forces. Based on this information, the following hypothesis is proposed:
Hypothesis 1. The digital economy can facilitate the development of new quality productive forces.
As a large country with vast territories, China’s four major economic regions— East, Central, West, and Northeast—exhibit uneven distribution in terms of infrastructure, geographical conditions, natural resources, and economic development levels. The combined effects of resource endowment differences and institutional disparities result in a regional layout where the level of digital development is higher in the East and lower in the West. The more developed regions in the East, with their advantages in the accumulation of human, financial, and material resources, can facilitate the rapid development of the digital economy, which is more conducive to promoting the formation of new quality productive forces. Conversely, in less developed regions, digital infrastructure and technological proficiency are relatively low, and digital access and application gaps may hinder the manifestation of the digital economy’s stimulatory effect on new quality productive forces. Consequently, the effects and functionalities of the digital economy in enhancing new quality productive forces exhibit significant regional heterogeneity. Based on the aforementioned information, the following hypothesis is proposed:
Hypothesis 2. The impact of the digital economy on new quality productive forces exhibits regional heterogeneity.
With increasing economic interconnectedness among regions resulting from the dismantling of geographical segmentation and regional barriers, the interactive effects between different regions have become more prominent. The development of a digital economy in one region not only influences the growth of new quality productive forces within that region, but may also exert spillover effects on neighboring regions. By relying on digital technology and data elements, as well as their inherent characteristics of permeability, integration, and synergy, the digital economy has broken the temporal and spatial constraints of information transmission, enhancing the breadth and depth of economic activity connections between cities. This not only accelerates the flow of social resources and production factors between regions but also strengthens cross-regional exchanges and interactions among enterprises. Therefore, the digital economy not only promotes the development of new quality productive forces within a region but also generates spatial spillover effects on the development of new quality productive forces in neighboring regions. Based on the aforementioned information, the following hypothesis is proposed:
Hypothesis 3. The impact of the digital economy on new quality productive forces exhibits spatial spillover effects.
Green innovation, which integrates the development concepts of “green” and “innovation”, has emerged as a crucial support for stable economic growth, green development, and low-carbon transformation in China’s economy. Green innovation serves as the core driving force behind green development and is an intrinsic requirement for the development of new quality productive forces. Digitalization and intelligent technologies provide robust support for green technological innovation and research and development, effectively enhancing labor productivity and resource utilization efficiency. This propels regions toward a smarter, more environmentally friendly, and sustainable direction, facilitating a transition toward high-end, intelligent, and green development, thereby improving the quality of regional development and contributing to the growth of new quality productive forces. Consequently, the development of a digital economy can enhance green innovation efficiency, which is conducive to achieving green technological transformation and promoting the formation and development of new quality productive forces. Based on the aforementioned information, the following hypothesis is proposed:
Hypothesis 4. Green innovation efficiency has a mediating effect on the impact of the digital economy influencing new quality productive force.
Traditional industries constitute the material foundation for the formation of new quality productive forces, and their transformation and upgrading are pivotal for cultivating new quality productive forces. Therefore, upgrading industrial structures is of significant importance for the development of new high-quality productive forces. This upgrading primarily achieves significant enhancement in green innovation efficiency through three mechanisms: economic growth, talent aggregation, and digital information enhancement. The economic growth effect refers to the green value-added achieved by broadening the industrial chain as a result of industrial structure upgrading. The talent aggregation effect manifests as intellectual input and service support provided by the tertiary industry to the secondary industry, reducing enterprises’ search costs for talent and breaking the constraints of insufficient green innovation input within enterprises, thereby accelerating the green innovation process. The digital information enhancement effect signifies the improvement of the information infrastructure during the digital transformation of industries, providing innovative information platforms and carriers. This significantly accelerates the flow and diffusion of green innovation information elements between production and application departments, reduces information asymmetry in enterprises’ innovation activities, and enhances green innovation efficiency. Ultimately, the transformation and upgrading of traditional industries or the elimination of backward industries at the end of the chain can not only optimize the rational allocation of industry resources and significantly improve resource utilization efficiency, but also promote the extension and green upgrading of the entire industrial chain, further facilitating the nurturing of new quality productive forces. Based on the aforementioned information, the following hypothesis is proposed:
Hypothesis 5. Industrial structure upgrading moderates the mediating effect of the digital economy on new quality productive forces, specifically moderating the facilitating role of green innovation efficiency on new quality productive forces.
The efficiency of green innovation is primarily reflected in the input-output ratio indicators of environmentally friendly technological innovation. This refers to the process of enhancing resource utilization efficiency, reducing production costs, and minimizing environmental burdens through technological and management innovations in production and consumption processes, thereby promoting the sustainable and healthy development of the regional economy. In the process of the digital economy driving the development of new quality productive forces, with an increase in investment in the research and development of green innovation technologies, green innovation efficiency is enhanced, leading to the development and application of more environmentally friendly technologies. This will result in significant changes in business models and production methods, effectively reducing pollution issues in traditional production processes across regions, improving production efficiency, reducing resource consumption, and achieving more rational resource allocation. Consequently, this propels economies toward development in a smarter, more environmentally friendly, and more sustainable direction. Therefore, the enabling effect of the digital economy on new quality productive forces may exhibit a threshold characteristic of “increasing marginal effects”.
Hypothesis 6. The impact of the digital economy on new quality productive forces exhibits nonlinear characteristics due to differences in the degree of green innovation efficiency.
3. Research Design
3.1. Data Sources
This study takes 31 provinces in China as the research object, and the time span is selected from 2012 to 2022, considering the availability of provincial-level panel data and sample comparability. The main data sources include WIND, CSMAR, CEIC China Premium Database, the website of the National Bureau of Statistics, the website of China National Intellectual Property Administration, the Peking University Digital Inclusive Finance Index, as well as various annual statistical yearbooks, including the “China Statistical Yearbook”, “China Financial Yearbook”, “China Industrial Statistical Yearbook”, “China Energy Statistical Yearbook”, “China Environmental Statistical Yearbook”, “China Information Industry Yearbook”, “China Science and Technology Statistical Yearbook”, “China High-tech Industry Statistical Yearbook”, and the statistical yearbooks of individual provinces. To ensure the consistency and completeness of the sample data, the linear interpolation method is employed to estimate and complete missing data for certain years or regions.
3.2. Description of Variables
3.2.1. Explained Variable
The explained variable in this study is the new quality productive force, denoted as NQPF. In the context of industrial transformation and upgrading toward intelligence, informatization, and green development, this study builds upon the “three-in-one” comprehensive indicator system established by Lu Jiang et al. (2024) [
32] and Cao Dongbo et al. (2024) [
33]. Drawing on the research methods of Cai Xiangjie et al. (2024) [
34], Han Wenlong et al. (2024) [
35], and Ren Yuxin et al. (2024) [
36], we have optimized and adjusted the third-class and fourth-class indicators. This indicator system is characterized by high comparability, strong representativeness, and ease of measurement, and aims to objectively and comprehensively reveal the development status of new quality productive forces. The indicator system for the new quality productive forces is shown in
Table 1, and the overall index is calculated using the entropy method.
3.2.2. Explanatory Variable
The explanatory variable is the digital economy, which is denoted by DIGI. Drawing on the “Statistical Classification of Digital Economy and Its Core Industries (2021)” published by the National Bureau of Statistics, as well as relevant indicator measurement methods from Pan Xinyue et al. (2024) [
37] and Li Zheng et al. (2023) [
38], this study constructs a comprehensive indicator system that encompasses four dimensions: infrastructure, development environment, digital industrialization, and industrial digitization, with a total of 20 indicators, as shown in
Table 2. The entropy method is further used to calculate the overall index of the digital economy.
3.2.3. Control Variables
Considering the multifaceted influences on the new quality productive forces, the following control variables are selected with reference to the existing literature: the economic development level (PGDP), measured by regional GDP per capita; the market development level (MDL), represented by the marketization index; the degree of government intervention (GOV), indicated by the ratio of general budget expenditure to general budget revenue of local governments; the level of opening (OPEN), assessed by the ratio of total import and export trade to GDP; the urbanization level (URB), measured by the proportion of the urban population to the total population; the old-age dependency level (ODR), reflecting the population structure and represented by the dependency ratio of the elderly population; and the education level (EDU), quantified by the ratio of students enrolled in ordinary institutions of higher learning to the total population.
3.2.4. Mediating Variable
The mediating variable is green innovation efficiency (GIE). To measure the green innovation efficiency of various regions from 2012 to 2022, we employ the Super-Slacks-Based Measure (Super-SBM) model, which was utilized by Shi Fengguang et al. (2023) [
39]. The calculation method is as follows:
where
is the green innovation efficiency, which encompasses three major dimensions: input indicators, desirable output indicators, and undesirable output indicators.
,
and
denote the input, desirable output, and undesirable output vectors, respectively.
,
,
represent the slack variables for input, desirable output, and undesirable output, respectively.
signifies the weight vector.
Specifically, the input indicators further include capital input, personnel input, energy input, and pollution treatment input. Capital input is represented by R&D expenditure, personnel input is measured by the full-time equivalent of R&D personnel, energy input is indicated by electricity consumption, and pollution treatment investment is assessed by the amount of investment completed for industrial pollution treatment. The desirable output indicators include technological output indicators, economic benefit indicators, and ecological benefit indicators. Technological output is measured by the number of patent applications, economic benefit is represented by the sales revenue of new products, and ecological benefit is indicated by the greening coverage rate of built-up areas. The undesirable output indicators are measured through three aspects: total sulfur dioxide emissions from industrial sources, total industrial wastewater discharge, and the generation of general industrial solid waste.
3.2.5. Moderating Variable
Industrial structure upgrading serves as a material carrier for the development of new quality productive forces. In order to more comprehensively analyze the mechanism of action involving the digital economy, green innovation efficiency, and new quality productive forces, this study uses industrial structure upgrading (STR) as a moderating variable, which is measured by the ratio of the value-added of the tertiary industry to that of the secondary industry across provinces.
3.2.6. Threshold Variable
Considering that the new quality productive forces in various regions are influenced not only by the digital economy but also by green innovation efficiency, and that this influence may exhibit nonlinear characteristics, this study adopts green innovation efficiency (GIE) as the threshold variable.
3.3. Descriptive Statistics
The definitions of the main variables and the results of the descriptive statistical analysis are presented in
Table 3. The distribution of each variable falls within a reasonable range. Specifically, the mean value of the new quality productive forces index is 0.1313, with a standard deviation of 0.1052. The average value of the digital economy index is 0.1244, and its fluctuation range is 0.1001.
3.4. Correlation Analysis
The correlation results of the main variables are shown in
Table 4. The results indicate a relatively significant correlation among the core variables, with both new quality productive forces and the digital economy showing significant positive correlations with various variables.
3.5. Model Setting
3.5.1. Setting of the Benchmark Model
To quantitatively analyze the impact of the digital economy on enabling new quality productive forces and to test Hypothesis 1, the following panel data model is constructed:
where
and
represent provinces and years, respectively;
denotes new quality productive forces;
represents the digital economy;
signifies a set of control variables that influence new quality productive forces;
is the constant term;
and
are the variable coefficients;
and
represent individual fixed effects and time fixed effects, respectively, and
is the random error term.
3.5.2. Setting of the Spatial Econometric Model
The digital economy leverages digital technology to guide the utilization of resources and promote productivity growth. Therefore, there may be spatial correlations between the digital economy and new quality productive forces. To test Hypothesis 3, this study combines model (1) with a spatial weight matrix to construct the following model:
where
represents the explanatory and control variables,
represents the spatial weight matrix, and
represents the regression coefficient of spatial autocorrelation. When
the equation represents the Spatial Durbin model; when
and
when, the formula represents the Spatial Autoregressive model; when
and
when, the formula is regarded as a Spatial Error model.
3.5.3. Setting of the Mediating Effect Model
To investigate the impact mechanism of the digital economy on new quality productive force, this study adopts the three-step method of Wen Zhonglin et al. (2014) [
40] to construct a mediation effect model, measuring the mediating role of green innovation efficiency:
where
is the mediating variable,
,
,
,
,
,
,
,
,
and
are the parameters to be estimated. Following the testing procedure, this study uses the Bootstrap method to measure the strength of the mediation effect.
3.5.4. Setting of the Moderated Mediation Effects Model
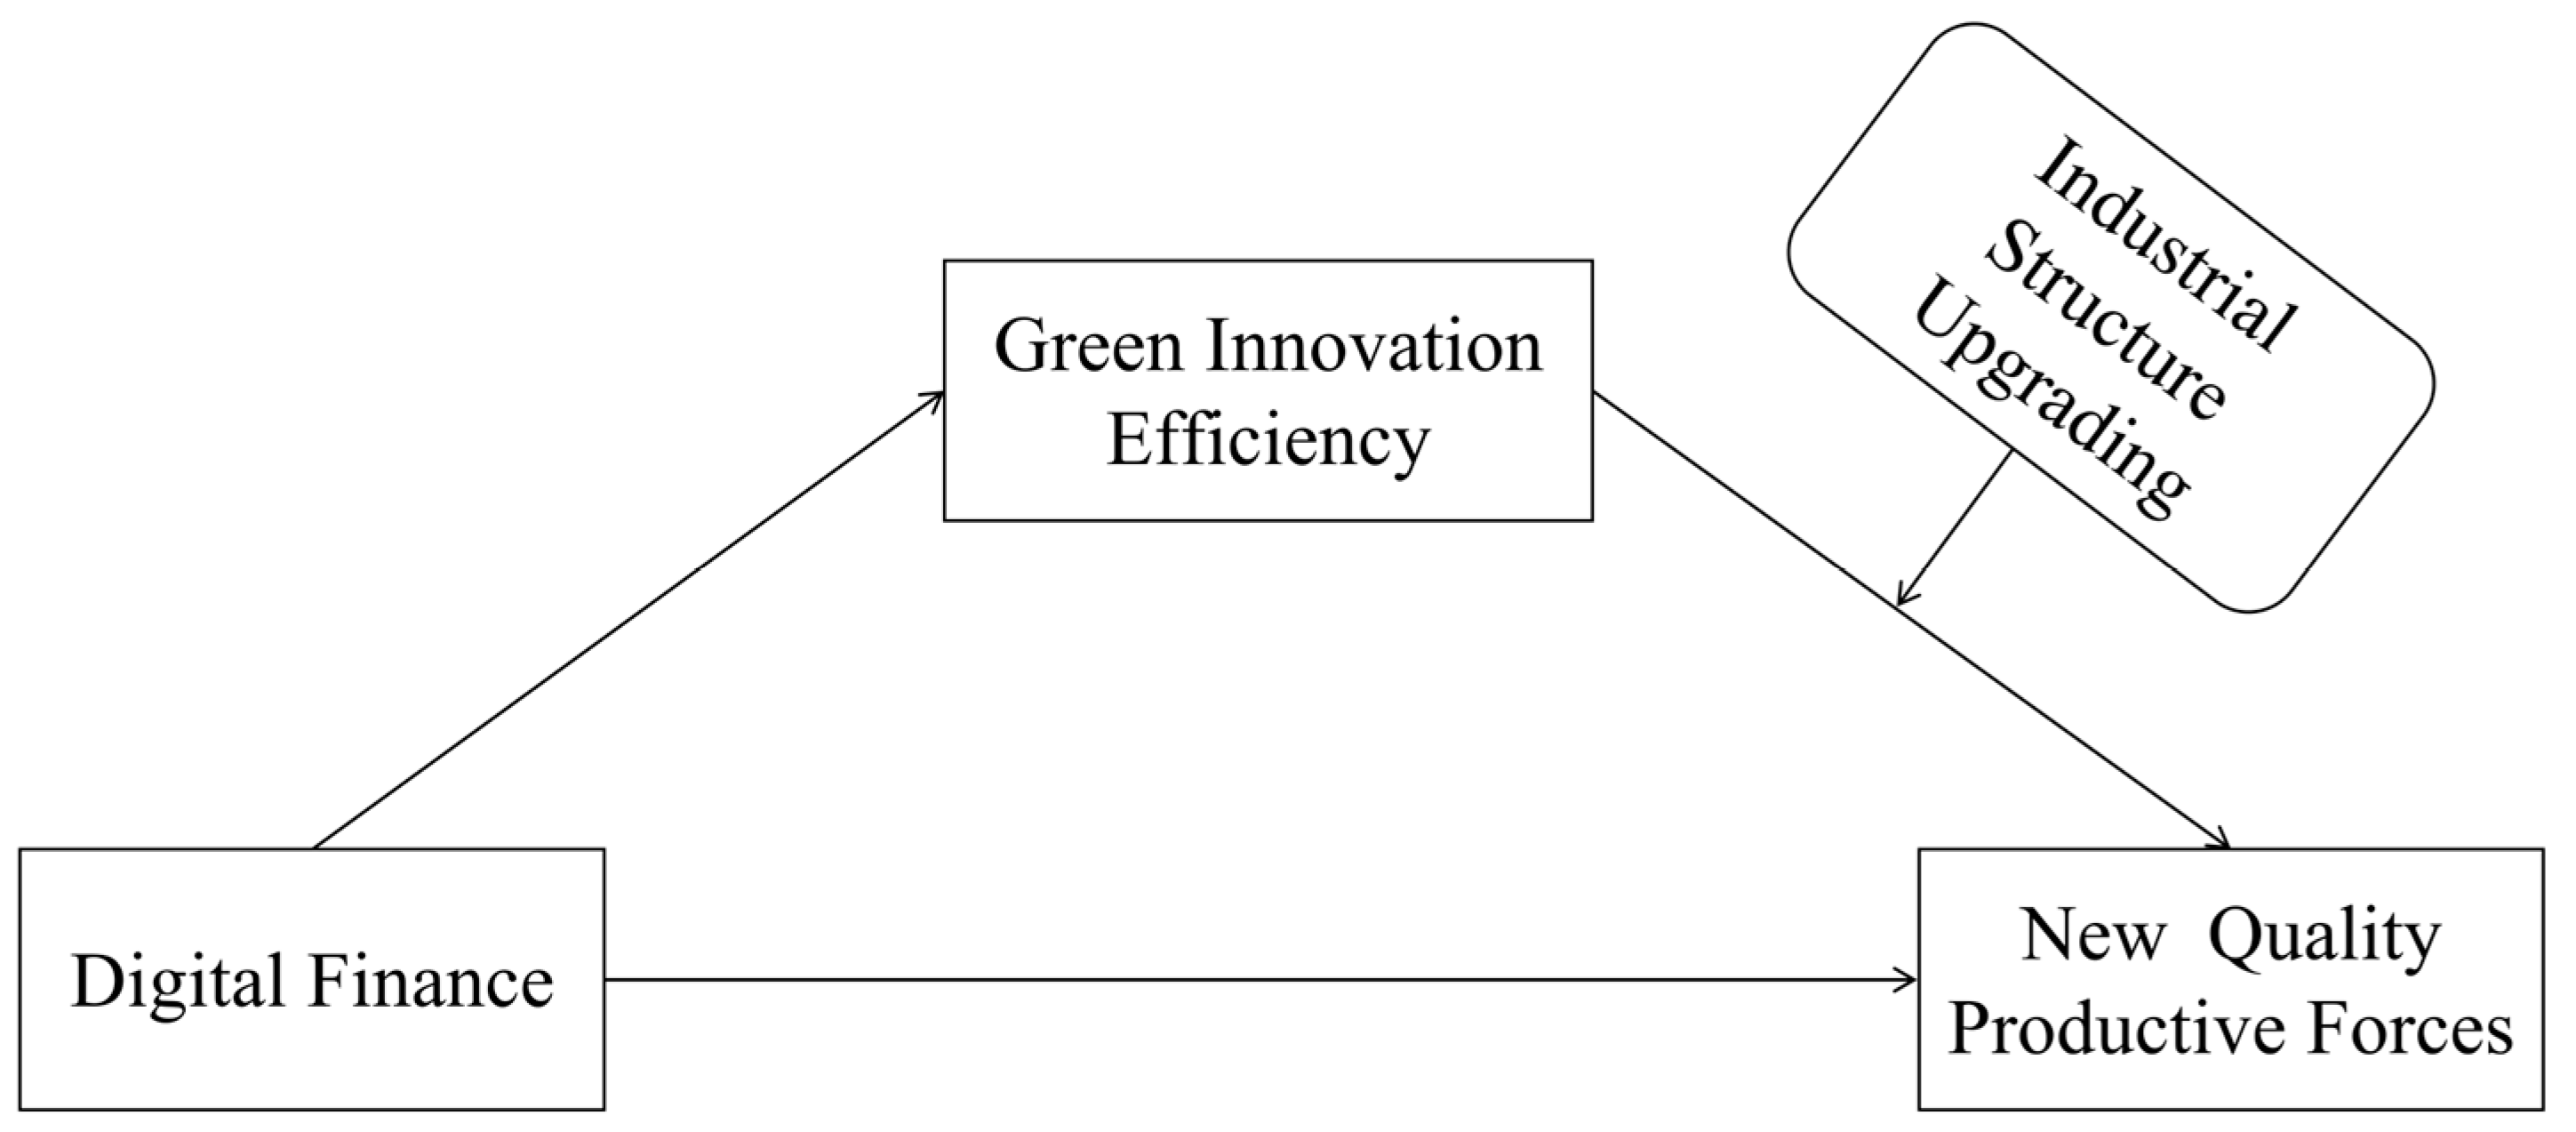
To uncover the moderated mediation effect of the digital economy on new quality productive forces and test Hypothesis 5, the following moderated mediation effect model is constructed. The transmission mechanism is illustrated in
Figure 1.
the moderating mediating effect
.
represents industrial structure upgrading and
denotes the interaction term between green innovation efficiency and industrial structure upgrading. The estimation of the moderating mediation effect primarily employs the structural equation method. To ensure the robustness of the results, this study adopts the Bootstrap testing method. At the same time, the dynamic moderating effect of industrial structure upgrading on green innovation efficiency and new quality productive forces is tested by calculating the moderating mediation effect with the mean of industrial structure upgrading plus or minus one standard deviation.
3.5.5. Setting of the Threshold Effect Model
Considering that as green innovation efficiency improves, the impact of the digital economy on new quality productive forces also varies. However, it remains to be verified whether a nonlinear dynamic spillover effect exists, and whether it demonstrates threshold characteristics. Therefore, to test Hypothesis 6, this study constructs a single threshold panel model and further extends it to a multi-threshold panel model:
where
is the threshold variable,
represents the threshold value, and
is an indicator function that takes a value of 1 when the condition is satisfied; otherwise, it takes a value of 0. Model (5-1) represents the scenario where only one threshold value is assumed to exist, while model (5-2) represents the scenario where multiple threshold values are assumed to exist.
4. Empirical Testing and Analysis of Results
4.1. Benchmark Regression Analysis
The test results using progressive regression forms, including panel mixed regression, individual fixed effects, time-specific fixed effects, and two-way fixed effects, are presented in
Table 5. The digital economy coefficients are 0.5180, 0.3390, 0.5041, and 0.5736, respectively, and all are significantly positive. Currently, China is in an era of vigorously developing the digital economy. The upgrading and implementation of digital technologies can effectively enhance production efficiency, optimize resource allocation, and accelerate the formation of new quality productive forces, thereby empowering high-quality development. This result provides quantitative evidence from a quantitative perspective of the role of the digital economy in driving the development of new quality productive forces, confirming the facilitative relationship between the two. Thus, Hypothesis 1 is supported.
4.2. Regional Heterogeneity Analysis
According to China’s regional division and regional policies, the four major economic regions are the East region (10 provinces), Central region (6 provinces), West region (12 provinces), and Northeast region (3 provinces). As shown in
Table 6, there are regional differences in the effect of the digital economy on boosting new quality productive forces, with the magnitude of the effect being the greatest in the eastern region, followed by the central, western, and northeastern regions, supporting Hypothesis 2. Among them, the coefficient for the eastern region is the largest at 0.6526, far exceeding that of the less developed regions, namely the central, western, and northeastern regions. The main reason may be that the development of the digital economy started earlier in the East, where a large number of high-tech companies are concentrated. With an earlier and well-established digital platform infrastructure and significant investments, the digital economy has a more prominent effect on promoting new quality productive forces in the East. However, as a new technological means that can break time and space constraints, the digital economy should play a greater role in the broader central and western regions. This also implies that with the construction and development of the digital economy platform infrastructure, there is still enormous potential for the development of a digital economy in vast, underdeveloped areas.
4.3. Spatial Effects Analysis
4.3.1. Spatial Weight Matrix Construction
Before conducting a spatial econometric analysis, it is necessary to construct a weight matrix for spatial interaction. This study selects three common spatial weight matrices to analyze the impact of the digital economy on new quality productive forces.
The following formula measures the proximity between the districts:
- 2.
The geographic distance matrix (W2)
The following formula measures the distance between the districts:
where
denotes the distance between the two provinces measured in latitude and longitude.
- 3.
The economic distance matrix (W3)
This formula measures the economic disparity between regions as follows:
where
represents the average GDP per capita of province
for 2011–2022.
4.3.2. Spatial Econometric Regression Analysis
The verification of the global Moran’s I index in
Table 7 indicates that there is a spatial effect of new quality productive forces, meaning that under different weight matrices, the explanatory variables exhibit a positive global spatial autocorrelation.
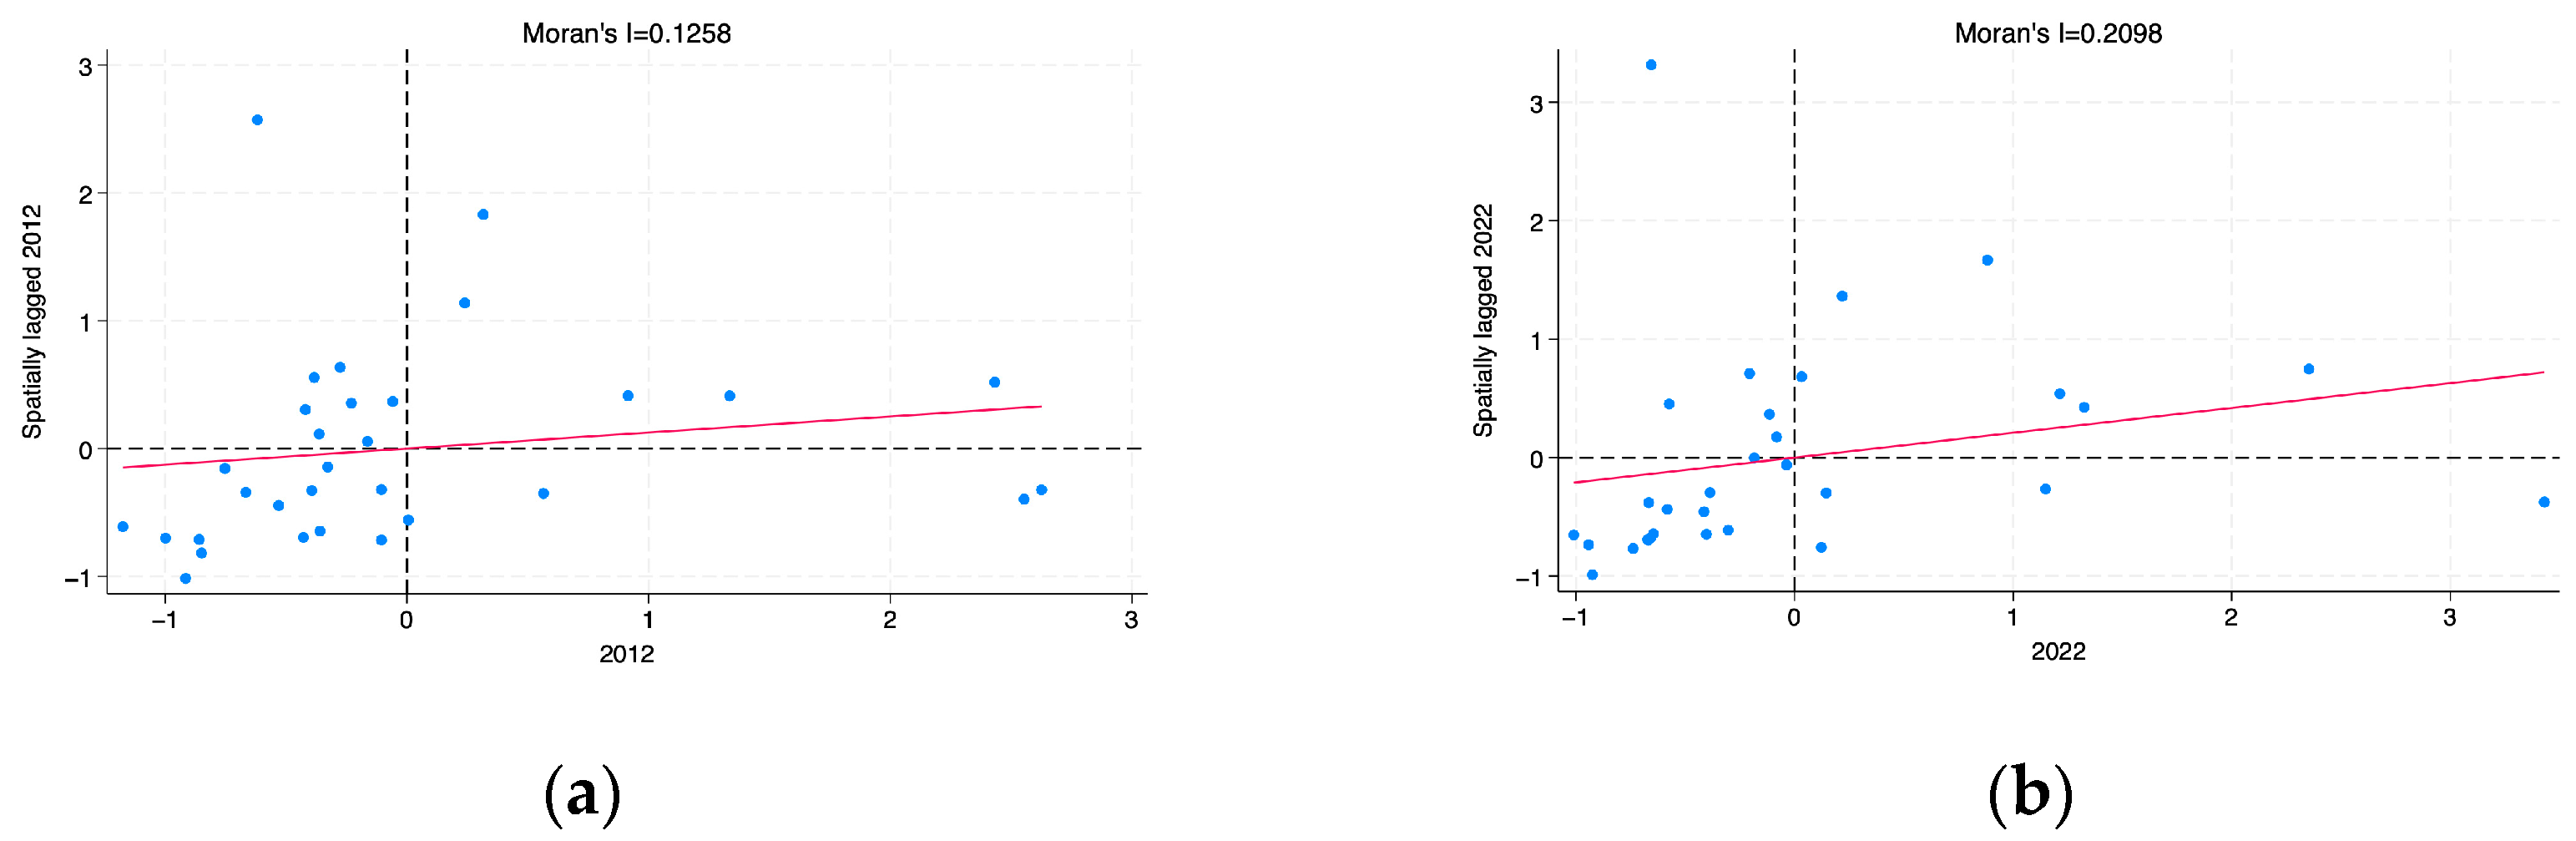
Based on the adjacency matrix, this study uses Moran’s I scatter plots to depict the clustering pattern of provinces, as shown in
Figure 2. Each point in the scatterplot represents a province and the slope of the fitted line corresponds to the value of global Moran’s I. The results show that the provinces exhibit an overall characteristic of “high—high agglomeration” and “low—low agglomeration” indicating that new quality productive forces have local spatial positive autocorrelation.
4.3.3. Tests for Spatial Effects
Based on the test results in
Table 8, this study selects the Spatial Durbin Model (SDM) for analysis. Additionally, a Hausman test is conducted on the basis of the selected model (
p = 0.0000), ultimately determining the adoption of the Spatial Durbin Model with two-way fixed effects.
- 2.
Spatial effects results analysis
Table 9 presents the test results of the Spatial Durbin Model under three spatial weight matrices, all of which are significantly positive. The results demonstrate that the digital economy has a significant positive effect on new quality productive forces, thus supporting Hypothesis 3. This study further decomposes this effect into direct and indirect effects for the analysis. The results show that the digital economy has a positive spatial spillover effect on new quality productive forces. Specifically, the indirect effect is significantly positive, indicating that the development of a digital economy in each region not only has a significant impact on its own region but also exerts a notable radiating effect on the level of new quality productive forces in adjacent regions.
4.4. Mediating Effects Analysis
This study employs a mediation effect model to further explore the extent to which the digital economy influences new quality productive forces through green innovation efficiency. The significance level of the coefficient
is tested using the Bootstrap method. If this coefficient is significant, it indicates the presence of a mediation (indirect) effect; otherwise, no mediation effect exists. Further testing of the significance of
is conducted. If this coefficient is significant, it suggests that not only is there a significant direct effect, but there may also be other mediator variables; if it is not significant, it implies that the digital economy only exhibits an indirect effect on new quality productive forces. The test results in
Table 10 show that
does not include 0 within the 95% confidence interval, indicating that this coefficient is significant and that a mediation effect exists.
Table 11 presents the mediation effect test results using the stepwise regression method. It can be seen that the coefficients of all variables are significantly positive. Among them, the total effect
is 0.5736 and is significant at the 1% level, indicating that the digital economy contributes to the development of new quality productive forces.
is 0.0192 and
is 0.7405, both of which are significant, suggesting that green innovation efficiency plays a positive indirect role in the process of digital economy’s influence on new quality productive forces. Hypothesis 4 is therefore supported.
4.5. Moderated Mediation Effects Analysis
Table 12 presents the results of the moderated mediation effect test. It can be observed that the interaction term between industrial structure upgrading and green innovation efficiency is significant at the 1% level, indicating that the moderating effect of industrial structure upgrading is relatively significant. Furthermore, the mediation effects were tested separately for low, medium, and high levels of industrial structure upgrading using the mean value of industrial structure upgrading and one standard deviation above and below it as thresholds. The test results show that at the low level of industrial structure upgrading, the 95% confidence interval includes 0, indicating that the mediation effect of the “digital economy—green innovation efficiency—new quality productive forces” pathway is not significant. However, at both medium and high levels of industrial structure upgrading, the 95% confidence intervals do not include 0, and the mediation effects are significant, with the effect strengthening as the industrial structure upgrades. This finding suggests that the moderating effect of industrial structure upgrading enhances the mediation effect of green innovation efficiency, enabling industrial transformation and upgrading to better leverage the promotional role of green innovation efficiency. Hypothesis 5 is therefore supported.
4.6. Threshold Effect Analysis
This study uses green innovation efficiency as a threshold variable to reveal the influence patterns and threshold characteristics of the digital economy on new quality productive forces. The results of the threshold effect test in
Table 13 show that the double threshold test is passed. The threshold estimates are presented in
Table 14, with threshold values of 0.1142 and 0.3783 within a 95% confidence interval.
Figure 3 illustrates that the threshold values have passed the test.
The results from the threshold model in
Table 15 reveal that when green innovation efficiency is less than 0.1142, the estimated coefficient for the digital economy is 0.3545 and significant at the 5% level. When green innovation efficiency falls within the range [0.1142, 0.3783], the estimated coefficient is 0.6139 and is significant at the 1% level. When green innovation efficiency exceeds 0.3783, the estimated coefficient is 0.7440 and significant at the 1% level. Compared to the estimated coefficients in the first and second threshold intervals, the coefficient in this interval is larger, indicating that the impact of the digital economy on new quality productive forces exhibits a nonlinear characteristic of “increasing marginal effect”. Thus, Hypothesis 6 is supported.
4.7. Endogeneity and Robustness Tests
To mitigate potential endogeneity issues and reduce estimation biases, this study further conducts endogeneity tests, with the results presented in
Table 16. Firstly, the Instrumental Variable approach is employed. Drawing on the research methodologies of Huang Qunhui et al. (2019) [
41] and Zhang Guangsheng et al. (2023) [
42], this study selects the number of post offices per 10,000 people in each province in 1984 as an instrumental variable for the development of a digital economy. The reasons for choosing this instrumental variable are twofold: firstly, internet usage is closely related to the number and distribution of local post offices, and the internet is a crucial component of the digital economy; secondly, the importance of post offices has diminished in current economic and social development, making it unlikely to affect the development level of new quality productive forces, thus ensuring the exogenous nature of the instrumental variable. Since the number of post offices per 10,000 people in 1984 is cross-sectional data, this study constructs an interaction term between the previous year’s national information service technology revenue and the number of post offices per 10,000 people in 1984 as an instrumental variable for the current year’s digital economy level. Columns (1) and (2) in
Table 16 present the first-stage and second-stage regression results of the Two-Stage Least Squares (2SLS) method, respectively. After incorporating the instrumental variable, the digital economy still significantly promotes the enhancement of new quality productive forces. The Kleibergen-Paap rk LM statistic significantly rejects the hypothesis of under-identification, and the Kleibergen-Paap rk Wald F statistic also rejects the hypothesis of weak identification, indicating a robust positive effect. Secondly, the dynamic panel model is used. Despite controlling for variables related to new quality productive forces as much as possible in the empirical model, the results may still be biased. To overcome potential endogeneity issues in the model, this study constructs a dynamic panel model and adopts the systematic GMM estimation method while also reporting the estimation results of the difference GMM, as shown in columns (3) and (4). The Hansen test confirms the validity of the instrumental variables, and the AR(2) test results indicate that the second-order differences in the disturbance terms in the model are not autocorrelated. Moreover, the regression coefficients of the core explanatory variables are significant, further verifying the robustness of the baseline regression in this study.
To confirm the reliability of the results from the baseline regression model, this study conducts a series of robustness checks, as shown in
Table 17. Firstly, the digital financial inclusion index (DIFI) and its sub-indices, namely coverage breadth (DIFI1), usage depth (DIFI2), and digitization level (DIFI3), are used as alternative indicators for the digital economy. The results show that the estimated coefficients for the total index and all three sub-indices are significantly positive, indicating the robustness of the baseline regression conclusions. Secondly, considering the special policies, levels of green innovation efficiency, and urban-rural gaps in municipalities directly under the central government, the data from these four municipalities are excluded, and the remaining 27 provinces and autonomous regions are tested. The conclusions remain robust. Thirdly, exclude certain time-series data. The Third Plenary Session of the 18th Central Committee of the Communist Party of China clearly defined the national strategy for developing a digital economy from a top-down perspective. Considering the policy impact, samples prior to 2013 are excluded from the test, and the coefficients remain significantly positive. In consideration of the impact of the COVID-19 pandemic, this study re-conducted the regression analysis after excluding data from 2020 to 2022. The results were significantly positive and passed the robustness test. Fourthly, to control the influence of extreme values on the regression results, this study applies a 1% trimming to the explanatory variables, and the results remain significantly positive, passing the robustness check.
5. Conclusions and Recommendations
As a new economic model integrating advanced digital technologies, the digital economy has emerged as a pivotal force in advancing new quality productive forces to greater heights, underpinned by its robust driving force and enabling capabilities. Based on panel data from 31 provinces in China spanning from 2012 to 2022, this study reveals the transmission mechanism and impact effects of the digital economy on new quality productive forces from multiple dimensions, possessing significant theoretical and practical implications. Based on panel data from 31 provinces in China between 2012 and 2022, this study empirically analyses the impact of the digital economy on new quality productive forces from a multidimensional perspective. Undoubtedly, there remains scope for further research within the confines of this study. Firstly, with the progression of time and the augmentation of data samples, it is conceivable to delve deeper into the analysis by utilizing more detailed panel data at the regional level. Secondly, recognizing the variations in the development status of the digital economy across different regions of China, future research should strive to develop diverse metrics for measuring the digital economy while taking into account these regional disparities. Thirdly, there is potential to further elucidate the multidimensional relationship between green innovation efficiency and new quality productive forces in subsequent investigations. The research findings are as follows: Firstly, the digital economy can facilitate the development of new quality productive forces, and this conclusion is robust. Secondly, the impact of the digital economy on new quality productive forces exhibits regional heterogeneity, and there is a positive spatial spillover effect. Thirdly, the enhancement of green innovation efficiency serves as a mediating process through which the digital economy promotes the development of new quality productive forces, and this mediation effect is positively moderated by the upgrading of industrial structure. Fourthly, the impact of the digital economy on new quality productive forces exhibits a nonlinear characteristic of “increasing marginal effect”. Based on these findings, the following recommendations are proposed in this study.
Firstly, the construction of digital infrastructure should be accelerated. On the one hand, efforts should be made to optimize and upgrade the network infrastructure. This involves accelerating the replacement of outdated equipment with inefficient and energy-intensive models, adopting intelligent and environmentally friendly digital equipment, and expanding new infrastructure across all sectors, such as agriculture, manufacturing, transportation, and energy. Emphasis should be placed on developing a new digital infrastructure to consolidate the foundation for the development of a digital economy. The construction of intelligent data and computing facilities should be coordinated, advancing toward agile deployment, elastic configuration, cross-domain scheduling, and balanced enhancement. Additionally, breakthroughs in digital technology should be promoted, and data security protection should be strengthened to provide support for the digital economy to further serve socio-economic development. On the other hand, it is necessary to accelerate the realization of comprehensive, multi-layered, and broad-scoped regional coordinated development of the digital economy. The government’s coordinating role and the market’s resource allocation function should be leveraged to establish a regional economic cooperation framework, achieving economic upgrading in less developed regions through bidirectional regional interactions. During the development process, each region should fully utilize its comparative advantages, implement differentiated competition and dislocation development strategies, and simultaneously focus on sharing development experiences and achievements, breaking down regional interest barriers and policy obstacles, and facilitating regional cooperation.
Secondly, vigorously enhance green innovation efficiency. Particularly in developing countries, governments should play a leading role in actively promoting research and development, application, and industrialization of green technologies. On one hand, the government can introduce relevant policies to encourage industries to engage in green technological innovation. This includes establishing special green innovation funds to guide social capital toward projects and areas with green innovation potential; cultivating and gathering high-level scientific and technological talent, with particular emphasis on the introduction and cultivation of interdisciplinary talent; encouraging enterprises to adopt energy-efficient technologies and equipment, increasing the proportion of clean energy, and reducing energy consumption; and increasing financial investment in pollution treatment, such as upgrading and expanding existing pollution treatment facilities, strengthening the supervision and evaluation of pollution treatment projects, improving pollution treatment technology, and reducing pollutant emissions. On the other hand, efforts should be accelerated to cultivate new green technology industries, promote the emergence of green patents, extend and greenly upgrade traditional industrial chains, and provide policy incentives to industries adopting green processes and green innovation technologies to motivate enterprises to achieve both economic and environmental benefits, striving to build a resource-saving and environmentally friendly modern economic system.
Thirdly, promoting the deep integration of digitalization and greenization. First, we should deepen the application of digital technology in the green sector, advancing the transformation and upgrading of energy resources, industrial structures, and consumption structures, thereby enabling digital technology to empower green industrial transformation. Specifically, we need to promote the digital transformation of enterprises and encourage them to adopt advanced digital technologies to achieve “cloud adoption, data utilization, and intelligence empowerment” for users. Enterprises should be encouraged to adopt intelligent and green technologies for the transformation and upgrading of traditional industries to improve production efficiency, optimize resource utilization, and reduce adverse environmental impacts. Second, it is necessary to improve the policy framework further for the coordination of digitization and greenification, strengthening the synergy between different policies. Detailed policy content and specific support measures should be formulated for key areas, clarifying the strategic goals and implementation steps for the coordination of digitization and greenification in various fields. Policies should include, but are not limited to, financial subsidies, tax reductions and exemptions, financing facilities, and other incentive measures to reduce the costs of enterprise transformation, making enterprises “willing, able, and daring to transform”. We should promote the formation of a stepped growth model, encouraging small and micro-enterprises to take the first step in transformation, while also supporting large and medium-sized enterprises to advance to a higher level of intelligence and greenification, thereby achieving coordinated transformation and development. Third, we should intensify the promotion of the concept of coordinated digitization and greenification by organizing various activities to enhance the awareness and understanding of all sectors of society, encourage the participation of social organizations and the public, and foster a good atmosphere of participation from the whole society. Active international exchanges and cooperation should be carried out, with investment cooperation agreements signed and participation in the formulation of international standards to enhance China’s voice in the global coordinated development of digitization and greenification.
Fourthly, promotes industrial upgrading and coordinated development. Firstly, strengthen policy effectiveness. The government should fully exert its functions in industrial planning, policy guidance, and market supervision, effectively guiding resources to be concentrated in the key nodes of the industrial chain and high-end areas of the value chain. The significant value of data elements in industrial governance and policy decision-making should be leveraged to promote data-driven industrial governance, innovation, and development. For developing countries, it is imperative to actively draw upon international experience and formulate industrial upgrading policies that suit their national conditions. This involves the prompt elimination of unsustainable industries characterized by high energy consumption and pollution while promoting green innovation. Secondly, adopt regionally differentiated transformation and upgrading strategies, optimizing industrial structure according to local conditions based on different factor endowments and development stages, guiding the transformation toward industrial digitalization, production intensification, innovation application, and industry upgrading. For developed regions, the focus should be on leveraging advantages in technological innovation, capital accumulation, and talent reserves to accelerate the transformation of traditional industries toward high-end, intelligent, and green models. For less developed regions, the focus should be on introducing advanced technology, cultivating emerging industries, optimizing resource allocation, and actively undertaking industrial transfers from the East to accelerate the upgrading of traditional industries and promote economic restructuring. Thirdly, strengthen upstream and downstream collaboration within regional industrial chains and optimize the regional industrial layout to facilitate smooth connections among various links in the industrial chain, forming a complementary and coordinately developed industrial pattern. Cross-regional enterprises can establish long-term and stable cooperative relationships by signing strategic cooperation agreements, jointly building industrial parks or industrial bases, etc., to promote technical exchanges and market connections between upstream and downstream enterprises, effectively reducing transaction costs and enhancing the overall operational efficiency of the industrial chain.


