Article

Relationships Between Floodplain Topography, Peat, Soil Moisture, and Alder Growth over a Decade After River Meandering Restoration in the Kushiro Wetlands, Hokkaido, Japan

1
Department of Civil Engineering, Shibaura Institute of Technology, 3-7-5 Toyosu, Koto-ku 135-8548, Tokyo, Japan
2
CTI Engineering Co., Ltd., 3-15-1 Nihombashi Hamacho, Chuo-ku 103-0007, Tokyo, Japan
3
Engineering Research Team, Civil Engineering Research Institute for Cold Region, 1-34 Hiragishi 1-Jo 3-Chome, Sapporo 062-8602, Hokkaido, Japan
*
Author to whom correspondence should be addressed.
Sustainability 2025, 17(2), 615; https://doi.org/10.3390/su17020615
Submission received: 14 October 2024 / Revised: 25 December 2024 / Accepted: 7 January 2025 / Published: 15 January 2025

Abstract

:
This study aimed to identify the predominant factors that are important for environmental sustainability in wetland restoration in the Kushiro Wetlands, Hokkaido, Japan, where a nature restoration project was implemented over a decade ago. Field surveys of topography and vegetation, as well as laboratory soil tests, were conducted in the meandering-restored section of the Kushiro River, where alder trees have flourished, and in the reference section, where wetland grasslands have been maintained. We then applied correlation analysis to the data to examine the relationship between the peat soil characteristics and alder tree size. The results showed a significant positive correlation between organic matter and the water content ratio in all the survey sections (correlation coefficient: 0.88; p-value < 0.05). The reference section had 24.1 ± 11.1% organic matter, indicating well-developed peat with sufficient moisture retention, while the re-meandering section had 13.1 ± 3.8%, indicating underdeveloped peat with limited moisture retention. Furthermore, no correlation was found between the relative elevation and water content ratio (correlation coefficient: −0.01; p-value > 0.05), nor was there any difference in nutrient concentrations between the survey sections. Therefore, it is possible that the difference in alder tree sizes between the sections depended on the soil moisture retention capacity based on the degree of peat soil development. These results suggest that peat soil restoration is crucial in human sustainable development for suppressing alder proliferation and restoring original peat grasslands.

1. Introduction

Peat wetlands are essential from the perspective of biodiversity conservation in wetland ecosystems and global warming mitigation through carbon storage [1,2,3]. Although they cover only 3% of the Earth’s surface [4], peat wetlands are estimated to store about 600 ± 100 gigatons [5]. This excellent carbon storage capacity is due to the 48–63% carbon enrichment of organic matter in peat soils [6]. Given this importance of peat wetlands, conservation and restoration efforts have been undertaken worldwide.
These efforts are supported by international frameworks, such as the Ramsar Convention [7], which guides the conservation and restoration of wetlands. Examples include Rewetting for Ecosystem Service Restoration in Germany [8], Peatland Regeneration for Global Warming Mitigation in the UK [9], and Indonesian Peatland Conservation Reduces Greenhouse Gas Emissions through Wetland Fire Prevention [10]. Many of these cases focus on restoring the physical environment, such as groundwater levels and surface water, similar to river restoration cases reported in Swiss studies [11]. However, restoration cases in Finland [12] and the United States [13] have reported challenges with limited outcomes for wetland vegetation, despite higher restoration achievements for groundwater levels and water quality.
In the context of these global efforts, the Kushiro Wetlands are a representative example of wetland restoration in Japan, sharing common challenges with international cases. In the 1970s, the Kushiro Wetlands experienced a significant increase in sediment inflow, due to the straightening of the Kushiro River for land use development [14]. As a result, alder forests have expanded about 4.5 times from 1979 to 2000 [15], and wetland reed and sedge communities are rapidly shrinking [16]. To address these issues, a nature restoration project was carried out from 2006 to 2011. Specifically, the meandering of the Kushiro River was restored, and various measures were implemented to reduce sediment inflow [17,18]. However, challenges remain in fully recovering the wetland ecosystem, particularly in suppressing the expansion of alder forests and restoring grassland wetlands.
Studies [17,19,20] evaluating restoration projects in the Kushiro Wetlands have often focused on restoring natural hydrological cycles. One year after the meandering restoration, an increase in flood frequency and a rise in groundwater levels were reported [17]. However, despite trends indicating a recovery in hydrological cycles, alder forests continued to expand over the decade after the re-meandering, and grassland wetland restoration remains limited [20]. Consequently, in addition to hydrological cycles, understanding geological conditions like the moisture retention characteristics of peat soils affecting peatland states might be crucial for rapidly restoring grassland wetlands [21].
We conducted in situ field observations of the Kushiro River’s meandering restoration section, characterized by thriving alder trees, and a wetland reference section maintaining grasslands with fewer alder trees for comparison. By comparing the survey results in both sections in terms of topography, vegetation, and soil over a decade after the meandering restoration, we attempted to empirically reveal the relationship between the soil characteristics and growth status of wetland vegetation.
Section 2 is an overview of the Kushiro Wetlands and the target survey areas, field survey methods, laboratory soil tests, and statistical analyses. Section 3 presents the results of the topography, vegetation, and soil surveys, along with their correlation analysis. Section 4 discusses the relationship between peat soil characteristics and the growth status of alder forests in detail by comparing the present results with previous knowledge. Finally, Section 5 highlights the main findings of this study and outlines a future research direction.

2. Methods

2.1. Target Wetland

This study surveyed part of the Kushiro Wetlands near the outlet of the Kushiro River on Hokkaido Island, Japan. According to historical climatic data (1991–2020) [22] near the study site, the average temperature is 18.4 °C in the warmest month (August), and −7.9 °C in the coldest month (January), with a maximum annual snow depth of 59 cm. Annual precipitation is 1054.9 mm, with an average monthly precipitation of 153.0 mm during the peak summer season (September), and 24.8 mm during the lowest winter season (February). This region has a subarctic humid climate (Dfb), characterized by cool, humid springs and summers, and dry, snowy winters.
The Kushiro Wetlands (Figure 1) are located in the lower reaches of the Kushiro River basin, with a basin area of 2510 km2. This area is a peat wetland that occupies 260 km2, about 10% of the basin. These wetlands are an essential habitat for wildlife, and were the first in Japan to be registered under the Ramsar Convention [23]. The main plant species include alder (Alnus japonica), reed (Phragmites australis), mosses (Polytrichum spp., Sphagnum spp.), cotton grass (Eriophorum vaginatum), willows (Salix spp.), ash (Fraxinus mandshurica), and spirea (Spiraea salicifolia) [24].
The survey site (Figure 1) is located in the northeastern part of the Kushiro Wetlands, approximately 30–33 km from the mouth of the Kushiro River. In 1984, the meandering river channel was straightened at the survey site as part of flood control and agricultural development efforts. This channel straightening reduced the frequency of floods, but increased sediment inflow into the floodplain within the wetland. Consequently, the wetland began to dry out, and the original wetland grass species, such as reeds, were replaced by alder trees. As a countermeasure to this human-induced vegetation change, a nature restoration project was implemented from 2006 to 2011, restoring the meandering channel of the river [17,19]. The river administrative body has conducted regular environmental monitoring since the restoration project’s implementation. The expected outcome of the project was that restoring the river meandering would improve hydrological conditions, ultimately resulting in wetland plant recovery. Although the hydrological conditions are gradually recovering [20], alder trees have been observed at the survey site today.
Figure 1 shows the survey sections for the field study. There are three cross-sections, i.e., KP30.0, KP32.0, and KP33.0, located at 30.0, 32.0, and 33.0 km upstream from the river mouth. The KP32.0 and KP33.0 lines are set on the wetland floodplain where the meandering channel restoration was conducted in 2010, hereafter collectively referred to as the re-meandering sections. The KP30.0 line is situated within the area where wetland grasslands have been preserved with a few trees. The KP30.0 line maintains the wetland grassland conditions well, serving as a restoration reference for recovering the re-meandering section. It is hereafter referred to as the reference section. A groundwater level analysis [20] indicated its partial recovery at five groundwater observation points (St. 1–St. 5, Figure 1), where the river administrative body has been monitoring these levels. The former straight channel was streamed north of St. 2 and St. 4, and the remains of the straight channel can be seen faintly in Figure 1.

2.2. Field Survey

A field survey was conducted from 25–26 October 2022, every 20 m along KP32.0 and KP33.0, and every 10 m along KP30.0. We collected observation data at 65 locations to capture the precise environmental conditions along the survey lines and ensure representativeness by avoiding specific biases. We observed the topography of the three survey sections, the biological characteristics of the representative plant communities, and soil samples at each observation point.
For the plant survey, tree height, trunk diameter, and herbaceous plant height were measured for representative species, such as alder and reed, at each survey point. The tree and herbaceous plant heights were measured using a measuring rod. Trunk diameter was obtained at a human’s chest height, 1.3 m aboveground, by using a diameter tape. The relationships between the tree heights and trunk diameters of alder trees were analyzed in both the re-meandering and reference sections, using the allometry relation [26] provided by Equation (1).
y = α x β
x, y: sizes of a biological individual, i.e., the tree height and trunk diameter of an alder, α, β: model parameters. We determined the model parameters using the least squares of Equation (2), the logarithmic transform of Equation (1) with the field observation data.
log y = β log x + log α
The soil samples were collected using a boring stick, with 300 g taken from a depth of 30 cm beneath the representative plant at the plant survey point. The boring stick was used multiple times at each survey point to collect more representative soil samples. Each sample was then evenly divided into two to three sub-samples before laboratory soil tests. The soil samples were sealed in plastic bags to maintain their conditions and stored in a laboratory. In the laboratory, the samples were kept in sealed containers at 10 °C to minimize the impact of external temperature and humidity changes. For the topographic survey, an RTK-GNSS (real-time kinematic global navigation satellite system) was used to measure the three-dimensional positions of observation points to obtain topographic characteristics with the survey sections. The relative height, RH, was calculated using the RTK-GNSS data and the water surface elevation of the Kushiro River for the three survey sections.

2.3. Laboratory Soil Tests

Laboratory soil tests were conducted using the soil samples. The water content ratio, WCR; organic matter content, OMC; phosphate concentration, CP; and available nitrogen concentration, CN, were determined.
The WCR and OMC were measured using a soil water content ratio test [27] and a strong ignition loss test [28] for all observation points, respectively. The arithmetic averages of the test results with the two to three sub-samples determined their most probable values at each observation point.
CP and CN were determined using a simplified method with a spectrophotometer, following a field soil analytic manual. In the simplified method, 4.0 g of air-dried fine soil and 10 mL of purified water were placed in a container, stirred, and allowed to stand at a room temperature of 15 °C for 6 to 18 h. Subsequently, a spectrophotometer analyzed the filtered sample solution. We selected eight to ten observation points in each study section. The arithmetic averages of the test results with the two to three sub-samples determined the most probable CP and CN values at each observation point.

2.4. Statistical Analysis

A correlation analysis of the field survey results was conducted to examine the relationship between vegetation, soil, and topography. We selected the following data for correlation analysis: the water content ratio, WCR; organic matter content, OMC; phosphate concentration, CP; and available nitrogen concentration, CN, for soil information and relative height, RH, from the river water surface for topographic information. For the correlation analysis, data from the observation points where all variables were available (23 locations, totaling 115 data entries) ensured consistency and comparability across the dataset. The analysis examined the relationships regardless of the survey sections. Before conducting the correlation analysis, data normality was checked. Since the data did not follow a normal distribution, Spearman’s rank correlation was used for the statistical analysis. The statistical literature on Spearman’s rank correlation analysis recommends a minimum sample size larger than 20 for reliable analysis [29]. Thus, the sample size of this study, 23, is sufficient to ensure reliable correlation analysis. For relationship examinations other than the correlation analysis, data from the observation points where target variables were available were used to increase statistical reliability. Data for 38 locations in the re-meandering sections and 16 locations in the reference section were used to examine relationships between WCR, OMC, and RH.
Python (ver. 3.8.13) and the pairplot function from Seaborn (ver. 0.11.2) were used for the statistical analysis.

3. Results

3.1. Field Survey

3.1.1. Relationships Between Relative Heights, Water Content Ratios, and Representative Plants

Figure 2 shows the transverse profiles of the relative heights, water content ratios, and representative plants in the three survey sections. The solid lines on the left-hand-side vertical axis indicate the relative heights, the symbol types in the plots represent the representative plant types, and the plot positions on the right-hand-side vertical axis indicate the water content ratios.
Regarding representative plants, in the reference section (KP30.0), the occupancy rate was 75% for reeds and 20% for alders. In the re-meandering sections (KP32.0 and KP33.0), reeds accounted for 15–50%, alders 30–40%, and willows 5%. This shows that the reference section tended to have more wetland plants than the re-meandering sections. Furthermore, the reference and re-meandering sections differed in the constitution of their plant species.
Regarding the relationship between alder trees and soil moisture, alder trees in the re-meandering section grew at 70–140% water content ratios. This section had lower water content than the reference section, where alder trees grew at a WCR of around 200%. Furthermore, alder trees in the reference section were sparsely scattered, whereas those in the re-meandering section, particularly KP32.0, tended to grow continuously in areas with low relative heights between the re-meandering Kushiro River and the old straight river channel trace. Regarding the relationship between reeds and soil moisture, reeds in the re-meandering sections grew at a WCR of 60–200%. Reeds in the reference section grew at almost the same WCR, 80–200%, but there were also a few spots where they grew at a WCR exceeding 400%.

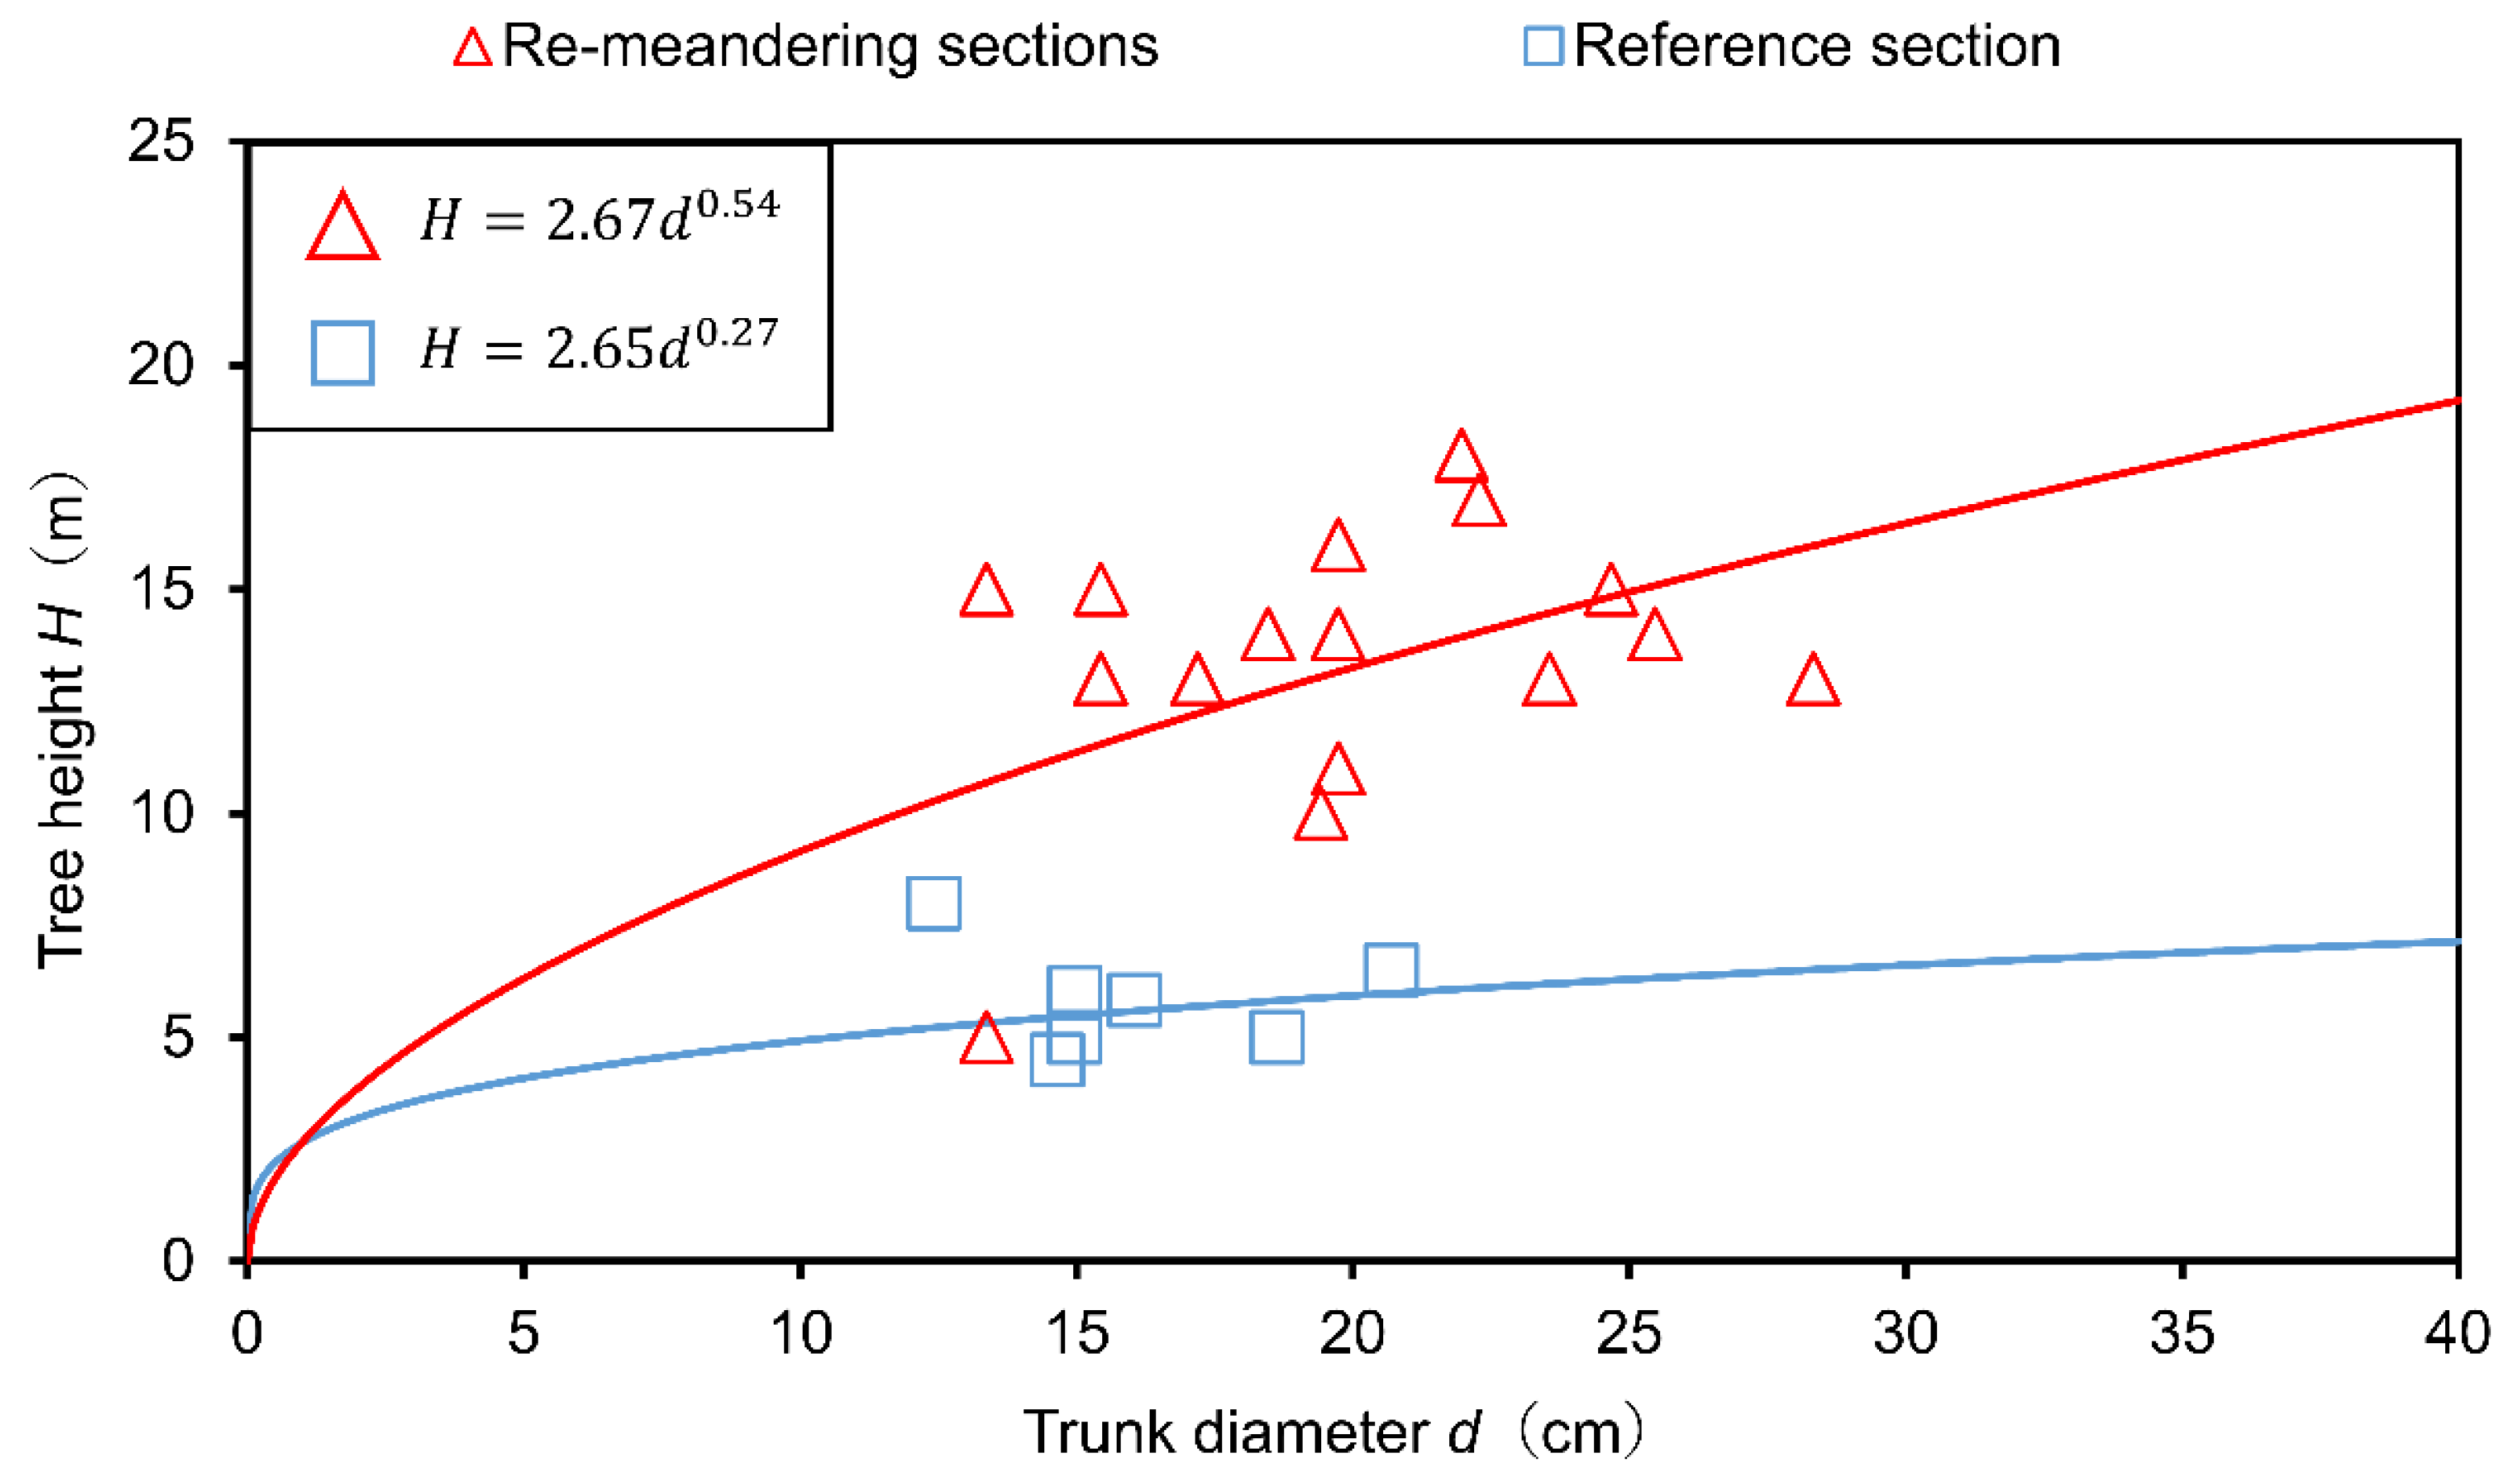
3.1.2. Alder Trees in the Re-Meandering and Reference Sections

Figure 3 shows the relationship between the tree height and trunk diameter of alders in the re-meandering and reference sections. The figure also indicates the allometric relationships between the tree height, H, and the trunk diameter, d, provided in Equations (3) and (4). The alder trees in the re-meandering sections were larger in both tree height and trunk diameter than the alder trees in the reference section. In Equations (3) and (4), the exponent value of the allometric relationship was 0.54 in the re-meandering sections and 0.27 in the reference section, resulting in a twofold difference between them. Therefore, it may be that the growth of alder trees in the reference section was suppressed in terms of height and trunk diameter compared with those in the re-meandering sections.
H = 2.67   d 0.54 ,   i n   t h e   r e m e a n d e r i n g   s e c t i o n s .
H = 2.65   d 0.27 , i n   t h e   r e f e r e n c e   s e c t i o n .

3.2. Laboratory Soil Tests

Table 1 summarizes the results of laboratory soil tests for the survey sections, including the mean values and standard deviations of water content ratio, WCR; organic matter content, OMC; available nitrogen concentration, CN; and phosphate concentration, CP. For WCR and OMC, the mean values in the reference section were twice as large as those in the re-meandering sections. At the same time, the standard deviations were one order of magnitude larger. On the other hand, CN and CP showed no significant in mean values or standard deviations between the reference and re-meandering sections. Therefore, it was evident that the nutrient concentrations were almost the same in all survey sections, and the differences in WCR and OMC reflected both sections’ characteristics.

3.3. Statistical Analysis

3.3.1. Correlation Analysis of the Field Survey and Laboratory Soil Test Results

Figure 4 summarizes the correlation coefficients between the relative height, RH; water content ratio, WCR; organic matter content, OMC; available nitrogen concentration, CN; and phosphate concentration, CP, based on data from 23 locations across all survey sections. The following three relations showed a highly positive correlation: 0.88 between WCR and OMC, 0.87 between WCR and CN, and 0.82 between OMC and CN. Moreover, the WCR and OMC had a highly positive correlation, with larger values in the reference section than those in the re-meandering sections, as shown in Table 1.

3.3.2. Relationships of the Water Content Ratio with Organic Matter Content and Relative Height

Figure 5 shows the relationships between the water content ratio, WCR; organic matter content, OMC; and relative height. RH. There was a clear positive correlation between OMC and WCR, but there was no correlation between RH and WCR. Figure 4 indicates that the corresponding correlation coefficient was 0.88 for the former two items and −0.01 for the latter two items. In addition, the re-meandering sections had a lower WCR than the reference section. This demonstrates that OMC, not RH, determined the soil moisture level in all the survey sections.

4. Discussion

4.1. Relationship Between Peat Soil, Water Content, and Alder Growth

Figure 5 suggests a positive correlation between organic matter content, OMC, and water content ratio, WCR, at the Kushiro Wetlands survey site in this study. Table 1 shows that OMC in the reference section was 24.1 ± 11.1%, confirming that the section has well-developed peat that can retain enough soil moisture. On the other hand, the OMC in the re-meandering sections was 13.1 ± 3.8%, so the undeveloped peat can retain soil moisture to a limited extent. Furthermore, there was no correlation between RH and WCR, and no difference in nutrient concentrations between the survey sections. Therefore, it can be inferred that the difference in the size of the alders shown in Figure 3 strongly depends on the amount of soil moisture caused by the degree of peat soil development.
The results for the reference section are consistent with previous findings showing that tree growth is limited in peat soils [30] with an organic matter content above 30% [31], and that the water retention capacity of peat soils influences the amount of water available to plants [32,33]. Previous studies have reported that water levels and relative heights are important environmental factors in determining water availability for wetland vegetation growth [34,35]. However, in this study, there was a high correlation between the organic matter content and the water content ratio in all the survey sections, and there was no correlation with relative height. Hence, it can be inferred that soil water retention due to the amount of peat significantly affects alder growth at the study site. Notably, the roles of pH and microbial activity in wetland vegetation [36,37], which this study did not cover, remain to be examined in future research.

4.2. Peat Soil Restoration

Over a decade after the nature restoration project in the Kushiro Wetlands, alder forests continue to flourish in the restored meandering section of the Kushiro River. Our previous study [20] reported that restoring natural hydrological cycles by re-meandering the river’s channel had only a limited influence on the recovery of its indigenous grassland wetlands. The present study suggests that restoring peat soil could be essential for restoring wetland grasslands. Furthermore, the peat soil characteristics that affect wetland ecosystems vary greatly, not only by water retention capacity, but also by peat deposition conditions and acidity [38,39]. Therefore, it is important to understand peat soil characteristics for restoration.
Regarding the time scale of wetland restoration, it will likely take a long time to restore peat soil and for it to transition into wetland grassland through natural processes in the restored meandering section of the Kushiro River. Therefore, artificially restoring peat soil might be essential for a shorter time scale. Conventional wetland restoration on a decadal scale has partially restored the geophysical environment, such as groundwater levels and water quality. However, grassland vegetation, such as sedges and podgrass, has not been fully restored, remaining a critical challenge in wetland restoration efforts [12].The importance and incompleteness of soil restoration [40,41] have also been reported in previous research work. Therefore, developing a short-time-scale restoration technique for peat soil is vital for wetland restoration, in addition to natural hydrological cycle recovery. The results of this study complement previous studies [12,40,41] indicating that restoring the hydrologic environment alone is insufficient, providing specific insights into the importance of soil restoration in peat wetlands.
While this study provides valuable insights into the importance of peat soil resto-ration, several challenges remain. The effects of other factors, such as pH, trace elements, and microbial activity on peat wetlands, require further investigation in an extended field survey. Moreover, incorporating time-series data, such as tree annual ring analysis, would enhance our understanding of the more prolonged temporal effects of wetland restoration.

5. Conclusions

This study examined the predominant factors that are important for environmental sustainability in wetland restoration in Kushiro Wetlands, Hokkaido, Japan. Field surveys of the topography and vegetation and laboratory soil tests were conducted in the survey sections. The results revealed a significant positive correlation between organic matter and the water content in all survey sections. This could indicate that the difference in alder tree growth in the area depends on the soil moisture retention capacity, influenced by the degree of peat soil development. The effects of other biochemical factors on peat wetlands and the temporal characteristics of alder tree growth are future research issues that will enhance our understanding of peat wetland restoration in human sustainable development.

Author Contributions

Y.N.: methodology, software, formal analysis, investigation, writing—original draft, writing—review and editing, visualization. T.Y.: methodology, software, investigation. T.O.: methodology, investigation, resources, writing—review and editing. H.M.: conceptualization, methodology, writing—review and editing, supervision, funding acquisition. All authors have read and agreed to the published version of the manuscript.

Funding

Partial support from the River Fund of the River Foundation, Japan (No. 2020-5211-045), is gratefully acknowledged.

Institutional Review Board Statement

Not applicable.

Informed Consent Statement

Not applicable.

Data Availability Statement

The observation data presented in this study are available via the corresponding author upon reasonable request.

Acknowledgments

The authors of this study are grateful for observation support provided by the Kushiro Development and Construction Department; the Hokkaido Regional Development Bureau; and the Ministry of Land, Infrastructure, Transport, and Tourism, Japan. The authors also thank the anonymous reviewers for their useful comments.

Conflicts of Interest

Author Takumi Yamaguchi was employed by the company CTI Engineering Co., Ltd. The remaining authors declare that the research was conducted in the absence of any commercial or financial relationships that could be construed as a potential conflict of interest.

References

  1. Page, S.E.; Baird, A.J. Peatlands and Global Change: Response and Resilience. Annu. Rev. Environ. Resour. 2016, 41, 35–57. [Google Scholar] [CrossRef]
  2. Temmink, R.J.M.; Lamers, L.P.M.; Angelini, C.; Bouma, T.J.; Fritz, C.; van de Koppel, J.; Lexmond, R.; Rietkerk, M.; Silliman, B.R.; Joosten, H.; et al. Recovering Wetland Biogeomorphic Feedbacks to Restore the World’s Biotic Carbon Hotspots. Science 2022, 376, eabn1479. [Google Scholar] [CrossRef]
  3. Hu, S.; Niu, Z.; Chen, Y.; Li, L.; Zhang, H. Global Wetlands: Potential Distribution, Wetland Loss, and Status. Sci. Total Environ. 2017, 586, 319–327. [Google Scholar] [CrossRef]
  4. Loisel, J.; Gallego-Sala, A. Ecological Resilience of Restored Peatlands to Climate Change. Commun Earth Env. 2022, 3, 208. [Google Scholar] [CrossRef]
  5. Yu, Z.; Loisel, J.; Brosseau, D.P.; Beilman, D.W.; Hunt, S.J. Global Peatland Dynamics since the Last Glacial Maximum. Geophys. Res. Lett. 2010, 37, L13402. [Google Scholar] [CrossRef]
  6. Joosten, H.; Sirin, A.; Couwenberg, J.; Laine, J.; Smith, P. The Role of Peatlands in Climate Regulation. In Peatland Restoration and Ecosystem Services: Science, Policy and Practice; Bonn, A., Joosten, H., Evans, M., Stoneman, R., Allott, T., Eds.; Ecological Reviews; Cambridge University Press: Cambridge, UK, 2016; pp. 63–76. ISBN 978-1-107-61970-8. [Google Scholar]
  7. Kingsford, R.; Bino, G.; Finlayson, C.; Falster, D.; Fitzsimons, J.; Gawlik, D.; Murray, N.; Grillas, P.; Gardner, R.; Regan, T.; et al. Ramsar Wetlands of International Importance—Improving Conservation Outcomes. Front. Environ. Sci. 2021, 9, 643367. [Google Scholar] [CrossRef]
  8. Zerbe, S.; Steffenhagen, P.; Parakenings, K.; Timmermann, T.; Frick, A.; Gelbrecht, J.; Zak, D. Ecosystem Service Restoration after 10 Years of Rewetting Peatlands in NE Germany. Environ. Manag. 2013, 51, 1194–1209. [Google Scholar] [CrossRef] [PubMed]
  9. Worrall, F.; Boothroyd, I.M.; Gardner, R.L.; Howden, N.J.K.; Burt, T.P.; Smith, R.; Mitchell, L.; Kohler, T.; Gregg, R. The Impact of Peatland Restoration on Local Climate: Restoration of a Cool Humid Island. J. Geophys. Res. Biogeosci. 2019, 124, 1696–1713. [Google Scholar] [CrossRef]
  10. Blackham, G.V.; Webb, E.L.; Corlett, R.T. Natural Regeneration in a Degraded Tropical Peatland, Central Kalimantan, Indonesia: Implications for Forest Restoration. For. Ecol. Manag. 2014, 324, 8–15. [Google Scholar] [CrossRef]
  11. Kurth, A.-M.; Weber, C.; Schirmer, M. How Effective Is River Restoration in Re-Establishing Groundwater–Surface Water Interactions?—A Case Study. Hydrol. Earth Syst. Sci. 2015, 19, 2663–2672. [Google Scholar] [CrossRef]
  12. Haapalehto, T.O.; Vasander, H.; Jauhiainen, S.; Tahvanainen, T.; Kotiaho, J.S. The Effects of Peatland Restoration on Water-Table Depth, Elemental Concentrations, and Vegetation: 10 Years of Changes. Restor. Ecol. 2011, 19, 587–598. [Google Scholar] [CrossRef]
  13. Bendele, S.; Sharrett, L.J.; Atkinson, R.B. Plant Community Response to Hydrologic Restoration in the Great Dismal Swamp. Castanea 2020, 85, 259–276. [Google Scholar] [CrossRef]
  14. Mizugaki, S.; Nakamura, F.; Araya, T. Using Dendrogeomorphology and 137Cs and 210Pb Radiochronology to Estimate Recent Changes in Sedimentation Rates in Kushiro Mire, Northern Japan, Resulting from Land Use Change and River Channelization. CATENA 2006, 68, 25–40. [Google Scholar] [CrossRef]
  15. Oki, K.; Awadu, T.; Oguma, H.; Omasa, K. Spatial Assessment of the Alder Tree in Kushiro Mire, Japan Using Remotely Sensed Imagery—Effects of the Surrounding Land Use on Kushiro Mire. Environ. Monit. Assess. 2005, 109, 243–253. [Google Scholar] [CrossRef] [PubMed]
  16. Nakamura, F.; Kameyama, S.; Mizugaki, S. Rapid Shrinkage of Kushiro Mire, the Largest Mire in Japan, Due to Increased Sedimentation Associated with Land-Use Development in the Catchment. CATENA 2004, 55, 213–229. [Google Scholar] [CrossRef]
  17. Nakamura, F.; Ishiyama, N.; Sueyoshi, M.; Negishi, J.N.; Akasaka, T. The Significance of Meander Restoration for the Hydrogeomorphology and Recovery of Wetland Organisms in the Kushiro River, a Lowland River in Japan. Restor. Ecol. 2014, 22, 544–554. [Google Scholar] [CrossRef]
  18. Nakamura, F.; Jitsu, M.; Kameyama, S.; Mizugaki, S. Changes in Riparian Forests in the Kushiro Mire, Japan, Associated with Stream Channelization. River Res. Appl. 2002, 18, 65–79. [Google Scholar] [CrossRef]
  19. Nakayama, T. Feedback and Regime Shift of Mire Ecosystem in Northern Japan. Hydrol. Process. 2012, 26, 2455–2469. [Google Scholar] [CrossRef]
  20. Yamaguchi, T.; Miyamoto, H.; Oishi, T. Using Simple LSTM Models to Evaluate Effects of a River Restoration on Groundwater in Kushiro Wetland, Hokkaido, Japan. Water 2023, 15, 1115. [Google Scholar] [CrossRef]
  21. Kurtz, A.M.; Bahr, J.M.; Carpenter, Q.J.; Hunt, R.J. The Importance of Subsurface Geology for Water Source and Vegetation Communities in Cherokee Marsh, Wisconsin. Wetlands 2007, 27, 189–202. [Google Scholar] [CrossRef]
  22. Japan Meteorological Agency Japan Meteorological Agency Web Site. Available online: https://www.data.jma.go.jp/obd/stats/etrn/ (accessed on 8 March 2023).
  23. Senga, Y.; Hiroki, M.; Nakamura, Y.; Watarai, Y.; Watanabe, Y.; Nohara, S. Vertical Profiles of DIN, DOC, and Microbial Activities in the Wetland Soil of Kushiro Mire, Northeastern Japan. Limnology 2011, 12, 17–23. [Google Scholar] [CrossRef]
  24. Nakayama, T. Factors Controlling Vegetation Succession in Kushiro Mire. Ecol. Model. 2008, 215, 225–236. [Google Scholar] [CrossRef]
  25. Gorelick, N.; Hancher, M.; Dixon, M.; Ilyushchenko, S.; Thau, D.; Moore, R. Google Earth Engine: Planetary-Scale Geospatial Analysis for Everyone. Remote Sens. Environ. 2017, 202, 18–27. [Google Scholar] [CrossRef]
  26. Packard, G.C. Is Non-Loglinear Allometry a Statistical Artifact? Biol. J. Linn. Soc. 2012, 107, 764–773. [Google Scholar] [CrossRef]
  27. JIS A 1203: 2020; Test Method for Water Content of Soils. Japanese Industrial Standard Committee: Tokyo, Japan, 2020.
  28. JIS A 1226: 2020; Test Method for Ignition Loss of Soils. Japanese Industrial Standards Committee: Tokyo, Japan, 2020.
  29. El-Hashash, E.F.; Shiekh, R.H.A. A Comparison of the Pearson, Spearman Rank and Kendall Tau Correlation Coefficients Using Quantitative Variables. Asian J. Probab. Stat. 2022, 20, 36–48. [Google Scholar] [CrossRef]
  30. Huang, P.-T.; Patel, M.; Santagata, M.; Bobet, A. Classification of Organic Soils. In JTRP Technical Reports; Indiana Department of Transportation and Purdue University: West Lafayette, IN, USA, 2009. [Google Scholar] [CrossRef]
  31. Zhong, Y.; Jiang, M.; Middleton, B. Effects of Water Level Alteration on Carbon Cycling in Peatlands. Ecosystem Health and Sustainability 2020, 6, 1806113. [Google Scholar] [CrossRef]
  32. Nusier, O.K. Influence of Peatmoss on Hydraulic Properties and Strength of Compacted Soils. Can. J. Soil. Sci. 2004, 84, 115–123. [Google Scholar] [CrossRef]
  33. Lal, R. Soil Organic Matter and Water Retention. Agron. J. 2020, 112, 3265–3277. [Google Scholar] [CrossRef]
  34. Liu, Q.; Liu, J.; Liu, H.; Liang, L.; Cai, Y.; Wang, X.; Li, C. Vegetation Dynamics under Water-Level Fluctuations: Implications for Wetland Restoration. J. Hydrol. 2020, 581, 124418. [Google Scholar] [CrossRef]
  35. Bruland, G.L.; Richardson, C.J. Hydrologic, Edaphic, and Vegetative Responses to Microtopographic Reestablishment in a Restored Wetland. Restor. Ecol. 2005, 13, 515–523. [Google Scholar] [CrossRef]
  36. Wang, C.; Li, H.; Sun, X.; Cai, T. Responses of Soil Microbial Biomass and Enzyme Activities to Natural Restoration of Reclaimed Temperate Marshes After Abandonment. Front. Environ. Sci. 2021, 9, 701610. [Google Scholar] [CrossRef]
  37. Neina, D. The Role of Soil PH in Plant Nutrition and Soil Remediation. Appl. Environ. Soil Sci. 2019, 2019, 5794869. [Google Scholar] [CrossRef]
  38. Kolka, R.K.; Thompson, J.A. Wetland Geomorphology, Soils, and Formative Processes. In Ecology of Freshwater and Estuarine Wetlands; Batzer, D., Ed.; University of California Press: Berkeley, CA, USA, 2007; ISBN 978-0-520-24777-2. [Google Scholar]
  39. Ma, M.; Zhu, Y.; Wei, Y.; Zhao, N. Soil Nutrient and Vegetation Diversity Patterns of Alpine Wetlands on the Qinghai-Tibetan Plateau. Sustainability 2021, 13, 6221. [Google Scholar] [CrossRef]
  40. Zedler, J.B. Progress in Wetland Restoration Ecology. Trends Ecol. Evol. 2000, 15, 402–407. [Google Scholar] [CrossRef]
  41. Richardson, C.; Bruland, G.; Hanchey, M.; Sutton-Grier, A. Soil Restoration: The Foundation of Successful Wetland Reestablishment. In Wetland Soils: Genesis, Hydrology, Landscapes, and Classification, 2nd ed.; CRC Press: Boca Raton, FL, USA, 2015; pp. 469–483. ISBN 978-1-4398-9698-3. [Google Scholar]
Figure 1. Kushiro Wetlands, survey sections, and groundwater observation points. Source: Left-hand side subfigure: modified from data from the National Geodetic Data Download Service (natural park area, lake, and river) [20]. Right-hand side image: modified from Google Earth Engine image [25]. KP represents the longitudinal river distance of the Kushiro River from the river mouth in km, and the areas within each survey section indicate the field survey range of this study.
Sustainability 17 00615 g001
Figure 2. Transverse profiles of the relative heights, water content ratios, and representative plants in the three survey sections. (a) KP30.0, (b) KP32.0, and (c) KP33.0. The color and shape of each plot indicate the types of representative plants observed at the survey sites. The solid lines on the left vertical axis represent relative height, RH, while the plot positions on the right vertical axis indicate the water content ratio, WCR. The horizontal axis shows the transverse distance from the right bank of the Kushiro River.
Sustainability 17 00615 g002
Figure 3. Relationships between the tree height and trunk diameter of alder trees in the re-meandering sections (16 locations) and the reference section (7 locations). The curves in the figure represent the allometric relationship estimated for each section, indicated in the upper left corner.
Sustainability 17 00615 g003
Figure 4. Scatterplot matrix of relative height, RH, and laboratory soil test results, i.e., water content ratio, WCR; organic matter content, OMC; available nitrogen concentration, CN; and phosphate concentration, CP. The data include the 23 locations in all survey sections; r represents the correlation coefficient, p represents the p-value, and the diagonal shows the histogram of each variable.
Sustainability 17 00615 g004
Figure 5. Relationships of the water content ratio, WCR, with the organic matter content, OMC, and the relative height, RH, in the re-meandering sections (38 locations) and the reference section (16 locations). The vertical axis of the graph represents WCR, the left axis represents RH, and the right axis represents OMC.
Sustainability 17 00615 g005
Table 1. Means and standard deviations of soil test results across re-meandering sections and the reference section, including water content ratio, WCR (%); organic matter content, OMC (%); available nitrogen concentration, CN (mg N/100 g); and phosphate concentration, CP (mg P2O5/100 g).
SiteWater Content Ratio, WCR (%)Organic Matter Content, OMC (%)Available Nitrogen Concentration,
Cn (mg N/100 g)
Phosphate Concentration,
Cp (mgP2O5/100 g)
Re-meandering
sections
106 ± 32.113.1 ± 3.825.3 ± 11.90.10 ± 0.06
Reference
section
229.5 ± 148.524.1 ± 11.127.7 ± 9.10.07 ± 0.04
Disclaimer/Publisher’s Note: The statements, opinions and data contained in all publications are solely those of the individual author(s) and contributor(s) and not of MDPI and/or the editor(s). MDPI and/or the editor(s) disclaim responsibility for any injury to people or property resulting from any ideas, methods, instructions or products referred to in the content.

