Evaluation of Water Quality and Eutrophication of Typical Lakes in Southeast Hubei, China
Abstract
1. Introduction
2. Materials and Methods
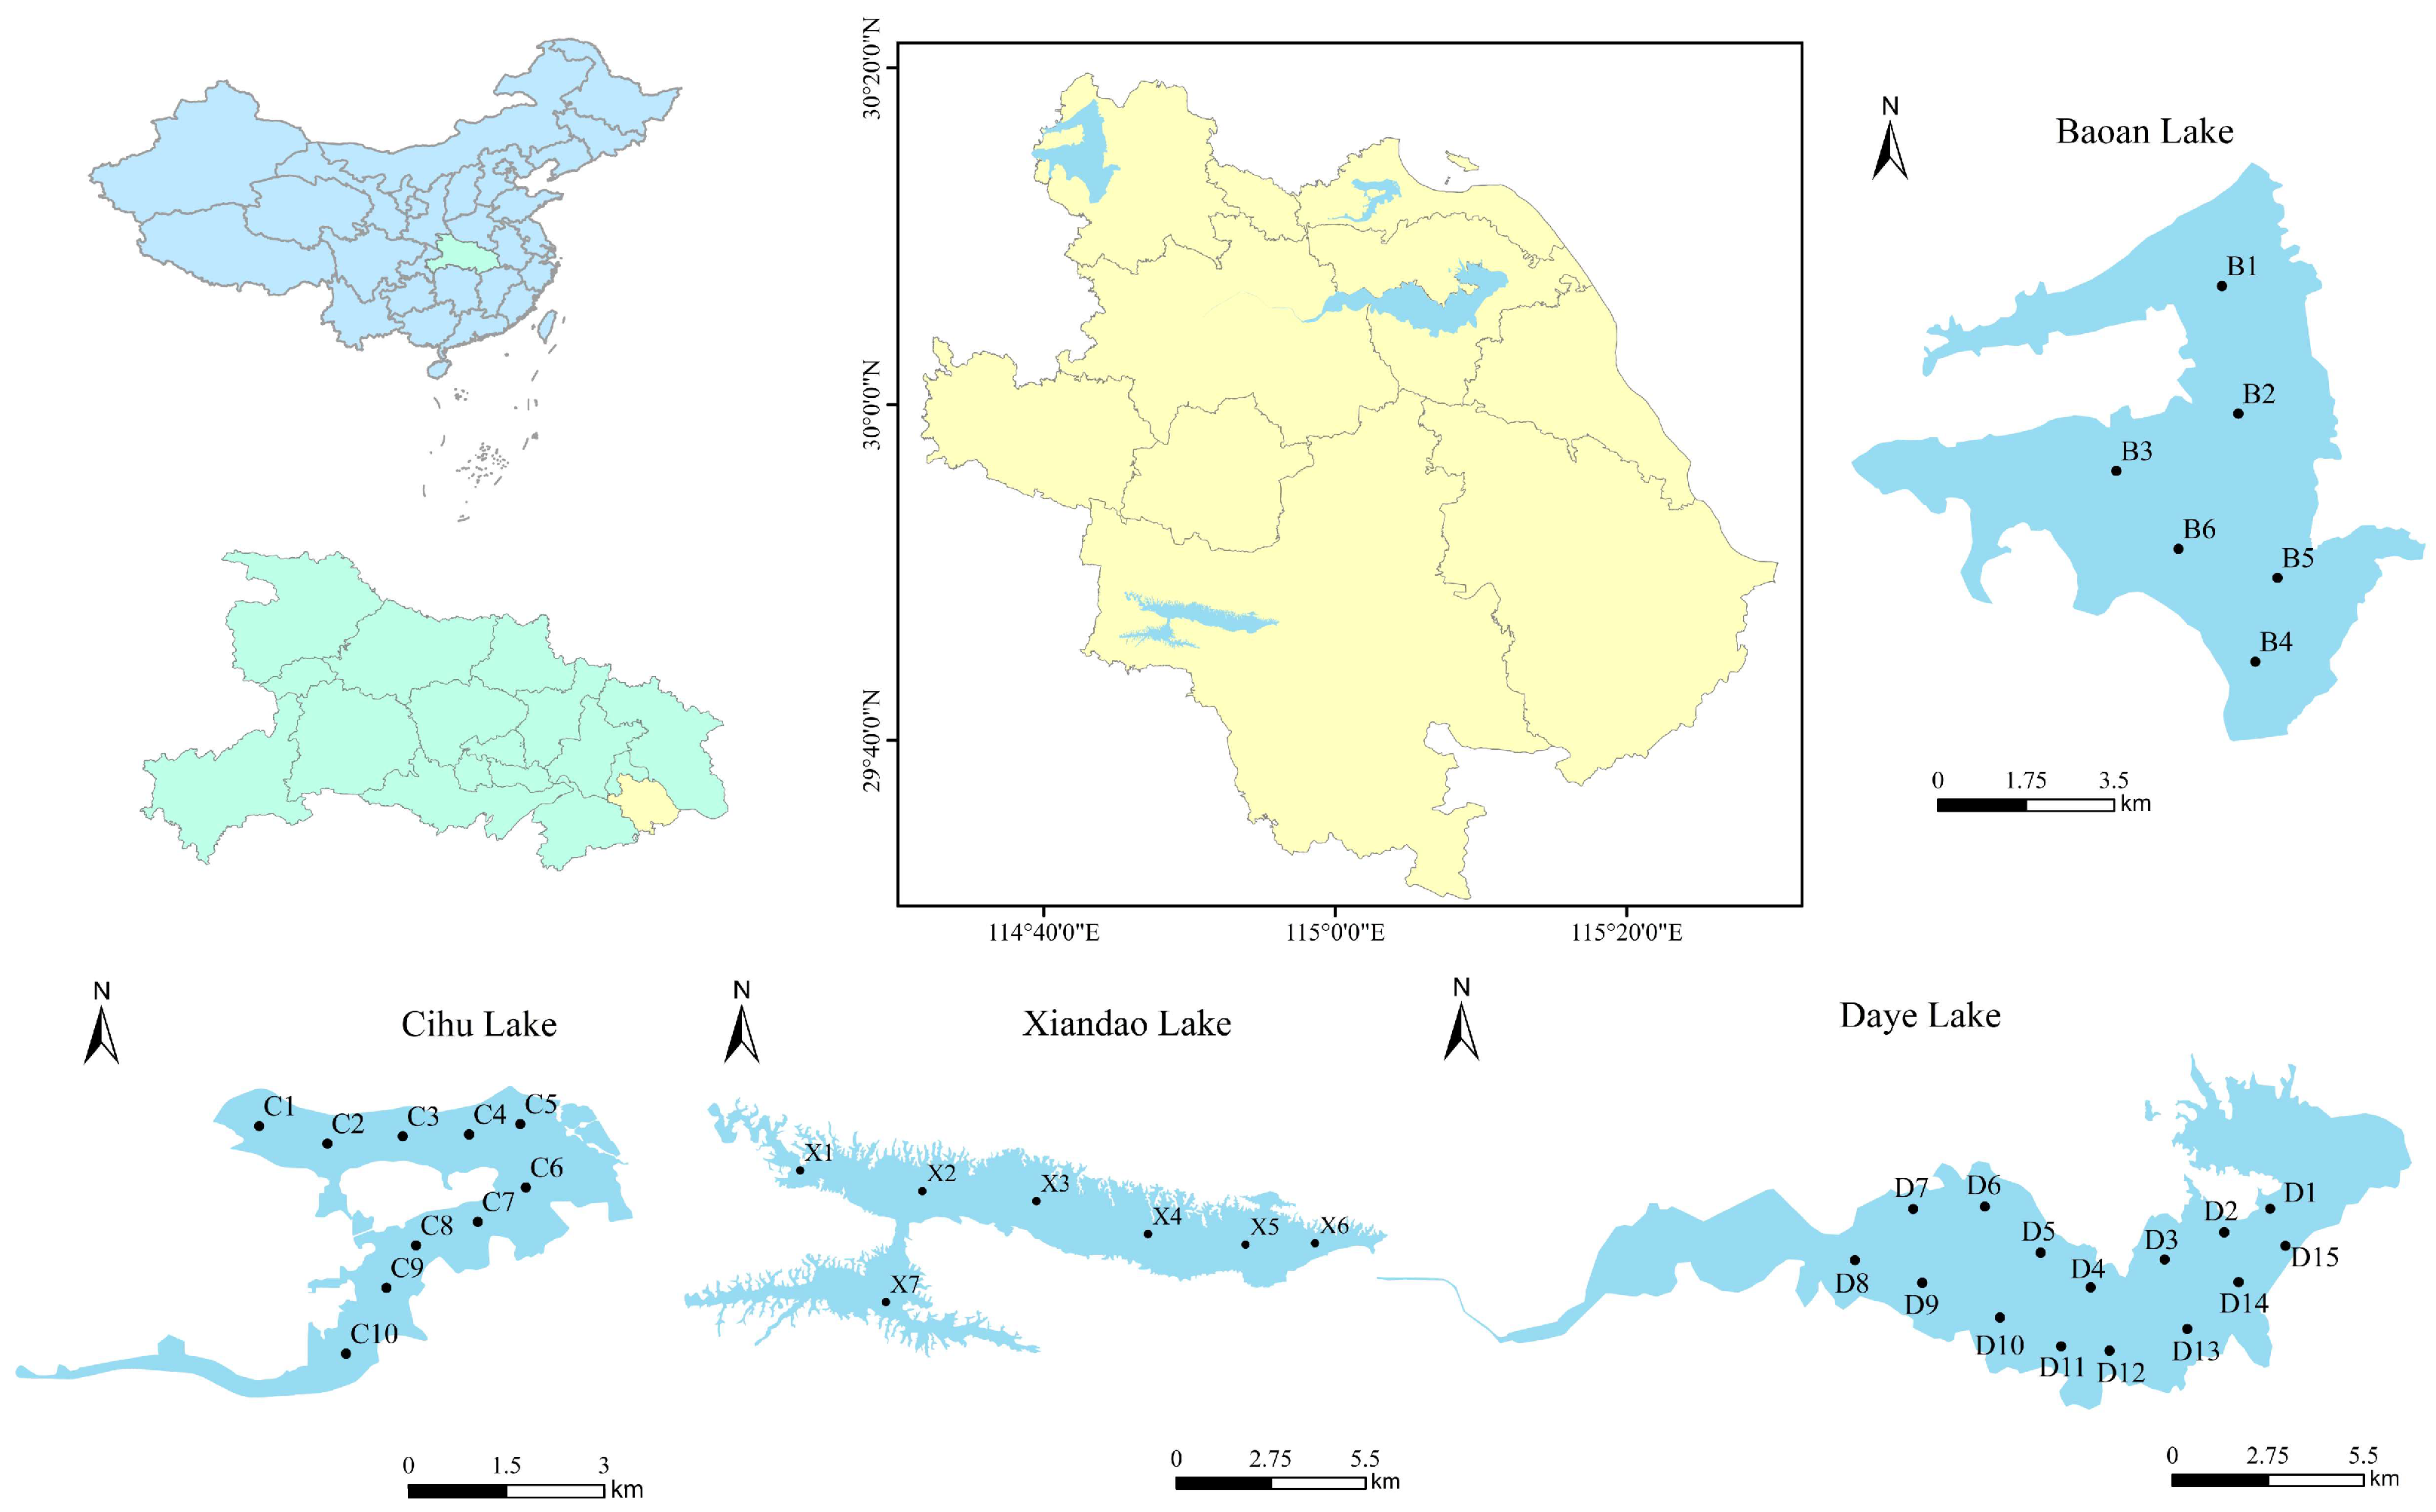
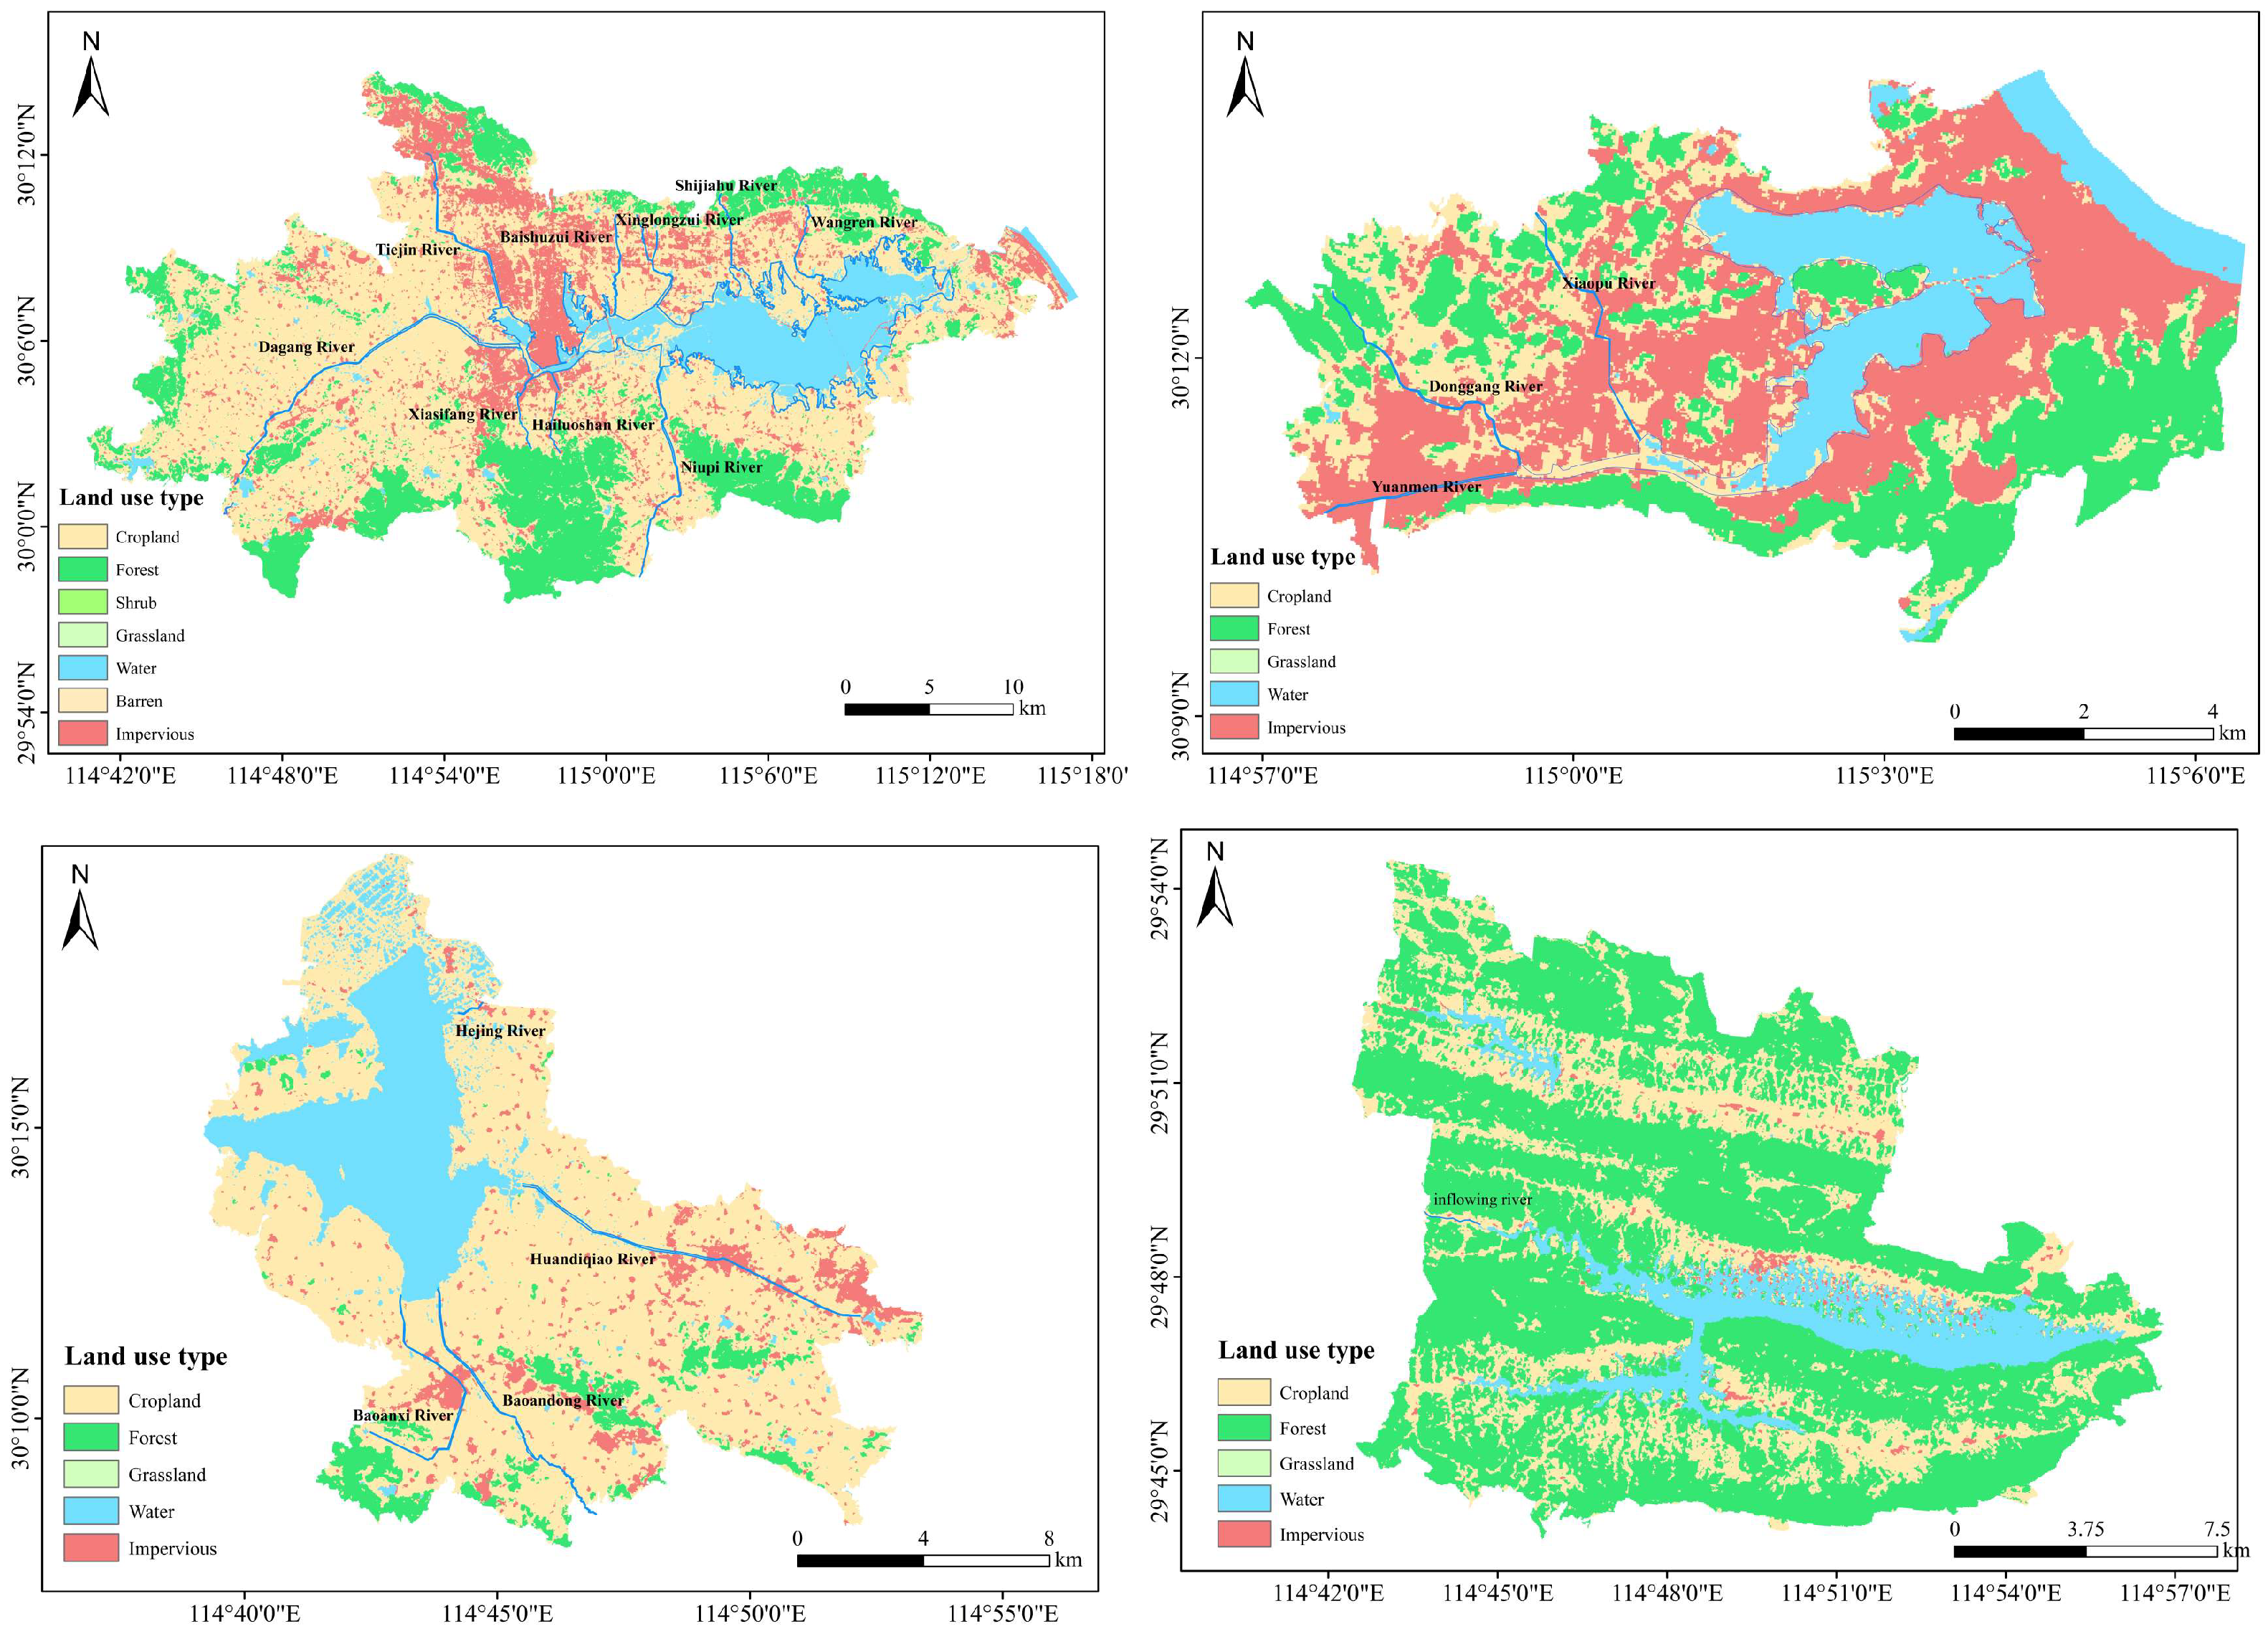
2.1. An Overview of the Study Area
2.2. Sampling Point Setting and Indicator Measurement
2.3. Evaluation Methods
2.3.1. Fuzzy Comprehensive Evaluation Method
2.3.2. Comprehensive TLI
2.4. Data Analysis
3. Results
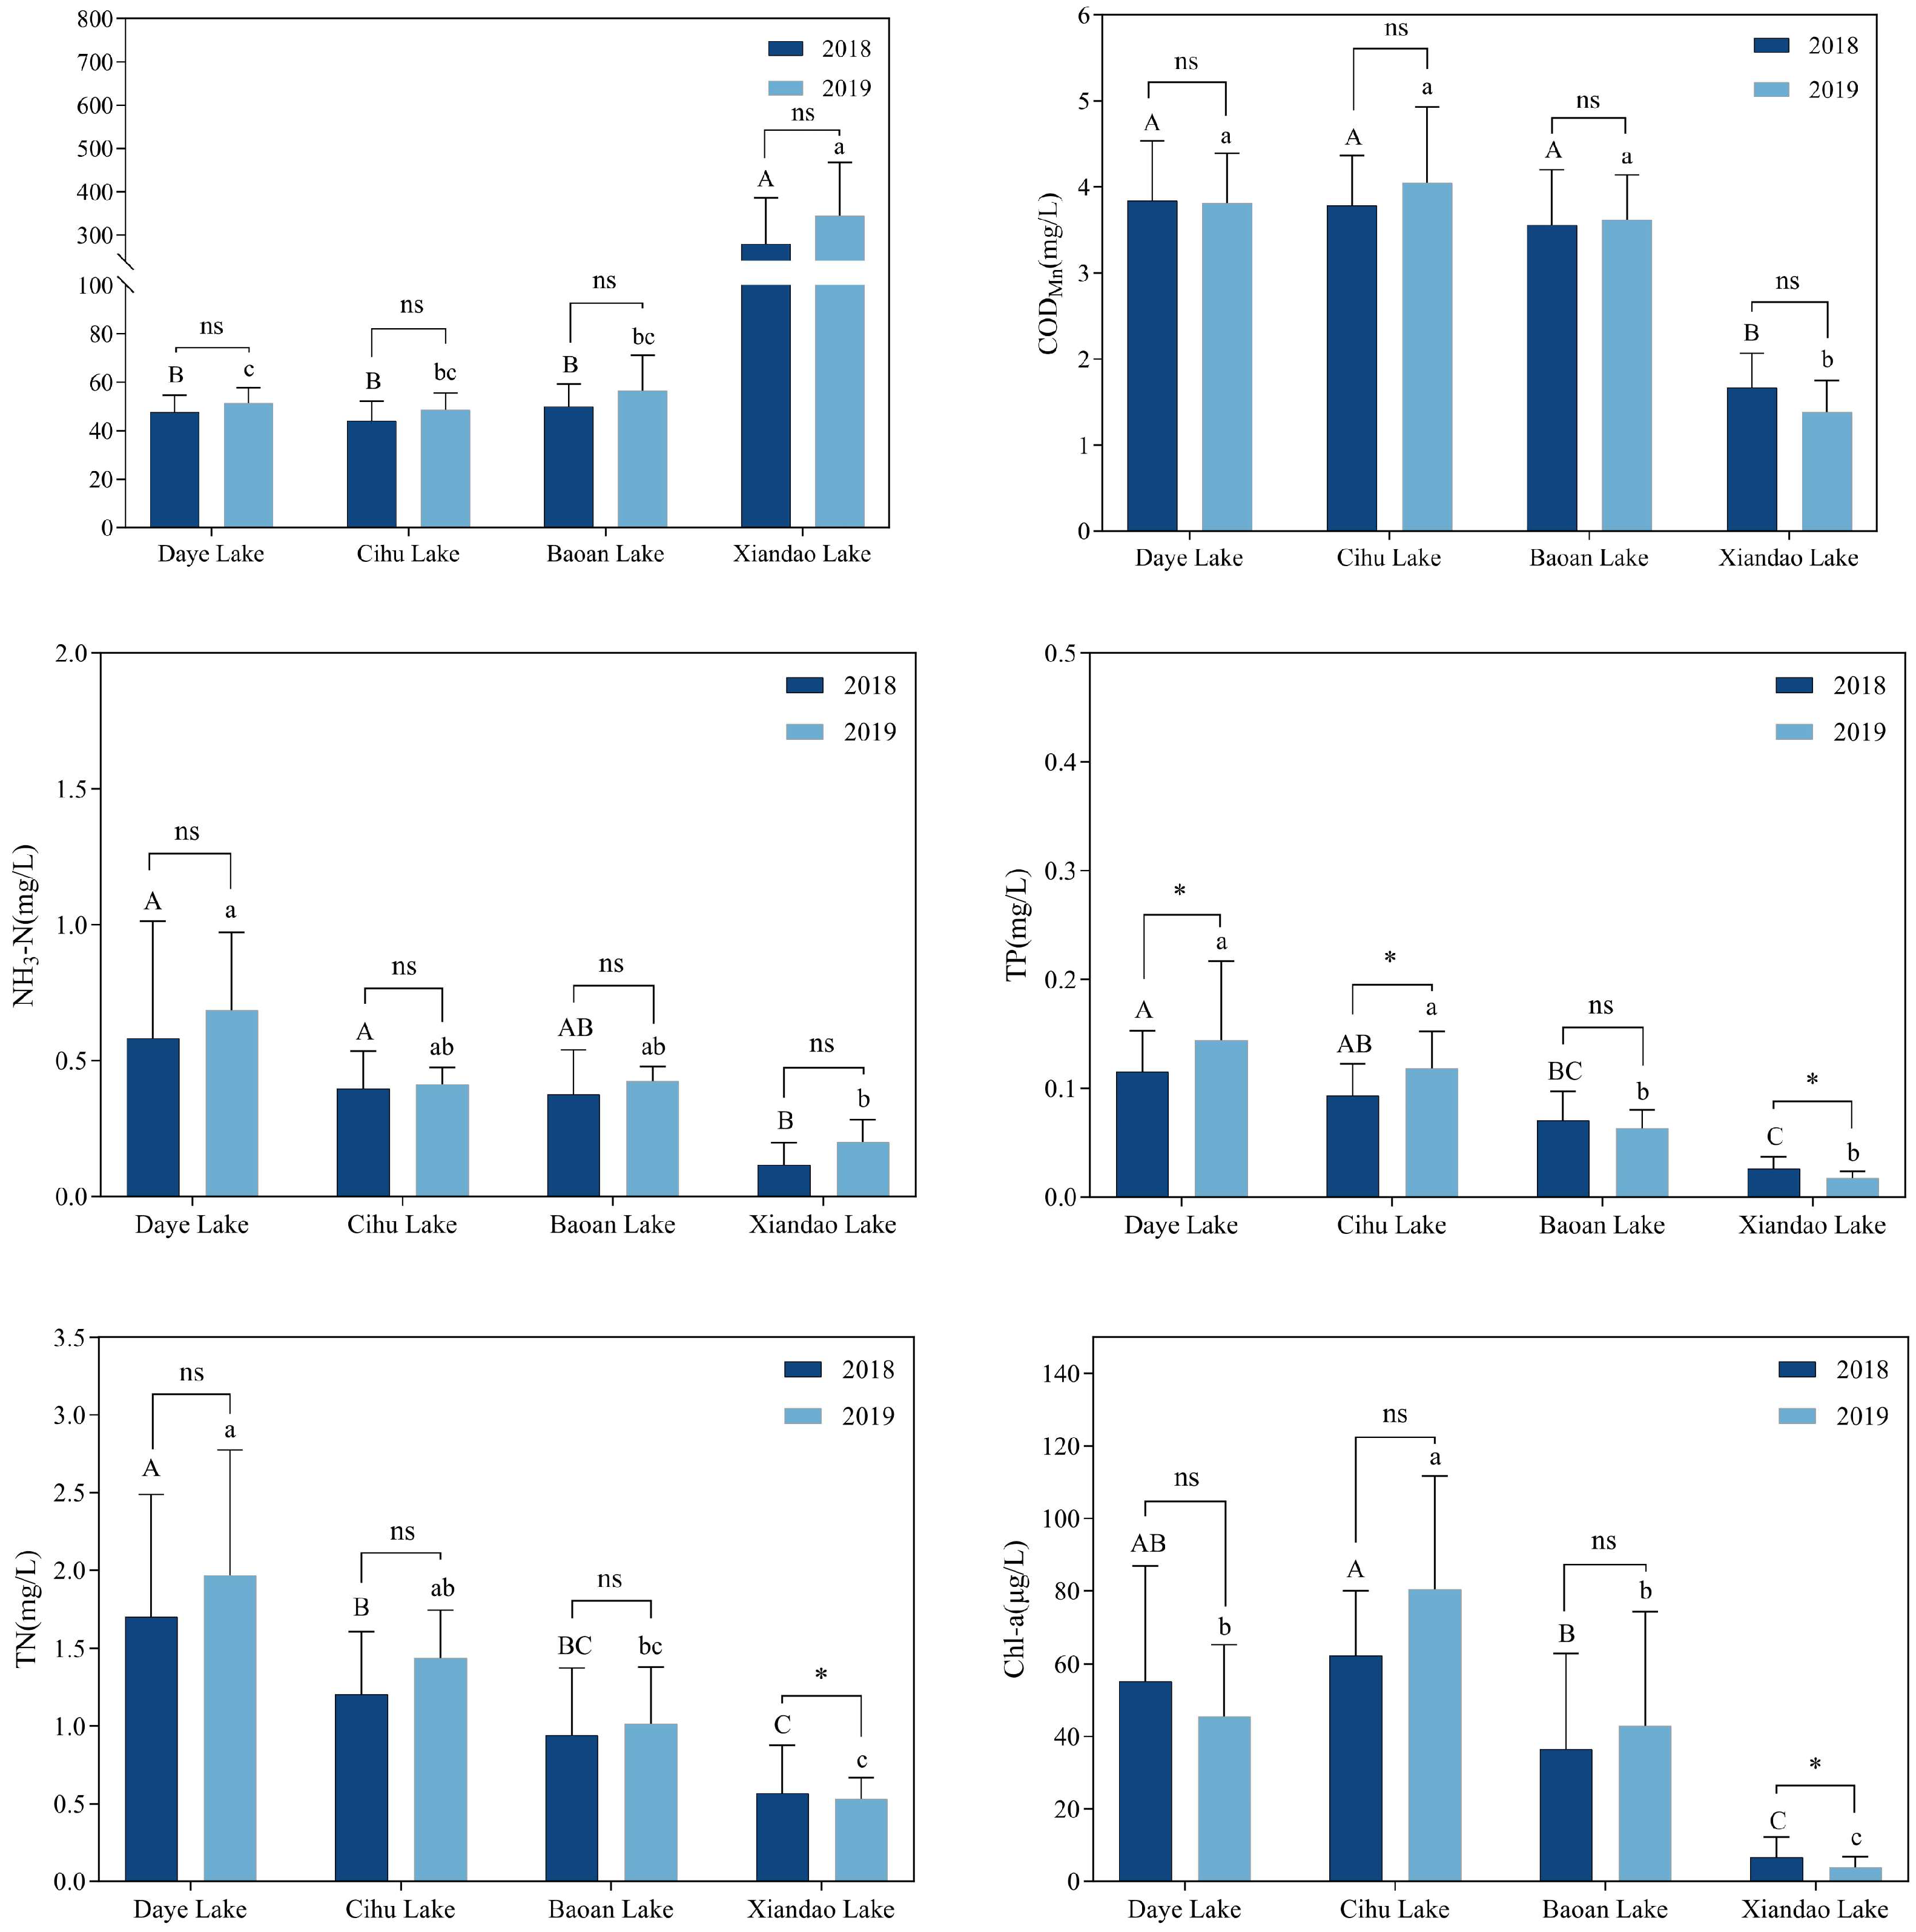
3.1. Chemical and Physical Characteristics of Water Bodies
3.2. Comprehensive Evaluation of Water Quality Levels
3.3. An Evaluation of the Comprehensive Trophic Level Index
4. Discussion
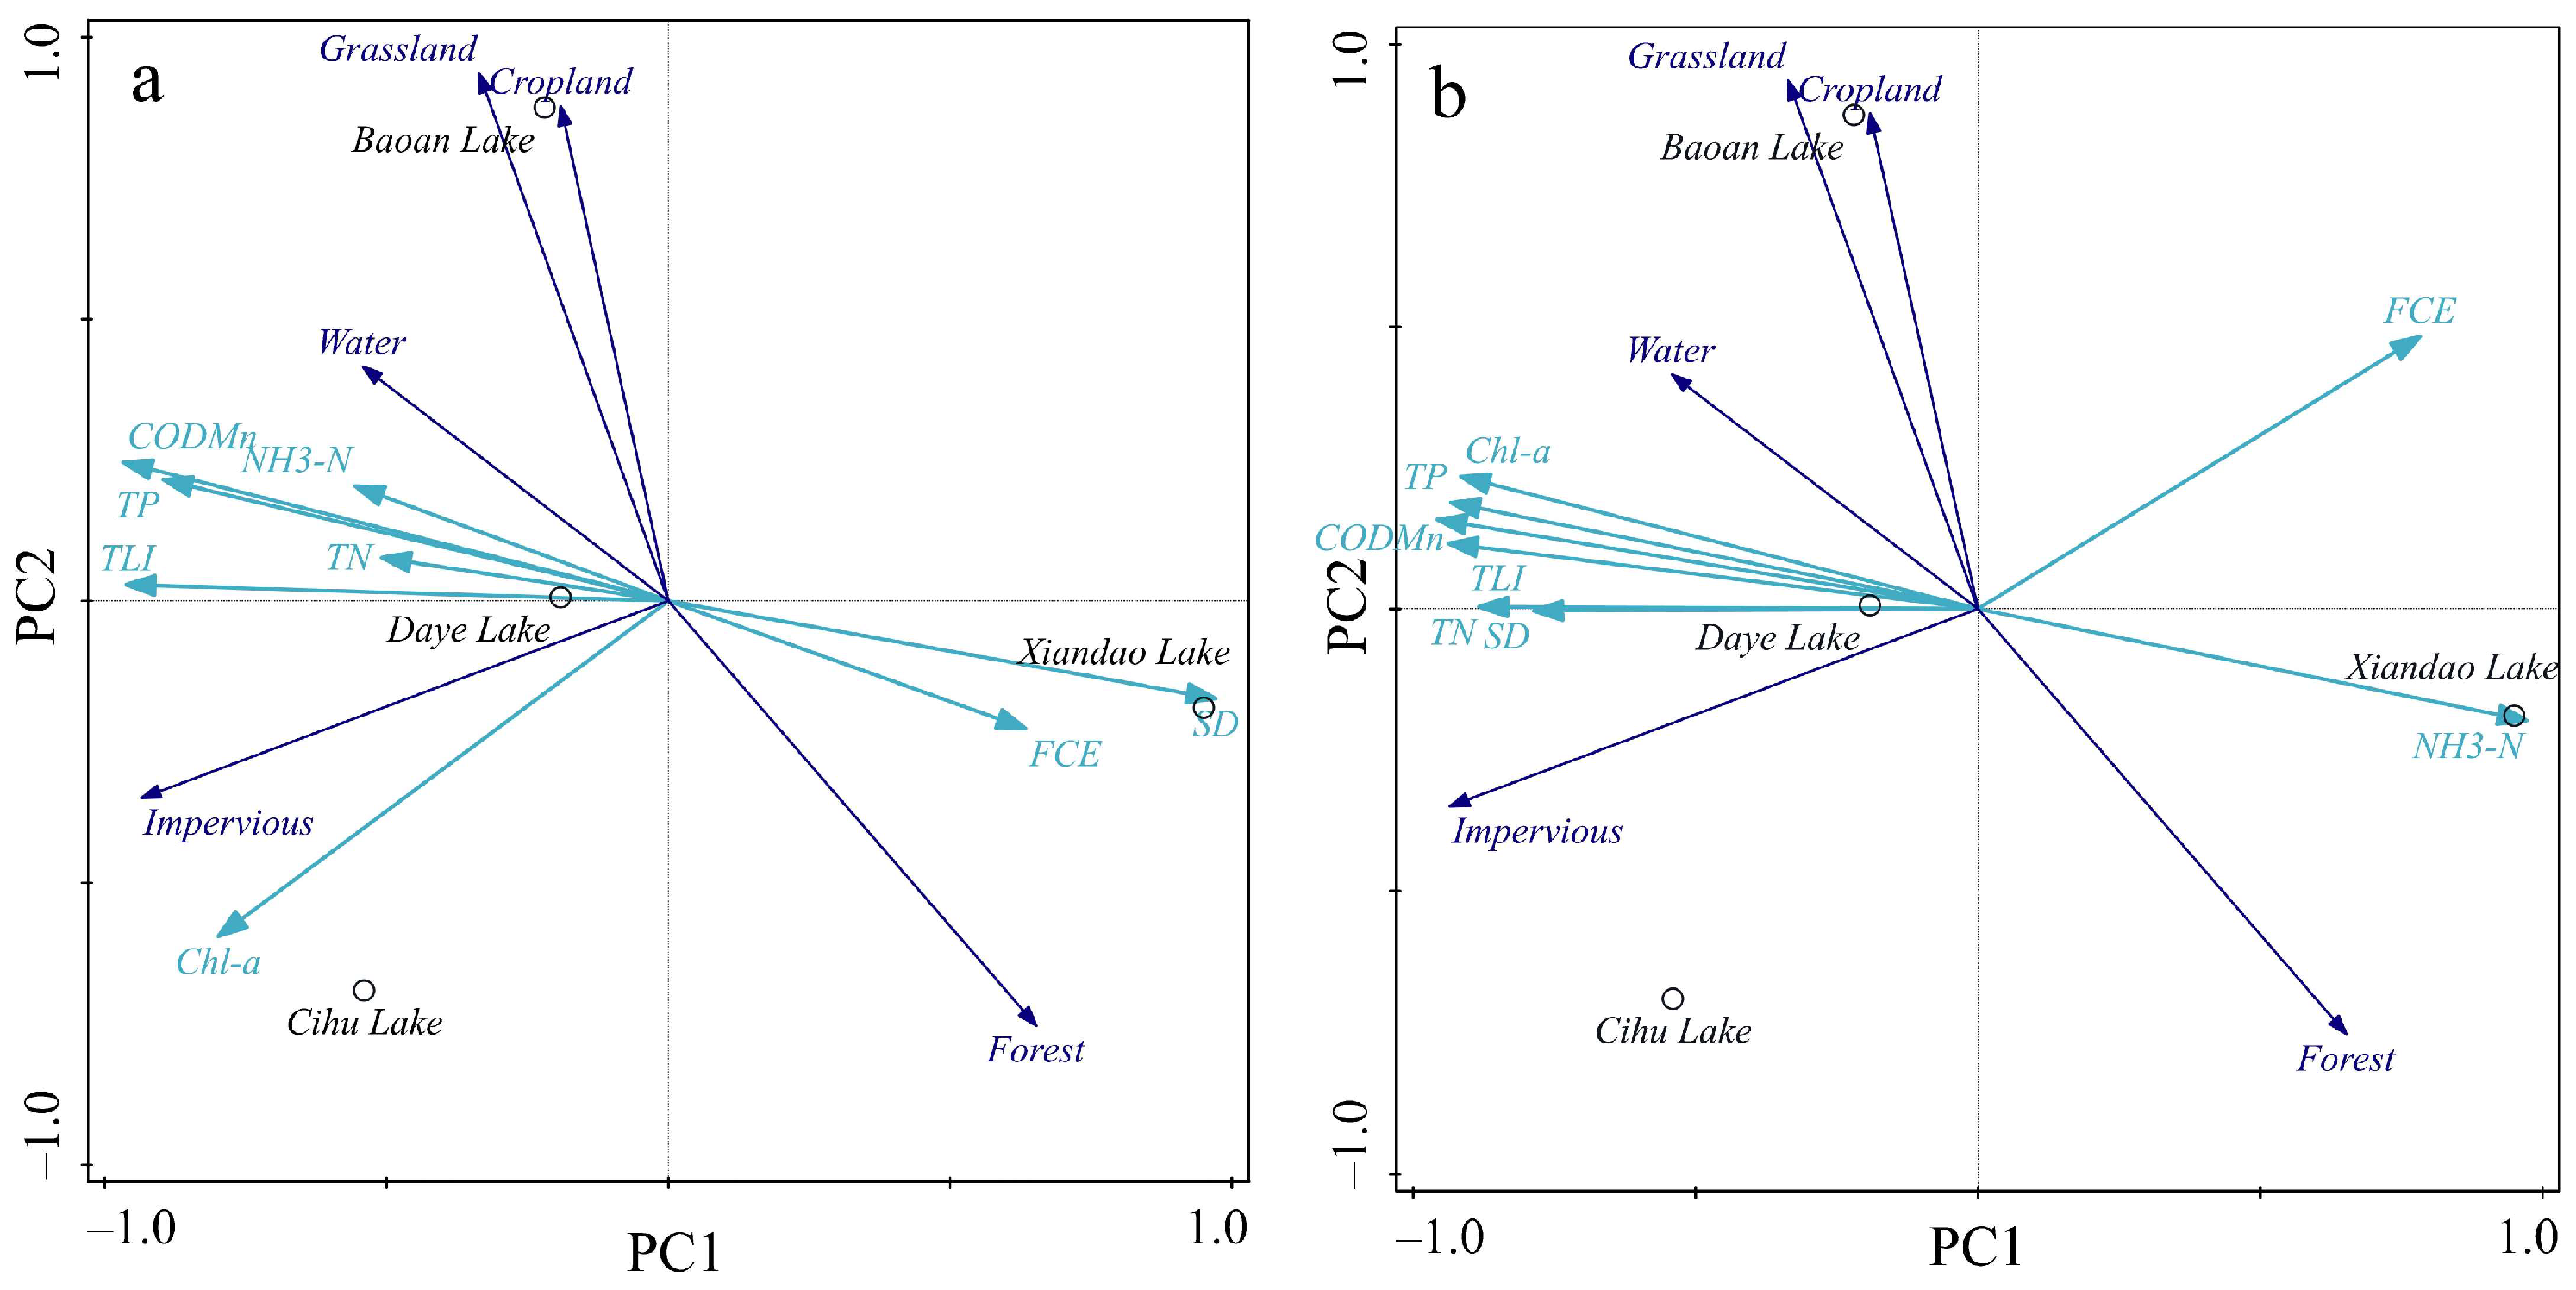
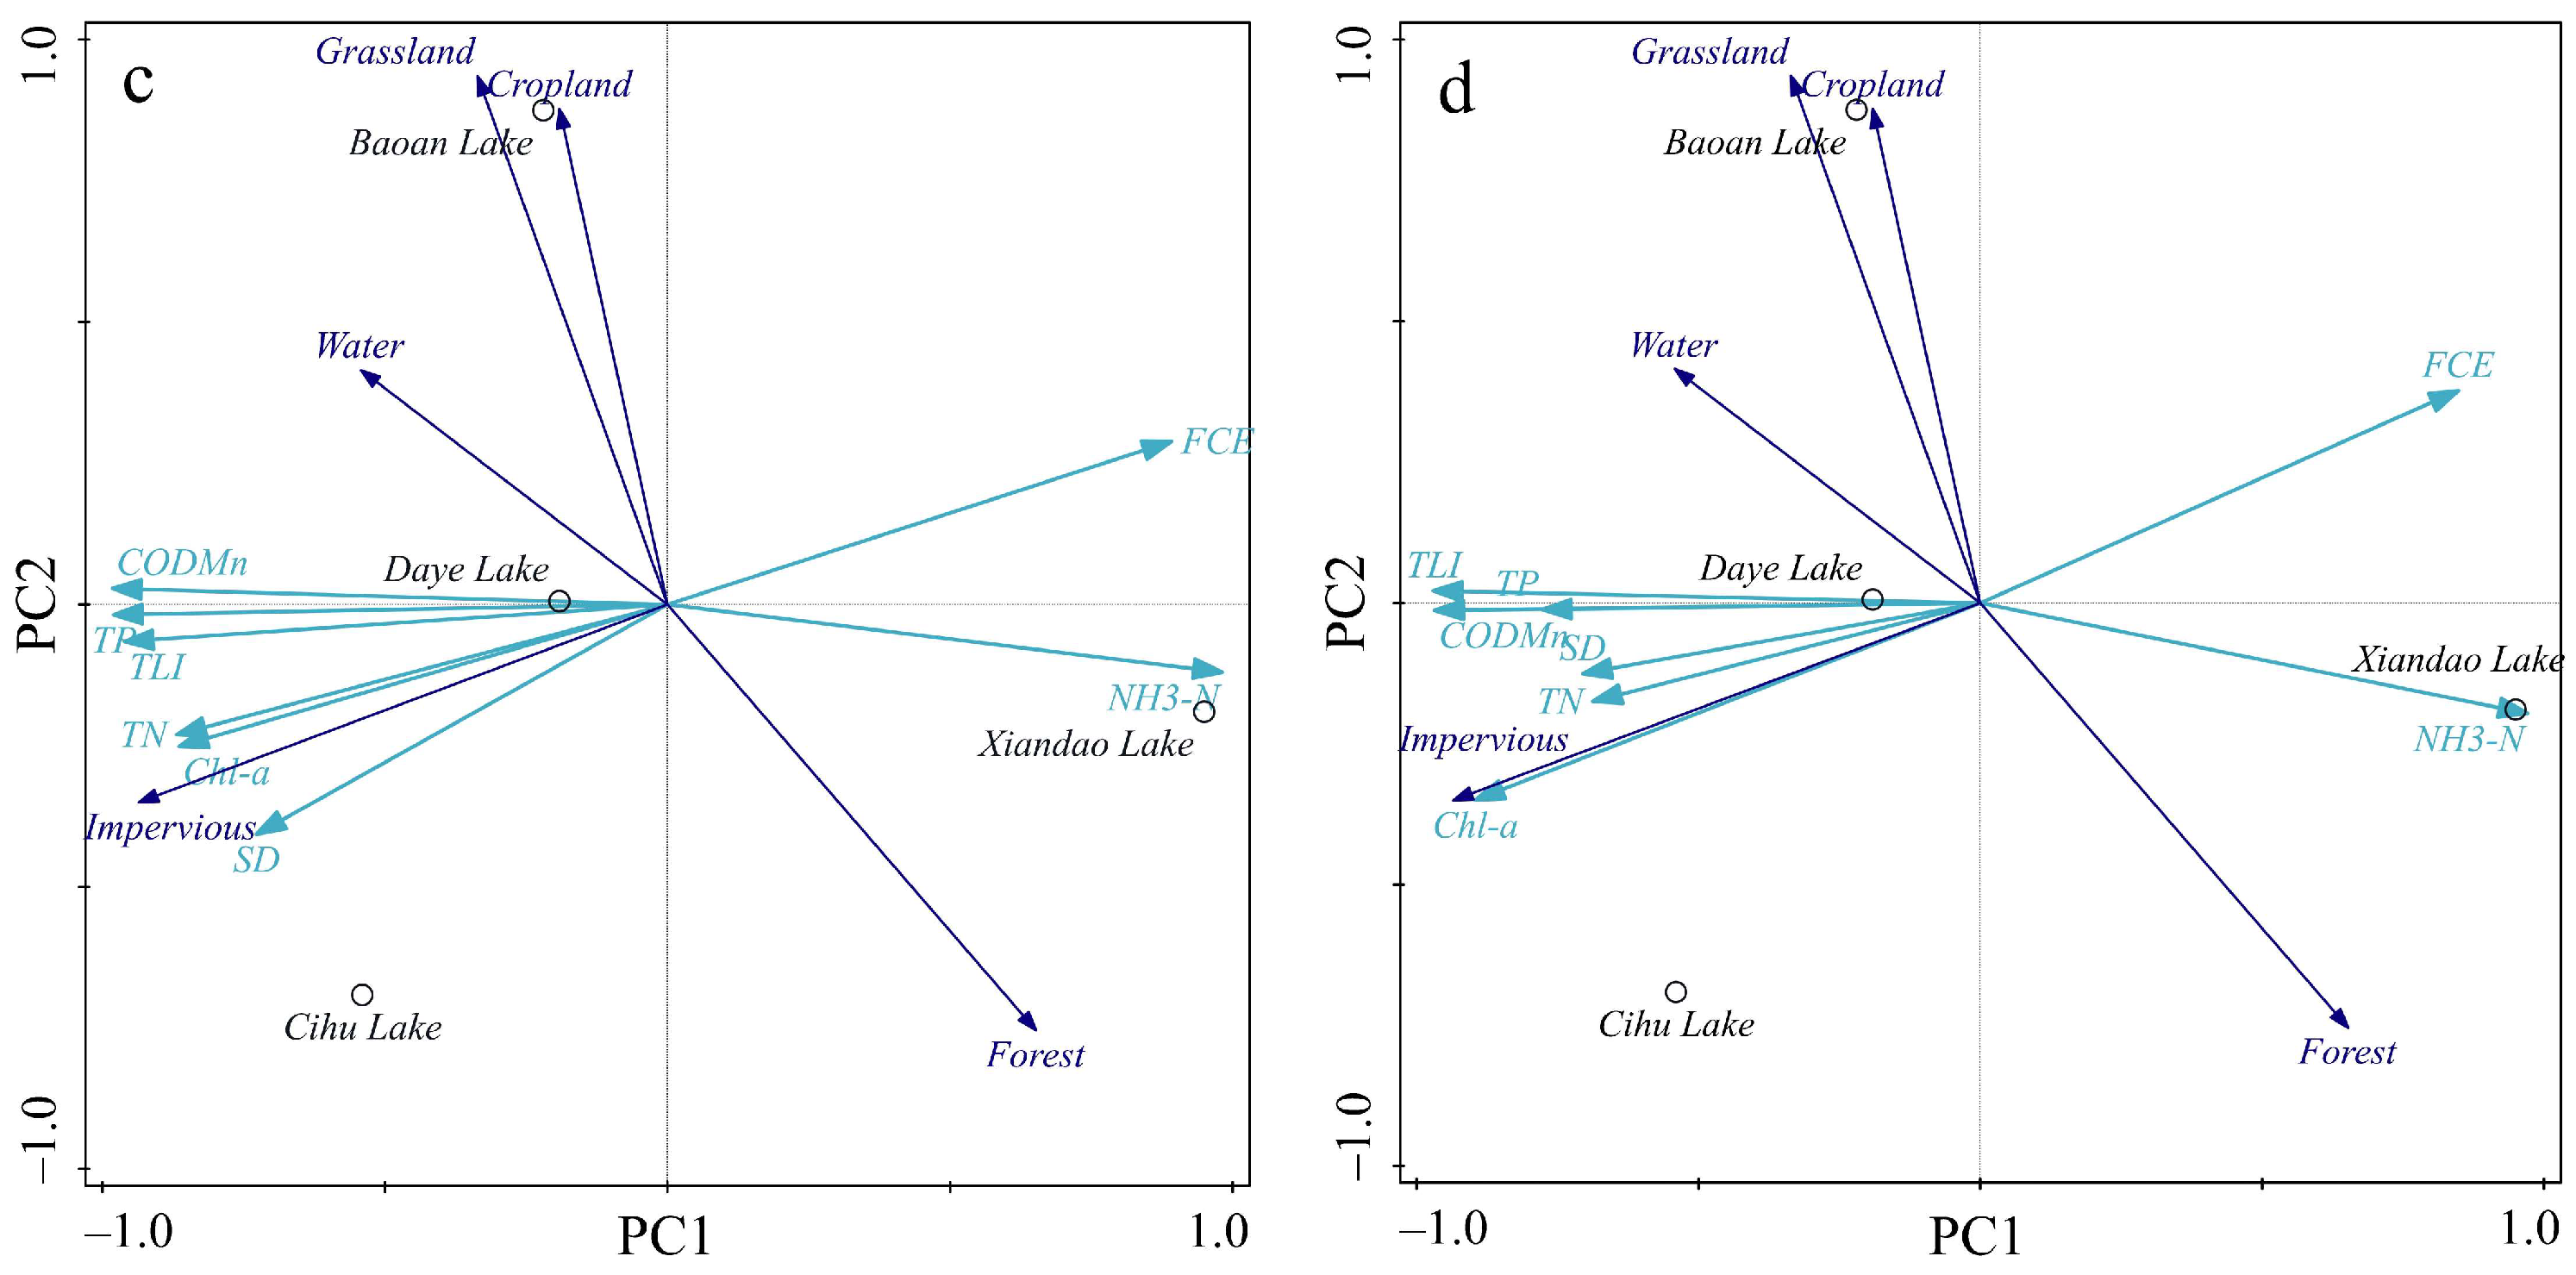
4.1. An Analysis of Factors Affecting the Water Quality
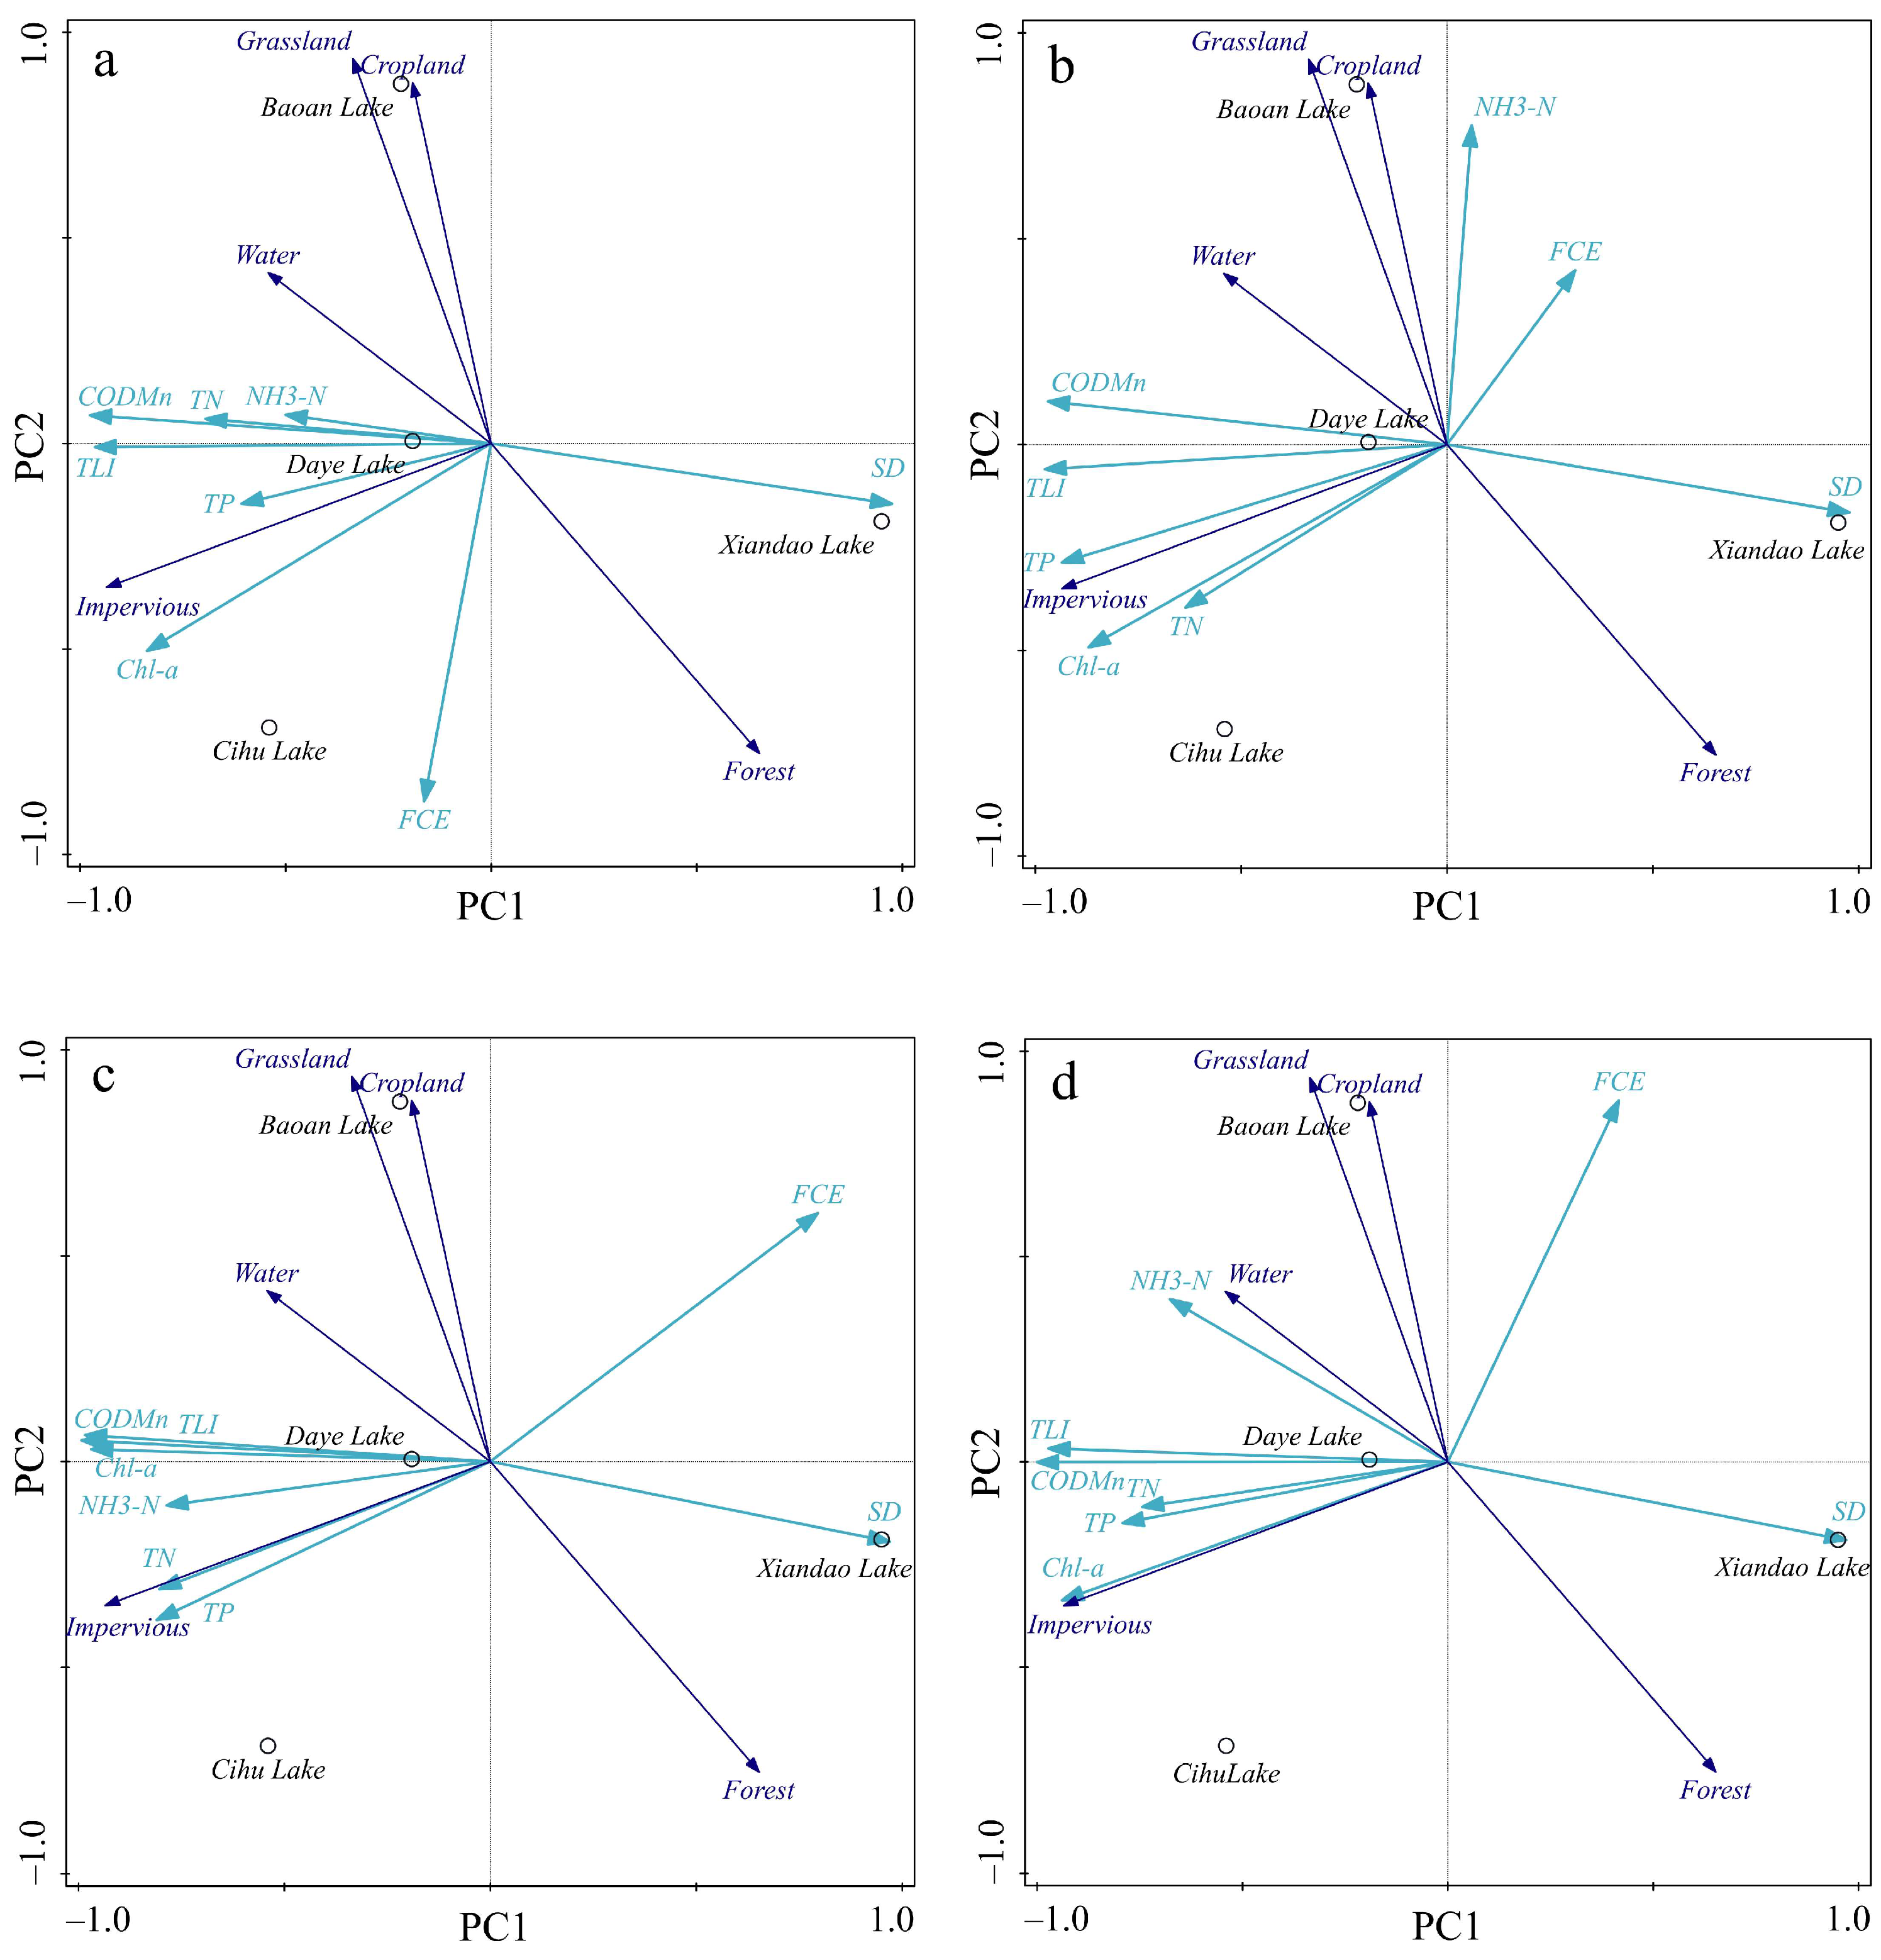
4.2. Impacts of Land Use on Lake Water Quality
4.3. Impacts of Inflowing Rivers and Precipitation on the Lake’s Water Quality
5. Conclusions
Author Contributions
Funding
Institutional Review Board Statement
Informed Consent Statement
Data Availability Statement
Conflicts of Interest
References
- Xie, Q.; Liu, J.; Liang, D. Spatio-temporal dynamics of lake distribution and their impact on ecosystem service values in Wuhan urbanized area during 1987–2016. Acta Ecol. Sin. 2020, 40, 7840–7850. [Google Scholar]
- Miao, S.; Liu, C.; Qian, B.; Miao, Q. Remote sensing-based water quality assessment for urban rivers: A study in Linyi de-velopment area. Environ. Sci. Pollut. Res. 2020, 27, 34586–34595. [Google Scholar] [CrossRef] [PubMed]
- He, X.; Li, X.; Gao, P.; Zhang, W. Seasonal Difference and Water Quality of Lakes in Taibaishan Nature Reserve. Sichuan Environ. 2021, 40, 82–88. (In Chinese) [Google Scholar]
- Liu, C.; Huang, W.; Gu, X.; Zhang, L.; Chen, K. The potential ecological risks and bioavailability of heavy metals in the sediments of Lake Baiyangdian. J. Lake Sci. 2022, 34, 1980–1992. [Google Scholar]
- Tao, Y.; Zhao, R. Occurrence and distribution of persistent organic pollutants in water of Chinese lakes and reservoirs. J. Lake Sci. 2020, 32, 309–324. [Google Scholar]
- Wang, X.; Pan, B.; Wang, L.; Liu, T.; Liao, Z.; Han, X.; Yang, Z. Water Environment Characteristics and Water Quality Assessment of Typical Lakes in Inner Mongolia. Environ. Sci. 2023, 44, 6744–6753. (In Chinese) [Google Scholar]
- Li, B.; Yang, G.; Wan, R. Multidecadal water quality deterioration in the largest freshwater lake in China (Poyang Lake): Implications on eutrophication management. Environ. Pollut. 2020, 260, 114033. [Google Scholar] [CrossRef]
- Paerl, H.; Huisman, J. Climate blooms like it hot. Science 2008, 320, 57–58. [Google Scholar] [CrossRef]
- Yang, X.; Wu, X.; Hao, H.; He, Z. Mechanisms and assessment of water eutrophication. Zhejiang Da Xue Xue Bao Li Xue Ban. 2008, 9, 197–209. [Google Scholar] [CrossRef]
- Ning, Y.; Yin, F.; Li, X. Application of several Evaluation Methods for River Water Quality in the Yangtze River Mainstream. J. Southwest Univ. (Nat. Sci.) 2020, 42, 126–133. (In Chinese) [Google Scholar]
- Bi, Y.; Wang, H.; Xia, B.; Jiang, C.; Wu, W.; Li, Z.; Li, S.; Su, H.; Bai, Z.; Xu, S.; et al. Pollution Characterization and Comprehensive Water Quality Assessment of Rain-source River: A Case Study of the Longgang River in Shenzhen. Environ. Sci. 2022, 43, 782–794. (In Chinese) [Google Scholar] [CrossRef]
- Yang, H.; Jia, C.; Yang, F.; Yang, X.; Wei, R. Water quality assessment of deep learning-improved comprehensive pollution index: A case study of Dagu River, Jiaozhou Bay, China. Environ. Sci. Pollut. Res. 2023, 30, 66853–66866. [Google Scholar] [CrossRef] [PubMed]
- Li, L.; Men, B.; Peng, R. Water quality evaluation of Wenyu River based on single factor evaluation and comprehensive pollution index method. Nat. Environ. 2021, 20, 1041–1046. [Google Scholar]
- Li, B.; Wu, Q.; Zhang, W.; Liu, Z. Water resources security evaluation model based on grey relational analysis and analytic network process: A case study of Guizhou Province. J. Water Process. Eng. 2020, 37, 101429. [Google Scholar] [CrossRef]
- Wang, X.; Zhao, X.; Liu, Z.; Dong, S. Research on Lake Eutrophication Forecasting Methods Based on Gray Theory. Comput. Simul. 2011, 28, 17–19. [Google Scholar]
- Yang, Q.; Zhang, J.; Hou, Z.; Lei, X.; Tai, W.; Chen, W.; Chen, T. Shallow groundwater quality assessment: Use of the improved Nemerow pollution index, wavelet transform and neural networks. J. Hydroinform. 2017, 19, 784–794. [Google Scholar] [CrossRef]
- Lin, T.; Yin, J.; Zhang, B.; Shan, Y.; Yang, P.; Yang, Y.; Yu, Y. Application of improved comprehensive water quality identification index method in water quality evaluation of the Pearl River Estuary. Water Resour. Prot. 2022, 38, 166–173+194. (In Chinese) [Google Scholar] [CrossRef]
- Wang, B.; Yang, Z.; Li, H.; Du, X.; Qin, W.; Li, F. Identification of the Songhua River Water Quality Using Fuzzy Synthetic Evaluation and GIS Approach. Res. Environ. 2008, 6, 124–129. [Google Scholar]
- Icaga, Y. Fuzzy evaluation of water quality classification. Ecol. Indic. 2006, 7, 710–718. [Google Scholar] [CrossRef]
- Wang, J.; Fu, Z.; Qiao, H.; Liu, F. Assessment of eutrophication and water quality in the estuarine area of Lake Wuli, Lake Taihu, China. Sci. Total Environ. 2018, 650, 1392–1402. [Google Scholar] [CrossRef]
- Lin, S.; Shen, S.; Zhou, A.; Lyu, H. Assessment and management of lake eutrophication: A case study in Lake Erhai, China. Sci. Total Environ. 2020, 751, 141618. [Google Scholar] [CrossRef] [PubMed]
- Shen, X.; Ma, W.; Luo, J.; Chen, X. Evaluation method of nutritional status and its applicability analysis in lakes and reservoirs. J. China Inst. Water Resour. Hydropower Res. 2013, 11, 74–80. [Google Scholar]
- Li, Y.; Zheng, C.; Qiu, X.; Yin, L.; Yang, Z. Analysis and evaluation of water quality and eutrophication status in tenggeli lake of ningxia. Sci. Technol. Eng. 2019, 19, 309–315. [Google Scholar]
- Liu, Y.; Liu, P.; Liu, L.; Zhang, D.; Wu, S.; Liu, S.; Li, H. Variation trend and cause analysis of water quality in Daye Lake of Huangshi City. J. Environ. Eng. Technol. 2022, 12, 553–559. [Google Scholar]
- Wu, C.; Wu, X.; Ge, X.; Feng, L.; Tan, Y.; Yang, J.; Ren, W.; Zou, M. Characteristics of Dissolved Organic Matter in Sediments of Typical Lakes in Southeastern Hubei Province, China. Int. J. Environ. Res. Public Health 2022, 19, 7402. [Google Scholar] [CrossRef]
- Wu, X.; Ma, X.; Jiang, B.; Ge, Z.; Ren, W.; Oin, Y.; Tan, Y. Temporal and Spatial Distribution Characteristics of Dissolved Organic Matter in Cihu Lake of Huangshi City. J. Ecol. Rural Environ. 2020, 36, 1276–1284. [Google Scholar]
- Chen, J.; Wang, K.; Guo, Y.; Zhu, K.; Ba, A.; Liu, Y.; Zhao, K. Food web structure of the Bao’an Lake based on stable carbon and nitrogen isotopes analysis. Acta Hydrobiologica Sinica. 2022, 46, 699–706. [Google Scholar]
- Wu, C.; Wu, X.; Ge, X.; Ren, W.; Feng, L.; Yang, J.; Tan, Y. Optical Properties of Five Typical Lakes in Southeastern Hubei Province. J. Hydroecol. 2022, 43, 96–104. [Google Scholar]
- Nanjing Institute of Geography and Limnology Chinese Academy of Sciences. Technical Regulations for Lake Investigation; Science Press: Beijing, China, 2015; pp. 58–80. [Google Scholar]
- GB3838-2002; Environmental Quality Standards for Surface Water. Ministry of Ecological and Environment of the People’s Republic of China: Beijing, China, 2002.
- Wang, Y.; Zhang, R.; Zhao, Y.; Sun, Y. Research on the Application of Fuzzy Comprehensive Evaluation Method in Lake Water Quality Evaluation. Jiangsu Agric. Sci. 2010, 1, 326–328. (In Chinese) [Google Scholar]
- Zhao, M.; Jiao, S.L.; Liang, H. Eutrophication of Lakes in Karst Plateau Based on the Comprehensive Trophic State Index Method. J. China Hydrol. 2020, 40, 9–15. (In Chinese) [Google Scholar]
- Zhang, Y.; Li, M.; Dong, J.; Yang, H.; Van Zwieten, L.; Lu, H.; Alshameri, A.; Zhan, Z.; Chen, X.; Jiang, X.; et al. A Critical Review of Methods for Analyzing Freshwater Eutrophication. Water 2021, 13, 225. [Google Scholar] [CrossRef]
- Bhagowati, B.; Ahamad, K.U. A review on lake eutrophication dynamics and recent developments in lake modeling. Ecohydrol. Hydrobiol. 2019, 19, 155–166. [Google Scholar] [CrossRef]
- Li, X.; Zhang, W.; Wu, J.; Li, H.; Zhao, T.; Zhao, C.; Shi, R.; Li, Z.; Wang, C.; Li, C. Loss of nitrogen and phosphorus from farmland runoff and the interception effect of an ecological drainage ditch in the North China Plain—A field study in a modern agricultural park. Ecol. Eng. 2021, 169, 106310. [Google Scholar] [CrossRef]
- Gržinić, G.; Piotrowicz-Cieślak, A.; Klimkowicz-Pawlas, A.; Górny, R.L.; Ławniczek-Wałczyk, A.; Piechowicz, L.; Olkowska, E.; Potrykus, M.; Tankiewicz, M.; Krupka, M.; et al. Intensive poultry farming: A review of the impact on the environment and human health. Sci. Total Environ. 2022, 858, 160014. [Google Scholar] [CrossRef]
- Wang, X.; Qin, B.; Gao, G.; Paerl, W. Nutrient enrichment and selective predation by zooplankton promote Microcystis (Cyanobacteria) bloom formation. J. Plankton Res. 2010, 32, 457–470. [Google Scholar] [CrossRef]
- Liu, X.; Zhang, G.; Sun, G.; Wu, Y.; Chen, Y. Assessment of Lake Water Quality and Eutrophication Risk in an Agricultural Irrigation Area: A Case Study of the Chagan Lake in Northeast China. Water 2019, 11, 2380. [Google Scholar] [CrossRef]
- Peng, D.; Jiang, X.; Sun, X.; Miu, R.; Ai, X. Spatio-temporal patterns and influencing factors of phytoplankton communities in the main inflow rivers of Qinghai Lake. Acta Sci. Circumstantiae 2024, 44, 491–502. [Google Scholar]
- Dong, Y.; Zhao, W.; Ji, S.; Wei, J.; Li, B.; Shi, X. Community structure of zooplankton and water quality evaluation in Chaobai River system in Beijing. J. Dalian Ocean Univ. 2020, 35, 424–431. (In Chinese) [Google Scholar]
- Subhasis, G.; Qiu, Z. Understanding the relationship of land uses and water quality in Twenty First Century: A review. J. Environ. Manag. 2016, 173, 41–48. [Google Scholar]
- Xiang, S.; Pan, Y.; Dou, J.; Lv, X.; Xue, L.; Cu, Z. Impact of land use on the water quality of inflow river to Erhai Lake at different temporal and spatial scales. Acta Ecol. Sin. 2018, 38, 876–885. [Google Scholar]
- Wu, J.; Zeng, S.; Yang, L.; Ren, Y.; Xia, J. Spatiotemporal characteristics of the water quality and its multiscale relationship with land use in the Yangtze River Basin. Remote Sens. 2021, 13, 3309. [Google Scholar] [CrossRef]
- Lewis, A.S.L.; Kim, B.S.; Edwards, H.L.; Wander, H.L.; Garfield, C.M.; Murphy, H.E.; Poulin, N.D.; Princiotta, S.D.; Rose, K.C.; Taylor, A.E.; et al. Prevalence of phyto-plankton limitation by both nitrogen and phosphorus related to nutrient stoichiometry, land use, and primary producer biomass across the northeastern United States. Inland Waters. 2010, 10, 42–50. [Google Scholar] [CrossRef]
- Yin, F.; Xiang, Y. Fuzzy Comprehensive Evaluation of Water Quality in Daye Lake. Wetl. Sci. 2016, 14, 428–432. [Google Scholar]
- Massoud, M.A.; El-Fadel, M.; Scrimshaw, M.D.; Lester, J.N. Factors influencing development of management strategies for the Abou Ali River in Lebanon: I: Spatial variation and land use. Sci. Total Environ. 2006, 362, 15–30. [Google Scholar] [CrossRef] [PubMed]
- Ren, W.; Wu, X.; Ge, X.; Lin, G.; Feng, L.; Ma, W.; Xu, D. Study on the Water Quality Characteristics of the Baoan Lake Basin in China under Different Land Use and Landscape Pattern Distributions. Int. J. Environ. Res. Public Health 2022, 19, 6082. [Google Scholar] [CrossRef]
- Liu, H.; Zhou, W.; Li, X.; Chu, Q.; Tang, N.; Shu, B.; Liu, G.; Xing, W. How many submerged macrophyte species are needed to improve water clarity and quality in Yangtze floodplain lakes? Sci. Total Environ. 2020, 724, 138267. [Google Scholar] [CrossRef]
- Song, Y.; Liew, J.; Sim, D.Z.H.; Mowe, M.A.D.; Mitrovic, S.M.; Tan, H.T.W.; Yeo, D.C.J. Effects of macrophytes on lake-water quality across latitudes: A meta-analysis. Oikos 2019, 128, 468–481. [Google Scholar] [CrossRef]
- Shi, P.; Zhang, Y.; Li, Z.; Li, P.; Xu, G. Influence of land use and land cover patterns on seasonal water quality at multi-spatial scales. Catena 2016, 151, 182–190. [Google Scholar] [CrossRef]
- Suthar, S.; Sharma, J.; Chabukdhara, M.; Nema, A.K. Water quality assessment of river Hindon at Ghaziabad, India: Impact of industrial and urban wastewater. Environ. Monit. Assess. 2009, 165, 103–112. [Google Scholar] [CrossRef]
- Xiang, S.; Wan, L.; Pang, Y. Spatial-temporal variation of inflow river water quality under land use effect. J. Agro-Environ. Sci. 2020, 39, 160–170. [Google Scholar]
- Gao, X.; Li, W.; Zhang, C.; Zhao, S. Impact of inflowing rivers on water quality of Nansi Lake. Water Resour. Prot. 2013, 29, 1–5. [Google Scholar]
- Shao, Z. Analysis of Pollution Characteristics and Countermeasures of Nanyang Lake and Its Main Inflow Rivers. Tai Shandong Agric. Univ. 2020. (In Chinese) [Google Scholar] [CrossRef]
- Yu, M.; Cai, Y.; Liu, H.; Gong, L.; Leng, X.; An, S. Impact of Land Use on Water Quality Along Inflow Rivers in Taihu Basin. J. Agro-Environ. Sci. 2014, 33, 1024–1032. [Google Scholar]
- Alam Imteaz, M.; Asaeda, T.; Lockington, D.A. Modelling the Effects of Inflow Parameters on Lake Water Quality. Environ. Model. Assess. 2003, 8, 63–70. [Google Scholar] [CrossRef]
- Rostami, S.; He, J.; Hassan, Q.K. Riverine Water Quality Response to Precipitation and Its Change. Environments 2018, 5, 8. [Google Scholar] [CrossRef]
- Zhang, Y.; Zhang, Y.; Wei, L.; Li, M.; Zhu, W.; Zhu, L. Spatiotemporal correlations between water quality and microbial community of typical inflow river into Taihu Lake, China. Environ. Sci. Pollut. 2022, 29, 63722–63734. [Google Scholar] [CrossRef]
- Jia, Z.; Chang, X.; Duan, T.; Wang, X.; Wei, T.; Li, Y. Water quality responses to rainfall and surrounding land uses in urban lakes. J. Environ. Manag. 2021, 298, 113514. [Google Scholar] [CrossRef]
- Shi, Y.; Wu, X.; Ge, X.; Zhou, M.; Wu, C.; Qin, Y.; Tan, Y. A Study on Eutrophication and Balance of Nitrogen and Phosphorus in Urban Lakes-Taking No.1 Area of Qingshan Lake in Huangshi City, Hubei Province as a case. Bull. Soil Water Conserv. 2020, 40, 208–215. [Google Scholar]
- Wang, W. Analysis of the Impact of Atmospheric Precipitation on River Water Quality in Jinzhou City. Water Resour. Plan. Des. 2016, 12, 53–55. [Google Scholar]
- Coffey, R.; Paul, M.J.; Stamp, J.; Hamilton, A.; Johnson, T. A Review of Water Quality Responses to Air Temperature and Precipitation Changes 2: Nutrients, Algal Blooms, Sediment, Pathogens. JAWRA J. Am. Water Resour. Assoc. 2018, 55, 844–868. [Google Scholar] [CrossRef]
- Zhang, C.; Lu, J.; Tian, Y. Influence of Environmental Factors on Water Quality in Different Precipitation Years. Adm. Tech. Environ. Monit. 2024, 36, 23–29. (In Chinese) [Google Scholar]
- Feng, B.; Wang, G.; Yang, W. Investigation and Analysis of on the Pollution Sources of Nanjing Xuanwu Lake. J. Anhui Agri. Sci. 2007, 28, 8963–8964+8973. (In Chinese) [Google Scholar]
| Trophic Level | Evaluation Criteria: TLI(∑) | Qualitative Evaluation |
|---|---|---|
| Oligotrophication | TLI(∑) < 30 | Great |
| Mesotrophication | 30 ≤ TLI(∑) ≤ 50 | Good |
| Eutrophication | TLI(∑) > 50 | Polluted |
| Mild eutrophication | 50 < TLI(∑) ≤ 60 | Mildly polluted |
| Moderate eutrophication | 60 < TLI(∑) ≤ 70 | Moderately polluted |
| Heavy eutrophication | TLI(∑) > 70 | Heavily polluted |
| Years | Lake | Seasons | CODMn | NH3-N | TP | TN |
|---|---|---|---|---|---|---|
| 2018 | Daye Lake | Spring | 0.1179 | 0.2043 | 0.2603 | 0.4175 |
| Summer | 0.1762 | 0.1021 | 0.3978 | 0.3239 | ||
| Autumn | 0.1394 | 0.0870 | 0.4526 | 0.3209 | ||
| Winter | 0.0810 | 0.1358 | 0.3256 | 0.4576 | ||
| Cihu Lake | Spring | 0.1857 | 0.1452 | 0.3279 | 0.3412 | |
| Summer | 0.1914 | 0.1078 | 0.3860 | 0.3149 | ||
| Autumn | 0.1520 | 0.0966 | 0.4421 | 0.3093 | ||
| Winter | 0.1149 | 0.1279 | 0.3190 | 0.4382 | ||
| Baoan Lake | Spring | 0.1834 | 0.1655 | 0.3247 | 0.3263 | |
| Summer | 0.2027 | 0.1216 | 0.3558 | 0.3199 | ||
| Autumn | 0.2024 | 0.1175 | 0.4010 | 0.2791 | ||
| Winter | 0.1363 | 0.1413 | 0.2945 | 0.4279 | ||
| Xiandao Lake | Spring | 0.1547 | 0.1425 | 0.2675 | 0.4353 | |
| Summer | 0.1903 | 0.0788 | 0.1959 | 0.5351 | ||
| Autumn | 0.2275 | 0.0783 | 0.2650 | 0.4292 | ||
| Winter | 0.1461 | 0.0702 | 0.3492 | 0.4345 | ||
| 2019 | Daye Lake | Spring | 0.0771 | 0.1668 | 0.3689 | 0.3872 |
| Summer | 0.1291 | 0.0887 | 0.3373 | 0.445 | ||
| Autumn | 0.1209 | 0.1285 | 0.4659 | 0.2846 | ||
| Winter | 0.099 | 0.1362 | 0.3323 | 0.4326 | ||
| Cihu Lake | Spring | 0.1369 | 0.1134 | 0.3474 | 0.4024 | |
| Summer | 0.1316 | 0.0948 | 0.4081 | 0.3655 | ||
| Autumn | 0.1411 | 0.1043 | 0.4779 | 0.2766 | ||
| Winter | 0.157 | 0.1002 | 0.3334 | 0.4094 | ||
| Baoan Lake | Spring | 0.1536 | 0.1395 | 0.246 | 0.461 | |
| Summer | 0.1936 | 0.1628 | 0.3514 | 0.2922 | ||
| Autumn | 0.2105 | 0.1335 | 0.3486 | 0.3074 | ||
| Winter | 0.1683 | 0.1764 | 0.2766 | 0.3787 | ||
| Xiandao Lake | Spring | 0.1695 | 0.1309 | 0.2036 | 0.4959 | |
| Summer | 0.1981 | 0.2028 | 0.136 | 0.4631 | ||
| Autumn | 0.1458 | 0.1375 | 0.2581 | 0.4586 | ||
| Winter | 0.1713 | 0.1547 | 0.2225 | 0.4514 |
| Years | Lake | CODMn | NH3-N | TP | TN |
|---|---|---|---|---|---|
| 2018 | Daye Lake | 0.1231 | 0.1339 | 0.3546 | 0.3885 |
| Cihu Lake | 0.1567 | 0.1181 | 0.3706 | 0.3546 | |
| Baoan Lake | 0.1804 | 0.1373 | 0.3425 | 0.3398 | |
| Xiandao Lake | 0.1796 | 0.0938 | 0.2725 | 0.4540 | |
| 2019 | Daye Lake | 0.1037 | 0.1342 | 0.3781 | 0.384 |
| Cihu Lake | 0.1413 | 0.103 | 0.3985 | 0.3571 | |
| Baoan Lake | 0.181 | 0.1528 | 0.3042 | 0.362 | |
| Xiandao Lake | 0.1733 | 0.1582 | 0.2041 | 0.4644 |
| Years | Seasons | Lake | I | II | III | IV | V | Fuzzy Composite Valuation | Evaluation Results |
|---|---|---|---|---|---|---|---|---|---|
| 2018 | Spring | Daye Lake | 0.0275 | 0.1508 | 0.2419 | 0.3640 | 0.2157 | 0.3640 | IV |
| Cihu Lake | 0.0724 | 0.2941 | 0.5191 | 0.1144 | 0.0000 | 0.5190 | III | ||
| Baoan Lake | 0.0291 | 0.3525 | 0.4885 | 0.1299 | 0.0000 | 0.4885 | III | ||
| Xiandao Lake | 0.0000 | 0.6174 | 0.1027 | 0.0000 | 0.0000 | 0.6174 | II | ||
| Summer | Daye Lake | 0.0100 | 0.0486 | 0.0657 | 0.1201 | 0.0057 | 0.1200 | IV | |
| Cihu Lake | 0.0141 | 0.0695 | 0.0989 | 0.0675 | 0.0000 | 0.0988 | III | ||
| Baoan Lake | 0.0794 | 0.3408 | 0.4374 | 0.1423 | 0.0000 | 0.4373 | III | ||
| Xiandao Lake | 0.3996 | 0.5433 | 0.0571 | 0.0000 | 0.0000 | 0.5432 | II | ||
| Autumn | Daye Lake | 0.0090 | 0.0460 | 0.0298 | 0.1219 | 0.0434 | 0.1218 | IV | |
| Cihu Lake | 0.0090 | 0.0497 | 0.0505 | 0.1115 | 0.0294 | 0.1114 | IV | ||
| Baoan Lake | 0.0833 | 0.3823 | 0.3049 | 0.2294 | 0.0000 | 0.3823 | II | ||
| Xiandao Lake | 0.2830 | 0.6278 | 0.0892 | 0.0000 | 0.0000 | 0.6277 | II | ||
| Winter | Daye Lake | 0.0078 | 0.0291 | 0.0173 | 0.0526 | 0.1432 | 0.1431 | V | |
| Cihu Lake | 0.0110 | 0.0497 | 0.0105 | 0.1278 | 0.0509 | 0.1278 | IV | ||
| Baoan Lake | 0.1527 | 0.1249 | 0.4510 | 0.2714 | 0.0000 | 0.4509 | III | ||
| Xiandao Lake | 0.2163 | 0.6436 | 0.1401 | 0.0000 | 0.0000 | 0.6435 | II | ||
| 2019 | Spring | Daye Lake | 0.0178 | 0.0593 | 0.1449 | 0.1097 | 0.6683 | 0.6683 | V |
| Cihu Lake | 0.0619 | 0.1883 | 0.0785 | 0.6713 | 0.0000 | 0.6713 | IV | ||
| Baoan Lake | 0.0994 | 0.1937 | 0.3679 | 0.3391 | 0.0000 | 0.3679 | III | ||
| Xiandao Lake | 0.4472 | 0.5528 | 0.0000 | 0.0000 | 0.0600 | 0.5528 | II | ||
| Summer | Daye Lake | 0.0429 | 0.1748 | 0.0000 | 0.1187 | 0.6636 | 0.6636 | V | |
| Cihu Lake | 0.0117 | 0.0448 | 0.0043 | 0.1666 | 0.0225 | 0.1666 | IV | ||
| Baoan Lake | 0.0771 | 0.4189 | 0.3791 | 0.1250 | 0.0000 | 0.4189 | II | ||
| Xiandao Lake | 0.4394 | 0.4556 | 0.1050 | 0.0000 | 0.0000 | 0.4556 | II | ||
| Autumn | Daye Lake | 0.0000 | 0.1823 | 0.0844 | 0.3694 | 0.3639 | 0.3694 | IV | |
| Cihu Lake | 0.0002 | 0.0464 | 0.0379 | 0.0813 | 0.0842 | 0.0842 | V | ||
| Baoan Lake | 0.0000 | 0.2615 | 0.5284 | 0.2101 | 0.0000 | 0.5284 | III | ||
| Xiandao Lake | 0.3056 | 0.6394 | 0.0550 | 0.0000 | 0.0000 | 0.6394 | II | ||
| Winter | Daye Lake | 0.0291 | 0.1643 | 0.0417 | 0.2686 | 0.4962 | 0.4962 | V | |
| Cihu Lake | 0.0101 | 0.0535 | 0.0230 | 0.1634 | 0.0000 | 0.1634 | IV | ||
| Baoan Lake | 0.0479 | 0.2047 | 0.6353 | 0.1121 | 0.0000 | 0.6353 | III | ||
| Xiandao Lake | 0.5127 | 0.4873 | 0.0000 | 0.0000 | 0.0000 | 0.5127 | I |
| Years | Lake | I | II | III | IV | V | Fuzzy Composite Valuation | Evaluation Results |
|---|---|---|---|---|---|---|---|---|
| 2018 | Daye Lake | 0.0098 | 0.2253 | 0.0218 | 0.5312 | 0.2118 | 0.5312 | IV |
| Cihu Lake | 0.0517 | 0.2231 | 0.2616 | 0.4636 | 0.0000 | 0.4636 | IV | |
| Baoan Lake | 0.0881 | 0.2688 | 0.5039 | 0.1392 | 0.0000 | 0.5039 | III | |
| Xiandao Lake | 0.2735 | 0.6617 | 0.0000 | 0.0000 | 0.0000 | 0.6617 | II | |
| 2019 | Daye Lake | 0.0098 | 0.1782 | 0.0499 | 0.2232 | 0.5389 | 0.5389 | V |
| Cihu Lake | 0.0263 | 0.2147 | 0.0482 | 0.6360 | 0.0748 | 0.6360 | IV | |
| Baoan Lake | 0.0672 | 0.2666 | 0.5729 | 0.0933 | 0.0000 | 0.5729 | III | |
| Xiandao Lake | 0.4521 | 0.5479 | 0.0000 | 0.0000 | 0.0000 | 0.5479 | II |
| Years | Seasons | Lake | TLI(Chl-a) | TLI(TP) | TLI(TN) | TLI(SD) | TLI(CODMn) | TLI(∑) | Nutrient Level |
|---|---|---|---|---|---|---|---|---|---|
| 2018 | Spring | Daye Lake | 65.3677 | 53.5773 | 64.0934 | 67.7040 | 34.6783 | 57.7239 | Mild eutrophication |
| Cihu Lake | 70.3615 | 50.5696 | 53.6244 | 66.9606 | 35.6841 | 56.6623 | Mild eutrophication | ||
| Baoan Lake | 54.6741 | 51.1736 | 53.6641 | 65.1514 | 36.6144 | 52.4448 | Mild eutrophication | ||
| Xiandao Lake | 38.9411 | 35.7024 | 45.6903 | 35.3048 | 11.8794 | 33.9102 | Mesotrophication | ||
| Summer | Daye Lake | 70.5624 | 57.8685 | 57.0820 | 63.4010 | 41.1135 | 59.0490 | Mild eutrophication | |
| Cihu Lake | 68.2577 | 54.3267 | 53.4218 | 64.7135 | 38.3099 | 56.8412 | Mild eutrophication | ||
| Baoan Lake | 69.0128 | 51.1736 | 51.7799 | 65.0190 | 36.8468 | 55.9436 | Mild eutrophication | ||
| Xiandao Lake | 42.0578 | 26.1568 | 44.5080 | 33.1470 | 10.0435 | 32.0025 | Mesotrophication | ||
| Autumn | Daye Lake | 73.6151 | 62.2358 | 59.2959 | 65.7294 | 38.6054 | 61.0457 | Moderate eutrophication | |
| Cihu Lake | 72.6774 | 60.7943 | 57.5661 | 70.1006 | 39.1718 | 61.1212 | Moderate eutrophication | ||
| Baoan Lake | 66.3871 | 53.0555 | 49.4048 | 61.5480 | 36.7076 | 54.5106 | Mild eutrophication | ||
| Xiandao Lake | 50.1141 | 35.5007 | 45.4024 | 31.5549 | 22.0709 | 37.9772 | Mesotrophication | ||
| Winter | Daye Lake | 60.0450 | 61.8798 | 70.5154 | 65.8734 | 32.3172 | 58.2473 | Mild eutrophication | |
| Cihu Lake | 67.4614 | 55.8552 | 63.8426 | 66.8334 | 32.3058 | 58.0696 | Mild eutrophication | ||
| Baoan Lake | 61.0107 | 49.3764 | 58.0398 | 67.1954 | 28.3612 | 53.4388 | Mild eutrophication | ||
| Xiandao Lake | 47.6549 | 38.6299 | 44.1991 | 26.1511 | 8.0715 | 34.1359 | Mesotrophication | ||
| 2019 | Spring | Daye Lake | 61.4704 | 66.0173 | 69.5888 | 63.1454 | 34.6926 | 59.1736 | Mild eutrophication |
| Cihu Lake | 71.4597 | 55.8456 | 60.9437 | 63.8662 | 34.6783 | 58.5042 | Mild eutrophication | ||
| Baoan Lake | 58.963 | 46.7574 | 59.6168 | 57.643 | 32.0414 | 51.6068 | Mild eutrophication | ||
| Xiandao Lake | 37.8224 | 26.1568 | 42.5637 | 23.8859 | 5.9416 | 28.0757 | Oligotrophication | ||
| Summer | Daye Lake | 68.1986 | 57.7215 | 65.1062 | 63.549 | 36.9787 | 59.0974 | Mild eutrophication | |
| Cihu Lake | 73.5524 | 60.2064 | 61.136 | 67.4967 | 36.4974 | 60.9147 | Moderate eutrophication | ||
| Baoan Lake | 62.8014 | 50.6497 | 49.9088 | 62.7389 | 35.0934 | 53.1166 | Mild eutrophication | ||
| Xiandao Lake | 45.5428 | 24.244 | 46.2519 | 25.213 | 17.6987 | 32.8322 | Mesotrophication | ||
| Autumn | Daye Lake | 69.9426 | 66.3389 | 61.0539 | 66.1845 | 40.7734 | 61.6346 | Moderate eutrophication | |
| Cihu Lake | 76.0754 | 65.6288 | 59.4003 | 66.025 | 43.0412 | 63.2248 | Moderate eutrophication | ||
| Baoan Lake | 73.9051 | 51.9291 | 52.2387 | 66.2447 | 39.6273 | 58.2051 | Mild eutrophication | ||
| Xiandao Lake | 33.3634 | 33.3322 | 44.7109 | 26.8764 | 7.3803 | 29.4333 | Oligotrophication | ||
| Winter | Daye Lake | 64.2218 | 59.8105 | 67.063 | 63.6893 | 33.744 | 58.2137 | Mild eutrophication | |
| Cihu Lake | 67.87 | 55.1039 | 61.1647 | 63.525 | 38.2198 | 58.0357 | Mild eutrophication | ||
| Baoan Lake | 60.3453 | 48.3053 | 55.9098 | 63.2943 | 33.897 | 52.9789 | Mild eutrophication | ||
| Xiandao Lake | 37.6318 | 27.8678 | 41.2554 | 34.4672 | 6.6707 | 30.1868 | Mesotrophication |
| Years | Lake | TLI(Chl-a) | TLI(TP) | TLI(TN) | TLI(SD) | TLI(CODMn) | TLI(∑) | Nutrient Level |
|---|---|---|---|---|---|---|---|---|
| 2018 | Daye Lake | 68.5522 | 59.2551 | 63.5574 | 65.6165 | 36.8963 | 59.5664 | Mild eutrophication |
| Cihu Lake | 69.8820 | 55.8056 | 57.6669 | 67.0581 | 36.4999 | 58.4096 | Mild eutrophication | |
| Baoan Lake | 64.0420 | 51.2469 | 53.5244 | 64.6206 | 34.8659 | 54.5098 | Mild eutrophication | |
| Xiandao Lake | 45.5646 | 34.6142 | 44.9611 | 31.2343 | 13.5968 | 34.9072 | Mesotrophication | |
| 2019 | Daye Lake | 66.4521 | 62.9048 | 65.9835 | 64.106 | 36.6876 | 59.812 | Mild eutrophication |
| Cihu Lake | 72.6435 | 59.7589 | 60.6768 | 65.1609 | 38.2952 | 60.4077 | Moderate eutrophication | |
| Baoan Lake | 65.8161 | 49.534 | 54.8232 | 62.2274 | 35.3149 | 54.5363 | Mild eutrophication | |
| Xiandao Lake | 39.5314 | 28.4479 | 43.8048 | 27.2375 | 10.2158 | 30.5821 | Mesotrophication |
| Physical and Chemical Indicators | PC1 | PC2 |
|---|---|---|
| TP | 0.871 | 0.114 |
| CODMn | 0.848 | −0.391 |
| SD | −0.802 | 0.233 |
| Chl-a | 0.718 | −0.563 |
| TN | 0.714 | 0.554 |
| NH3-N | 0.68 | 0.627 |
| Eigenvalue | 3.609 | 1.237 |
| Variance contribution | 60.148 | 20.614 |
| cumulative | 60.148% | 80.761% |
Disclaimer/Publisher’s Note: The statements, opinions and data contained in all publications are solely those of the individual author(s) and contributor(s) and not of MDPI and/or the editor(s). MDPI and/or the editor(s) disclaim responsibility for any injury to people or property resulting from any ideas, methods, instructions or products referred to in the content. |
© 2024 by the authors. Licensee MDPI, Basel, Switzerland. This article is an open access article distributed under the terms and conditions of the Creative Commons Attribution (CC BY) license (https://creativecommons.org/licenses/by/4.0/).
Share and Cite
Leng, M.; Wu, X.; Ge, X.; Yang, X.; Huang, Z.; Liu, H.; Zhu, J.; Li, J.; Gong, M.; Sun, Z.; et al. Evaluation of Water Quality and Eutrophication of Typical Lakes in Southeast Hubei, China. Sustainability 2024, 16, 8964. https://doi.org/10.3390/su16208964
Leng M, Wu X, Ge X, Yang X, Huang Z, Liu H, Zhu J, Li J, Gong M, Sun Z, et al. Evaluation of Water Quality and Eutrophication of Typical Lakes in Southeast Hubei, China. Sustainability. 2024; 16(20):8964. https://doi.org/10.3390/su16208964
Chicago/Turabian StyleLeng, Mingkai, Xiaodong Wu, Xuguang Ge, Xiaoqing Yang, Zhi Huang, Haoran Liu, Jiali Zhu, Jinge Li, Mengting Gong, Zhepeng Sun, and et al. 2024. "Evaluation of Water Quality and Eutrophication of Typical Lakes in Southeast Hubei, China" Sustainability 16, no. 20: 8964. https://doi.org/10.3390/su16208964
APA StyleLeng, M., Wu, X., Ge, X., Yang, X., Huang, Z., Liu, H., Zhu, J., Li, J., Gong, M., Sun, Z., & Li, Z. (2024). Evaluation of Water Quality and Eutrophication of Typical Lakes in Southeast Hubei, China. Sustainability, 16(20), 8964. https://doi.org/10.3390/su16208964


