
Evaluation and Analysis of Passive Energy Saving Renovation Measures for Rural Residential Buildings in Cold Regions: A Case Study in Tongchuan, China

Abstract
1. Introduction
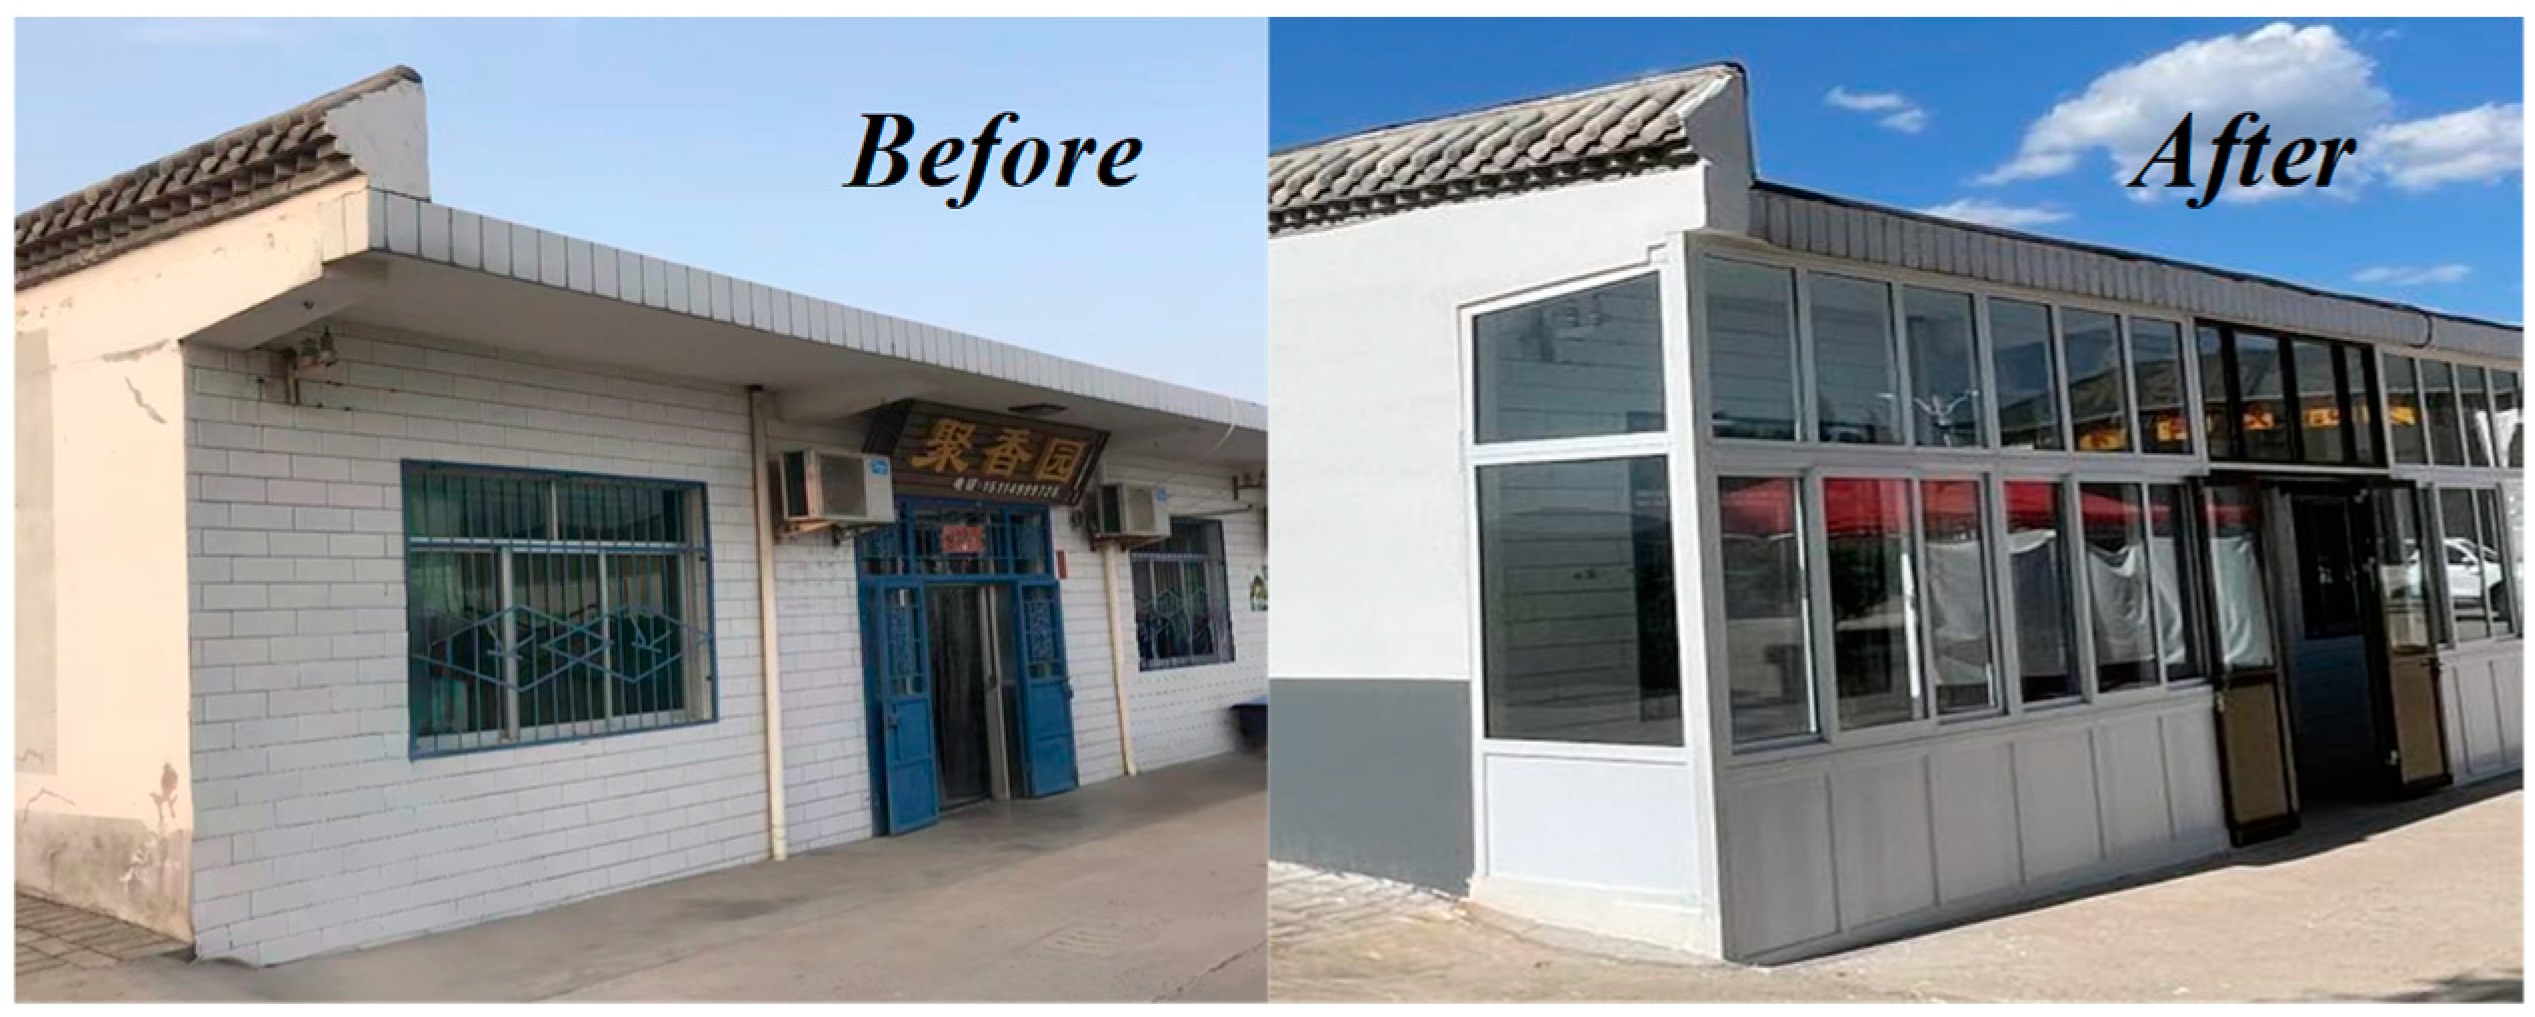
2. Case Study
2.1. Location and Climate
2.2. Enclosure Structure
2.3. Strategy Selection and Parameters
3. Method
3.1. Life Cycle Assessment Calculation
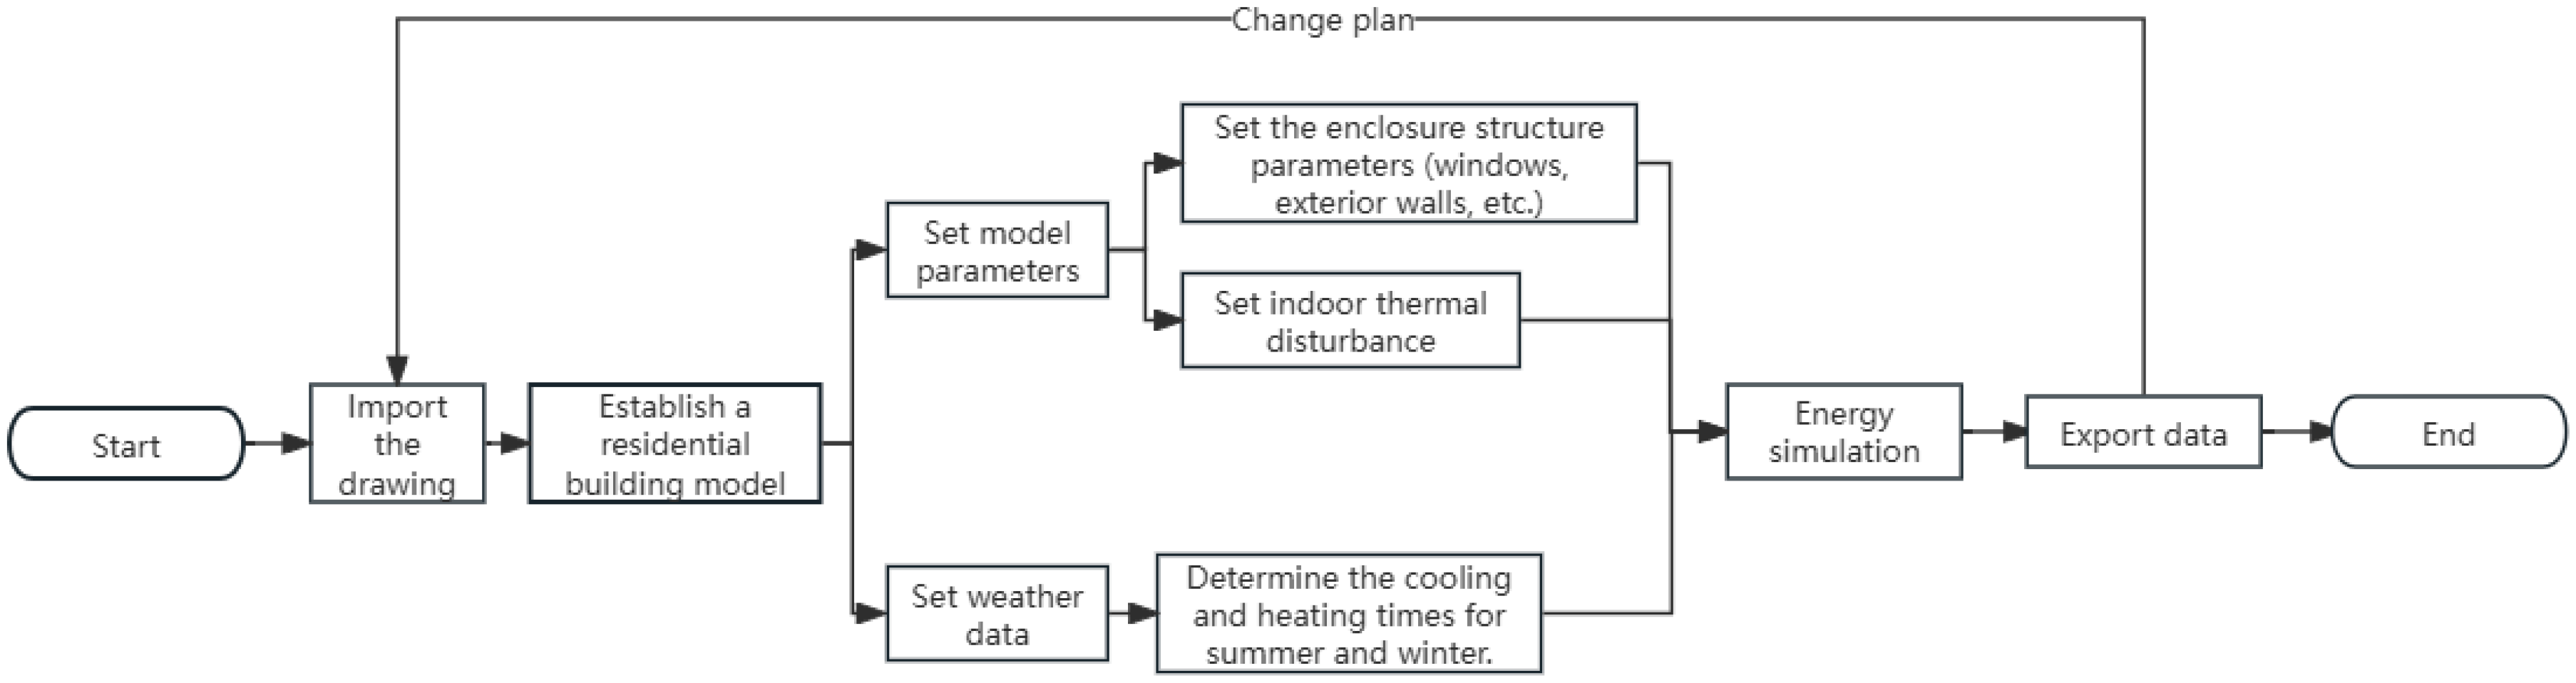
3.2. Indoor Thermal Environment Simulation
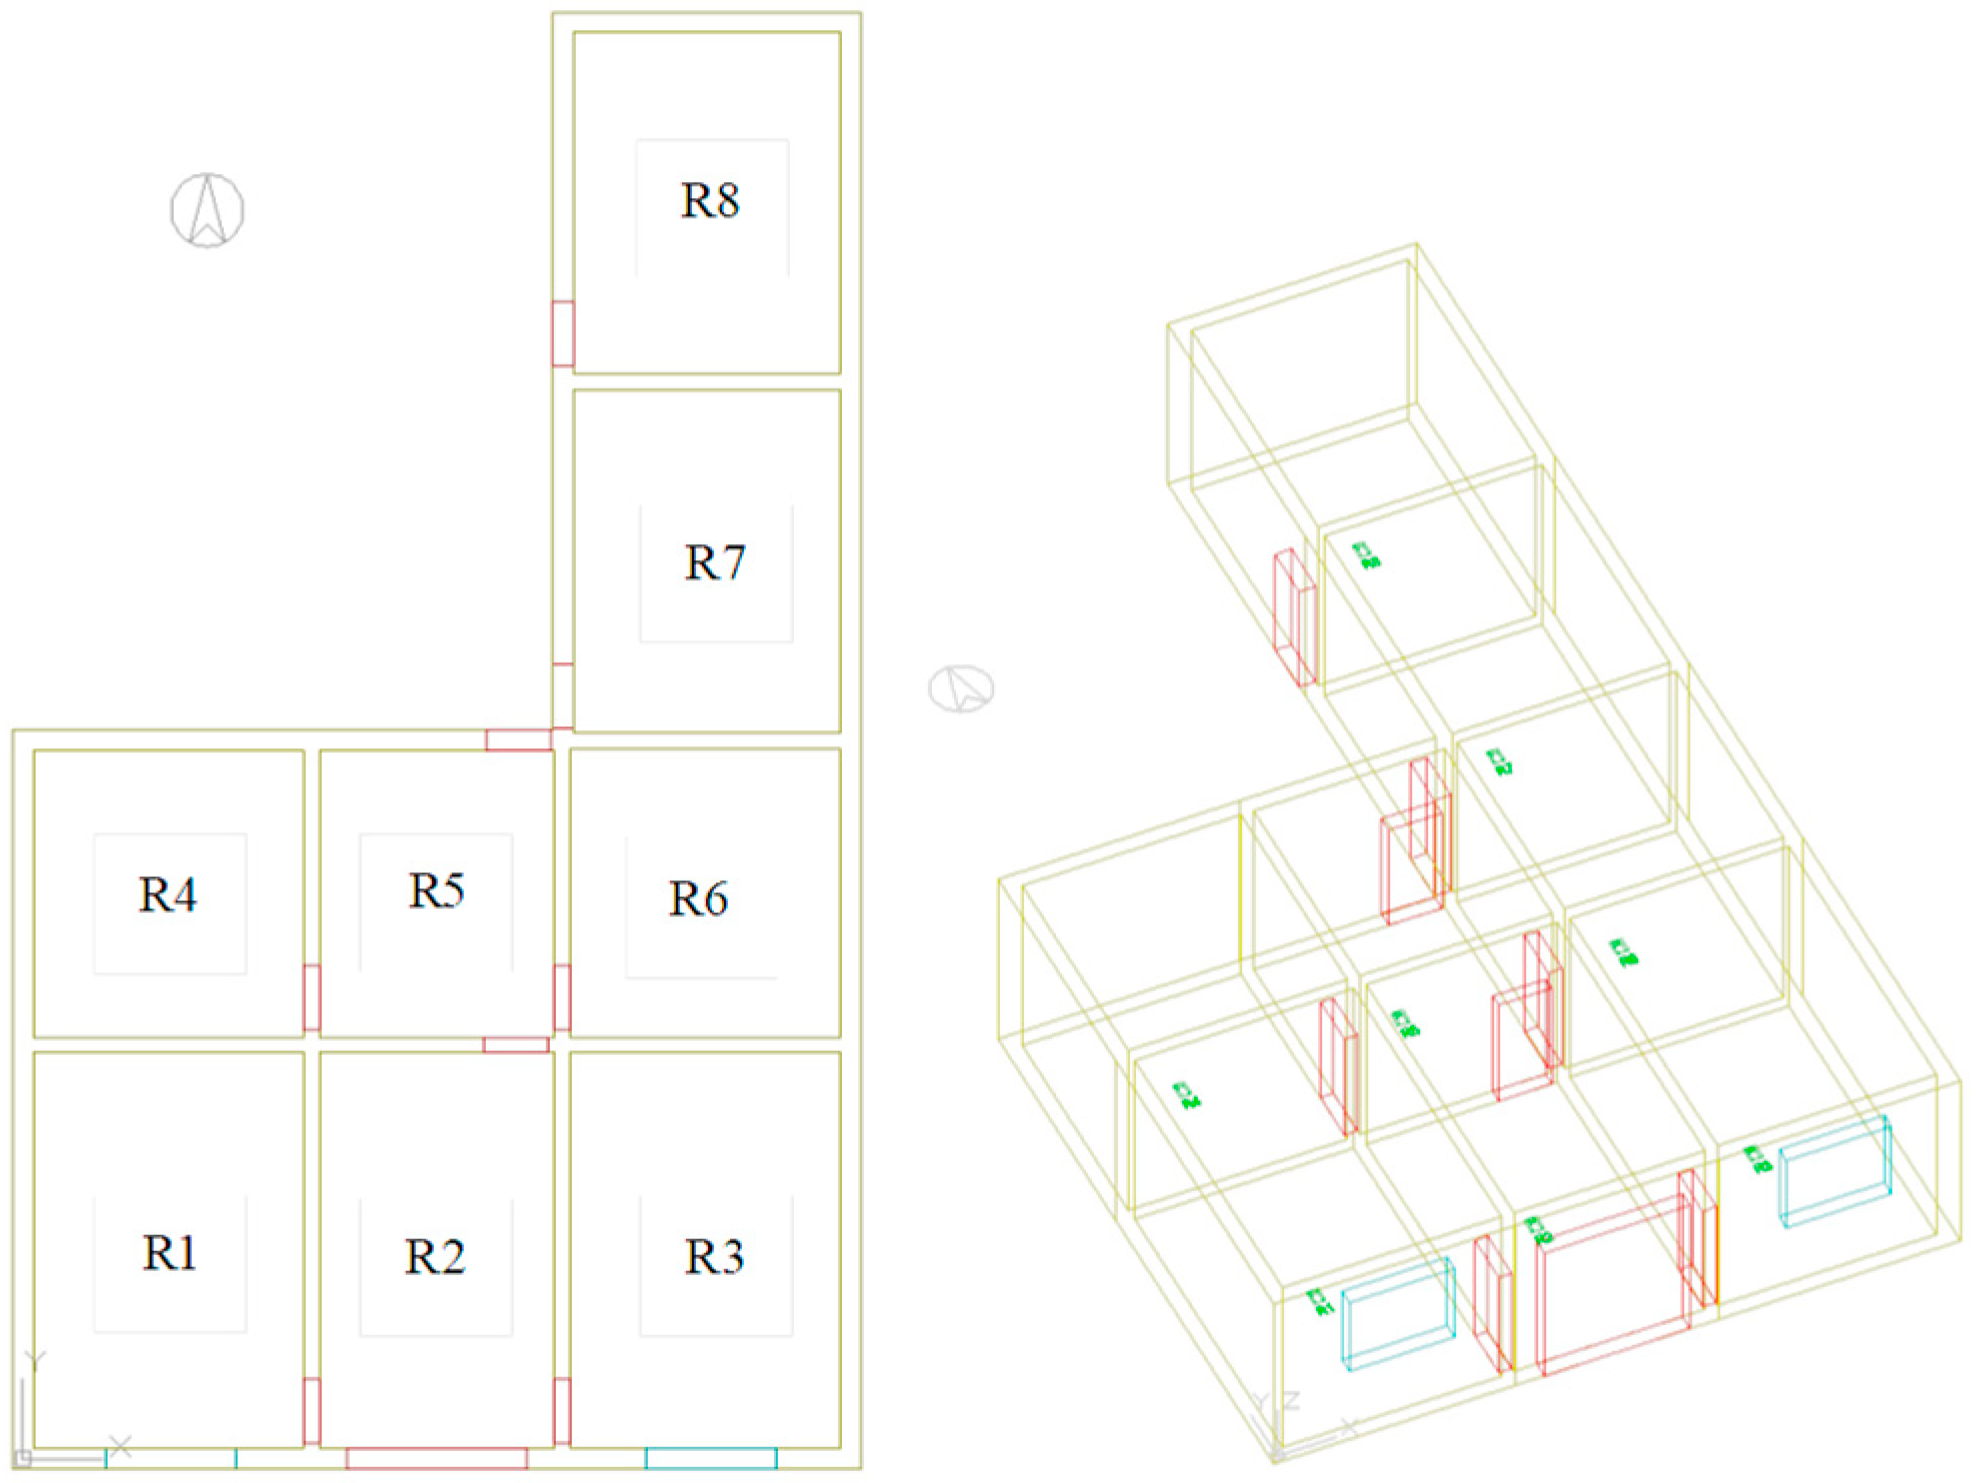
- Model: Figure 6.
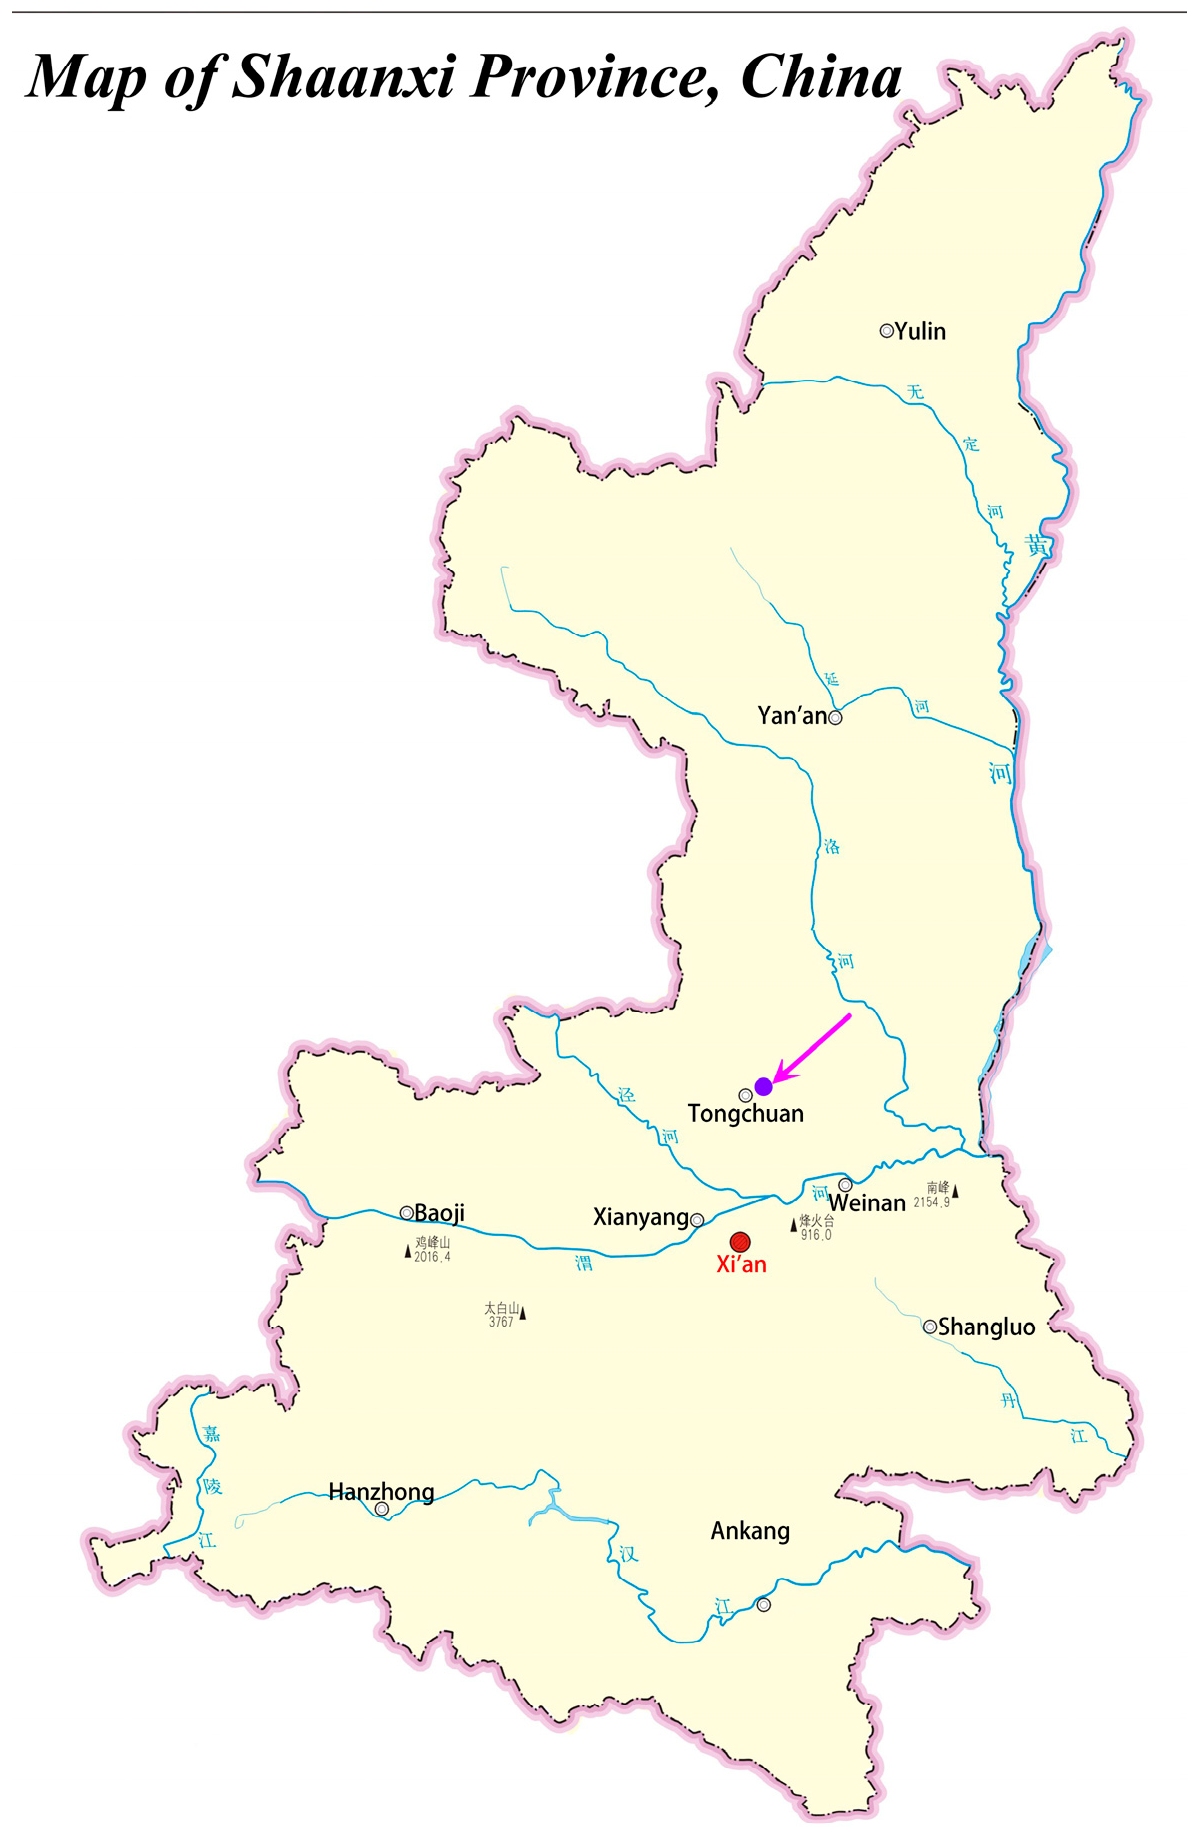
- Meteorological data: Typical meteorological data from Xi’an are selected. (Xi’an and Tongchuan are both located in cold regions with similar latitudes and a straight-line distance difference of less than 90 km, Figure 2. They have extremely similar annual temperature changes, so it is feasible to choose Xi’an as a substitute without typical temperature data from Tongchuan.)
- Indoor temperature: 14 °C in winter.
- Indoor ventilation: The ventilation rate in winter is 0.5 h−1.
- Thermal disturbance of personnel, lighting, and equipment in each room: 1.
- Heating period: November 15 to March 15.
- Cooling period: June 1 to August 31.
3.3. Economic Benefits
3.4. Carbon Economy
3.5. Carbon Emission Payback Period
3.6. Orthogonal Experiment and Range Analysis
4. Results
4.1. Implied Carbon Emissions and Energy Performance of Special Renovation Measures
- 1.
- The carbon emissions from building materials during the cradle-to-gate phase account for over 40% of the total embodied carbon emissions in energy-saving renovations. This underscores the importance of prioritizing low-carbon production methods for building materials in all aspects of energy-saving renovation projects.
- 2.
- The proportions of carbon emissions from transportation, construction, and demolition are relatively low, not exceeding 2%, 5%, and 0.11%, respectively. This can be attributed to the simplicity of the construction process involved in rural residential building energy-saving renovations, which typically require minimal use of heavy machinery. Consequently, this emphasizes the necessity of pursuing more low-carbon building materials in future renovation efforts.
- 3.
- During the operational phase, carbon emissions generated from replacing materials at the end of their service life constitute more than 50% of the materialization phase’s emissions. Specifically, maintenance-related replacement emissions include those from demolition, cradle-to-gate emissions of new building materials, transportation, and construction, collectively representing a significant portion of overall emissions. These findings further reinforce the conclusions drawn from points 1 and 2.
- 1.
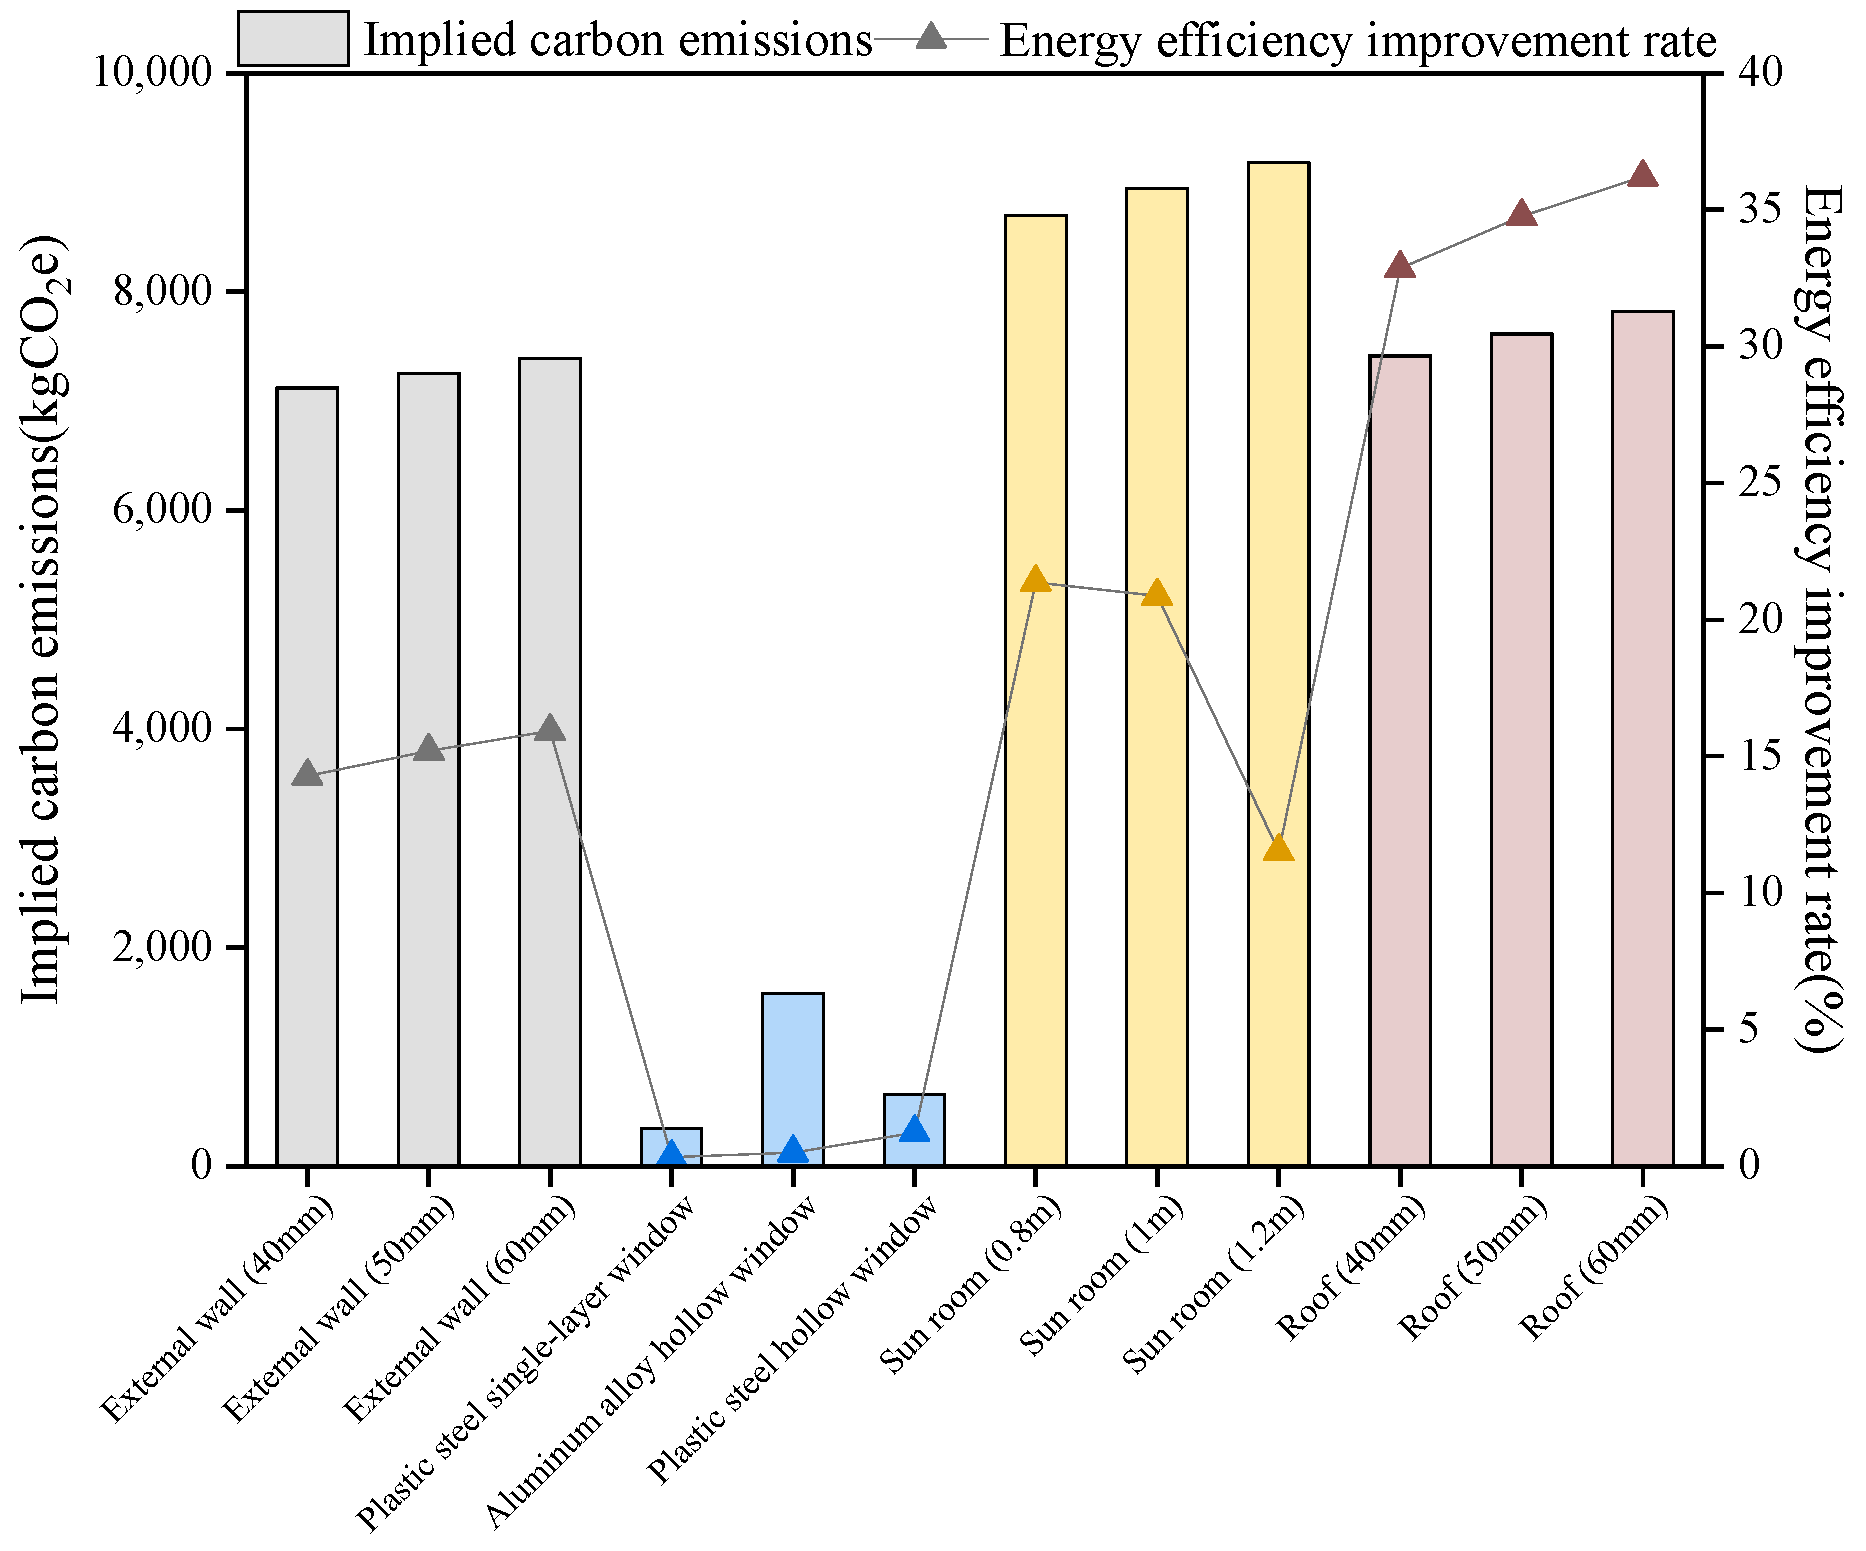
- Among individual renovation measures, the order of implied carbon emission intensity is as follows: sunroom, roof, gable, then external window. Notably, the carbon emissions associated with external windows are significantly lower than those of other measures. Conversely, the ranking of energy performance is as follows: roof, sunroom, gable, then external window. The energy performance of external windows is also significantly lower than that of other measures.
- 2.
- From an energy performance perspective, to meet the requirements for improving building energy efficiency, roof renovation, adding a sunroom, and exterior wall renovation are identified as the most critical components of rural residential building renovations. These measures represent the core focus areas for energy-saving renovations in rural homes.
- 3.
- It is noteworthy that sunrooms not only enhance building energy efficiency but also provide additional usable space, akin to the balcony function in urban residential buildings. This feature plays a positive role in increasing residents’ satisfaction and represents a meaningful renovation measure.
- 4.
- Among the four specific renovation measures, the highest energy efficiency improvement rate did not exceed 40%, failing to meet the renovation requirements. Therefore, relying solely on one measure for the energy-saving renovation of rural houses is deemed unreasonable.
4.2. Carbon Emissions and Energy Performance During the Life Cycle of Combination Schemes
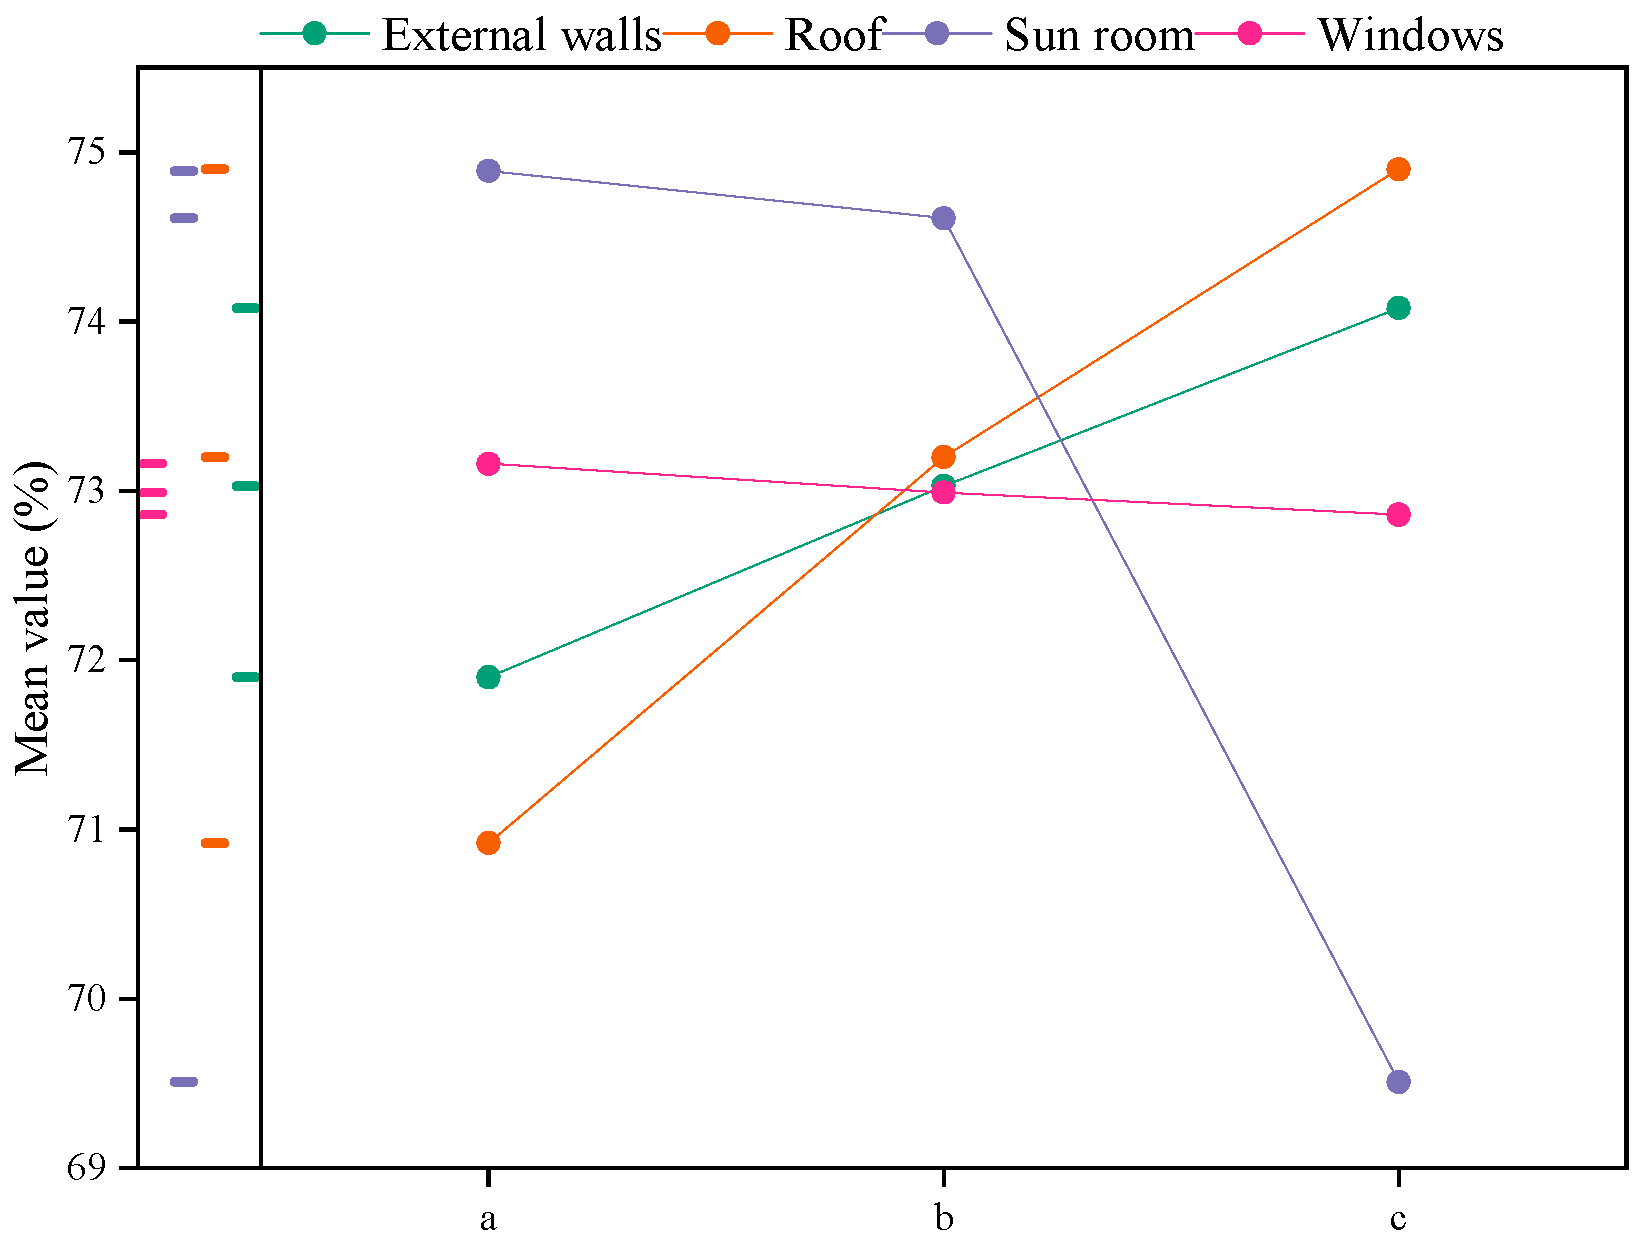
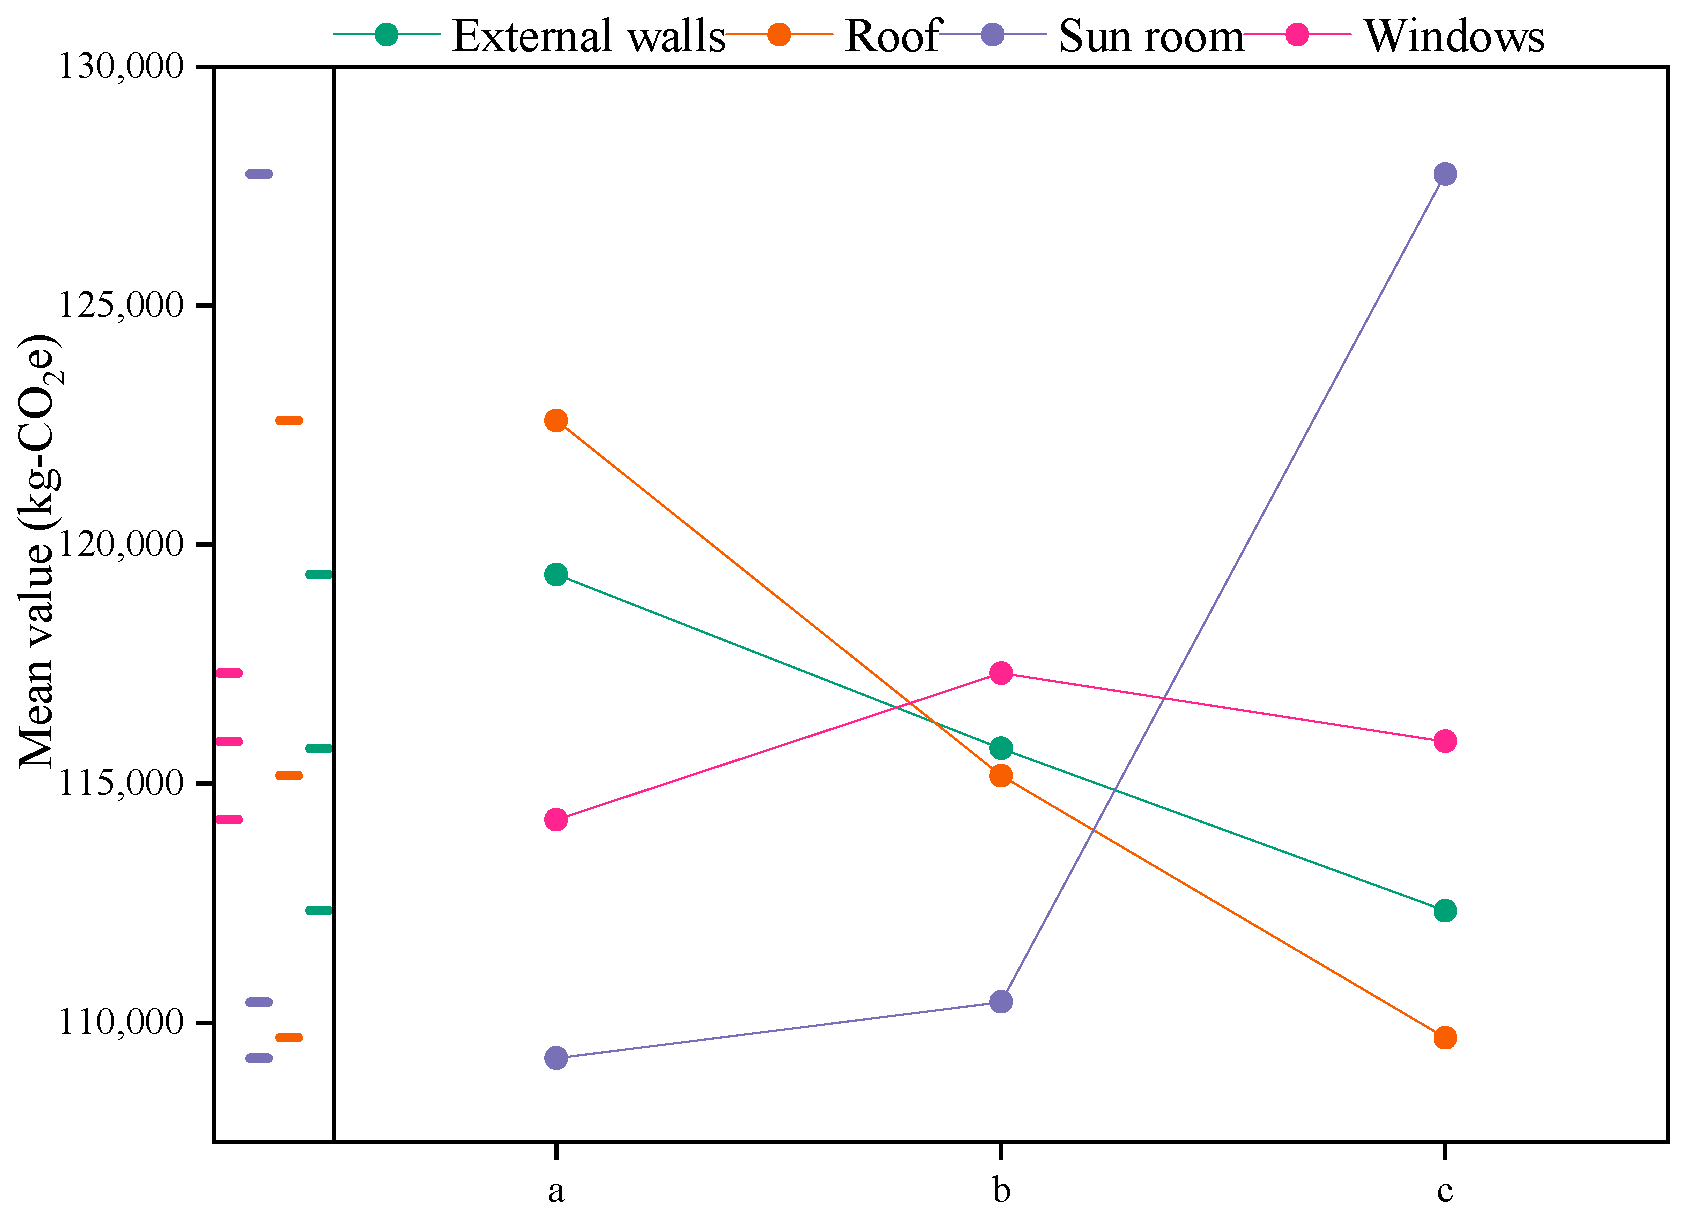
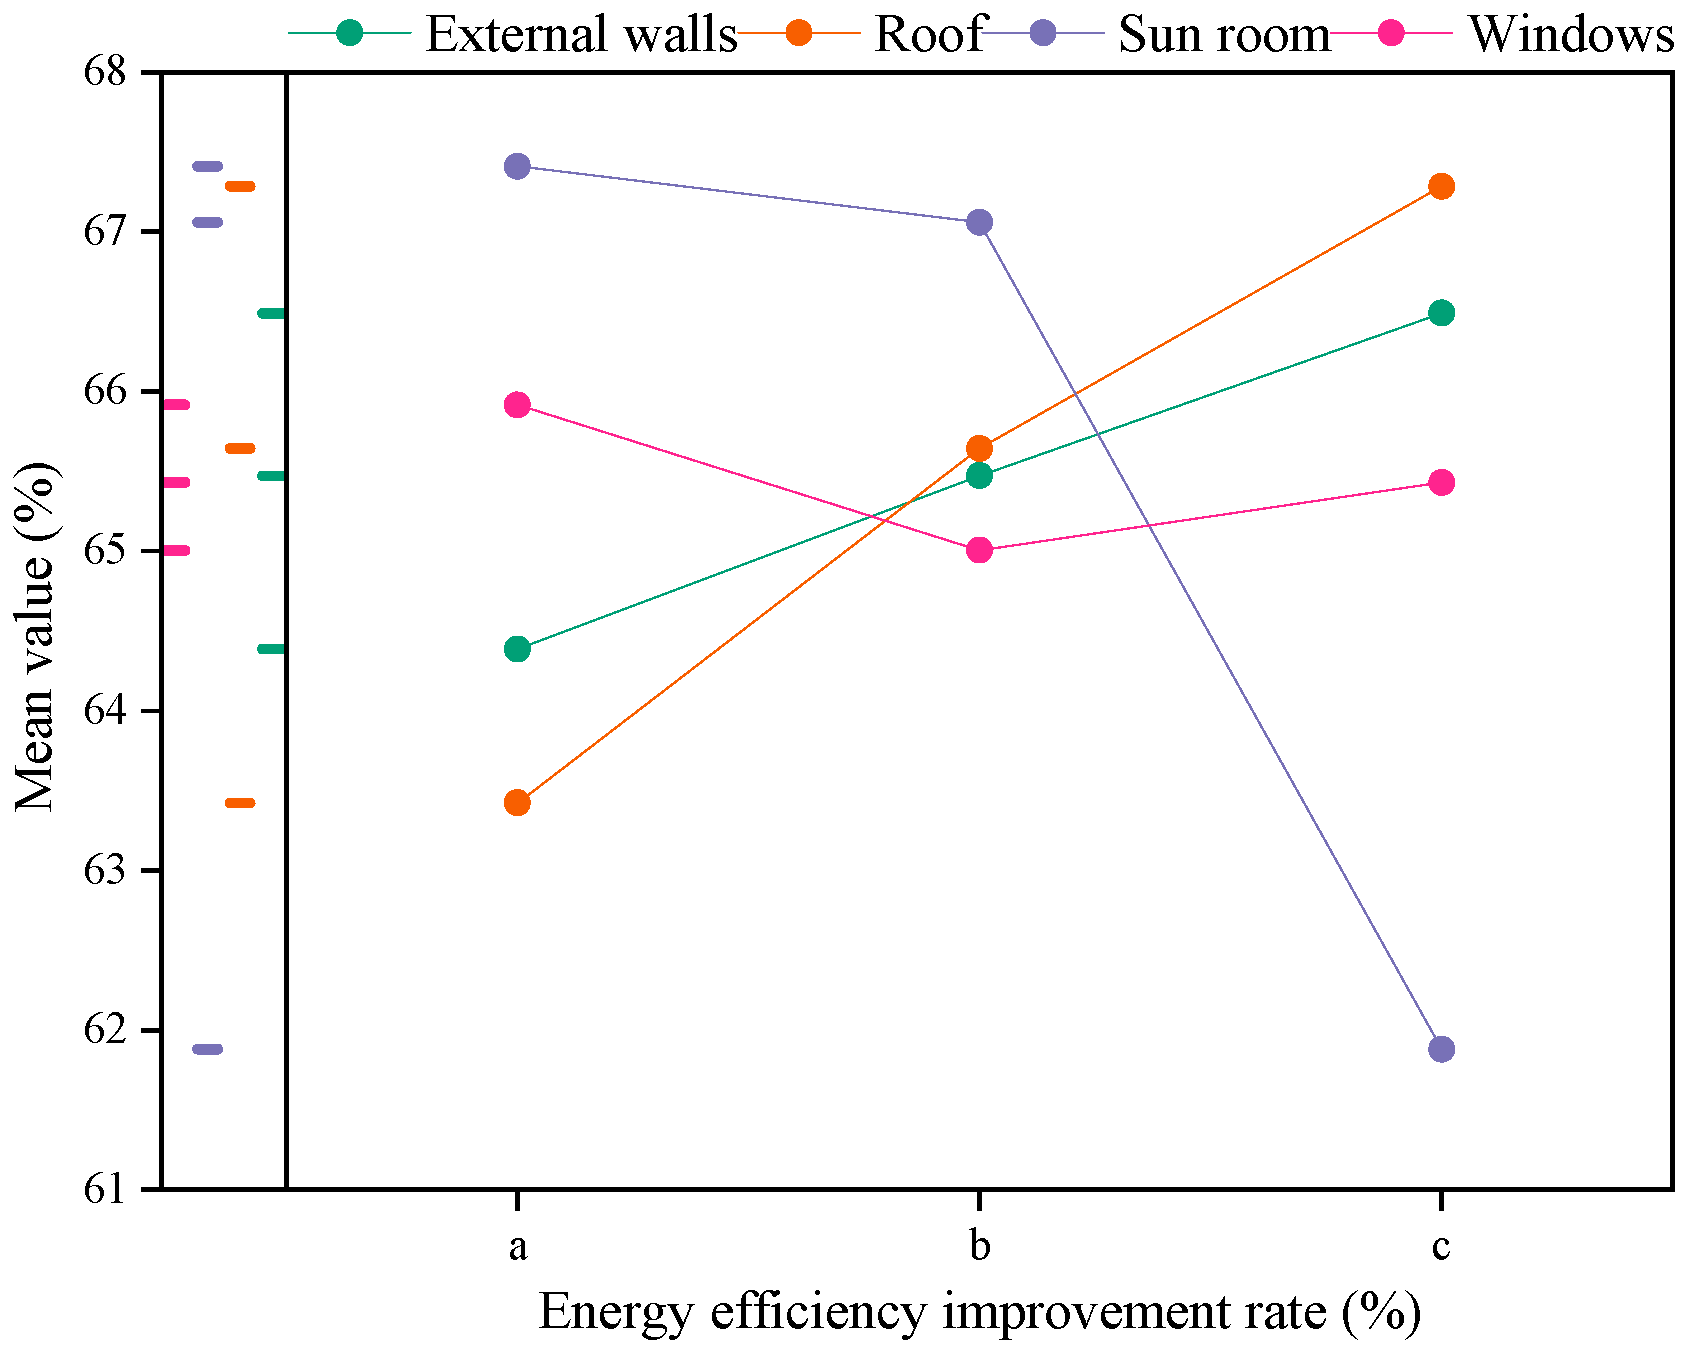
- 1.
- From the perspective of energy consumption improvement rates, the sensitivity ranking of the impact on the energy efficiency improvement rate of rural houses is as follows: depth of sunroom > thickness of roof insulation layer > thickness of exterior wall insulation layer > type of exterior window. In other words, varying the depth of the sunroom has the greatest influence on building energy efficiency, particularly when changing from 1 m to 1.2 m.
- 2.
- The solution with the highest energy efficiency improvement rate is AcBcCaDa (MAX), which means an external wall insulation layer thickness of 60 mm, a roof insulation layer thickness of 60 mm, a sunroom depth of 0.8 m, and a plastic steel single-layer window type. It was found that a lower heat transfer coefficient of the external window results in a more energy-efficient scheme regarding a sunroom, which differs from the results of special renovation. This discrepancy arises because the sunroom’s high transparency allows full utilization of daylight, causing temperatures in the sunroom to rise even higher than those inside the house. Consequently, a higher heat transfer coefficient of the external windows facilitates temperature transmission from the sunroom to the interior, thereby reducing daytime indoor heating demands.
- 3.
- From the perspective of CF, the sensitivity ranking of the impact on rural houses’ CF is as follows: depth of sunroom > thickness of roof insulation layer > thickness of exterior wall insulation layer > type of exterior window. Notably, there is a significant difference between the sunroom at a depth of 1 m and that at a depth of 1.2 m.
- 4.
- The scheme with the lowest CF corresponds to the same configuration as the scheme with the highest energy efficiency improvement rate, namely AcBcCaDa (MAX).
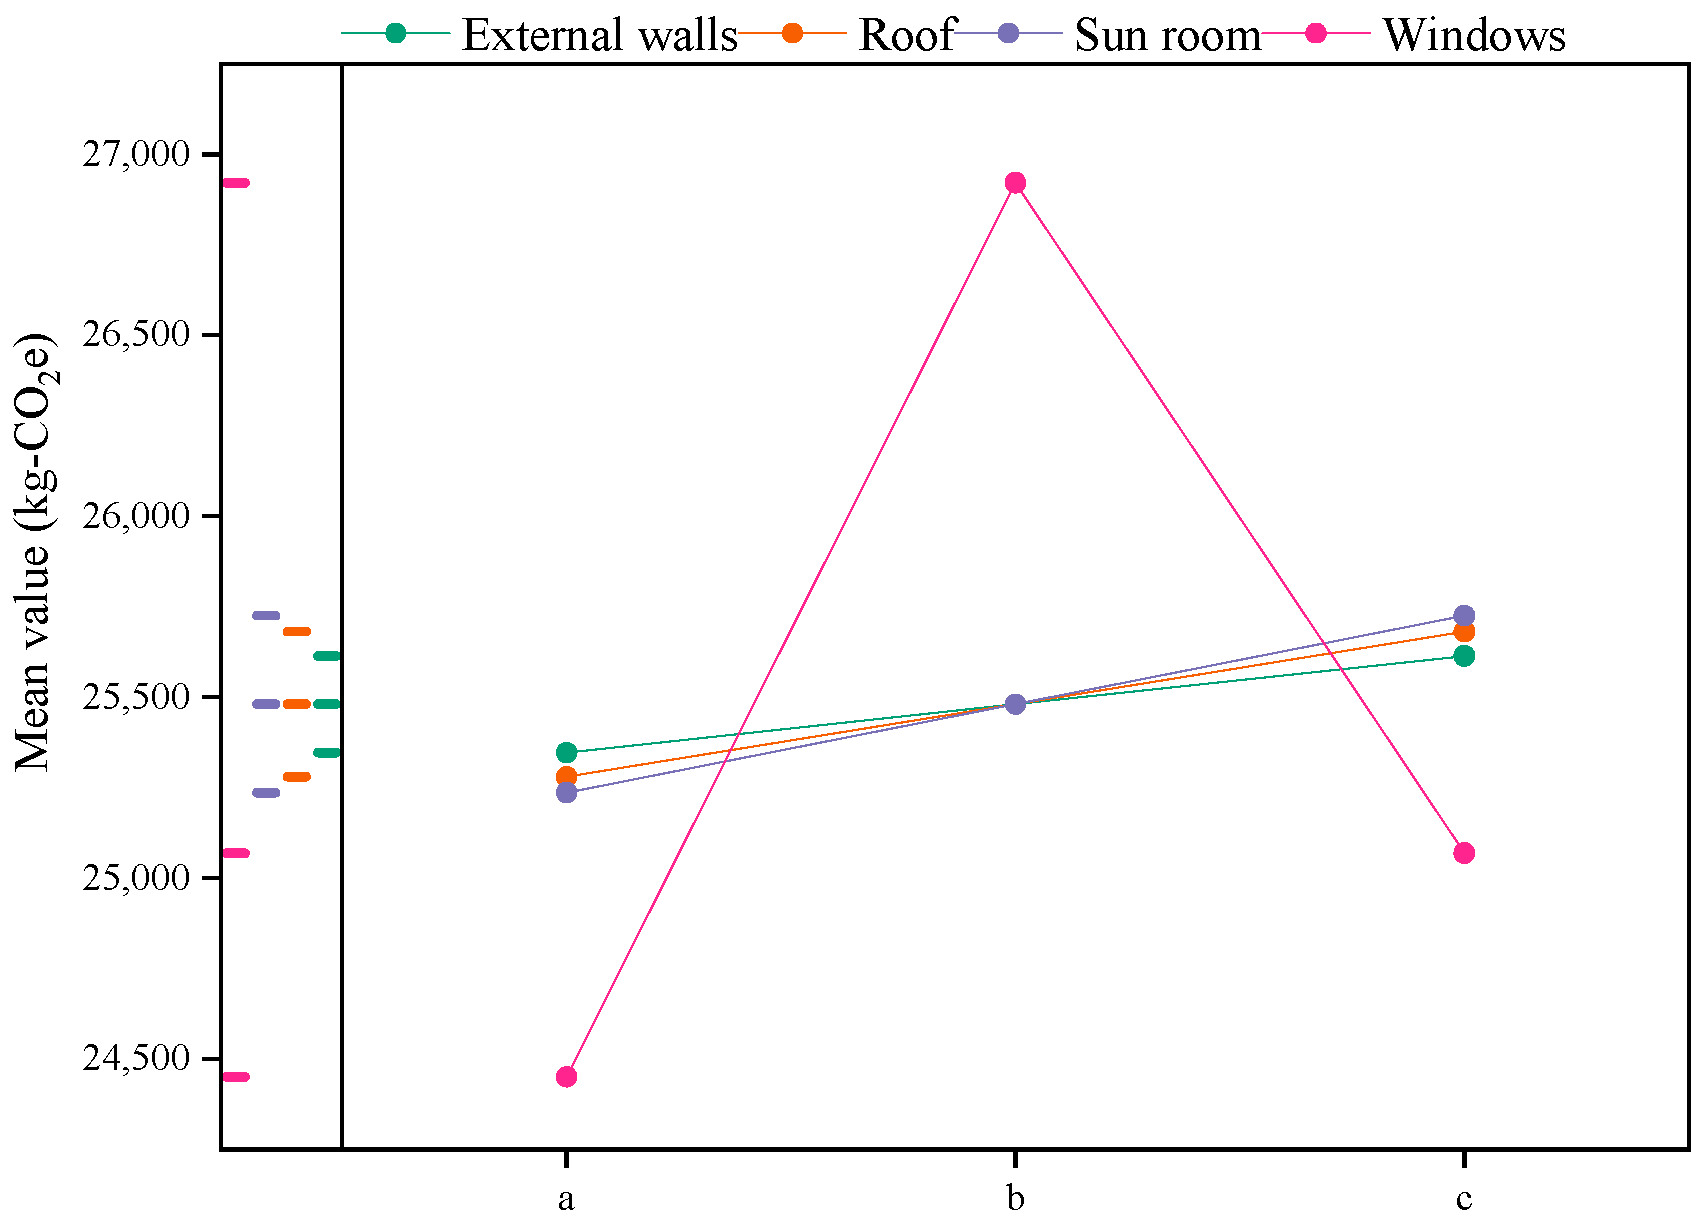
- 5.
- The sensitivity ranking of implied carbon emissions from rural houses is as follows: type of external window > depth of sunroom > thickness of roof insulation layer > thickness of external wall insulation layer. The ranking highlights significant differences in the implied carbon emissions between various types of external windows (Figure 8).
- 1.
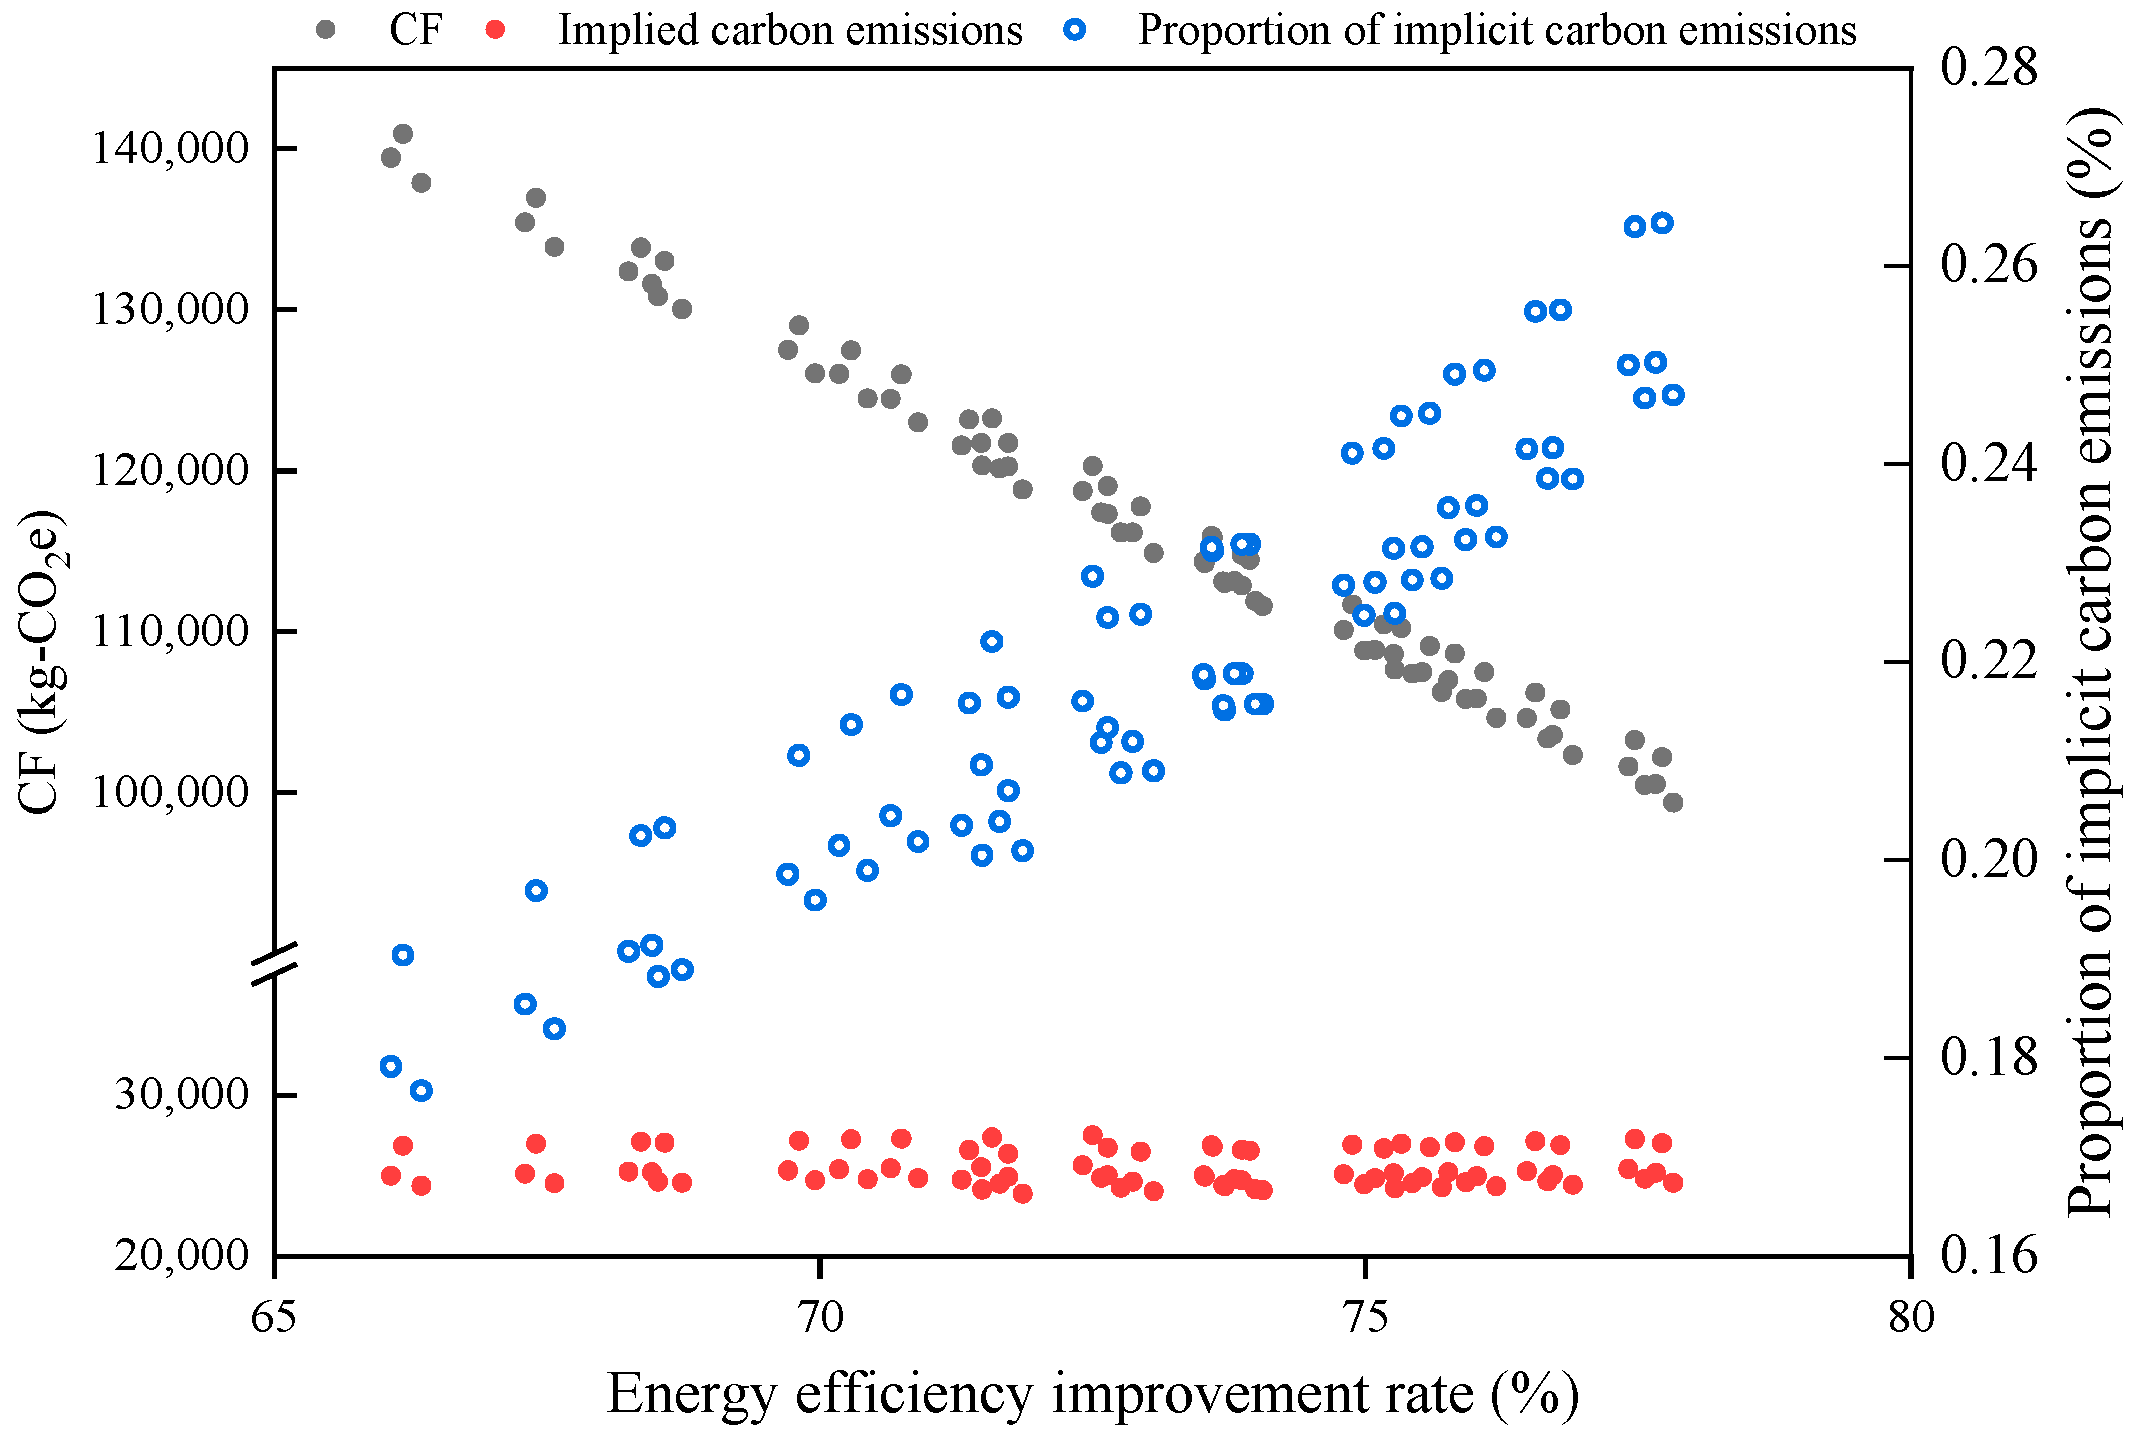
- After fully combining these limited measures, their CF ranges from 99.37 t-CO2e to 140.92 t-CO2e, with the corresponding annual average carbon emission intensity per unit area ranging from 24.69 kg-CO2e/(m2∙a) to 35.01 kg-CO2e/(m2∙a).
- 2.
- As the energy efficiency improvement rate increases, CF generally shows a decreasing trend. However, upon detailed observation, there is not a strict correlation between CF and the energy efficiency improvement rate. This indicates that simply pursuing a higher energy efficiency improvement rate may not necessarily yield optimal environmental impact. To achieve environmental goals, differences among various factors cannot be ignored.
- 3.
- The combination of specific renovation measures constitutes the embodied carbon emissions of the combination plan, accounting for 17.67% to 26.43%. This highlights the importance of embodied carbon emissions in rural residential energy-saving renovation projects, which should not be overlooked.
- 4.
- While the overall change in embodied carbon emissions is not significant, the detailed trends are not strictly positively correlated, mainly influenced by the type of external window, consistent with the results in Figure 11.
4.3. Carbon Reduction Performance and Economy
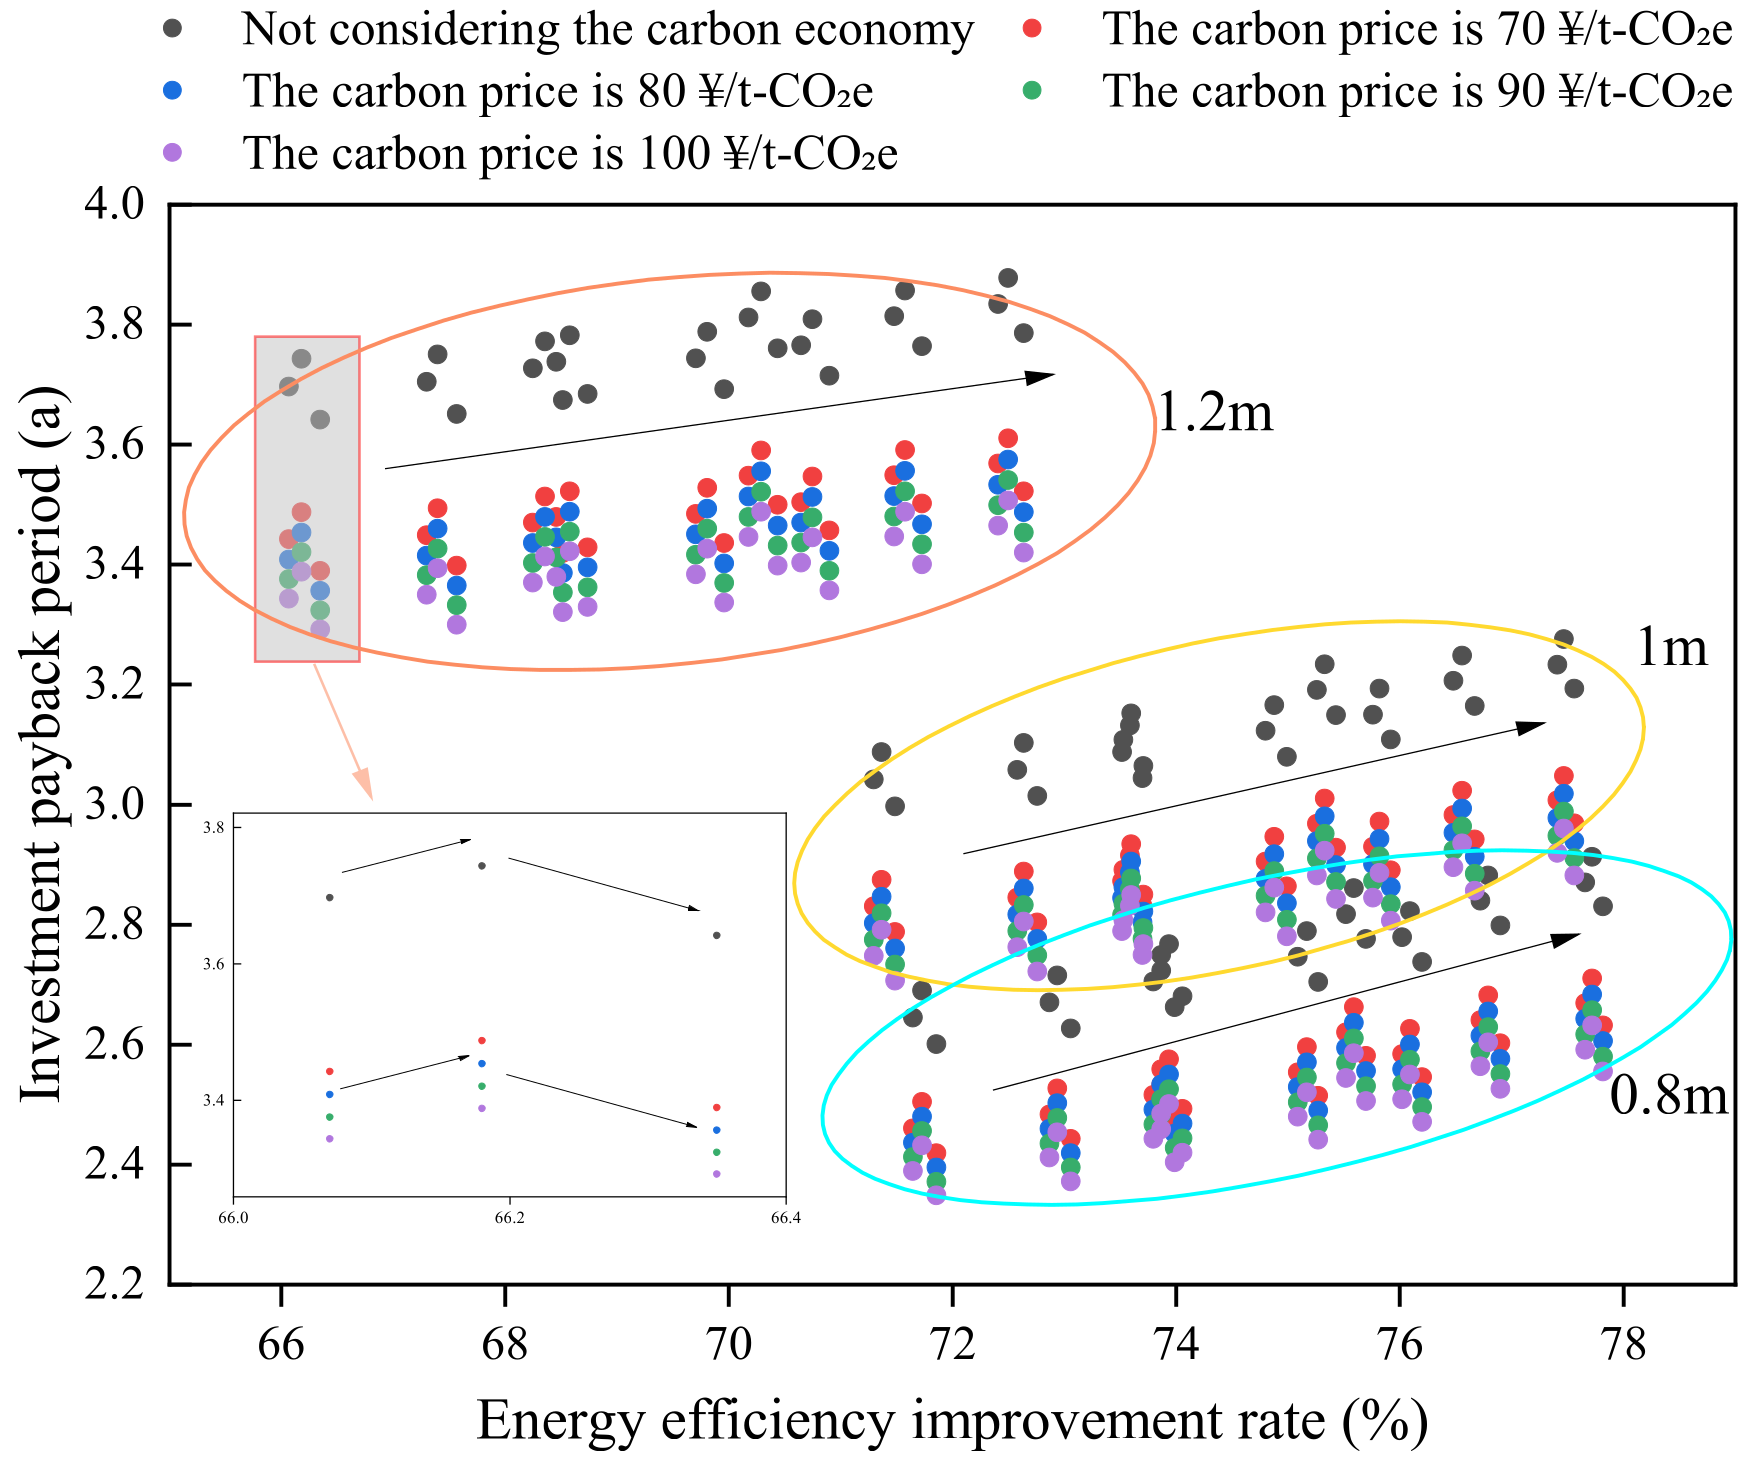
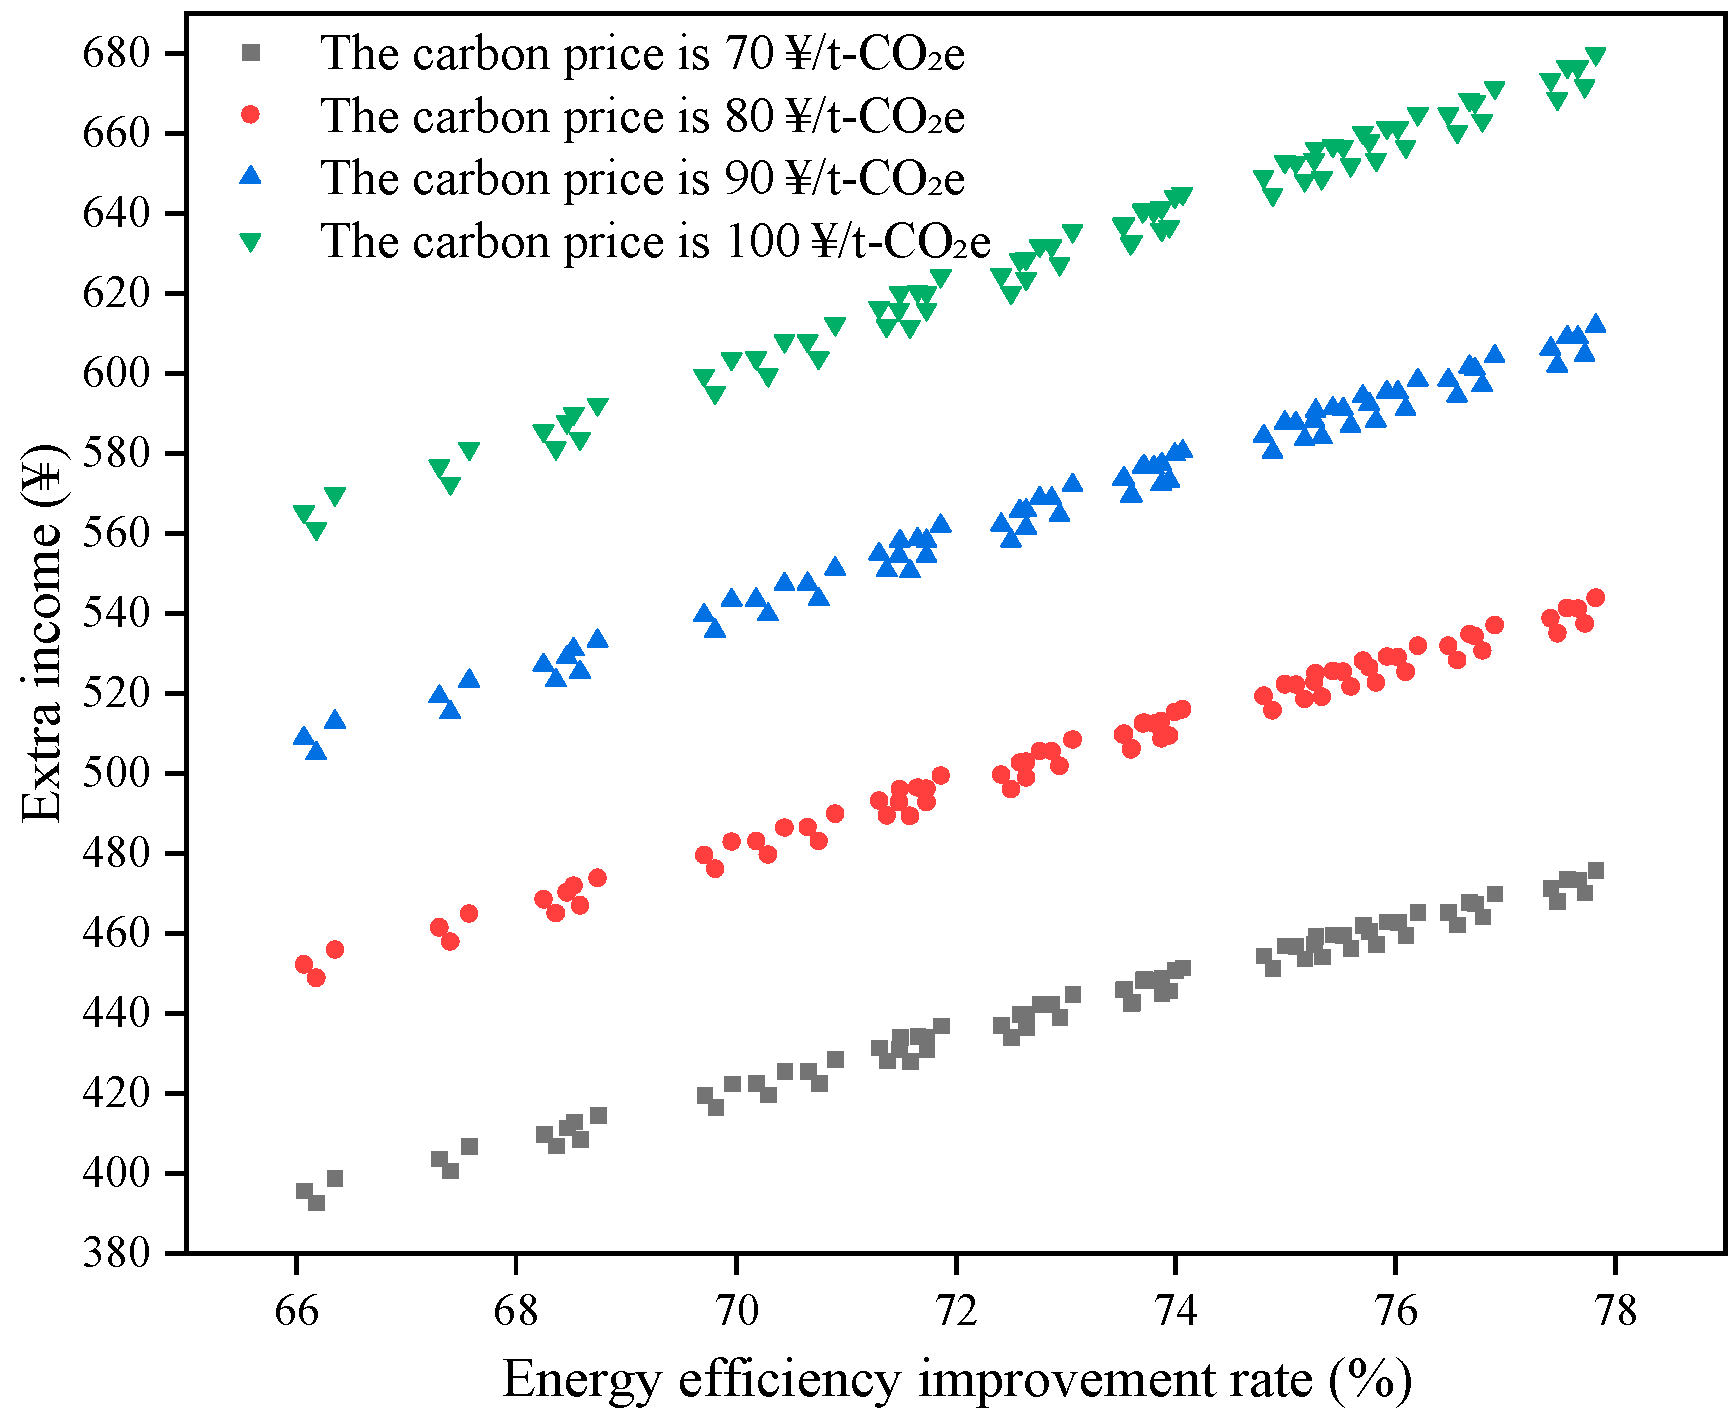
- 1.
- When factoring in the carbon market, there is a substantial improvement in the project’s static investment payback period. Specifically (Figure 15), when carbon reductions are traded at prices of 70 CNY/t-CO2e, 80 CNY/t-CO2e, 90 CNY/t-CO2e, and 100 CNY/t-CO2e, the investment payback period decreases by 6.84%-7.03%, 7.74%-7.92%, 8.62%-8.86%, and 9.49%-9.75%, respectively. Correspondingly, as energy efficiency improves, the expected additional annual benefits are projected to range from CNY 392.85 to CNY 475.94, CNY 448.97 to CNY 543.93, CNY 505.09 to CNY 611.93, and CNY 561.21 to CNY 679.92, respectively. It is noteworthy that in the context of the carbon trading market, the primary purchasers of carbon reduction credits are typically enterprises subject to carbon emission constraints. When rural residential energy conservation and carbon reduction amounts are traded with these enterprises, the proceeds go to farmers, positively impacting the income gap between urban and rural residents. Additionally, rural residents benefiting from carbon inclusivity may become more proactive in carbon reduction efforts, thereby playing a crucial role in achieving environmental objectives.
- 2.
- From the perspective of the energy efficiency improvement rate, it is found that an increase in this rate does not fully reduce the static investment payback period of the project. The lowest payback period scheme has an energy efficiency improvement rate of 71.86%.
- 3.
- Our analysis indicates that sunroom depth has the most significant impact on the investment payback period. A sunroom with a depth of 1.2 m exhibits the longest payback period, while one with a depth of 0.8 m demonstrates the shortest.
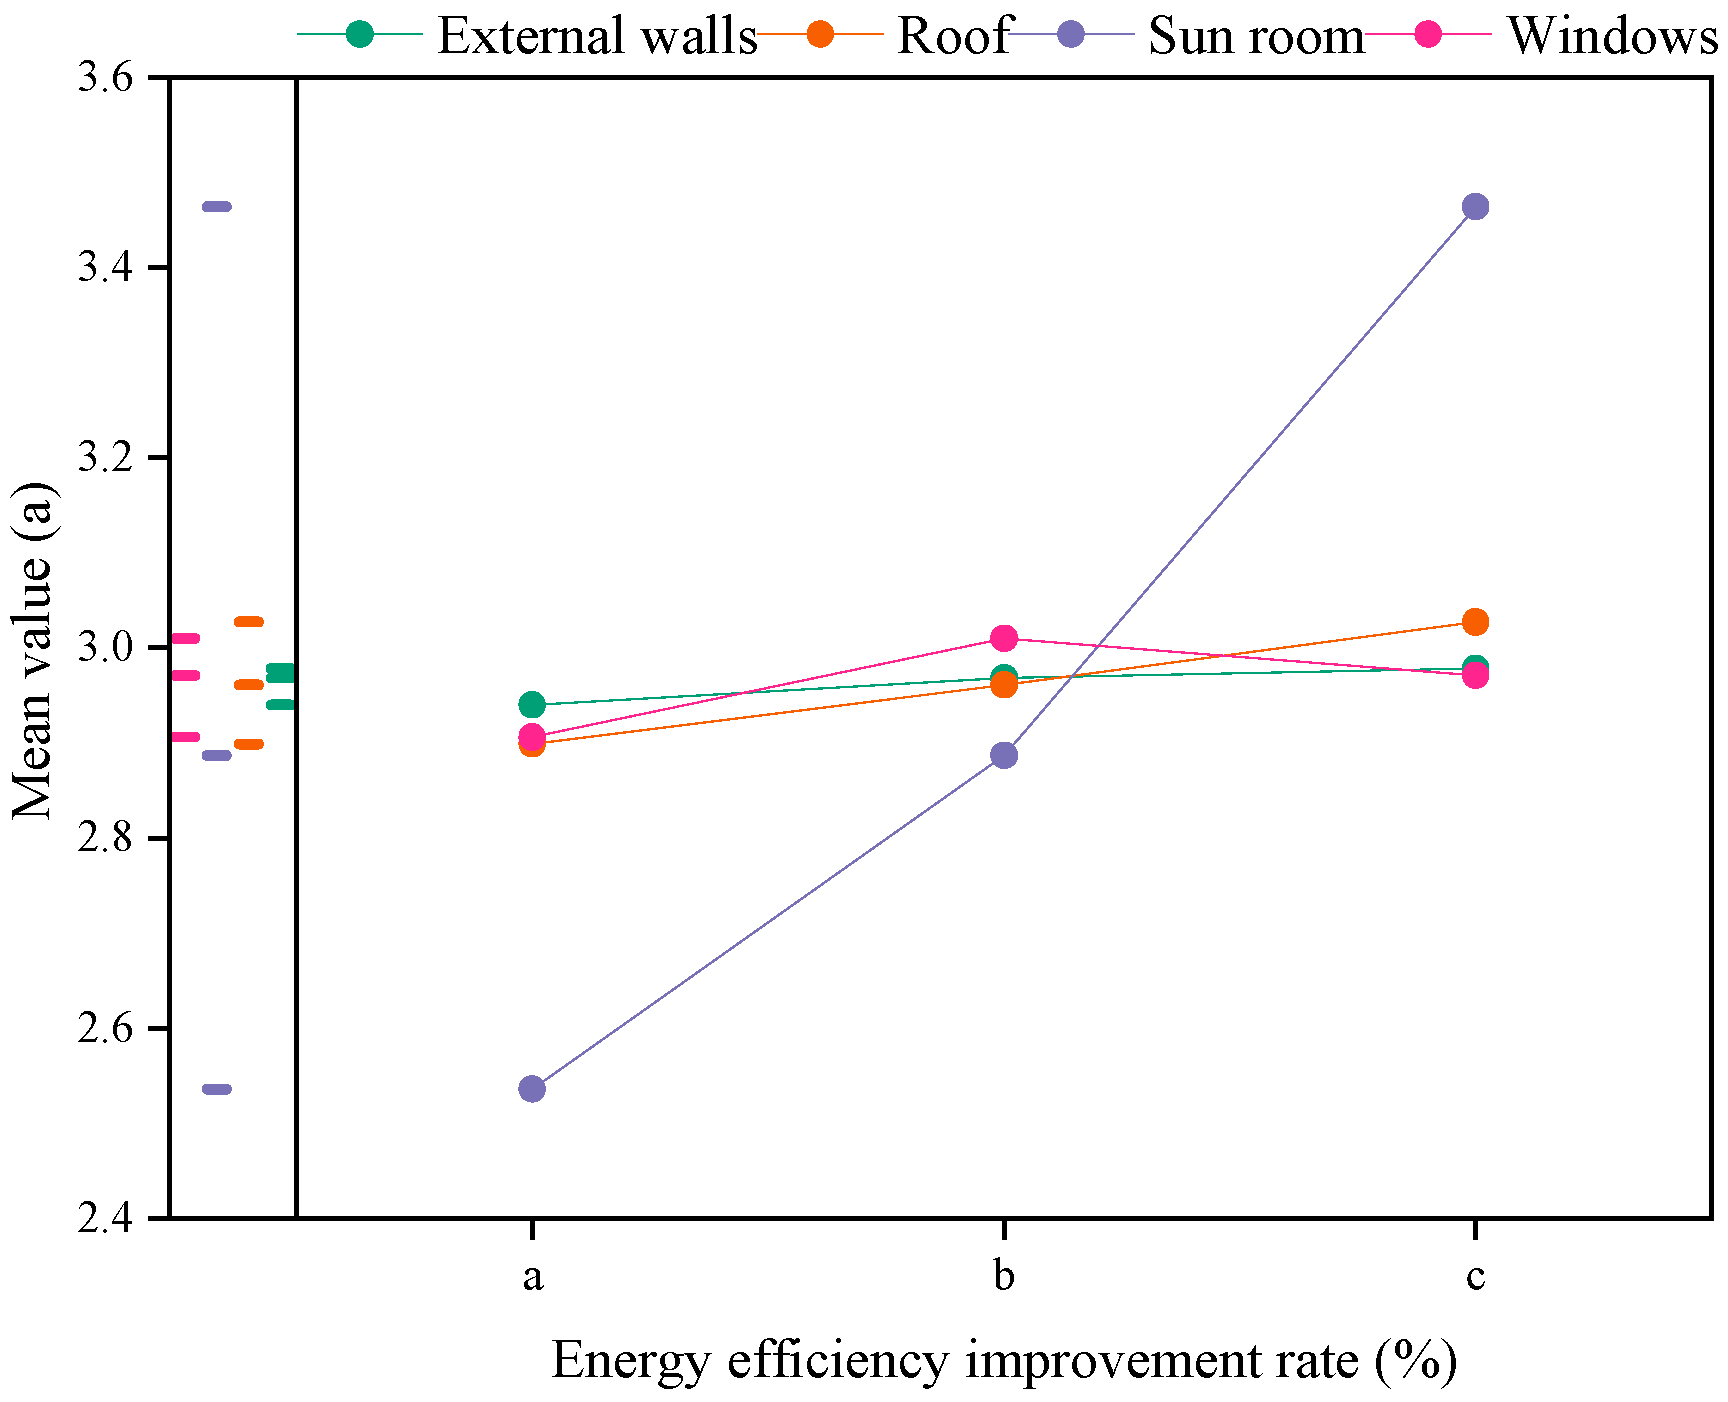
- 4.
- As illustrated in Figure 16, the sensitivity ranking of factors affecting the investment payback period is as follows: depth of sunroom > thickness of roof insulation layer > type of external window > thickness of external wall insulation layer. Notably, the high construction costs associated with deeper sunrooms should not be overlooked, as they can significantly extend the investment payback period. Surprisingly, increasing the thickness of the roof insulation layer can actually lengthen the payback period, underscoring the need for balanced considerations in design decisions.
5. Discussion
- 1.
- Carbon Emission Considerations
- 2.
- The Emergence of the Carbon Economy
- 3.
- Conceptual Framework: Carbon Payback Period
- 4.
- Uncertainty Factors of LCA
- 5.
- Urban Renewal and Renovation
- 6.
- Limitations and Prospects
- (1)
- This study specifically focuses on buildings located in Tongchuan City, which has a cold climate. This implies that the quantitative results may only be applicable to this specific region. Given China’s wide longitudinal span and diverse climate zones, it is necessary to conduct comprehensive research on rural housing across different climate zones.
- (2)
- This paper focuses on passive energy-saving renovations, which should also include ground and chimney renovations. The types of external windows considered are relatively limited. Currently, there are various types of external windows on the market, such as low-E glass and gas-filled windows, whose effects are also worth studying. The development and application of active energy-saving technologies require increased investment.
- (3)
- The buildings in the paper are flat-roofed structures, while sloping roofs are still prevalent in rural areas. Additionally, many building envelope structures are made of bricks, requiring scientific research on transformation strategies.
- (4)
- This study did not consider psychological factors such as residents’ needs and satisfaction. Future research should supplement these aspects using scientific methods, as considering users’ feelings is just as important as the economy and environment.
6. Conclusions
- (1)
- During the embodied carbon emissions phase of rural residential renovations, low-carbon production of building materials requires significant attention. Emissions from transportation, construction, and demolition constitute only a minor proportion and should not overshadow the critical focus on material production.
- (2)
- Considering all evaluation indicators, the depth design of sunrooms warrants priority, followed by the thickness of roof insulation and then wall insulation. The choice of external windows has the most substantial impact on the carbon recovery period.
- (3)
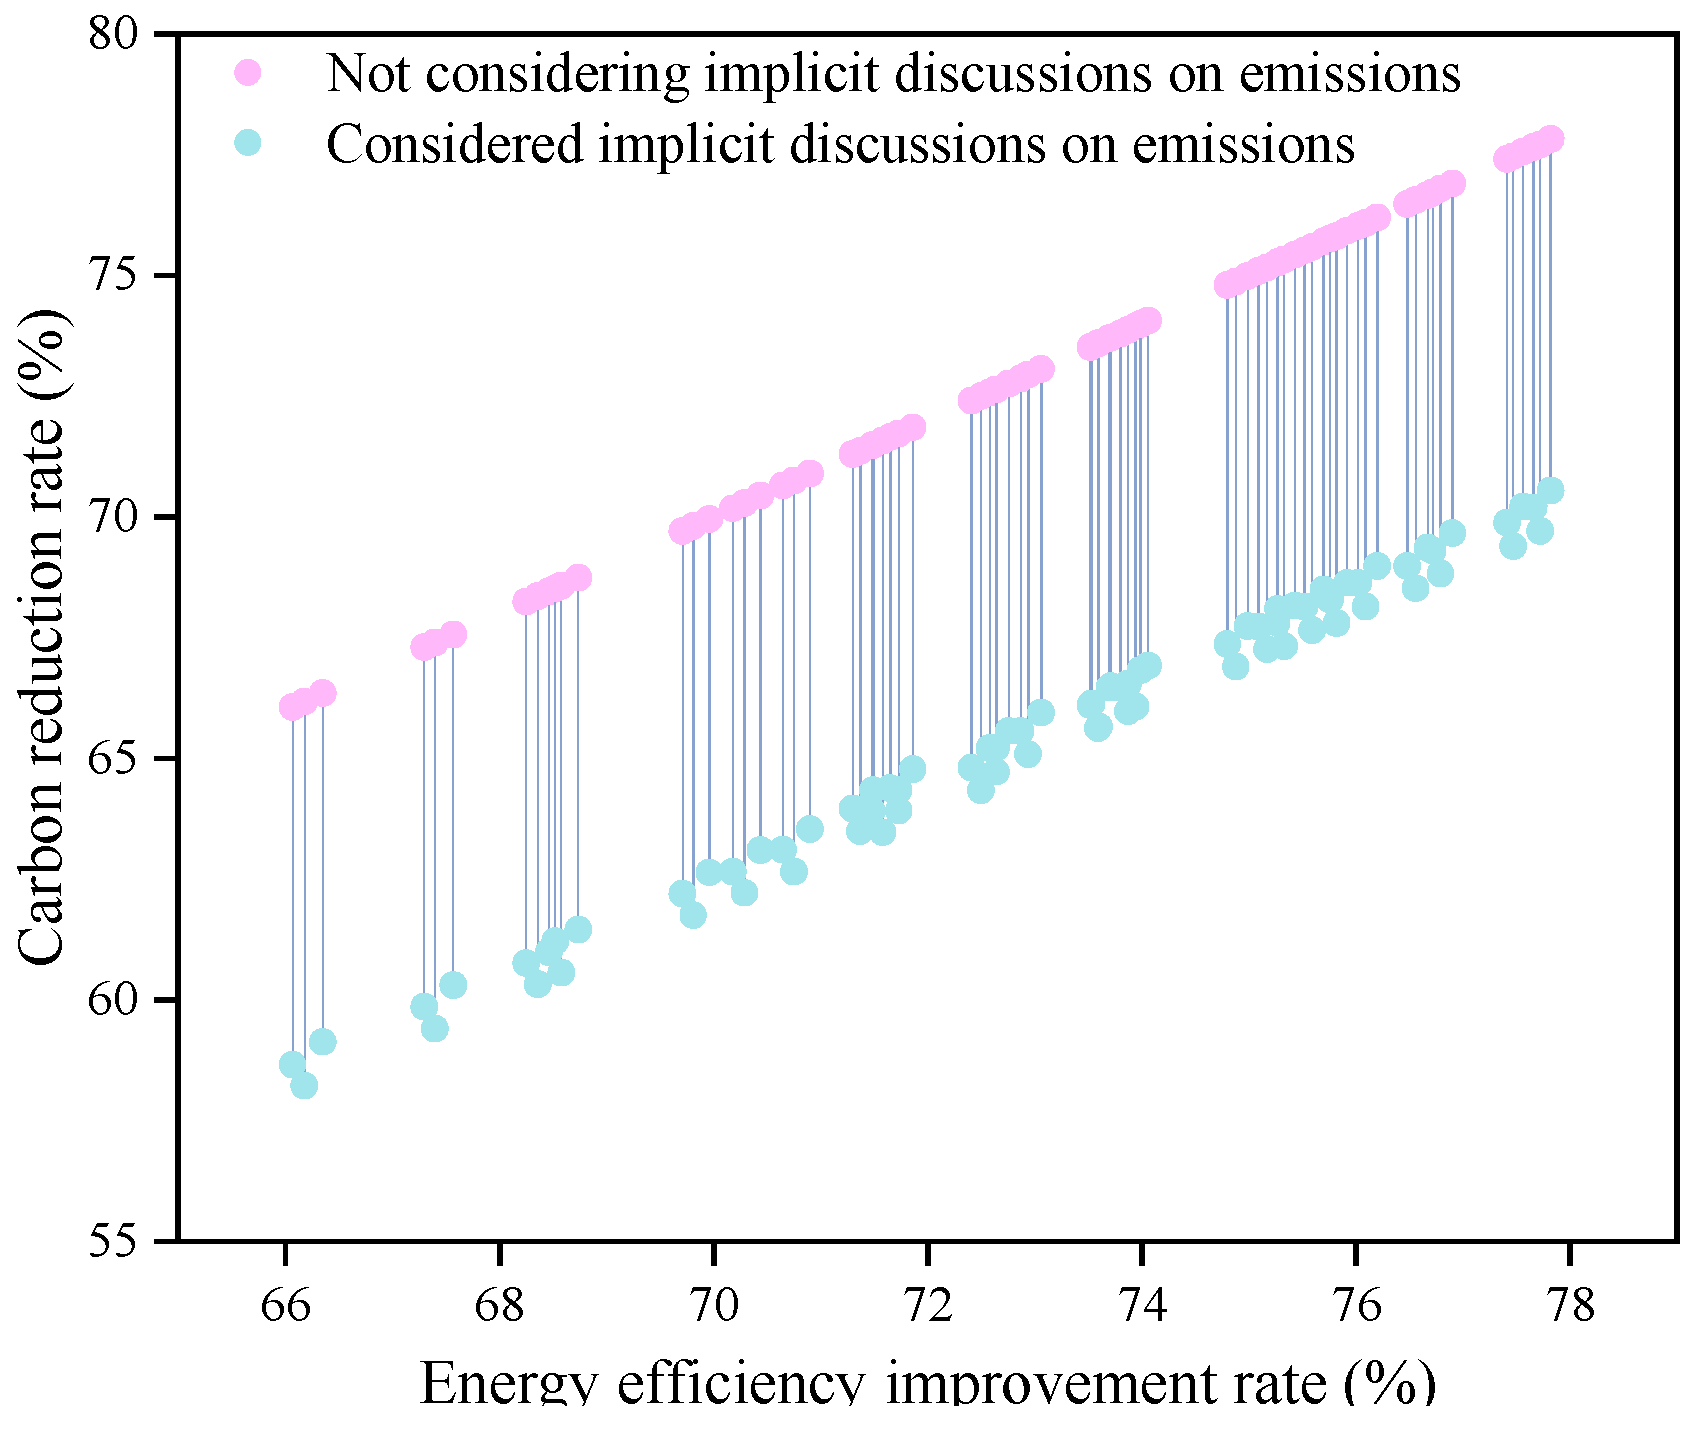
- Embodied carbon emissions from comprehensive renovations represent 17.67% to 26.43% of the total carbon footprint. Overlooking these emissions can result in an overestimation of the carbon reduction rate by 9.35% to 12.02%.
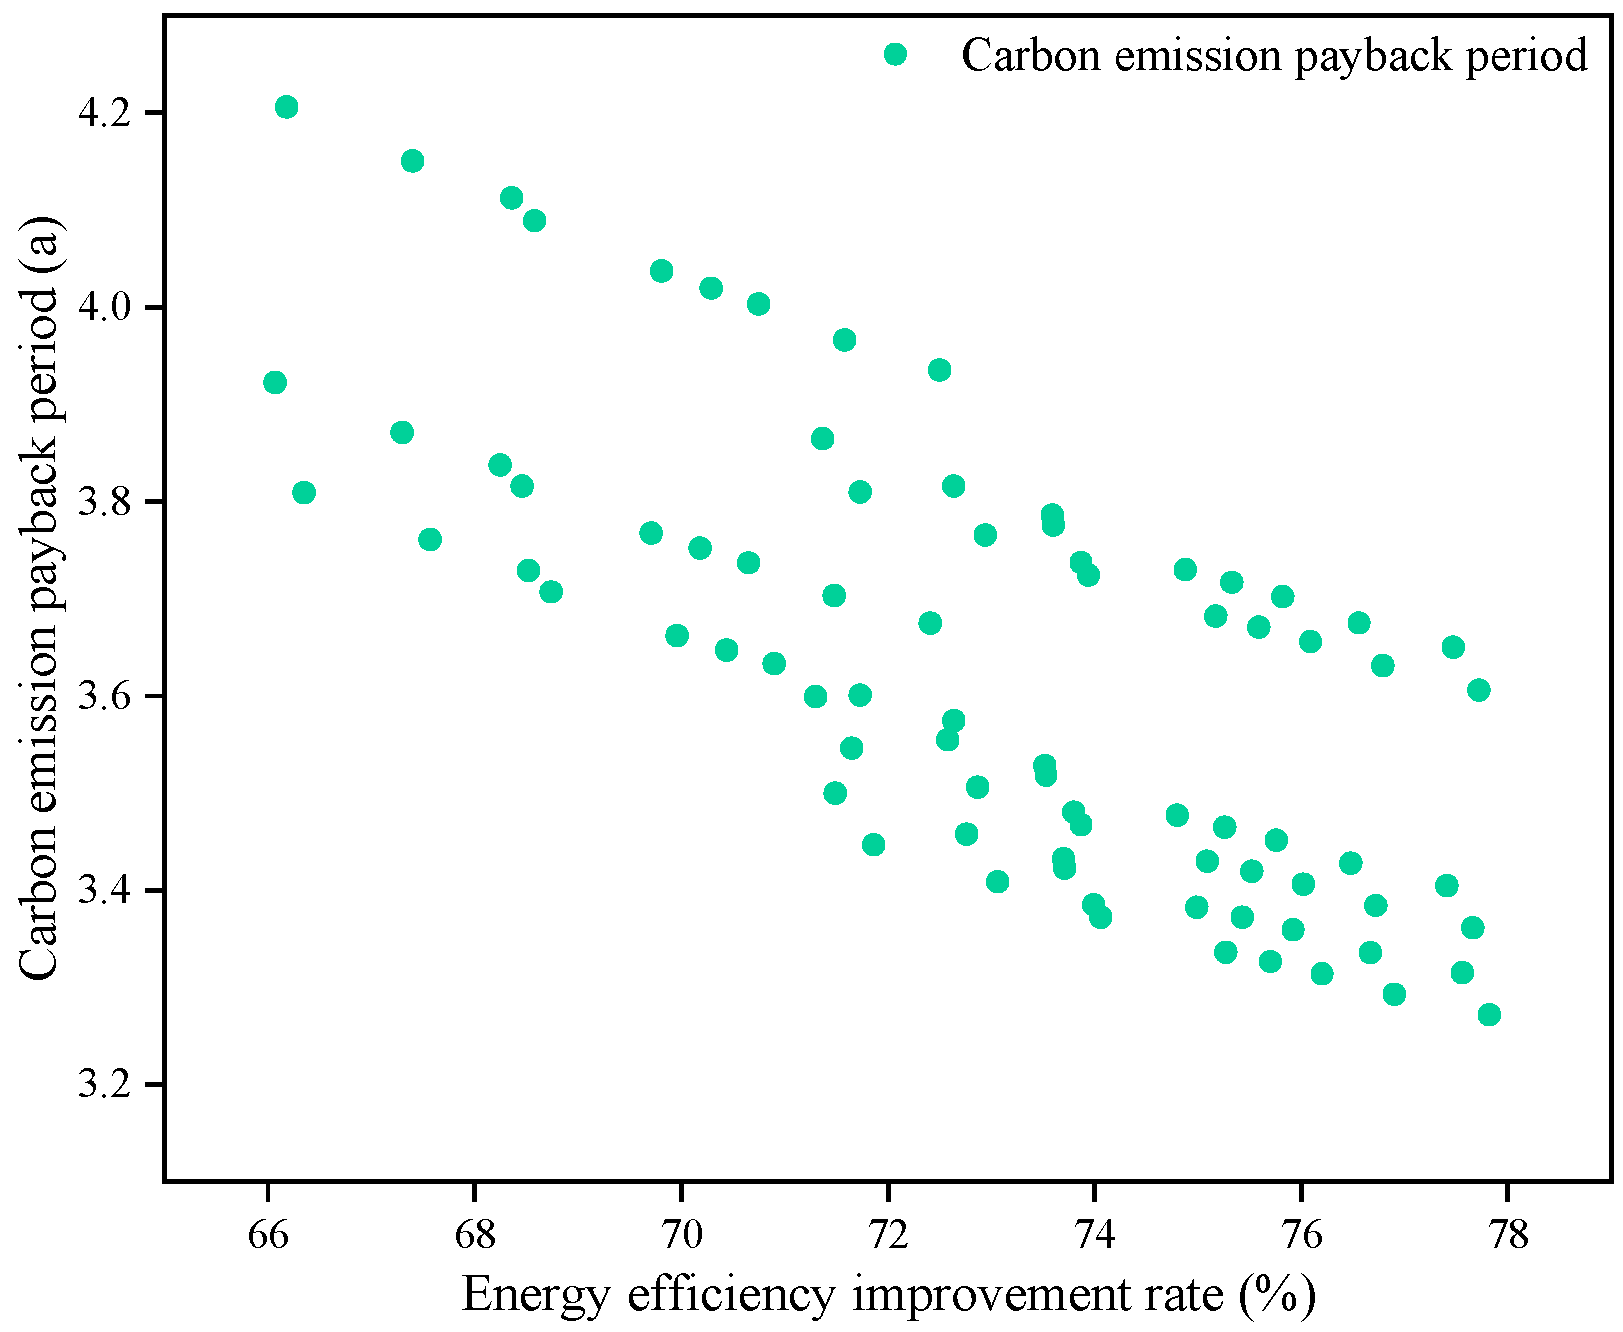
- (4)
- The estimated carbon payback period for the proposed renovation plan ranges between 3.27 and 4.21 years. This parameter should be incorporated alongside economic assessments for multi-objective optimization in future projects.
- (5)
- The concept of the carbon economy can effectively shorten the investment payback period of projects and mitigate income disparity between urban and rural residents to some extent. Investors and relevant governmental bodies should recognize its significance.
Author Contributions
Funding
Institutional Review Board Statement
Informed Consent Statement
Data Availability Statement
Conflicts of Interest
References
- Jansen, B.W.; van Stijn, A.; Gruis, V.; van Bortel, G. A circular economy life cycle costing model (CE-LCC) for building components. Resour. Conserv. Recycl. 2020, 161, 104857. [Google Scholar] [CrossRef]
- Agency, I.E. International Energy Agency. 2020. Available online: https://www.iea.org/ (accessed on 1 October 2024).
- Ürge-Vorsatz, D.; Khosla, R.; Bernhardt, R.; Chan, Y.C.; Vérez, D.; Hu, S.; Cabeza, L.F. Advances toward a net-zero global building sector. Annu. Rev. Environ. Resour. 2020, 45, 227–269. [Google Scholar] [CrossRef]
- Economidou, M.; Todeschi, V.; Bertoldi, P.; D’Agostino, D.; Zangheri, P.; Castellazzi, L. Review of 50 years of EU Energy Efficiency Policies for Buildings. Energy Build. 2020, 225, 110322. [Google Scholar] [CrossRef]
- Li, C.; Li, Z.; Bai, L.; Guo, Y.; Qin, J.; Wang, H. Estimating air pollutant emissions from burning straw for heating in rural Northeast China: Based on the heat load for building heating. J. Build. Eng. 2023, 72, 106642. [Google Scholar] [CrossRef]
- Guo, H.; Qiao, W.; Liu, J. Dynamic feedback analysis of influencing factors of existing building energy-saving renovation market based on system dynamics in China. Sustainability 2019, 11, 273. [Google Scholar] [CrossRef]
- Wang, J.; Zhang, Y.; Wang, Y.; Gu, L. China’s building energy efficiency standards assessment based on fuzzy evaluation algorithm. In Proceedings of the Institution of Civil Engineers-Engineering Sustainability; Thomas Telford Ltd.: London, UK, 2019; Volume 173, pp. 291–302. [Google Scholar] [CrossRef]
- Zhou, Y.; Zheng, S.; Lei, J.; Zi, Y. A cross-scale modelling and decarbonisation quantification approach for navigating Carbon Neutrality Pathways in China. Energy Convers. Manag. 2023, 297, 117733. [Google Scholar] [CrossRef]
- Kang, Y.; Wu, J.; Liu, R.; He, L.; Yu, Z.; Yang, Y. Handshaking towards zero-concept analysis and technical measures of LEED zero-energy building in connection with technical standard of nearly zero-energy building in China. Energy Explor. Exploit. 2021, 39, 669–689. [Google Scholar] [CrossRef]
- Liu, Y.; Xue, S.; Guo, X.; Zhang, B.; Sun, X.; Zhang, Q.; Wang, Y.; Dong, Y. Towards the goal of zero-carbon building retrofitting with variant application degrees of low-carbon technologies: Mitigation potential and cost-benefit analysis for a kindergarten in Beijing. J. Clean. Prod. 2023, 393, 136316. [Google Scholar] [CrossRef]
- Ng, T.S.; Yau, R.M.; Lam, T.N.; Cheng, V.S. Design and commission a zero-carbon building for hot and humid climate. Int. J. Low-Carbon Technol. 2016, 11, 222–234. [Google Scholar] [CrossRef]
- RICS. Whole Life Carbon Assessment for the Built Environment. 2017. Available online: https://www.rics.org/content/dam/ricsglobal/documents/standards/Whole_life_carbon_assessment_PS_Sept23.pdf (accessed on 28 December 2024).
- Joensuu, T.; Edelman, H.; Saari, A. Circular economy practices in the built environment. J. Clean. Prod. 2020, 276, 124215. [Google Scholar] [CrossRef]
- Decorte, Y.; Steeman, M.; Van Den Bossche, N. Effect of a one-dimensional approach in LCA on the environmental life cycle impact of buildings: Multi-family case study in Flanders. Build. Environ. 2021, 206, 108381. [Google Scholar] [CrossRef]
- Eberhardt, L.C.M.; Rønholt, J.; Birkved, M.; Birgisdottir, H. Circular Economy potential within the building stock-mapping the embodied greenhouse gas emissions of four Danish examples. J. Build. Eng. 2021, 33, 101845. [Google Scholar] [CrossRef]
- Munaro, M.R.; Tavares, S.F.; Bragança, L. Towards circular and more sustainable buildings: A systematic literature review on the circular economy in the built environment. J. Clean. Prod. 2020, 260, 121134. [Google Scholar] [CrossRef]
- Prabatha, T.; Hewage, K.; Karunathilake, H.; Sadiq, R. To retrofit or not? Making energy retrofit decisions through life cycle thinking for Canadian residences. Energy Build 2020, 226, 110393. [Google Scholar] [CrossRef]
- Amoruso, F.M.; Sonn, M.H.; Schuetze, T. Carbon-neutral building renovation potential with passive house-certified components: Applications for an exemplary apartment building in the Republic of Korea. Build. Environ. 2022, 215, 108986. [Google Scholar] [CrossRef]
- Galimshina, A.; Moustapha, M.; Hollberg, A.; Padey, P.; Lasvaux, S.; Sudret, B.; Habert, G. What is the optimal robust environmental and cost-effective solution for building renovation? Not the usual one. Energy Build. 2021, 251, 111329. [Google Scholar] [CrossRef]
- Struhala, K.; Ostrý, M. Life-cycle assessment of a rural terraced house: A struggle with sustainability of building renovations. Energies 2021, 14, 2472. [Google Scholar] [CrossRef]
- He, B.-J.; Yang, L.; Ye, M. Building energy efficiency in China rural areas: Situation, drawbacks, challenges, corresponding measures and policies. Sustain. Cities Soc. 2014, 11, 7–15. [Google Scholar] [CrossRef]
- Wang, M.; Wei, C. Toward sustainable heating: Assessment of the carbon mitigation potential from residential heating in northern rural China. Energy Policy 2024, 190, 114141. [Google Scholar] [CrossRef]
- Tahsildoost, M.; Zomorodian, Z. Energy, carbon, and cost analysis of rural housing retrofit in different climates. J. Build. Eng. 2020, 30, 101277. [Google Scholar] [CrossRef]
- Cui, Y.; Sun, N.; Cai, H.; Li, S. Indoor temperature improvement and energy-saving renovations in rural houses of China’s Cold Region—A case study of shandong province. Energies 2020, 13, 870. [Google Scholar] [CrossRef]
- Liu, Z.; Wu, D.; He, B.-J.; Wang, Q.; Yu, H.; Ma, W.; Jin, G. Evaluating potentials of passive solar heating renovation for the energy poverty alleviation of plateau areas in developing countries: A case study in rural Qinghai-Tibet Plateau, China. Sol. Energy 2019, 187, 95–107. [Google Scholar] [CrossRef]
- Chen, X.; Li, Z.; Liu, Z.; Dai, L.; Fan, Q.; Li, J.; Weng, D.; Liu, M. A spatial–temporal coefficient method for analyzing the rural dwellings renovation with intermittent heating in China. Energy Build. 2024, 323, 114820. [Google Scholar] [CrossRef]
- Peng, P.; Wang, H. Solar chimney design in rural areas of Anhui, China: CFD simulation, energy and carbon footprint assessment. J. Build. Eng. 2024, 96, 110590. [Google Scholar] [CrossRef]
- Moreno-Rangel, A. Passivhaus. Encyclopedia 2020, 1, 20–29. [Google Scholar] [CrossRef]
- Marincu, C.; Dan, D.; Moga, L. Investigating the influence of building shape and insulation thickness on energy efficiency of buildings. Energy Sustain. Dev. 2024, 79, 101384. [Google Scholar] [CrossRef]
- Pathirana, S.; Rodrigo, A.; Halwatura, R. Effect of building shape, orientation, window to wall ratios and zones on energy efficiency and thermal comfort of naturally ventilated houses in tropical climate. Int. J. Energy Environ. Eng. 2019, 10, 107–120. [Google Scholar] [CrossRef]
- Wu, X.; Peng, B.; Lin, B. A dynamic life cycle carbon emission assessment on green and non-green buildings in China. Energy Build. 2017, 149, 272–281. [Google Scholar] [CrossRef]
- Ministry of Housing and Urban-Rural Development of the People’s Republic of China. Design Standard for Energy Efficiency of Rural Residential Buildings GB/T 50824-2013; China Architecture & Building Press: Beijing, China, 2013. [Google Scholar]
- Piccardo, C.; Gustavsson, L. Deep energy retrofits using different retrofit materials under different scenarios: Life cycle cost and primary energy implications. Energy 2023, 281, 128131. [Google Scholar] [CrossRef]
- Shi, L.; Qi, X.; Yang, Z.; Tao, L.; Li, Y.; Qiu, J.; Jiang, X. Comparative study of greenhouse gas emission calculations and the environmental impact in the life cycle assessment of buildings in China, Finland, and the United States. J. Build. Eng. 2023, 70, 106396. [Google Scholar] [CrossRef]
- Du, Q.; Shao, L.; Zhou, J.; Huang, N.; Bao, T.; Hao, C. Dynamics and scenarios of carbon emissions in China’s construction industry. Sustain. Cities Soc. 2019, 48, 101556. [Google Scholar] [CrossRef]
- Yan, D.; Zhou, X.; An, J.; Kang, X.; Bu, F.; Chen, Y.; Pan, Y.; Gao, Y.; Zhang, Q.; Zhou, H.; et al. DeST 3.0: A new-generation building performance simulation platform. In Building Simulation; Tsinghua University Press: Beijing, China, 2022; Volume 15, pp. 1849–1868. [Google Scholar] [CrossRef]
- ASHRAE. ASHRAE Guideline 14-2014: Measurement of Energy, Demand, and Water Savings; American Society of Heating, Refrigerating and Air-Conditioning Engineers: Atlanta, GA, USA, 2014. [Google Scholar]
- He, Y.; Wang, Y.; Song, Z.; Yu, H.; Xue, Y. Study on Carbon Emissions from the Renovation of Old Residential Areas in Cold Regions of China. Sustainability 2023, 15, 3018. [Google Scholar] [CrossRef]
- Du, Q.; Wang, Y.; Pang, Q.; Hao, T.; Zhou, Y. The dynamic analysis on low-carbon building adoption under emission trading scheme. Energy 2023, 263, 125946. [Google Scholar] [CrossRef]
- Chen, M.; Zhang, Z.; Deng, Q.; Feng, Y.; Wang, X. Optimization of underfloor air distribution systems for data centers based on orthogonal test method: A case study. Build. Environ. 2023, 232, 110071. [Google Scholar] [CrossRef]
- Li, Q.; Hu, H.; Ma, L.; Wang, Z.; Arıcı, M.; Li, D.; Luo, D.; Jia, J.; Jiang, W.; Qi, H. Evaluation of energy-saving retrofits for sunspace of rural residential buildings based on orthogonal experiment and entropy weight method. Energy Sustain. Dev. 2022, 70, 569–580. [Google Scholar] [CrossRef]
- Luo, W.; Zhang, Y.; Gao, Y.; Liu, Y.; Shi, C.; Wang, Y. Life cycle carbon cost of buildings under carbon trading and carbon tax system in China. Sustain. Cities Soc. 2021, 66, 102509. [Google Scholar] [CrossRef]
- Evans, M.; Yu, S.; Song, B.; Deng, Q.; Liu, J.; Delgado, A. Building energy efficiency in rural China. Energy Policy 2014, 64, 243–251. [Google Scholar] [CrossRef]
- Tian, W.; Heo, Y.; de Wilde, P.; Li, Z.; Yan, D.; Park, C.S.; Feng, X.; Augenbroe, G. A review of uncertainty analysis in building energy assessment. Renew. Sustain. Energy Rev. 2018, 93, 285–301. [Google Scholar] [CrossRef]
- Hoxha, E.; Habert, G.; Lasvaux, S.; Chevalier, J.; Le Roy, R. Influence of construction material uncertainties on residential building LCA reliability. J. Clean. Prod. 2017, 144, 33–47. [Google Scholar] [CrossRef]
- Aktas, C.B.; Bilec, M.M. Impact of lifetime on US residential building LCA results. Int. J. Life Cycle Assess. 2012, 17, 337–349. [Google Scholar] [CrossRef]
- Groen, E.; Heijungs, R.; Bokkers, E.; de Boer, I. Methods for uncertainty propagation in life cycle assessment. Environ. Model. Softw. 2014, 62, 316–325. [Google Scholar] [CrossRef]
- Leung, W.; Noble, B.; Gunn, J.; Jaeger, J.A. A review of uncertainty research in impact assessment. Environ. Impact Assess. Rev. 2015, 50, 116–123. [Google Scholar] [CrossRef]
- Chen, X.; Matthews, H.S.; Griffin, W.M. Uncertainty caused by life cycle impact assessment methods: Case studies in process-based LCI databases. Resour. Conserv. Recycl. 2021, 172, 105678. [Google Scholar] [CrossRef]
- Rajabi, M.S.; Beigi, P.; Aghakhani, S. Drone delivery systems and energy management: A review and future trends. In Handbook of Smart Energy Systems; Springer: Berlin/Heidelberg, Germany, 2023; pp. 1–19. [Google Scholar] [CrossRef]
- Beigi, P.; Rajabi, M.S.; Aghakhani, S. An overview of drone energy consumption factors and models. In Handbook of Smart Energy Systems; Springer: Berlin/Heidelberg, Germany, 2022; pp. 1–20. [Google Scholar] [CrossRef]
- Guo, H.; Chen, Z.; Chen, X.; Yang, J.; Song, C.; Chen, Y. UAV-BIM-BEM: An automatic unmanned aerial vehicles-based building energy model generation platform. Energy Build. 2024, 328, 115120. [Google Scholar] [CrossRef]
- Morteza, A.; Yahyaeian, A.A.; Mirzaeibonehkhater, M.; Sadeghi, S.; Mohaimeni, A.; Taheri, S. Deep learning hyperparameter optimization: Application to electricity and heat demand prediction for buildings. Energy Build. 2023, 289, 113036. [Google Scholar] [CrossRef]


| Position | Renovation Measures and Materials | Material Production | Construction | Operation | Waste | Specifications/Dosage | |||||
|---|---|---|---|---|---|---|---|---|---|---|---|
| A1–A3 | A4 | A5 | B1 | B2 | B3 | C1 | |||||
| Carbon Emission Factors | Unit | Distance /km | Method | Method | Service Life/Year | Method | Method | Area /m2 | Thickness /mm | ||
| Wall | EPS | 61.2 | kg CO2e /m3 | 30 | * | Calculated according to the simulation results of DeST-h | 30 | Default no repair | Calculated by reconstruction measures and parts | 70 | 40–60 |
| Cement mortar | 558.1 | 35 | x | 40 | |||||||
| Exterior window | Aluminum alloy single-layer window | 30.4 | kg CO2e /m2 | 30 | 25 | 5.4 | x | ||||
| Plastic steel single-layer window | 68.5 | ||||||||||
| Aluminum alloy hollow window | 56.3 | ||||||||||
| Plastic steel hollow window | 94.4 | ||||||||||
| Roof | XPS | 70.2 | kg CO2e /m3 | 30 | 30 | 126.5 | 40–60 | ||||
| Cement mortar | 558.1 | 35 | x | 30 | |||||||
| Asphalt | 91.74 | 6 | |||||||||
| Sunroom | Section steel | 2.05 | kg CO2e /kg | 30 | 25 | 0.51–0.53 | 4 | ||||
| Plastic steel hollow window | 94.4 | kg CO2e /m2 | 30–32 | x | |||||||
| Aluminum composite panel | 8.06 | kg CO2e /m2 | 11.8–12.5 | 4 | |||||||
| Rock wool insulation board | 1980 | kg CO2e /t | 11.8–12.5 | 60 | |||||||
| Position | Alternative Renovation Measures | Thermal Transmittance [W/(m2·K)] | Specifications | Price | Unit |
|---|---|---|---|---|---|
| Exterior wall | EPS | 0.041 | Thickness: 40–60 mm | 450 | CNY/m3 |
| Exterior window | Aluminum alloy single-layer window | 6.4 | / | 436.8 | CNY/m2 |
| Plastic steel single-layer window | 4.7 | 327.6 | |||
| Aluminum alloy hollow window | 3.7 | 517.4 | |||
| Plastic steel hollow window | 2.6 | 409.5 | |||
| Roof | XPS | 0.028 | Thickness: 40–60 mm | 630 | CNY/m3 |
| Sunroom | Square steel column, plastic steel double-glazed window, plastic steel door, and thermal insulation wall | / | Depth: 0.8 m, 1.0 m, 1.2 m | 740.85 | CNY/m2 |
| Level | Thickness of External Wall Insulation Layer (A, mm) | Thickness of Roof Insulation Layer (B, mm) | Sunroom Depth (C, m) | Exterior Window Type (D) |
|---|---|---|---|---|
| a | 40 | 40 | 0.8 | Plastic steel single-layer window |
| b | 50 | 50 | 1.0 | Aluminum alloy hollow window |
| c | 60 | 60 | 1.2 | Plastic steel hollow window |
| Number | Thickness of External Wall Insulation Layer (A, mm) | Thickness of Roof Insulation Layer (B, mm) | Sunroom Depth (C, m) | Exterior Window Type (D) |
|---|---|---|---|---|
| 1 | 40 | 40 | 0.8 | Plastic steel single-layer window |
| 2 | 40 | 50 | 1.2 | Aluminum alloy hollow window |
| 3 | 40 | 60 | 1 | Plastic steel hollow window |
| 4 | 50 | 40 | 1.2 | Plastic steel hollow window |
| 5 | 50 | 50 | 1 | Plastic steel single-layer window |
| 6 | 50 | 60 | 0.8 | Aluminum alloy hollow window |
| 7 | 60 | 40 | 1 | Aluminum alloy hollow window |
| 8 | 60 | 50 | 0.8 | Plastic steel hollow window |
| 9 | 60 | 60 | 1.2 | Plastic steel single-layer window |
Disclaimer/Publisher’s Note: The statements, opinions and data contained in all publications are solely those of the individual author(s) and contributor(s) and not of MDPI and/or the editor(s). MDPI and/or the editor(s) disclaim responsibility for any injury to people or property resulting from any ideas, methods, instructions or products referred to in the content. |
© 2025 by the authors. Licensee MDPI, Basel, Switzerland. This article is an open access article distributed under the terms and conditions of the Creative Commons Attribution (CC BY) license (https://creativecommons.org/licenses/by/4.0/).
Share and Cite
Cao, P.; Wang, J.; Huang, D.; Cao, Z.; Li, D. Evaluation and Analysis of Passive Energy Saving Renovation Measures for Rural Residential Buildings in Cold Regions: A Case Study in Tongchuan, China. Sustainability 2025, 17, 540. https://doi.org/10.3390/su17020540
Cao P, Wang J, Huang D, Cao Z, Li D. Evaluation and Analysis of Passive Energy Saving Renovation Measures for Rural Residential Buildings in Cold Regions: A Case Study in Tongchuan, China. Sustainability. 2025; 17(2):540. https://doi.org/10.3390/su17020540
Chicago/Turabian StyleCao, Ping, Jiawei Wang, Dinglei Huang, Zhi Cao, and Danyang Li. 2025. "Evaluation and Analysis of Passive Energy Saving Renovation Measures for Rural Residential Buildings in Cold Regions: A Case Study in Tongchuan, China" Sustainability 17, no. 2: 540. https://doi.org/10.3390/su17020540
APA StyleCao, P., Wang, J., Huang, D., Cao, Z., & Li, D. (2025). Evaluation and Analysis of Passive Energy Saving Renovation Measures for Rural Residential Buildings in Cold Regions: A Case Study in Tongchuan, China. Sustainability, 17(2), 540. https://doi.org/10.3390/su17020540