Article

Comparison of Lichen and Moss Transplants for Monitoring the Deposition of Airborne Microfibers

1
Department of Life Sciences, University of Siena, 53100 Siena, Italy
2
Istituto Nazionale di Geofisica e Vulcanologia, 00143 Rome, Italy
3
School of Environment, Trent University, Peterborough, ON K9L 0G2, Canada
4
Instituto Argentino de Oceanografía (IADO–CONICET/UNS), Camino La Carrindanga Km 7.5, Bahía Blanca 8000, Argentina
5
Departamento de Biología, Bioquímica y Farmacia, Universidad Nacional del Sur, San Juan 670, Bahía Blanca 8000, Argentina
*
Author to whom correspondence should be addressed.
These authors contributed equally to this work.
Sustainability 2025, 17(2), 537; https://doi.org/10.3390/su17020537
Submission received: 19 October 2024 / Revised: 9 January 2025 / Accepted: 10 January 2025 / Published: 12 January 2025
(This article belongs to the Special Issue Microplastic Research and Environmental Sustainability)

Abstract

:
Interest in using lichens and mosses to monitor airborne microplastics is growing, but few studies have thoroughly compared their effectiveness as biomonitors. Here, we directly compare the ability of lichen and moss transplants collected from a rural area to accumulate microfibers (MFs) and Potentially Toxic Elements (PTEs) under the same deployment conditions. Transplants (n = 60; triplicates for both lichen and moss) were co-deployed on tree branches across a range of urban exposure sites (e.g., commercial and residential areas and urban parks) for 77 days in Siena, Italy. The results showed that both biomonitors accumulated similar amounts of MFs, in terms of counts and on a mass basis, but when expressed on a surface area basis, lichens showed significantly higher values. Irrespective of the metric, lichen and moss MF accumulation data were strongly correlated. In contrast, there was no correlation between MFs and PTEs, suggesting that their sources were different. MFs accumulated by lichen and moss transplants were dominated by polyethylene terephthalate (PET) and polypropylene polymers, suggesting that the main source of airborne MFs is synthetic textiles. Our results suggest that both lichen and moss transplants can be effectively used as low-cost monitors of atmospheric MFs in urban areas in support of the sustainable development goal of clean air.

1. Introduction

The increasing prevalence of microplastics (MPs, plastic particles < 5 mm) in the environment has led to global concern about their potential impacts [1,2,3]. MPs have been detected in aquatic [4,5,6,7,8] and terrestrial [9,10] ecosystems, in the atmosphere [11,12,13], in plant [14,15] and animal [16] tissue, and even in human blood [17,18]. In the atmosphere, MPs have been detected in a variety of shapes (e.g., fibers, foams, fragments, and films) and polymer compositions [19]. However, numerous studies have highlighted that microfibers (MFs) are the most common shape of airborne MPs [13,20]. Furthermore, some of the most common polymers found in the atmosphere include polyethylene (PE), polypropylene (PP), polystyrene (PS), and the polyester family polymers such as polyethylene terephthalate (PET) [21,22,23].
Sensitive biological organisms, such as lichens and mosses, are commonly used as biomonitors to detect airborne contaminants, e.g., potentially toxic elements (PTEs) [24,25,26,27,28], PAH [29,30,31], or nitrogen [32,33,34]. Lichens and mosses have been widely used as biomonitors of atmospheric deposition since the late 1960s because they have a high capacity to trap and accumulate atmospheric particles [35,36]. Recently, mosses and lichens have also been used to monitor the deposition of airborne MPs in rural areas of Ireland [19] and Central Italy [37], as well as in urban areas, such as Toronto, Canada [38], Naples and Milan, Italy [39,40], and around a landfill dumping site, Italy [41].
The ability of the moss Pseudoscleropodium purum and the lichen Evernia prunastri to retain airborne MFs has been compared in natural environments, and the results suggested that moss accumulated a higher number of MFs [37]. Nevertheless, this study concluded that key factors such as the age of the organisms (i.e., a longer exposure time) and their habitat position (horizontally on the soil for the moss and vertically on tree trunks for the lichen) may have affected the results.
In the present study, the two biomonitors (P. purum and E. prunastri) were collected from a rural area and co-exposed for 77 days inside cotton bags at ten urban sites in Siena, Central Italy, to compare the ability of mosses and lichens to accumulate MFs under the same exposure conditions. The study also analyzed the possible differential accumulation of PTEs by the two biomonitors.

2. Materials and Methods

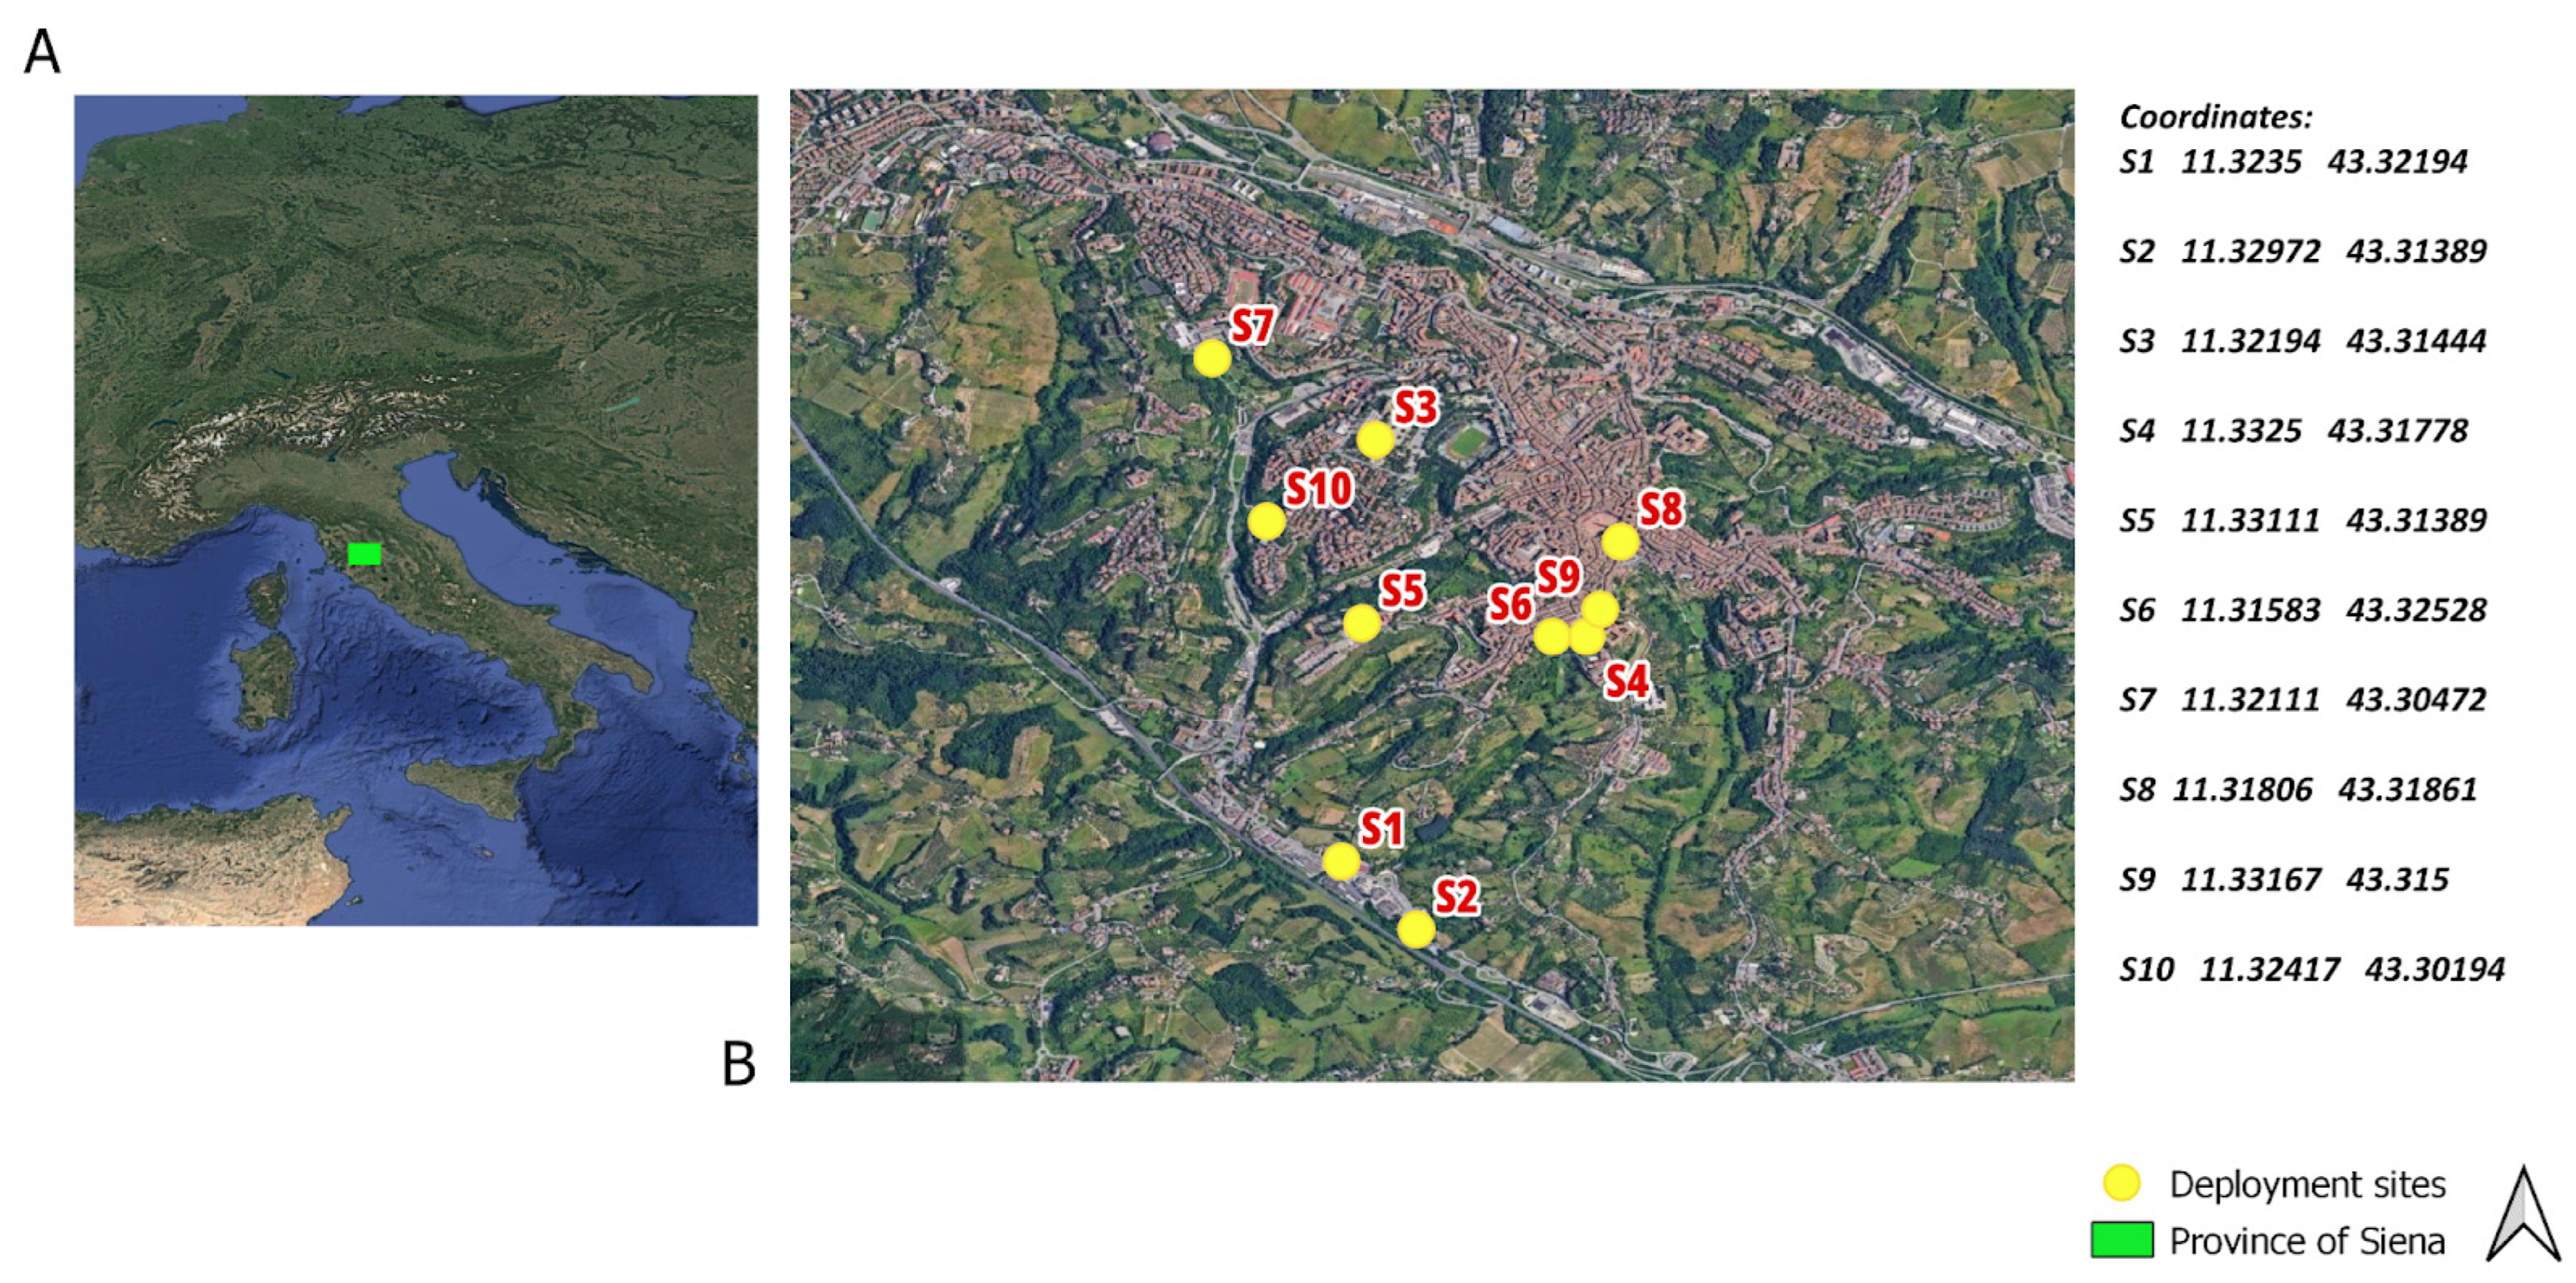
2.1. Experimental Design

In this study, the epigeic (soil inhabiting) moss P. purum (Hedw.) M. Fleisch. and the epiphytic (tree inhabiting) lichen E. prunastri (L.) Ach. were collected from a rural area in Central Italy (43°17′41.39″ N, 11°11′03.45″ E) that is far away from any local sources of air pollution. All samples were cleaned, avoiding the use of plastic tools, and stored in paper bags at room temperature until they were placed into cotton-knit bags with a mesh size of 1 cm. A total of 60 bags (triplicate for both moss and lichen) were deployed on tree branches at a height of 2–2.5 m from the ground at 10 urban sites across the city of Siena (43°18′29.52″ N, 11°19′45.48″ E), Central Italy (Figure 1). The sites were selected to cover a gradient in anthropogenic intensity, but they were also based on the availability of trees for sample deployment, namely, commercial areas (S1, S2), urban parks (S3, S7), the city center (S8, S9), botanical gardens (S4, S6), and residential areas (S5, S10). The exposure lasted 77 days, (from 26 October 2023 to 11 January 2024; a total of 4–12 weeks of exposure is typically recommended for transplants [42,43]) between autumn and winter, typically the most humid period of the year, in order to guarantee optimal survival conditions for both species. Three unexposed bagged samples for each biomonitor were used as controls. Siena has a population of about 55,000 inhabitants, but the number of residents is much higher due to university students and tourist influx all year round. The area has a Mediterranean climate, with an average annual temperature of 13.4 °C and an annual rainfall of 777 mm.

2.2. Microplastic Extraction

Following collection, all samples (1 g per sampling site) were air-dried to a constant weight (residual water < 10%) and digested using a wet peroxide oxidation method [19,37,40,41]. Samples were then vacuum-filtered onto cellulose filter papers (Whatman Grade 1, Mainstone, UK, 1001-090, 11 µm) and placed into glass Petri dishes for storage. The filter papers were examined for MFs under a stereomicroscope (Eurotek OXTL101TUSB, Eurotek, Inc, Eatontown, NJ, USA) equipped with a digital camera (MDCE-5C, NINGBO YONGXIN OPTICS CO., LTD. Ningbo, China) using the standard five-criteria method. MFs were further verified using a hot needle test that was set at a temperature of 300 °C, which is higher than the melting point of the vast majority of plastic polymers; if a suspected MF melted upon contact with the hot needle, it was counted as a MP. All MFs were measured using the open-source image processing software ImageJ 1.53t [44]. The five-criteria method included (a) unnatural color, (b) material homogeneity, (c) particle resiliency, (d) reflective surface, and (e) limited fraying [37,40,45]. The visual limit for particle detection is about 50 µm. Analytical blanks were routinely processed to check for potential laboratory contamination; no MFs were detected in the analytical blank. All glassware was rinsed three times with filtered deionized water before use, and aluminum foil was used to cover the glassware during MP extraction to prevent airborne contamination. Furthermore, surfaces were cleaned using paper towels and filtered deionized water, and all personnel wore cotton clothing throughout the process. MF accumulation, i.e., the difference between control and exposed samples, was expressed both on a mass basis (MF/g) and on a surface area basis (MF/m2). For the latter, mass data were converted into surface area (Equation (1)) using the values of 0.135 m2/g and 0.012 m2/g for the moss and lichen’s [40] specific surface area, respectively, measured following the method reported by [46].
MF accumulation (MF/m2) = MF (MF/g)/specific surface area (m2/g)

2.3. Polymer Identification

The polymer type of the extracted MFs was determined using µ-FT-IR (LUMOS II, Bruker Scientific LLC, Billerica, MA, USA) in attenuated total reflectance (ATR) mode. Glass slides with double-sided tape were prepared, and the extracted MFs were adhered to the tape. The glass slides were fixed to the FTIR stage, and a spectrum (with a spectral range of 400 cm−1 to 4000 cm−1 and 32 scans) was captured for each MF using the LUMOS II OPUS (version 8.7.31) spectroscopy software. The ATR crystal was cleaned with an isopropyl-dipped tissue before each MF identification to avoid cross-contamination between scans. Finally, the spectra were analyzed for polymer type using the open-source software Open Specy [47]. About 25% of the total MF found in both the moss and the lichen were analyzed for their polymer type.

2.4. Chemical Analysis

Samples (250 mg) were mineralized with 3 mL of HNO3 (67–69%), 0.2 mL of HF (47–51%), and 0.5 mL of H2O2 (30–32%) in a microwave digestion system (Ethos 900, Milestone, Bergamo, Italy) and analyzed for 8 potentially toxic elements (PTEs), namely, Al, Ba, Cd, Cr, Cu, Fe, Sb, and Zn (mg/kg dw) using inductively coupled plasma—mass spectrometry (ICP-MS, NexION 350x, Perkin Elmer, Waltham, MA, USA). The analytical quality was checked using blanks and the certified reference material IAEA-336 “Lichen”. PTE accumulation was expressed as the ratio of the concentration in exposed samples to that of unexposed ones (EU ratio) [42].

2.5. Statistical Analysis

To disentangle any differences in the biomonitoring of MF and PTE accumulation, a linear mixed-effects model (LMEM) was fitted, with the organism as a fixed factor and the site as a random factor. For model validation, scatterplots of the residuals against the explanatory variable and the fitted values were used to check for linearity and homoscedasticity, respectively, and normal probability (qqnorm) plots were used to check for normality since there is evidence that graphical methods are more informative than formal tests [48]. Significance of the models was checked with type II Anova (analysis of deviance) using the Wald chi-square test. Correlations between MFs and PTEs were checked with Spearman’s test and significant differences were assessed using the Mann–Whitney test. All statistical calculations were performed using the free R software 4.4.1 [49].

3. Results

Control (unexposed) samples had 1 ± 1 MF/g for the moss and 1.3 ± 0.7 MF/g for the lichen, corresponding to 10 ± 5 MF/m2 for the moss and 83 ± 83 MF/m2 for the lichen.
In samples retrieved after 77 days of exposure in the urban area of Siena (Table 1), in total, 145 MFs were detected (Figure 2), with an average per site of 8.3 ± 1.2 MFs in moss and 6.1 ± 1.1 MFs in lichen samples. On a mass basis, moss accumulated 2.8 ± 0.4 MF/g and the lichen 2.0 ± 0.4 MF/g, while on a surface basis, moss accumulated 20 ± 3 MF/m2 and lichen 169 ± 31 MF/m2. The MF length ranged 114–4530 µm in moss and 64–4470 µm in lichen, with a mean value of 1240 ± 100 µm and 1326 ± 122 µm, respectively. Statistically significant differences between the moss and lichen data emerged only for surface-based data, with higher values for the lichen (Mann–Whitney test: z = 3.60 p < 0.05). Irrespective of the metric, the moss and lichen data were strongly correlated (Spearman’s test: r = 0.85 p < 0.05; Figure 3).
The polymer types identified in MFs accumulated by the moss samples included 47% PET, 18% PP, 12% PE, 6% polyamide (PA), 6% high density polyethylene (HDPE), 6% polyvinyl chloride (PVC), and 6% polyurethane (PU), while MFs in lichen samples included 65% PET, 17% PP, 6% PE, 6% PS, and 6% polyacrylonitrile (PAN) (Figure 4). The difference in the number of polymer types accumulated by the moss and lichen may reflect their specific surface area, but it more likely reflects intersite variation in transplant exposures.
The accumulation of PTEs, expressed as EU ratios, was found to be significantly (Mann–Whitney test: p < 0.05) higher in mosses compared to lichens, with the only exception of Cd, which was higher in lichens (Table 2).
Microfibers showed no statistically significant correlation with PTEs for either mosses or lichens.

4. Discussion

In a study conducted in rural areas of Central Italy with in situ samples (i.e., not transplants), mosses showed significantly higher MF concentrations than lichens, with 14.5 MF/g and 9.7 MF/g, respectively, and we concluded that these differences could be due to the influence of natural positioning (horizontal soil vs. vertical tree trunks) and possibly also age, i.e., exposure time [37]. To evaluate the real efficacy of mosses and lichens as biomonitors for the deposition of airborne MFs, a transplant experiment was conducted in this study, exposing both organisms inside cotton bags side by side for 77 days across 10 urban sites, reflecting a range in anthropogenic intensity. The results showed that the total net accumulation of MFs after accounting for MFs present in unexposed samples was similar (83 vs. 70 MFs). In concert, a study in Naples (Southern Italy) found 102 ± 24 and 87 ± 17 MFs accumulated by moss and lichen transplants, respectively, exposed for six weeks [39]. Similarly in the study in Naples, although a higher amount of MFs was found on moss, the difference was not statistically significant. As such, we can argue that in absolute MFs terms, all factors being equal, the ability of mosses and lichens to accumulate airborne MFs is similar. Furthermore, we reached the same conclusion expressing MF data on a mass basis. However, results were different when MF data were expressed on a surface area basis since the surface/mass ratio of moss is much higher (i.e., the same biomass has a higher surface), leading to a lower MF content per unit surface area in the moss group. Since accumulated MFs are essentially MFs that are intercepted and retained by the moss or the lichen, it may be suggested that while the ability to retain MFs may depend upon a wide array of factors such as habitus, structure, external layer, etc., the surface that can intercept airborne MFs plays a fundamental role; thus, the expression of the data on a surface area basis is recommended. Irrespective of the metric used to represent the data, the strong correlation found between the moss and lichen data is a good indication that both biomonitors work well and provide the same qualitative information.
It is noteworthy that the mass/surface ratio of the moss Hypnum cupressiforme (0.135 g/m2) reported by [46] is identical to that of P. purum calculated here; this is probably due to the almost identical habitus of the two species. The mass/surface ratio of the lichen E. prunastri calculated by us (0.012 g/m2), despite a similar habitus, is about half of that of the lichen Pseudevernia furfuracea (0.026 g/m2) reported by [46]; however, to check the quality of our measure, we also calculated the mass/surface ratio for P. furfuracea, and we obtained a values of 0.023 g/m2, which is consistent with the value reported by [46].
One study, focusing on the biomonitors’ ability to accumulate MFs and performed in Naples, found that the bag enclosing the moss (H. cupressiforme) and lichen (P. furfuracea) samples trapped a large amount of MFs, and the naked samples roughly accumulated a similar total of MFs accumulated by the biomonitors plus the net [39]. This result is logical since MF deposition is, at least largely, a merely passive process. However, it should be noted that the mesh size of the bagging net used by [39] was 2 mm, while our bags had a much wider mesh size of 1 cm. Nevertheless, also in our study, MF interception by the bag is likely since the amount of MFs detected in the exposed samples was modest. In fact, a study conducted in urban parks in Siena using tree leaves [45] reported an average MF deposition of 7.1 ± 0.6 MF/g, corresponding to 600 ± 53 MF/m2, which is higher than the values observed in our study (on average 2.3–2.8 MF/g and 20–194 MF/m2). Moreover, in our study, the deployment of samples below the tree canopy may have caused a shielding effect that could have affected the deposition of MFs since plant canopy can affect air circulation around the biomonitor’s surface [41], and the leaves may have acted as biomonitors themselves, collecting MPs [45], with dynamic fluctuations contributing to the process [50]. As a last issue for consideration, since the length of MFs accumulated was not different between the two biomonitors, as already observed for the same species in their natural environment [37]; considering that the longest fiber measured in our samples was about 4.5 mm, the mesh size of 1 cm was large enough to allow MFs to be deposited on the samples without being necessarily intercepted by the bagging net. However, this issue has not been approached experimentally and cannot be evaluated properly.
Contrary to MFs, the moss and lichen showed a differential accumulation of PTEs, with the moss presenting higher levels for all elements but Cd (see Supplementary Materials). It should be noted that using the same metric, i.e., the EU ratio, for MFs, the moss also showed a statistically significant higher accumulation. However, the use of this metric for MFs may be questionable since MFs are xenobiotics, i.e., artificial substances foreign to living organisms, and a “natural” background for MFs is not reasonable.
Interestingly, none of the investigated PTEs showed any significant correlation with MFs, suggesting that their sources are different. Given the lack of industrial areas in Siena, the only known local sources of air pollution by PTEs are from heating systems and vehicle traffic. It is important to remark that since our focus was on MFs with a visual detection limit of about 50 µm in this study, we did not identify traffic-related microplastics such as tire wear particles or nanoplastics, with the former reported in Siena [45].
We suggest that in our study, the source of MFs was related to the use of synthetic clothes and plastic materials by people. This is confirmed also by the fact that the predominant polymer type of MFs was PET, also known as polyester, accounting for 47% in mosses and 65% in lichens, since PET is the most commonly used thermoplastic polymer in the textile industry and food packaging [51]. This is consistent with the study in Siena that used tree leaves as biomonitors of airborne MPs [45], which also showed that PET was the main plastic polymer.

5. Conclusions

This study compared the ability of the moss P. purum and the lichen E. prunastri to accumulate MFs under the same exposure conditions when transplanted across sites reflecting a range in anthropogenic intensity. The results showed similar amounts of MFs accumulated by both biomonitors, both as counts and on a mass basis, but when expressed on a surface area basis, the data showed much higher values for lichens. Based on the strong correlation between the moss and lichen data, it can thus be concluded that although the metric determines the outcome, both biomonitors work quantitatively well, but lichens should be preferred since a higher sensitivity is a valuable feature. Moreover, surface-based data, given a known exposure time, are ideal to estimate deposition rates. MFs accumulated by the both moss and lichen samples were dominated by PET and PP polymers, suggesting that the main source of airborne MFs is related to the use of synthetic textiles and single-use plastic materials. No association at all emerged between MFs and PTEs, suggesting that their sources are different. Overall, our results suggest that both lichen and moss transplants can be effectively used as low-cost monitoring tools for atmospheric MFs in urban areas, thus supporting the sustainable development goal of clean air.

Supplementary Materials

The following supporting information can be downloaded at the following website: https://www.mdpi.com/article/10.3390/su17020537/s1, Table S1: Trace elements concentration (mg/kg) for control and exposed (S1–S10) moss transplants; Table S2: Trace elements concentration (mg/kg) for control and exposed (S1–S10) lichen transplants.

Author Contributions

Conceptualization, S.L.; methodology, L.G., M.J. and J.A.; formal analysis, L.G., M.J. and S.L.; investigation, L.G., M.J., N.S.L.C. and A.R.; data curation, L.G., M.J., J.A. and S.L.; writing—original draft preparation, L.G. and M.J.; writing—review and editing, S.L. and J.A.; supervision, S.L. and J.A. All authors have read and agreed to the published version of the manuscript.

Funding

This research was supported by INGV Project “Pianeta Dinamico” (Ministry of University and Research), research line 2023–2025 “CHIOMA”, Cultural Heritage Investigations and Observations: a Multidisciplinary Approach (CUP D53J19000170001).

Institutional Review Board Statement

Not applicable.

Informed Consent Statement

Not applicable.

Data Availability Statement

Data are contained within the article.

Acknowledgments

The authors thank their colleagues from the Lab of Applied Plant Sciences of the University of Siena for the collaboration.

Conflicts of Interest

The authors declare no conflicts of interest.

References

  1. Velis, C.A.; Lerpiniere, D.; Tsakona, M. Prevent Marine Plastic Litter-Now. An ISWA Facilitated Partnership to Prevent Marine Litter, With a Global Call to Action for Investing in Sustainable Waste and Resources Management Worldwide. Report Prepared on Behalf of the International Solid Waste Association (ISWA). An Output of ISWA Marine Litter Task Force, Vienna. 2017. Available online: https://www.eawag.ch/fileadmin/Domain1/Abteilungen/sandec/E-Learning/Moocs/Solid_Waste/Further_resources/Week_4/prevent_marine_plastic_litter_iswa.pdf (accessed on 19 October 2024).
  2. Geyer, R.; Jambeck, J.R.; Law, K.L. Production, use, and fate of all plastics ever made. Sci. Adv. 2017, 3, e1700782. [Google Scholar] [CrossRef]
  3. Lamichhane, G.; Acharya, A.; Marahatha, R.; Modi, B.; Paudel, R.; Adhikari, A.; Raut, B.K.; Aryal, S.; Parajuli, N. Microplastics in environment: Global concern, challenges, and controlling measures. Int. J. Environ. Sci. Technol. 2023, 20, 4673–4694. [Google Scholar] [CrossRef] [PubMed]
  4. Hidalgo-Ruz, V.; Gutow, L.; Thompson, R.C.; Thiel, M. Microplastics in the marine environment: A review of the methods used for identification and quantification. Environ. Sci. Technol. 2012, 46, 3060–3075. [Google Scholar] [CrossRef]
  5. Andrady, A.L. Microplastics in the marine environment. Mar. Pollut. Bull. 2011, 62, 1596–1605. [Google Scholar] [CrossRef] [PubMed]
  6. Fowler, C.W. Marine debris and northern fur seals: A case study. Mar. Pollut. Bull. 1987, 18, 326–335. [Google Scholar] [CrossRef]
  7. Carpenter, E.J.; Smith, K.L., Jr. Plastics on the Sargasso Sea surface. Science 1972, 175, 1240–1241. [Google Scholar] [CrossRef] [PubMed]
  8. Coe, J.; Rogers, D. Marine Debris Sources, Impacts, and Solutions; Springer: New York, NY, USA, 1996. [Google Scholar]
  9. Horton, A.A.; Walton, A.; Spurgeon, D.J.; Lahive, E.; Svendsen, C. Microplastics in freshwater and terrestrial environments: Evaluating the current understanding to identify the knowledge gaps and future research priorities. Sci. Total Environ. 2017, 586, 127–141. [Google Scholar] [CrossRef]
  10. Surendran, U.; Jayakumar, M.; Raja, P.; Gopinath, G.; Chellam, P.V. Microplastics in terrestrial ecosystem: Sources and migration in soil environment. Chemosphere 2023, 318, 137946. [Google Scholar] [CrossRef] [PubMed]
  11. Evangeliou, N.; Grythe, H.; Klimont, Z.; Heyes, C.; Eckhardt, S.; Lopez-Aparicio, S.; Stohl, A. Atmospheric transport is a major pathway of microplastics to remote regions. Nat. Commun. 2020, 11, 3381. [Google Scholar] [CrossRef] [PubMed]
  12. Zylstra, E.R. Accumulation of wind-dispersed trash in desert environments. J. Arid Environ. 2013, 89, 13–15. [Google Scholar] [CrossRef]
  13. Dris, R.; Gasperi, J.; Saad, M.; Mirande, C.; Tassin, B. Synthetic fibers in atmospheric fallout: A source of microplastics in the environment? Mar. Pollut. Bull. 2016, 104, 290–293. [Google Scholar] [CrossRef]
  14. Li, L.; Luo, Y.; Peijnenburg, W.J.; Li, R.; Yang, J.; Zhou, Q. Confocal measurement of microplastics uptake by plants. MethodsX 2020, 7, 100750. [Google Scholar] [CrossRef]
  15. Capozzi, F.; Granata, A.; Gaglione, A.; Gargiulo, T.; Rallo, A.; Marino, F.; Sorrentino, M.C.; Pironti, C.; Vergara, A.; Spagnuolo, V.; et al. Sequential extraction of anthropogenic microfibers from the leaves of Pittosporum tobira. Chemosphere 2024, 367, 143628. [Google Scholar] [CrossRef] [PubMed]
  16. Carlin, J.; Craig, C.; Little, S.; Donnelly, M.; Fox, D.; Zhai, L.; Walters, L. Microplastic accumulation in the gastrointestinal tracts in birds of prey in central Florida, USA. Environ. Pollut. 2020, 264, 114633. [Google Scholar] [CrossRef] [PubMed]
  17. Leslie, H.A.; van Velzen, M.J.M.; Brandsma, S.H.; Vethaak, A.D.; Garcia-Vallejo, J.J.; Lamoree, M.H. Discovery and quantification of plastic particle pollution in human blood. Environ. Int. 2022, 163, 107199. [Google Scholar] [CrossRef] [PubMed]
  18. Çobanoğlu, H.; Belivermiş, M.; Sıkdokur, E.; Kılıç, Ö.; Çayır, A. Genotoxic and cytotoxic effects of polyethylene microplastics on human peripheral blood lymphocytes. Chemosphere 2021, 272, 129805. [Google Scholar] [CrossRef]
  19. Roblin, B.; Aherne, J. Moss as a biomonitor for the atmospheric deposition of anthropogenic microfibres. Sci. Total Environ. 2020, 715, 136973. [Google Scholar] [CrossRef]
  20. Cai, L.; Wang, J.; Peng, J.; Tan, Z.; Zhan, Z.; Tan, X.; Chen, Q. Characteristic of microplastics in the atmospheric fallout from Dongguan city, China: Preliminary research and first evidence. Environ. Sci. Pollut. Res. 2017, 24, 24928–24935. [Google Scholar] [CrossRef] [PubMed]
  21. Din, K.S.; Khokhar, M.F.; Butt, S.I.; Qadir, A.; Younas, F. Exploration of microplastic concentration in indoor and outdoor air samples: Morphological, polymeric, and elemental analysis. Sci. Total Environ. 2024, 908, 168398. [Google Scholar] [CrossRef]
  22. Zhang, C.; Wang, S.; Sun, D.; Pan, Z.; Zhou, A.; Xie, S.; Wang, J.; Zou, J. Microplastic pollution in surface water from east coastal areas of Guangdong, South China and preliminary study on microplastics biomonitoring using two marine fish. Chemosphere 2020, 256, 127202. [Google Scholar] [CrossRef]
  23. Plastics Europe. Plastics the Facts 2019. An Analysis of European Plastics Production, Demand and Waste Data; Plastics Europe; Association of Plastic Manufacturers: Brussels, Belgium, 2019; Available online: https://plasticseurope.org/wp-content/uploads/2021/10/2019-Plastics-the-facts.pdf (accessed on 19 October 2024).
  24. Branquinho, C.; Catarino, F.; Brown, D.H.; Pereira, M.J.; Soares, A. Improving the use of lichens as biomonitors of atmospheric metal pollution. Sci. Total Environ. 1999, 232, 67–77. [Google Scholar] [CrossRef]
  25. Abas, A. A systematic review on biomonitoring using lichen as the biological indicator: A decade of practices, progress and challenges. Ecol. Indic. 2021, 121, 107197. [Google Scholar] [CrossRef]
  26. Nimis, P.L.; Andreussi, S.; Pittao, E. The performance of two lichen species as bioaccumulators of trace metals. Sci. Total Environ. 2001, 275, 43–51. [Google Scholar] [CrossRef] [PubMed]
  27. Al-Radady, A.S.; Davies, B.E.; French, M.J. A new design of moss bag to monitor metal deposition both indoors and outdoors. Sci. Total Environ. 1993, 133, 275–283. [Google Scholar] [CrossRef]
  28. Vukovic, G.; Urosevic, M.A.; Goryainova, Z.; Pergal, M.; Skrivanj, S.; Samson, R.; Popovic, A. Active moss biomonitoring for extensive screening of urban air pollution: Magnetic and chemical analyses. Sci. Total Environ. 2015, 521–522, 200–210. [Google Scholar] [CrossRef] [PubMed]
  29. DoŁęgowska, S.; Migaszewski, Z.M. PAH concentrations in the moss species Hylocomium splendens (Hedw.) BSG and Pleurozium schreberi (Brid.) Mitt. from the Kielce area (south-central Poland). Ecotoxicol. Environ. Saf. 2011, 74, 1636–1644. [Google Scholar] [CrossRef] [PubMed]
  30. Landis, M.S.; Berryman, S.D.; White, E.M.; Graney, J.R.; Edgerton, E.S.; Studabaker, W.B. Use of an epiphytic lichen and a novel geostatistical approach to evaluate spatial and temporal changes in atmospheric deposition in the Athabasca Oil Sands Region, Alberta, Canada. Sci. Total Environ. 2019, 692, 1005–1021. [Google Scholar] [CrossRef] [PubMed]
  31. Uribe, D.M.; Ortega, L.M.; Grassi, M.T.; Dolatto, R.G.; Sánchez, N.E. Lichens as bio-monitors of polycyclic aromatic hydrocarbons: Measuring the impact of features and traffic patterns. Heliyon 2023, 9, e20087. [Google Scholar] [CrossRef] [PubMed]
  32. Root, H.T.; Jovan, S.; Fenn, M.; Amacher, M.; Hall, J.; Shaw, J.D. Lichen bioindicators of nitrogen and sulfur deposition in dry forests of Utah and New Mexico, USA. Ecol. Indic. 2021, 127, 107727. [Google Scholar] [CrossRef]
  33. Delves, J.; Lewis, J.E.J.; Ali, N.; Asad, S.A.; Chatterjee, S.; Crittenden, P.D.; Jones, M.; Kiran, A.; Pandey, B.P.; Reay, D.; et al. Lichens as spatially transferable bioindicators for monitoring nitrogen pollution. Environ. Pollut. 2023, 328, 121575. [Google Scholar] [CrossRef]
  34. Špirić, Z.; Stafilov, T.; Vučković, I.; Glad, M. Study of nitrogen pollution in Croatia by moss biomonitoring and Kjeldahl method. J. Environ. Sci. Health A Tox. 2014, 49, 1402–1408. [Google Scholar] [CrossRef]
  35. Rühling, A.; Tyler, G. Sorption and retention of heavy metals in the woodland moss Hylocomium splendens (Hedw). Oikos 1970, 21, 92–97. [Google Scholar] [CrossRef]
  36. Berg, T.; Royset, O.; Steinnes, E. Moss (Hylocomium splendens) used as biomonitor of atmospheric trace-element deposition-Estimation of uptake efficiencies. Atmos. Environ. 1995, 29, 353–360. [Google Scholar] [CrossRef]
  37. Jafarova, M.; Grifoni, L.; Aherne, J.; Loppi, S. Comparison of lichens and mosses as biomonitors of airborne microplastics. Atmosphere 2023, 14, 1007. [Google Scholar] [CrossRef]
  38. Bertrim, C.; Aherne, J. Moss Bags as Biomonitors of Atmospheric Microplastic Deposition in Urban Environments. Biology 2023, 12, 149. [Google Scholar] [CrossRef] [PubMed]
  39. Capozzi, F.; Sorrentino, M.C.; Granata, A.; Vergara, A.; Alberico, M.; Rossi, M.; Spagnuolo, V.; Giordano, S. Optimizing moss and lichen transplants as biomonitors of airborne anthropogenic microfibers. Biology 2023, 12, 1278. [Google Scholar] [CrossRef] [PubMed]
  40. Jafarova, M.; Contardo, T.; Aherne, J.; Loppi, S. Lichen biomonitoring of airborne microplastics in Milan (N Italy). Biology 2022, 11, 1815. [Google Scholar] [CrossRef] [PubMed]
  41. Loppi, S.; Roblin, B.; Paoli, L.; Aherne, J. Accumulation of airborne microplastics in lichens from a landfill dumping site (Italy). Sci. Rep. 2021, 11, 4564. [Google Scholar] [CrossRef] [PubMed]
  42. Cecconi, E.; Fortuna, L.; Benesperi, R.; Bianchi, E.; Brunialti, G.; Contardo, T.; Nuzzo L di Frati, L.; Monaci, F.; Munzi, S.; Nascimbene, J.; et al. New interpretative scales for lichen bioaccumulation data: The italian proposal. Atmosphere 2019, 10, 136. [Google Scholar] [CrossRef]
  43. Capozzi, F.; Giordano, S.; Aboal, J.R.; Adamo, P.; Bargagli, R.; Boquete, T.; Di Palma, A.; Real, C.; Reski, R.; Spagnuolo, V.; et al. Best options for the exposure of traditional and innovative moss bags: A systematic evaluation in three European countries. Environ. Pollut. 2016, 214, 362–373. [Google Scholar] [CrossRef] [PubMed]
  44. Wayne, R. ImageJ; US National Institutes of Health: Bethesda, MD, USA, 2011; Available online: https://imagej.net/ij/ (accessed on 19 October 2024).
  45. Jafarova, M.; Grifoni, L.; Renzi, M.; Bentivoglio, T.; Anselmi, S.; Winkler, A.; Di Lella, L.A.; Spagnuolo, L.; Aherne, J.; Loppi, S. Robinia pseudoacacia L. (Black Locust) Leaflets as Biomonitors of Airborne Microplastics. Biology 2023, 12, 1456. [Google Scholar] [CrossRef] [PubMed]
  46. Capozzi, F.; Sorrentino, M.C.; Di Palma, A.; Mele, F.; Arena, C.; Adamo, P.; Spagnuolo, V.; Giordano, S. Implication of vitality, seasonality and specific leaf area on PAH uptake in moss and lichen transplanted in bags. Ecol. Indic. 2020, 108, 105727. [Google Scholar] [CrossRef]
  47. Cowger, W.; Steinmetz, Z.; Gray, A.; Munno, K.; Lynch, J.; Hapich, H.; Primpke, S.; De Frond, H.; Rochman, C.; Herodotou, O. Microplastic Spectral Classification Needs an Open Source Community: Open Specy to the Rescue! Anal. Chem. 2021, 93, 7543–7548. [Google Scholar] [CrossRef]
  48. Dobson, A.J. An Introduction to Generalized Linear Models, 2nd ed.; Chapman and Hall/CRC: New York, NY, USA, 2001. [Google Scholar] [CrossRef]
  49. R Core Team. R: A Language and Environment for Statistical Computing; R Foundation for Statistical Computing: Vienna, Austria, 2024; Available online: https://www.R-project.org/ (accessed on 19 October 2024).
  50. Jiao, M.; Wang, Y.; Yang, F.; Zhao, Z.; Wei, Y.; Li, R.; Wang, Y. Dynamic fluctuations in plant leaf interception of airborne microplastics. Sci. Total Environ. 2024, 906, 167877. [Google Scholar] [CrossRef]
  51. De Vos, L.; Van de Voorde, B.; Van Daele, L.; Dubruel, P.; Van Vlierberghe, S. Poly (alkylene terephthalate) s: From current developments in synthetic strategies towards applications. Eur. Polym. J. 2021, 161, 110840. [Google Scholar] [CrossRef]
Figure 1. (A) Location of the province of Siena, Central Italy. (B) Deployment sites (n = 10) for lichen and moss transplants across the city of Siena with coordinates (latitude and longitude in decimal degrees).
Sustainability 17 00537 g001
Figure 2. Images of MFs extracted from moss (A) and lichen (B) transplants.
Sustainability 17 00537 g002
Figure 3. Correlation (Spearman’s R) between the number of MFs accumulated (count) by the lichen and moss at the 10 study sites (Table 1).
Sustainability 17 00537 g003
Figure 4. Proportion (%) of microfiber polymer types accumulated by the moss (A) and lichen (B) samples.
Sustainability 17 00537 g004
Table 1. Total amount of microfibers (count), microfibers by mass (mean ± standard error), microfibers by surface area (mean ± standard error), minimum (min) and maximum (max) microfiber length of moss and lichen samples exposed for 77 days at 10 urban sites in Siena, Central Italy.
SiteCountMass
(MF/g ± SE)
Surface Area
(MF/g ± SE)
Fiber Length
(μm)
MossLichenMossLichenMossLichenMossLichen
S1622.0 ± 0.80.7 ± 0.715 ± 656 ± 56114–9661082–1923
S2872.7 ± 0.92.3 ± 1.320 ± 7194 ± 111551–2340430–3500
S3662.0 ± 0.62.0 ± 0.215 ± 4167 ± 17581–3671426–1156
S41083.3 ± 1.22.7 ± 0.725 ± 9222 ± 56665–4530393–2070
S5451.3 ± 0.71.7 ± 1.710 ± 5139 ± 139461–2740722–3800
S6872.7 ± 1.32.3 ± 0.920 ± 10194 ± 73404–2870533–2017
S71264.0 ± 2.02.0 ± 1.230 ± 15167 ± 96290–2200562–4067
S8953.0 ± 1.51.7 ± 1.222 ± 11139 ± 100253–2294462–2866
S916145.3 ± 0.94.7 ± 1.740 ± 7389 ± 139285–3526320–4470
S10210.7 ± 0.30.3 ± 0.35 ± 228 ± 28394–12401427
Table 2. Accumulation (EU) ratios (mean ± standard error) of potentially toxic elements in the moss and lichen samples co-exposed for 77 days at 10 urban sites in Siena, Central Italy.
AlBaCdCrCuFeSbZn
Lichen0.80 ± 0.040.90 ± 0.021.23 ± 0.070.94 ± 0.031.08 ± 0.040.91 ± 0.800.44 ± 0.091.04 ± 0.04
Moss2.03 ± 0.192.07 ± 0.060.90 ± 0.052.14 ± 0.071.91 ± 0.082.10 ± 0.071.47 ± 0.331.72 ± 0.07
Disclaimer/Publisher’s Note: The statements, opinions and data contained in all publications are solely those of the individual author(s) and contributor(s) and not of MDPI and/or the editor(s). MDPI and/or the editor(s) disclaim responsibility for any injury to people or property resulting from any ideas, methods, instructions or products referred to in the content.

