Article

The Impact of the Convergence of Advanced Manufacturing and Modern Services on Green Innovation Efficiency

1
College of Economics and Management, Nanjing University of Aeronautics and Astronautics, Nanjing 211106, China
2
College of Economics, Nankai University, Tianjin 300071, China
3
College of Management Engineering, Qingdao University of Technology, Qingdao 266525, China
*
Author to whom correspondence should be addressed.
Sustainability 2025, 17(2), 492; https://doi.org/10.3390/su17020492
Submission received: 11 December 2024 / Revised: 1 January 2025 / Accepted: 7 January 2025 / Published: 10 January 2025

Abstract

:
Cross-region and cross-industry cooperation has become a key driver of industrial transformation. Advanced manufacturing is boosting the modern service industry and fostering innovation and development, while the modern service industry is promoting advanced manufacturing and stimulating the market demand. The convergence of advanced manufacturing and modern services (CAMMS) is a key driver of environmental innovation in China’s modern economy. This study explores the impact of CAMMS on green innovation efficiency and its spatial correlations. Employing a two-way fixed-effect model, along with the mediating-effect model and the spatial Durbin model (SDM), we analyze Chinese provincial panel data from 2006 to 2021 to explore the effects of CAMMS on green innovation efficiency and its spatial spillover effects. Our findings reveal the following: (1) CAMMS significantly enhances green innovation efficiency. (2) Optimizing industrial structure and improving factor allocation are the primary mechanisms through which CAMMS promotes green innovation efficiency. (3) The CAMMS mechanism positively influences spatial spillover effects on green innovation efficiency, with these effects becoming more pronounced in the eastern region and after 2011. (4) Finally, due to increasing information transmission costs and local protectionism, the “spillover effect” of CAMMS on green innovation efficiency has geographical boundaries. This study contributes to the literature by providing valuable insights for future practices in CAMMS and green innovation strategies in China. This also provides strong support for the local economy to achieve green transformation and sustainable development.

1. Introduction

Over forty years of development since the implementation of the reform and opening-up policy, China’s economy has achieved substantial and rapid expansion, establishing itself as a key driver of the global economy. Its gross domestic product (GDP) drastically increased from CNY 367.9 billion in 1978 to CNY 114.37 trillion in 2021, with an average annual growth rate of 14.62%. This achievement is noteworthy. However, since 2006, China has been a major source of global carbon dioxide emissions, comprising about 27% of the global total as of 2021. This fact highlights the persistent environmental and resource issues caused by high energy consumption and high pollution emissions despite the country’s rapid economic growth (Yu et al., 2023) [1]. At the 75th United Nations General Assembly, the Chinese government committed to peaking carbon dioxide emissions before 2030 and achieving carbon neutrality by 2060, thereby indicating the urgent need for China to move toward green transformation and green development.
Green innovation can promote dual benefits for the economy and ecology by providing sustained momentum for green development and support for economic green transition (Xie & Jamaani, 2022) [2]. “The 14th Five-Year Plan of the People’s Republic of China for National Economic and Social Development and the Outline of the Vision for 2035” proposes strategic goals to support green technological innovation. Studies have shown that China’s green innovation efficiency, a key indicator in evaluating the effectiveness of energy conservation and emission reduction (Miao et al., 2021) [3], remains relatively low with significant regional disparities (Tan et al., 2022) [4]. In light of the “dual carbon” goals, both the academe and the government are exploring effective ways to improve the country’s green innovation efficiency from different perspectives, thereby offering substantive recommendations.
The key to achieving green innovation is to modify industrial methods and build a modern industrial system (Qiu et al., 2023) [5]. Promoting the deep integration of manufacturing and services has long been a fundamental strategy for adjusting China’s industrial structure (Zhou, 2003) [6]. Industrial convergence arises from technological advancements and relaxed regulations, which in turn reduce industry barriers, change competitive dynamics among enterprises, and blur industry boundaries. Due to rapid digitalization and advancements in smart technologies in recent years, the manufacturing industry has undergone unprecedented transformation and upgrading (Wang et al., 2022) [7]. As such, the new wave of technological revolution has been driving the deep convergence of advanced manufacturing and modern services (CAMMS), which is characterized by high technology and knowledge, marking a new trend in modern industrial development (Wang et al., 2024) [8].
Advanced manufacturing is focused on intelligent production and precise management, while the modern service industry offers technical support, research, consultation, data analytics, and other related assistance. With a clear but interdependent division of labor between advanced manufacturing and the modern service industry, they promote the coordinated development of both upstream and downstream segments of the industrial chain. In this process, on the one hand, advanced manufacturing requires support from the modern service industry to enhance its technical capabilities and competitiveness; on the other hand, the scientific and technological service sector depends on the demands of advanced manufacturing to expand its market. As a result, a dynamic and coordinated development relationship has been established between them. CAMMS is a key trend in current economic development, indicating deep interaction between manufacturing and services. In 2019, the National Development and Reform Commission and 15 other departments jointly issued the “implementation opinions on promoting the deep convergence of advanced manufacturing and modern services”, which outlined specific measures to facilitate industrial convergence through market orientation and innovation-driven approaches. CAMMS has also introduced new models for industrial development, thereby becoming a critical breakthrough and pathway for addressing the lack of green innovation in China.
Compared to general innovation, green innovation relies heavily on the exchange of interdisciplinary knowledge (Dangelico & Pujari, 2010) [9]. CAMMS fosters this environment by emphasizing intelligent production and precise management in advanced manufacturing, while the technology service sector provides essential technical support, research consulting, and data analysis services (Wang et al., 2023) [10]. Such interaction promotes the cross-fertilization of specialized knowledge in high-end fields and enhances the coordinated development of the industrial chain’s upstream and downstream segments. CAMMS can enhance resource efficiency in production, minimize energy waste and emissions, and drive the manufacturing sector’s shift towards greener, smarter, and low-carbon practices.
To date, many scholars have examined the convergence of manufacturing and services, as well as the service-oriented transformation within the manufacturing sector. Their findings indicate that these trends contribute to production efficiency (Wang & Han, 2023) [11], economic development (Dong & Li, 2024) [12], income growth (Yang et al., 2023) [13], and increased innovation capacity (Soellner et al., 2024) [14], as well as improved environmental efficiency (Dong et al., 2021, Wang et al., 2021) [15,16]. Nonetheless, research on the green innovation effects resulting from CAMMS, particularly from the perspective of the high-end industrial chain, remains relatively scarce.
To fill existing research gaps, this study analyzes provincial data from China from 2006 to 2021, thus integrating CAMMS and green innovation efficiency into a unified analytical framework. This work examines the impact, mechanisms, and spatial spillovers of CAMMS on green innovation efficiency. Our study contributes to the existing literature in the following aspects. First, as a representative modern industrial system within an emerging economy, China’s industrial structure, innovation model, and pollution emission intensity differ from those of developed countries. Consequently, whether the dual goals of CAMMS development and green innovation can be achieved simultaneously remains a topic worthy of exploration, along with the nature of their relationship. A comprehensive indicator system for CAMMS development is developed in this study. Based on this effort, a nonparametric stochastic frontier model and a coupled coordination model are applied to measure CAMMS by using provincial data of China for in-depth analysis. We also aim to clarify the mechanisms and pathways through which CAMMS influences green innovation efficiency. Our research also provides valuable policy recommendations for developing countries that are seeking a win–win situation for achieving economic development and environmental sustainability.
This study provides a new perspective to reveal the path for CAMMS to affect green innovation efficiency, with an emphasis on spatial spillover effects. This methodology goes beyond the theoretical analysis of the existing research. In addition, due to rising information transmission costs and the impact of local protectionism, spatial effects vary with increasing distances between regions. Thus, the present paper conducts an empirical study on the attenuation boundaries of spatial spillover effects. The findings enhance our understanding of the spatial effects of CAMMS on green innovation efficiency, while also providing strong support achieving long-term environmental protection and social sustainable development goals.
The remainder of this paper is structured as follows: Section 2 presents the literature review and hypothesis development, Section 3 outlines the methodology and data, and Section 4 presents the empirical results, revealing how CAMMS affects green innovation efficiency. Finally, our conclusions and policy implications are presented in Section 5.

2. Literature Review and Hypothesis Development

2.1. Literature Review

2.1.1. Research on CAMMS

The concept of “industrial convergence” was first discussed academically by Rosenberg (1963) [17], who observed that as the American machinery manufacturing industry evolved, its general skills were applied across various sectors, thus creating technological interconnections and giving rise to “technological convergence”. In the Industry 4.0 era, the deep integration of modern communication technologies (e.g., digital information) with manufacturing has redefined production characteristics and labor division and accelerated industrial chain evolution (Sony et al., 2023) [18]. Geum et al. (2016) [19] suggested that industrial convergence is a result of industries becoming interconnected through distinct structures of products, participants, knowledge, technology, and demand. As a new economic phenomenon, industrial convergence fosters the mutual integration and expansion of technology, products, and services across industries, thereby generating network effects (Kim et al., 2015) [20]. The integration of manufacturing and service industries has become a common phenomenon of cross-border integration (Crozet & Milet, 2017) [21]. Tian et al. (2023) [22] proposed that promoting industrial convergence, particularly in high-end segments, is essential for building an internationally competitive industrial system, especially considering the recent wave of scientific and technological reforms. Modern services, characterized by high added value, can provide new growth points for advanced manufacturing (Yang et al., 2021) [23]. Conversely, the standardized operations of advanced manufacturing offer management experience and modern equipment to modern services (Di Berardino & Onesti, 2020) [24]. This bidirectional relationship fosters a comprehensive network effect that enables knowledge and information exchange, reduces transaction costs, and plays a vital role in the development of a new economic system.
Currently, there is no unified standard for measuring industrial convergence. Early research indicates that integration generally depends on a common technological foundation among industries. Thus, scholars have attempted to use patent data to estimate the level of industrial convergence, mainly using metrics, such as the Herfindahl index (Gambardella & Torrisi, 1998) [25] and patent correlation coefficients (Tunzelmann, 2001) [26]. Meanwhile, other researchers have approached industrial convergence by analyzing supply and demand relationships among industries and calculating the share of intermediate inputs in total output using input–output tables, resulting in a method known as the input–output approach (Dong et al., 2021) [27]. However, since China’s input–output tables are published every five years, thereby restricting data continuity, some scholars have turned to coupling coordination models from physics for their studies (Cao et al., 2020) [28]. However, these models often fail to accurately represent industrial integration as an interactive and dynamic process. Xie (2012) introduced the concept of “technical efficiency” from stochastic frontier analysis to the study of industrial integration, specifically measuring the level of integration between the industrial and information sectors [29]. This distinctive approach accounts for discrepancies between actual conditions and ideal levels of industrial convergence.

2.1.2. Research on CAMMS and Green Innovation Efficiency

Thus far, few studies have focused on the effects of CAMMS on green innovation efficiency. This research on CAMMS and green innovation efficiency can be categorized into two primary sections. The first section examines the innovation effects of CAMMS. Many countries have eased regulations on such sectors as broadcasting, television, telecommunications, and the Internet, thereby fostering the integration between multiple industries (Iosifidis, 2011) [30]. The most notable benefit of successfully implementing “Triple Play” reform (TPR) in France is the enhancement of the quality of life for its citizens. In fact, TPR has not only lowered the service-accessing costs but also boosted the economic vitality of France (Crampes & Hollander, 2006) [31]. Several studies suggest that service transformation enables companies to swiftly understand customer needs and expand information sources. This process disrupts the traditional factor structure, innovation system, and organizational framework of manufacturing enterprises, ultimately boosting their total factor productivity (TFP; Wang et al., 2024) [32]. However, other studies have emphasized notable differences between the operational models of services and manufacturing. Service transformation may create conflicts in funding and human resources between service and product operations (Zhou et al., 2024) [33], adversely affecting product innovation and potentially triggering a “learning paradox” between leveraging existing knowledge and seeking new insights (Eggert, 2011) [34]. For Xu et al. (2022) [35], the modern service industry is characterized by high levels of permeability, inclusiveness, and technical complexity; thus, its involvement can disrupt the traditional models of manufacturing enterprises. This integration not only increases the number of innovations within enterprises but also strengthens their capacity for independent innovation while simultaneously improving the quality of those innovations.
The second category examines the effects of industrial convergence on the environment. Most scholars acknowledge the environmental benefits of manufacturing servitization, including reduced carbon emissions (Zong & Gu, 2022) [36], increased green TFP (Wang et al., 2024) [37], and successful green transformation (Song et al., 2024) [38]. Byun et al. (2009) [39] suggest that, in order to reduce pollution, governments should prioritize the industrial integration of the IT and energy sectors. This effort is particularly important in developing countries, where such integration remains to be delivered. The servitization model is more effective than traditional production models in mitigating the negative environmental impacts of physical products. This transformation has led to increased investments in high-end service elements, such as knowledge and technology, within manufacturing firms, which in turn reduces energy consumption during production and enhances environmental performance (Xie et al., 2024) [40].
However, there has been limited research on the environmental effects of integrating manufacturing and services. For instance, Dong et al. (2021) [15] examined the impact of industrial integration on energy efficiency through the case of China’s information industry and manufacturing. They concluded that a positive spatial spillover effect exists, in which technological innovation plays a vital role. Furthermore, Dong et al. (2021) [27] observed that integrating manufacturing and producer services positively impacts regional green development efficiency, which is achieved through green innovation pathways. Moreover, some researchers have examined the environmental effects from the perspective of the co-agglomeration of manufacturing and services (Yang et al., 2021) [41]. However, significant differences exist between industrial agglomeration and industrial convergence: while industrial co-agglomeration emphasizes distinct spatial externalities (Yang et al., 2016) [42], industrial convergence focuses on the horizontal and vertical integration of elements in the industrial chain.
Despite extensive discussions on the concept, evaluation, innovation effects, and environmental impacts of industrial integration, there remain crucial research gaps, which the current paper aims to address. First, research on CAMMS remains in its early stages, and the existing literature lacks a scientific framework and methodology for evaluation. Mainstream methods for measuring industrial integration include input–output analysis and coupling coordination. In comparison, this paper employs a nonparametric stochastic frontier model based on the CAMMS context and its synergy mechanisms. Second, the existing literature concentrates on the innovation and environmental impacts of integrating manufacturing and service industries, lacking in-depth research from the high-end perspective of the industrial chain. In the context of a new wave of technological reform, investigating the green innovation impacts of CAMMS is of significant importance. Third, given the importance of the flow of factors between advanced manufacturing and modern services, this paper aims to examine the impact of CAMMS on green innovation efficiency from a spatial spillover perspective, which will provide empirical support for regional linkage and green research and development (R&D).

2.2. Theoretical Analysis and Research Hypothesis

2.2.1. The Nexus Between CAMMS and Green Innovation Efficiency

Industrial convergence transcends traditional sector boundaries, enhances inter-industry relationships, and drives industrial restructuring (Kim et al., 2015) [20]. The strong integration, driving force, and innovation spillover effects between advanced manufacturing and modern services profoundly impact various sectors of society in several ways. CAMMS effectively lowers the costs associated with information collection and contracting for entities in the industrial division of labor, thus focusing limited resources on core green value-added activities. This outcome not only lowers pollution (Cainelli & Mazzanti, 2013) [43] but also improves innovation (Santos-Vijande et al., 2021) [44]. For example, advanced manufacturing can outsource noncore services to specialized professional teams, allowing it to detach service costs from the production process and convert them into variable costs.
Furthermore, intermediate service products offered by the modern service industry effectively streamline the inputs and outputs of upstream and downstream manufacturing sectors, facilitating the precise matching of supply and demand while simultaneously promoting a deeper division of labor within the industrial chain (Liu et al., 2023) [45]. In turn, this process encourages advanced manufacturing to adopt low-carbon and environmentally friendly technologies and services in production, thus replacing high-energy and high-polluting inputs and facilitating the green transformation of production processes.
The integration of tacit knowledge from the modern service industry and explicit technology from advanced manufacturing accelerates the flow of scientific talent, which enhances the technology spillover effect (Miao et al., 2022) [46]. In turn, this knowledge spillover encourages companies to reach a consensus on energy conservation and resource utilization, leading to effective knowledge complementarity.
Based on the above analysis, we propose Hypothesis 1 as follows:
Hypothesis 1.
CAMMS has a significant positive impact on green innovation efficiency.

2.2.2. The Impact Paths of CAMMS on Green Innovation Efficiency

CAMMS indirectly enhances green innovation efficiency through the upgrading of industrial structures via different mechanisms. First, it optimizes the industrial chain. The “product + service” model of industrial convergence has significantly influenced traditional production and operational frameworks, driving advanced manufacturing to expand into modern services (Tao et al., 2017) [47]. This transformation encourages enterprises to adjust their scale to improve management efficiency (Wang et al., 2018) [48]. Following industrial convergence, the organizational forms within the industrial chain undergo restructuring and cross-linking, through which competition and cooperation extend from individual industries to cross-industrial levels, resulting in increased interactions among enterprises. In a competitive environment, enterprises that successfully integrate and transform gain market advantages, while those that are unable to adapt risk elimination (Bustinza et al., 2015) [49]. This dynamic competitive landscape fosters the emergence of new technologies and products, thus reshaping market supply and demand dynamics and further facilitating the upgrading of industrial structures. Meanwhile, upgrading industrial structures actively enhances green innovation efficiency by facilitating the industrial chain’s transition from being labor- and resource-intensive to knowledge- and technology-intensive (Qiu et al., 2023) [5]. Simultaneously, low-value-added and high-pollution industries are gradually replaced by high-value-added emerging sectors, effectively reducing resource consumption and pollution emissions during production (Qi et al., 2022) [50], and ultimately promoting green growth and innovation.
CAMMS indirectly promotes green innovation efficiency by addressing the distortion of innovative resources. In particular, CAMMS effectively alleviates the distortion of innovation resources. New-generation information technologies, such as deep learning, big data, cloud computing, blockchain, and artificial intelligence, continue to achieve breakthroughs that drive the rapid development of industrial convergence. This innovative convergence reduces information asymmetry in factor markets and improves the flow and allocation efficiency of innovative labor and capital (Liu et al., 2024) [51]. In the context of transformation and upgrading, industrial convergence eliminates communication barriers between enterprises, enhances labor-matching efficiency in modern services, and meets the advanced manufacturing industry’s demand for high-quality talent (Xie et al., 2024) [40]. Furthermore, addressing the distortion of innovative resources positively drives green innovation efficiency. Research indicates that committing resource misallocation suppresses China’s innovation productivity (Zhang et al., 2020) [52], whereas optimizing resource allocation can enhance the enterprise value chain and promote high-quality economic development. The effective allocation of innovative resources deepens regional specialization and collaboration, helps achieve higher service quality at lower costs, facilitates continuous research on newer forms of clean energy and low-carbon technologies, and ultimately promotes advancements in corporate green technologies (Che et al., 2024) [53].
Based on the above analysis, Hypotheses 2 and 3 are proposed as follows:
Hypothesis 2.
Optimizing industrial structure is an effective intermediary mechanism for CAMMS to improve green innovation efficiency.
Hypothesis 3.
Improving factor allocation is an effective intermediary mechanism for CAMMS to improve green innovation efficiency.

2.2.3. Spatial Spillover Effect of CAMMS on Green Innovation Efficiency

Numerous studies have confirmed the strong connections in economic activities among regions (Lesage & Pace, 2008) [54]. The proximity of geographical locations facilitates the movement of certain factors, such as talent and technology, between regions. Therefore, it is crucial to examine the direct relationship and the interactions among different spatial units to effectively analyze the impact of industrial integration on green innovation efficiency. First, an increased proportion of service elements in advanced manufacturing can stimulate investments in the surrounding service industries through supply and demand dynamics. This change, in turn, deepens supply and demand dynamics along interregional industrial chains, promoting communication and collaboration among regions (Hu, 2023) [55]. For instance, sharing pollution control equipment and outsourcing environmental services help in achieving decreasing returns to scale while promoting increasing returns to scale in pollution control technologies, resulting in enhanced green innovation efficiency in surrounding areas.
Moreover, the integration of advanced manufacturing with modern service sectors, such as telecommunications and finance, has blurred industry boundaries, accelerated the flow of innovation and talent, and facilitated the application of knowledge across related fields (Wang et al., 2022) [56]. Such a spillover effect of knowledge and skills not only promotes the local circulation of high-end factors, such as environmental knowledge and green technologies, but also extends its impact to neighboring regions.
In light of regional competition and political pressures, neighboring provinces and cities often learn from local enterprises’ successful experiences in service transformation and implementation of policies to enhance local green innovation efficiency (Ding et al., 2022) [57]. As a result, the dissemination of this demonstration and catching-up mechanism significantly creates spatial spillover effects.
Based on the above analysis, Hypotheses 4 is proposed as follows:
Hypothesis 4.
CAMMS has a spatial spillover effect on green innovation efficiency.
This paper argues that CAMMS has specific limits on the spatial spillover effects related to green innovation efficiency. First, while information technology has enabled cross-regional innovation dissemination between the technology service industry and advanced manufacturing, the information services offered by modern services often display a “nonstandardized” characteristic (Caves et al., 1989) [58]. This leads to lower communication efficiency than face-to-face interactions. Furthermore, as geographical distance increases, information dissemination can become distorted, thereby weakening the spatial spillover effect of industrial integration on improving green innovation efficiency. Second, before green innovation activities began, communication mainly relied on the face-to-face transfer of tacit knowledge, such as lectures and interviews. While transportation and information technology have somewhat alleviated constraints on knowledge dissemination, both the efficiency of information transmission and transaction costs significantly increase once distance exceeds a certain threshold, resulting in a considerable decline in the effectiveness of tacit knowledge. Third, advanced manufacturing and modern services typically collaborate through contractual agreements; however, the intangible and time-sensitive nature of technology services makes it difficult to conduct scientific evaluations after transactions (Charnoz et al., 2018) [59]. Therefore, modern services and advanced manufacturing often display a “local preference” under similar economic and trade conditions. Fourth, local governments may impose entry barriers and restrictions on knowledge flow to protect local economic development and ultimately achieve economic benefits.
Based on the above analysis, Hypotheses 5 is proposed as follows:
Hypothesis 5.
The threshold effect of CAMMS on green innovation efficiency has regional boundaries.

3. Methodology and Data

3.1. Estimation Methodology

3.1.1. Benchmark Regression Model

To investigate the role of CAMMS in increasing green innovation efficiency, the two-way fixed-effect model is used to construct the benchmark model as follows, which can consider the estimation bias existing in both individual and time issues.
G I E i t = α 0 + α 1 C A M M S i t + α i X i t + λ i + θ t + ε i t
where i and t are provinces and time, respectively (i = 1, 2, 3, …, 30; t = 2006, …, 2021); GIE is the green innovation efficiency; and CAMMS is the convergence of advanced manufacturing and modern services. Furthermore, λ i is the region-fixed effect, θ t is the time-fixed effect, ε i t is the error term, X i t is the control variables, α 0 is the constant term of the model, and α 1 is the elasticity coefficient of CAMMS on the green innovation efficiency.

3.1.2. Mechanism Testing Model

To investigate how CAMMS enhances green innovation efficiency, this study adopts the stepwise method outlined by Baron and Kenny (1986) [60]. First, using Model (1), we evaluate the impact of CAMMS on green innovation efficiency. Next, to assess the impact of CAMMS, Model (2) is constructed in which advanced industrial structure (AIS) and factor allocation (FA) serve as dependent variables, and CAMMS serves as the independent variable. Finally, in order to observe any changes in CAMMS’ impact, AIS and FA are integrated into Model (1). In addition, Model (3) includes CAMMS, AIS, and green innovation efficiency, so as to test the impact of CAMMS on green innovation efficiency after adding the mediating variables.
M I D i t = β 0 + β 1 C A M M S i t + k = 2 n β k X i t + λ i + θ t + ε i t
G I E i t = γ 0 + γ 1 C A M M S i t + γ 2 M I D i t + k = 2 n γ k X i t + λ i + θ t + ε i t
In the equations above, M I D i t is the mechanism variable. X i t is the control variables. If γ 1 , γ 2 , and β 1 are significant and the estimated values in Model (3) are slightly lower than those in the benchmark Model (1), then Hypotheses 2 and 3 are supported, thus suggesting an action mechanism involving AIS and FA.

3.1.3. Spatial Correlation Test Model

Spatial correlation is used to map how the attributes of different spatial units have clustered or spread across geographic space. To explore the spatial distribution of green innovation efficiency across China, the global Moran’s I index is employed to detect local clustering effects and evaluate the impacts of different regions. The formula for measuring the global Moran’s I index is as follows:
M o r a n s I = n i = 1 n j = 1 n w i j i = 1 n j 1 n w i j ( y i y ¯ ) ( y j y ¯ ) i = 1 n ( y i y ¯ ) 2
Here, y i and y j represent the green innovation efficiency of region i and region j , respectively. y ¯ is the average value of green innovation efficiency; w i j is the spatial weight matrix. A global Moran’s I index less than 0 suggests a negative spatial correlation between the analyzed variables; an index of 0 suggests no spatial correlation between the analyzed variables; and an index greater than 0 indicates a positive spatial correlation between the analyzed variables. The stronger the correlation, the greater the index value.
Although the global Moran’s I index can measure the overall spatial autocorrelation, it is unable to capture specific spatial correlations between regions. To address this limitation, we use the local Moran’s I index to identify spatial clustering across China’s provinces and evaluate the mutual influence between them. The formula for calculating the local Moran’s I index is as follows:
L o c a l   M o r a n s   I i = ( y i y ¯ ) j i n w i j ( y i y ¯ )
A positive local Moran’s I index suggests that the regions with similar green innovation efficiency tend to cluster, while a negative value indicates that the regions with varying green innovation efficiencies are likely to cluster.

3.1.4. Spatial Econometric Model

Existing studies have shown that green innovation has spatial dependence and that ignoring its spatial spillover effects may lead to biased estimation results (Fan & Xiao, 2021) [61]. Compared to traditional regression methods, spatial econometric methods are better able to consider the complex spatial correlation and dependence of the sample. Therefore, to reduce the estimation error of the impact of CAMMS on green innovation efficiency, this paper introduces spatial econometric models to explore the impact of CAMMS on green innovation efficiency. To analyze spatial spillover effects, this paper mainly constructs an SDM, and its specific formula is as follows:
G I E i t = β 0 + β 1 C A M M S i t + β i X i t + ρ j = 1 n W i j G I E i j + θ 1 j = 1 n W i j C A M M S i j + θ i j = 1 n W i j X i t + μ i + γ t + ε i t
where W is the spatial weight matrix; W i j G I E i j and W i j C A M M S i j represent the spatial lag terms of the explained variable and the explanatory variable, respectively, which are used to measure the lagged effects of neighboring regions; ρ is the spatial autoregressive coefficient; and θ 1 is the coefficient of the spatial lag term of the explanatory variable. The remaining parameters have the same meaning as in the baseline regression model.

3.1.5. Spatial Weight Matrix

Spatial econometric models are significantly different from standard econometric models and are based on using a spatial weight matrix (W) to describe the spatial effects of variables. Currently, the neighborhood matrix constructed based on neighborhood relationships and with the geographic distance and economic distance matrices constructed based on distance relationships are commonly used. Given the high correlation between CAMMS and green innovation efficiency, this paper mainly explores the spatial effects based on the geographic distance matrix, and the economic distance spatial weight matrix is used for robustness tests. The geographic distance matrix is typically used as the weight coefficient in the spatial weight matrix of geographical distance. The specific setting of the spatial weight matrix is as follows:
W i j = 1 d i j 2   i j 0   i = j
where dij represents the distance between two provincial capitals.
The economic distance matrix is measured as the reciprocal of the difference between the average GDP of each province. The specific setting of the spatial weight matrix is as follows:
W i j = 1 | I ¯ i I ¯ j |   i j 0   i = j
where I ¯ = 1 t 1 t 0 + 1 t = t 0 t 1 I i t , and I i denote the GDP per capita of province i in year t.

3.2. Dependent Variable: Green Innovation Efficiency

The Super-EBM (Epsilon-Based Measure) model is adopted to estimate green innovation efficiency. This model not only considers radial ratios between target and actual values but also handles both radial and non-radial slack variations between input and output elements, thereby improving the comparability of results (Xiao et al., 2023) [62]. To address the complexity of green innovation activities, this study constructs an input–output index system for green innovation based on multi-dimensional inputs and outputs according to the three main bodies: input, desired output, and undesired output. The input variables consist of capital, labor, and energy. In particular, capital input is measured by R&D expenditures across regions using the perpetual inventory method; labor input is represented by the full-time equivalent of R&D personnel (Luo et al., 2023) [63]; and energy input is indicated by total energy consumption (Zhai & An, 2021) [64].
Output indicators include expected and unexpected outputs. Expected outputs encompass innovative economic and knowledge outputs, where the former is measured by the number of domestic patent applications granted, while the latter is measured by the sales revenue from new products. This paper differs from previous studies as it considers environmental pollution as an unexpected output and the inevitable innovation losses from green innovation activities. To evaluate emissions from industrial wastewater, sulfur dioxide, and particulate matter, environmental pollution is indicated by a comprehensive pollution index, which is calculated using the entropy method (Fan et al., 2021) [65]. Innovation loss is expressed as the ratio of unauthorized innovative R&D patent applications to the total number of authorized patents.
The development trends and spatial distribution characteristics of green innovation efficiency are shown in Figure 1. First, Figure 1a shows that the average green innovation efficiency increased from 0.557 in 2006 to 0.859 in 2021, indicating a significant improvement in efficiency, which reflects the notable effectiveness of China’s policies supporting green innovation. In particular, the green innovation efficiency in the eastern region is prominent, while the disparity between the central and western regions has gradually widened since 2015. Second, Figure 1b, which was created with ArcMap software 10.4, indicates that the green innovation efficiency of coastal provinces is significantly higher than that of non-coastal regions.

3.3. Independent Variable: CAMMS

The existence of friction costs and coordination costs affects the integration pathways between advanced manufacturing and modern services, resulting in discrepancies between actual development and the ideal state (Xie et al., 2012) [29]. Therefore, when measuring CAMMS, special attention should be given to the differences between the actual state and the ideal state of both sectors. However, the evaluation methods commonly employed by most scholars, such as patent coefficient methods, Herfindahl indices, input–output methods, and coupling coordination methods, do not effectively capture the deviation characteristics of these fields during integration. As such, the current paper employs a nonparametric stochastic frontier model to estimate the single-path integration levels of technology services’ manufacturing orientation and advanced manufacturing’s service orientation. Building on this, a coupling coordination model is used to assess the bidirectional integration level between advanced manufacturing and modern services. The specific steps are described below.
First, principal component factor analysis is employed to calculate the actual development levels of advanced manufacturing (AM) and modern services (MSs).
Second, a nonparametric stochastic frontier model is used to estimate the ideal development levels of AM and MSs across Chinese provinces. The formulas are presented as follows:
A M i t = A M i t + ε i t = f ( M S i t , i , t ) + ε i t
M S i t = M S i t + ε i t = f ( A M i t , i , t ) + ε i t
where A M i t represents the actual level of advanced manufacturing development in region i at time t; M S i t represents the actual level of modern service development in region i at time t; and A M = f ( M S i t , i , t ) represents the ideal development level of the technology services system required for advanced manufacturing, thus illustrating how advanced manufacturing promotes modern services. Furthermore, M S = f ( A M i t , i , t ) indicates the ideal development level of the advanced manufacturing system required for modern services, demonstrating how modern services drive advanced manufacturing. Finally, the regional and temporal effects are expressed nonparametrically, with ε i t representing the random disturbance term.
Based on the above estimates, the corresponding calculation formulas for the integration coefficients of advanced manufacturing driving modern services and modern services driving advanced manufacturing are as follows:
C A M M S 1 i t = exp ( f ^ ( A M i t , i , t ) max j = 1 , , n f ^ ( A M i t , j , t ) )
C A M M S 2 i t = exp ( f ^ ( M S i t , i , t ) max j = 1 , , n f ^ ( M S i t , j , t ) )
Finally, we use a coupling coordination model to measure CAMMS; the formula is as follows:
C i t = C A M M S 1 i t × C A M M S 2 i t ( C A M M S 1 i t + C A M M S 2 i t ) / 2
C A M M S i t = C i t × G i t , G = α C A M M S 1 i t + β C A M M S 2 i t
where C represents the development coupling degree of the CAMMS, with a value range of [0, 1]; G denotes the comprehensive coordination coefficient of the CAMMS; α , β are the weight coefficient of the CAMMS, considering the cross-industry integration; and CAMMS indicates the level of industrial convergence.
Serving as a foundation for industrial integration, technological convergence facilitates the flow of resources (Jeong & Lee, 2015) [66]. In achieving industrial convergence, the matching of production factors is typically a central process. In addition, industrial convergence shall be guided by market demand (Jeong et al., 2015) [67]. In fact, technological convergence failed in many companies not due to insufficient technical capabilities, but because of weak connections between suppliers and consumers. In a word, they failed to address market demands. Market business matching reflects the trends of both market share and industrial development. In a growing market, the spillover effects of resources across industries become more apparent and tend to form a spatial pattern for advanced manufacturing and modern services to become agglomerated. The spatial arrangement of resources would enhance the coordination capacity of industrial convergence (Yang et al., 2021) [23]. With deepened specialization, enterprises are encouraged to keep on innovating to adapt to market changes. The faster the pace of industrial innovation and upgrading, the stronger the drive for inter-industry learning. This process could boost industrial convergence (Chen et al., 2023) [68]. Based on the above analysis, we construct an indicator system for CAMMS from four aspects: factor matching, market business matching, spatial layout matching, and innovation matching (Table 1).
The development trends and spatial distribution of CAMMS are shown in Figure 2. Figure 2a reveals that the level of industrial integration rose from 0.684 in 2006 to 0.856 in 2021, representing a growth rate of 25.15%. This growth indicates a shift from a primary coordination state to a good coordinated state, although it remains in a transitional development phase. Additionally, CAMMS in the eastern region is significantly stronger than in the central and western regions. The uneven distribution of CAMMS across different regions is further highlighted in Figure 2b.
Following Ye (2024) [69], CAMMS was divided into ten types (see Table 2).

3.4. Mediating Variable

3.4.1. Advanced Industrial Structure

The advanced industrial structure (AIS) typically refers to the process of transitioning from traditional labor- and capital-intensive industries to technology- and service-oriented industries. According to Lyu et al. (2023) [70], the proportion of each industry’s output in GDP is represented as a three-dimensional spatial vector X0 = (X1,0, X2,0, X3,0). We then calculate the angles θ1, θ2 and θ3 between X0 and the vectors X1 = (1,0,0), X2 = (0,1,0), and X3 = (0,0,1), arranged from low to high industry levels. The calculation proceeds as follows:
θ j = a c r o s s i = 11 3 ( x i , j x i , 0 ) i = 1 3 ( x i , j 2 ) 1 / 2 i = 1 3 ( x i , 0 2 ) 1 / 2 , j = 1 , 2 , 3
A I S = k = 1 3 j = 1 k θ j
Here, AIS represents advanced industrial structure.

3.4.2. Factor Allocation

“Factor allocation” refers to the process of adjusting and distributing production factors within an industrial economy. Drawing on the methods of Cheng and Hu (2011) [71], the present paper uses the resource distortion index to assess the factor allocation efficiency of each province. The calculation formula is as follows:
First, the Cobb–Douglas production function is established, followed by a logarithmic transformation of the relevant variables, resulting in the expression shown below:
ln Y i t = c + α ln K i t + β ln L i t + ε i t
where Y represents output, measured by regional gross domestic product (GDP); K represents capital stock, calculated from fixed asset investment using the perpetual inventory method with a depreciation rate of 9.6%; and L represents labor input, indicated by the number of employed persons in each region.
Secondly, the marginal product of labor (MPL) and the marginal product of capital (MPK) are calculated, producing the following results:
M P L = α Y i t L i t ; M P K = β Y i t K i t
Thirdly, based on the deviation between the marginal products of factors and their prices, the absolute distortion coefficients of capital (distK) and labor (distL) are calculated, producing the following results:
d i s t K i t = | α Y i t r i t K i t 1 | ; d i s t L i t = | β Y i t w i t L i t 1 |
Finally, by combining the degrees of capital and labor distortion, the overall distortion coefficient (FA) is obtained, with the resulting formula presented as follows:
F A i t = d i s t K i t α α + β d i s t L i t β α + β

3.5. Control Variables

This study integrates existing research findings and introduces several control variables into the econometric model to address endogeneity issues arising from the absence of key explanatory variables and improve estimation accuracy. The environmental Kuznets curve demonstrates a strong connection between economic levels and pollutant emissions; therefore, we use per capita GDP as the measure of economic development (PGDP). Additionally, openness (OPEN) impacts green innovation, which we represent through the ratio of foreign direct investment to regional GDP (Wang et al., 2021) [72]. Moderate environmental regulations can encourage enterprises to increase their investments in environmental technology R&D; thus, we quantify environmental regulation (ER) by the ratio of environmental governance investment to GDP (Zhao & Sun, 2016) [73]. Moreover, enhancing the educational level of local residents promotes greater awareness of environmental cleanliness, resulting in higher demands for energy conservation and emission reduction. In turn, this drives the government to strengthen regulations while encouraging enterprises to invest in green technology R&D. Consequently, this study employs the average number of enrolled students in higher education institutions per 100,000 people to evaluate regional education level (EDU).
Considering data availability and completeness, we analyze panel data covering 30 provinces in China between 2006 and 2021. Due to a lack of data, Tibet, Hong Kong, Macau, and Taiwan are excluded from the analysis. This paper selects the pharmaceutical manufacturing industry, aerospace and equipment manufacturing industry, electronic communication equipment manufacturing industry, computer office equipment manufacturing industry, medical equipment and instrument manufacturing industry, information industry, and chemical manufacturing industry as the representative industries of the advanced manufacturing industry. This paper selects transportation, storage and postal services, information transmission, computer services and software, scientific research, technical services, and geological exploration as the representative industries of modern services. Data primarily originated from several sources, including the China Statistical Yearbook, the China Statistical Yearbook on High Technology Industry, the China Statistical Yearbook of the Tertiary Industry, the China Statistical Yearbook on Science and Technology, and the China Energy Statistical Yearbook. The descriptive statistics of the variables are shown in Table 3.

3.6. Sample and Data Sources

Given the data availability, the regions of Tibet, Hong Kong, Macao, and Taiwan were excluded. Therefore, the final samples cover the data of 30 Chinese provinces from 2006 to 2021. The data for constructing the GAMMC index system of this study were sourced from the China Statistical Yearbook (https://data.stats.gov.cn), the China High-tech Industry Statistical Yearbook, the China Tertiary Industry Statistical Yearbook, and the China Science and Technology Statistical Yearbook. The data for evaluating the green innovation efficiency index were derived from the China Statistical Yearbook, China Science and Technology Statistical Yearbook, and China Energy Statistical Yearbook. The data for other variables were obtained from the China Statistical Yearbook. Some missing data were supplemented using interpolation methods.

4. Empirical Results

4.1. Analysis of the Benchmark Regression Results

In order to avoid spurious regression, we performed diagnostic tests before conducting the benchmark regression on the sample data. Green innovation efficiency was used as the dependent variable, and the variance inflation factor (VIF) of the independent variables was calculated. Generally, a VIF value below 10 is believed to indicate no serious multicollinearity problem in samples. As shown in Table 4, all VIF values for this study are below 10, confirming no significant multicollinearity among the selected sample variables.
Additionally, the HT (Harris–Tzavalis) test was implemented to assess the stationarity of the data, with its results showcased in Table 5, which demonstrates that the p-values for each variable after the first-order difference are all below 0.01. Therefore, the null hypothesis of non-stationarity can be rejected. These tests confirm that the model proposed in this study does not suffer from spurious regression.
Model (1) is used for benchmark regression, and the assessment results for the impact of CAMMS on green innovation efficiency are shown in Table 6. Column (1) presents the regression results without relevant control variables, where the estimated coefficient for CAMMS is 0.560, which is significant at the 1% level. Columns (2)–(5) present the regression results with the sequential addition of control variables. After adjusting for the level of openness (OPEN), economic development (PGDP), environmental regulation (ER), and educational level (EDU), the obtained coefficients for CAMMS are 0.830, 0.463, 0.516, and 0.351, respectively, all significant at least at the 5% level. These findings indicate that CAMMS effectively promotes green innovation efficiency, consistent with previous theoretical analyses. Thus, Hypothesis 1 of this paper is validated.
The strong interconnection and complementarity functionalities between advanced manufacturing and technological services have facilitated communication and collaboration across various sectors, thereby driving innovation and technological advancements. Moreover, these functionalities have enhanced the environmental service system and boosted the research, development, and implementation of green technologies. Green innovation is not only more technically complex than general innovation, but it also often demonstrates a degree of “exogeneity” linked to the product itself. CAMMS allows advanced manufacturing firms to swiftly identify users’ intrinsic green needs, promoting the exchange of tacit knowledge through product–service integration. This, in turn, helps companies capture potential market demand and improve their green innovation levels.

4.2. Analysis of Mechanism Test

From the above results, it can be seen that CAMMS indeed improves green innovation efficiency. However, how does CAMMS accomplish this improvement? This section explores the mechanisms through which CAMMS influences green innovation efficiency, focusing on two key areas: advanced industrial structure and factor allocation. We use Models (2) and (3) to test the mediating effect, with the results presented in Table 7.
Column (2) of Table 7 shows that the regression coefficient for CAMMS related to the AIS is significantly positive, indicating that CAMMS effectively promotes the upgrading of industrial structure. Column (3) similarly reveals a significantly positive regression coefficient for the impact of AIS on green innovation efficiency. Additionally, the regression coefficient for CAMMS is lower than the benchmark coefficient presented in Column (1), which supports the mediating role of AIS between CAMMS and green innovation efficiency. The industrial linkages and factor alignments established during the CAMMS process facilitate the upgrading of the manufacturing structure. Furthermore, advanced industrialization effectively reduces energy consumption and pollutant emissions, thereby enhancing green innovation efficiency. Therefore, Hypothesis 2 is supported.
In Column (4), the regression coefficient for FA in CAMMS is significantly negative, indicating that CAMMS effectively alleviates resource distortions. Column (5) of Table 5 also shows a significant negative correlation between FA and green innovation efficiency. Furthermore, the regression coefficient for CAMMS is slightly lower than the benchmark coefficient in Column (1). This finding reinforces the mediating effect of FA between CAMMS and green innovation efficiency. By improving the efficiency of capital and labor allocation within CAMMS, the imbalance between the supply of innovation funds and the demand for high-tech talent can be effectively addressed, which in turn promotes the advancement of the green innovation chain. Therefore, Hypothesis 3 is supported.
After calculating the mediating effect contribution rate ( β 1 × γ 2 / α 1 ), we find that AIS contributes 36.33%, while FA accounts for 7.12%, indicating that AIS has a more significant mediating effect, since AIS typically drives technological innovation and product upgrades, as well as the development of higher value-added industries. The industries with high-value-added and advanced technologies tend to adopt green innovations, such as energy conservation, emission reduction, and resource recycling; these efforts may directly boost green innovation efficiency. In contrast, although optimizing FA is important, its effects are generally indirect and may impact green innovation efficiency in multiple mediating pathways.

4.3. Analysis of Spatial Econometric Results

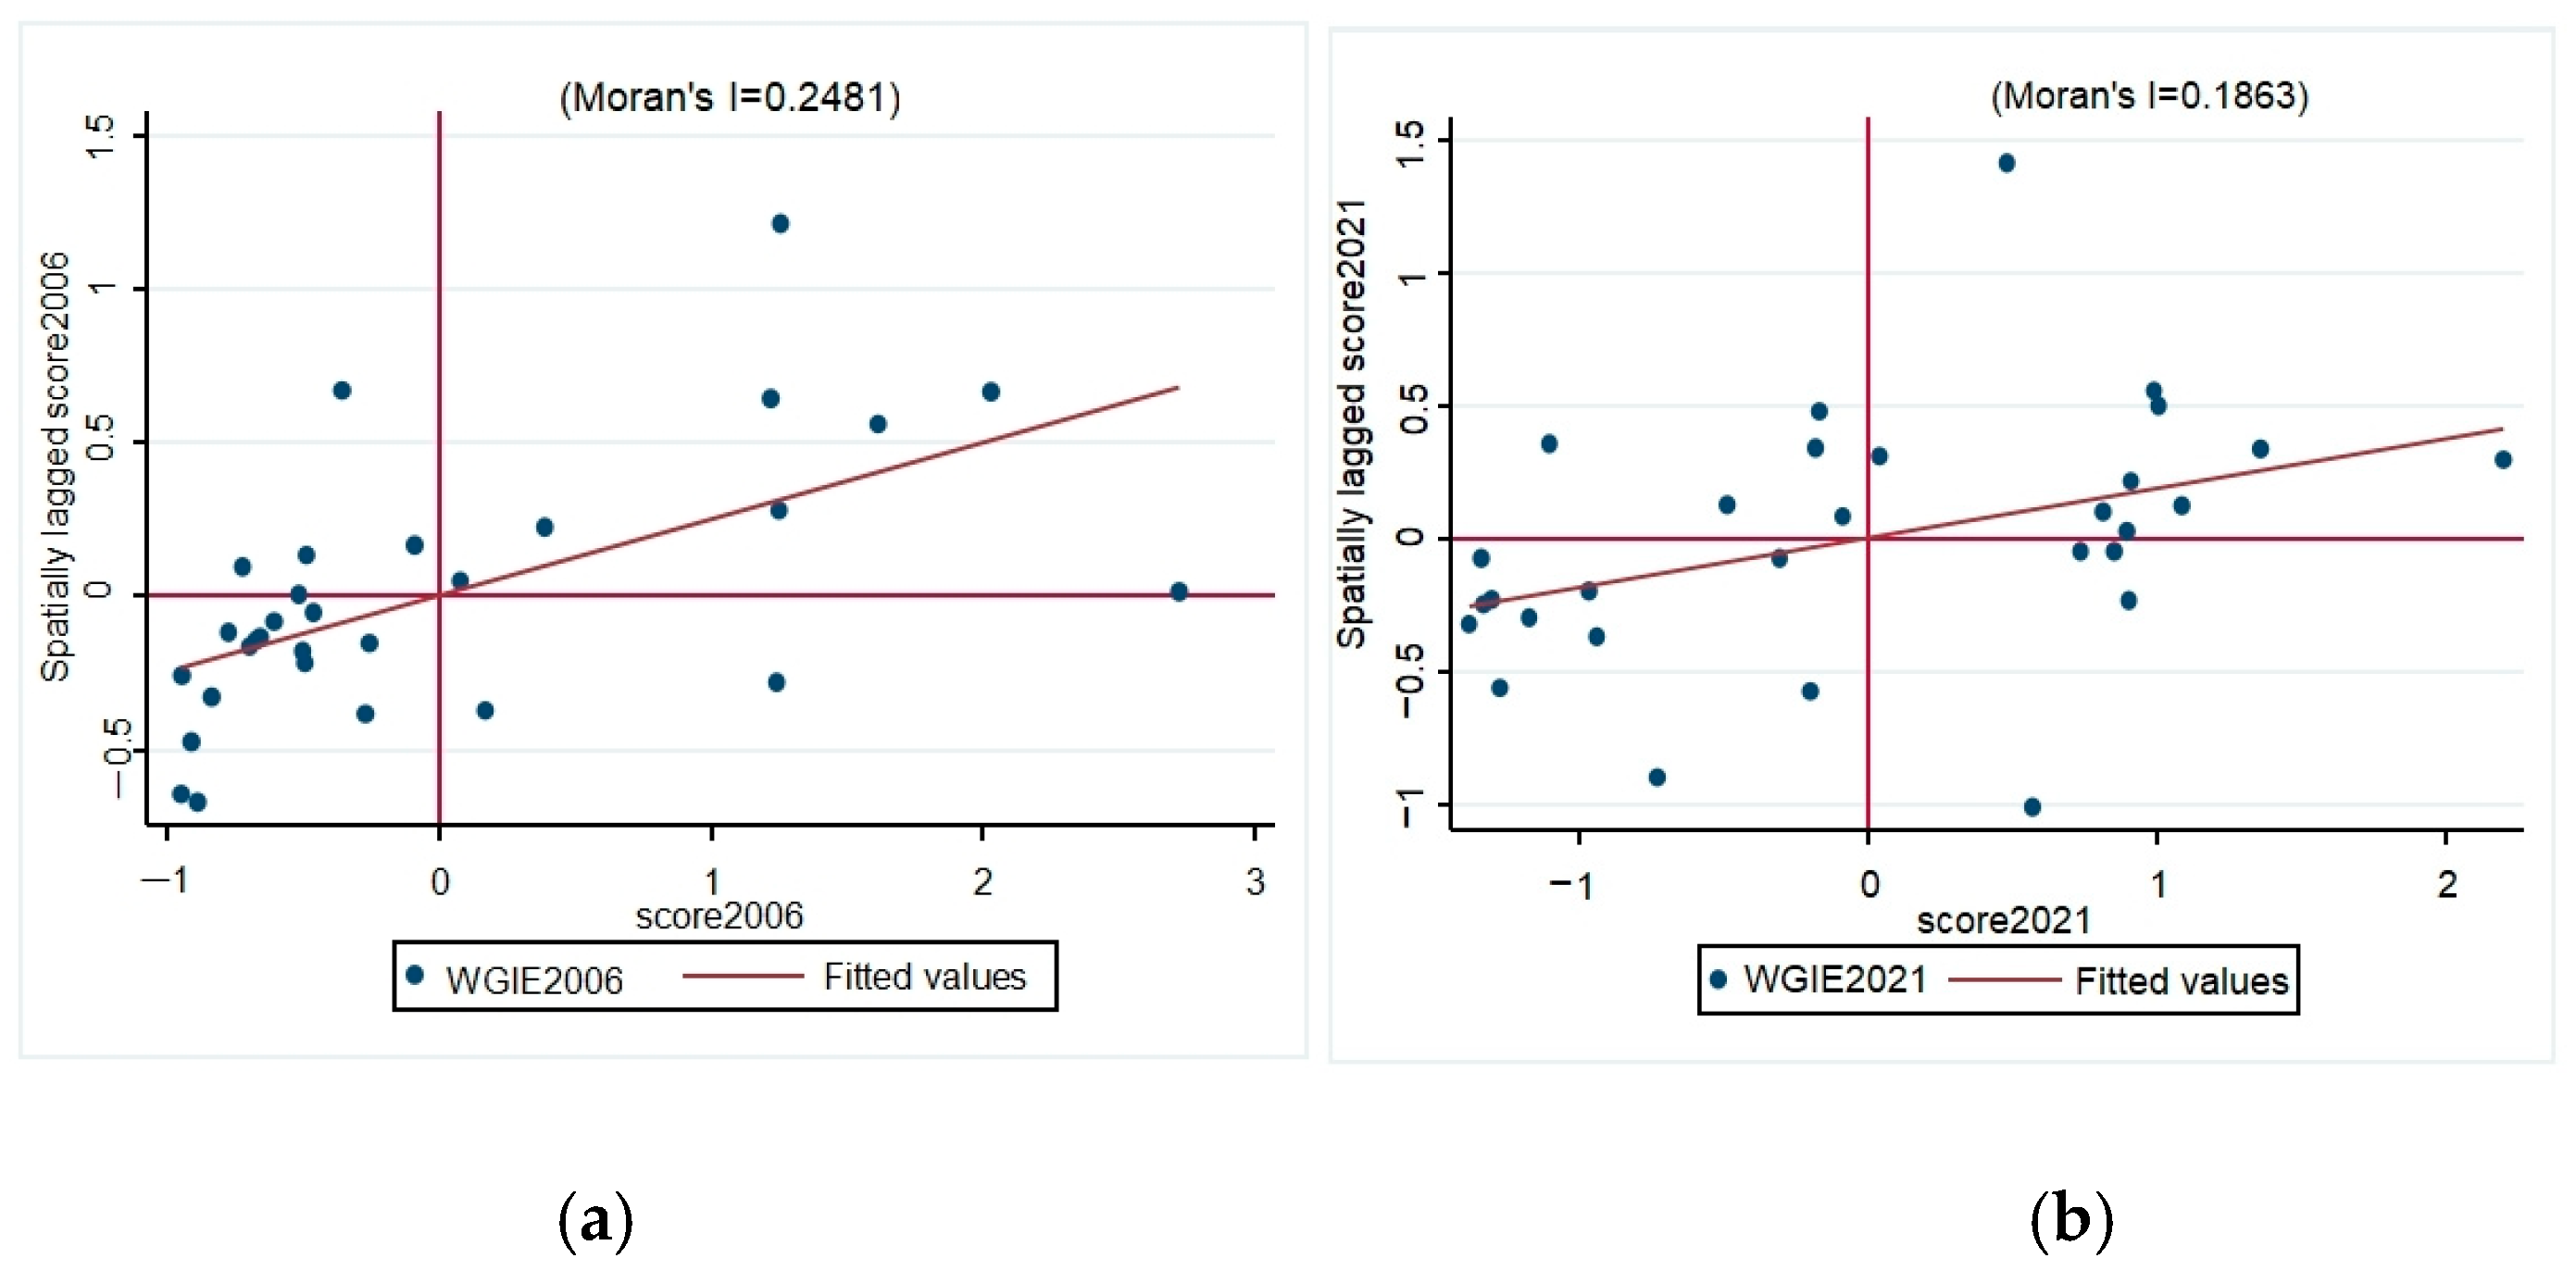
4.3.1. Results of Spatial Correlation Test

We evaluated the spatial correlation of the independent variable (green innovation efficiency) to assess the suitability of the spatial econometric model employed in this study. Model (4) is used to test the global spatial autocorrelation of the green innovation efficiency. The data in Table 8 indicate a positive global Moran’s I index for green innovation efficiency throughout the study period. Except for 2018 and 2019, the global Moran’s I index for green innovation efficiency met the significance threshold of at least 10%. This indicates that green innovation efficiency shows significant positive spatial autocorrelation and clustering characteristics.
To illustrate the clustering characteristics of the green innovation efficiency in a better manner, Model 5 is selected to test the local spatial autocorrelation of the green innovation efficiency. We create a Moran’s I scatter plot, as shown in Figure 3. As shown in the figure, from 2006 to 2021, the Moran’s I scatter points of most provinces are situated in the first and third quadrants. These results reveal a significantly positive spatial correlation in green innovation efficiency, marked by “high–high clustering” and “low–low clustering”, further confirming the distinct local spatial clustering behavior of green innovation efficiency. Therefore, considering spatial factors is essential when examining the impact of industrial convergence on green innovation efficiency.

4.3.2. Results of the Spatial Spillover Effect

The spatial Durbin model (SDM), as mentioned in Model 6, is used to examine the spatial spillover effect of GAMMC on the green innovation efficiency. To verify the appropriateness of the SDM, Columns (2) and (3) show the results for the spatial lag model (SLM) and the spatial error model (SEM), respectively. The likelihood ratio (LR) test and the Wald test reject the null hypothesis with statistical significance, thus confirming that the SDM cannot be simplified to either the SLM or the SEM.
As indicated in Column (3) of Table 9, the spatial autocorrelation coefficient for the SDM is 0.147, which meets the significance threshold at the 10% level. This suggests that a 1% increase in the green innovation level of a province leads to a corresponding 0.147% increase in levels of neighboring provinces, consistent with the findings of the Moran test. Furthermore, the coefficient for the impact of CAMMS on green innovation efficiency is 0.339, which is significant at the 5% level. In comparison, the coefficient for the spatial lag term W*CAMMS is 1.936, which passes the 1% significance test and indicates a positive influence of CAMMS on green innovation in neighboring provinces.
The results of the decomposition of the spatial spillover effects of CAMMS on green innovation are presented in Table 10. Column (1) shows the direct effects, with the coefficient for CAMMS at 0.394, which is statistically significant at the 1% level. This result indicates that a 1% increase in CAMMS results in a corresponding 0.394% increase in green innovation, highlighting the idea that the interaction between advanced manufacturing and modern services significantly boosts local green innovation. Column (2) of Table 10 displays the results for indirect effects, where the CAMMS coefficient is 2.299, which is also significant at the 1% level. This finding implies that a 1% increase in CAMMS leads to a 2.299% increase in green innovation in neighboring provinces, thereby supporting Hypothesis 4. In other words, the demonstration effects, industrial linkages, and technological spillovers from CAMMS not only facilitate the movement of high-end resources, such as skilled labor, information, environmental knowledge, and green technology, within the region but may also extend to adjacent areas, thus fostering the continuous optimization and restructuring of the industrial framework. The enhanced flow and allocation of innovative resources accelerate the application and dissemination of green technologies. In turn, this reduces the costs associated with environmental technology transfer and green patent development and ultimately improves green innovation efficiency.
The total effects are presented in Column (3) of Table 10, where the coefficient for CAMMS is 2.692, which is statistically significant at the 1% level. Additionally, the indirect effect of CAMMS is significantly greater than its direct effect, suggesting that CAMMS not only enhances local green innovation but also has a stronger positive impact on the green innovation of neighboring provinces through spatial spillover effects. The transformation of advanced manufacturing into service-oriented industries deepens the demand-and-supply relationships within regional industrial chains, promoting closer cooperation among various regions and collectively driving the scale effects of governance technologies. In turn, these improve green innovation efficiency in surrounding areas.

4.3.3. Robustness Test

To validate these results, robustness checks were performed in two areas: replacing the spatial weight matrix and substituting indicators. First, we compared the estimated results using the SDM under the economic geography weight matrix, as shown in Column (1) of Table 11. The analysis results show that the estimated coefficients and significance levels for CAMMS and W*CAMMS have not changed significantly. Furthermore, the impact of control variables on green innovation efficiency varies only in terms of significance levels. These results imply that the conclusions of this paper are unaffected by the spatial weight matrix, thereby confirming the robustness of the findings.
This study also uses alternative indicators for CAMMS and green innovation efficiency to evaluate the effect of the former on the latter. We employed traditional data envelopment analysis, specifically the BCC (Banker, Charnes and Cooper) model, to recalculate the green innovation indicators, resulting in new efficiency estimates. These were then re-estimated using the SDM, with the results presented in Column (2) of Table 11. We also adopted the method of Cao et al. (2020) [28] and applied the coupling evaluation model for re-measuring CAMMS, after which we conducted a regression analysis using SDM. The results are shown in Column (3) of Table 11. The analysis demonstrates that, after separately replacing CAMMS and green innovation efficiency, the estimated coefficients and significance levels for CAMMS and W*CAMMS remain consistent with those prior to the substitution. Furthermore, the coefficients and significance levels of the control variables related to green innovation efficiency support this conclusion.
Furthermore, we acknowledge that there may be a time lag in CAMMS’s impact on green innovation efficiency. Therefore, we include the one-period-lagged CAMMS (L. CAMMS) in the regression model, with the results presented in Column (4) of Table 11. The results indicate that the coefficient of L. CAMMS is 0.178, significant at the 1% level, further confirming the robustness of the findings.

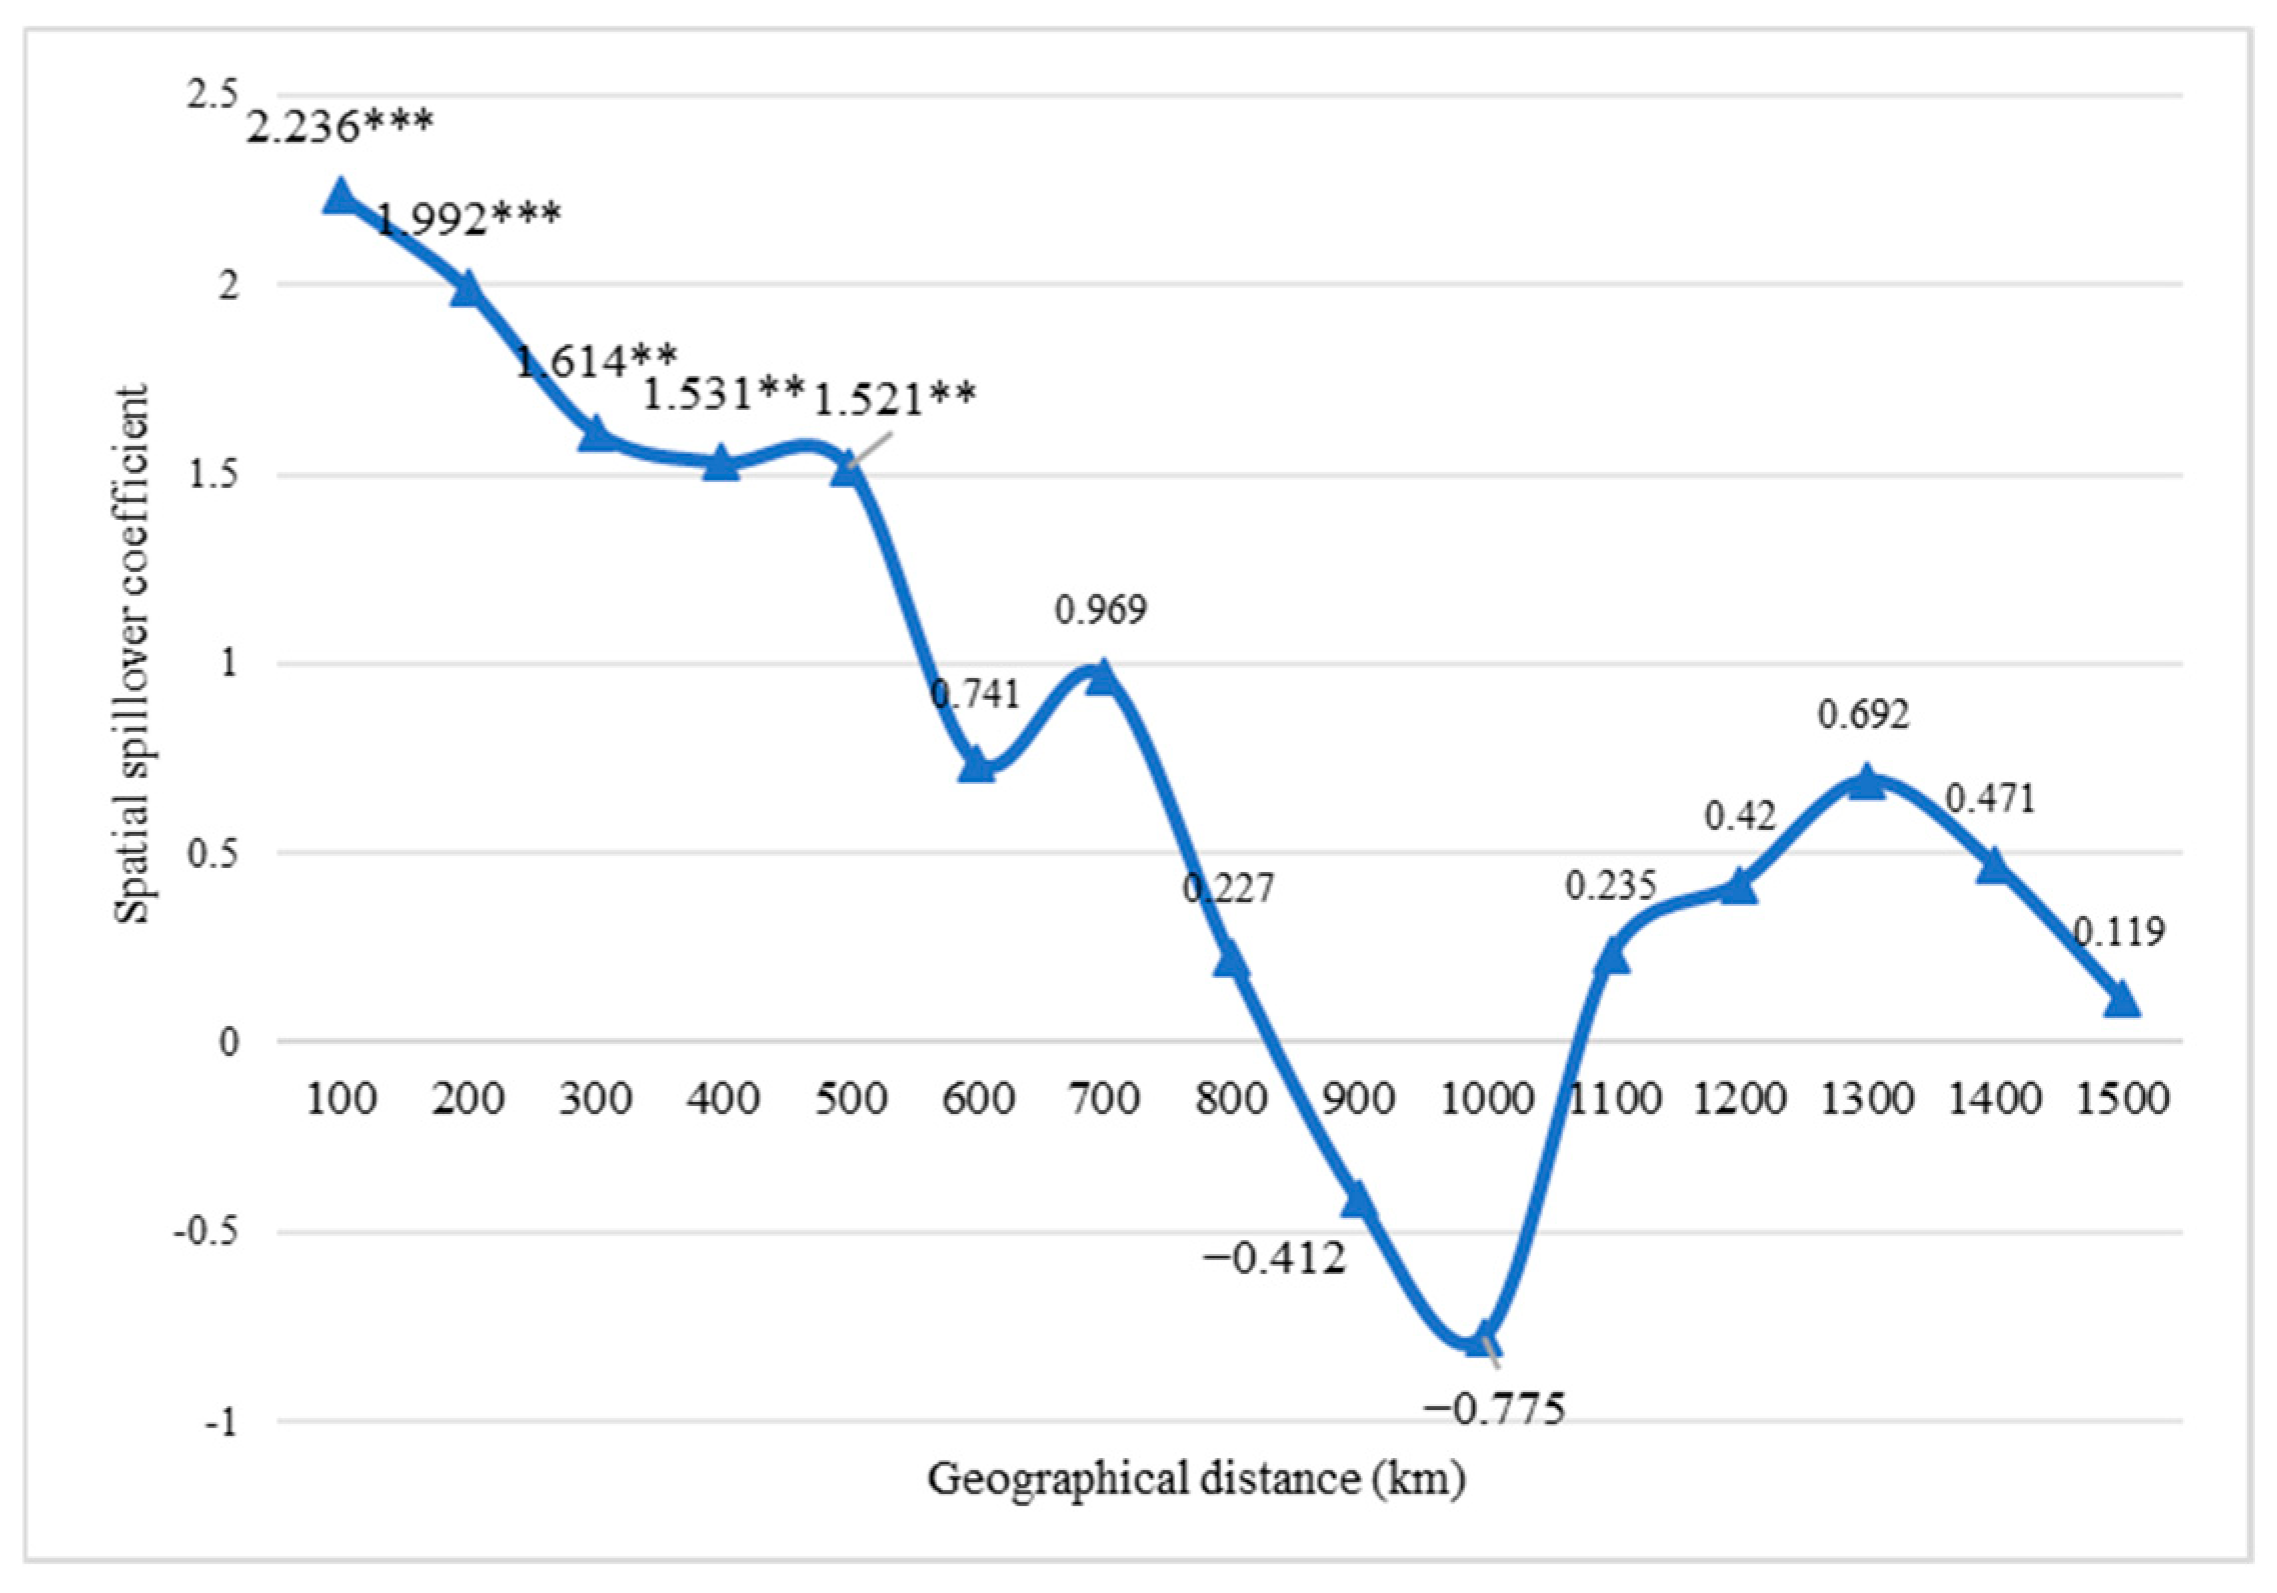
4.3.4. The Spillover Boundaries of the Spatial Spillover Effect

To test the boundary hypothesis regarding the spatial spillover effects of CAMMS on green innovation efficiency, this study employs methodologies from the existing literature and analyzes them using the decay principle of geographical distance (Yuan et al., 2020) [74]. Specifically, we assume that the distance between two provinces lies within the range [dmin, dmax], with r denoting the incremental distance from dmin to dmax. When dijd, the geographic unit element is defined as the inverse of the square of the distance between the two regions; conversely, when dij < d, the corresponding element in the matrix is 0. This approach allows for a more precise assessment of how varying distances affect spatial spillover effects.
This method also enables the exclusion of provinces within distance d from the spatial weight matrix, thus enhancing the observation of the long-distance decay changes in the spatial spillover effects of CAMMS on green innovation efficiency. The specific formula is as follows:
W d | d = d min , d max + r , d min + 2 r , , d max
where Wd = [Wij,d]n×n is a spatial weight matrix expressed as
W d = 1 d i j 2 , d i j d 0 , d i j < d   o r   i = j
This study uses a threshold distance-based spatial weight matrix and employs the SDM to reassess the spatial spillover effects of CAMMS on green innovation efficiency. A minimum interprovince distance of 100 km is set, with increments of 100–1500 km. This decision is based on the fact that beyond 1500 km, the number of spatial units participating in the regression decreases significantly, potentially introducing considerable noise. This study also records the spatial spillover effect coefficients of CAMMS on green innovation efficiency, along with their t-statistics at various distance thresholds. Finally, the spatial spillover effect coefficients are visualized (Figure 4) to analyze the decay boundaries of CAMMS on green innovation efficiency at various distances.
Figure 4 illustrates the change in the spatial spillover coefficient of CAMMS in terms of green innovation efficiency as geographical distances are increased. The horizontal axis indicates the distances between provinces, while the vertical axis reveals the spatial spillover coefficient of CAMMS.
As shown in Figure 4, the spatial spillover effects of CAMMS change significantly with increasing distance, with the decay boundary of CAMMS’s spatial spillover effect located within 500 km. Within this range, the coefficients for CAMMS’s spatial spillover effect on green innovation efficiency fluctuate between 1.521 and 2.236, with all coefficients passing the significance test at the 5% level. In the distance range of 500–1000 km, the spatial spillover effect decays most rapidly, as coefficients decrease from 1.521 to −0.775. Beyond 1000 km, the spatial spillover effect exhibits random fluctuations, mainly due to a reduction in spatial units within the weight matrix.

4.3.5. Heterogeneity Analysis

Heterogeneity Analysis Based on the Region

China is a vast, resource-rich country that is divided into three main regions (eastern, central, and western) based on differences in location, economic foundation, and resource endowment. The eastern region benefits from ample financial resources, a developed transportation infrastructure, and favorable terrain and climate, all of which promote population concentration and create a convenient network for technological exchange and collaboration (Xu et al., 2023) [75]. Cooperation between enterprises and research institutions is closely integrated, resulting in improved efficiency in disseminating knowledge and technology, thus advancing green innovation. In comparison, the central and western regions lag in economic development, with limited resources for high-tech industries and a weak industrial chain. Although these regions have lower pollution levels, their investments in green innovation remain insufficient (You & Zhang, 2024) [76]. Furthermore, higher altitudes, variable climate conditions, greater distances between cities, and inconvenient transportation in the central and western regions significantly reduce opportunities for technological exchange. These limitations, in turn, hinder technological advancement for local enterprises and restrict the promotion and application of green innovation.
The present study categorizes the sample provinces into the eastern region and the central and western regions and then performs a grouped regression analysis using Model (4). The spatial effect decomposition results for the two sample groups are presented in Table 10. In particular, Columns (1), (2), and (3) of Table 12 present the effect decomposition results for the eastern region, while Columns (4), (5), and (6) provide results for the central–western regions. The results indicate that CAMMS significantly promotes local green innovation in the eastern and central–western regions, with significance established at a minimum of the 5% level. Columns (2) and (5) show that the impact coefficient of CAMMS on green innovation in neighboring provinces in the eastern region is significant at the 1% level, while the effect in the central–western regions is not significant.

Heterogeneity Analysis Based on Policy Development

The year 2011 marked the initiation of the comprehensive pilot program for modern service industries, indicating progress in CAMMS. In 2019, the National Development and Reform Commission, together with 14 other departments, issued the “Implementation Opinions on Promoting Deep Integration of Advanced Manufacturing and Modern Service Industries”, which clarified the approach and objectives for industrial integration and expedited CAMMS implementation. Consequently, the present study identifies 2011 and 2019 as significant turning points in the development of CAMMS-related policies. To achieve this, we divided the sample period into three phases, 2006–2010, 2011–2018, and 2019–2021, and performed a grouped regression analysis using Model (4).
The spatial effect decomposition results for the three sample groups are shown in Table 13. In particular, Columns (5) and (8) indicate that during the periods 2011–2018 and 2019–2021, the impact coefficients of CAMMS on green innovation in neighboring provinces are significant at the 1% level. In contrast, the results in Column (1) reveal that during 2006–2010, CAMMS had no significant impact on green innovation in neighboring provinces. These findings suggest that, after the implementation of the pilot reform in the modern service industry, the government significantly advanced this sector’s development by relaxing access restrictions. This policy also encouraged positive interactions with the manufacturing industry, facilitating the collaborative exploration of cross-regional innovation models and enhancing the sharing of green technologies and experiences.

5. Conclusions and Policy Implications

5.1. Conclusions

To evaluate the influence of China’s CAMMS on green innovation efficiency, this paper constructed an integrated development index for CAMMS from four aspects. Then, this work employed the fixed-effect, spatial econometric, and mediation-effect models to examine the impact of CAMMS on green innovation efficiency based on China’s province-level dataset between 2006 and 2021. After discussing the results, we present the following conclusions:
(1)
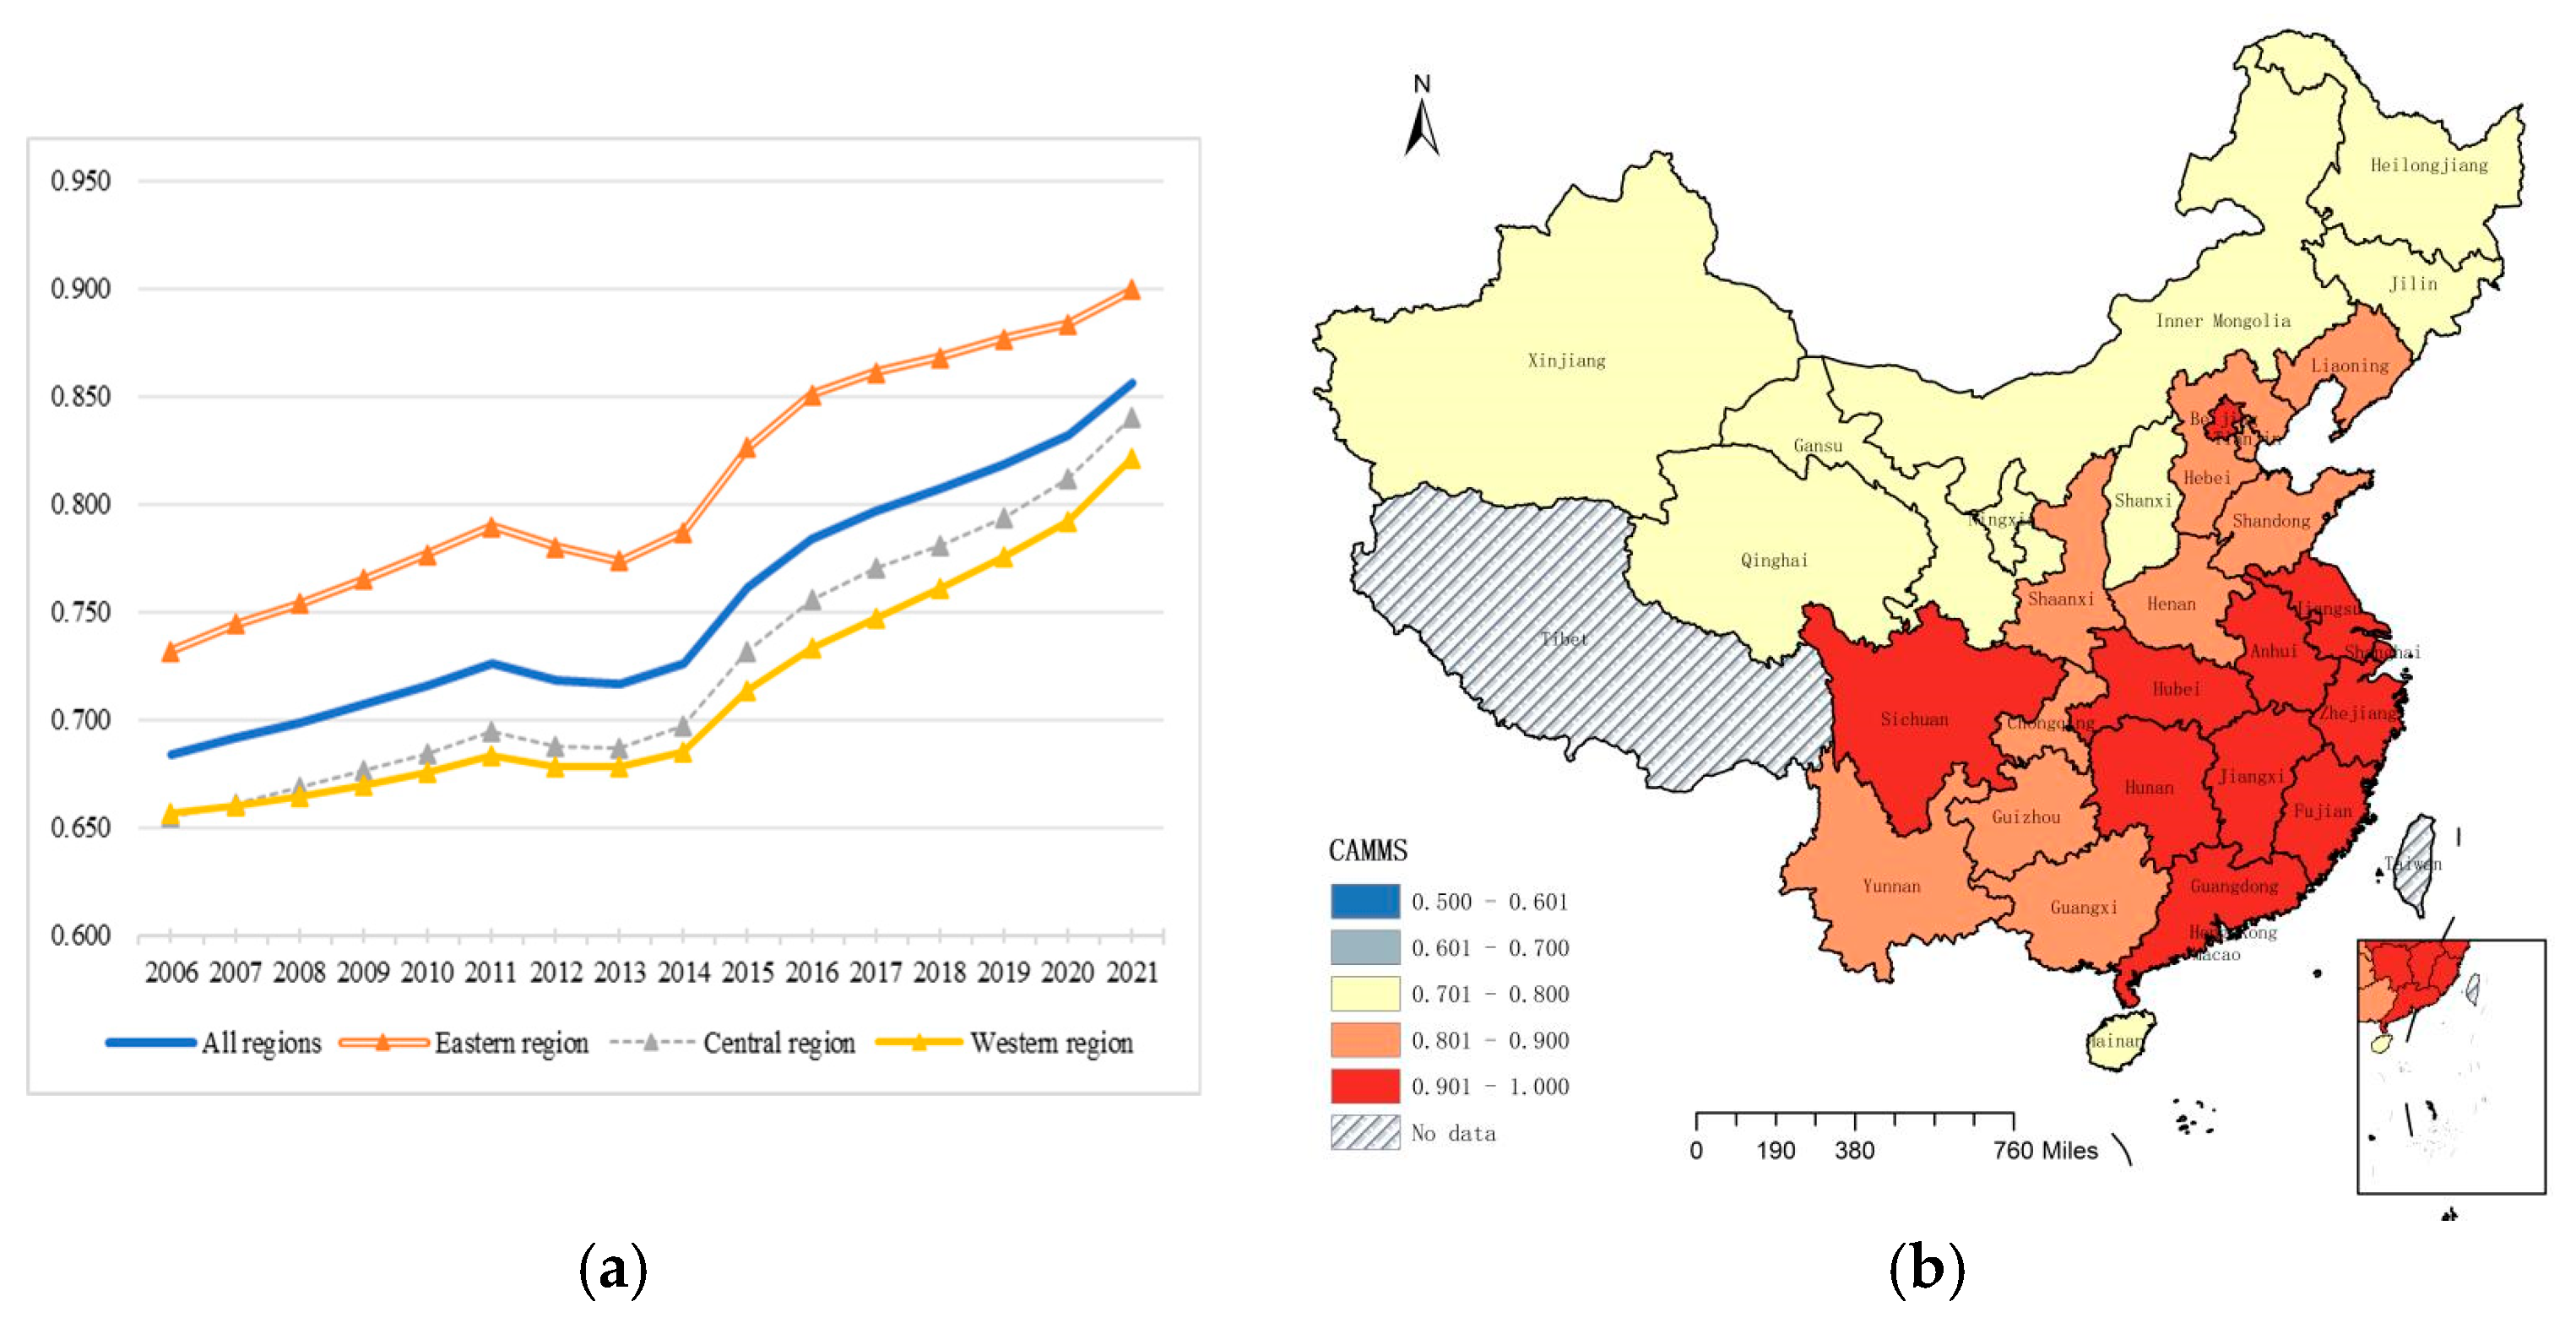
During the study period, China’s CAMMS demonstrated a notable upward trend, in which its overall integration level advanced from a primary coordination state to a good coordination state. Furthermore, the spatial distribution of CAMMS exhibits a gradual decline from the eastern to western regions.
(2)
CAMMS significantly enhances local green innovation efficiency. In particular, the results of the mechanism analysis show that CAMMS optimizes the industrial structure and reduces factor distortion, thus improving green innovation efficiency through advanced industrial frameworks and factor allocation.
(3)
CAMMS can produce spillover effects on green innovation in neighboring areas; however, such an effect is constrained by regional boundaries, with an effective influence range of 500 km.
(4)
The heterogeneity analysis results show that the spillover effects of CAMMS on green innovation are primarily focused in the eastern region, and this effect emerged after the implementation of the comprehensive reform pilot for the modern service industry in 2011.

5.2. Policy Implications

To further promote CAMMS and improve green innovation efficiency, the following policy recommendations are proposed.
Although this paper demonstrates that the overall level of CAMMS has improved and has emerged as a significant force in enhancing green innovation efficiency in China, its spatial distribution still reveals considerable imbalances. This indicates that CAMMS in China still has significant potential for further integration. To enhance the CAMMS environment, the national government should allocate adequate funding and support for high-tech industry projects, thereby improving the essential software and hardware conditions required for industrial integration. Furthermore, local governments should adaptively foster the establishment of industrial clusters tailored to the specific needs of high-tech industry development in their respective regions to maximize the scale effects of CAMMS.
The mechanism analysis results indicate that CAMMS effectively enhances green innovation efficiency via two main channels: AIS and resource allocation. To advance this process, innovative technologies should be utilized to facilitate the intelligent and networked transformation of traditional industries, expedite the shift from capital- to technology-intensive industries, and enhance energy efficiency while fostering green and low-carbon industrial development. Furthermore, the government should establish a diversified and complementary industrial cooperation platform to enhance the precise matching of labor, capital, and technology elements during the industrial integration process. Such a strategy ensures that the modern services and professional talent required by the industries are efficiently allocated and fully utilized.
The spatial spillover effects of CAMMS on green innovation efficiency demonstrate that policies promoting industrial integration influence green innovation in local regions and neighboring areas. Thus, policies aimed at promoting industrial integration for green innovation should start with macroeconomic regulation, thus dismantling regional barriers and enhancing cooperation among regions. For instance, while fully utilizing the spatial diffusion of knowledge generated by industrial convergence, the eastern region should play a pivotal role in industrial integration by coordinating various CAMMS areas, strategically planning CAMMS development, and facilitating cross-regional exchanges and cooperation in terms of talent and capital between modern services and advanced manufacturing.
Furthermore, the government should persist in advancing comprehensive reforms in the modern service sector by implementing measures (e.g., tax incentives), relaxing loan conditions, and establishing standardized systems to foster the growth of modern service enterprises exhibiting positive momentum. Through market mechanisms, the government can facilitate cross-regional and cross-industry mergers and acquisitions while providing policy support and guidance. Ultimately, these steps can enhance the competitiveness of these enterprises and improve the informatization of their services.
The spatial spillover effects of CAMMS on green innovation efficiency demonstrate distinct geographical boundaries. Thus, it is essential to mitigate local protectionism and administrative fragmentation. Furthermore, the government should accelerate the free movement of innovative factors between regions, especially in areas with significant institutional differences, gradually removing the spillover effects resulting from geographical boundaries. Doing so will facilitate more efficient resource sharing and cooperation among regions, as well as improve the overall level of green innovation.

Author Contributions

Conceptualization, S.N.; Software, L.W.; Formal analysis, S.N.; Writing—original draft, H.Z.; Writing—review & editing, H.Z.; Funding acquisition, L.W. All authors have read and agreed to the published version of the manuscript.

Funding

The article is sponsored by the National Natural Science Foundation of China (7230416).

Institutional Review Board Statement

Not applicable.

Informed Consent Statement

Not applicable.

Data Availability Statement

The raw data supporting the conclusions of this article will be made available by the authors on request.

Acknowledgments

The article is sponsored by the National Natural Science Foundation of China (7230416). The authors acknowledge the useful comments from the editor and anonymous reviewers. Certainly, all remaining errors are our own.

Conflicts of Interest

The authors declare no conflict of interest.

References

  1. Yu, X.H.; Xu, H.Y.; Lou, W.G.; Xu, X.; Shi, V. Examining energy eco-efficiency in China’s logistics industry. Int. J. Prod. Econ. 2023, 258, 108797. [Google Scholar] [CrossRef]
  2. Xie, P.J.; Jamaani, F. Does green innovation, energy productivity and environmental taxes limit carbon emissions in developed economies: Implications for sustainable development. Struct. Chang. Econ. Dyn. 2022, 63, 66–78. [Google Scholar] [CrossRef]
  3. Miao, C.L.; Duan, M.M.; Zuo, Y.; Wu, X.Y. Spatial heterogeneity and evolution trend of regional green innovation efficiency—An empirical study based on panel data of industrial enterprises in China’s provinces. Energy Policy 2021, 156, 112370. [Google Scholar] [CrossRef]
  4. Tan, F.F.; Gong, C.Y.; Niu, Z.Y. How does regional integration development affect green innovation? Evidence from China’s major urban agglomerations. J. Clean. Prod. 2022, 379, 134613. [Google Scholar] [CrossRef]
  5. Qiu, Y.; Wang, H.; Wu, J. Impact of industrial structure upgrading on green innovation: Evidence from Chinese cities. Environ. Sci. Pollut. Res. 2023, 30, 3887–3900. [Google Scholar] [CrossRef]
  6. Zhou, Z. Industrial Convergence: New power of industrial development and economic growth. China Ind. Econ. 2003, 46–52. [Google Scholar]
  7. Wang, Q.; Geng, C.; E, H.T.; Song, J. Research on capital allocation efficiencies with four-dimensional factor capitals from China’s intelligent manufacturing enterprises. PLoS ONE 2022, 17, e0270588. [Google Scholar] [CrossRef]
  8. Wang, Y.M.; Zhou, Y.N.; Sun, X.Q. Investigating the dynamics, assessment, and strategies for integrated innovation between advanced manufacturing and modern services in the digital economy: A provincial analysis. Comp. Econ. Soc. Syst. 2024, 1, 61–73. [Google Scholar]
  9. Dangelico, R.M.; Pujari, D. Mainstreaming green product innovation: Why and how companies integrate environmental sustainability. J. Bus. Ethics 2010, 95, 471–486. [Google Scholar] [CrossRef]
  10. Wang, D.; Xu, D.Y.; Zhou, N.; Cheng, Y. The asymmetric relationship between sustainable innovation and industrial transformation and upgrading: Evidence from China’s provincial panel data. J. Clean. Prod. 2022, 378, 134453. [Google Scholar] [CrossRef]
  11. Wang, Y.; Han, P. Digital Transformation, Service-Oriented Manufacturing, and Total Factor Productivity: Evidence from A-Share Listed Companies in China. Sustainability 2023, 15, 9974. [Google Scholar] [CrossRef]
  12. Dong, F.; Li, Y.F. How does industrial convergence affect regional high-quality development? Evidence from China. J. Asia Pac. Econ. 2024, 29, 1650–1683. [Google Scholar] [CrossRef]
  13. Yang, J.; Chen, L.M.; Zhang, Y.D. Rural industrial convergence, urbanization development, and farmers’ income growth—Evidence from the Chinese experience. Front. Sustain. Food Syst. 2023, 7, 1237844. [Google Scholar] [CrossRef]
  14. Soellner, S.; Helm, R.; Klee, P.; Endres, H. Industrial service innovation: Exploring the transformation process to digital servitization in industrial goods companies. Ind. Mark. Manag. 2024, 117, 288–303. [Google Scholar] [CrossRef]
  15. Dong, F.; Li, Y.; Zhang, X.; Zhu, J.; Zheng, L. How does industrial convergence affect the energy efficiency of manufacturing in newly industrialized countries? Fresh evidence from China. J. Clean. Prod. 2021, 316, 128316. [Google Scholar] [CrossRef]
  16. Wang, J.D.; Dong, K.Y.; Taghizadeh-Hesary, F.; Dong, X. Does industrial convergence mitigate CO2 emissions in China? A quasi-natural experiment on “Triple Play” Reform. Energy Econ. 2023, 128, 107107. [Google Scholar] [CrossRef]
  17. Rosenberg, N. Technological change in the machine tool industry, 1840–1910. J. Econ. Hist. 1963, 23, 414–443. [Google Scholar] [CrossRef]
  18. Sony, M.; Antony, J.; Mc Dermott, O.; Garza-Reyes, J.A. An empirical examination of benefits, challenges, and critical success factors of industry 4.0 in manufacturing and service sector. Technol. Soc. 2021, 67, 101754. [Google Scholar] [CrossRef]
  19. Geum, Y.; Kim, M.S.; Lee, S. How industrial convergence happens: A taxonomical approach based on empirical evidences. Technol. Forecast. Soc. Chang. 2016, 107, 112–120. [Google Scholar] [CrossRef]
  20. Kim, N.; Lee, H.; Kim, W.; Lee, H.; Suh, J.H. Dynamic patterns of industry convergence: Evidence from a large amount of unstructured data. Res. Policy 2015, 44, 1734–1748. [Google Scholar] [CrossRef]
  21. Crozet, M.; Milet, E. Should everybody be in services? The effect of servitization on manufacturing firm performance. J. Econ. Manag. Strategy 2017, 26, 820–841. [Google Scholar] [CrossRef]
  22. Tian, H.G.; Yang, H.X.; Wang, L.Y. The Integration of “Two Industries” and the Evolution of New Business Forms. Nankai Econ. Res. 2023, 11, 168–185. [Google Scholar]
  23. Yang, N.; Liu, Q.; Chen, Y. Does industrial agglomeration promote regional innovation convergence in China? Evidence from high-tech industries. IEEE Trans. Eng. Manag. 2021, 70, 1416–1429. [Google Scholar] [CrossRef]
  24. Di Berardino, C.; Onesti, G. The two-way integration between manufacturing and services. Serv. Ind. J. 2020, 40, 337–357. [Google Scholar] [CrossRef]
  25. Gambardella, A.; Torrisi, S. Does technological convergence imply convergence in markets? evidence from the electronics industry. Res. Policy 1998, 27, 445–463. [Google Scholar] [CrossRef]
  26. Tunzelmann, F.N.V. Industry-specific competencies and converging technological systems: Evidence from patents. Struct. Change Econ. Dyn. 2001, 12, 141–170. [Google Scholar]
  27. Dong, F.; Li, Y.; Qin, C.; Sun, J. How industrial convergence affects regional green development efficiency: A spatial conditional process analysis. J. Environ. Manag. 2021, 300, 113738. [Google Scholar] [CrossRef]
  28. Cao, L.; Li, L.; Wu, Y.; Zeng, W. Does industrial convergence promote regional metabolism? Evidence from China. J. Clean. Prod. 2020, 273, 123010. [Google Scholar] [CrossRef]
  29. Xie, K.; Xiao, J.H.; Zhou, X.B.; Wu, J.P. Quality of Convergence between Industrialization and Informatization in China. Econ. Res. J. 2012, 47, 4–30. [Google Scholar]
  30. Iosifidis, P. Growing pains? The transition to digital television in Europe. Eur. J. Commun. 2011, 26, 3–17. [Google Scholar] [CrossRef]
  31. Crampes, C.; Hollander, A.J. Triple play time. Commun. Strateg. 2006, 63, 51. [Google Scholar]
  32. Wang, H.S.; Fang, S.X.; Guo, Q.; Meng, B. Impact of manufacturing servitization on total factor productivity under global trade openness. Rev. Dev. Econ. 2024, 28, 904–928. [Google Scholar] [CrossRef]
  33. Zhou, D.; Yan, T.T.; Zhao, L.L.; Guo, J. Performance implications of servitization: Does a Manufacturer’s service supply network matter? Int. J. Prod. Econ. 2020, 219, 31–42. [Google Scholar] [CrossRef]
  34. Eggert, A.; Hogreve, J.; Ulaga, W.; Muenkhoff, E. Industrial services, product innovations, and firm profitability: A multiple-group latent growth curve analysis. Ind. Mark. Manag. 2011, 40, 661–670. [Google Scholar] [CrossRef]
  35. Xu, J.; Li, L.; Tian, C. Does the manufacturing embedded servitization promote firm innovation? The perspective of quantity and quality. Sci. Technol. Prog. Policy 2022, 39, 95–105. [Google Scholar]
  36. Zong, Y.; Gu, G.D. The threshold effect of manufacturing servitization on carbon emission: An empirical analysis based on multinational panel data. Struct. Chang. Econ. Dyn. 2022, 60, 353–364. [Google Scholar] [CrossRef]
  37. Wang, H.S.; Lockett, M.; He, D.N.; Lv, Y. Enhancing green total factor productivity through manufacturing output servitization: A case study in China. Heliyon 2024, 10, e23769. [Google Scholar] [CrossRef]
  38. Song, Y.W.; Niu, N.; Song, X.Y.; Zhang, B. Decoding the influence of servitization on green transformation in manufacturing firms: The moderating effect of artificial intelligence. Energy Econ. 2024, 139, 107875. [Google Scholar] [CrossRef]
  39. Byun, G.; Cho, J.Y.; Lee, B.G. Analyzing convergence of IT and energy industry based on social system framework. Int. J. Humanit. Soc. Sciences. 2009, 26, 1256–1261. [Google Scholar]
  40. Xie, C.; He, X.; Wang, W.; Wang, J. Assessing the impact of manufacturing servitization on the urban green development efficiency in China. Clean Technol. Environ. Policy 2024, 14, 1–25. [Google Scholar] [CrossRef]
  41. Yang, H.; Zhang, F.; He, Y. Exploring the effect of producer services and manufacturing industrial co-agglomeration on the ecological environment pollution control in China. Environ. Dev. Sustain. 2021, 23, 16119–16144. [Google Scholar] [CrossRef]
  42. Yang, Z.S.; Song, T.; Chahine, T. Spatial representations and policy implications of industrial co-agglomerations, a case study of Beijing. Habitat Int. 2016, 55, 32–45. [Google Scholar] [CrossRef]
  43. Cainelli, G.; Mazzanti, M. Environmental innovations in services: Manufacturing–services integration and policy transmissions. Res. Policy 2013, 42, 1595–1604. [Google Scholar] [CrossRef]
  44. Santos-Vijande, M.L.; López-Sánchez, J.Á.; Pascual-Fernández, P.; Rudd, J.M. Service innovation management in a modern economy: Insights on the interplay between firms’ innovative culture and project-level success factors. Technol. Forecast. Soc. Change 2021, 165, 120562. [Google Scholar] [CrossRef]
  45. Liu, Y.; Shang, M.; Xu, J.; Zhang, L.; Hua, H. Value chain and the integrated development of manufacturing and modernized services: A case study of Shandong Province, China. Sustainability 2023, 15, 1439. [Google Scholar] [CrossRef]
  46. Miao, Z. Industry 4.0, technology spillover impact on digital manufacturing industry. J. Enterp. Inf. Manag. 2022, 35, 1251–1266. [Google Scholar] [CrossRef]
  47. Tao, F.; Cheng, Y.; Zhang, L.; Nee, A.Y.C. Advanced manufacturing systems: Socialization characteristics and trends. J. Intell. Manuf. 2017, 28, 1079–1094. [Google Scholar] [CrossRef]
  48. Wang, W.; Lai, K.H.; Shou, Y. The impact of servitization on firm performance: A meta-analysis. Int. J. Oper. Prod. Manag. 2018, 38, 1562–1588. [Google Scholar] [CrossRef]
  49. Bustinza, O.F.; Bigdeli, A.Z.; Baines, T.; Baines, T.; Elliot, C. Servitization and competitive advantage: The importance of organizational structure and value chain position. Res.-Technol. Manag. 2015, 58, 53–60. [Google Scholar] [CrossRef]
  50. Qi, G.; Wang, Z.; Wang, Z.; Wei, L. Has industrial upgrading improved air pollution? Evidence from China’s digital economy. Sustainability 2022, 14, 8967. [Google Scholar] [CrossRef]
  51. Liu, M.; Hua, D. Enhancing resource allocation efficiency: The impact of servitization in China’s manufacturing sector. Ind. Mark. Manag. 2024, 121, 160–178. [Google Scholar] [CrossRef]
  52. Zhang, F.; Wang, Y.; Liu, W. Science and technology resource allocation, spatial association, and regional innovation. Sustainability 2020, 12, 694. [Google Scholar] [CrossRef]
  53. Che, S.; Tao, M.; Silva, E.; Sheng, M.S.; Zhao, C.; Wang, J. Financial misallocation and green innovation efficiency: China’s firm-level evidence. Energy Econ. 2024, 136, 107697. [Google Scholar] [CrossRef]
  54. Lesage, J.P.; Pace, R.K. Spatial econometric modeling of origin-destination flows. J. Reg. Sci. 2008, 48, 941–967. [Google Scholar] [CrossRef]
  55. Hu, C.C. Analyzing dynamic coupling and coordination of modern service and advanced manufacturing industries in Guangdong–Hong Kong–Macao Greater Bay Area. Heliyon 2023, 9, 6. [Google Scholar] [CrossRef]
  56. Wang, C.; Wang, L.; Xue, Y.; Li, R. Revealing spatial spillover effect in high-tech industry agglomeration from a high-skilled labor flow network perspective. J. Syst. Sci. Complex. 2022, 35, 839–859. [Google Scholar] [CrossRef]
  57. Ding, J.; Liu, B.; Shao, X. Spatial effects of industrial synergistic agglomeration and regional green development efficiency: Evidence from China. Energy Econ. 2022, 112, 106156. [Google Scholar] [CrossRef]
  58. Caves, D.W.; Christensen, L.R.; Diewert, W.E. The economic theory of index numbers and the measurement of input, output, and productivity. J. Econom. Soc. 1982, 1, 1393–1414. [Google Scholar] [CrossRef]
  59. Charnoz, P.; Lelarge, C.; Trevien, C. Communication costs and the internal organisation of multi-plant businesses: Evidence from the impact of the French high-speed rail. Econ. J. 2018, 128, 949–994. [Google Scholar] [CrossRef]
  60. Baron, R.M.; Kenny, D.A. The moderator-mediator variable distinction in social psychological research: Conceptual, strategic, and statistical considerations. J. Personal. Soc. Psychol. 1986, 51, 1173. [Google Scholar] [CrossRef]
  61. Fan, J.H.; Xiao, Z.H. Analysis of spatial correlation network of China’s green innovation. J. Clean. Prod. 2021, 299, 126815. [Google Scholar] [CrossRef]
  62. Xiao, Y.; Ma, D.; Zhang, F.; Zhao, N.; Wang, L.; Guo, Z.; Zhang, J.; An, B.; Xiao, Y. Spatiotemporal differentiation of carbon emission efficiency and influencing factors: From the perspective of 136 countries. Sci. Total Environ. 2023, 879, 163032. [Google Scholar] [CrossRef] [PubMed]
  63. Luo, Y.; Lu, Z.; Wu, C. Can internet development accelerate the green innovation efficiency convergence: Evidence from China. Technol. Forecast. Soc. Chang. 2023, 189, 122352. [Google Scholar] [CrossRef]
  64. Zhai, X.; An, Y. The relationship between technological innovation and green transformation efficiency in China: An empirical analysis using spatial panel data. Technol. Soc. 2021, 64, 101498. [Google Scholar] [CrossRef]
  65. Fan, F.; Lian, H.; Liu, X.; Wang, X. Can environmental regulation promote urban green innovation Efficiency? An empirical study based on Chinese cities. J. Clean. Prod. 2021, 287, 125060. [Google Scholar] [CrossRef]
  66. Jeong, S.; Lee, S. What drives technology convergence? Exploring the influence of technological and resource allocation contexts. J. Eng. Technol. Manag. 2015, 36, 78–96. [Google Scholar] [CrossRef]
  67. Jeong, S.; Kim, J.C.; Choi, J.Y. Technology convergence: What developmental stage are we in? Scientometrics 2015, 104, 841–871. [Google Scholar] [CrossRef]
  68. Chen, Y.; Shen, L.; Zhang, X.; Chen, Y. Industry convergence and value innovation: A bibliometric analysis and systematic review. Kybernetes 2023, 52, 4576–4610. [Google Scholar] [CrossRef]
  69. Ye, X.; Wang, J.; Sun, R. The coupling and coordination relationship of the digital economy and tourism industry from the perspective of industrial integration. Eur. J. Innov. Manag. 2024, 27, 1182–1205. [Google Scholar] [CrossRef]
  70. Lyu, Y.W.; Wang, W.Q.; Wu, Y.; Zhang, J. How does digital economy affect green total factor productivity? Evidence from China. Sci. Total Environ. 2023, 857, 159428. [Google Scholar] [CrossRef]
  71. Cheng, Y.W.; Hu, W.M. Distortions, misallocation and losses: Theory and application. China Econ. Q. 2011, 10, 1401–1422. [Google Scholar]
  72. Wang, M.; Zhang, X.; Hu, Y. The green spillover effect of the inward foreign direct investment: Market versus innovation. J. Clean. Prod. 2021, 328, 129501. [Google Scholar] [CrossRef]
  73. Zhao, X.; Sun, B. The influence of Chinese environmental regulation on corporation innovation and competitiveness. J. Clean. Prod. 2016, 112, 1528–1536. [Google Scholar] [CrossRef]
  74. Yuan, H.; Feng, Y.; Lee, J.; Liu, H.; Li, R. The spatial threshold effect and its regional boundary of financial agglomeration on green development: A case study in China. J. Clean. Prod. 2020, 244, 118670. [Google Scholar] [CrossRef]
  75. Xu, Q.; Li, X.; Guo, F. Digital transformation and environmental performance: Evidence from Chinese resource-based enterprises. Corp. Soc. Responsib. Environ. Manag. 2023, 30, 1816–1840. [Google Scholar] [CrossRef]
  76. You, J.; Zhang, B. The impact and spatial spillover effect of traditional culture on urban green innovation: Empirical evidence from China. J. Environ. Manag. 2024, 369, 122303. [Google Scholar] [CrossRef]
Figure 1. The development tendency and spatial distribution of China’s (municipal) green innovation efficiency. (a) The time series of green innovation efficiency from 2006 to 2021, with the horizontal axis representing the time and the vertical one representing the value of green innovation efficiency. The blue curve reveals the change in China’s overall green innovation efficiency; the red curve shows the change in the eastern region of China; the gray curve reflects the change in its central region; and the yellow curve illustrates the change in its western region. (b) The spatial distribution of green innovation efficiency across 30 provinces of China in 2021.
Sustainability 17 00492 g001
Figure 2. The development tendency and spatial distribution of China’s (municipal) CAMMS. (a) The time series of CAMMS from 2006 to 2021, with the horizontal axis representing the time and the vertical one showcasing the CAMMS value. The blue curve reveals the change in CAMMS across China; the red curve shows the change in its eastern region; the gray curve reflects the change in its central region; and the yellow curve illustrates the change in its western region. (b) The spatial distribution of CAMMS values across 30 provinces of China in 2021.
Sustainability 17 00492 g002
Figure 3. Moran’s I scatter plots of China’s (municipal) green innovation efficiency in 2006 and 2021. (a,b) display the Moran scatter plots of the green innovation efficiency for 30 provinces of China in 2006 and 2021. The horizontal axis indicates the standardized values of the green innovation efficiency, while the vertical axis shows the spatial lag of this efficiency.
Sustainability 17 00492 g003
Figure 4. The distribution of spatial spillover effect with geographical distance. Note: ***, **, and * indicate significance levels at 1%, 5%, and 10%, respectively.
Sustainability 17 00492 g004
Table 1. Construction of CAMMS index system.
PrimarySecondaryAdvanced ManufacturingModern Service
DefinitionDefinition
Production factor matchingLabor forceThe number of employees in AMThe number of employees in MS
Capital investmentFixed asset investment in AMFixed asset investment in MS
Market business matchingOutput scaleOutput value of AMThe added value of MS
Industrial scaleNumber of companies in AMNumber of companies in KIBS
Industrial structureOutput value of AM/GDPThe added value of MS/GDP
Workforce structureNumber of AM employees/Number of manufacturing employeesNumber of MS employees/Number of service employees
Industrial scale structureNumber of companies in AM/Number of companies in manufacturingNumber of companies in MS/Number of companies in service
Investment structureInvestment in fixed assets of AM/Investment in fixed assets of manufacturingInvestment in fixed assets of MS/Investment in fixed assets of service
Output efficiencyProfit margin in AMLabor productivity in MS
Investment efficiencyProfit margin in AM/Investment in fixed assets of AMThe added value of MS/Investment in fixed assets of MS
Spatial layout matchingLabor force location entropy(Regional AM employment/Regional employment)/(National AM employment/National employment)(Regional MS employment/Regional employment)/(National MS employment/National employment)
Capital location entropy(Regional AM capital/Regional capital)/(National AM capital/National capital)(Regional MS capital/Regional capital)/(National MS capital/National capital)
R&D labor force location entropy(Number of R&D personnel in AM/Regional number of R&D personnel)/(National number of R&D personnel in AM/National number of R&D personnel)(Number of R&D personnel in MS/Regional Number of R&D personnel)/(National number of R&D personnel in MS/National Number of R&D personnel)
R&D capital location entropy(Internal expenditure on R&D in AM/Regional internal expenditure on R&D)/(Internal expenditure on R&D in AM/National internal expenditure on R&D)(Internal expenditure on R&D in MS/Regional internal expenditure on R&D)/(Internal expenditure on R&D in MS/National internal expenditure on R&D)
Innovation matchingR&D labor inputNumber of R&D personnel in AMNumber of R&D personnel in R&D institutions
R&D capital inputInternal expenditure of R&D funds in AMInternal expenditure of R&D funding in R&D institutions
R&D project inputInvestment in R&D projects from AMInvestment in innovative projects from R&D institutions
Table 2. Classification standard of CAMMS.
Coupling Coordination LevelTypeCoupling Coordination LevelType
[0.000, 0.100)Extremely maladjusted[0.500, 0.600)Barely coordinated
[0.100, 0.200)Seriously maladjusted[0.600, 0.700)Primary coordination
[0.200, 0.300)Moderately maladjusted[0.700, 0.800)Intermediate coordination
[0.300, 0.400)Slightly maladjusted[0.800, 0.900)Good coordination
[0.400, 0.500)Nearly maladjusted[0.900, 1.000]High-quality coordination
Table 3. The statistical description of variables.
VariableObs.MeanS. D.MinMax
GIE4800.7610.3470.0801.761
CAMMS4800.7420.0870.6201.000
AIS4801.7780.0871.6202.025
FA480−1.0430.666−5.2980.580
OPEN4806.2641.9240.5399.615
PGDP4809.2530.4878.09010.760
ER4802.3450.947−2.4594.703
EDU4807.7960.3216.8768.817
Note: The prefix “ln” before variables denotes taking natural logistic form, the same as in the following tables.
Table 4. Collinearity tests.
VariableVIF1/VIF
PGDP2.890.345
CAMMS2.840.352
EDU2.780.359
OPEN1.910.523
ER1.230.813
Mean VIF2.33
Table 5. Stationarity tests.
VariableStatisticp Value
GIE0.6690.969
CAMMS0.7230.998
OPEN0.7480.999
PGDP0.6460.915
ER0.6450.909
EDU0.7020.995
D_GIE0.034 ***0.000
D_CAMMS0.245 ***0.000
D_OPEN0.242 ***0.000
D_PGDP−0.013 ***0.000
D_ER0.252 ***0.000
D_EDU0.110 ***0.000
Note: *** indicates significance levels at 1%.
Table 6. Regression results of the impact of CAMMS on green innovation efficiency.
VariableGIEGIEGIEGIEGIE
(1)(2)(3)(4)(5)
CAMMS0.560 ***
(5.49)
0.830 ***
(6.79)
0.463 ***
(3.54)
0.516 ***
(3.94)
0.351 **
(2.21)
OPEN −0.270 ***
(−3.88)
−0.897 ***
(−7.52)
−0.924 ***
(−7.79)
−0.985 ***
(−8.01)
PGDP 0.222 ***
(6.35)
0.212 ***
(6.08)
0.213 ***
(6.13)
ER −0.099 ***
(−2.92)
−0.124 ***
(−3.40)
EDU 0.086 *
(1.83)
_Cons−0.062
(−0.83)
−0.120
(−1.60)
−1.594 ***
(−6.55)
−1.608 ***
(−6.67)
−1.660 ***
(−6.85)
ProvinceYesYesYesYesYes
YearYesYesYesYesYes
R20.5480.5610.5950.6020.604
N480480480480480
Note: ***, **, and * indicate significance levels at 1%, 5% and 10%, respectively, and T-values are reported in parentheses.
Table 7. Results of mechanism verification.
VariableGIE
(1)
Path I:
Advanced Industrial Structure
Path II:
Factor Allocation
AIS
(2)
GIE
(3)
FA
(4)
GIE
(5)
CAMMS0.351 **
(2.21)
0.187 ***
(5.49)
0.333 **
(2.09)
−0.088 *
(−1.73)
0.344 **
(2.15)
AIS 0.682 ***
(2.90)
FA −0.284 *
(−1.88)
OPEN−0.985 ***
(−8.01)
0.246 ***
(9.72)
−1.155 ***
(−8.45)
0.447 ***
(11.28)
−0.859 ***
(−6.07)
PGDP0.213 ***
(6.13)
0.076 ***
(10.71)
0.159 ***
(4.08)
0.062 ***
(5.62)
0.229 ***
(6.33)
ER−0.124 ***
(−3.40)
−0.038 ***
(−5.05)
−0.088 **
(−2.34)
−0.048 ***
(−4.11)
−0.127 ***
(−3.40)
EDU0.086 *
(1.83)
0.014
(1.47)
0.084 *
(1.76)
0.008
(0.56)
0.096 **
(2.01)
_Cons−1.660 ***
(−6.85)
0.825 ***
(16.66)
−2.225 ***
(−7.18)
1.317 ***
(17.01)
−1.287 ***
(−4.10)
ProvinceYesYesYesYesYes
YearYesYesYesYesYes
R20.6040.8810.6250.8160.620
N480480480480480
Note: ***, **, and * indicate significance levels at 1%, 5%, and 10%, respectively, and T-values are reported in parentheses.
Table 8. Global Moran’s I for green innovation efficiency during 2006–2021.
YearMoran’s Ip ValueYearMoran’s Ip Value
20060.2480.00120140.2630.001
20070.2460.00220150.2370.003
20080.1920.00820160.1980.007
20090.1900.01020170.1440.033
20100.2220.0042018−0.0080.382
20110.1680.01820190.0230.273
20120.2360.00320200.2420.002
20130.3400.00020210.1860.011
Table 9. Spatial econometric regression results.
VariableSLMSEMSDM
(1)(2)(3)
CAMMS0.469 ***
(3.64)
0.410 ***
(2.86)
0.339 **
(2.54)
OPEN−0.878 ***
(−7.73)
−0.834 ***
(−7.11)
−0.900 ***
(−7.73)
PGDP0.206 ***
(6.19)
0.208 ***
(6.07)
0.247 ***
(7.20)
ER−0.080 **
(−2.47)
−0.058 *
(−1.72)
−0.104 ***
(−3.12)
EDU0.202 *
(1.69)
0.198
(1.51)
0.437 ***
(3.01)
W*CAMMS 1.936 ***
(5.19)
W*OPEN −0.010
(−0.04)
W*PGDP −0.241 **
(−2.45)
W*ER −0.196 ***
(−2.84)
W*EDU −0.360
(−1.21)
rho0.325 ***
(4.53)
0.257 ***
(2.93)
0.147 *
(1.76)
sigma2_e0.019 ***
(14.86)
0.020 ***
(14.88)
0.018 ***
(14.96)
ProvinceYesYesYes
YearYesYesYes
LR test18.00 ***22.68 ***-
Wald test18.20 ***23.20 ***-
Log-likelihood242.590237.370263.602
R20.2340.2280.516
N480480480
Note: ***, **, and * indicate significance levels at 1%, 5%, and 10%, respectively, and T-values are reported in parentheses.
Table 10. Decomposition based on the results of SDM.
VariableDirect EffectIndirect EffectTotal effect
(1)(2)(3)
CAMMS0.394 ***
(2.89)
2.299 ***
(5.79)
2.692 ***
(6.52)
OPEN−0.910 ***
(−7.99)
−0.158
(−0.47)
−1.067 ***
(−2.88)
PGDP0.245 ***
(7.31)
−0.242 **
(−2.19)
0.003
(0.03)
ER−0.110 ***
(−3.26)
−0.241 ***
(−2.91)
−0.351 ***
(−3.74)
EDU0.431 ***
(3.14)
−0.328
(−0.98)
0.103
(0.35)
Note: ***, **, and * indicate significance levels at 1%, 5%, and 10%, respectively, and T-values are reported in parentheses.
Table 11. Results of robustness check.
VariableReplace the Spatial Weight MatrixReplace the Explained VariableReplace the Explanatory VariablesConsider the Lag
(1)(2)(3)(4)
L.CAMMS 0.178 ***
(2.99)
CAMMS0.767 ***
(5.65)
0.937 ***
(4.40)
0.241 ***
(5.23)
OPEN−0.943 ***
(−7.93)
−0.550 ***
(−2.97)
−0.855 ***
(−7.43)
−0.915 ***
(−6.97)
PGDP0.227 ***
(5.24)
0.362 ***
(6.67)
0.216 ***
(6.55)
0.205 ***
(5.97)
ER−0.096 ***
(−2.83)
−0.517 ***
(−9.81)
−0.177 ***
(−4.92)
−0.138 ***
(−3.69)
EDU0.183
(1.48)
0.876 ***
(3.81)
0.455 ***
(3.20)
0.097 **
(2.08)
W*CAMMS1.234 ***
(3.42)
5.342 ***
(8.78)
0.910 ***
(6.42)
W*OPEN−0.894 ***
(−2.69)
2.000 ***
(4.41)
0.256
(0.86)
W*PGDP−0.029
(−0.28)
−0.970 ***
(−6.22)
−0.204 **
(−2.36)
W*ER−0.264 **
(−2.14)
0.070
(0.62)
−0.372 ***
(−4.98)
W*EDU0.399
(0.56)
−0.626
(−1.32)
−0.040
(−0.14)
rho/lambda0.171 **
(1.98)
0.126 *
(1.65)
0.091
(1.08)
sigma2_e0.019 ***
(14.94)
0.045 ***
(14.97)
0.017 ***
(14.99)
ProvinceYesYesYes
YearYesYesYes
Loglikelihood246.85557.036273.128
R20.3090.3600.5770.640
N480480480450
Note: ***, **, and * indicate significance levels at 1%, 5%, and 10%, respectively, and T-values are reported in parentheses.
Table 12. Heterogeneity analysis based on the region.
VariableEastern RegionCentral and Western Regions
Direct EffectIndirect EffectTotal EffectDirect EffectIndirect EffectTotal Effect
(1)(2)(3)(4)(5)(6)
CAMMS1.454 ***
(6.80)
3.066 ***
(7.39)
4.520 ***
(7.96)
0.560 **
(2.08)
0.418
(0.78)
0.979
(1.50)
OPEN−0.514 ***
(−2.79)
−4.027 ***
(−9.64)
−4.541 ***
(−9.76)
−1.014 ***
(−5.96)
0.348
(0.89)
−0.666
(−1.45)
PGDP0.412 ***
(5.30)
0.736 ***
(4.44)
1.148 ***
(6.93)
0.193 ***
(3.08)
−0.171
(−1.22)
0.021
(0.16)
ER−0.066
(−1.50)
−0.014
(−0.23)
−0.080
(−0.94)
−0.120 *
(−1.66)
0.140
(0.77)
0.020
(0.10)
EDU−0.125 ***
(−5.95)
−0.238 ***
(−6.39)
−0.363 ***
(−7.15)
0.138
(1.01)
0.218
(0.31)
0.356
(0.47)
Note: ***, **, and * indicate significance levels at 1%, 5%, and 10%, respectively.
Table 13. Heterogeneity analysis based on the region.
Variable2006–20102011–20182019–2021
Direct EffectIndirect EffectTotal EffectDirect EffectIndirect EffectTotal EffectDirect EffectIndirect EffectTotal Effect
(1)(2)(3)(4)(5)(6)(7)(8)(9)
CAMMS0.201
(0.56)
−1.535
(−1.37)
−1.334
(−1.07)
1.157 ***
(6.76)
2.298 ***
(5.74)
3.454 ***
(7.58)
0.720 ***
(2.76)
2.470 **
(2.35)
3.190 ***
(2.63)
OPEN−1.089 ***
(−3.25)
−2.896 **
(−2.13)
−3.984 **
(−2.55)
−1.084 ***
(−7.04)
−0.626
(−1.52)
−1.711 ***
(−3.95)
−0.830 ***
(−3.86)
0.435
(0.43)
−0.394
(−0.36)
PGDP0.333 ***
(3.12)
0.785 **
(2.05)
1.117 ***
(2.76)
0.305 ***
(4.88)
−0.370 ***
(−3.08)
−0.065
(−0.66)
0.177 ***
(2.66)
−0.303
(−1.24)
−0.126
(−0.52)
ER−0.226 ***
(−2.83)
−0.134
(−0.34)
−0.360
(−0.84)
−0.018
(−0.42)
−0.161
(−1.19)
−0.180
(−1.32)
−0.156 **
(−2.29)
−0.951 **
(−2.47)
−1.107 ***
(−2.68)
EDU2.520
(0.66)
5.666
(0.38)
8.187
(0.58)
-0.017
(−0.09)
2.418 ***
(2.90)
2.401 ***
(2.91)
0.153
(0.88)
−1.150
(−0.83)
−0.998
(−0.66)
Note: ***, **, and * indicate significance levels at 1%, 5%, and 10%, respectively, and T-values are reported in parentheses.
Disclaimer/Publisher’s Note: The statements, opinions and data contained in all publications are solely those of the individual author(s) and contributor(s) and not of MDPI and/or the editor(s). MDPI and/or the editor(s) disclaim responsibility for any injury to people or property resulting from any ideas, methods, instructions or products referred to in the content.

