Article

Research on Urbanization and Ecological Environmental Response: A Case Study of Zhengzhou City

1
School of Marxism, Hohai University, Nanjing 210024, China
2
School of Medicine, Zhejiang Ocean University, Zhoushan 316022, China
3
Marine Science and Technology College, Zhejiang Ocean University, Zhoushan 316022, China
*
Author to whom correspondence should be addressed.
Sustainability 2025, 17(2), 458; https://doi.org/10.3390/su17020458
Submission received: 18 October 2024 / Revised: 29 December 2024 / Accepted: 7 January 2025 / Published: 9 January 2025
(This article belongs to the Special Issue Urbanization and Environmental Sustainability—2nd Edition)

Abstract

:
The relationship between the urbanization process and the ecological environment is key to regional development. As a typical Chinese city undergoing rapid urban development, Zhengzhou is an important representative of the urbanization process and the changes in the ecological environment. In this study, we explored the response relationship between urban development and the ecological environment in Zhengzhou, using night light data, Landsat satellite imagery, and population data from this city. The analysis of the NTL data showed that there were three stages of development in Zhengzhou from 2000 to 2021: the slow expansion stage from 2000 to 2003, the steady expansion stage from 2004 to 2011, and the rapid expansion stage from 2012 to 2021. The multi-year average RSEI value of Zhengzhou was less than 0.4, and it showed a trend of first increasing and then decreasing, indicating that the quality of the city’s ecological environment was poor and indirectly indicating that the urbanization degree of the region was significant. The changes in the NTL and RSEI indicate that urban development has significantly reduced the quality of the city’s ecological environment, particularly after Zhengzhou entered the stage of rapid expansion. The coupling degree (C) and coupling coordination degree (D) between urbanization and the ecological environment showed a decreasing trend, and the average value was lower than 0.3. This indicates that the ecological environment in Zhengzhou has been seriously affected by the process of urbanization, and the natural ecology has been strongly impacted by human activity. C and D also showed a decreasing trend from 2000 to 2015 but increased from 2016 to 2021, indicating that the ecological environment in Zhengzhou has gradually improved. The degree of coordination D between urbanization and the ecological environment in Zhengzhou had a strong negative correlation with the population size and growth rate but a positive correlation with the Moran value, indicating that an increase in the population increases the burden on the ecological environment. However, a reasonable spatial population distribution is conducive to improving regional urban–ecological coordination.

1. Introduction

Urban development and ecological security are important issues in regional development research. Over the past three decades, China’s economy has developed rapidly, and the urbanization rate has increased, rising from 17.92% in 1978 to 60.60% in 2019, indicating the country’s rapid urbanization rate [1]. While urbanization and socioeconomic development are increasing, urbanization also leads to a reduction in agricultural land [2,3,4], a reduction in wildlife habitats [3,5,6], and changes in the regional hydrology and climate [7,8,9]. The continuous population growth during the process of urbanization has led to an increase in the demand for land resources such as housing, commercial land, and infrastructure; this has changed the original ecological environment and placed great pressure on the ecosystem. It is crucial to quantitatively evaluate the relationship between urbanization and the ecological environment in order to facilitate the organic development of the two, which is important to promote regional socioeconomic development and ecological stability.
The application of satellite remote sensing technology in monitoring land use, vegetation cover, and water environment reproduction is becoming increasingly prevalent, and it is possible to objectively and quantitatively analyze the spatiotemporal characteristics of urban development and land use change using multi-source remote sensing data. Due to the close relationship between night lighting and human activities, night-time light (NTL) data can be used to characterize the urbanization process and human activities. Compared with traditional visible, near-infrared, or radar sensors, the night light data obtained via satellite remote sensing have better stability, speeds, accuracy, and authenticity, and they can directly reflect human night-time activities. In recent years, night-time lighting has been widely used in research on urbanization and population spatial agglomeration [10,11], regional economic development [12,13,14], electricity consumption, carbon emissions, and other areas. However, due to the differences in the distribution of night light sources, a single set of night light data is not sufficient to describe the spatial dynamics of human settlements [15]; moreover, land use/land cover types and their evolution need to be carefully considered [16]. Therefore, the collaborative use of night light data and land use data is of great importance for the study of rapid urban development.
Traditional eco-environmental monitoring methods limit the scope of the study area, and the generalization of the regional eco-environment is complex. In recent years, remote sensing measurement technology has also played an important role in the field of regional ecology and ecological quality assessment. Some remotely sensed indices have been used to describe the current state of the ecological environment, such as the normalized vegetation index (NDVI) [17,18,19,20], the leaf area index (LAI) [21,22], and the enhanced vegetation index (EVI) [23,24,25,26]. In these studies, a single remote sensing ecological index is used to reveal changes in the ecological environment. However, in an ecosystem composed of multiple elements, one or two ecological factors cannot accurately reflect the regional ecological status, and it is difficult to comprehensively evaluate the ecological environment. Xu et al. (2019) coupled the inverted vegetation index, humidity index, land surface temperature, and building–bare soil index and proposed a remote sensing ecological index (RSEI) to measure the regional ecological situation. This enabled them to quickly monitor and evaluate the regional environment and achieve the visualization, spatiotemporal analysis, and change trend prediction of regional ecological environment changes [27]. The RSEI overcomes the shortcomings of a single indicator and facilitates the aggregation of sub-indicators, and it has been successfully applied to analyze, model, and predict the regional ecological characteristics in several regions [28,29,30]. The RSEI model is visual, scalable, and comparable, and its reliability and credibility have been verified in previous studies at different spatial and temporal scales [31,32,33,34]. Due to its concise calculation method and strong indicative nature, the RSEI has been widely used in ecological security assessment studies in various areas.
In China, there are many regions that have not yet completed industrialization and urbanization and are still in the “accelerated development” stage of urbanization [35]. In order to sustain this rapid development and maintain a good quality of life for the Chinese people, it is necessary to study the degree of coordination between urbanization and ecological environment [36]. Many statistical methods, such as the environmental Kuznets curve [29,37,38,39], the gray system model, and the double exponential model have been used to examine how industrialization pushes negative impacts on environmental quality [40,41]. When the statistical data obtained by the traditional method are detailed and sufficient, these models have proven to be effective. In recent years, researchers have also begun to use the coupling model to study the nonlinear relationship between urbanization and the ecological environment. For example, by analyzing the coupling coordinated degree between urbanization and air environment in Wuhan from 1996 to 2013, it was found that Wuhan changed from slightly unbalanced development to almost balanced development, and then entered a period of superior balanced development [42]. Through the analysis of the coupling relationship between urbanization and the ecological environment in 209 countries and regions, it was found that the values of the coupling coordination degree vary widely among countries and regions, both quantitatively and spatially [43]. An analysis of the coupling adjustment and spatial differentiation between urbanization and ecological environment in Ya’an City found that the degree of coupling adjustment between urbanization and ecological environment has been increasing over the years, from moderate imbalance to high adjustment [44]. These studies suggest that the use of a coupled model is effective in assessing the relationship between the ecological environment and urbanization. There are still many cities in China undergoing urbanization; it is difficult and very expensive to obtain detailed statistical data for each city, which is not conducive for the government to make effective and quick decisions. In this article, we choose Zhengzhou as a typical representative city to analyze the relationship between urbanization and ecological environment in central Chinese cities, and provide a reference for the government to make relevant policies.
As a typical example of a city undergoing rapid urban development in China, Zhengzhou is a significant representative of this country’s urbanization process and the changes in its ecological environment. This work studies the relationship between the urbanization process and the ecological environment in Zhengzhou and discusses the coupling and coordination degrees of the two. The ecological security and the human–land coordination in this city are indicative and representative, and our work contributes to ecological security research focusing on rapid urbanization and development. This work uses remote sensing data to evaluate the urbanization process and the quality of the ecological environment in Zhengzhou from 2001 to 2021, studies the status of urbanization and the ecological quality and their temporal and spatial variation, and explores the degree of coupling and coordination between them. It seeks to provide theoretical guidance and a scientific basis for the management of Zhengzhou’s ecological environment.
This paper is organized as follows: Section 1 is the introduction; Section 2 describes the data and methods; Section 3 is the analysis of the results; and Section 4 presents the conclusions and discussion.

2. Materials and Methods
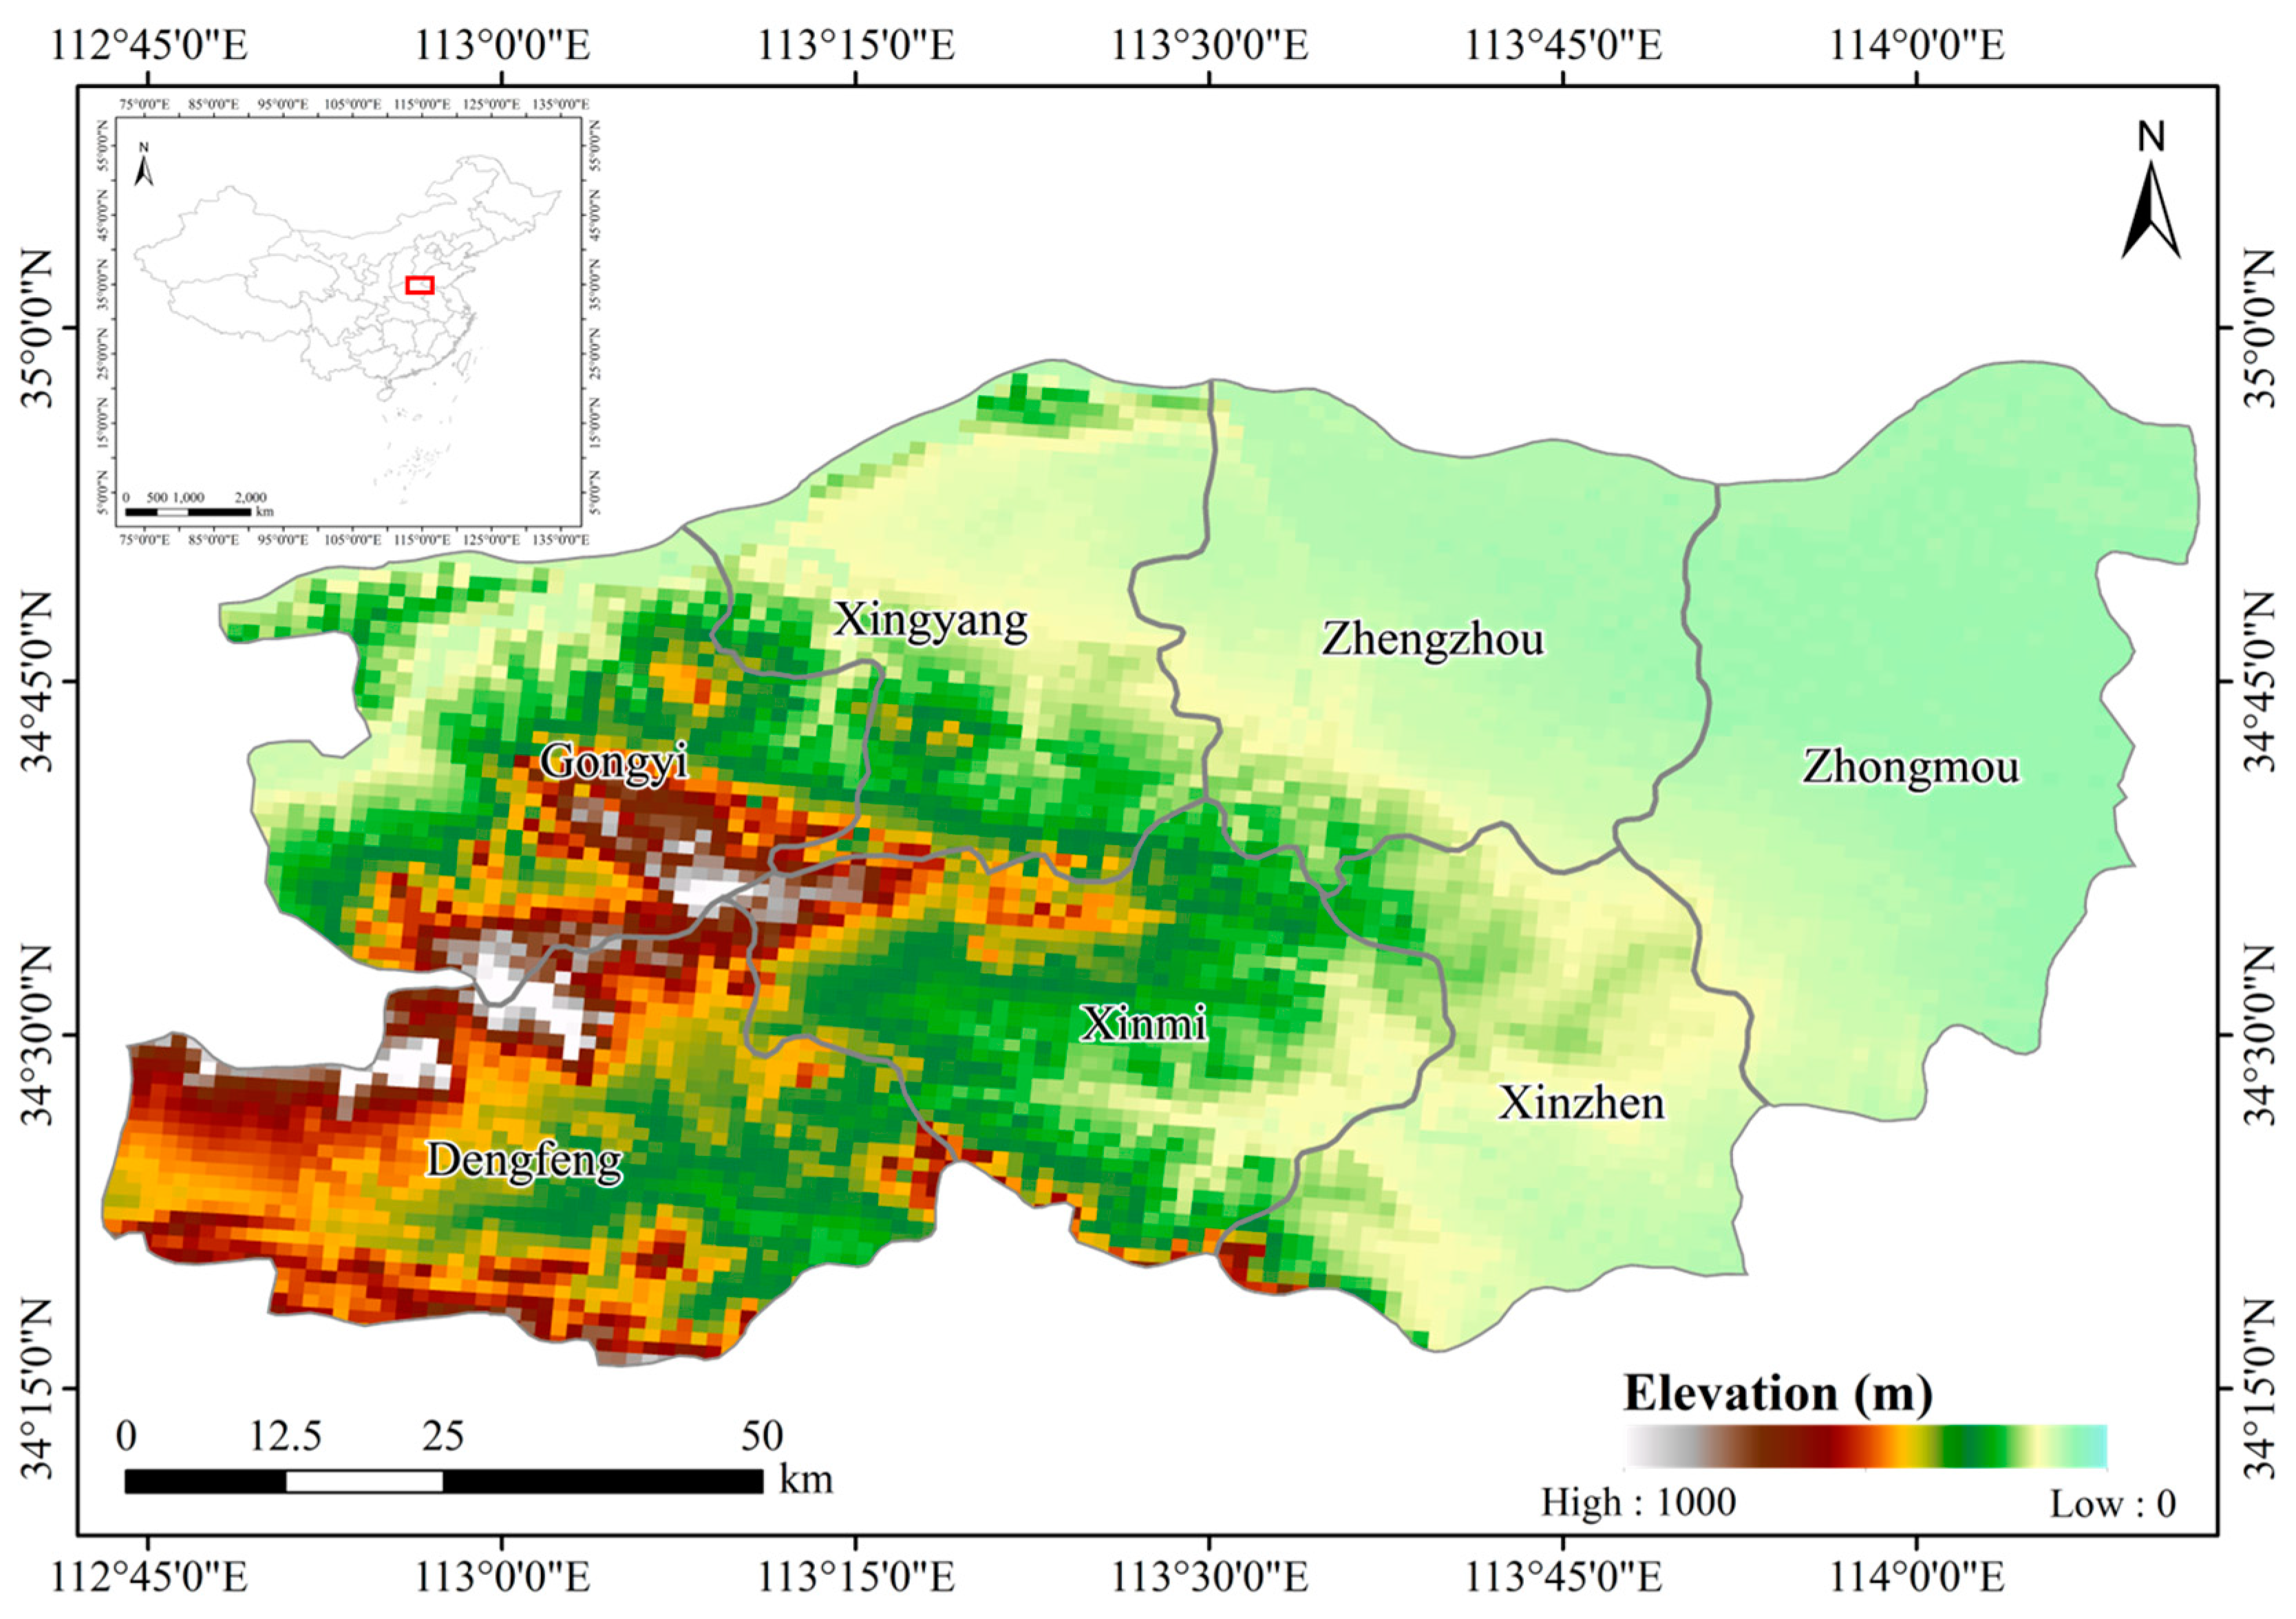
2.1. Study Area

Zhengzhou is the capital of Henan Province in China, with geographical coordinates of 34°16′~34°58′ and 112°42′~114°14′; it is located in the southern part of the North China Plain and the lower reaches of the Yellow River. Zhengzhou is a major city in Central China and an important transportation hub (Figure 1). From 2000 to 2020, Zhengzhou underwent rapid urbanization: the total population increased rapidly from 6.65 million to 12.612 million, and the construction land area increased from 1236 km2 to 2275 km2. Both the population and the amount of construction land almost doubled within a period of 20 years. By the end of 2019, Zhengzhou had a permanent population of 10.352 million, of which 7.721 million were urban residents, with an urbanization rate of 74.6%.

2.2. Data

Night light data are an important type of remote sensing data in the study of urbanization, and this work uses the night light data provided by Chen et al. (2021) to study the urban change in Zhengzhou [16]. The spatial resolution of the dataset was 500 m, and the time period was 2000–2021. The data can be downloaded from https://doi.org/10.7910/DVN/YGIVCD (accessed on 18 February 2023).
The spatial distribution data of the population were derived from the 1 km high-precision population distribution data provided by the WorldPop Hub. These data are generated by a gridded population distribution algorithm based on random forest, provided by Lloyd et al. 2019 [45]. The data can be downloaded from https://hub.worldpop.org (accessed on 9 November 2023), where population data for 2000 to 2020 are currently available. Zhengzhou’s total population and PGR data for 2000 to 2021 were derived from the statistical yearbook.
In this work, the RSEI was calculated using Landsat satellite data, and the image year covered the period of 2000 to 2021. To ensure the stability and representativeness of the RSEI, images with less than 20% cloud cover, covering May to September, were selected for the RSEI calculations. It should be noted that different Landsat satellite images from different years were selected to ensure that a sufficient number of valid pixels were retained in the subsequent processing, as shown in Table 1.

2.3. Methods

2.3.1. RSEI

According to the RSEI calculation method provided by Xu et al., 2019, the RSEI for Zhengzhou City from 2000 to 2021 was calculated. Processing was performed via three main steps. First, the four key factors of the NDVI, WET, LST, and NDBSI were calculated. Second, a principal component analysis was performed on the four key factors, and the first principal component was extracted (the contribution rate of the first principal component was >70%). Third, the extracted first principal component was normalized to obtain the final RSEI. For a detailed calculation process, please refer to [27].

2.3.2. Coupling Coordination Model

Referring to the NTL, the RSEI data were interpolated to the same resolution (same number of row and column pixels) using the linear interpolation method. Based on this, the coupling calculation between the RSEI and NTL data was performed. The coupling coordination model used in this work was as follows [12]:
C = U E / ( U + E ) 2
Here, U is the subsystem of the urbanization level, and this work uses the NTL data to refer to it (normalization); E is the ecological environment subsystem, which is denoted by the RSEI in this work (in this process, the RSEI is interpolated to the NTL with the same data resolution); C is the coupling value between the two subsystems, where the closer C is to 1, the more coordinated the two subsystems are.
Considering the possibility of a “false coordination” phenomenon whereby both subsystems would have low values, we also used the coordinated development model coupling urbanization and the ecological environment to objectively reflect the level of coordinated development:
T = α U + β E
D = C T
Here, T is the convergence of the two subsystems, which represents the comprehensive harmony index between urbanization and the ecological environment; C represents the coupling degree between urbanization and the ecological environment; D is the coupling coordination between urbanization and the ecological environment; and alpha and beta are indeterminate coefficients. Considering that the urban system has a strong influence on the local ecological environment during the urbanization process in Zhengzhou, and the ecological environment is only one of the factors affecting the urbanization process, this study assigns greater weight to the urbanization system, with alpha and beta values of 0.65 and 0.35, respectively [12].

3. Results

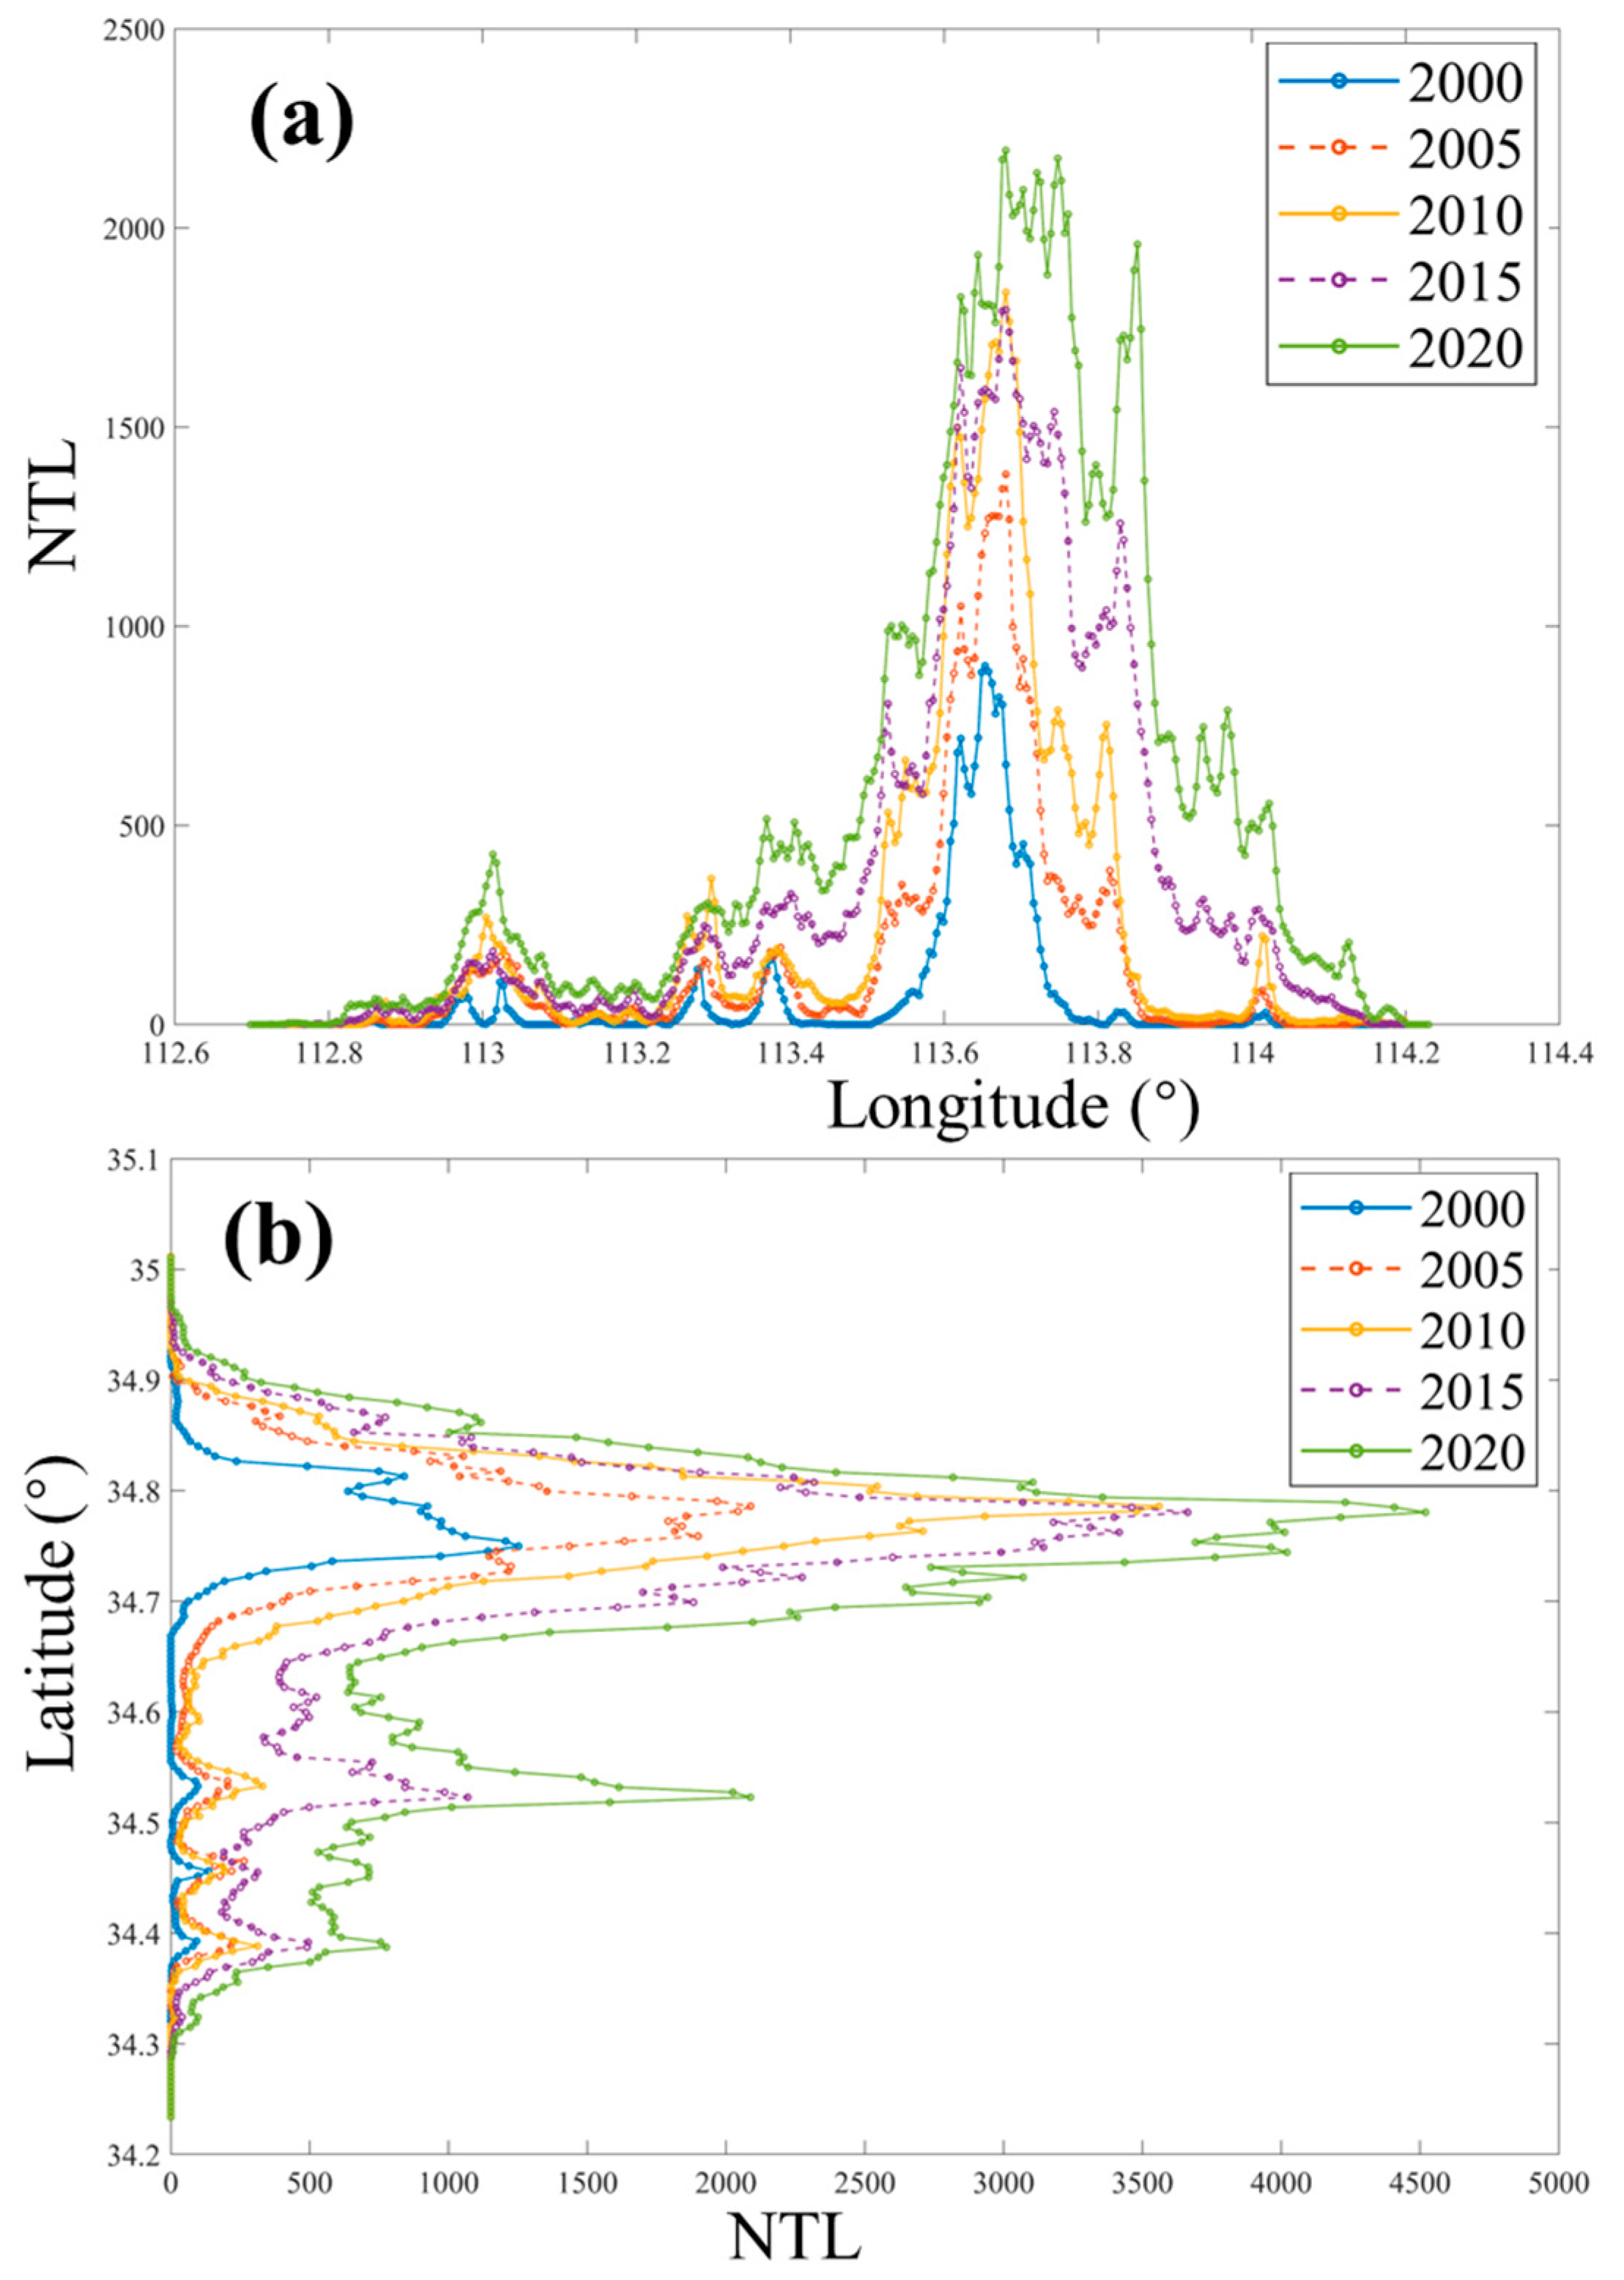
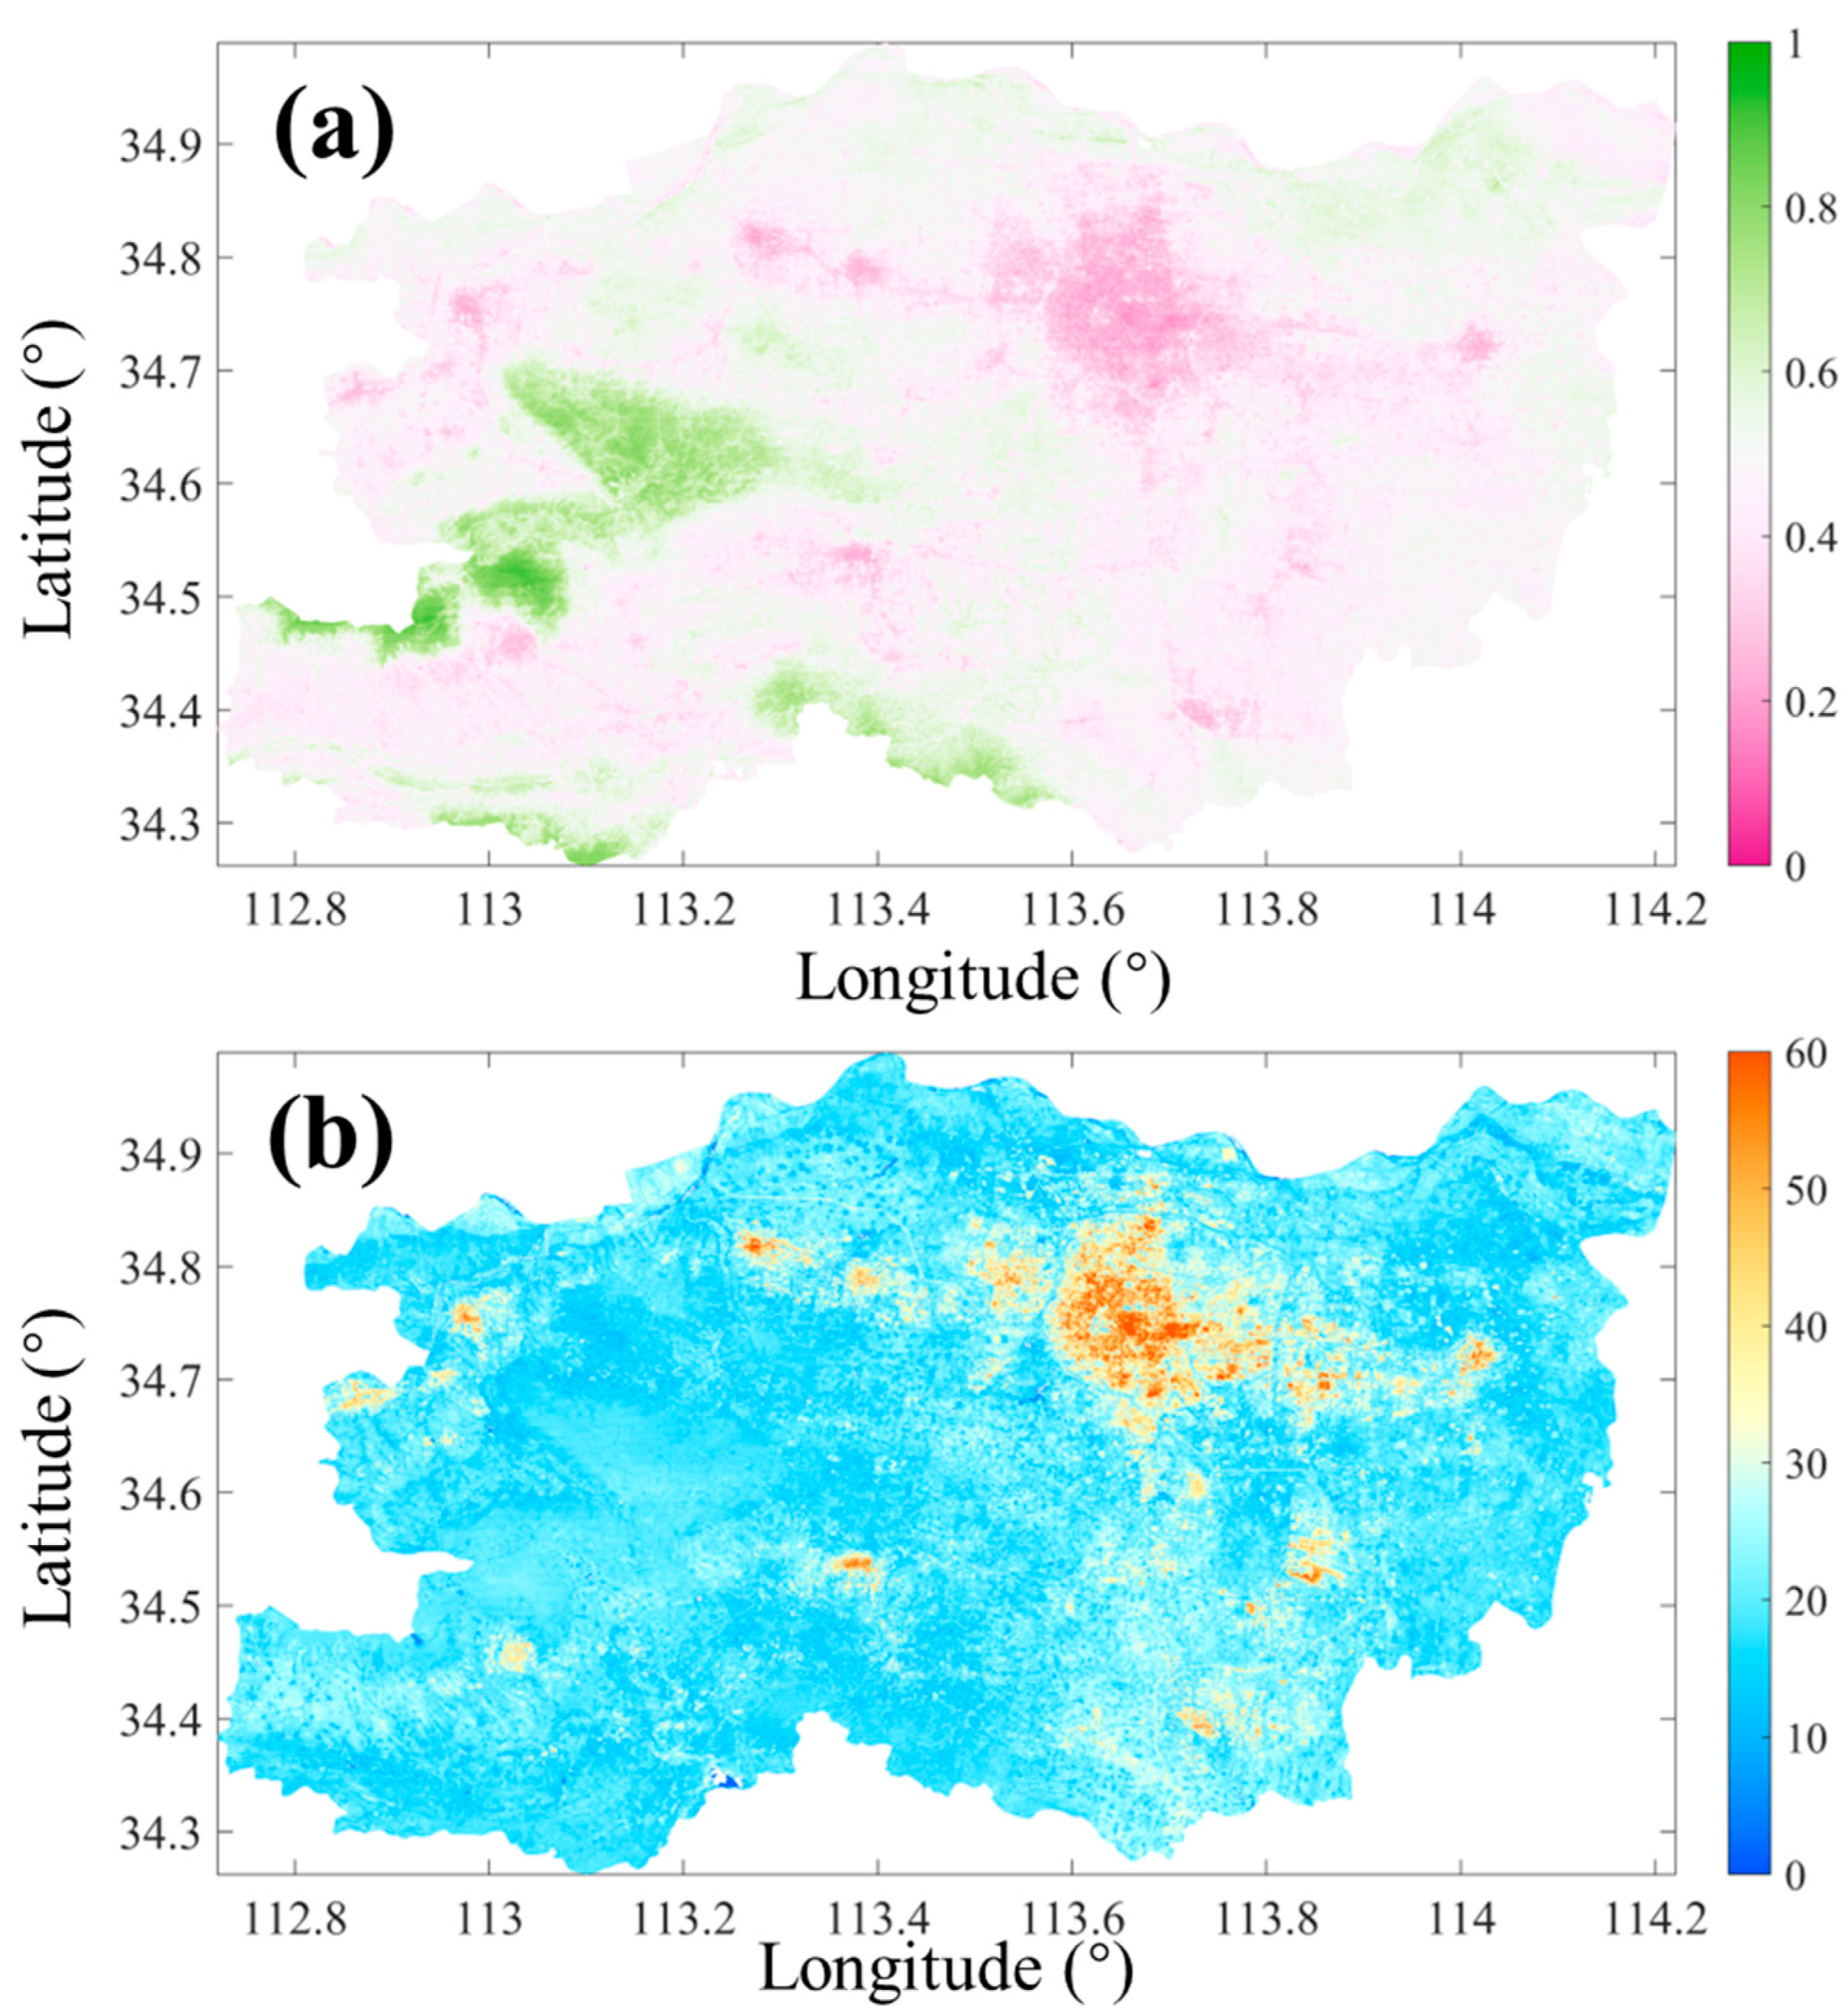
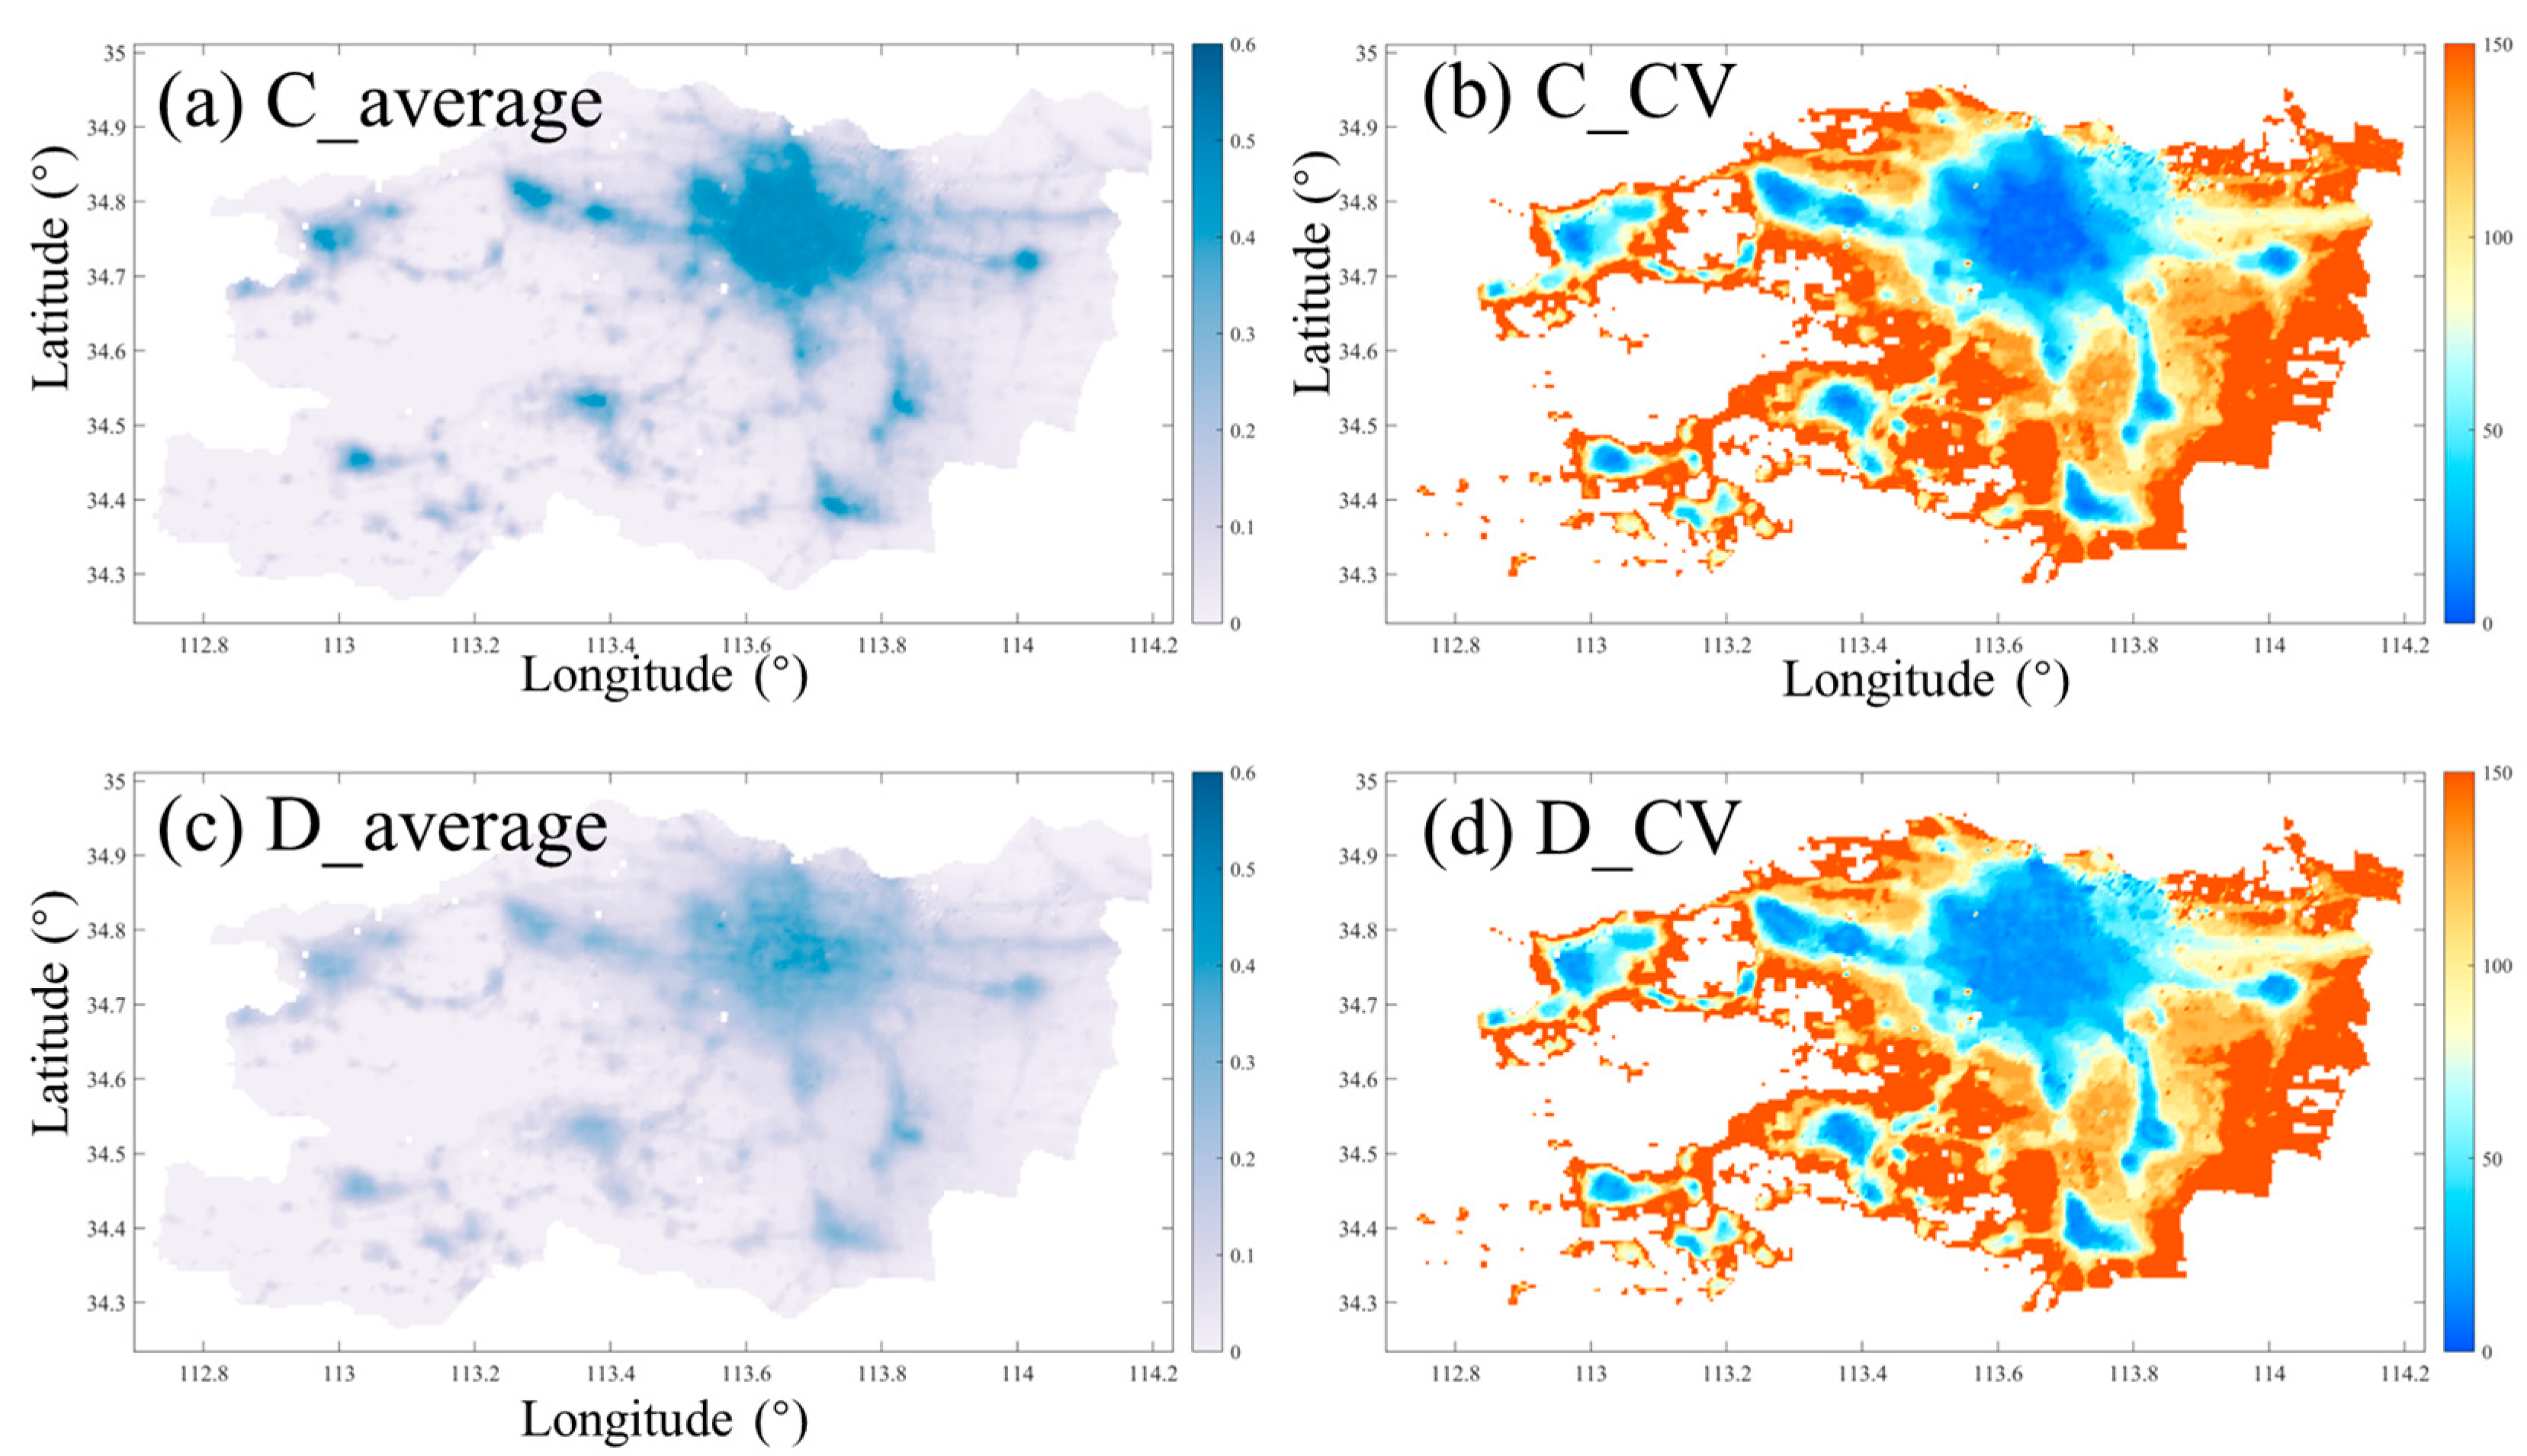
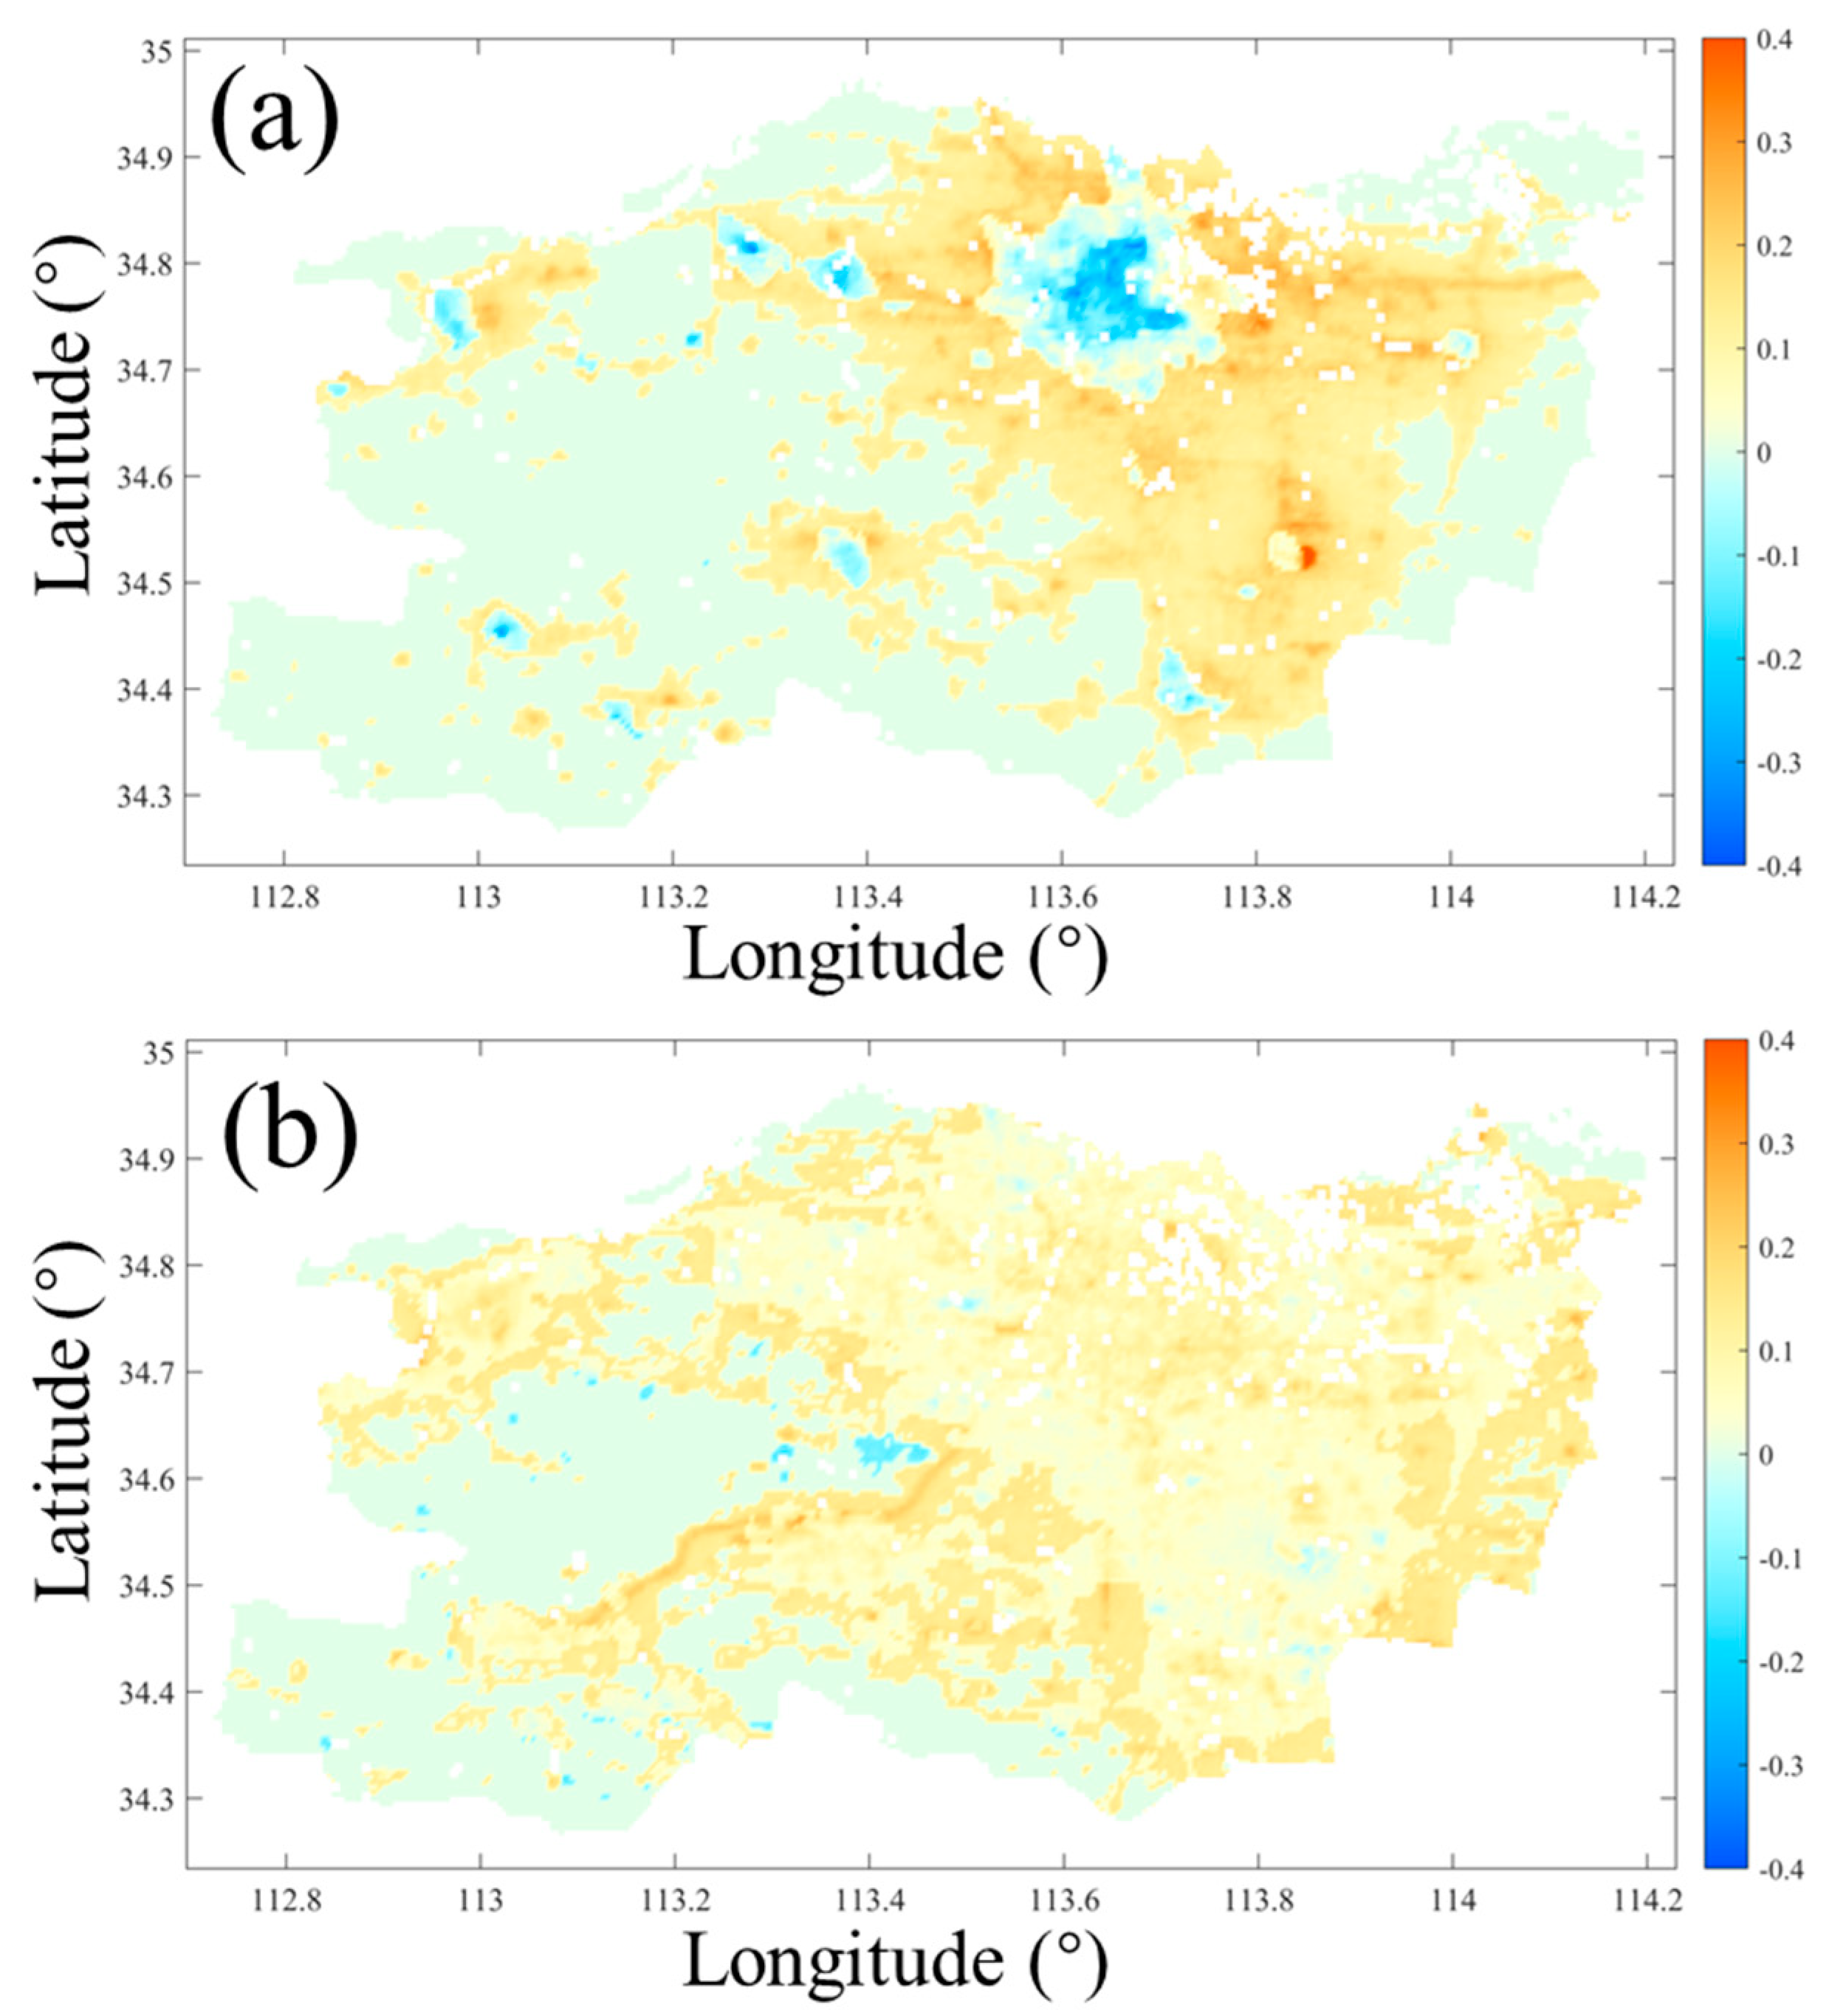
3.1. Characteristics of NTL and RSEI

There was an overall increasing trend in the NTL of Zhengzhou City from 2000 to 2021, and the NTL was mainly concentrated in the northeastern part of the map, with Zhengzhou City as the core (Figure 2). In 2000, the night light coverage area (blue area) was mainly concentrated in Zhengzhou’s city center, which is located in the northern part of Zhengzhou. From 2000 to 2021, the coverage of night light in Zhengzhou City gradually increased in all directions, with this area as the center. However, the characteristics of the NTL showed three different stages over time. From 2000 to 2003, the coverage of NTL began to increase, but it expanded slowly around the main urban area based on the coverage in 2000; this represented the slow expansion stage. During the period of 2004 to 2011, the coverage of the NTL increased significantly compared to the year 2000, and sub-cities started to emerge. However, the expansion rate did not increase significantly during these 9 years, indicating a steady expansion stage. From 2012 to 2021, the coverage of NTL increased significantly, mainly expanding towards the southeast. The size of the connected cities expanded rapidly, and Zhengzhou’s urban pattern emerged in 2016. The connectivity between the main urban area and affiliated cities was strengthened, marking the rapid expansion stage in Zhengzhou City. The changes in the range of the NTL data indicate that the urbanization of Zhengzhou is gradually increasing and expanding in the southeastern direction from the original urban area of Zhengzhou. This increase in area indicates that the urban region of Zhengzhou has increased; it is mainly concentrated in the northeastern region of Zhengzhou.
Figure 3 shows the numerical values of the NTL in the longitude and latitude directions with intervals of five years, from which the changes in the NTL in these directions can be observed. In the longitude direction, Figure 3a shows that there are two concentrated areas of high NTL values, which demonstrate the eastward expansion of the city. The high NTL values in 2000, 2005, and 2020 were mainly concentrated in the area between 113.2° E and 113.8° E, but the high NTL values in 2015 and 2020 were concentrated in the area between 113.2° E and 114.2° E. In the latitude direction, Figure 3b shows that the high-NTL area experienced southward expansion. In 2000, the high NTL values were concentrated between 34.7° and 34.9° N and gradually began to expand southward. In 2010, this area had already expanded southward to 34.6°N, and, in 2015 and 2020, it expanded southward to reach 34.3° N. It is worth noting that the peak area of the NTL occurred between 34.7° N and 34.9° N, and the total value of the NTL continuously increased from 2000 to 2020, indicating that the urban land in this region tends to be dense. However, there were additional NTL peak areas between 34.5° N and 34.6° N in 2015 and 2020, indicating that the urbanization in this region increased in speed after 2015. Overall, the total value of the NTL continued to increase from 2000 to 2020, indicating that urbanization in Zhengzhou accelerated and expanded southeastward from the original city center.
The spatial distribution of the mean and coefficient of variation of the RSEI in Zhengzhou City from 2000 to 2021 is shown in Figure 4. Overall, the urban area of Zhengzhou shows a trend of low RSEI values in the east and high RSEI values in the west. The overall RSEI value of Zhengzhou is less than 0.4, which indicates the poor quality of the ecological environment in this region and indirectly indicates a high degree of urbanization. The RSEI value in the western region is above 0.6, indicating that the quality of the ecological environment in this area is excellent and indirectly indicating a low degree of urbanization in this region. The areas with high coefficients of variation are well matched with the low-RSEI areas, indicating that the urbanization process in the low-RSEI areas has undergone significant changes. Figure 5 shows the time-series changes in the RSEI in Zhengzhou City, which showed an initial increase from 2000 to 2010 and a subsequent decrease from 2010 to 2021. The RSEI had a high value in 2003, 2008, and 2015, indicating that the ecological environment in Zhengzhou City had better quality during the period around 2010.

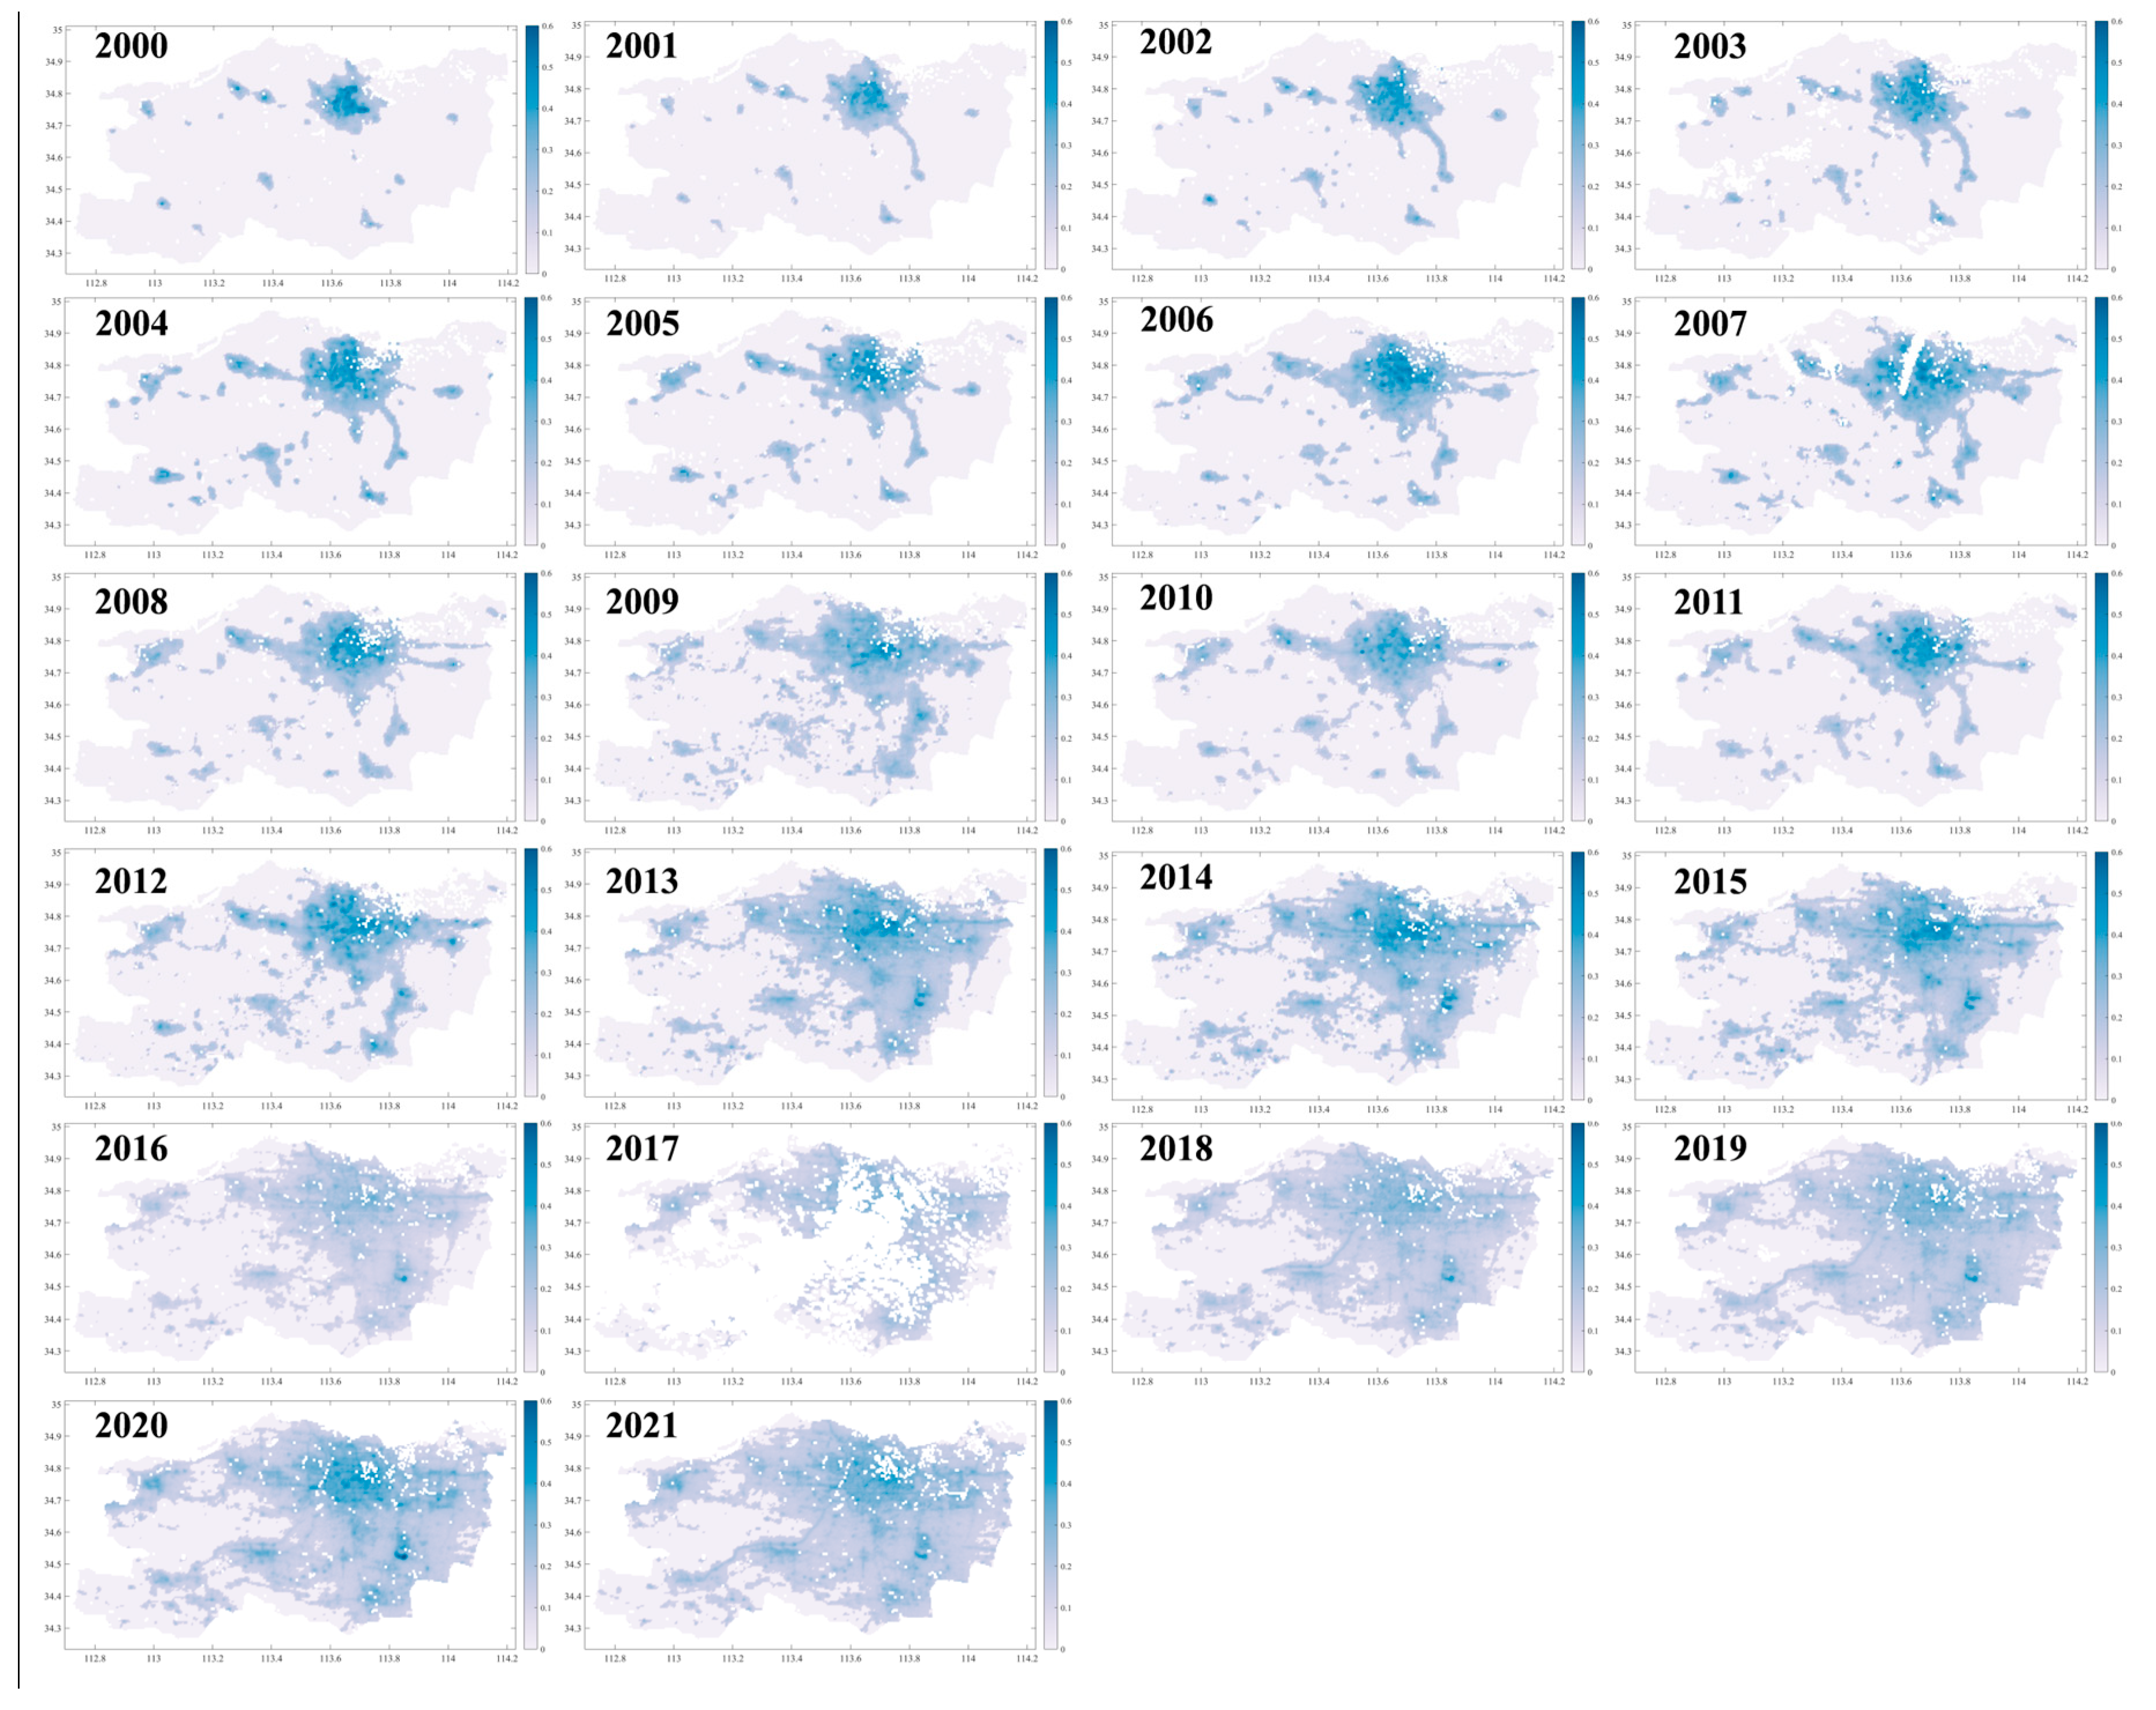
3.2. Coupling Coordination Degree of Urbanization and the Ecological Environment

Using the RSEI and NTL data, the coupling degree (C) and coupling coordination degree (D) between urbanization and the ecological environment in Zhengzhou City from 2000 to 2021 were computed. From Figure 6, it can be seen that C and D show a decreasing trend from 2000 to 2021 (p value < 0.001). However, they show a slowly increasing trend from 2016 to 2021. C and D reached their maximum values in 2004 and their minimum values in 2016. Overall, the coupling coordination degree (D value) between urbanization and the ecological environment in Zhengzhou City from 2000 to 2021 was relatively low (the average was less than 0.25), which indicates poor coordination between urban and ecological aspects. The natural ecology of Zhengzhou has been severely threatened by human activity, and the conflict between humans and the natural ecology is evident.
From Figure 7, it can be seen that the D value in the urban core area of Zhengzhou also decreases with time, resulting in a decrease in the mean value in Figure 8. The spatial distribution of D values decreases outward from the urban core area. Regarding the time series, from 2000 to 2016, the D value in Zhengzhou City showed a decreasing trend, indicating that the conflict between urbanization and ecology increased in severity. However, from 2016 to 2021, it showed an upward trend. This indicates that the conflict between urbanization and ecology in Zhengzhou City is easing (but the value is still low). Overall, the D values are low, indicating that the urban–ecological coordination in Zhengzhou is not high, and the natural ecology is seriously threatened by human activity.

4. Discussion

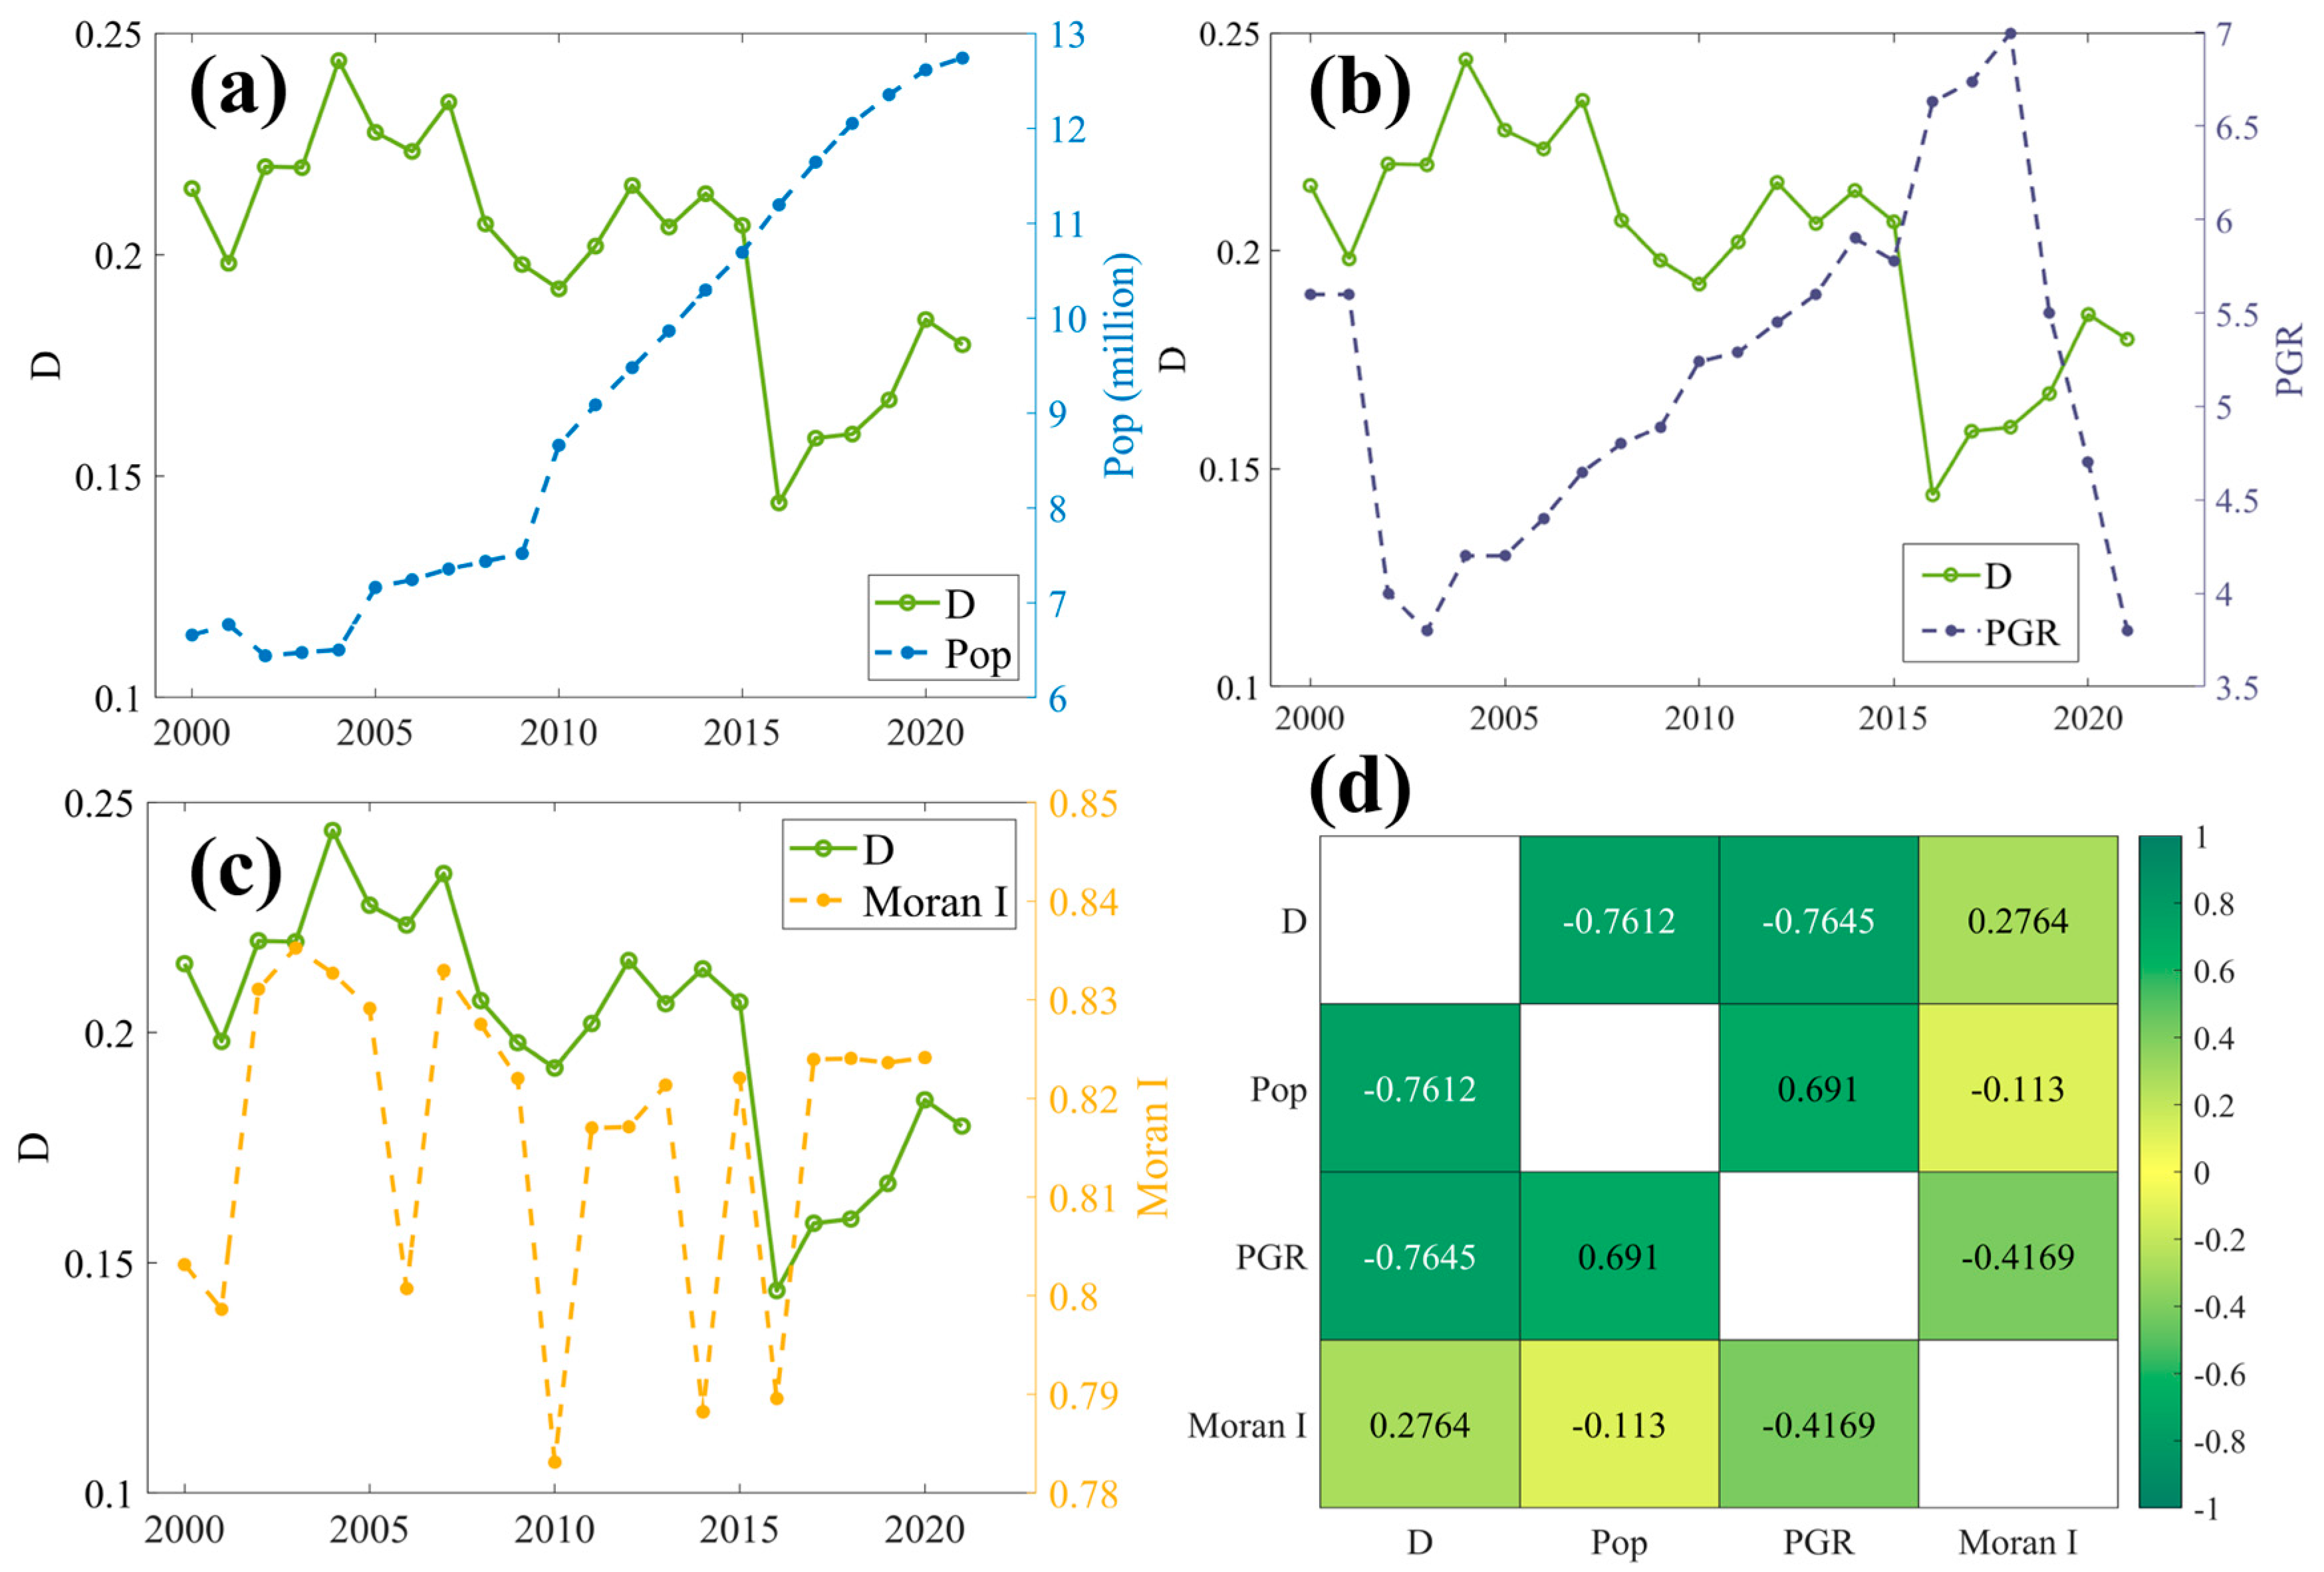
4.1. Spatial Relationship Between Population and Coupling Coordination Degree (D Value)

The correlation between population change and urbanization and the ecological environment is an important factor influencing the process of urbanization and the quality of the ecological environment. This section explores the relationship between population change and D based on Figure 6, with 2016 as the limit. Figure 9 shows that the areas where D decreased in Zhengzhou City from 2000 to 2016 were mainly located in the core urban area and its surrounding regions, while the values in other large areas increased or remained unchanged. The change in D is spatially uneven. It can be seen that there is a significant blue low-value area shown in Figure 9a, which means that the value of the coupling degree in this area decreased from 2000 to 2016. However, the disappearance of this low-value area from 2016 to 2020 indicates the increase in the coupling degree during this period. This significant blue low represents the core area of Zhengzhou City (Figure 1), which is also the area where the population is growing the fastest (Figure 10). Figure 9a,b both show that from 2000 to 2020, there is an area in the western part of Zhengzhou where the value of the coupling degree does not change significantly. The reason is that this area is also a high-value area of land elevation (Figure 1). This means that most of these areas are mountains with high vegetation cover and low population and transportation difficulties, and these problems are not conducive to urbanization. Figure 10 shows that, from 2000 to 2021, the population of Zhengzhou City was mainly concentrated in the urban area. The corresponding area with the largest population increase was also the area with the largest decrease in the D value. Does this mean that the population is the main negative factor affecting the coordinated development of the urban ecology? To answer this question, we conducted further analysis.

4.2. Temporal Variation Between Population and Coupling Coordination Degree (D Value)

Consistent with our expectations, Figure 11a,b,d show that there is a strong negative correlation between the population and D. However, in Figure 11c, we show the Moran index, which expresses the degree of population aggregation, with higher values indicating a more concentrated population. Figure 11c,d both show that there is a positive correlation between D and the Moran index. The more concentrated the population, the higher the D value and the more coordinated the human environment. This suggests that the spatial distribution characteristics of the population also affect regional ecological security. For Zhengzhou City, the concentration of the population in the core area causes the D value in this area to decrease; at the same time, it reduces the population pressure on other areas. Therefore, as the Moran index increases, the D value in fact shows an increasing trend. The trend corresponding to the regions where the population increases significantly, as shown in Figure 11, is mostly negative. This indicates that, when the population is concentrated in a particular region, the D value in this region tends to decline. At the same time, it should be noted that the population growth in other regions is positive. The increase in the population has not led to a decrease in the ecological coordination of regional cities. These findings suggest that population growth is not simply negatively correlated with the ecological coordination of regional cities and that a reasonable spatial population distribution is conducive to improvements in the ecological coordination of regional cities.
Figure 11a shows that the evolution of the coupling degree between the ecological environment and urbanization in Zhengzhou occurred in three different periods (2000–2004, 2005–2016, and 2017–2020). The coupling degree showed an increasing trend from 2000 to 2004, and an overall decreasing trend from 2005 to 2016. However, there was a brief increase from 2010 to 2013, with the lowest degree of coupling in 2016. After 2016, the degree of coupling started to improve. This indicates that in the early stage of urbanization, Zhengzhou paid more attention to economic development and urbanization, and neglected the quality of ecological environment. However, in the later stage of urbanization, the ecological environment gradually improved to a certain extent, and the improvement of the ecological environment lagged behind the development of the city. The reason for this phenomenon may be that the local government’s development strategy initially focused more on economic development, but later began to pay attention to coordinated development.
Other cities in China have also been undergoing a similar transformation. For example, the level of urbanization and ecological environment and the coordination of coupling in Beijing and its functional areas were studied by Huang et al. [46]. They found that from 2001 to 2011, the overall coordination of coupling in Beijing shifted from the “basic balance” development stage to the “super balance” stage. After 2011, the ecological environment of Beijing and most functional areas deteriorated, and the coordination between accelerated urbanization and ecological environmental degradation may be the result of environmental lag. The evolution process of the coupling degree between urbanization and ecological environment in Qingdao has four phases (2000–2004, 2005–2009, 2010–2013, and 2014–2018). Qingdao’s coupling degree was poor in 2000–2004, started to increase in 2005–2009, was in the run-in stage in 2010–2013, and was in the highly coupled stage in 2014–2018. Overall, Qingdao’s coupling degree shifted from the stage of “severe disharmony and lagging urbanization” to the stage of “good coordination and lagging ecological environment” [47]. Whether in Zhengzhou, Qingdao or Beijing, the degree of coupling between the ecological environment and urbanization all show a trend of first decreasing and then increasing. This may be a common problem in developing countries. For example, prioritizing economic development over environmental protection. But the development process of the coupling degree in each city is different, which may be related to the policies of the local municipal government and regional economic development.

5. Conclusions

In this work, based on night light data, Landsat satellite data, and population data for Zhengzhou City, the spatial–temporal variation in the NTL and RESI from 2000 to 2021 was analyzed. The relationship between the coupling coordination degree between urbanization and the ecological environment and the population was also discussed. The main conclusions are as follows.
Over the past two decades, Zhengzhou City has experienced rapid urbanization. Taking 2010 as the boundary, the annual RSEI value of Zhengzhou City showed a trend of first increasing and then decreasing, and the annual average value was less than 0.4. This indicated that the quality of the ecological environment was poor, which suggested that the urbanization degree in this region was significant. The NTL data show that there were three stages of development in Zhengzhou from 2000 to 2021: the slow expansion stage from 2000 to 2003, the steady expansion stage from 2004 to 2011, and the rapid expansion stage from 2012 to 2021. The changes in the RSEI and NTL indicated that, after Zhengzhou entered the rapid expansion stage, its urban development significantly reduced the quality of the ecological environmental quality, which was also reflected in the coupling degree (C) and the coupling coordination degree (D) between urbanization and the ecological environment.
The mean value of the coupling degree (C) and the coupling coordination degree (D) between urbanization and the ecological environment in Zhengzhou was less than 0.3, indicating that the urbanization and ecological environment in this city are extremely uncoordinated. The process of urbanization has placed severe pressure on the ecological environment in Zhengzhou, and the natural ecology has been seriously affected by human activities. In terms of time, the coupling degree (C) and the coupling coordination degree (D) between urbanization and the ecological environment in Zhengzhou showed a downward trend from 2000 to 2021, but they increased from 2016 to 2021.
The population is an important factor influencing urbanization and the quality of the ecological environment. The correlation analysis showed that the population size and growth rate were strongly and negatively correlated with D, indicating that population growth has a negative impact on the ecological environment. However, D was positively correlated with the Moran index, and it is suggested that population agglomeration could improve the overall ecological coordination of Zhengzhou City. Based on the scatter analysis of the population growth and D value trends, we believe that the reasonable spatial distribution of the population could improve the degree of regional urban–ecological coordination.
Although the coupling degree of ecological environment and urbanization of Zhengzhou shows an increasing trend in 2016–2020, policy makers and city officials still need to pay more attention to protect Zhengzhou’s ecological environment, as economic development is the most important issue affecting the ecological environment. Therefore, how to reduce the environmental pressure generated by the unit economy is the key to solving environmental problems. Based on the analysis in this article, we provide some suggestions for Zhengzhou government officials to consider.
(1)
Improve and upgrade the existing industrial structure, reduce the ecological environment consumed by industries, strengthen environmental protection, and improve the efficiency of pollutant treatment.
(2)
Support the development of clean industries, such as accelerating the development of tertiary industries, knowledge-based information services, scientific and technological research and development, and cultural industries.
(3)
Promote the development of townships and rural areas, increase the construction of hospitals and colleges in these areas, achieve population transfer and dispersion, and reserve ecological land (water, green parks, etc.) for existing urban areas.
(4)
Establish demonstration zones in the city. Optimize the environment of some residential communities to provide better environmental quality and service management for residents.
(5)
Based on the regional characteristics of Zhengzhou, establish scenic spots in the beautiful mountainous areas and recommend the development of local characteristic industries such as tourism.

Author Contributions

Conceptualization, H.F.; methodology, D.W.; software, D.W.; data curation, H.F.; writing—original draft preparation, H.F. and Q.J.; writing—review and editing, D.W. and Q.J.; visualization, D.W.; funding acquisition, D.W. All authors have read and agreed to the published version of the manuscript.

Funding

This research was funded by the Project of Education of Zhejiang Province (Grant No. Y202250625), the Basic Public Welfare Research Project of Zhejiang Province (Grant No. LGF22D060001).

Institutional Review Board Statement

Not applicable.

Informed Consent Statement

Not applicable.

Data Availability Statement

The night light data are provided by Chen et al. (2021) and can be downloaded from https://doi.org/10.7910/DVN/YGIVCD (accessed on 18 February 2023); The population distribution data provided by the WorldPop Hub and can be downloaded from https://hub.worldpop.org (accessed on 9 November 2023).

Acknowledgments

The authors are grateful to Chen et al. (2021) for providing the night light data and the WorldPop Hub for providing the population distribution data. The authors are also grateful for satellite remote sensing data, and open source data platform, as well as to the other researchers who provided assistance.

Conflicts of Interest

The authors declare no conflicts of interest.

References

  1. Guojun, Z.; Yuchen, X.U.; Longjie, W.; Shuru, Z. From localization to de-localization and re-localization: Transformation of the human-land relationship in China’s urbanization process. Prog. Geogr. 2021, 40, 28–39. [Google Scholar] [CrossRef]
  2. Bren d’Amour, C.; Reitsma, F.; Baiocchi, G.; Barthel, S.; Güneralp, B.; Erb, K.-H.; Haberl, H.; Creutzig, F.; Seto, K.C. Future urban land expansion and implications for global croplands. Proc. Natl. Acad. Sci. USA 2017, 114, 8939–8944. [Google Scholar] [CrossRef] [PubMed]
  3. Fuller, R.; Irvine, K. Interactions between people and nature in urban environments. In Urban Ecology; Cambridge University Press: Cambridge, UK, 2010; pp. 172–201. [Google Scholar] [CrossRef]
  4. Chen, J. Rapid urbanization in China: A real challenge to soil protection and food security. Catena 2007, 69, 1–15. [Google Scholar] [CrossRef]
  5. McKinney, M.L. Urbanization, Biodiversity, and Conservation: The impacts of urbanization on native species are poorly studied, but educating a highly urbanized human population about these impacts can greatly improve species conservation in all ecosystems. BioScience 2002, 52, 883–890. [Google Scholar] [CrossRef]
  6. Grimm, N.B.; Faeth, S.H.; Golubiewski, N.E.; Redman, C.L.; Wu, J.; Bai, X.; Briggs, J.M. Global Change and the Ecology of Cities. Science 2008, 319, 756–760. [Google Scholar] [CrossRef] [PubMed]
  7. McDonald, R.I.; Weber, K.F.; Padowski, J.; Boucher, T.; Shemie, D. Estimating watershed degradation over the last century and its impact on water-treatment costs for the world’s large cities. Proc. Natl. Acad. Sci. USA 2016, 113, 9117–9122. [Google Scholar] [CrossRef] [PubMed]
  8. Kalnay, E.; Cai, M. Impact of urbanization and land-use change on climate. Nature 2003, 423, 528–531. [Google Scholar] [CrossRef] [PubMed]
  9. Seto, K.C.; Shepherd, J.M. Global urban land-use trends and climate impacts. Curr. Opin. Environ. Sustain. 2009, 1, 89–95. [Google Scholar] [CrossRef]
  10. Elvidge, C.D.; Baugh, K.E.; Anderson, S.J.; Sutton, P.C.; Ghosh, T. The Night Light Development Index (NLDI): A spatially explicit measure of human development from satellite data. Soc. Geogr. 2012, 7, 23–35. [Google Scholar] [CrossRef]
  11. Ortakavak, Z.; Çabuk, S.N.; Cetin, M.; Senyel Kurkcuoglu, M.A.; Cabuk, A. Determination of the nighttime light imagery for urban city population using DMSP-OLS methods in Istanbul. Environ. Monit. Assess. 2020, 192, 790. [Google Scholar] [CrossRef] [PubMed]
  12. Li, Y.; Li, Y.; Zhou, Y.; Shi, Y.; Zhu, X. Investigation of a coupling model of coordination between urbanization and the environment. J. Environ. Manag. 2012, 98, 127–133. [Google Scholar] [CrossRef] [PubMed]
  13. Fan, J.; Ma, T.; Zhou, C.; Zhou, Y.; Xu, T. Comparative Estimation of Urban Development in China’s Cities Using Socioeconomic and DMSP/OLS Night Light Data. Remote Sens. 2014, 6, 7840–7856. [Google Scholar] [CrossRef]
  14. Yu, B.; Shi, K.; Hu, Y.; Huang, C.; Chen, Z.; Wu, J. Poverty Evaluation Using NPP-VIIRS Nighttime Light Composite Data at the County Level in China. IEEE J. Sel. Top. Appl. Earth Obs. Remote Sens. 2015, 8, 1217–1229. [Google Scholar] [CrossRef]
  15. Ma, T.; Yin, Z.; Zhou, A. Delineating Spatial Patterns in Human Settlements Using VIIRS Nighttime Light Data: A Watershed-Based Partition Approach. Remote Sens. 2018, 10, 465. [Google Scholar] [CrossRef]
  16. Chen, Z.; Yu, B.; Yang, C.; Zhou, Y.; Yao, S.; Qian, X.; Wang, C.; Wu, B.; Wu, J. An extended time series (2000-2018) of global NPP-VIIRS-like nighttime light data from a cross-sensor calibration. Earth. Syst. Sci. Data 2021, 13, 889–906. [Google Scholar] [CrossRef]
  17. Barzola-Monteses, J.; Espinoza-Andaluz, M.; Mite-León, M.; Flores-Morán, M. Energy Consumption of a Building by using Long Short-Term Memory Network: A Forecasting Study. In Proceedings of the 2020 39th International Conference of the Chilean Computer Science Society (SCCC), Coquimbo, Chile, 16–20 November 2020; pp. 1–6. [Google Scholar]
  18. Shu, X.; Bao, T.; Li, Y.; Gong, J.; Zhang, K. VAE-TALSTM: A temporal attention and variational autoencoder-based long short-term memory framework for dam displacement prediction. Eng. Comput. 2022, 38, 3497–3512. [Google Scholar] [CrossRef]
  19. Jlidi, M.; Hamidi, F.; Barambones, O.; Abbassi, R.; Jerbi, H.; Aoun, M.; Karami-Mollaee, A. An Artificial Neural Network for Solar Energy Prediction and Control Using Jaya-SMC. Electronics 2023, 12, 592. [Google Scholar] [CrossRef]
  20. Chan, S.; Oktavianti, I.; Puspita, V. A Deep Learning CNN and AI-Tuned SVM for Electricity Consumption Forecasting: Multivariate Time Series Data. In Proceedings of the 2019 IEEE 10th Annual Information Technology, Electronics and Mobile Communication Conference (IEMCON), Vancouver, BC, Canada, 17–19 October 2019; pp. 0488–0494. [Google Scholar]
  21. Shikulskaya, O.; Urumbaeva, O.; Shalaev, T. Concept of Intelligent Energy Grid Control Based on Upgraded Neural Network. In Proceedings of the 2020 International Conference on Electrotechnical Complexes and Systems (ICOECS), Ufa, Russia, 27–30 October 2020; pp. 1–5. [Google Scholar]
  22. Krishnan, M.; Jung, Y.M.; Yun, S. Prediction of Energy Demand in Smart Grid using Hybrid Approach. In Proceedings of the 2020 Fourth International Conference on Computing Methodologies and Communication (ICCMC), Erode, India, 11–13 March 2020; pp. 294–298. [Google Scholar]
  23. Rosato, A.; Araneo, R.; Andreotti, A.; Succetti, F.; Panella, M. 2-D Convolutional Deep Neural Network for the Multivariate Prediction of Photovoltaic Time Series. Energies 2021, 14, 2392. [Google Scholar] [CrossRef]
  24. Rosato, A.; Succetti, F.; Araneo, R.; Andreotti, A.; Mitolo, M.; Panella, M. A Combined Deep Learning Approach for Time Series Prediction in Energy Environments. In Proceedings of the 2020 IEEE/IAS 56th Industrial and Commercial Power Systems Technical Conference (I&CPS), Las Vegas, NV, USA, 29 June–28 July 2020; pp. 1–5. [Google Scholar]
  25. Qi, X.; Zheng, X.; Chen, Q. A short term load forecasting of integrated energy system based on CNN-LSTM. E3S Web Conf. 2020, 185, 01032. [Google Scholar] [CrossRef]
  26. Pramono, S.H.; Rohmatillah, M.; Maulana, E.; Hasanah, R.N.; Hario, F. Deep Learning-Based Short-Term Load Forecasting for Supporting Demand Response Program in Hybrid Energy System. Energies 2019, 12, 3359. [Google Scholar] [CrossRef]
  27. Xu, H.; Wang, Y.; Guan, H.; Shi, T.; Hu, X. Detecting Ecological Changes with a Remote Sensing Based Ecological Index (RSEI) Produced Time Series and Change Vector Analysis. Remote Sens. 2019, 11, 2345. [Google Scholar] [CrossRef]
  28. Bai, S.; Kolter, J.; Koltun, V. An Empirical Evaluation of Generic Convolutional and Recurrent Networks for Sequence Modeling. arXiv 2018, arXiv:1803.01271. [Google Scholar] [CrossRef]
  29. Kijima, M.; Nishide, K.; Ohyama, A. Economic models for the environmental Kuznets curve: A survey. J. Econ. Dyn. Control 2010, 34, 1187–1201. [Google Scholar] [CrossRef]
  30. Vanting, N.; Ma, Z.; Jørgensen, B. A scoping review of deep neural networks for electric load forecasting. Energy Inform. 2021, 4, 49. [Google Scholar] [CrossRef]
  31. Nti, I.K.; Teimeh, M.; Nyarko-Boateng, O.; Adekoya, A.F. Electricity load forecasting: A systematic review. J. Electr. Syst. Inf. Technol. 2020, 7, 13. [Google Scholar] [CrossRef]
  32. Wang, H.; Lei, Z.; Zhang, X.; Zhou, B.; Peng, J. A review of deep learning for renewable energy forecasting. Energy Convers. Manag. 2019, 198, 111799. [Google Scholar] [CrossRef]
  33. Aguiar-Pérez, J.M.; Pérez-Juárez, M.Á. An Insight of Deep Learning Based Demand Forecasting in Smart Grids. Sensors 2023, 23, 1467. [Google Scholar] [CrossRef] [PubMed]
  34. Sharma, K.; Dwivedi, Y.K.; Metri, B. Incorporating causality in energy consumption forecasting using deep neural networks. Ann. Oper. Res. 2024, 339, 537–572. [Google Scholar] [CrossRef]
  35. Fang, C.; Wang, S.; Li, G. Changing urban forms and carbon dioxide emissions in China: A case study of 30 provincial capital cities. Appl. Energy 2015, 158, 519–531. [Google Scholar] [CrossRef]
  36. He, J.; Wang, S.; Liu, Y.; Ma, H.; Liu, Q. Examining the relationship between urbanization and the eco-environment using a coupling analysis: Case study of Shanghai, China. Ecol. Indic. 2017, 77, 185–193. [Google Scholar] [CrossRef]
  37. Grossman, G.M.; Krueger, A.B. Economic Growth and the Environment. Q. J. Econ. 1995, 110, 353–377. [Google Scholar] [CrossRef]
  38. Ozatac, N.; Gokmenoglu, K.K.; Taspinar, N. Testing the EKC hypothesis by considering trade openness, urbanization, and financial development: The case of Turkey. Environ. Sci. Pollut. Res. 2017, 24, 16690–16701. [Google Scholar] [CrossRef] [PubMed]
  39. Saboori, B.; Sulaiman, J. Environmental degradation, economic growth and energy consumption: Evidence of the environmental Kuznets curve in Malaysia. Energy Policy 2013, 60, 892–905. [Google Scholar] [CrossRef]
  40. Nonomura, A.; Kitahara, M.; Takuro, M. Impact of land use and land cover changes on the ambient temperature in a middle scale city, Takamatsu, in Southwest Japan. J. Environ. Manag. 2009, 90, 3297–3304. [Google Scholar] [CrossRef] [PubMed]
  41. Vargo, J.; Habeeb, D.; Stone, B. The importance of land cover change across urban–rural typologies for climate modeling. J. Environ. Manag. 2013, 114, 243–252. [Google Scholar] [CrossRef] [PubMed]
  42. Ding, L.; Zhao, W.; Huang, Y.; Cheng, S.; Liu, C. Research on the Coupling Coordination Relationship between Urbanization and the Air Environment: A Case Study of the Area of Wuhan. Atmosphere 2015, 6, 1539–1558. [Google Scholar] [CrossRef]
  43. Zhao, Y.; Wang, S.; Ge, Y.; Liu, Q.; Liu, X. The spatial differentiation of the coupling relationship between urbanization and the eco-environment in countries globally: A comprehensive assessment. Ecol. Model. 2017, 360, 313–327. [Google Scholar] [CrossRef]
  44. Zhou, Y.; Peng, R.; Hu, H.; Wang, T.; Wei, W. Coupling coordination and spatial differentiation between urbanization and eco-environment: Case study of Ya’an, China. GeoJournal 2022, 87, 4041–4060. [Google Scholar] [CrossRef]
  45. Lloyd, C.T.; Chamberlain, H.; Kerr, D.; Yetman, G.; Pistolesi, L.; Stevens, F.R.; Gaughan, A.E.; Nieves, J.J.; Hornby, G.; MacManus, K.; et al. Global spatio-temporally harmonised datasets for producing high-resolution gridded population distribution datasets. Big Earth Data 2019, 3, 108–139. [Google Scholar] [CrossRef]
  46. Huang, Y.; Qiu, Q.; Sheng, Y.; Min, X.; Cao, Y. Exploring the Relationship between Urbanization and the Eco-Environment: A Case Study of Beijing. Sustainability 2019, 11, 6298. [Google Scholar] [CrossRef]
  47. Fu, S.; Zhuo, H.; Song, H.; Wang, J.; Ren, L. Examination of a coupling coordination relationship between urbanization and the eco-environment: A case study in Qingdao, China. Environ. Sci. Pollut. Res. 2020, 27, 23981–23993. [Google Scholar] [CrossRef] [PubMed]
Figure 1. Geographical location of Zhengzhou City.
Sustainability 17 00458 g001
Figure 2. Spatial distribution of night light (NTL > 10) in Zhengzhou from 2000 to 2021. Blue denotes the light coverage in 2000, and red denotes the extended coverage based on the year 2000.
Sustainability 17 00458 g002
Figure 3. The sum of the NTL values in longitude (a) and latitude (b) at 5-year intervals in Zhengzhou City.
Sustainability 17 00458 g003
Figure 4. Spatial distribution of the mean values (a) and coefficients of variation (b) of the RSEI in Zhengzhou from 2000 to 2021.
Sustainability 17 00458 g004
Figure 5. Trends in the RSEI from 2000 to 2021. The p value is 0.0628 during the increasing trend period 2000–2010, and the p value is 0.4454 during the decreasing trend period 2011–2021.
Sustainability 17 00458 g005
Figure 6. Annual mean variations in Zhengzhou’s coupling degree (C) and coordination degree (D) from 2000 to 2021. The p value of C-trendline is 0.000037 during the period 2000–2021, and the p value of D-trendline is 0.00021 during the period 2000–2021.
Sustainability 17 00458 g006
Figure 7. Spatial distribution of coupling coordination degree (D value) between urbanization and the ecological environment in Zhengzhou from 2000 to 2021. If D is zero, this means that NTL has a zero value; as there is a large amount of cloud cover in the 2017 image, there are a large number of zero values in 2017.
Sustainability 17 00458 g007
Figure 8. Spatial distribution of mean values and coefficients of variation of coupling degree (C) and coupling coordination degree (D value) between urbanization and the ecological environment in Zhengzhou from 2000 to 2021.
Sustainability 17 00458 g008
Figure 9. Spatial distribution of the D value in Zhengzhou between two years: (a) the difference between 2016 and 2000; (b) the difference between 2021 and 2016.
Sustainability 17 00458 g009
Figure 10. Spatial distribution of the difference in the population between 2020 and 2000 in Zhengzhou.
Sustainability 17 00458 g010
Figure 11. Variations in correlation coefficients of D value and population data in Zhengzhou City. (ac) present the population (Pop), population growth rate (PGR), and Moran’s I (c), respectively. (d) presents the correlation coefficients of the data.
Sustainability 17 00458 g011
Table 1. Information about the Landsat satellite imagery.
Year20002001200220032004200520062007200820092010
SatelliteL5L7L7L5L5L7L5L5L5L5L5
Year20112012201320142015201620172018201920202021
SatelliteL5L5L8L8L8L8L8L8L8L8L8
Disclaimer/Publisher’s Note: The statements, opinions and data contained in all publications are solely those of the individual author(s) and contributor(s) and not of MDPI and/or the editor(s). MDPI and/or the editor(s) disclaim responsibility for any injury to people or property resulting from any ideas, methods, instructions or products referred to in the content.

