1. Introduction
Forests, tree rows, avenues, and other elements of green infrastructure constitute a vital part of the cultural landscape due to the ecosystem services they provide [
1,
2]. At the same time, in areas within or near settlements, and along transport corridors—where human presence is frequent or continuous—maintaining an acceptable level of risk becomes a critical concern [
3]. Legal liability for accidents and damages lies with the land manager. However, institutions responsible for trees often lack the organizational capacity (resources, procedures, personnel) or even accurate data on the green infrastructure under their management [
4]. This frequently results in poor management decisions that lead to the degradation of green infrastructure assets, which cannot be restored in the short term (up to 10 years) [
5].
The primary tool for managing risk in tree stands and wooded areas is regular area-wide inspection [
6], followed by the development of a risk management plan based on the findings [
7]. During the inspection, clearly visible diagnostic features are recorded—those that can be identified through visual observation and are sufficiently distinct to assess the condition of the tree and the threats it may pose to its surroundings, as well as to determine appropriate maintenance measures [
8]. Inspections can be carried out by individuals with basic (limited) knowledge of tree assessment [
9,
10,
11,
12].
Research concerning the use of high-resolution aerial imagery in forestry, particularly for assessing tree-related risks, is not a new phenomenon [
13]. UAV operations do not require additional infrastructure (e.g., airports, control stations, etc.), though they are subject to applicable legal regulations that must be complied with [
14]. Commercially available UAVs offer an efficient and relatively low-cost means of registering or monitoring designated areas. Quadrotor-based platforms are characterized by simple operation, short preparation time before flight, and increasingly extended flight durations on a single battery charge. UAV performance allows for aerial imaging of areas spanning several hundred hectares without the need to land [
15]. UAVs enable imaging of diagnostic features in tree crowns (vertical photos taken at 90 ± 5°) and, to some extent, in lower parts of trees (oblique images taken at 35–50° angles). Moreover, selected UAVs available on the market are equipped with sensors that capture not only visible light (VIS), but also selected parts of the electromagnetic spectrum—such as green (G, ±560 nm), red (R, ±650 nm), red edge (RE, ±730 nm), and near-infrared (NIR, ±860 nm) wavelengths [
16]. Analyses based on such data allow for the identification of subtle diagnostic characteristics, such as vegetation indices (VI) or the normalized difference vegetation index (NDVI), which are derived from differences in visible and near-infrared reflectance [
17]. These indices are correlated with tree condition—particularly biomass and chlorophyll content [
18]. Modern commercial drones can produce high-resolution orthomosaic images (with ground sampling distance, GSD, well below 10 cm), which serve as valuable data sources for automated tree condition analysis and land cover classification [
19]. Currently, the Polish Geoportal offers orthomosaics in the visible light spectrum for selected regions of the country at a GSD of 25 cm. For specific spectral analyses (e.g., NDVI), satellite imagery from 2020 is available with a resolution of 10 m. A critical parameter for area-wide inspections is the recording of GSNN geolocation metadata for individual images. This enables the transformation from pixel-based coordinates to geodetic (geographical) coordinates, thus allowing for precise localization of observed phenomena in the field. The use of dedicated RTK receivers enables horizontal and vertical positioning accuracy well below 10 cm [
20].
Using drones for “one-off” applications—such as mapping tree stands, assessing their vitality, or detecting dead and dying trees (which was the focus of this study)—represents only the initial stage of applying UAVs in risk assessment for trees. UAVs, which do not require any infrastructure, can collect data at short intervals, providing information that enables a better understanding of trends in vegetation communities. In this context, it is worth leveraging information provided by vegetation indices (e.g., the NDVI mentioned earlier). The literature already describes dozens of indices capable of providing information on, for example, water stress, photosynthetic activity [
21], nitrogen uptake, or Water Use Efficiency (WUE) and Nutrient Use Efficiency (NUE) [
22,
23,
24], among others.
The aforementioned data acquisition capabilities provide the basis for creating orthomosaics and subsequently conducting land cover classification analyses, which can be performed partially or fully automatically using dedicated software. Most classification methods rely on analyzing the spectral reflectance similarity of different land use categories across various spectral ranges or their interrelationships. The output of such classification is a land cover map reflecting predefined object features or classes [
15,
17].
As noted by Heliguy [
25], traditional field surveys are time-consuming and resource-intensive, and they also involve higher operational costs. In this context, the use of unmanned aerial vehicles (UAVs) for data acquisition emerges as an attractive alternative.
The actual effectiveness of remote sensing methods in urban tree risk assessment is still uncertain. The aim of the study is to assess the potential of UAV-based multispectral aerial imagery (capturing a broader spectrum than visible light alone) for area-wide risk management in the vicinity of trees, as compared to traditional ground-based surveys.
This study is guided by two core hypotheses. First, we hypothesize that remote sensing methods have the potential to detect trees exhibiting signs of high risk—specifically dead or declining trees—at a level comparable to traditional ground-based detection, while offering the advantage of significantly lower cost and labor intensity. The second hypothesis assumes that UAV-based multispectral (CIR) imagery provides higher reliability in detecting dead and declining trees than RGB imagery, offering operational benefits for area-wide tree risk management.
2. Methods
2.1. Study Area
The research was conducted in a 109-year-old forest stand dominated by Scots pine (Pinus sylvestris L.), located within the administrative boundaries of the town of Gostyń.
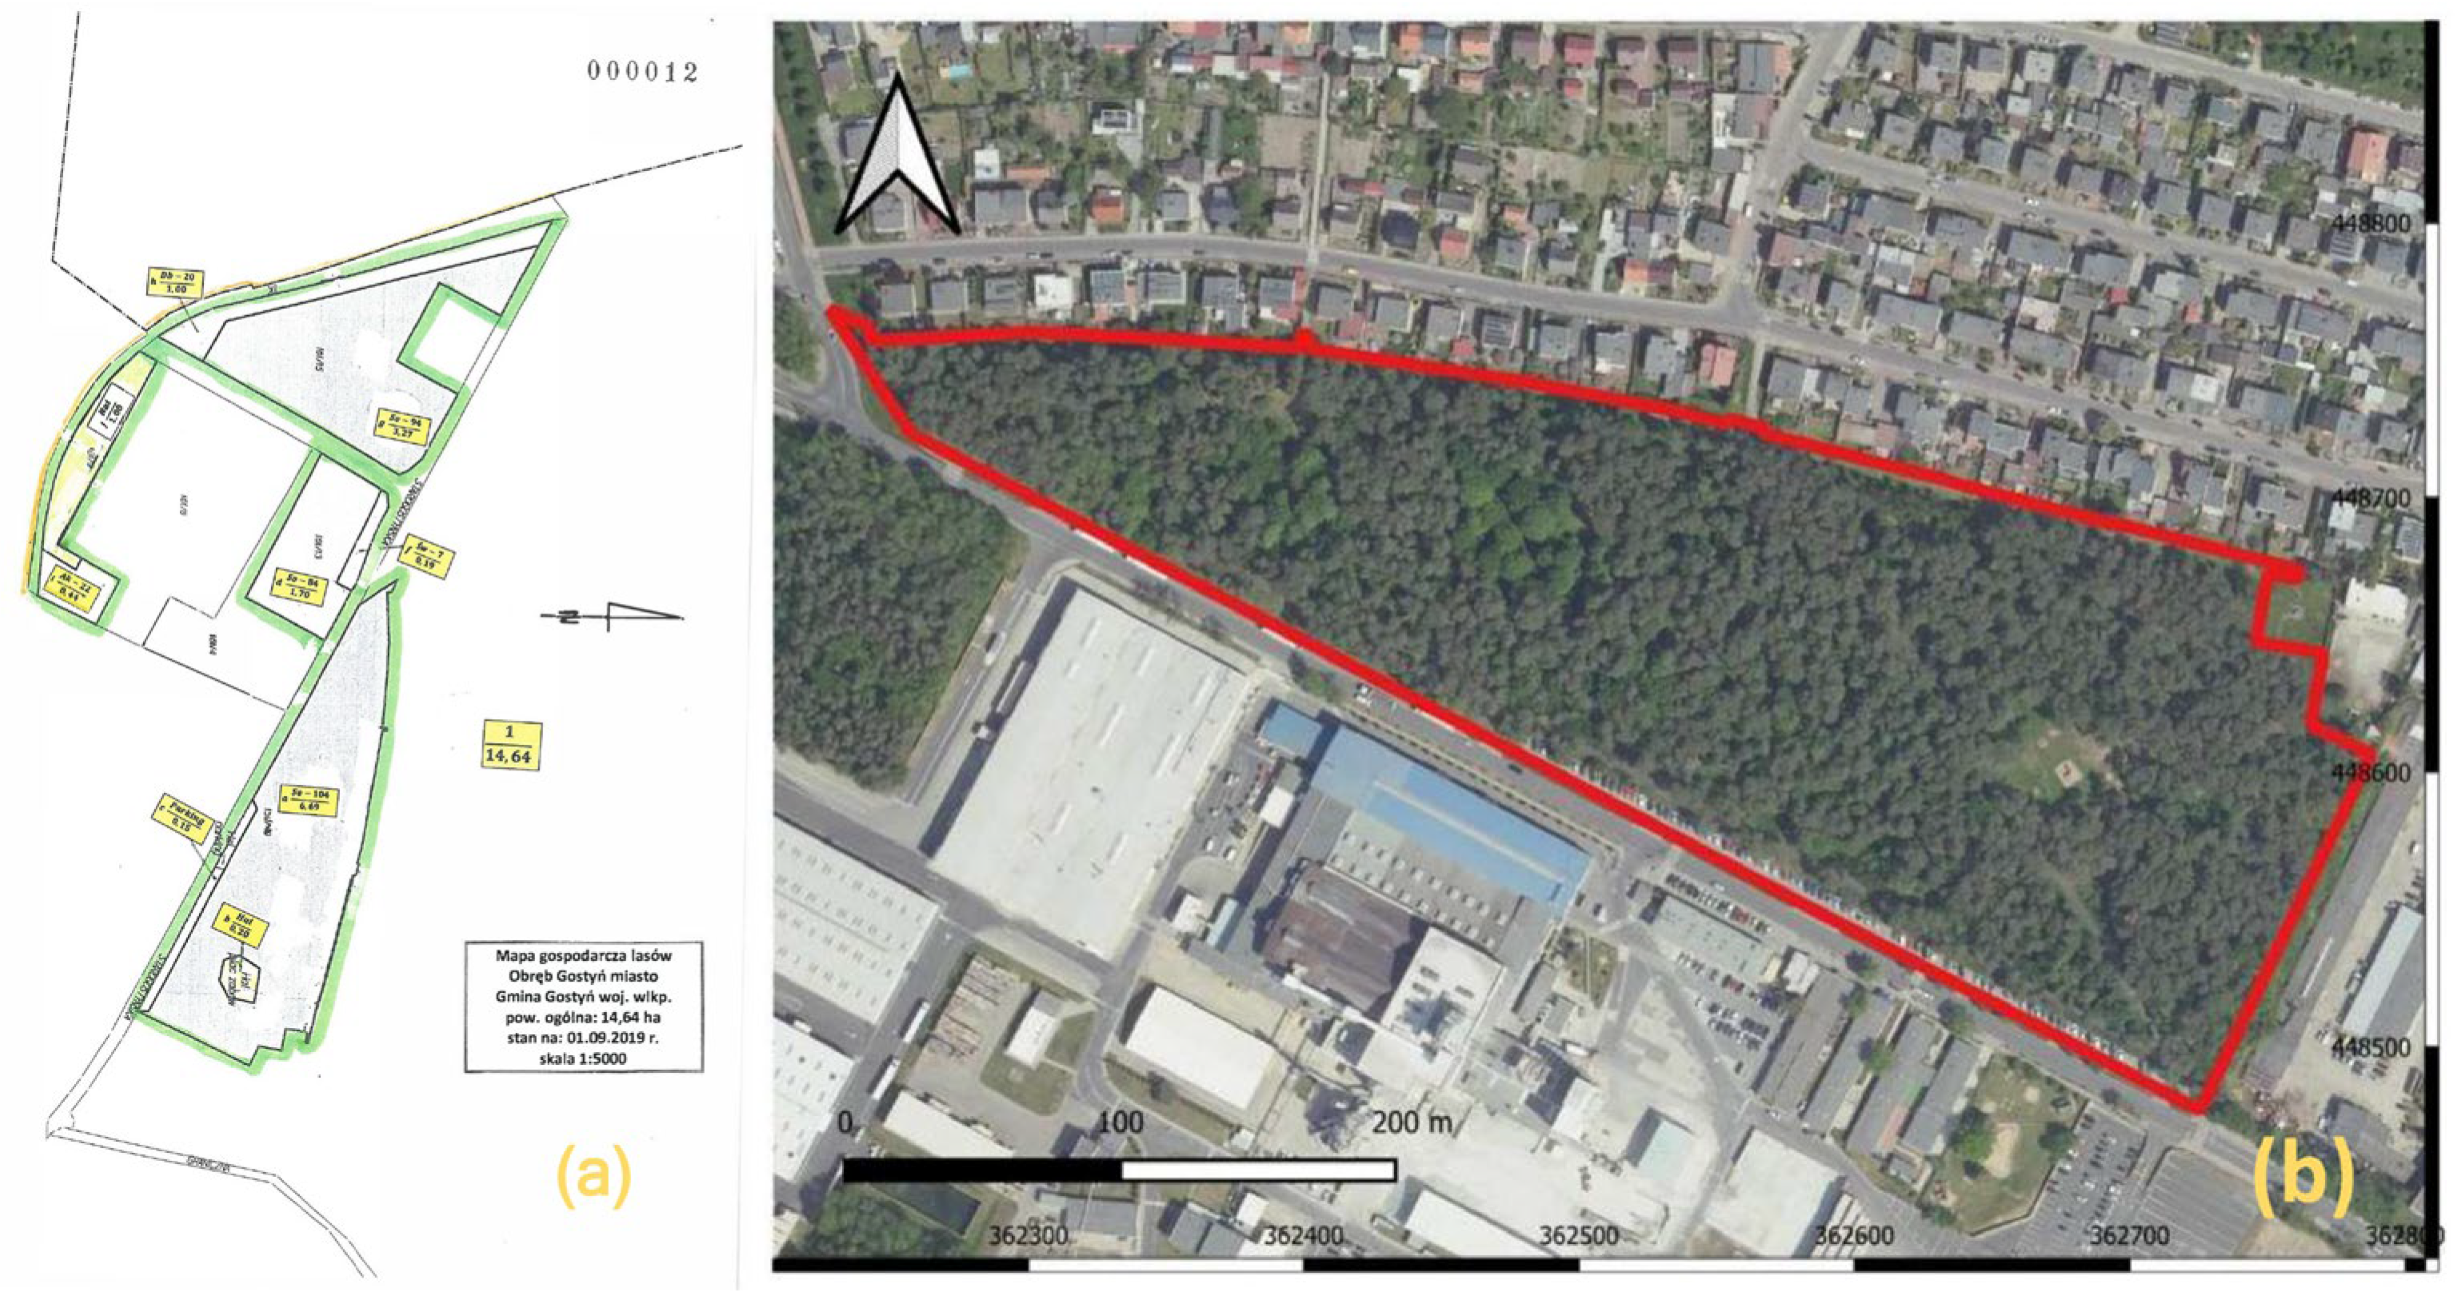
The study area encompassed a section of plot no. 159/49, registered in the land and building cadastre, located in the cadastral district of Gostyń, Gostyń County, Greater Poland Voivodeship. The plot in question is covered by the Simplified Forest Management Plan (UPUL) for the Municipality of Gostyń, which includes forest areas within the districts of Gostyń Miasto, Daleszyn, Stary Gostyń, Kunowo, Osowo, Stankowo, and Stężyca for the period from 1 January 2020 to 31 December 2020. The land is owned by the Municipality of Gostyń (
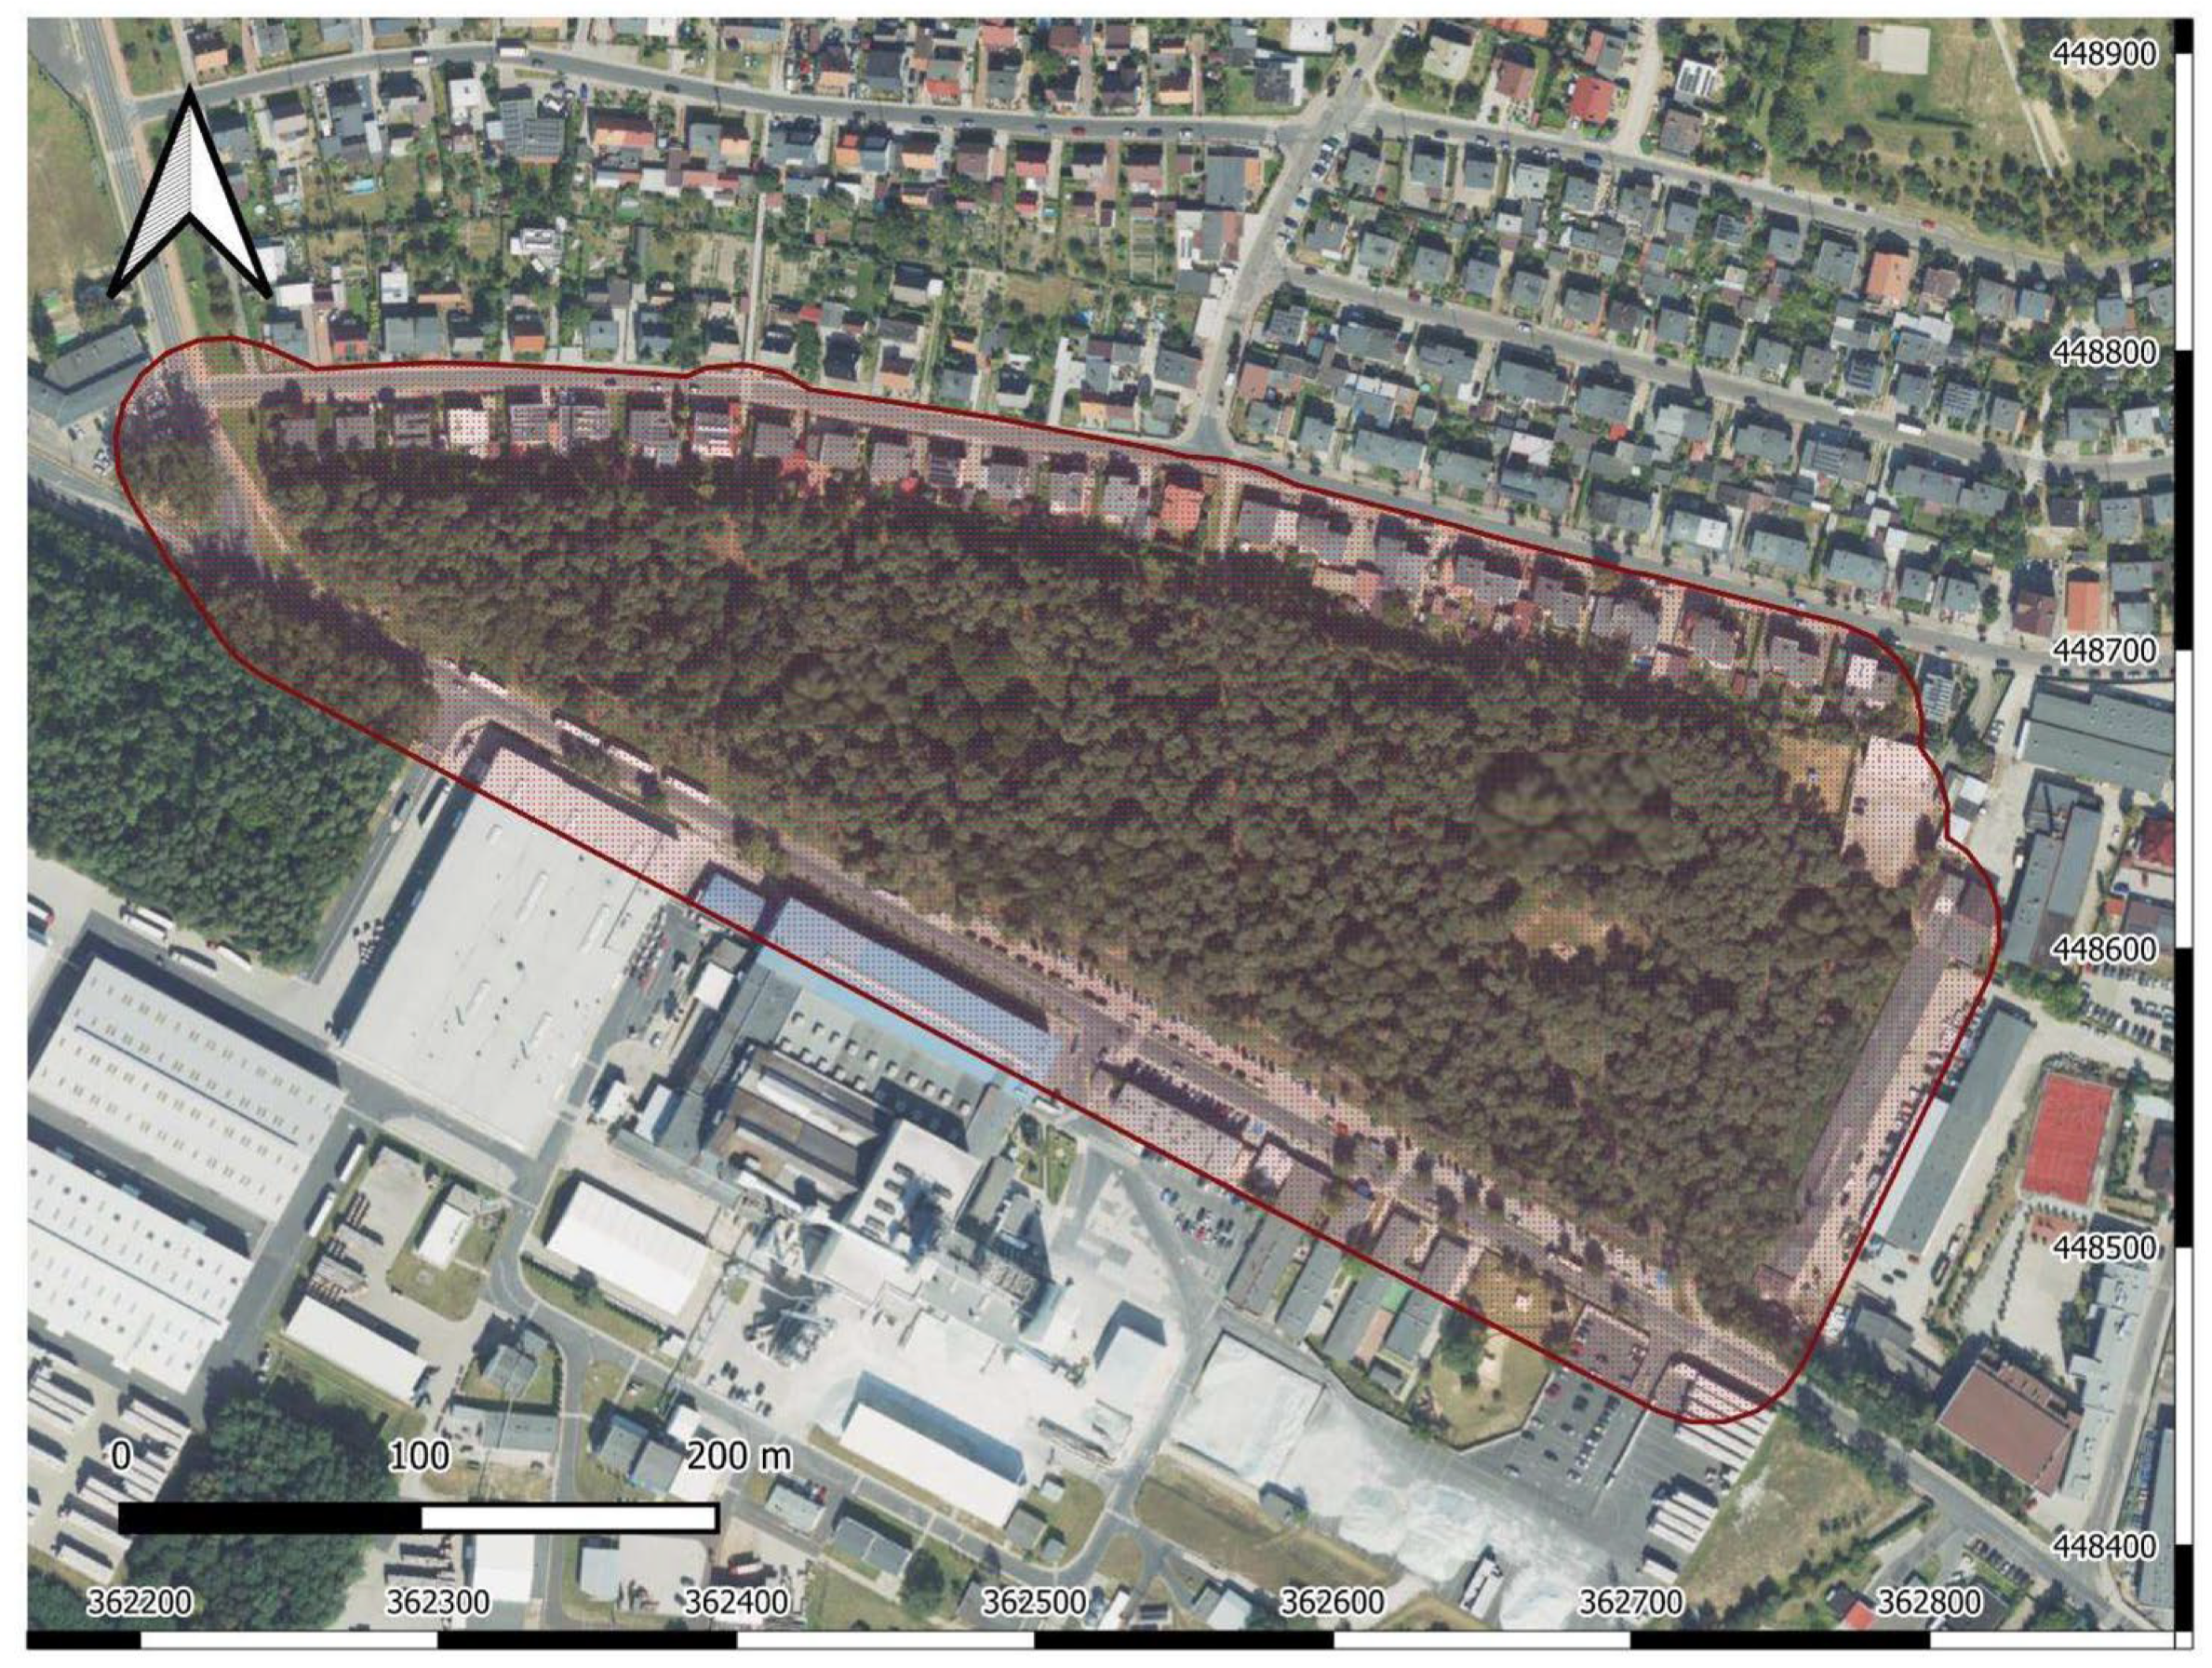
Figure 1a).
The study was conducted in a uniform pine forest stand covering an area of 6.69 hectares, described in the aforementioned UPUL as compartment 1a. The average diameter at breast height (DBH) of the trees is 37 cm, and the average tree height is 24 m. The dominant species is classified as site class II. The canopy cover is moderate and discontinuous, with a stand density index of 0.7. The total timber volume over the entire area is 1646 m
3. Natural regeneration (mainly sycamore and black locust) covers 60% of the understory area. The UPUL explicitly characterizes the stand as having a “park-like” nature. The study area is wedge-shaped (see
Figure 1b). To the south, it borders a municipal road and, further on, a glassworks facility. To the east are industrial zones, and to the north lies a residential neighborhood of single-family homes.
Due to its close proximity to the town center and its location adjacent to residential areas and large industrial facilities, the stand is subject to significant anthropogenic pressure. Numerous paths of varying width and usage frequency traverse the forest. Some of these paths are paved, and parts of the forest are equipped with street lighting installed on poles. Within a 0.20 ha enclave inside the forest stand, there is a playground equipped with recreational infrastructure. Currently, there are no formal regulations governing the use of this facility.
Preliminary hazard analysis identified damage to pine trees caused by the spiny bark beetle (Ips acuminatus Gyllenhal), the presence of red ring rot (Porodaedalea pini (Brot.) Murrill), and (often in groups) progressive tree dieback.
2.2. Tree Assessment
Classification criteria combined numerical NDVI thresholds with visual interpretation of crown color and morphology. Trees with NDVI values < 0.20 and lacking visible green assimilation organs were classified as dead, while trees with NDVI values in the range 0.20–0.28 and exhibiting partial crown dieback were classified as declining. NDVI thresholds were determined from the ground-based assessment of 51 trees and calibrated using crown condition indicators visible in CIR imagery. Calibration was performed by comparing field-assessed tree vitality (Roloff class R3 or dead) with corresponding NDVI values extracted for the same trees. This correspondence was visually validated using CIR composites. A scatterplot analysis confirmed the separation between healthy, declining, and dead trees. However, due to the limited sample size (n = 51), no formal cross-validation was applied, which we acknowledge as a methodological limitation.
A semi-automated classification workflow was applied: first, a supervised classification of the CIR orthomosaic was performed in SAGA GIS to distinguish tree health categories. The resulting classification was then reviewed and refined in QGIS through expert visual inspection, using both CIR composites and RGB orthomosaics for reference.
2.3. UAVs-Based Data Collection and Processing
2.3.1. Aerial Data Collection
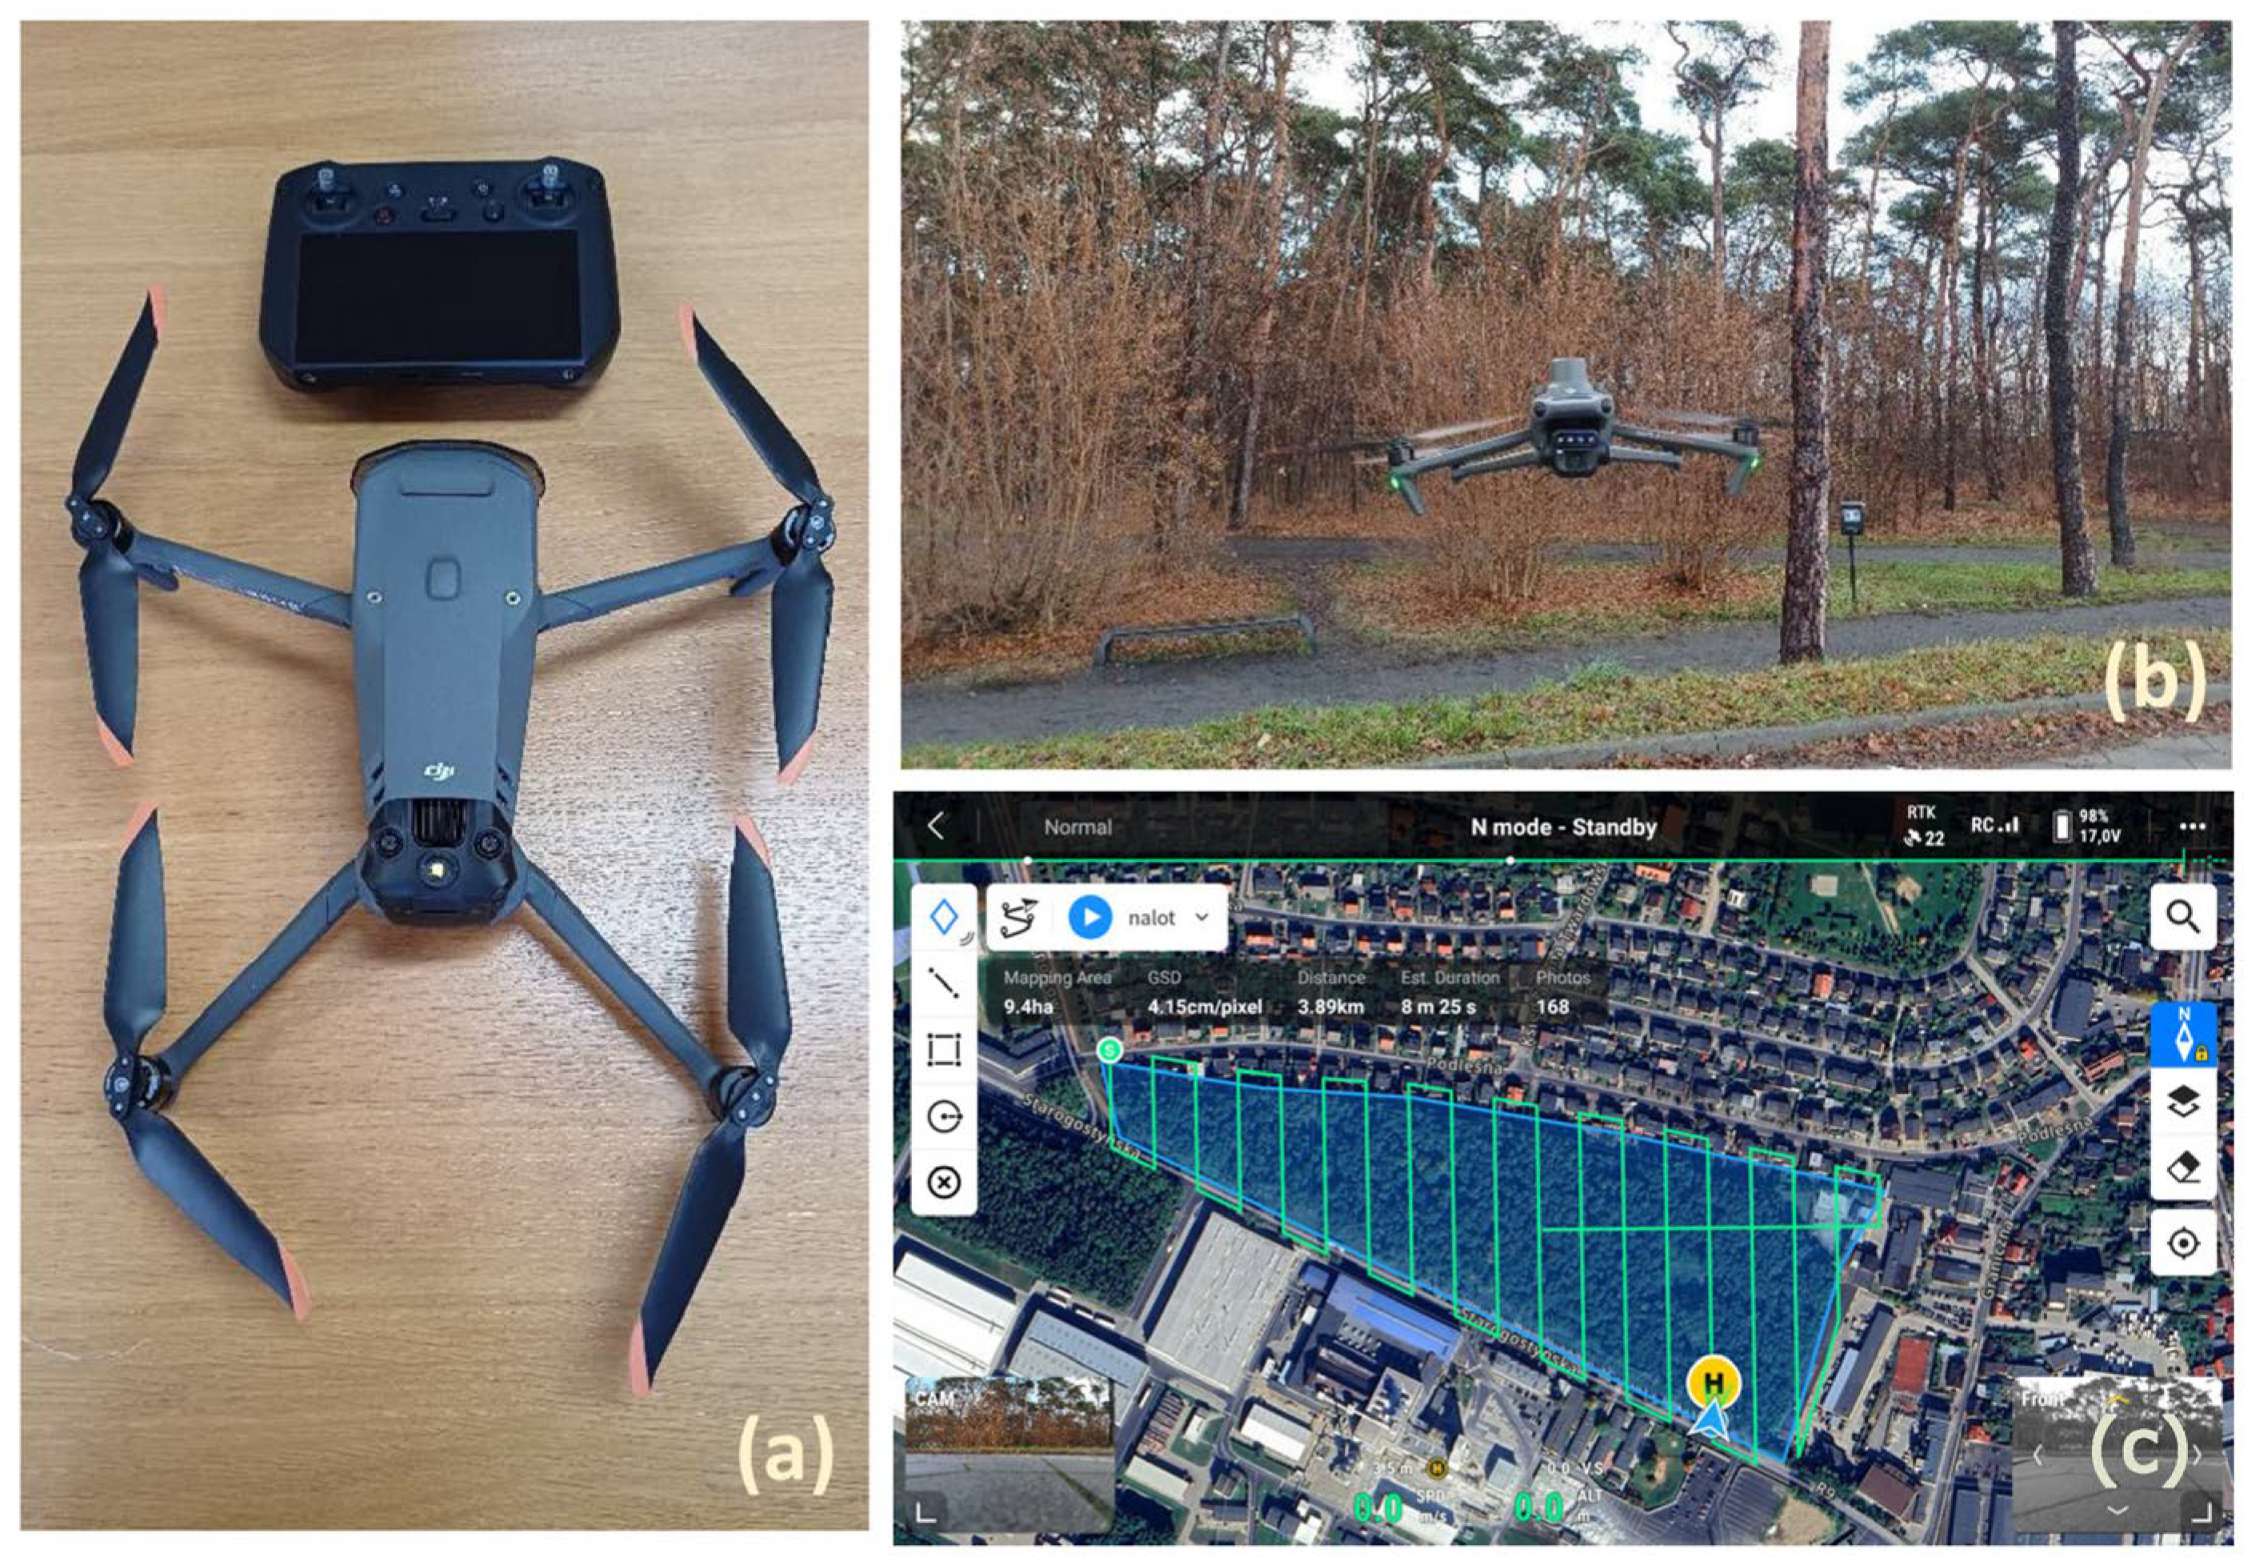
This study focuses on the potential use of commercially available unmanned aerial vehicles (UAVs) that are financially accessible to public institutions such as local governments, State Forests, or national parks. The aerial imagery used in this study was obtained during a UAV flight (
Figure 2a–c) conducted in December 2024. The photographs were taken using an unmodified DJI Mavic 3 Multispectral UAV (DJI, Shenzhen, China). The UAV is powered by LiPo batteries with a total capacity of 5000 mAh, allowing for a maximum flight time of 43 min and coverage of up to 200 ha per charge. The UAV is equipped with a non-metric RGB camera featuring a 4/3-inch CMOS sensor, capable of shooting 20 MP images, with a lens equivalent to 24 mm focal length and an aperture range of f/2.8 to f/11. The ISO range is 100–6400. The mechanical shutter prevents motion blur and enables -rapid, 0.7 s interval shots. In addition, the drone carries multispectral cameras (four single-band 1/2.8-inch CMOS sensors), each capable of capturing 5 MP images with a 25 mm focal length equivalent and an f/2.0 aperture. This enables imaging in the following spectral bands: Green (G): 560 ± 16 nm; Red (R): 650 ± 16 nm; Red Edge (RE): 730 ± 16 nm; Near-Infrared (NIR): 860 ± 26 nm.
Flight stability is maintained through integrated components such as a GPS module, accelerometer, barometer, gyroscope, and compass [
26]. Additionally, the UAV was equipped with the optional D-RTK 2 High Precision GNSS mobile station, which ensured enhanced positioning accuracy. The D-RTK 2 GNSS base station was used externally to improve positioning accuracy; it was not mounted on the UAV itself, which explains why the module is not visible in
Figure 2a.
2.3.2. Processing of Data Collected Using UAVs
Meteorological conditions during the flight included: air temperature 0 °C; air humidity 78%; complete cloud cover (8/8 oktas); wind speed 8 m·s−1; surface condition: dry. When evaluated against recommended UAV operating conditions, the weather during the flight was considered highly challenging. The total flight time was less than 13 min. A total of 825 digital images were taken: 165 RGB images in *.jpeg format, and 165 images each in the G, R, RE, and NIR bands in *.tiff format, amounting to a total data volume of 7.38 GB. These images were used to generate orthomosaics.
To generate orthomosaics, the WebODM Drone Software—OpenDroneMap™, version 3.3.2—was used. The final outputs included a true-color RGB orthomosaic, as well as orthomosaics in the green (G), red (R), and near-infrared (NIR) spectral bands. Images from the red-edge (RE) band were not used in the study, because under overcast conditions their reflectance values were inconsistent and did not improve class separation in preliminary trials.
Further analyses were conducted using QGIS 3.34.4 and SAGA GIS 9.2.0. Based on reflectance maps in the red and NIR bands, a Normalized Difference Vegetation Index (NDVI) map was generated. A CIR composite image, emulating color-infrared imagery, was created using the G, R, and NIR bands. The CIR composite was then subjected to object-based classification, resulting in a post-classification image along with a corresponding table indicating the surface area percentage of each identified tree health class (specifically, dead or declining trees).
2.4. Ground-Based Data Collection and Processing
2.4.1. Ground-Based Data Collection
To compare tree crown health as determined from aerial imagery, a ground-based tree health assessment was conducted. However, due to heavy cloud cover during fieldwork, it was not possible to evaluate the discoloration of assimilation organs (i.e., foliage). Therefore, the study focused on identifying dead trees or those in the final stages of decline. This assessment was carried out several weeks prior to the aerial survey, in November 2024, and conducted twice, with a two-week interval between observations. The survey was conducted twice by an experienced arborist (ISA TRAQ certified), which increased reliability, although no formal inter-observer statistics were calculated. The UAV-based classification was carried out independently of the ground survey results to minimize observer bias.
During each inspection, the observer recorded the location of trees that were classified—based on visual assessment—as severely weakened or dead. It should be noted that this method introduces a significant degree of subjectivity into the results.
Declining trees were assessed using Roloff’s vitality classification [
27], which is based on the visual condition of the distal parts of the crown. Each tree was evaluated according to this classification system, which defines four vitality levels: R0—trees with vigorous shoot growth, R1—trees with slightly delayed shoot growth, R2—trees with clearly delayed shoot growth, R3—trees with no potential for regeneration and no chance of returning to class R2. Following the visual assessment, only R3 trees and dead trees were included in the further analysis.
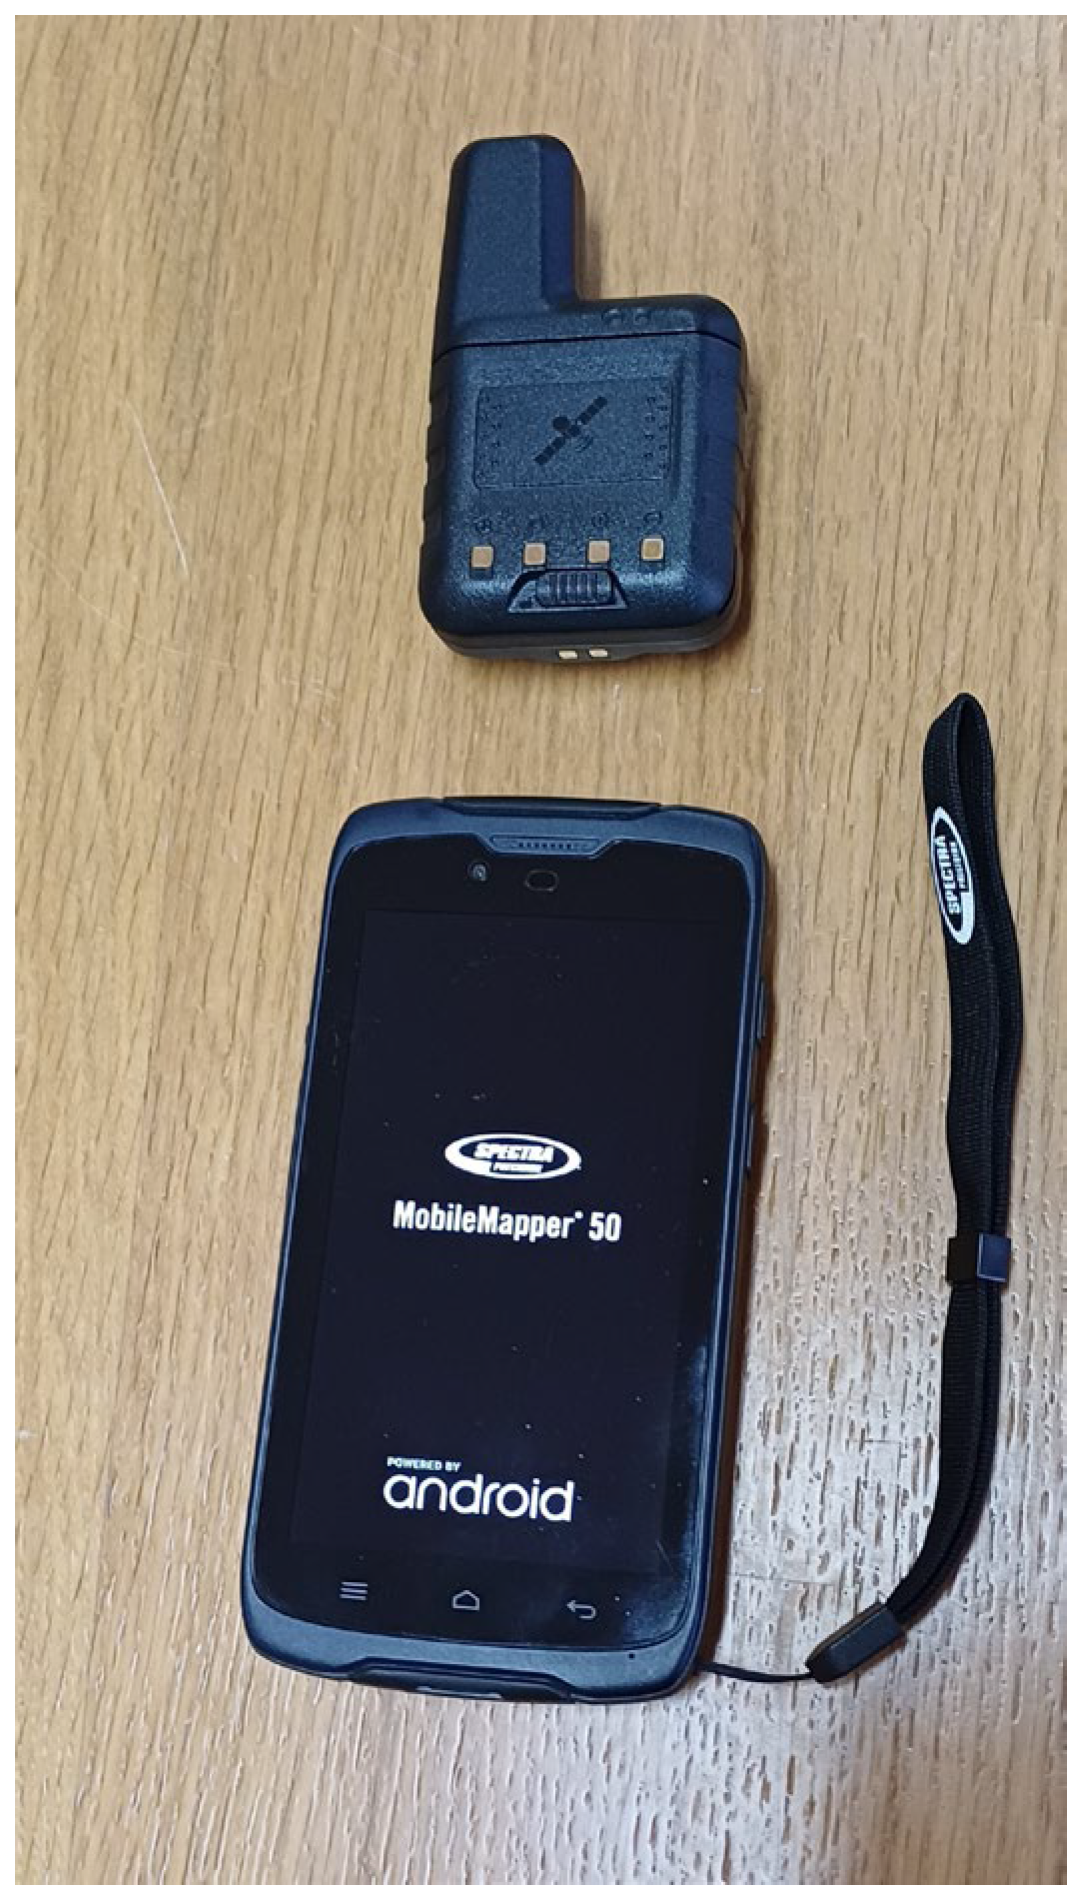
To record the geographic coordinates of the trees, a Spectra Precision Mobile Mapper MM50 device (Trimble Inc., Westminster, CA, USA) was used in conjunction with an external high-precision GNSS receiver (
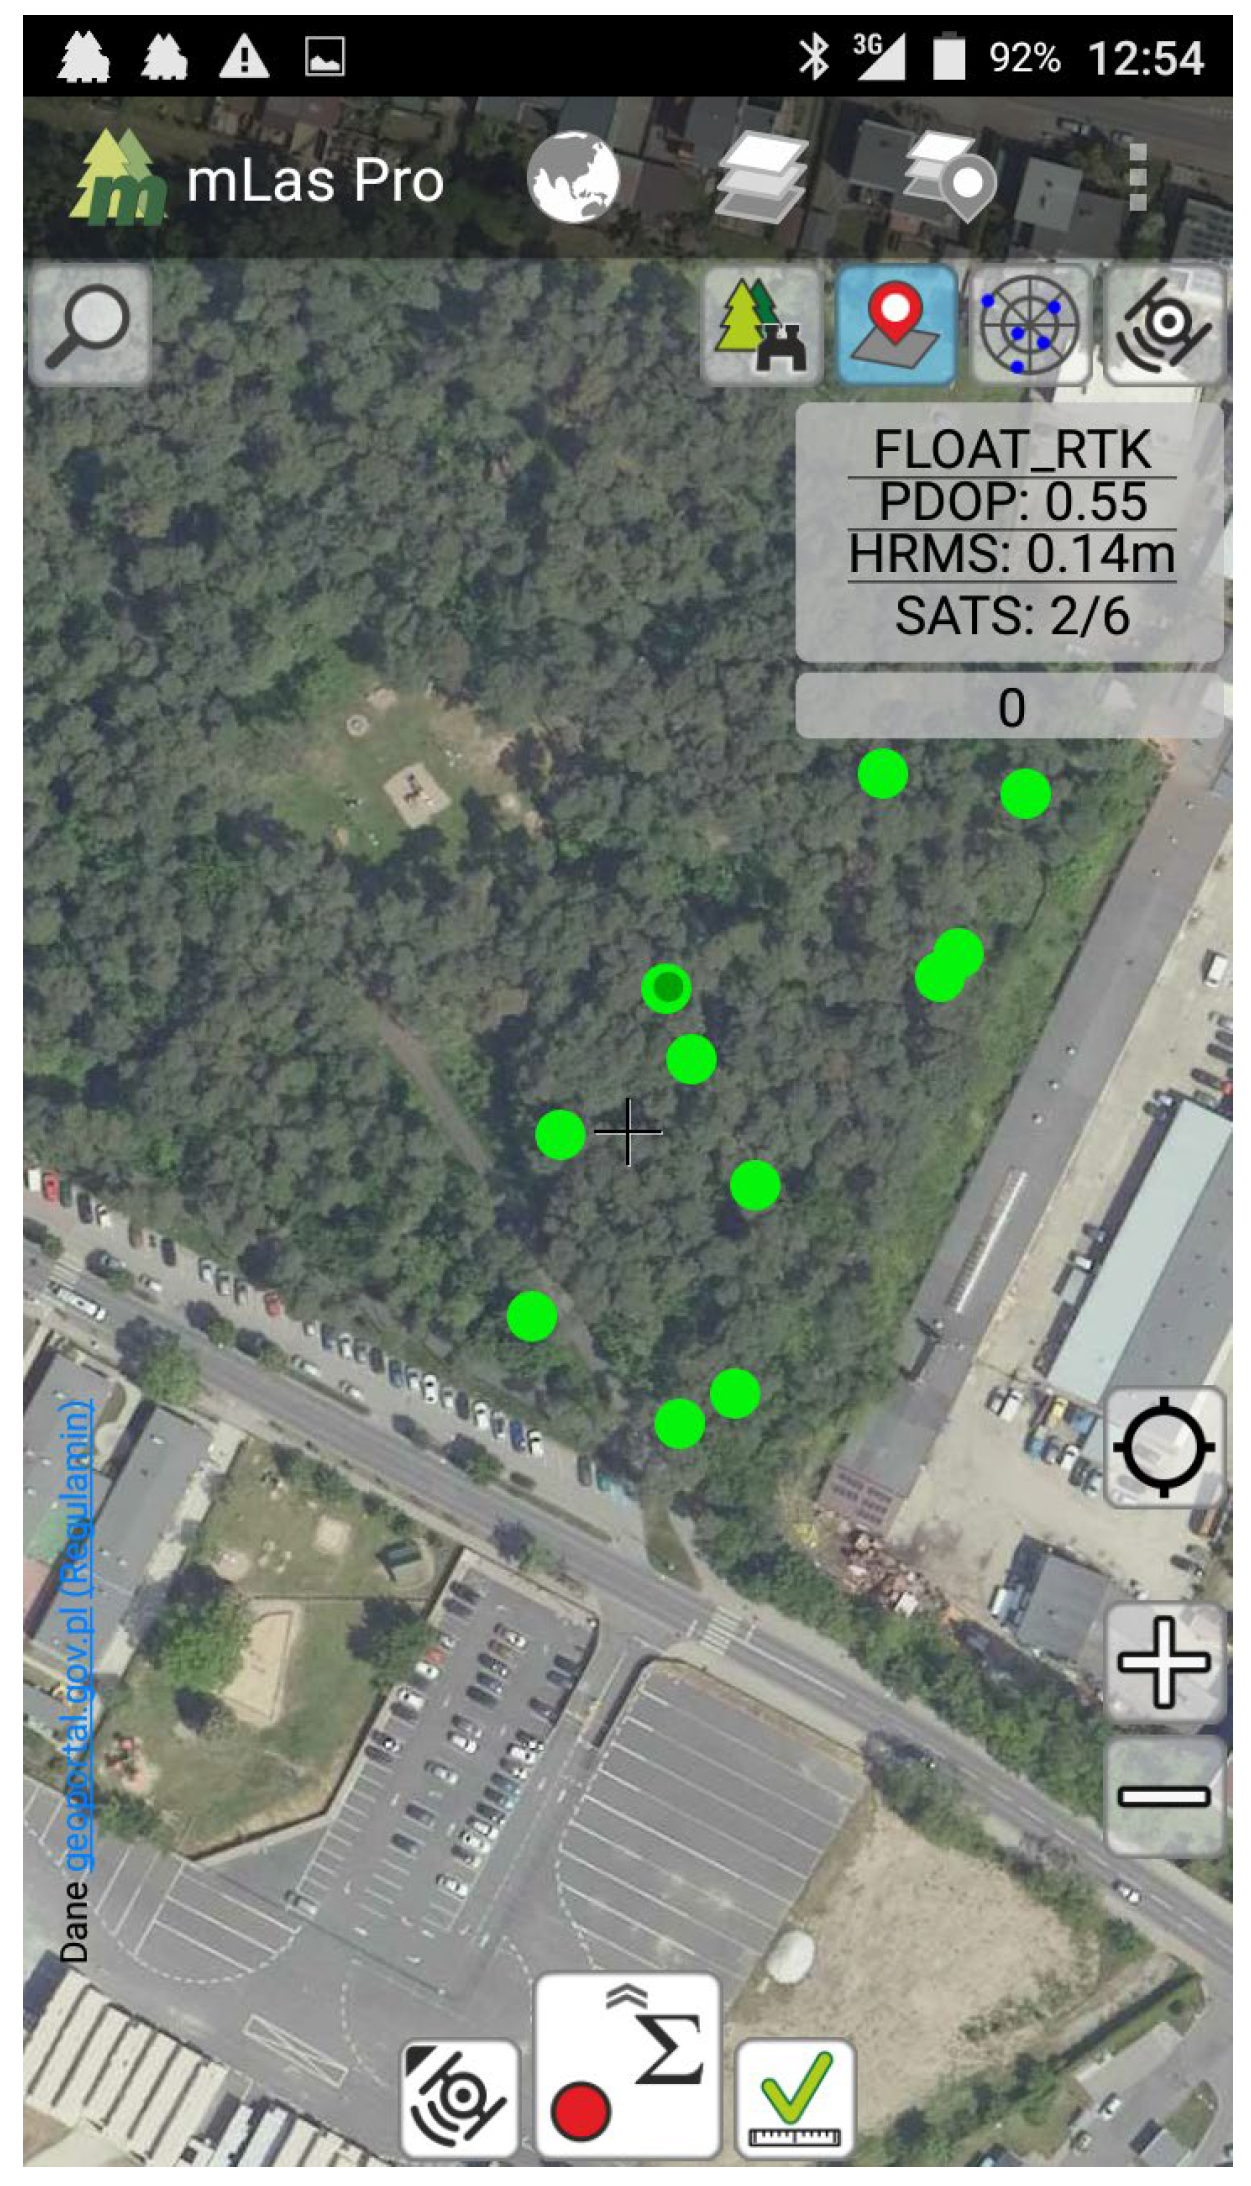
Figure 3). The use of the external GNSS receiver was driven by the objective of achieving high positional accuracy—especially since the measurements were taken beneath the tree canopy. Ultimately, a positional accuracy of less than 1 m was achieved, which is considered sufficient for further analysis. The Mobile Mapper MM50 was equipped with the mLas Inżynier 8 Pro application, which enabled the export of measurements in *.shp file format. The application interface during GPS measurement of trees classified by the observer as dead or severely weakened is shown in
Figure 4.
During data collection, each tree was also assigned a brief description, including information on its biosocial position, condition of the assimilation apparatus (foliage), whether it had suffered structural damage (e.g., to the stem or crown), and other relevant characteristics.
Tree height was measured in the field using a Nikon Forestry Pro II laser rangefinder (Nikon Corporation, Tokyo, Japan), and the results were verified against height data derived from the point cloud generated during UAV photogrammetric processing (
Table 1).
Notes:
Age derived from stand description in the Simplified Forest Management Plan (UPUL).
Height measured in the field using a Nikon Forestry Pro II laser rangefinder and verified against UAV-derived point cloud data.
DBH measured at 1.3 m above ground using a Haglöf forest caliper (Haglöf Sweden AB, Långsele, Sweden).
Crown width measured as the mean of two perpendicular crown diameters; larger values correspond to trees with less competition (edge or gap trees).
All trees were classified as R3 in Roloff’s vitality classification or as dead.
2.4.2. Processing of Ground-Based Survey Data
The *.shp file containing the geographic locations of the trees was further processed using QGIS software. This allowed for the extraction of precise geographic coordinates for each tree. Given that the observer conducted two separate field surveys, the locations of the identified trees were averaged using available tools in QGIS in order to minimize the subjectivity of the classification and its influence on the research results. The resulting averaged positions were then adopted as the reference dataset for further analyses.
2.5. Tree Risk Assessment
To evaluate the health condition of trees, remote sensing data obtained via an unmanned aerial vehicle (UAV) was used. The drone was equipped with a digital camera capable of recording visible light wavelengths, as well as sensors that simultaneously captured selected spectral bands—specifically green, red, red edge, and near-infrared radiation. The UAV flights produced a series of images, which were subsequently processed into orthomosaics: both in natural color and in selected spectral bands or their composites. Based on the analysis of tree crown coloration in the images, the health condition of the trees was assessed, with a particular focus on identifying the locations of dead, severely weakened, or declining trees. The obtained results were compared with the findings of an area-wide ground-based inspection, which relied on visually identifiable, obvious diagnostic features.
A standard procedure was used to determine the level of risk associated with the trees under study. The selected tree risk assessment method included a combination of ISA/BMP and TRAQ methods. According to the standards [
28,
29] a fall risk zone of 1.5 tree heights determined the hazard zone. Dead and dying trees located in this zone were classified as high-risk trees for research, and the methodology of this study was based on them.
3. Results
3.1. UAV Image Acquisition and Orthomosaic Generation
As expected from the stand description, all analyzed trees belonged to Scots pine (Pinus sylvestris L.), which is the sole dominant species in the study plot.
The UAV flight resulted in, among other data, 165 RGB (true-color) images in *.jpeg format. These photographs depict sections of the study area in central projection. While the images offer some utility in assessing tree vitality, their practical use presents several challenges: (i) locating dead or weakened trees requires a significant time investment, (ii) accurate interpretation demands prior experience, (iii) a degree of subjectivity remains in tree classification, and (iv) determining the precise geographic coordinates (especially the treetop positions) of identified trees is difficult. Due to these limitations, individual images were not analyzed in this study. Instead, the research focused exclusively on the evaluation of orthomosaics derived from photographs (
Figure 5).
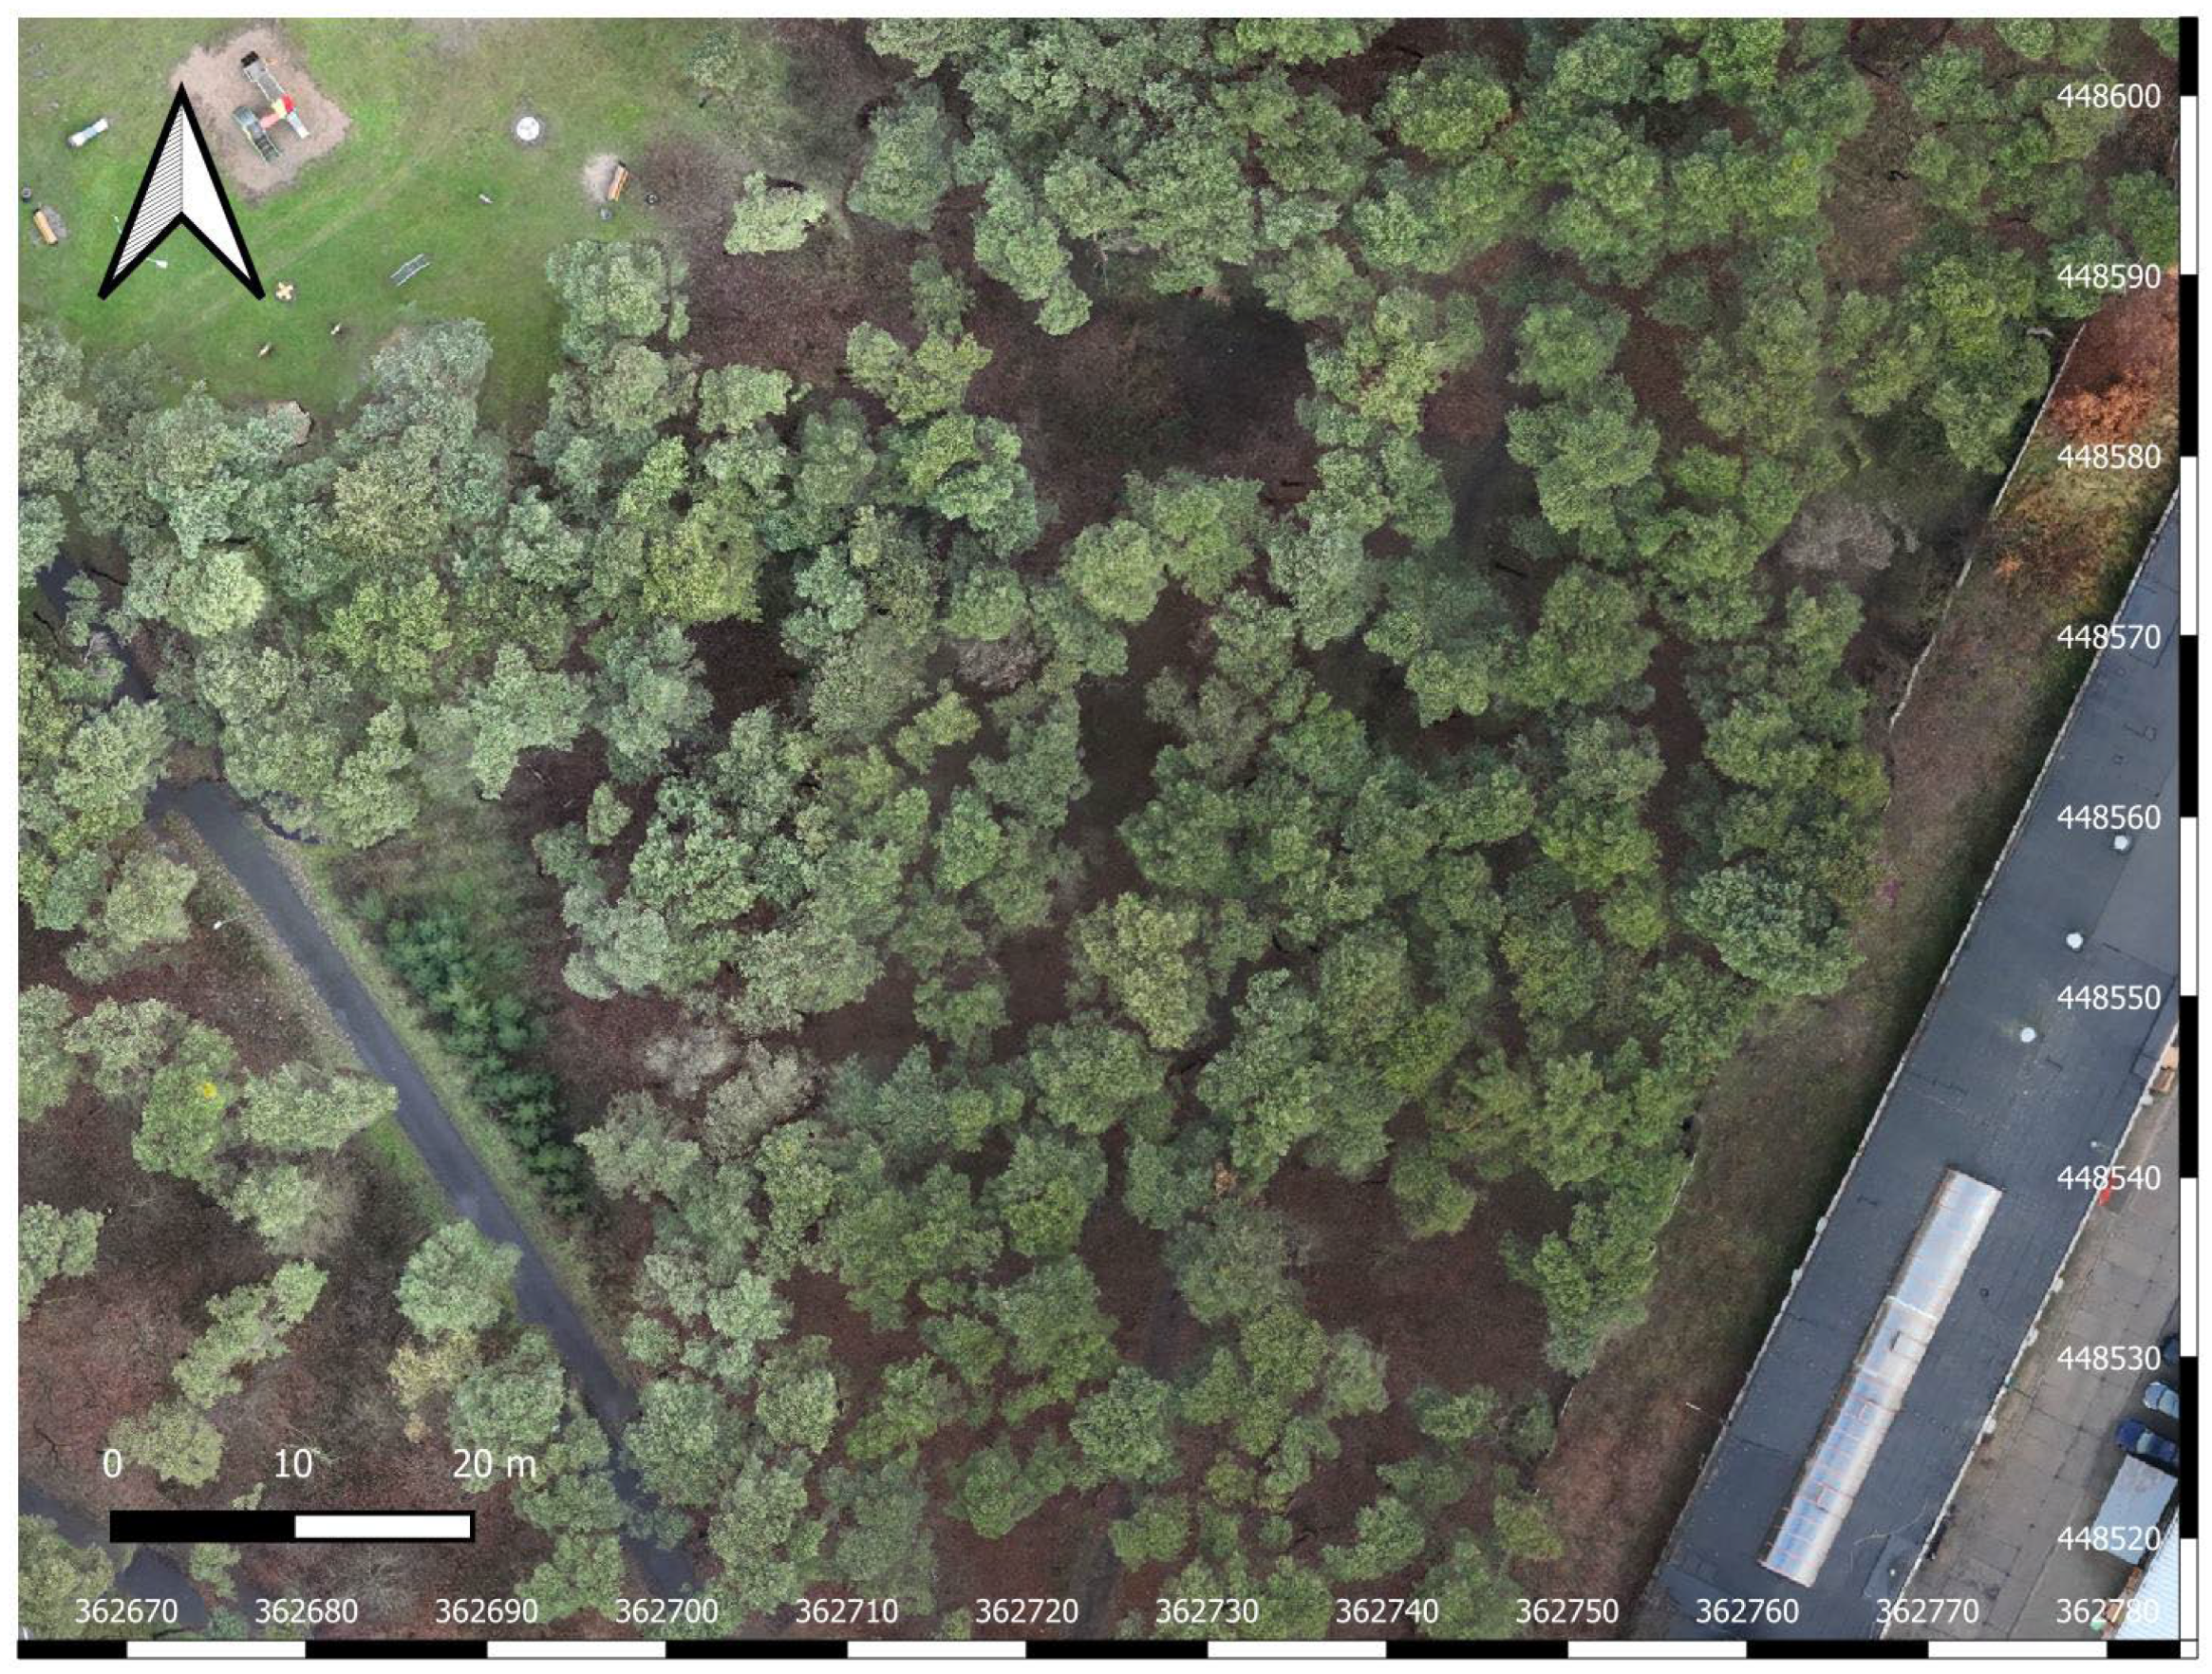
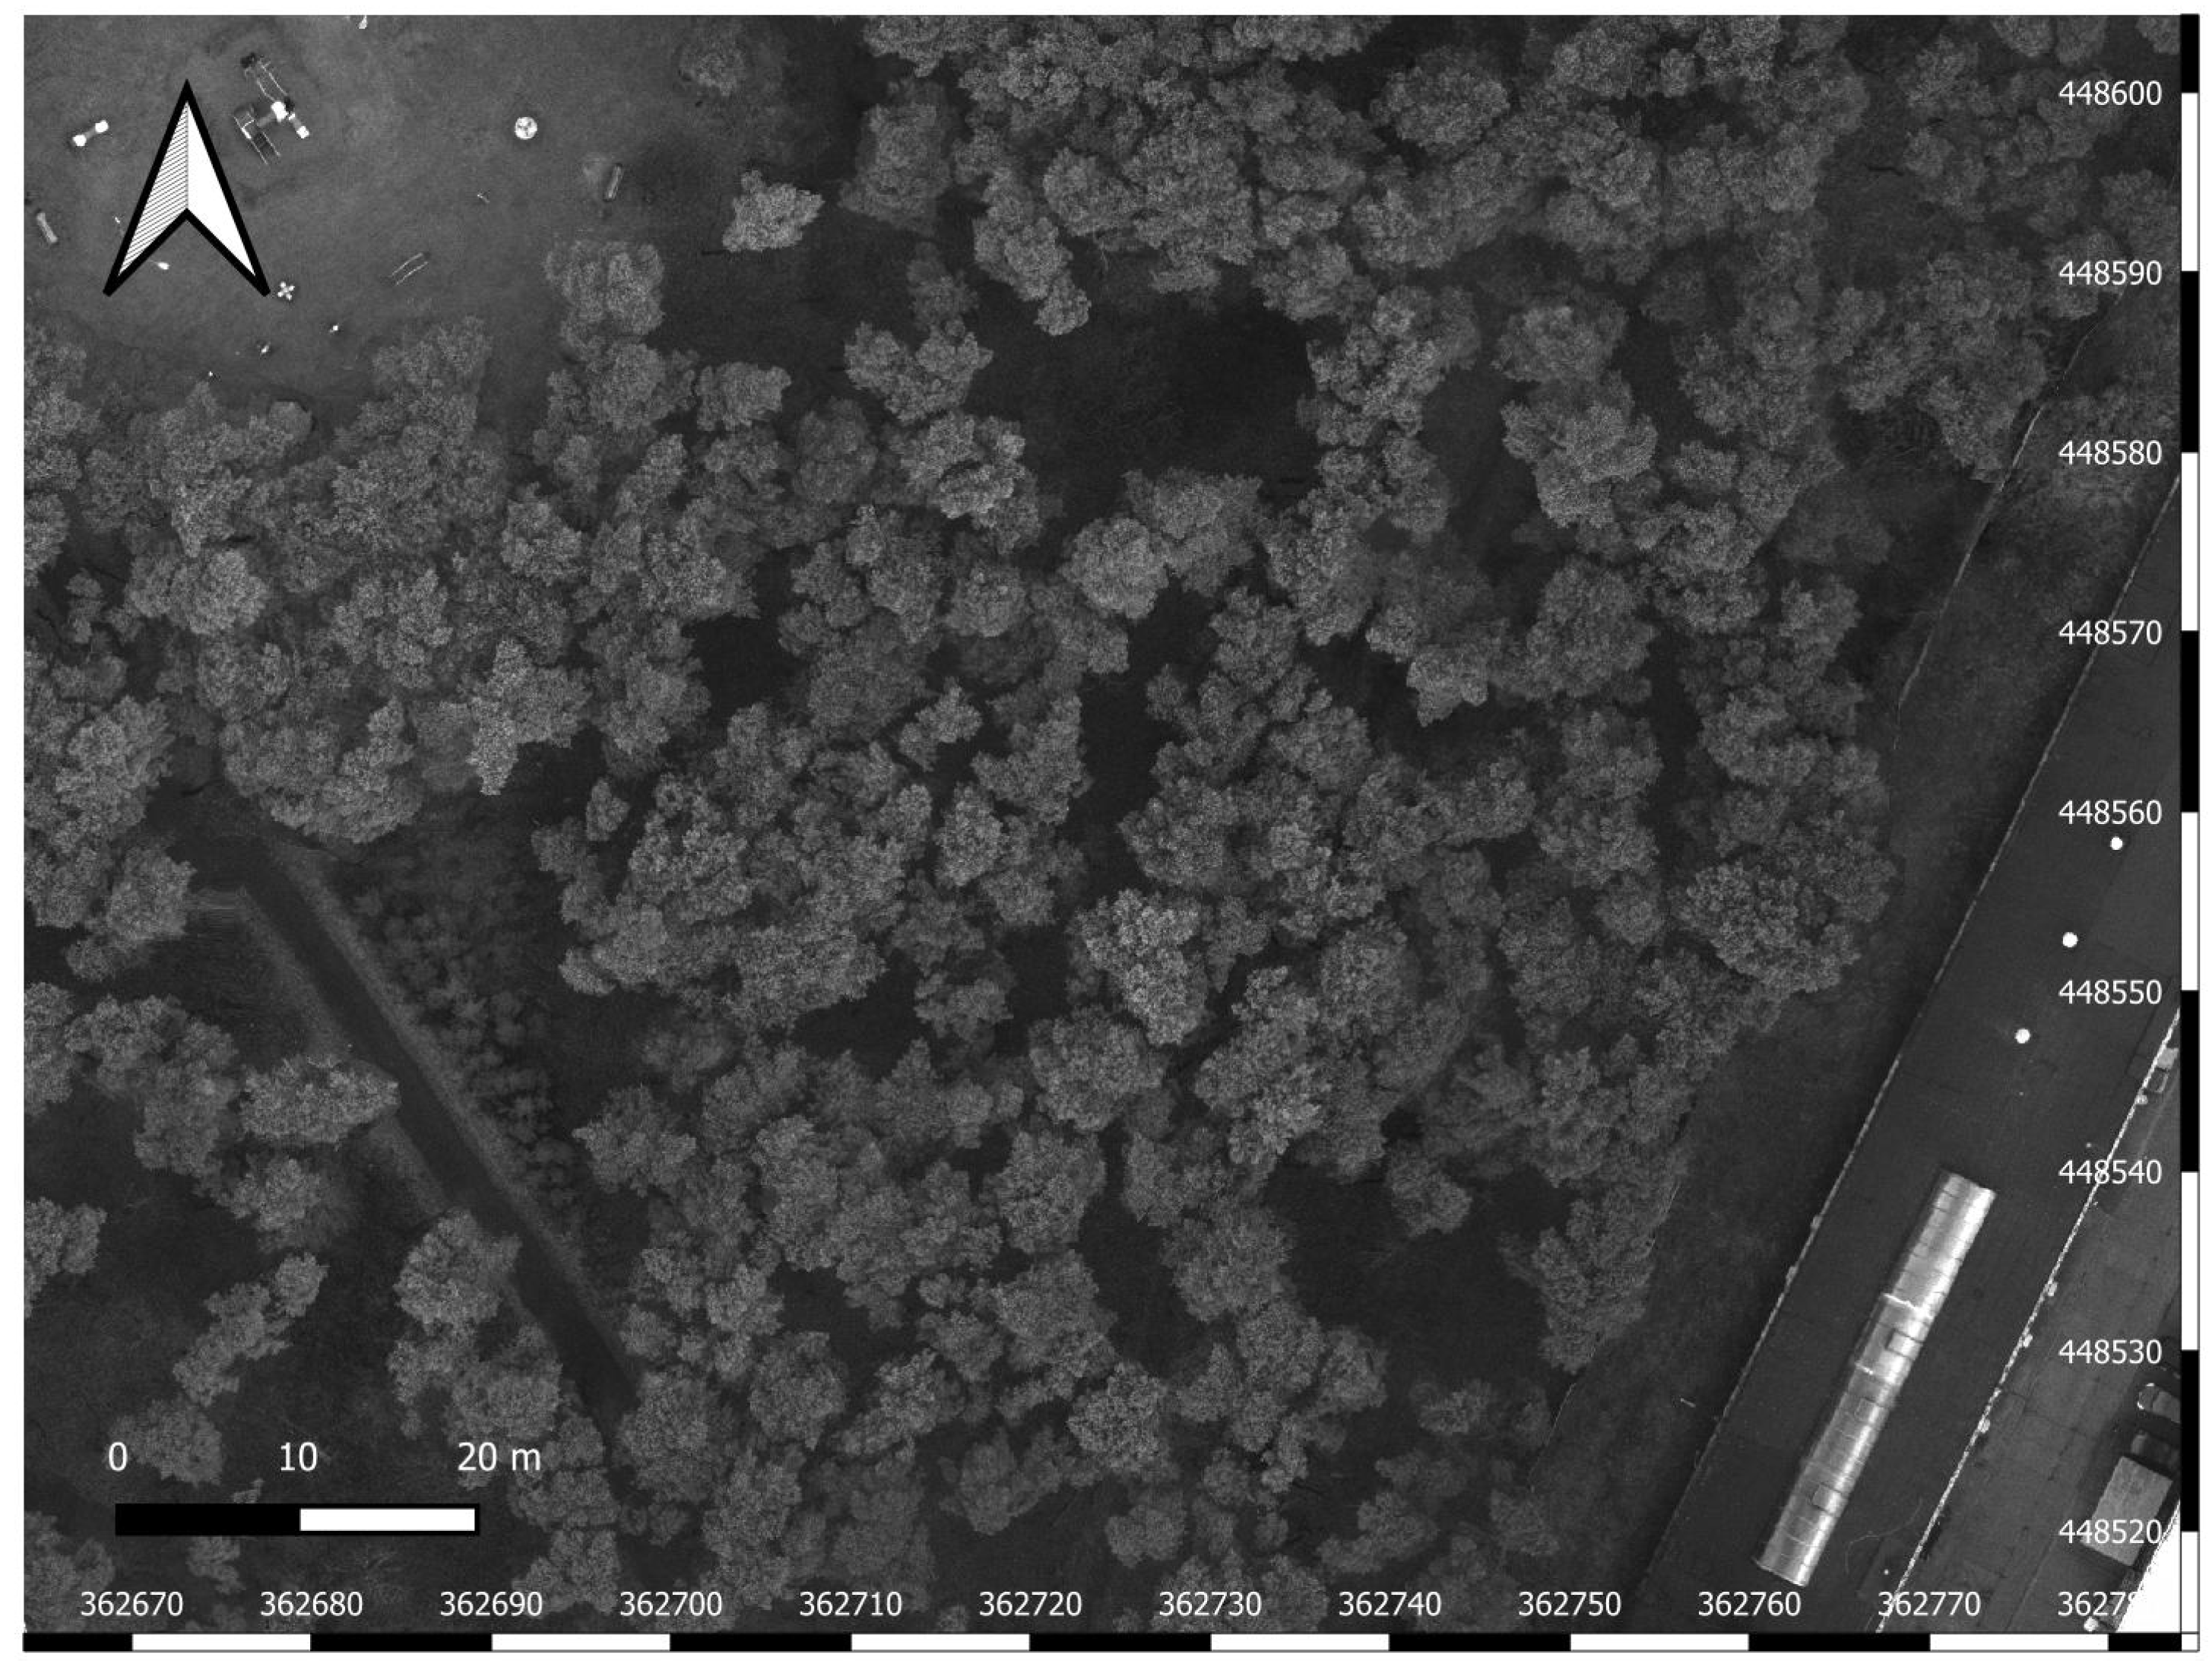
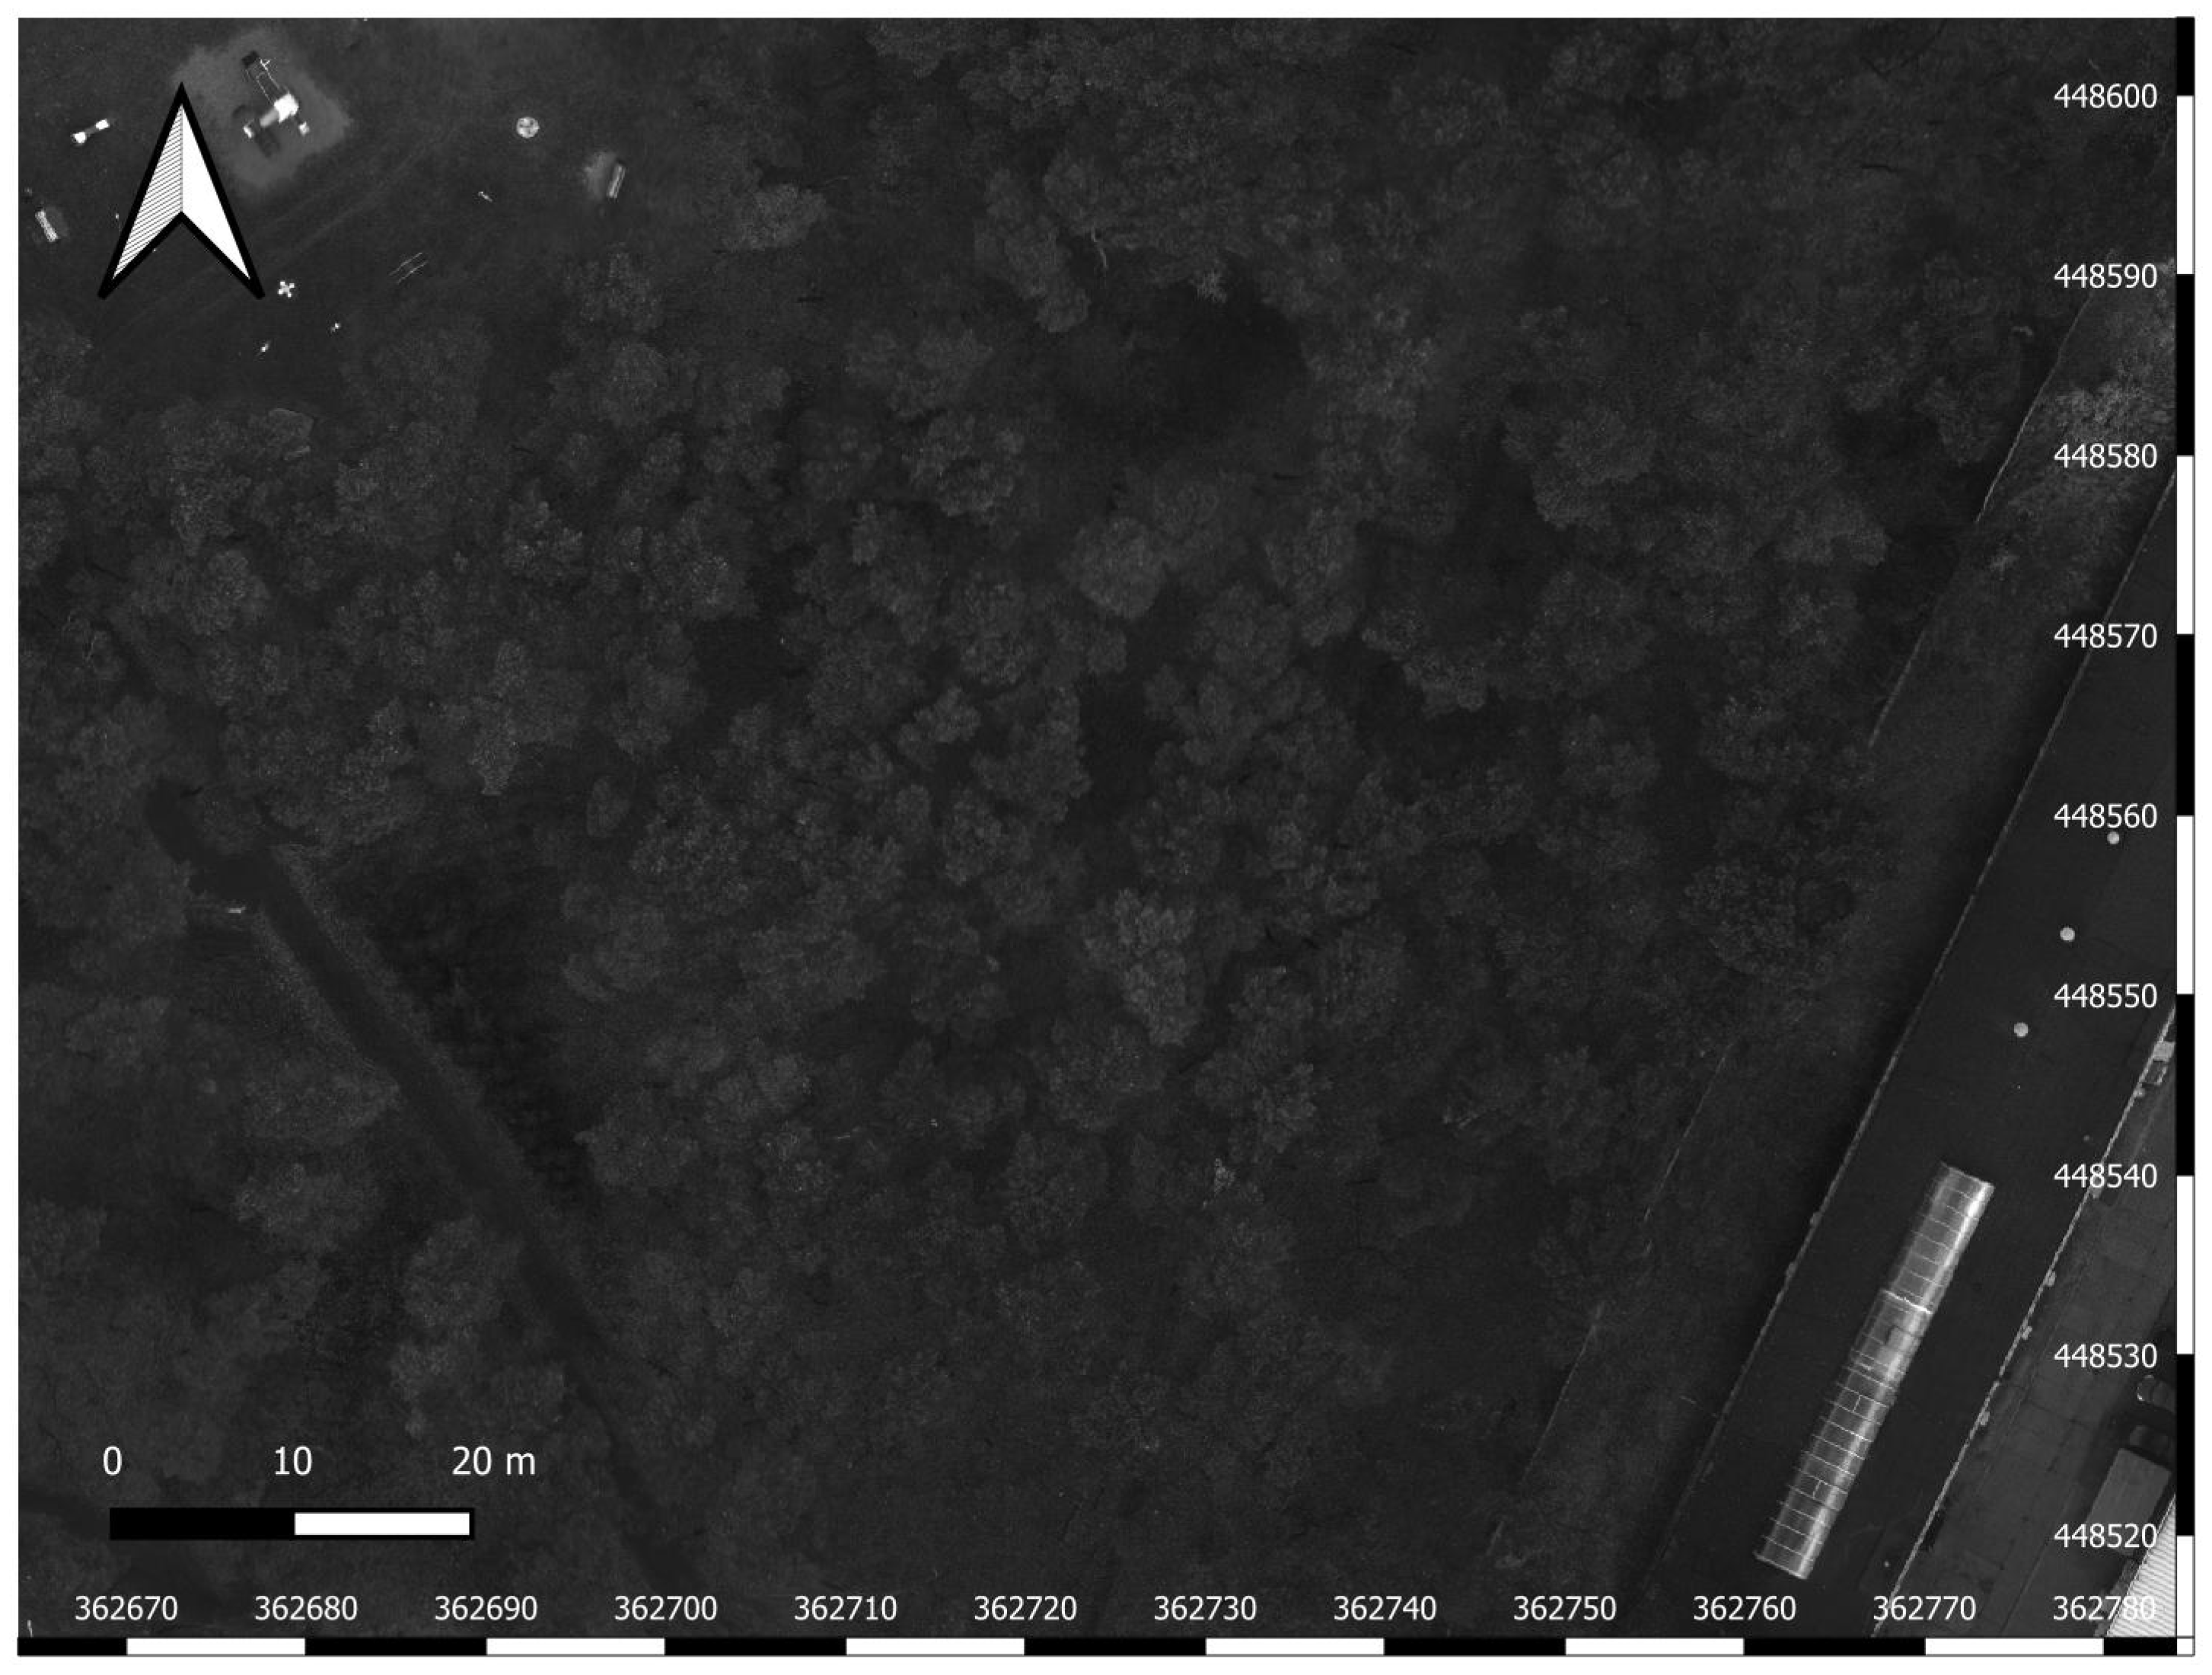
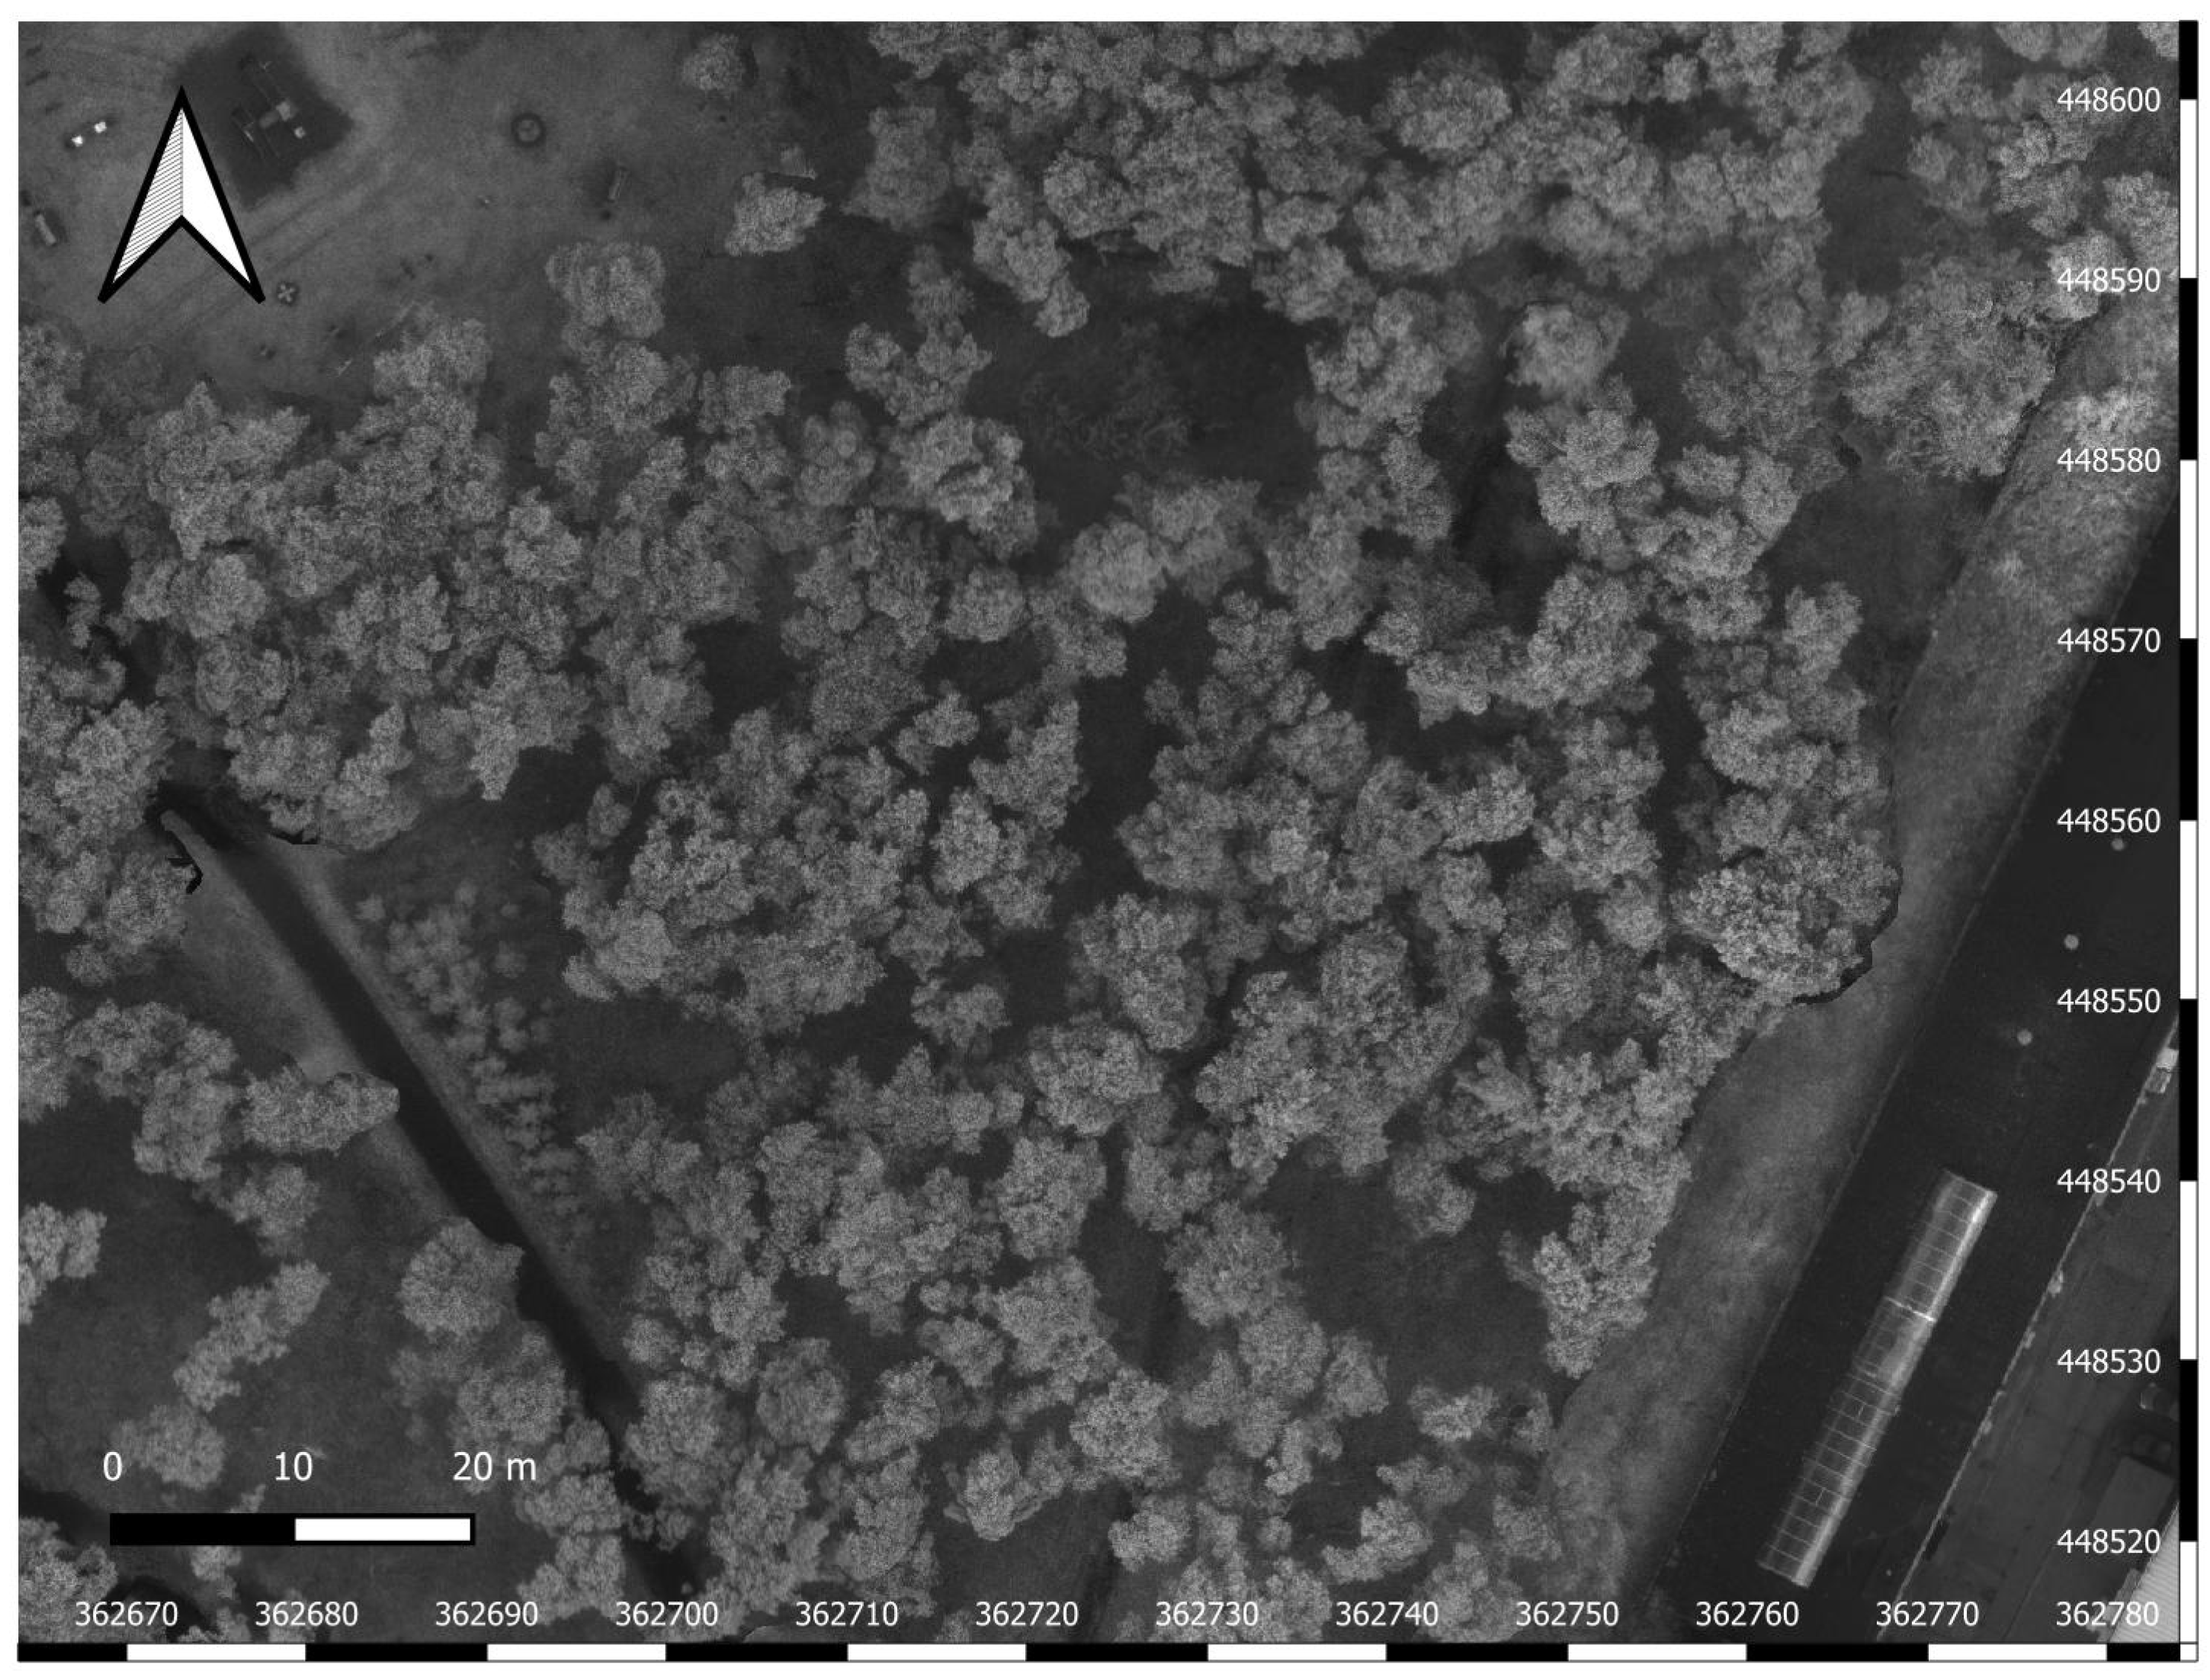
Fragments of the RGB orthomosaic, as well as orthomosaics in the green (G), red (R), and near-infrared (NIR) spectral bands, are presented in
Figure 6,
Figure 7,
Figure 8 and
Figure 9.
Based on the reflectance maps, a color composite of the NDVI vegetation index (
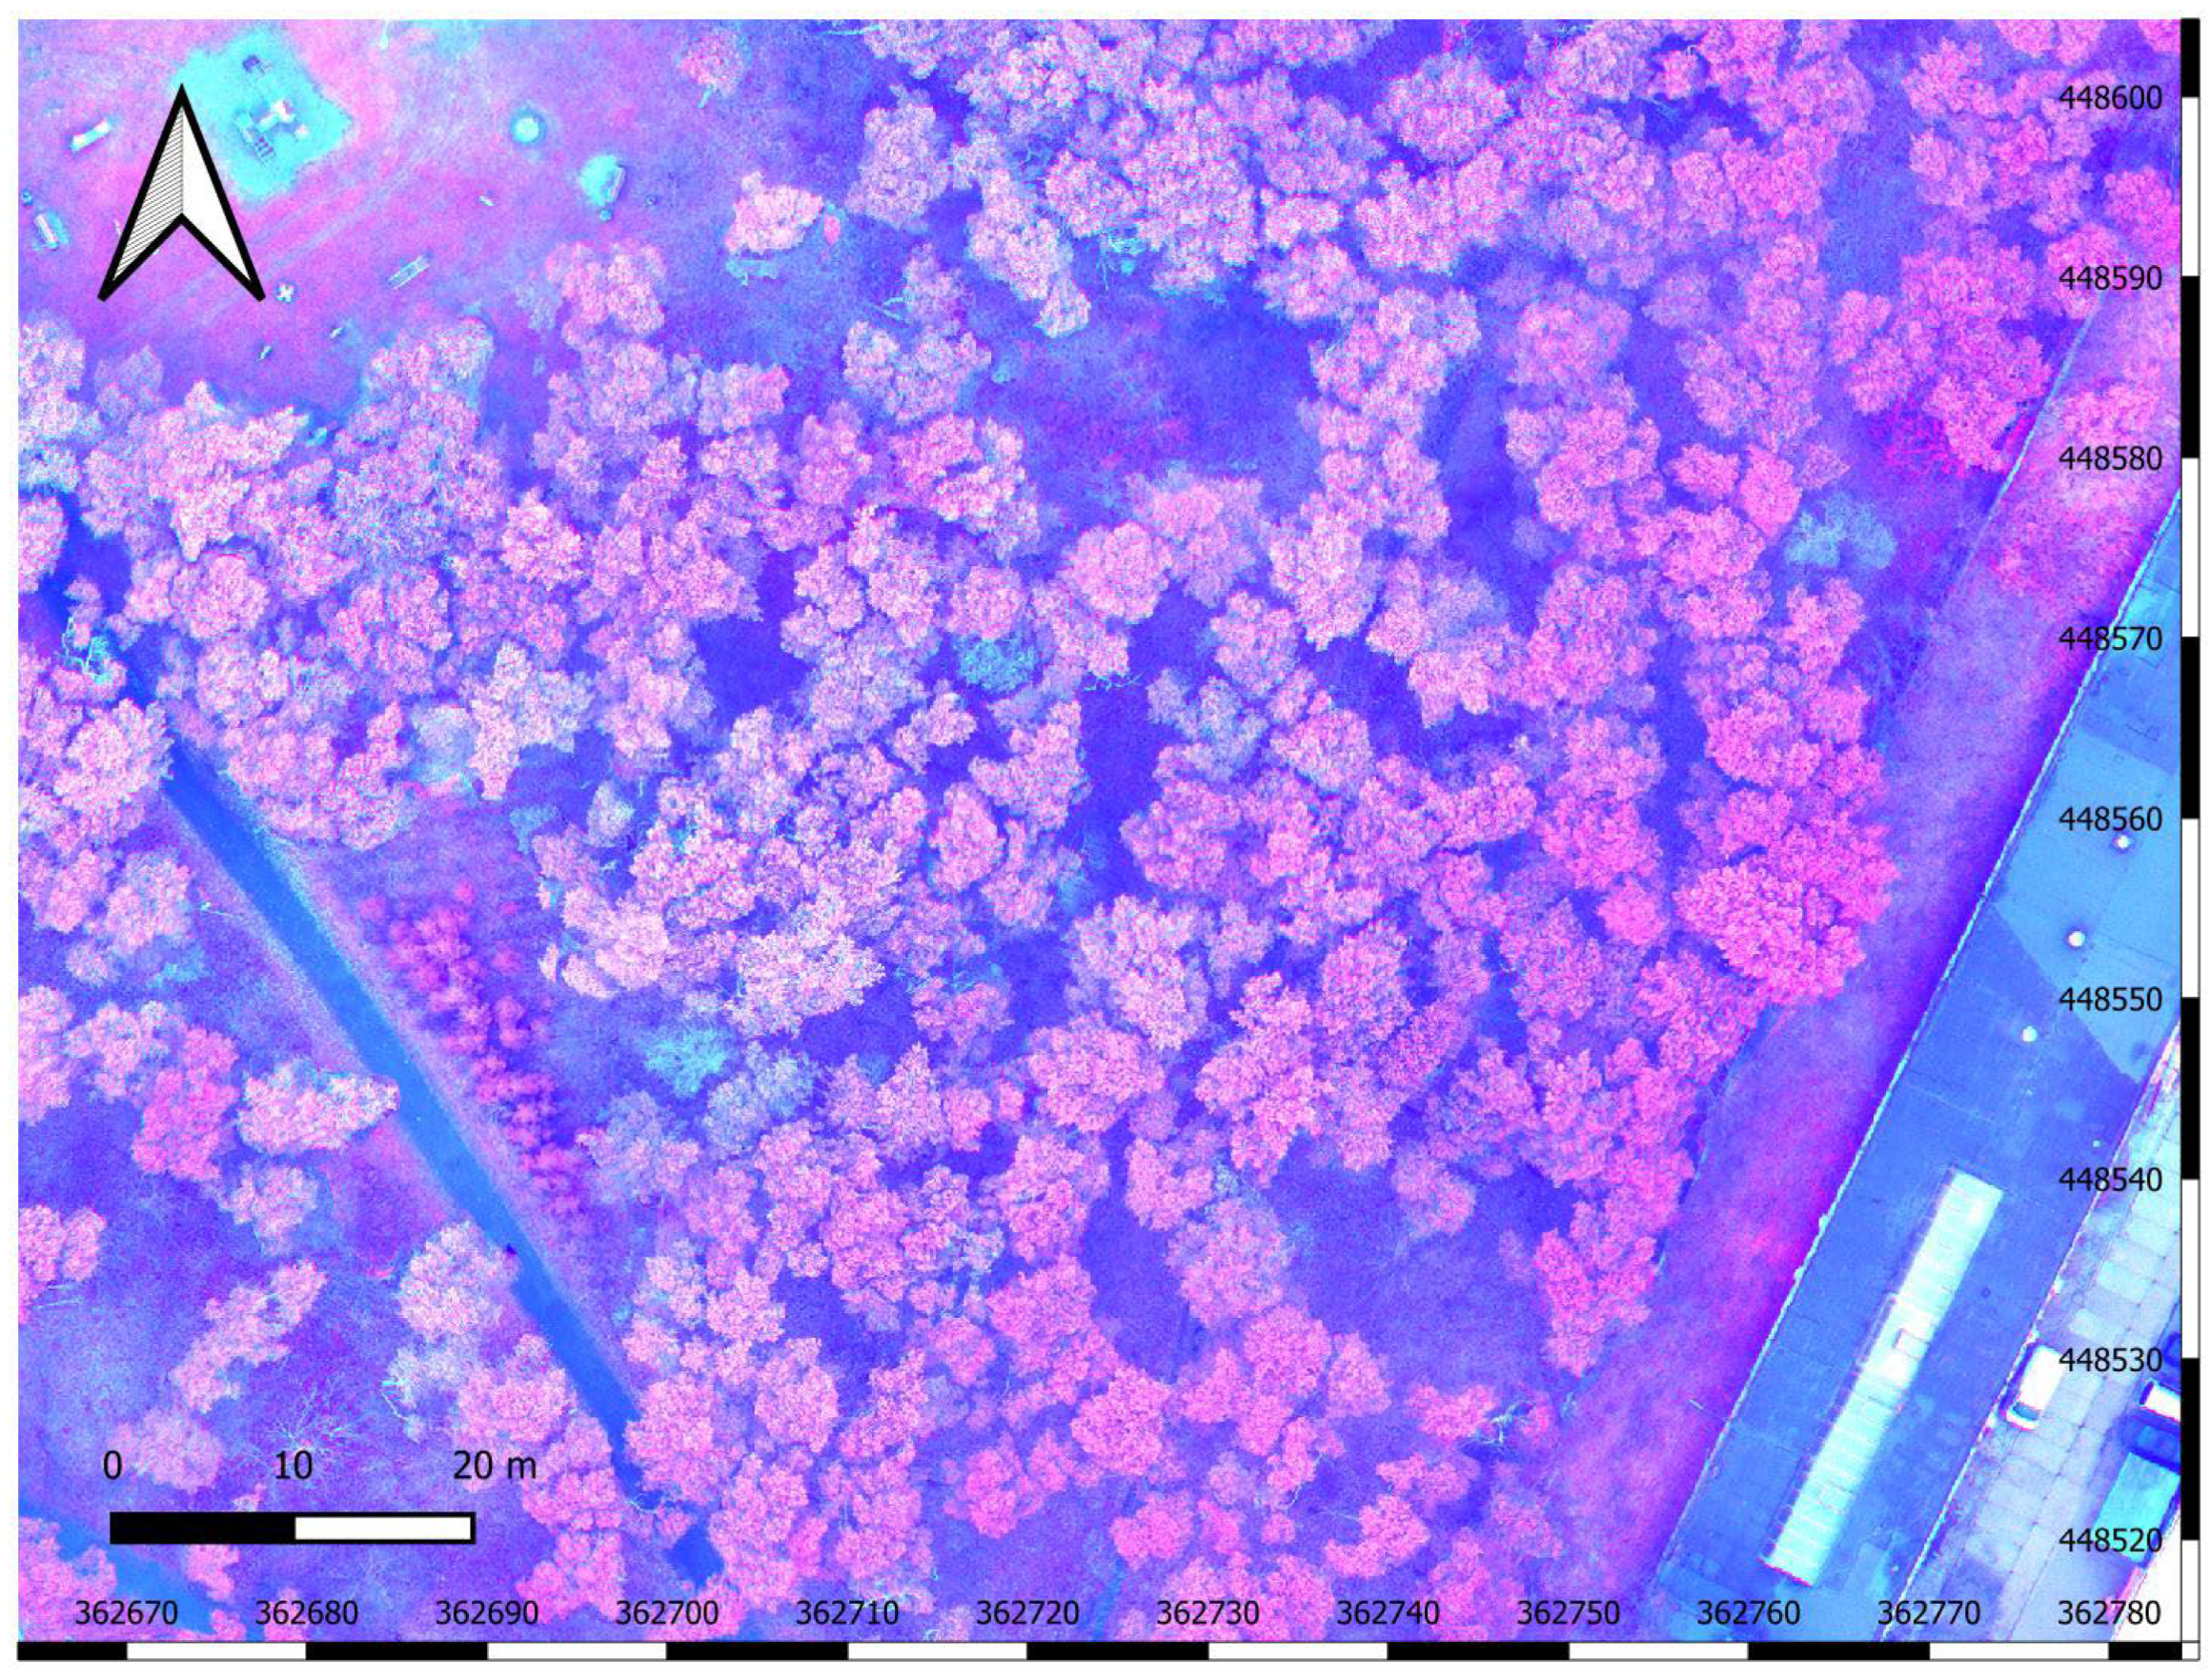
Figure 10) was created in QGIS, along with a CIR color composite using near-infrared (NIR) and visible light bands G and R (
Figure 11).
The color rendering in the generated orthomosaics is not uniform—in the central part of the orthomosaics, a color distortion can be observed, due to the omission of color correction during the orthomosaic stitching process. Additionally, the impact of adverse and variable weather conditions during data acquisition cannot be ruled out. Moreover, artifacts are noticeable in the CIR and NDVI composites generated using individual spectral bands. These imperfections or image distortions may stem from errors in the unsupervised orthorectification process, challenging weather conditions during the UAV flight, or other factors.
3.2. Hazard Zone Delineation
As part of the analysis, selected topographic features (e.g., paths, roads, buildings, infrastructure elements, etc.) were vectorized in QGIS based on the orthomosaic. This allowed for the delineation of a potential tree fall risk zone, where people and/or property may be present simultaneously. Assuming, in accordance with ISA/BMP and TRAQ method guidelines, a fall risk zone extending at least 1.5 times the tree height, it was determined that the hazard zone essentially covers the entire study area (
Figure 12).
For the purpose of the area-wide inspection, it was determined that the analyzed area is characterized by a relatively uniform function, use intensity, and maintenance level.
3.3. Comparison of Field and UAV-Based Inspections
During the desk-based analysis, the generated RGB and CIR orthomosaics were used. In QGIS, a point layer representing the locations of dead and dying trees as identified by the observer during the field inspection was overlaid onto the orthomosaics. Tree health was assessed visually using the orthomosaics. A Comparison between the reference dataset (averaged data from field inspections) and the orthomosaics led to the following findings:
- (i)
During the field inspection, 51 dead or dying trees were identified, corresponding to an average density of 7.62 dead trees per hectare within the study area.
- (ii)
Of the 51 trees identified in the field, 40 trees were confirmed on the orthomosaics, as they could be clearly classified as dead or dying.
- (iii)
The agreement rate between the field inspection and orthomosaic analysis was 78%. This level of accuracy, while not perfect, is comparable with results obtained in other UAV-based tree vitality studies and therefore provides a reliable basis for integrating UAV data into tree risk assessments.
- (iv)
The CIR composite proved to be much more useful for comparative analysis, due to its higher contrast between healthy and dead trees. The visual interpretation of RGB aerial photographs was time-consuming, required more experience, and involved a significantly greater degree of subjectivity.
- (v)
Analysis of false negatives (22% of cases) indicated that the undetected trees on the orthomosaics included: 8 dead or dying trees located beneath the canopy, and 3 broken trees (both trees with completely missing tops and trees with crowns resting on healthy neighboring trees).
The UAV-based classification identified 78% of declining and dead trees correctly, with a mean density of 7.62 trees/ha. The NDVI thresholds distinguishing healthy, declining, and dead trees were set at 0.20 and 0.28, calibrated with field data (n = 51).
It should be noted that NDVI values are relative and context-dependent; thresholds reported here were calibrated using local field data and should not be interpreted as universal absolute values.
Details of these key indicators are summarized in
Table 2.
This study was based on a single UAV survey conducted in mid-summer conducted in December 2024, following a ground survey carried out in November 2024; therefore, temporal changes in NDVI could not be assessed within the scope of this research.
During the verification of the orthomosaics, some trees showing signs of decline—visible mainly as greenish/blueish branches in the CIR composite—were not recorded in the reference dataset (i.e., they had not been identified during the field inspection). Although some deciduous trees in dormancy were misclassified as dead due to the timing of data acquisition, field verification did not confirm the death of these pines. However, the analysis of these cases showed that they often resulted from specific crown structures (e.g., highly branched crowns with many dead limbs) or the loss of upper crown parts (often due to mechanical damage), leaving only the lower peripheral sections intact. Although this latter situation did not confirm complete tree death at the time of the study, it should be considered an indicator warranting further monitoring.
3.4. NDVI-Based Tree Vitality Assessment
While analyzing the NDVI vegetation index map in SAGA GIS, raster cell values were extracted for the point layer representing the locations of dead or dying trees. NDVI values ranged from −0.0920 to 0.5306. It was determined that dead and dying trees present in the reference dataset and positively confirmed on the orthomosaics and/or CIR composite had NDVI values below 0.2000 (observed in 35 trees), which in simplified terms corresponds to areas completely lacking living vegetation. Another 5 trees had NDVI values between 0.2000 and 0.2823, which roughly corresponds to areas with sparse residual vegetation. Values above 0.2823 were associated with the locations of dead trees that could not be confirmed on the orthomosaics (in practice, the NDVI signal came from alive trees located above the dead ones in the upper canopy layer). While NDVI values should not be interpreted in absolute values, this method still shows practical potential for verifying tree vitality using this index.
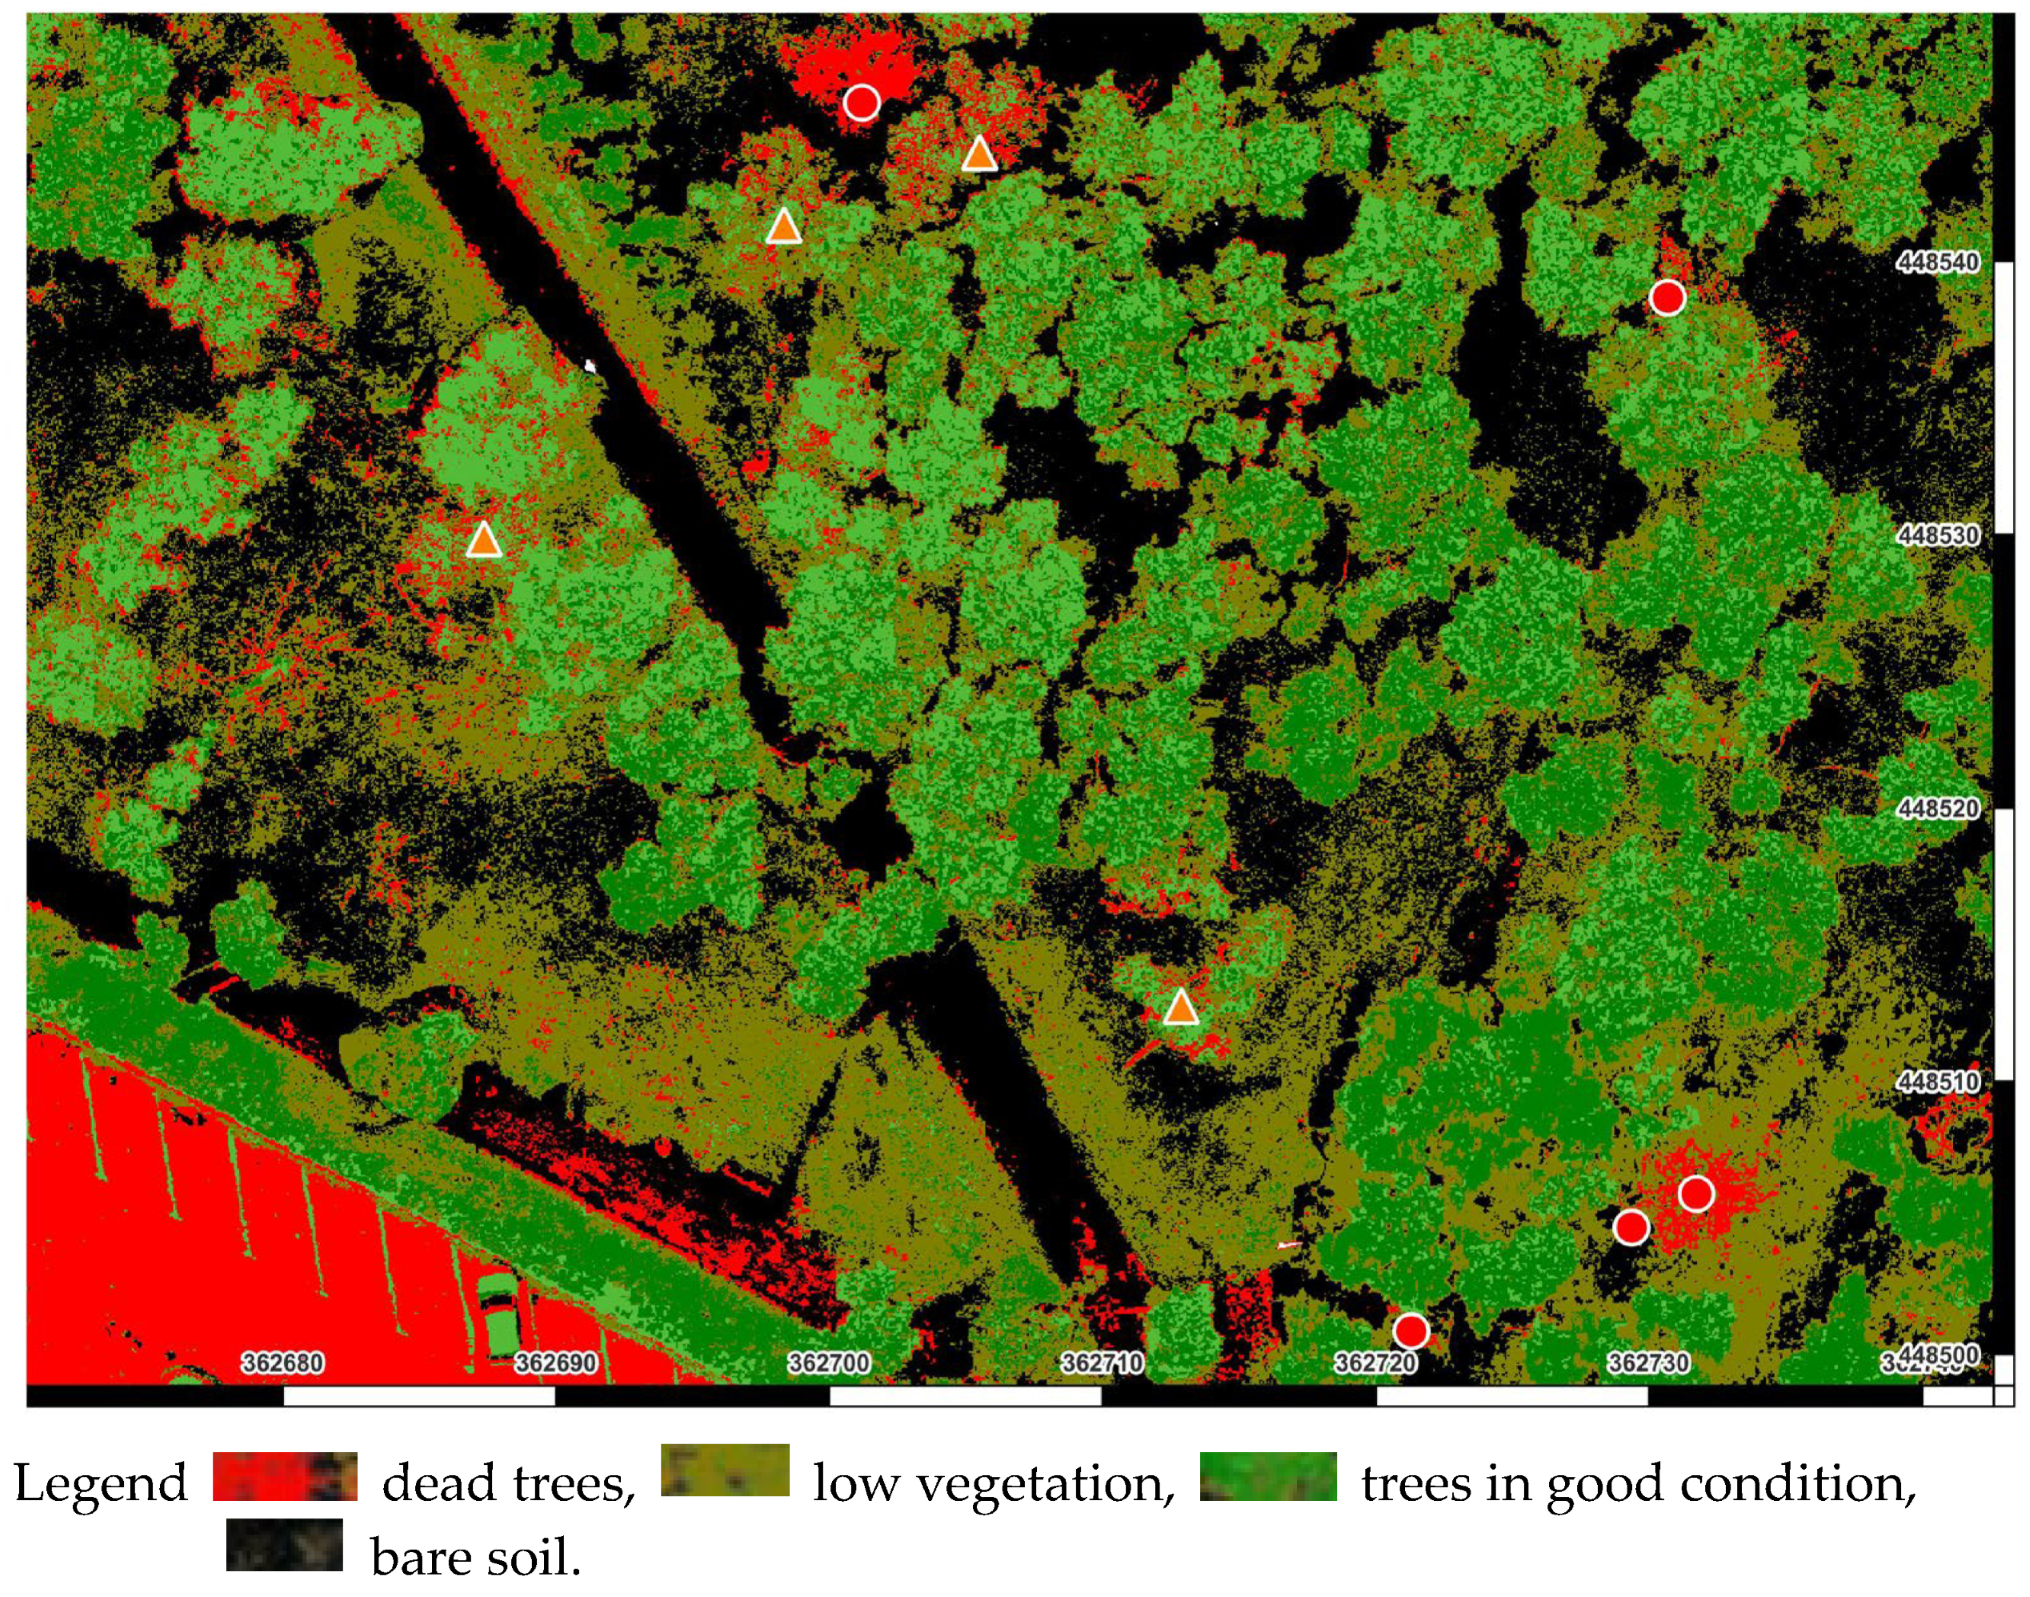
The locations of tree groups identified in the field survey (
n = 51) were explicitly overlaid on the CIR orthomosaic. Groups of dead trees are marked with red circles, while groups of declining trees are marked with orange triangles (
Figure 13). This visualization ensures direct comparability between field and UAV-based classifications.
Supervised classification in SAGA GIS was performed using the Maximum Likelihood algorithm, with approximately XX training samples per class (dead, declining, healthy trees, background). Validation was based on the 51 field reference trees.
3.5. Automated Land Cover Classification
Finally, the potential of automated land cover classification for assessing tree vitality was analyzed. A supervised classification of the CIR orthomosaic was performed in SAGA GIS, with the results presented in
Figure 13. Five land cover classes were selected: (i) dead trees, (ii) low vegetation, (iii) trees in good condition, (iv) bare soil. The post-classification image provided very clear and easily interpretable data, which proved much more useful than the RGB and CIR orthomosaics alone. However, the attempt to classify five land cover classes led to the algorithm erroneously grouping dead trees with certain land cover elements (e.g., concrete paving on parking lots) into the same class. While this does not disqualify the applied method, further research into classification techniques optimized for the specific site conditions would be necessary to improve accuracy and enable practical application. A part of these misclassifications occurred because dead trees were confused with bare soil or pavement, which shared similar reflectance; adding these as separate training classes should reduce this issue in future analyses. For operational deployments, we recommend including a dedicated ‘asphalt/concrete’ training class and applying simple texture or morphological filters to better separate dead trees from hard surfaces.
4. Discussion
4.1. Tree Risk and NDVI Utility
Dead and dying trees can be distinguished in analyses within the visible spectrum, and they belong to the group of trees with the highest priority for inspection. The removal of dead or dying trees constitutes a fundamental and objective step in strategies to reduce risk in urban greenery [
30,
31]. In a study involving experts from various cities, 67–87% of respondents indicated “removing trees that are completely dead” as a priority risk management operation for urban trees [
30].
Although there have been attempts to use NDVI for assessing tree structural stability, as in the study by [
32], where the NDVI derived from an orthophotomap and Terrestrial Laser Scanning (TLS) data was used to monitor the vitality of urban trees—and the high utility of NDVI was demonstrated as an objective and repeatable indicator of crown vitality regardless of expert subjectivity [
33], which showed that NDVI allowed for the identification of stressed and dying trees, proving the practical usefulness of this index for urban greenery health monitoring—NDVI has not, for example, been successfully used in this study to identify species, achieving only 40% accuracy. In forested areas, which are composed of a limited number of species, NDVI could potentially be used for both species identification and assessing their physiological state. Both NDVI and NDVI red-edge (NDVIRE) have proven to be the most effective indices for detecting damaged pine crowns, achieving 95% accuracy across the study area [
34], although in our study we obtained an accuracy of 78%. This lower agreement likely reflects under-canopy occlusion in a discontinuous canopy, the timing of a single late-autumn acquisition under overcast conditions, and nadir-only imaging at 4.15 cm GSD, all of which increase the probability of false negatives relative to multi-date or leaf-on datasets.
4.2. Interpretation of Spectral Data
It must first be clearly emphasized that the results of multispectral imaging primarily provide information about the health status of trees, rather than directly indicating the increased risk posed by the tree’s presence. In simple terms, the plant’s spectral response is closely related to the amount of pigments in its photosynthetic apparatus (primarily chlorophyll) and certain other tissue properties (e.g., cell structure, water content). However, these features alone cannot be considered as directly influencing the risk posed by a tree. Nevertheless, if we adopt the assumption that the presence of dying and dead trees (which exhibit distinct differences in multispectral imaging compared to healthy trees) significantly increases the hazard, then—within this assumption—the spectral response of plants can be linked to the presence of potential risk.
A key issue related to the interpretation of multispectral data is the fact that we only capture a two-dimensional slice of space (e.g., the forest canopy) with the UAV sensors. Therefore, inferences are limited to this narrow section of reality while simultaneously extending to the entire space below the captured layer (compared to assessing the technical condition of a building solely by observing its roof from above).
4.3. UAV Applications and Constraints
One of the advantages of using drones is their ability to access areas that are typically invisible or otherwise inaccessible to the observer—for example, enabling the detection of fungal fruiting bodies located high in the tree canopy [
8,
35,
36].
An important challenge in analyzing multispectral data is the need to either interpret raw data according to a defined, known standard, evaluate them in a relative context, or analyze these data over time (trend analysis). By analyzing raw raster data, we can precisely determine the absolute value of a given pixel (e.g., stating that a particular area has an average NDVI of 0.6). However, this absolute value alone does not provide unambiguous information. Only by knowing the NDVI of a reference area (e.g., an area occupied by fully healthy plants) can we draw meaningful conclusions about the health status of the area being examined. In the study by Otsu et al. [
34], specific threshold values were established, above which it was possible with high probability to identify crowns as damaged. Thresholds of NDVI ~0.50 and NDVIRE ~0.44 enabled consistent detection of tree defoliation across different locations. In our study, we observed that the average NDVI of the area decreased over time from 0.6 to 0.5, which allowed us to infer a deterioration in plant health. However, it should be stressed that knowing these absolute values without the broader context and accepted reference points does not provide fully meaningful information.
It should also be noted that only data acquired with the same equipment and under identical conditions can be considered comparable, as there is no standardization of devices and methods. Despite the aforementioned advantages, it is important to remember that the use of drones is subject to legal regulations and limitations arising from their technical design of these devices (particularly battery capacity), safety requirements, weather conditions, manufacturer guidelines, and geographic zones where flight restrictions apply [
36,
37,
38]. The effectiveness of multispectral methods may also depend on the type of tree stand. This type of aerial inspection may yield the best results in tree-lined avenues, which tend to show a higher detection rate due to the regular and wide spacing between trees.
Mia et al. [
39] compared various indices (NDVI, NDRE, GNDVI, GRVI) derived from UAV orthomosaics (RGB + NIR) and demonstrated a significant correlation between these index values and the health parameters of urban trees—including canopy gaps, crown defects, and infestations. These findings indicate a substantial potential of drone remote sensing as a low-cost and efficient tool for urban forest management. The efficiency of UAVs enables the capture of imagery suitable for generating orthomosaics covering areas ranging from several hundred to several thousand hectares [
40].
Based on the analysis of the generated orthomosaics (in both the full visible light range [RGB] and individual spectral bands [NIR, R, G], as well as their combinations), it was found that trees in the studied stand exhibited varied health conditions. Fully healthy or dead trees could be identified relatively easily in natural color images. However, the CIR composite, simulating multispectral imagery, proved especially valuable for assessing tree health. Furthermore, the classification process of CIR orthomosaics in GIS software such as QGIS or SAGA GIS can significantly accelerate the assessment process.
In the study by González-Ferreiro [
41], static (logistic) and Random Forest models were compared using UAV-acquired data to distinguish live from dead trees based on NDVI calculated from RGB and multispectral orthomosaics. The logistic model achieved a 75% classification accuracy, confirming the practical utility of simple vegetation indices. Together, these three cited publications confirm that a combination of orthomosaics (RGB/CIR) and NDVI indices provides an effective tool for monitoring tree health and stability—both along road sections and within natural woodlands—which has practical applications in urban green space management.
4.4. Limitations and Future Research
The final product of UAV work is an orthomosaic, which represents the result of processing aerial photographs and is characterized by depicting land cover in an orthogonal view at a uniform scale. In other words, an orthomosaic presents the land surface as “seen perpendicularly from above,” thereby reducing the three-dimensional crown structure to its planar projection. A key point is that the resulting two-dimensional crown image will only be a narrow slice of the inherently three-dimensional space occupied by the crown (and everything beneath it). UAV sensors register only this uppermost canopy layer as essentially the surface of the crown and only if the registered space exceeds the ground sampling distance (GSD). Zięba-Kulawik & Wężyk et al. [
42] applied CIR orthomosaic data and NDVI in the analysis of canopy cover changes in urban forests over decades (2005–2017). The authors estimated the urban forest volume of Kraków (Poland) and the distribution of vegetation (low, medium, high) using a voxel-based GEOBIA approach. This method combined ALS LiDAR point clouds, satellite imagery, and aerial orthophotos collected at specific timestamps. Selected landscape metrics (e.g., NP, AREA_MN, CONTIG_MN, LPI, PARA_MN, SPLIT, MESH, PD, DIVISION, LSI) were applied to quantify differences between 2D- and 3D-derived vegetation structures and to detect changes in the urban landscape, arguing that such metrics can support tree health and stability assessments within GIS packages.
Despite the acknowledged limitations of the applied method, the potential error in tree-lined avenues is negligible or minimal, as avenues are typically less structurally complex than standard forest stands (i.e., they lack biosocial stratification of trees, lower vegetation layers, etc.). Therefore, higher accuracy can be expected when assessing tree health in avenues. In contrast, typical forest stands produce much less reliable results. It should be emphasized that the main limitation during the research was not the difficulty in recognizing the health status of dominant trees (i.e., those visible to the UAV), but rather the inability to register (and thus assess the health status of) trees forming the subcanopy or lower layers. A properly operated UAV, within the working conditions specified by the manufacturer, enables the acquisition of accurate, reliable, and repeatable results for those fragments of urban forests that the UAV can capture freely and without obstruction.
The UAV used in this study is primarily designed for users in agriculture, horticulture, and orchard management. Its main uses include assessing crops for nutrient deficiencies, detecting the effects of fertilizers, monitoring drought and localized irrigation shortages, identifying crop damage caused by pests or weather events, and many others. However, this does not disqualify the use of UAVs in forestry or urban forest risk management. For example, in forestry, UAVs equipped with multispectral cameras have been used to identify weakened stands as potential sites for sampling invasive nematodes. Nothing prevents the use of drones to assess how trees respond to nearby construction or infrastructure projects. The possibilities and concepts for drone use are therefore extensive.
Future research should address several aspects that may further improve the reliability of UAV-based vitality assessments. First, multi-season acquisitions (leaf-on and leaf-off) are recommended to stabilize NDVI thresholds and minimize the influence of seasonal variability. Second, oblique imagery could reduce crown occlusion, which was one of the limiting factors in our study. Third, the integration of UAV multispectral data with LiDAR would allow more accurate detection of crown structure and mechanical defects such as breakage or loss of stability. Finally, the use of advanced classification algorithms (e.g., Random Forest, U-Net) and texture-based features may increase the robustness of classifications under different stand conditions.
A limitation of this study is the lack of temporal NDVI monitoring. Since our analysis was based on a single UAV campaign conducted in mid-summer, seasonal dynamics and longer-term changes in NDVI could not be assessed. As the stand was >90% Scots pine, the leaf-off timing of minor broadleaved admixtures had a negligible effect on NDVI; however, the temporal mismatch (November ground survey vs. December UAV flight) remains a potential limitation.
It should be emphasized that the NDVI thresholds and overall accuracy reported here are specific to the Scots pine stand under investigation. These values cannot be directly transferred to broadleaf or mixed stands without local recalibration against field reference data.
The results should be discussed, including how they can be interpreted from the perspective of previous studies and of the working hypotheses. The findings and their implications should be considered in the broadest context possible. Future research directions may also be highlighted.
5. Conclusions
The study demonstrated that unmanned aerial vehicles (UAVs) along with the remote sensing data they collect, combined with GIS-based analyses, can be useful for assessing risk around trees, particularly when conducting area-wide inspections. Observations can be performed—subject to the technical capabilities of the equipment and regulatory constraints—at virtually any interval and over any area of any size, regardless of accessibility.
Images captured with commercially available drones (such as the DJI Mavic 3 Multispectral used in this study) and processed into orthomosaics can be effectively used to assess the degree of damage to individual trees and stands. The photographic material collected provides essential and easily obtainable information about the health condition of pines in the studied forest and offers a general overview of the analyzed area.
Data for analysis obtained via drones can be collected in a fully automated manner and require minimal preparation time. Furthermore, acquisition costs are relatively low (primarily related to purchasing or renting the UAV). However, it is crucial to use drones capable of capturing high-resolution images in selected spectral bands (especially near-infrared, NIR). For further processing, it is possible to use free and open-source GIS software (although many commercial programs exist), which should enable the creation of automated segmentation and classification workflows as well as the export of results.
Orthomosaics generated from UAV flights can aid in locating hazardous trees, as they can achieve high precision in determining the actual positions of dead or dying trees. Remote sensing methods have the potential to accelerate large-scale inspections; the achieved detection accuracy level of 78% for dead or dying trees appears suitable for interior park or forest areas. We note that a full confusion matrix was not reported due to the limited sample size (n = 51), which would make derived metrics statistically unstable; instead, we provide overall agreement and describe false negatives in detail. However, for avenues and high-traffic locations, ground inspections remain necessary.
Flights conducted with UAVs cannot replace ground-based inspections (especially in dense stands), but they can effectively complement them. This is particularly relevant given that drones can provide information about crown sections invisible from the ground and well as non-obvious indicators (e.g., data from spectral ranges beyond human perception).
The nature of UAV use and their technical capabilities require that assessments made with their use be supplemented by other risk identification methods (e.g., biomechanical evaluations). Nonetheless, the aforementioned high speed and low cost of acquiring data for analyzing extensive areas suggest that this method should be considered for adoption by entities managing large areas of tree-covered land (forests, parks, roadside tree lines).
Using UAVs to assess risk around trees results in the collection of large amounts of source material (photographs), which can serve both as documentation of inspection activities and as input for various analyses.
Visual assessment of RGB aerial photographs obtained via UAVs is a time-consuming process that requires expertise. Much better results are achieved by evaluating multispectral images (particularly CIR composites). The acceleration (or automation) of health assessments on collected imagery can be achieved by applying selected image classification methods. The resulting classified images can then be further analyzed in GIS tools for risk management (spatial analyses, prioritizing hazard removal).
For operational applications, UAV surveys should follow minimum standards: flights at ~100 m AGL with ≥70% frontlap and sidelap, ground sampling distance (GSD) below 5 cm, the use of multispectral sensors including NIR, and the generation of CIR composites and NDVI indices. To be operationally useful, surveys should reach at least 75% agreement with field inspections. NDVI thresholds must be calibrated locally against a field reference set (ca. 50 trees). Ground verification should be prioritized in high-use microsites (e.g., playgrounds, pedestrian routes, parking areas) within ≥1.5 × tree height hazard buffers. It should be emphasized that the NDVI thresholds and detection accuracy reported in this study are stand- and species-specific, primarily applicable to Scots pine. Application to mixed or broadleaf stands would require recalibration against local field data. It should also be noted that remote sensing methods for tree health assessment are not limited to passive techniques (such as those used in this study, which focused on capturing and processing digital photographs). There is growing potential to enhance these methods by incorporating active techniques, such as data acquisition with laser systems (e.g., LiDAR). Laser scanning can provide three-dimensional information on crown extent, canopy area, and tree heights. Future deployments should also consider multisession acquisitions (leaf-on/leaf-off) and the use of oblique imagery to reduce canopy occlusion, thereby improving detection robustness. Collecting such data, combined with health information for individual trees derived from multispectral imagery, aligns perfectly with the concept of precision forestry.
It should also be noted that remote sensing methods for tree health assessment are not limited to passive techniques (such as those used in this study, which focused on capturing and processing digital photographs). There is growing potential to enhance these methods by incorporating active techniques, such as data acquisition with laser systems (e.g., LiDAR). Laser scanning can provide three-dimensional information on crown extent, canopy area, and tree heights. Collecting such data—combined with health information for individual trees derived from multispectral imagery—aligns perfectly with the concept of “precision forestry”.
