Article

Research on Multi-Timescale Optimization Scheduling of Integrated Energy Systems Considering Sustainability and Low-Carbon Characteristics

1
School of Renewable Energy, Shenyang Institute of Engineering, Shenyang 110136, China
2
Key Laboratory of Regional Multi-Energy System Integration and Control, Shenyang 110136, China
*
Author to whom correspondence should be addressed.
Sustainability 2025, 17(19), 8899; https://doi.org/10.3390/su17198899
Submission received: 31 August 2025 / Revised: 26 September 2025 / Accepted: 30 September 2025 / Published: 7 October 2025

Abstract

The multi-timescale optimization dispatch method for integrated energy systems proposed in this paper balances sustainability and low-carbon characteristics. It first incorporates shared energy storage resources such as electric vehicles into system dispatch, fully leveraging their spatiotemporal properties to enhance dispatch flexibility and rapid response capabilities for integrating renewable energy and enabling clean power generation. Second, an incentive-penalty mechanism enables effective interaction between the system and the green certificate–carbon joint trading market. Penalties are imposed for failing to meet renewable energy consumption targets or exceeding carbon quotas, while rewards are granted for meeting or exceeding targets. This regulates the system’s renewable energy consumption level and carbon emissions, ensuring robust low-carbon performance. Third, this strategy considers the close coordination between heating, cooling, and electricity demand response measures with the integrated energy system, smoothing load fluctuations to achieve peak shaving and valley filling. Finally, through case study simulations and analysis, the advantages of the multi-timescale dispatch strategy proposed in this paper, in terms of economic feasibility, low-carbon characteristics, and sustainability, are verified.

1. Introduction

Global environmental degradation and climate warming pose severe challenges to human sustainable development. Reducing greenhouse gas emissions and promoting the low-carbon transformation of energy systems have become a widespread consensus. Integrated energy systems (IES) achieve energy complementarity, coordination, and cascaded utilization by coupling electricity and other heterogeneous energy sources, significantly improving energy efficiency and facilitating the consumption of clean energy, thereby becoming the core vehicle for implementing the ‘dual carbon’ goals [1]. As electric vehicle fleets, distributed renewable energy sources, and energy storage devices are increasingly integrated into the grid, the energy flow characteristics of IES become increasingly complex. Achieving coordinated interaction among ‘generation-grid-load-storage’ through multi-timescale optimized scheduling has become a key research focus.
As mobile energy storage units, the large-scale integration of electric vehicles (EVs) brings flexible control potential to IES, but their random charging behavior and vehicle-to-grid (V2G) bidirectional characteristics pose challenges to system stability. Paper [2] constructs a multi-objective optimization model for microgrids incorporating EVs, coordinating distributed power generation and charging/discharging scheduling. Reference [3] proposes an EV group scheduling strategy to guide the behavior of different user groups through dynamic pricing. Paper [4] compares centralized and distributed pricing strategies to analyze their impact on scheduling efficiency and fairness. Reference [5] uses a multi-objective hybrid algorithm to optimize charging costs, battery degradation, and load fluctuations. Paper [6] integrates EVs as mobile energy storage to minimize microgrid costs. Paper [7] uses the NSGAII-NDAX algorithm to optimize active distribution grids with large-scale EVs. Reference [8] establishes a three-stage model to balance electricity prices and user choices. Paper [9] optimizes the operation of electricity–hydrogen integrated charging stations to serve new energy vehicles. References [10,11,12,13] focuses on shared energy storage, proposing demand response alliances, microgrid cluster coordination, and dynamic leasing mechanisms to promote efficient cross-regional energy storage utilization.
Under the ‘dual carbon’ policy, the synergy between tradable green certificates (TGCs) and carbon emission trading schemes (ETS) is crucial for IES low-carbon optimization. Paper [14] establishes a bidirectional interaction mechanism between energy, carbon, and green certificates to drive system-wide low-carbon transformation. Reference [15] designs a carbon and green certificate trading strategy for multi-regional IES to balance cross-regional carbon footprints. Reference [16] integrates hydrogen utilization with carbon–green certificate mechanisms to enhance emission reduction benefits. A two-layer optimization technique is used in [17] to synchronize carbon–green certificate trade with incentive-based demand response. Reference [18] uses system dynamics modeling to simulate the linkage of the power, carbon, and green certificate markets at multiple scales. Reference [19] optimizes multi-energy systems incorporating liquid CO2 storage, integrated with carbon–green certificate mechanisms. Reference [20] designs an integrated market led by Independent System Operators (ISOs) to analyze multi-agent equilibrium. Reference [21] quantifies the impact of TGCs and ETS policy coordination on the electricity market. Reference [22] constructs a ‘green–carbon’ offset game model to guide users’ green electricity consumption. Reference [23] studies virtual power plant strategic bidding in multi-market scenarios. A planning framework for retrofitting coal-fired power plants in conjunction with carbon–green certificate markets is suggested in Reference [24] to support the shift away from coal-fired power.
Demand response is the key link in IES multi-energy coordination. Paper [25] integrates energy trading with comprehensive demand response to optimize IES operations. Paper [26] proposes a demand response aggregation scheduling method for multi-interconnected IES. Paper [27] combines price-based response with V2G to achieve robust scheduling for industrial park IES. Paper [28] integrates carbon trading with demand response to balance supply, demand, and consumption. Paper [29] optimizes low-carbon scheduling of hydrogen-containing IES through tiered response. Reference [30] constructs a multi-timescale integrated demand response framework. Paper [31] integrates carbon trading with demand response to optimize IES incorporating power-to-gas (P2G). Paper [32] employs a three-stage strategy to achieve multi-timescale supply–demand coordination. Paper [33] proposes multi-objective optimization of tiered carbon trading and refined load response. Reference [34] quantifies the adjustable capacity of IES, considering demand response and economic constraints. Paper [35] designs strategies for diversified hydrogen utilization and flexible supply–demand response to enhance the system’s low-carbon benefits. Existing research covers multiple dimensions, but heterogeneous load differentiation strategies and the spatial-temporal coordination of shared energy storage and carbon–green markets still require further exploration.
In summary, the existing literature has made progress in EVs scheduling, carbon–green coordination, and demand response, but has not yet formed a systematic solution for ‘shared energy storage control–carbon–green market transmission–multi-energy load coordination.’ Therefore, this paper addresses the IES multi-timescale optimization scheduling problem by proposing an innovative strategy that takes into account sustainability and low-carbon characteristics. Through case study simulations, the strategy’s comprehensive effectiveness in terms of economic efficiency, emission reduction effects, and system sustainability is verified.

2. Comprehensive Energy System Optimization Dispatch Model Incorporating Demand Response and Green Certificate–Carbon Joint Trading

2.1. Integrated Demand Response Model

IES are designed to supply and manage multiple forms of energy, such as power, heat, gas, and cooling. Price-based and incentive-based electricity demand response models, incentive-based heat demand response models, fuzzy comfort-based cooling demand response models, and incentive-based gas demand response models are all included in the integrated demand response (IDR) that is being examined in this study.

2.1.1. Price-Based Electricity Demand Response Model

In economics, the phrase “price elasticity of demand” is commonly used to characterize how sensitive demand is to changes in prices. Since residential customers are more vulnerable to changes in electricity prices, price-based electricity load demand response is taken into account here.
ε = Δ P P ρ t Δ ρ t
P D R L = P ( 1 + ε t t Δ ρ t ρ t + h = 1 h t 24 ε t h Δ ρ h ρ h ) t = 1 , 2 , , 24 ; h = 1 , 2 , , 24
P D R L = P 1 P 2 P t + P 1 P 2 P t ε 11 ε 12 ε 1 t ε 21 ε 22 ε 1 t ε t 1 ε t 2 ε t t Δ ρ 1 ρ 1 Δ ρ 2 ρ 2 Δ ρ 3 ρ 3
where in order to quantify the dependent relationship between user electricity consumption and the price increase at a particular period and the subsequent time, the letters ε , ε t t , and ε t h stand for the elasticity coefficient, self-elasticity coefficient, and cross-elasticity coefficient, respectively; the price of electricity is represented by ρ t ; the price change is represented by Δ ρ t ; the electricity load power at time t prior to and following the demand response is denoted by P t and P D R L , t , respectively. ( P = P 1 , P 2 , , P t T , P D R L = P D R L , 1 , P D R L , 2 , , P D R L , t T ).

2.1.2. Incentive-Based Electric Load Demand Response Model

Because industrial consumers are relatively sensitive to direct economic incentives, incentive-based power reaction to demand is considered here, wherein electricity loads are classified as reducible, transferable, and base loads, and users are paid according to the amount of load reduced and transferred.
P D R L , t = P B a s e t + P Z Y t P X J t
P Z Y s u m = t = 1 T P Z Y t
0 P Z Y t P Z Y max
0 P X J t P X J max
C D R p = t = 1 T ( P Z Y t c Z Y p , t + P X J t c X J p , t )
where at time t , the base load is denoted by P B a s e t , the reducible load by P X J t , and the transferable load by P Z Y t ; P Z Y s u m is a fixed value that denotes the total of all transferable loads for the entire dispatch time T ; the upper bounds of reducible and transferable loads are denoted by P Z Y max and P X J max , respectively; the unit power transfer and reduction compensation unit prices at time t are denoted by c Z Y p , t and c X J p , t , respectively; C D R p represents the incentive-based electricity demand response compensation revenue.

2.1.3. Incentive-Based Thermal Load Demand Response Model

Gas turbines, gas boilers, and electric boilers provide centralized heat generation for the thermal load in this study. Despite its inability to control temperature on its own, the load side can readily transfer thermal load over time and reduce it at the moment. The economic compensation that users receive is determined by the quantity of transfer and load reduction. There are three different kinds of thermal load: reducible, transferable, and basic. The model is:
H t 0 + Δ t = u H t 0 + Δ t H Z Y Δ t + 1 , Δ t [ 0 , t h o l d ]
t = 1 T u H t = t 0 t 1 u H t = t h o l d
u H t u H t 1 β H t
where the 0–1 variables u H t and β H t reflect the operational condition and start/stop situation of the load at time t , respectively; H Z Y t is the load volume of the transferable load at time t ; [ t 0 , t 1 ] is the transfer extent of the moveable load; t h o l d is the load duration.
H X J s u m = t = t s t = t e H X J t
H X J min H X J t H X J max
where t s and t e represent the start-up and shutdown times for reducing the heat load, respectively; at time point t , H X J t represents the actual reducible heat load; H X J s u m represents the total reducible heat load; H X J max and H X J min stand for the maximum and lower limit values for reducing the load at each time point, respectively.
H D R L , t = H B a s e t + H Z Y t H X J t
C D R h = t = 1 T ( H Z Y t c Z Y h , t + H X J t c X J h , t )
where at time t , the basic heat load power is denoted by H B a s e t and the response heat load power by H D R L , t ; c Z Y h , t and c X J h , t represent the heat load shift and reduction compensation unit price, respectively; C D R h represents the heat response compensation income.

2.1.4. Demand Response Concept for Cold Load Based on Ambiguous Feeling

In this paper, the cooling load primarily originates from absorption refrigeration units and electric refrigeration systems, where the load side is easily adjustable. As a result, the cooling load is seen as an adaptable, flexible load that takes part in fuzzy comfort-based cooling demand response. In order to describe users’ perceptions of environmental temperature, this study uses the predicted average vote (PWV) measure, which is expressed as follows:
f P M V = ( 0.3028 e 0.0359 M + 0.2746 ) [ M ( 1 η ) 3.0538 ( 5.758 0.00693 H P a ) 0.041896 ( H 58.1478 ) f c l h c l ( T c l T a ) 0.0173 ( 5.8667 P a ) M 0.00139 ( 34 T a ) M 3.9 × 10 8 f c l ( T c l 4 T m r t 4 ) ]
where H is the surface heat transfer coefficient; P a is the air pressure of water vapor in the vicinity of the human body; h c l is the surface heat transfer coefficient; M stands for metabolic rate; e for constant; η for heat dissipation rate; T c l for average body surface temperature; T a is the temperature of the air surrounding the human body; T m r t for average environmental radiation temperature; the optimal comfort temperature is 26 ° C , and f P M V is related to temperature F as follows:
f P W V = 0.3895 ( F 26 ) ,   F 26 0.4065 ( F + 26 ) ,   F < 26
C D R L , t = S C μ ( F o u t t F i n t ) + ( C C S C / Δ t ) ( F i n t F i n t 1 )
F min F i n t F max
where S C represents the space for cooling; the indoor and outside temperatures during time period t are denoted by F i n t and F o u t t , respectively; the highest interior temperature is F max , while the lowest is F min ; the cooling load power is represented by C D R L , t ; μ is the energy loss per unit cooling region with a unit temp differential (taken as 1.03683 × 10 4 J / ( m 2 ° C ) ); C C represents the heat capacity per unit cooling area (taken as 1.6277 × 10 5 J / ( m 2 ° C ) ).

2.1.5. Price-Based Load Demand Response Model

Gas generation through electricity-to-gas conversion and gas purchases from the gas network is the source of the gas load in this study. Although the load side is currently easy to move in terms of time and reduction, it is challenging to regulate independently. Gas load demand response based on incentives is thus implemented. The gas load is separated into basic, transferable, and reducible categories. The model of transferable gas load is:
G t s t a r t + n = U G t s t a r t + n G Z Y n + 1 ,   n [ 0 , t l a s t ]
t = 1 T U G t = t = t s t a r t t e n d U G t = t l a s t
U G t U G t 1 B G t
where U G t and B G t are the 0–1 variables that indicate the operational condition and start/stop situation of the load at moment t , respectively; G Z Y t is the load amount of the transferable load at moment t ; [ t s t a r t , t e n d ] is the transfer extent of the transferable burden; t l a s t is the burden duration.
G X J s u m = t = t f r o m t = t t o G X J t
G X J min G X J t G X J max
where t f r o m and t t o are the start and stop times for reducing the gas load, respectively; G X J max and G X J min are the upper and lower limit values for reducing the gas load at each time point, respectively; G X J t and G X J s u m are the actual gas load reduction and total load reduction at time point t , respectively.
G D R L , t = G B a s e t + G Z Y t G X J t
C D R g = t = 1 T ( c Z Y g , t G Z Y t + c X J g , t G X J t )
where c Z Y g , t and c X J g , t stand for the price of the gas load adjustment and reduction compensation unit, respectively; C D R h is the gas response compensation income; G B a s e t and G D R L , t stand for the basic gas load and the gas load power after answer at time t , respectively.

2.2. Green Certificate–Carbon Joint Trading Mechanism

The carbon reduction characteristics of new energy power generation have been fully reflected through the development of a green certificate–carbon joint trading mechanism that combines the carbon trading (CET) and green certificate trading (GCT) methods. Figure 1 displays an overview of this mechanism’s structure. In this mechanism, Chinese Certified Emission Reductions (CCER) significantly enhance market coherence and synergy. Specifically, CCER serves as a bridge, not only facilitating mutual recognition between green certificates and the electricity substitution mechanism but also enabling a proportional conversion with carbon allowances.
On the one hand, IES for new energy power generation (taking wind power and photovoltaic power generation as examples) must be reviewed and approved by the management department to obtain green certificates, which are then traded on the green certificate trading platform to complete the transfer of ownership. At the same time, the management department sets a requirement that IES must use a certain proportion of new energy power. To make up for the difference, those that do not fulfill the standard have to buy more quotas from the green certificate market. On the other hand, regulatory authorities allocate carbon emission quotas to IES. In the event that an IES’s carbon emissions fall short of the quota, it can sell the excess on the carbon trading market; else, it will have to buy more quotas. Furthermore, when IES have surplus green certificates after meeting their renewable energy quotas, they can convert these green certificates into carbon emission reductions equivalent to CCERs through the carbon–green certificate mutual recognition mechanism. Green certificates can participate in the carbon trading market in addition to being active in the green certificate trading market because carbon quotas, renewable energy quotas, and CCERs are interconnected. This makes it possible for the two marketplaces to integrate and communicate effectively.
The National Development and Reform Commission’s 2013 “Methodology for Integrating Renewable Energy Power Generation Grid Connection Projects” states that the “regional grid baseline emission factor” can be used to calculate the emission reduction contribution of each MWh of renewable energy power generation. Thus, once IES reaches the revised energy quota allocation targets, the amount of carbon emission reduction that corresponds to the excess green certificates can be computed:
E C C E R G C T = t = 1 T ( ϑ O M υ e 1 + ϑ B M υ e 2 ) P C C E R G C T , t
where after IES reaches the revised energy quota allocation targets, E C C E R G C T stands for the decrease in carbon emissions that corresponds to the excess green credits; υ e 1 and υ e 2 represent the marginal emission factor weights for electricity and capacity, respectively; ϑ B M and ϑ O M represent the marginal emission factors for capacity and electricity, respectively; IES must satisfy the new energy quota allocation objectives before the surplus green certificates may be converted into new energy power generation, denoted by P C C E R G C T , t .
The green certificate–carbon joint trading model is as follows:
D a b = t = 1 T [ P W i n d t + P P V t ] D s u m = t = 1 T [ P L t + P E C t + P E B t + P C C S t + P P 2 G t + P E i n , t η E i n P H t P C C H P t P E o u t , t η E o u t ]
α G C T = D G C T D s u m C G C T = δ G C T ( α G C T D s u m D a b ) γ
E C E T = E C E T f r e e + E C C E R G C T E = E C E T s j E C E T C C E T = f ( E )
C C E T G C T = C C E T + C G C T
where the entire power generation of new energy sources is represented by D a b ; the photovoltaic and wind power outputs at time t are denoted by P P V t and P W i n d t , respectively; D s u m denotes the new energy consumption of IES within cycle T ; P L t represents the demand power on the load side of IES; P E C t , P E B t , P C C S t , P P 2 G t , P H t , and P C C H P t represent the power of electric refrigeration units, electric boilers, electric-to-gas conversion equipment, coal-fired units, and combined heat, power, and cooling units, respectively; energy storage device charging and discharging power in the IES at time t is represented by P E i n , t and P E o u t , t , respectively, while charging and discharging efficiency is represented by η E i n and η E o u t , respectively; α G C T is the renewable energy quota allocation indicator; D G C T stands for the IES’s renewable energy quota; C G C T for the cost of a green certificate transaction; δ G C T for the cost of a green certificate unit; green certificate transaction volume and photovoltaic and wind power generation capacity are converted by a coefficient γ ; after taking into account green certificate–carbon joint trading, the IES’s free carbon quota amount is denoted by E C E T ; E C E T f r e e is the IES’s free carbon quota; E C C E R G C T is the carbon quota that was obtained by converting green certificates to CCER certification; E C E T s j is the actual carbon emissions of the IES; E is the carbon emissions trading volume after joint trading; C C E T G C T is the overall cost of green certificate–carbon joint trading; C C E T is the cost of carbon trading after accounting for green certificate–carbon joint trading.

2.3. Virtual Energy Storage Modeling Including Electric Vehicles

EV owners can flexibly adjust their charging and discharging times in response to price incentives. By implementing effective scheduling strategies to guide electric vehicles to charge during off-peak hours and discharge during peak hours, they function similarly to batteries, exhibiting virtual energy storage characteristics. Set the electric vehicle’s return period ( t f ) and distance ( L ), and set the charging cut-off time for electric vehicle owners to be before the end of off-peak electricity prices t a v and before the start of peak electricity prices t p e a k . The charging t s t a r t c h a and discharge start time t s t a r t d i s of electric vehicles must satisfy the following relationship:
t s t a r t c h a = t f , 0 t f t a v t s t a r t d i s = t p e a k , t a v t f t p e a k t f , t p e a k t f T
The charging and discharging duration of electric vehicles is:
t c x c h a = min ( S O C E V max S O C E V min ) Q E V , l E V c h a , max Q E V P E V e θ E V c h a t c x d i s = min ( S O C E V max S O C E V min ) Q E V L p E V , l E V d i s , max Q E V P E V e θ E V d i s
where the charging and discharging times of the electric car are denoted by t c x c h a and t c x d i s , respectively; S O C E V max and S O C E V min represent the maximum and minimum values of the electric vehicle’s state of charge, respectively; Q E V represents the capacity of the electric vehicle; p E V is the power consumption of electric vehicles; l E V c h a , max and l E V d i s , max represent the maximum charging and discharging depths of the electric vehicle, respectively; P E V e represents the rated power of the electric vehicle; θ E V c h a and θ E V d i s represent the charging and discharging efficiencies of the electric vehicle, respectively.
The charging and discharging completion times of the electric vehicle are as follows:
t e n d c h a = t s t a r t c h a + t c x c h a t e n d d i s = t s t a r t d i s + t c x d i s
where the electric vehicle’s charging and discharging finish periods are denoted by t e n d c h a and t e n d d i s , respectively.
Electric cars can be charged and discharged in the following ways:
P E V = t = t s t a r t t e n d P E V t
t s t a r t = t s t a r t c h a , t e n d = t e n d c h a , u E V = 1 t s t a r t = t s t a r t d i s , t e n d = t e n d d i s , u E V = 0
where the electric vehicle’s charge or discharge capacity at a given moment is denoted by P E V t , while its net charge/discharge capacity is denoted by P E V ; the charging or discharging start and end timings are denoted by t , t s t a r t , and t e n d , respectively; the charge/discharge state is shown by u E V , where 1 denotes charging and 0 denotes discharging.
Charge/discharge power relationship of electric vehicles:
P E V t = P E V i n , t P E V o u t , t 0 P E V o u t , t P E V o u t , max 0 P E V i n , t P E V i n , max
where P E V i n , t and P E V o u t , t represent the charging and discharging power at time t ; P E V i n , max and P E V o u t , max represent the electric vehicle’s maximum charging and releasing power at position t , respectively.

3. Modeling of Multi-Timescale Integrated Energy Systems

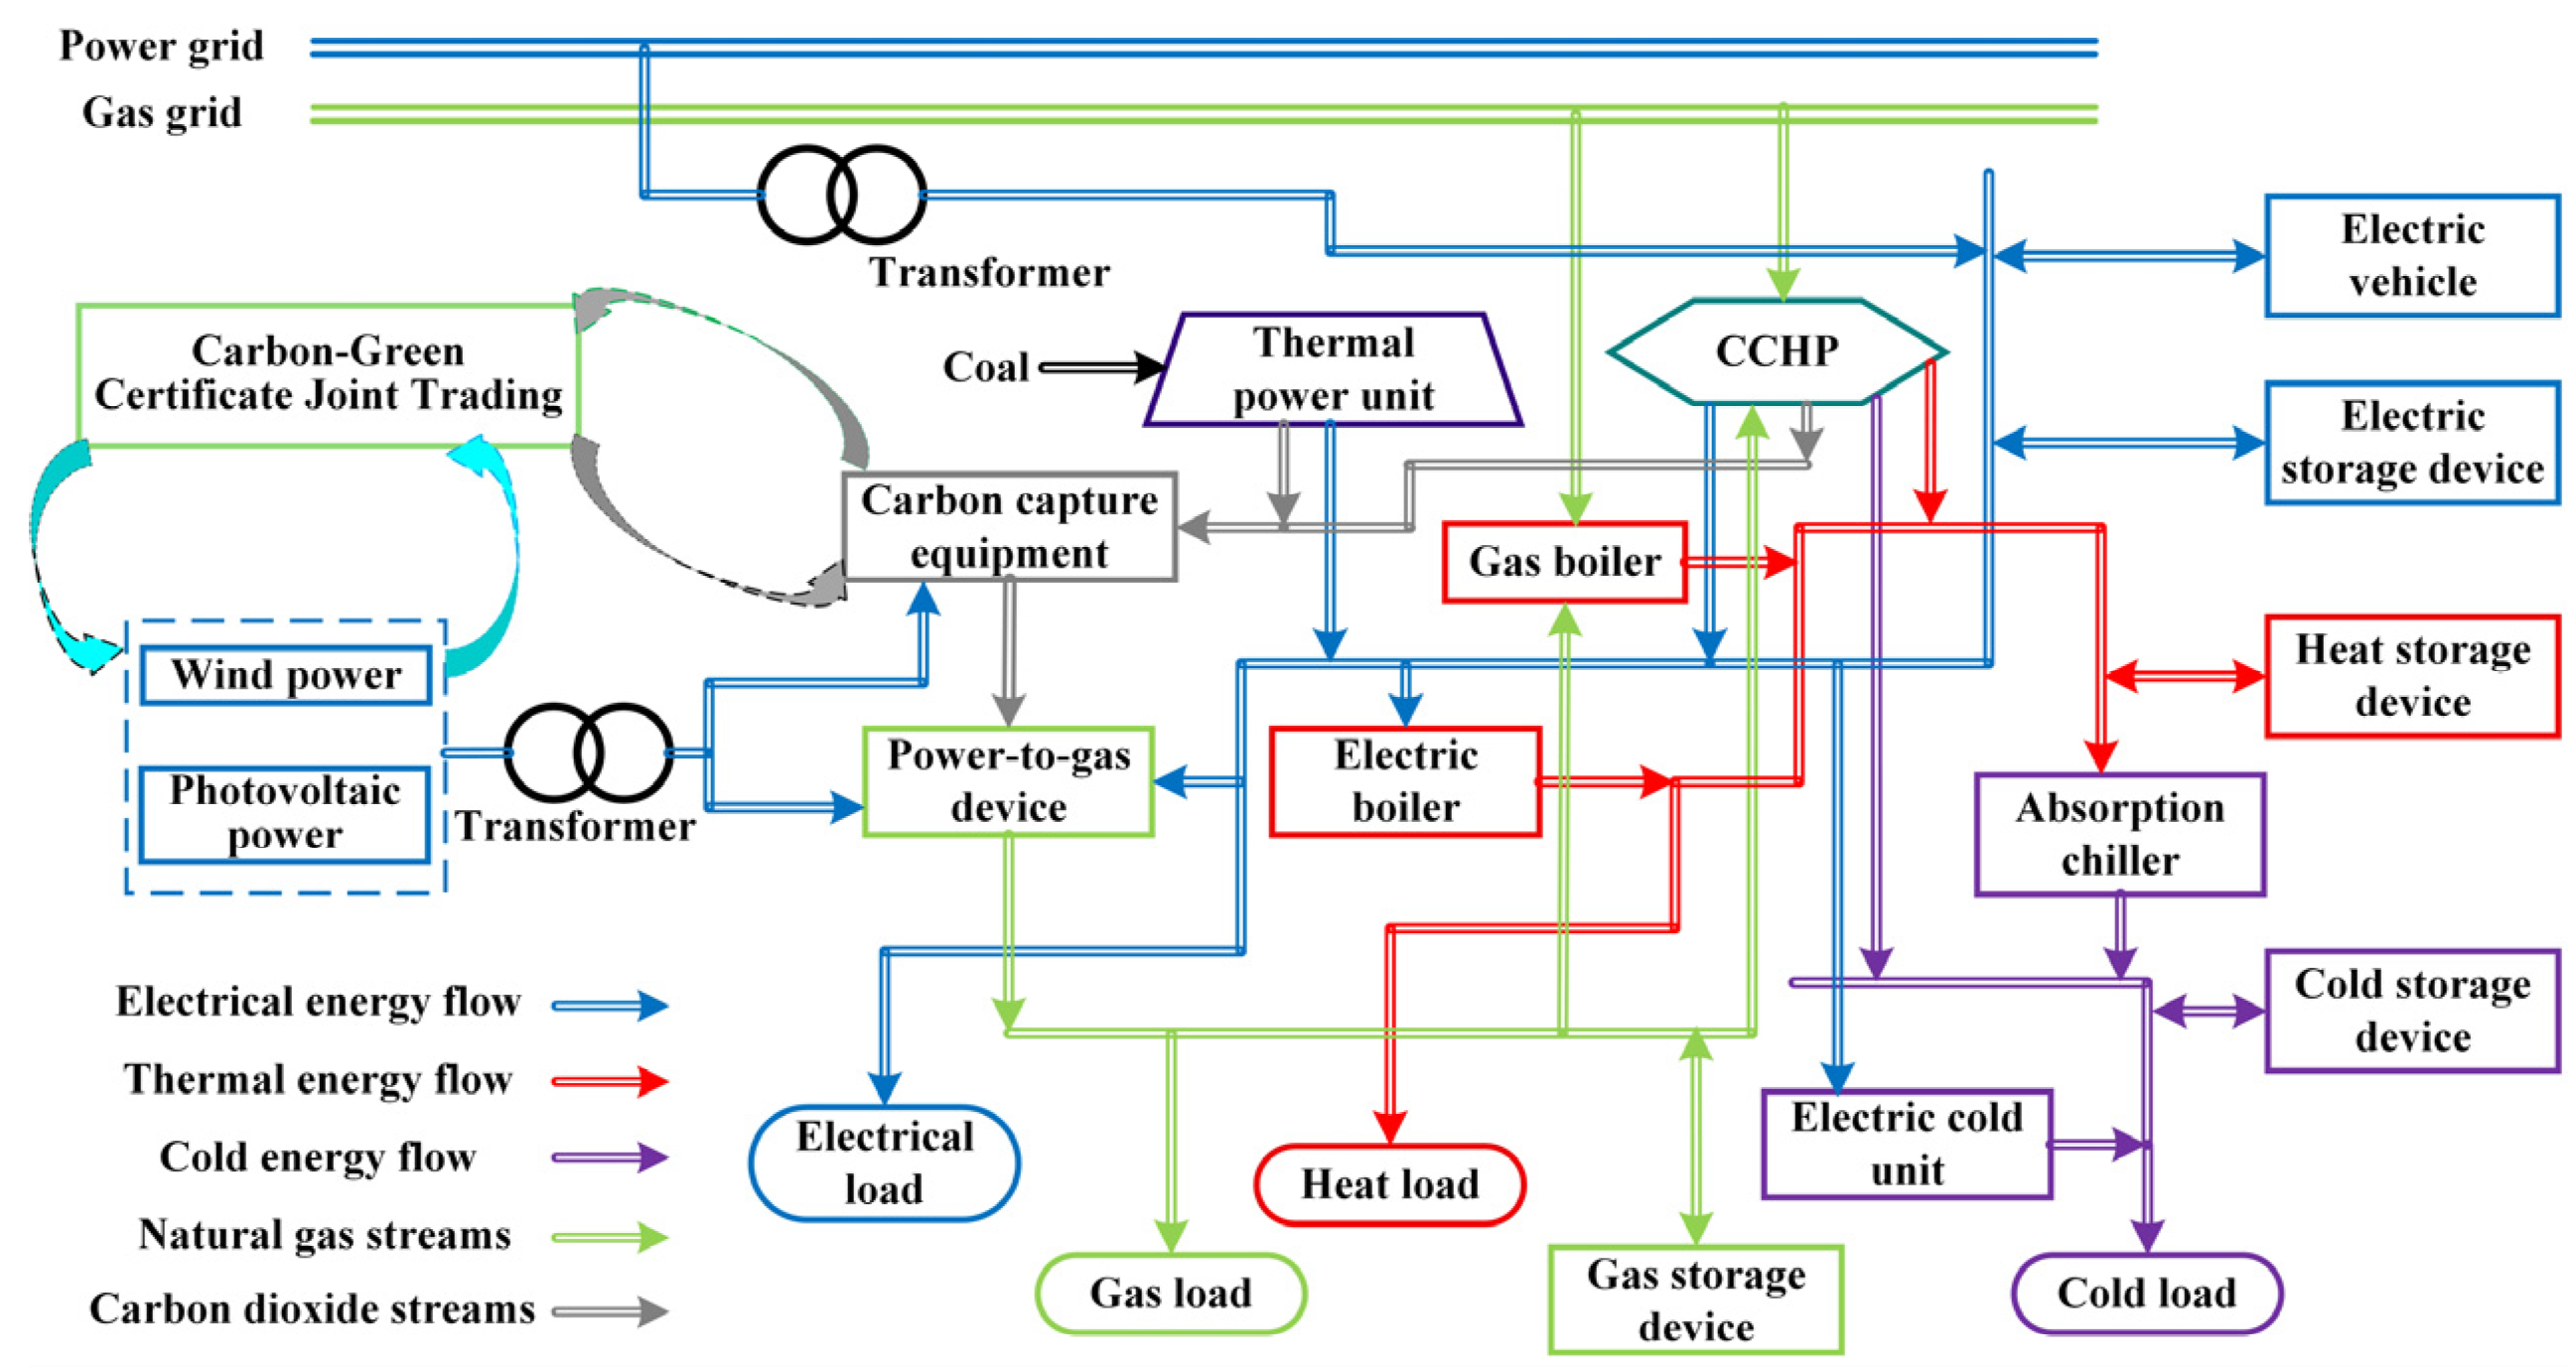
Based on the aforementioned heating, cooling, and electricity demand response, this study considers the participation of shared energy storage systems such as electric vehicles under the green certificate–carbon joint trading framework and establishes an energy flow framework for an integrated energy system. Figure 2 displays the models of the particular energy conversion and storage devices.

3.1. Combined Cooling, Heat, and Power (CCHP) Model

Natural gas is used by the combined heat, power, and cooling (CCHP) unit to supply the system with heat, cooling, and electricity. The following is the CCHP model:
P C C H P t = η C C H P e G C C H P t α = H C C H P t / P C C H P t β = C C C H P t / H C C H P t
P C C H P min P C C H P t P C C H P max Δ P C C H P min P C C H P t ( t + Δ t ) P C C H P t ( t ) Δ P C C H P max
α min α α max β min β β max
where for CCHP, H C C H P t , C C C H P t , and G C C H P t stand for the thermal power output, cooling power output, and gas power output, respectively; the gas-to-electricity conversion rate of the CCHP is denoted by η C C H P e ; α represents the thermal-to-electricity ratio of the CCHP; β represents the cooling-to-heating ratio of the CCHP; P C C H P min and P C C H P max represent the minimum and maximum electrical power outputs of the CCHP, respectively; Δ P C C H P max and Δ P C C H P min stand for the CCHP’s electrical power output ramp’s top and lower bounds, respectively; α min and α max represent the minimum and maximum thermal-to-electricity ratios, respectively; β min and β max represent the minimum and maximum cooling-to-heating ratios, respectively.

3.2. Gas Boiler (GB) Model

The GB thermal energy output model is:
H G B t = η G B h G G B t H G B min H G B t H G B max Δ H G B min H G B t + Δ t H G B t Δ H G B max
where H G B max and H G B min stand for GB’s maximum and minimum thermal output powers, respectively; Δ H G B max and Δ H G B min represent the upper and lower bounds of the thermal power ramp of GB, respectively; the gas-to-heat exchange coefficient by η G B h ; the thermal power produced by H G B t ; the gas power consumed by GB and G G B t , respectively.

3.3. Absorption Chiller (AC) Model

The AC heat output model is:
C A C t = η A C c H A C t C A C min C A C t C A C max Δ C A C min C A C t + Δ t C A C t Δ C A C max
where the AC unit’s cooling power output is denoted by C A C t , its heat-to-cool conversion coefficient by η A C c , and its heat power consumption by H A C t ; C A C max and C A C min are the maximum and minimum cooling power outputs of the AC unit, respectively; Δ C A C max and Δ C A C min stand for the upper and lower bounds of the cooling power ramp-up of the AC unit, respectively.

3.4. Electrical Energy Conversion Model

The output model for converting electricity into energy (heat, cold, gas) is as follows:
H E B t = η E B P E B t C E C t = η E C P E C t G P 2 G t = η P 2 G P P 2 G t E C O 2 t = η C O 2 P C C S t
P E B min P E B t P E B max P E C min P E C t P E C max P P 2 G min P P 2 G t P P 2 G max P C C S min P C C S t P C C S max
Δ P E B min P E B t + Δ t P E B t Δ P E B max Δ P E C min P E C t + Δ t P E C t Δ P E C max Δ P P 2 G min P P 2 G t + Δ t P P 2 G t Δ P P 2 G max Δ P C C S min P C C S t + Δ t P C C S t Δ P C C S max
where η E B , η E C , η P 2 G , and η C O 2 represent the conversion efficiencies of the electric boiler, electric refrigeration, P2G, and carbon capture and storage (CCS), respectively; P E B t , P E C t , P P 2 G t , and P C C S t denote the electrical power consumed by electric boiler (EB), electric chiller (EC), P2G, and CCS, respectively; H E B t , C E C t , and G P 2 G t represent the thermal, cold, and gas power outputs of EB, EC, and P2G, respectively; E C O 2 t is the amount of CO2 captured by the CCS device; P E B max , P E B min , P E C max , P E C min , P P 2 G max , P P 2 G min , P C C S max , and P C C S min are the maximum and minimum electrical power consumed by EB, EC, P2G, and CCS, respectively; Δ P E B max , Δ P E B min , Δ P E C max , Δ P E C min , Δ P P 2 G max , Δ P P 2 G min , Δ P C C S max , and Δ P C C S min are the upper and lower limits of the electrical power ramp-up for EB, EC, P2G, and CCS, respectively.

3.5. Energy Storage Device Model

The following is the model of energy storage equipment for gas, heat, cold, and electricity:
E x t + Δ t = E x t + P x i n . t η x i n P x o u t , t η x o u t E x min E x t E x max 0 P x i n , t μ x P x i n , max 0 P x o u t , t μ x P x o u t , max
where x ( x = e , h , c , g ) represents the type of energy storage equipment, including electrical, thermal, cooling, and gas energy; E x t represents the energy stored in the system at time t ; P x i n , t and P x o u t , t represent the charging and discharging capabilities of the energy storage system, respectively; the energy storage system’s charging and discharging efficiency are indicated by η x i n and η x o u t , respectively; the maximum input and output power limits of the energy storage system are shown by P x i n , max and P x o u t , max , respectively; the top and lower bounds of the energy that the system can store are represented by E x max and E x min , respectively; at time t the energy storage device can only maintain one of the charging or discharging states because μ x is a variable that ranges from 0 to 1, when μ x is 1, it indicates charging, and when μ x is 0, it indicates discharging.

3.6. Multi-Timescale Scheduling Strategy

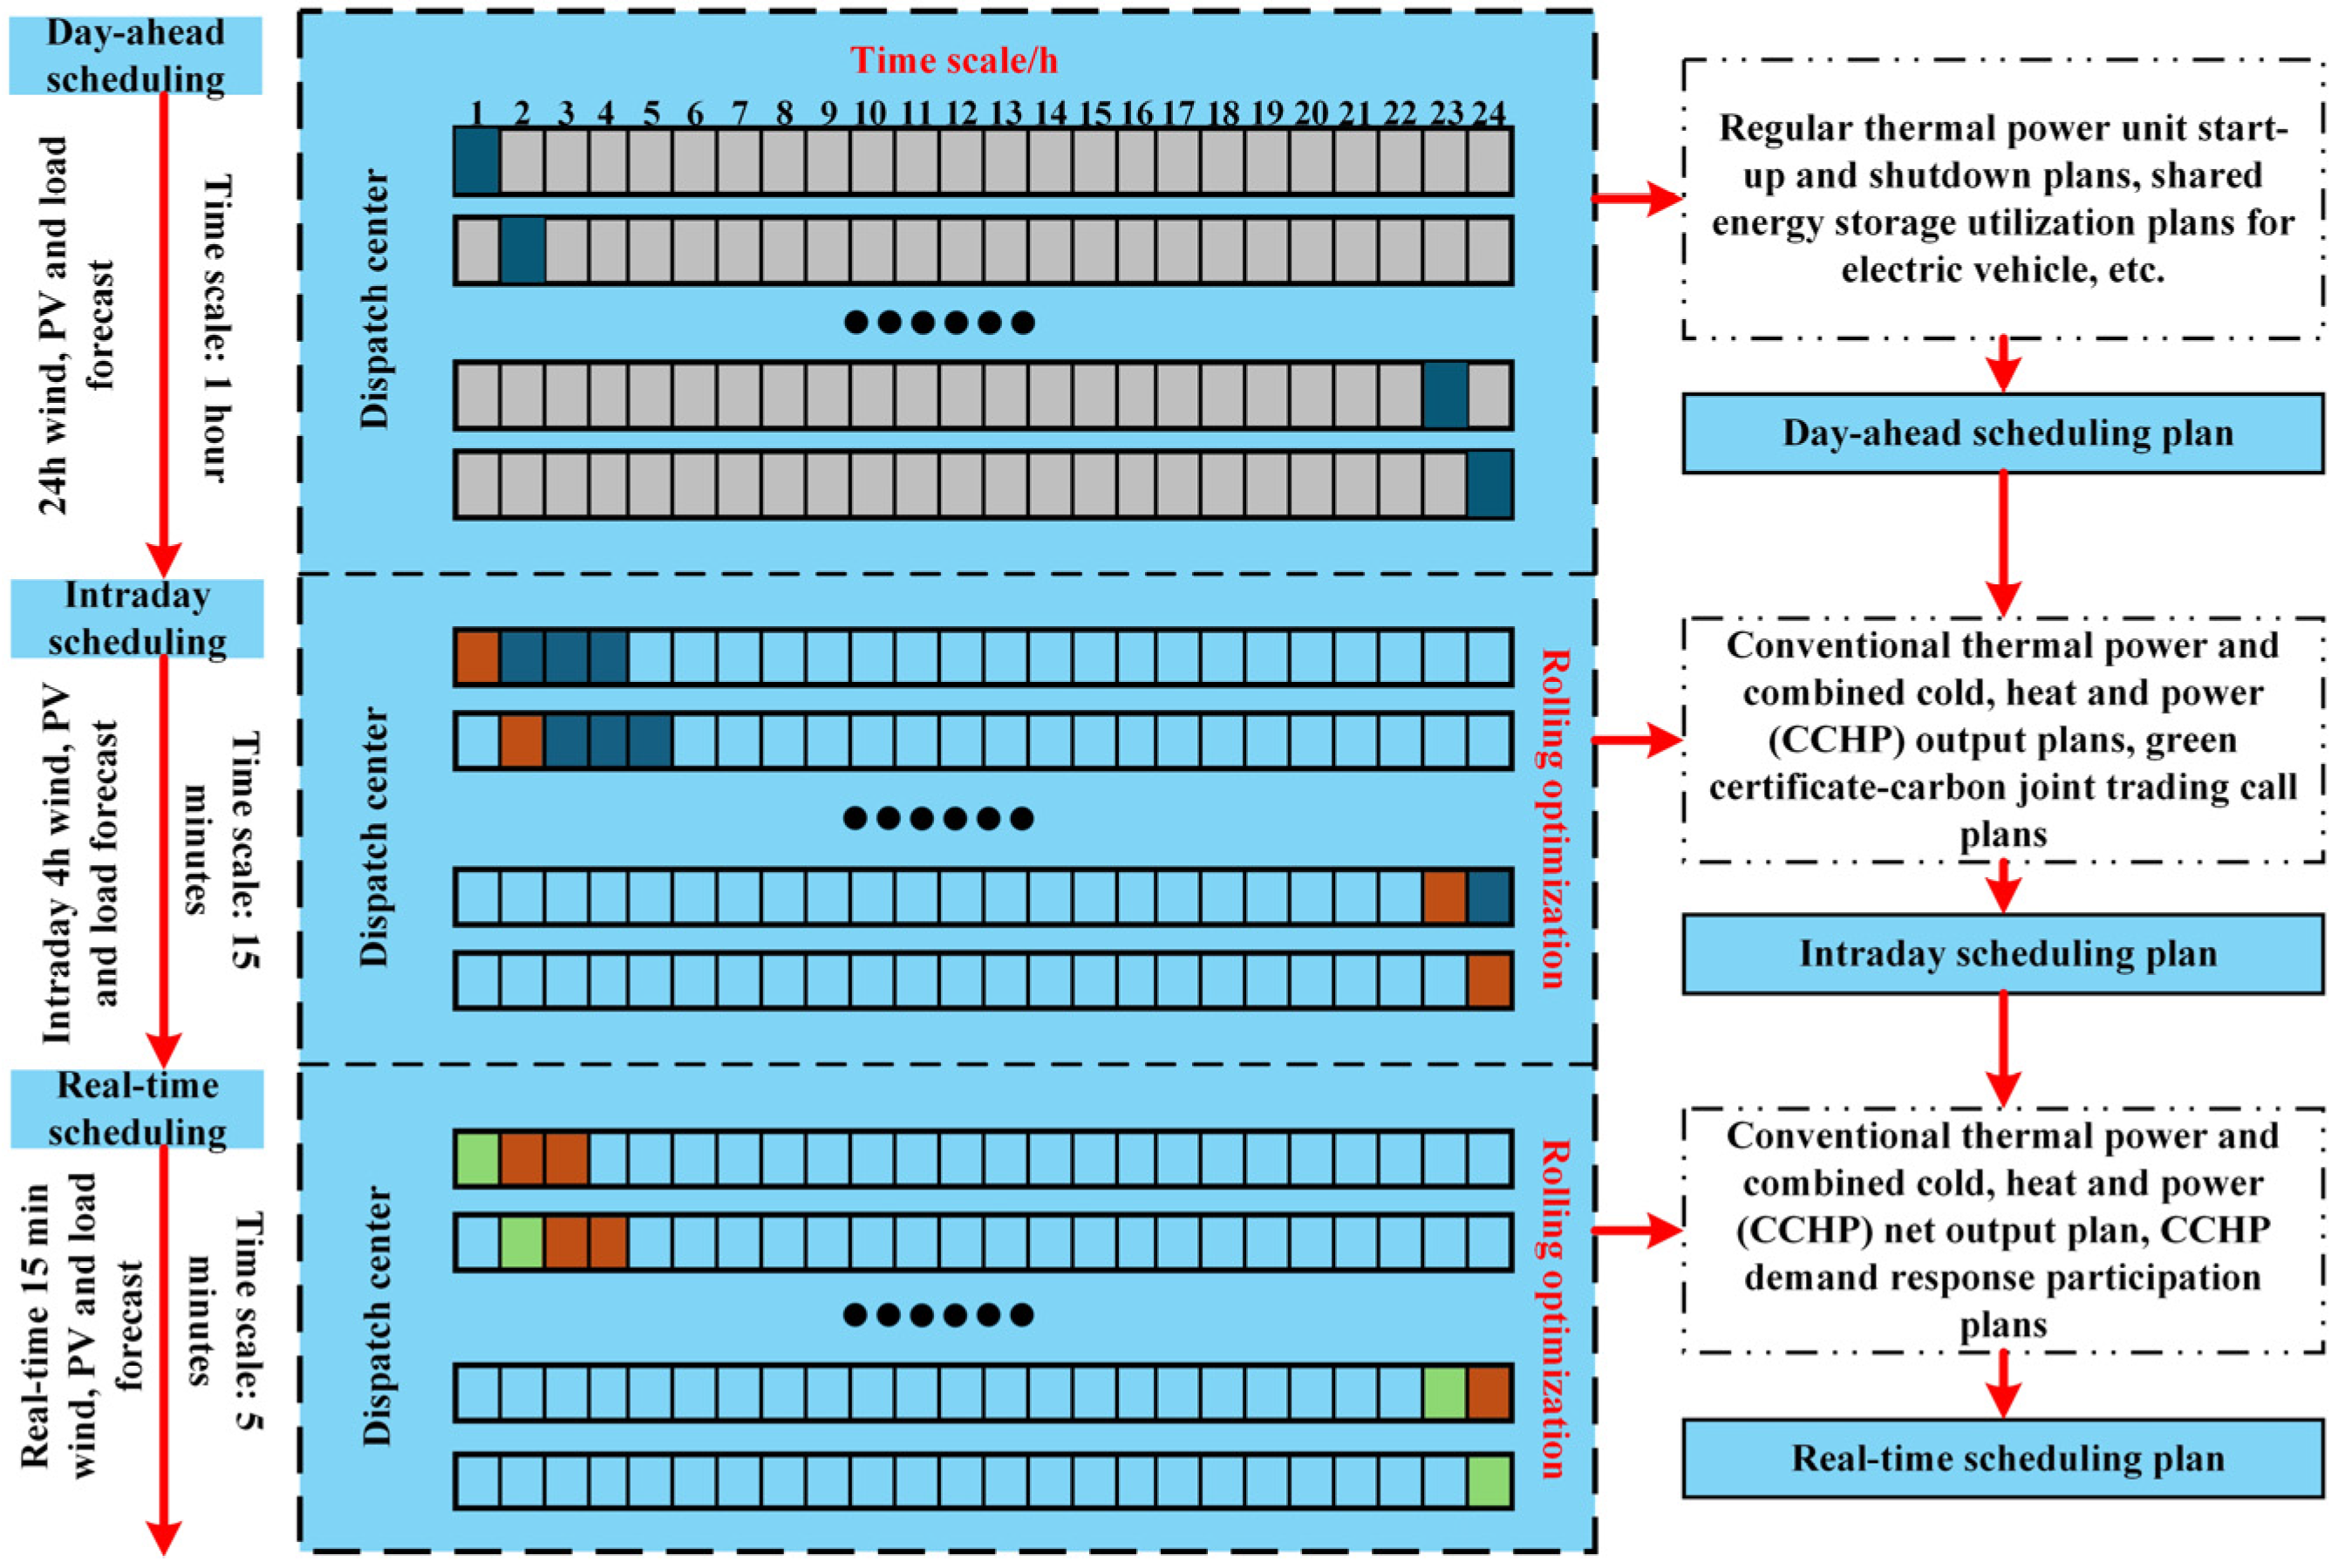
This paper focuses on multi-time-scale optimization scheduling for integrated energy systems, with a three-tier framework. Day-ahead (24 h cycle, 1 h resolution) analyses how shared energy storage like electric vehicles impacts economy and reliability. Intraday (4 h rolling cycle, 15 min resolution) explores green certificate–carbon quota joint trading’s synergies in renewable energy absorption and carbon emission costs. Real-time (15 min adjustment cycle, 5 min resolution) quantifies dispatch value with multiple demand response resources (e.g., interruptible, temperature-controlled loads). Stages form a “strategic planning-tactical adjustment-real-time control” closed-loop system, with strategies in Figure 3.

4. Multi-Timescale Optimization Scheduling of Integrated Energy Systems

4.1. Day-Ahead Scheduling Phase

4.1.1. Objective Function

min F r q = F C o a l + F Q t + F O P + F W i n d q + F P V q + F D R + F B u y + F C E T G C T + F B c
where coal costs are represented by F C o a l ; coal-fired power plant startup and shutdown costs by F Q t ; P2G and CCS equipment operation and maintenance costs by F O P ; curtailed wind power costs by F W i n d q ; curtailed PV power costs by F P V q ; demand response costs by F D R ; energy purchase costs by F B u y ; green certificate–carbon joint trading costs by F C E T G C T ; and compensation costs for charging and discharging electric vehicles by F B c .
Coal cost
F C o a l = t = 1 T a ( P H t ) 2 + b P H t + c
where the coal cost coefficients are denoted by a , b , and c ; the production of the coal-fired unit at time t is represented by P H t .
Start–stop cost
F Q t = t = 1 T ( μ t + η t ) c Q t
where μ t and η t represent the transition states from shutdown to startup and from startup to shutdown, respectively; c Q t is the unit startup/shutdown cost coefficient.
Operational cost
F O P = t = 1 T c C C S P C C S t + c P 2 G P P 2 G t
where the carbon capture device’s unit operating and maintenance costs are denoted by c C C S , its output by P C C S t ; the electricity-to-gas conversion equipment’s unit operating and maintenance costs by c P 2 G ; and P P 2 G t is the output of the P2G conversion equipment.
Cost of wind energy curtailment
F W i n d q = t = 1 T c W i n d [ P W i n d max P W i n d r q , t ]
where c W i n d is the cost per unit of lowering wind power; P W i n d r q , t represents the actual consumption output of wind power generation the day before; and P W i n d max represents the maximum wind power generating output.
Abandoning photovoltaic power generation cost
F P V q = t = 1 T c P V [ P P V max P P V r q , t ]
Demand response cost
F D R = t = 1 T c X J i E X J i , t + c Z Y i E Z Y i , t
where an energy source’s unit load reduction price is denoted by c X J i ; the load elimination amount of multiple sources of energy for heating, cooling, and electricity is shown by E X J i , t ; c Z Y i represents the unit transfer expense for different energy sources for electricity, heating, and cooling; and E Z Y i , t stands for the movement of load amount of numerous forms of energy for electricity, heating, and cooling.
Energy procurement cost, considering the interaction of electrical energy between the system and the power grid, as well as the cost of natural gas purchased from external sources.
F B u y = t = 1 T c G r i d P G r i d t + c G a s G G a s t
where c G r i d is the unit cost of electricity, the entire quantity of electricity traded within the same power grid is denoted by P G r i d t ; G G a s t is the quantity of natural gas acquired from outside sources; and c G a s is the cost of natural gas per unit.
Green certificate–carbon joint trading cost
F C E T G E T = C C E T G E T
Electric vehicle charging and discharging compensation cost
F B c = t = 1 T c i n P E V i n , t + c o u t P E V o u t , t
where c i n and c o u t are the unit compensation costs for charging and discharging electric vehicles, respectively.

4.1.2. Constraints

Wind power output constraint
0 P W i n d r q , t P W i n d max
Photovoltaic output constraint
0 P P V r q , t P P V max
Power balance constraints for electricity, heat, cooling, and gas
P B u y t + P W i n d r q , t + P P V r q , t + P C C H P t + P o u t t = P i n t + P E B t + P E C t + P P 2 G t + P L t H C C H P t + H G B t + H E B t + H o u t t = H i n t + H L t C C C H P t + C E C t + C A C t + C o u t t = C i n t + C L t G B u y t + G P 2 G t + G o u t t = G C C H P t + G G B t + G i n t + G L t
P o u t t = P E S o u t , t + P E V o u t , t P i n t = P E S i n , t + P E V i n , t
where P C C H P t represents the electrical power output of the CCHP system at time t ; P B u y t purchased by the power grid; P i n t and P o u t t represent, respectively, the charging and discharging power of the energy storage device at time t ; P L t represents the electrical load demand power; H i n t and H o u t t for the thermal storage device’s heating and cooling power at time t , respectively; H L t for the thermal load demand power; at time t , C i n t and C o u t t represent the charging and releasing powers of the cold storage device, respectively; C L t represents the cold load demand power; G B u y t purchased by the power grid; G i n t and G o u t t for the powering up and powering down capabilities of the gas storage tank at moment t , respectively; and G L t for the gas load demand power.
External interaction constraints
P B u y min P B u y t P B u y max G B u y min G B u y t G B u y max
where the highest and lowest values of the gas that the system purchased from the external gas grid are denoted by the letters G B u y max and G B u y min , respectively; the letters P B u y max and P B u y min signify the most and least levels of electricity that the system obtained from the external power grid, respectively.

4.2. Intraday Dispatch Phase

4.2.1. Objective Function

min F r n = F C o a l + F W i n d q + F P V q + F D R + F B u y + F C E T G C T + F S + F B c
where the cost of curtailing wind power is denoted by F W i n d q ; the cost of curtailing PV power by F P V q ; and the cost of load loss by F S .
Cost of wind energy curtailment
F W i n d q = t = 1 T c W i n d [ P W i n d max P W i n d r n , t ]
where P W i n d r n , t shows the wind power generation’s truthful intraday consumption output.
Abandoning photovoltaic power generation cost
F P V q = t = 1 T c P V [ P P V max P P V r n , t ]
where P P V r n , t means the actual intraday consumption output of the PV power supplying.
Opportunity cost
C S = k S P S r n , t
where k S is the load shedding cost coefficient; and P S r n , t is the load shedding power of the system during intraday.

4.2.2. Constraints

Wind power output constraint
0 P W i n d r n , t P W i n d max
Photovoltaic output constraint
0 P P V r n , t P P V max
Electric power balance constraint condition
P B u y t + P W i n d r n , t + P P V r n , t + P C C H P t + P o u t t + P S r n , t = P i n t + P E B t + P E C t + P P 2 G t + P L t

4.3. Real-Time Scheduling Phase

4.3.1. Objective Function

min F s s = F C o a l + F W i n d q + F P V q + F D R + F B u y + F C E T G C T + F S
Cost of wind energy curtailment
F W i n d q = t = 1 T c W i n d [ P W i n d max P W i n d s s , t ]
where the realistic consumption output of wind power generation in real time is shown by P W i n d s s , t .
Abandoning photovoltaic power generation cost
F P V q = t = 1 T c P V [ P P V max P P V s s , t ]
where the system’s real-time load shedding power is denoted by P S s s , t .
Opportunity cost
C S = k S P S s s , t
where P S s s , t is the load shedding power of the system during real-time.

4.3.2. Constraints

Wind power output constraint
0 P W i n d s s , t P W i n d max
Photovoltaic output constraint
0 P P V s s , t P P V max
Electric power balance constraint condition
P B u y t + P W i n d s s , t + P P V s s , t + P C C H P t + P o u t t + P S s s , t = P i n t + P E B t + P E C t + P P 2 G t + P L t

5. Case Study Analysis

This research examines the demand response of different energy sources and the involvement of shared energy storage, such as electric vehicles, in the context of green certificate–carbon joint trading. It adopts multi-timescale scheduling strategies, analyzes the flow and coupling relationships of different energy sources, builds a comprehensive energy system model based on the variations in response characteristics of different heterogeneous energy sources across timescales, and performs simulation analyses using MATLAB 2022b and solves them using CPLEX 12.10.0. The particular parameters [25] and scenario settings are shown in Table 1.
Scenario 1: Multi-time scale optimization scheduling of a comprehensive energy system with multiple heterogeneous energy sources, including heating, cooling, and electricity, without considering electric vehicles as shared energy storage.
Scenario 2: Multi-time scale optimization scheduling of a comprehensive energy system with electric vehicles as shared energy storage, without considering participation in the green certificate–carbon joint trading market.
Scenario 3: Multi-timescale optimized scheduling of a comprehensive energy system considering electric vehicles as shared energy storage and participation in the green certificate–carbon joint trading market, without considering demand response mechanisms.
Scenario 4: Multi-timescale optimized scheduling of a comprehensive energy system considering electric vehicles as shared energy storage, participation in the green certificate–carbon joint trading market, and multiple demand response mechanisms.

5.1. Day-Ahead Analysis

The day-ahead phase primarily explores the impact of the temporal and spatial flexibility and rapid response characteristics of shared energy storage systems, such as electric vehicles, on the flexibility of the system, as well as whether they possess low-carbon characteristics.
As shown in Table 2, compared with Scenario 1, the coal consumption cost and energy procurement cost in Scenario 2 decreased by 6.597% and 4.885%, respectively. Although the charging and discharging compensation cost of electric vehicles increased from 0 yuan to 58,660.0642 yuan, the total cost decreased by 3.931%. Additionally, the curtailment costs for wind power and photovoltaic power generation decreased by 45.707% and 51.873%, respectively. This indicates that by integrating shared energy storage flexibility resources (such as electric vehicles), it is possible to stabilize and average the power generation output of coal-fired power plants and combined heat and power plants to some extent, thereby reducing fluctuations in power generation.
Compared to Scenario 2, Scenario 3 reduces the curtailment costs of wind power and photovoltaic power generation from 2405.3686 yuan and 1209.375 yuan to 0 yuan, respectively. The total cost savings amounted to 309,057.8051 yuan. The cost of green certificates–carbon joint trading changes from 0 yuan to a loss of −528,682.7552 yuan. This clearly demonstrates that participating in the green certificates–carbon joint trading market can facilitate the trading of surplus green certificates and carbon quotas, fully utilize clean energy sources such as photovoltaic and wind power, avoid the curtailment of wind and photovoltaic power generation, reduce the production of traditional energy, and thereby help reduce carbon dioxide emissions into the atmosphere.
In Scenario 4, compared to Scenario 3, the cost of coal-fired power generation decreased by 4.524%. Energy procurement costs decreased by 94,056.7074 yuan. Demand response (DR) call costs increased from 0 yuan to 163,840.5373 yuan, while total costs decreased from 2,869,491.0196 yuan to 2,845,294.0451 yuan. The above data indicates that incorporating demand response can promote rational energy use by users through price mechanisms and policy subsidies, thereby achieving the goal of stabilizing load fluctuations. At the same time, it reduces output fluctuations per unit, thereby alleviating unnecessary costs.
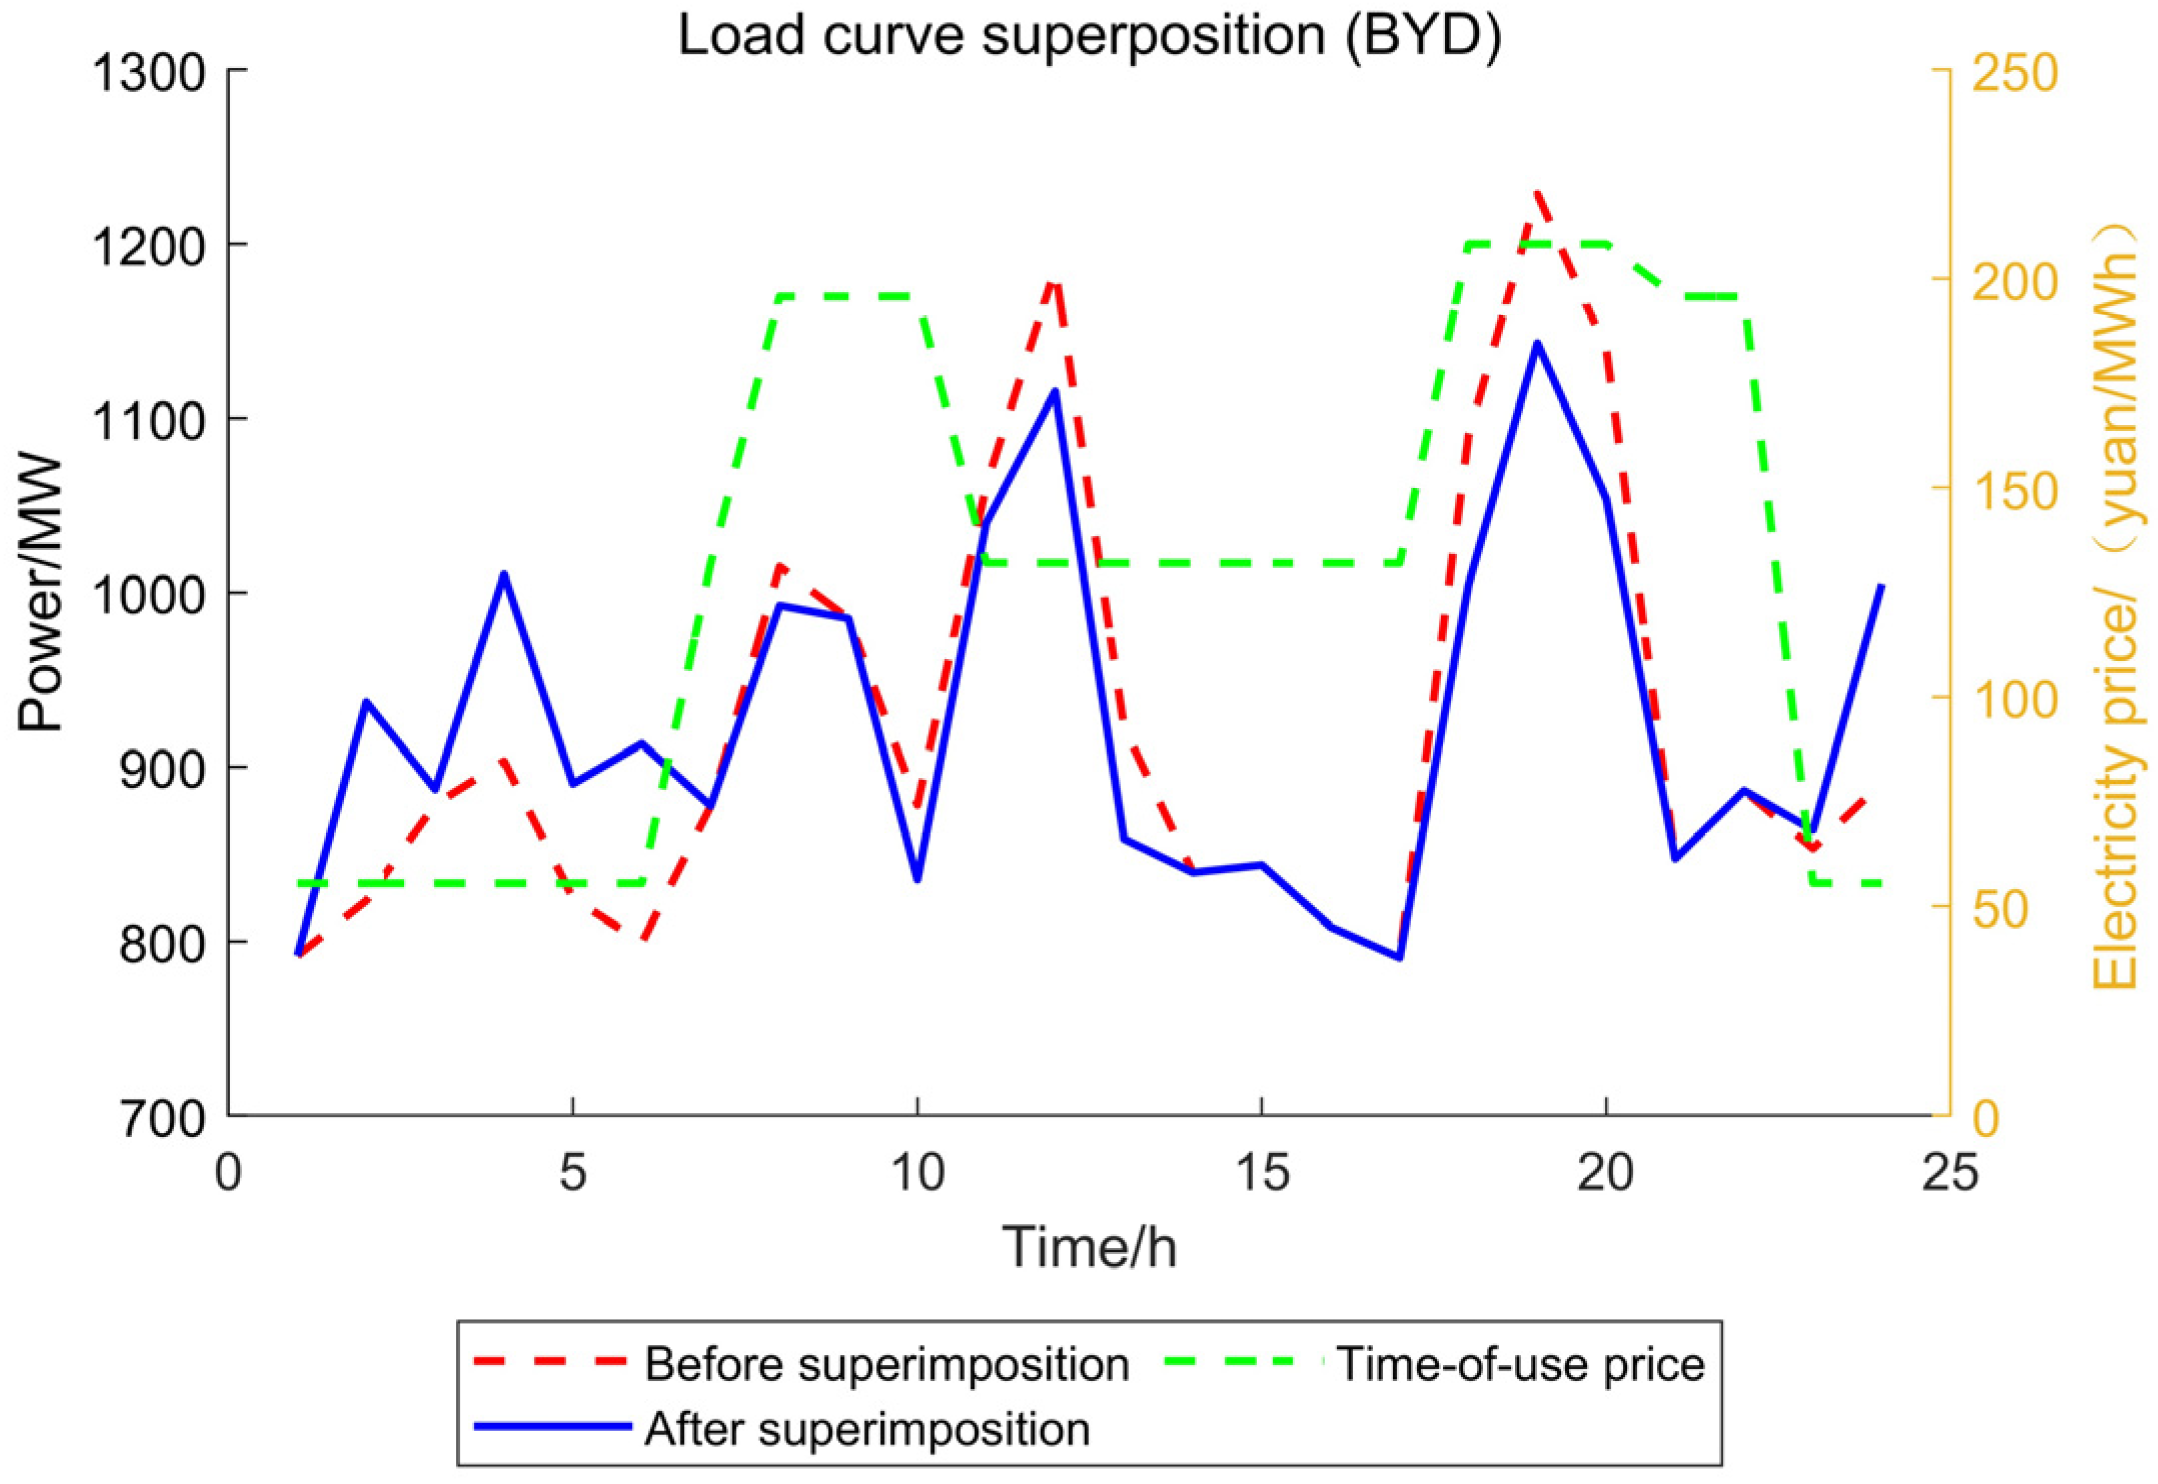
To mitigate the impact of individual differences, case study simulations were conducted for the Chinese automotive brand BYD, the Japanese automotive brand Nissan, and the German automotive brand BMW. As shown in Figure 4, BYD electric vehicles charge during the low-price periods from 0:00 to 6:00 and from 22:00 to 24:00, and discharge during the high-price periods from 8:00 to 10:00 and from 18:00 to 20:00, as well as the mid-price period from 11:00 to 14:00.
As shown in Figure 5, before the electric vehicles participated, the load was steeper and more volatile. Following participation, peak shaving and valley filling were achieved, resulting in smoother load oscillations with higher load during off-peak hours and lower load during peak hours.
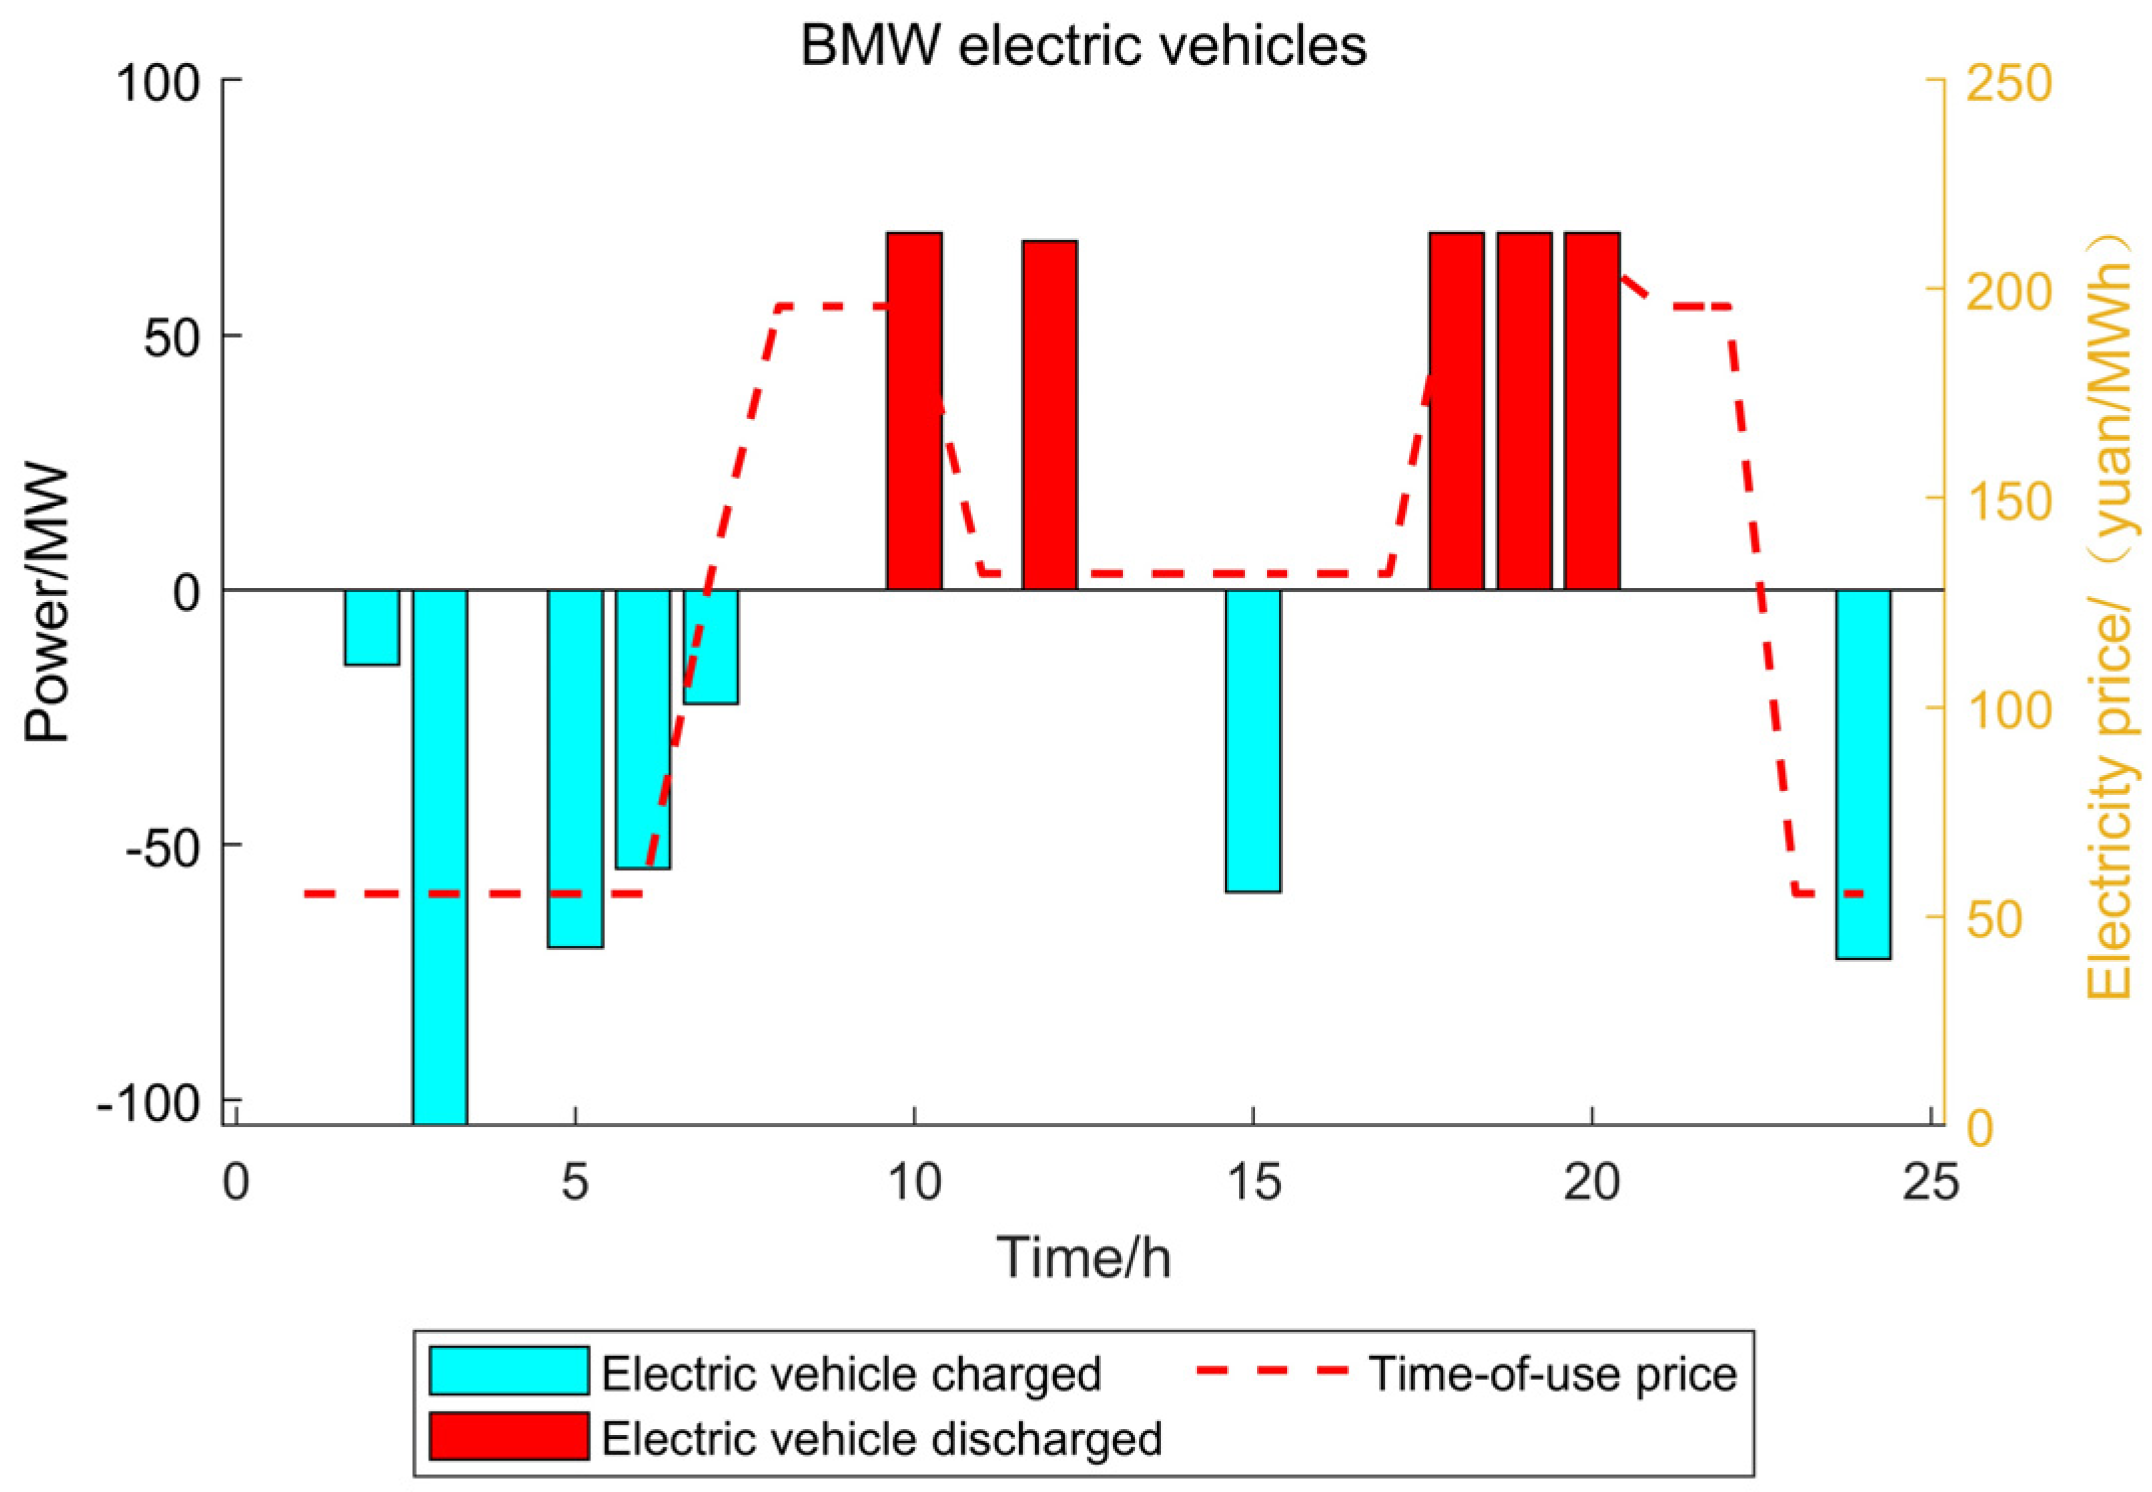
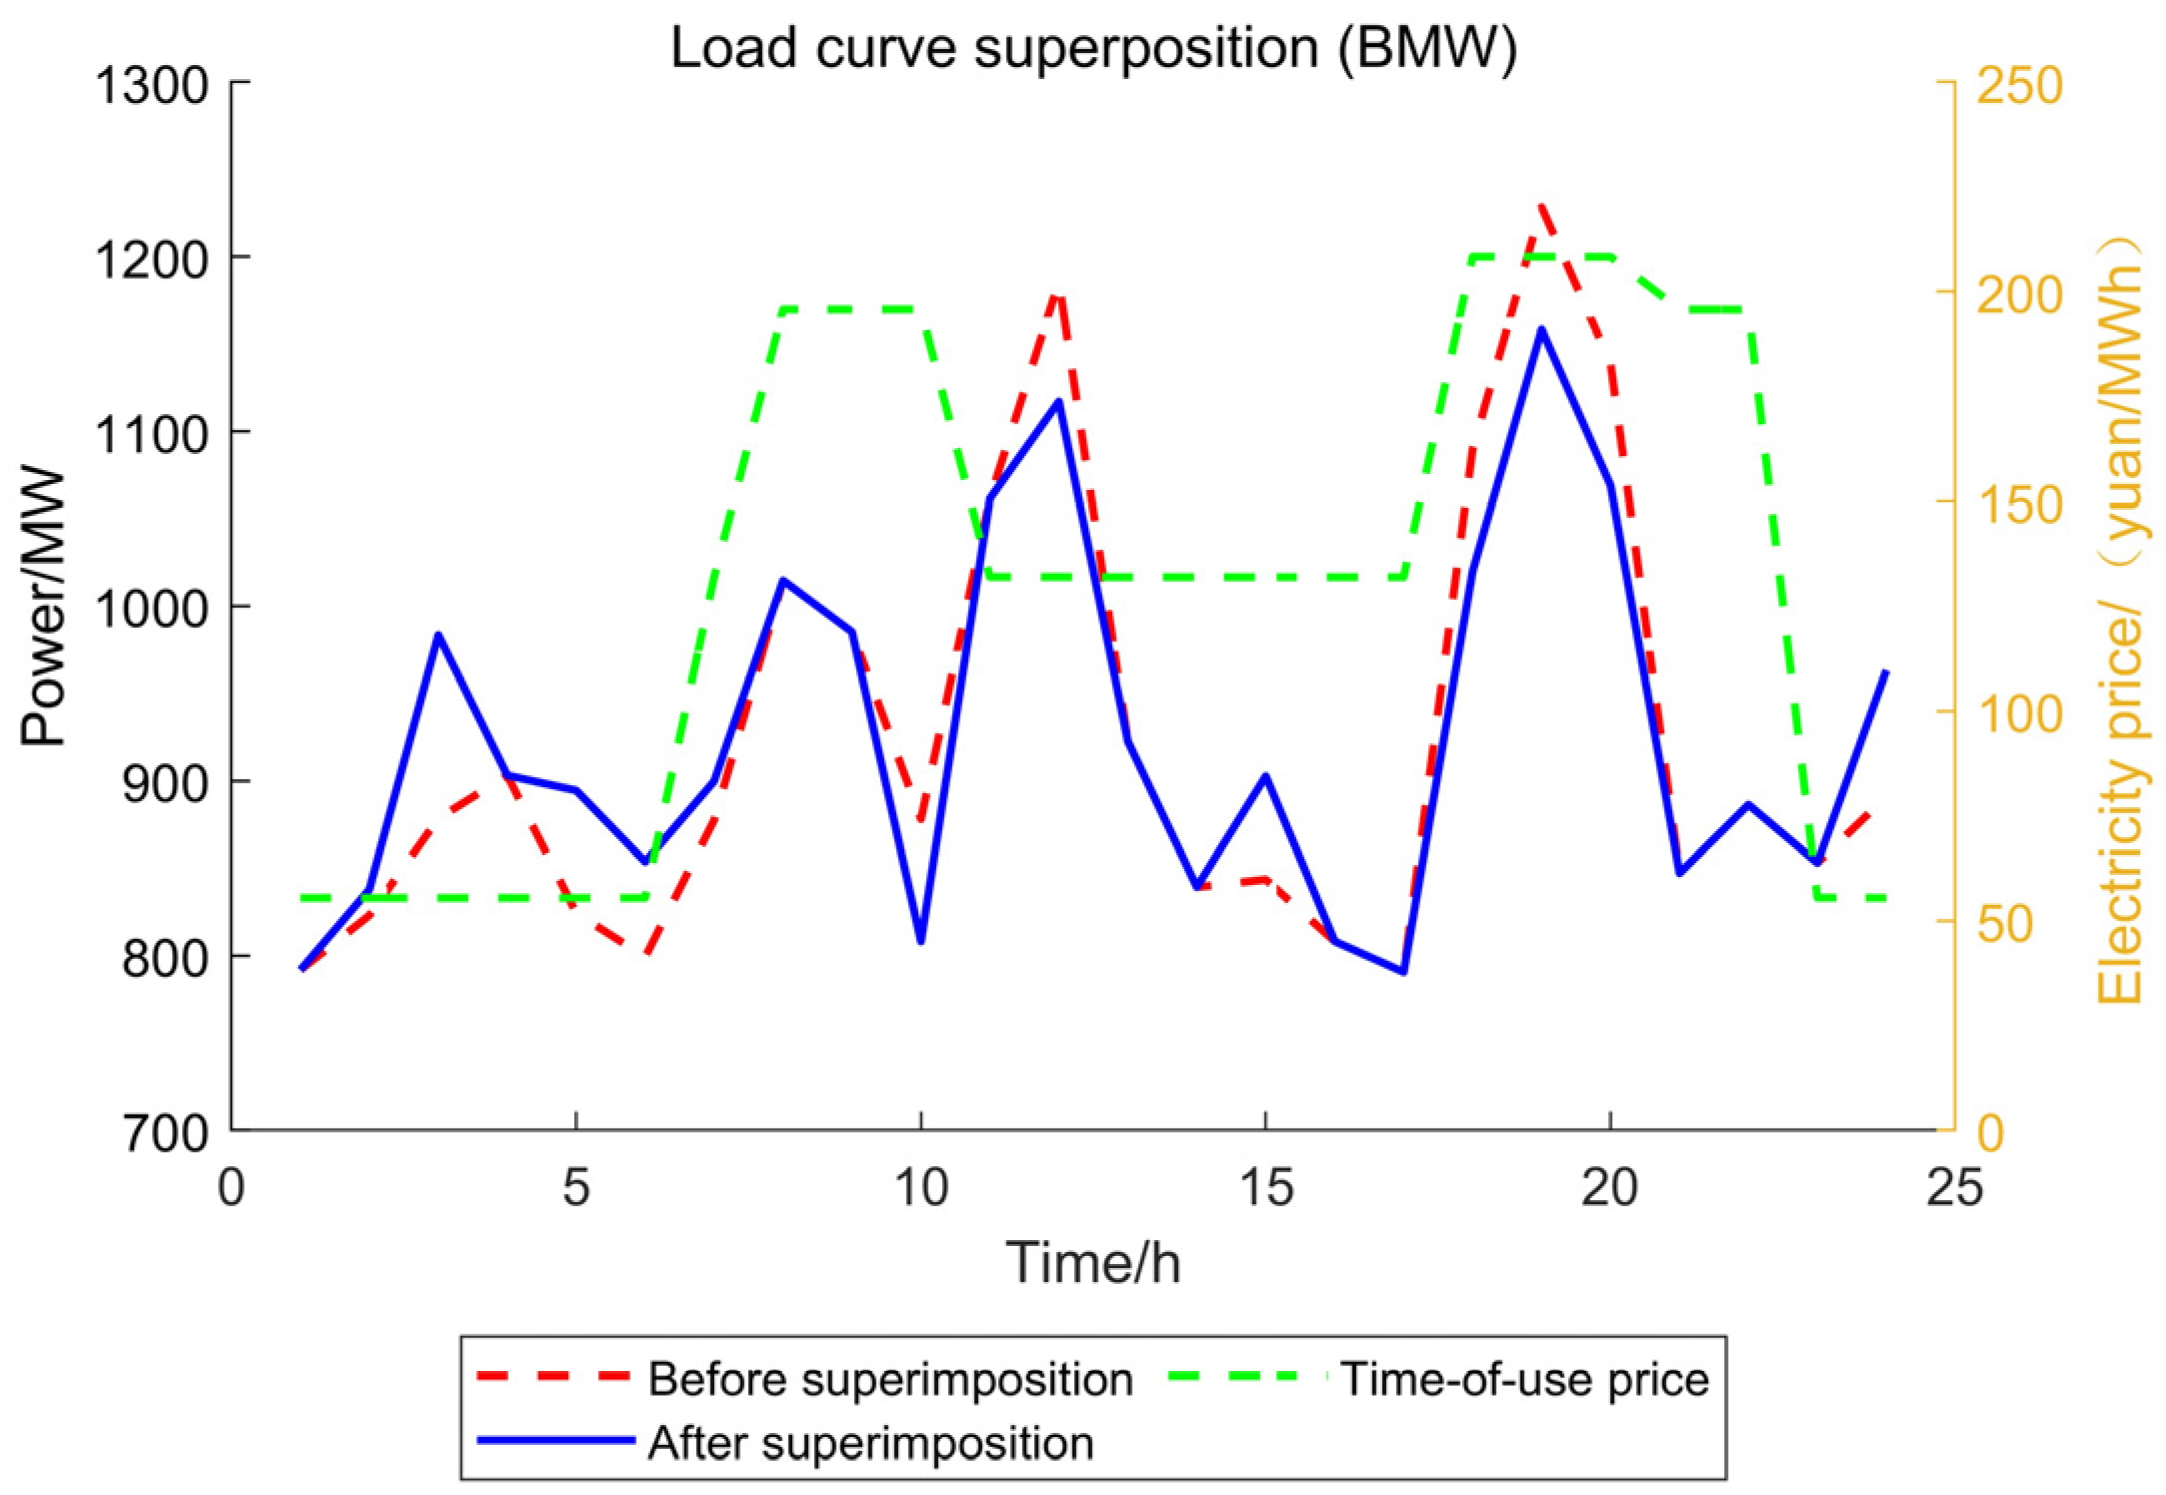
As shown in Figure 6, BMW electric vehicles charge during the low-price periods of 2–3 a.m., 5–7 a.m., and midnight, and during the mid-price period at 3 p.m. They discharge during the high-price periods of 10 a.m. and 6–8 p.m., and during the mid-price period at noon. Electric vehicles exhibit excellent responsiveness to fluctuations in electricity prices and can effectively coordinate with demand response mechanisms.
As shown in Figure 7, the electric vehicles’ participation in the pre-peak load reached 1228.41 MW, and the off-peak load reached 790.518 MW. After participation, the peak load decreased to 1158.41 MW, and the off-peak load decreased to 799.155 MW. The peak-to-off-peak difference narrowed, and load fluctuations became smoother, allowing for more reasonable power output scheduling for each unit.
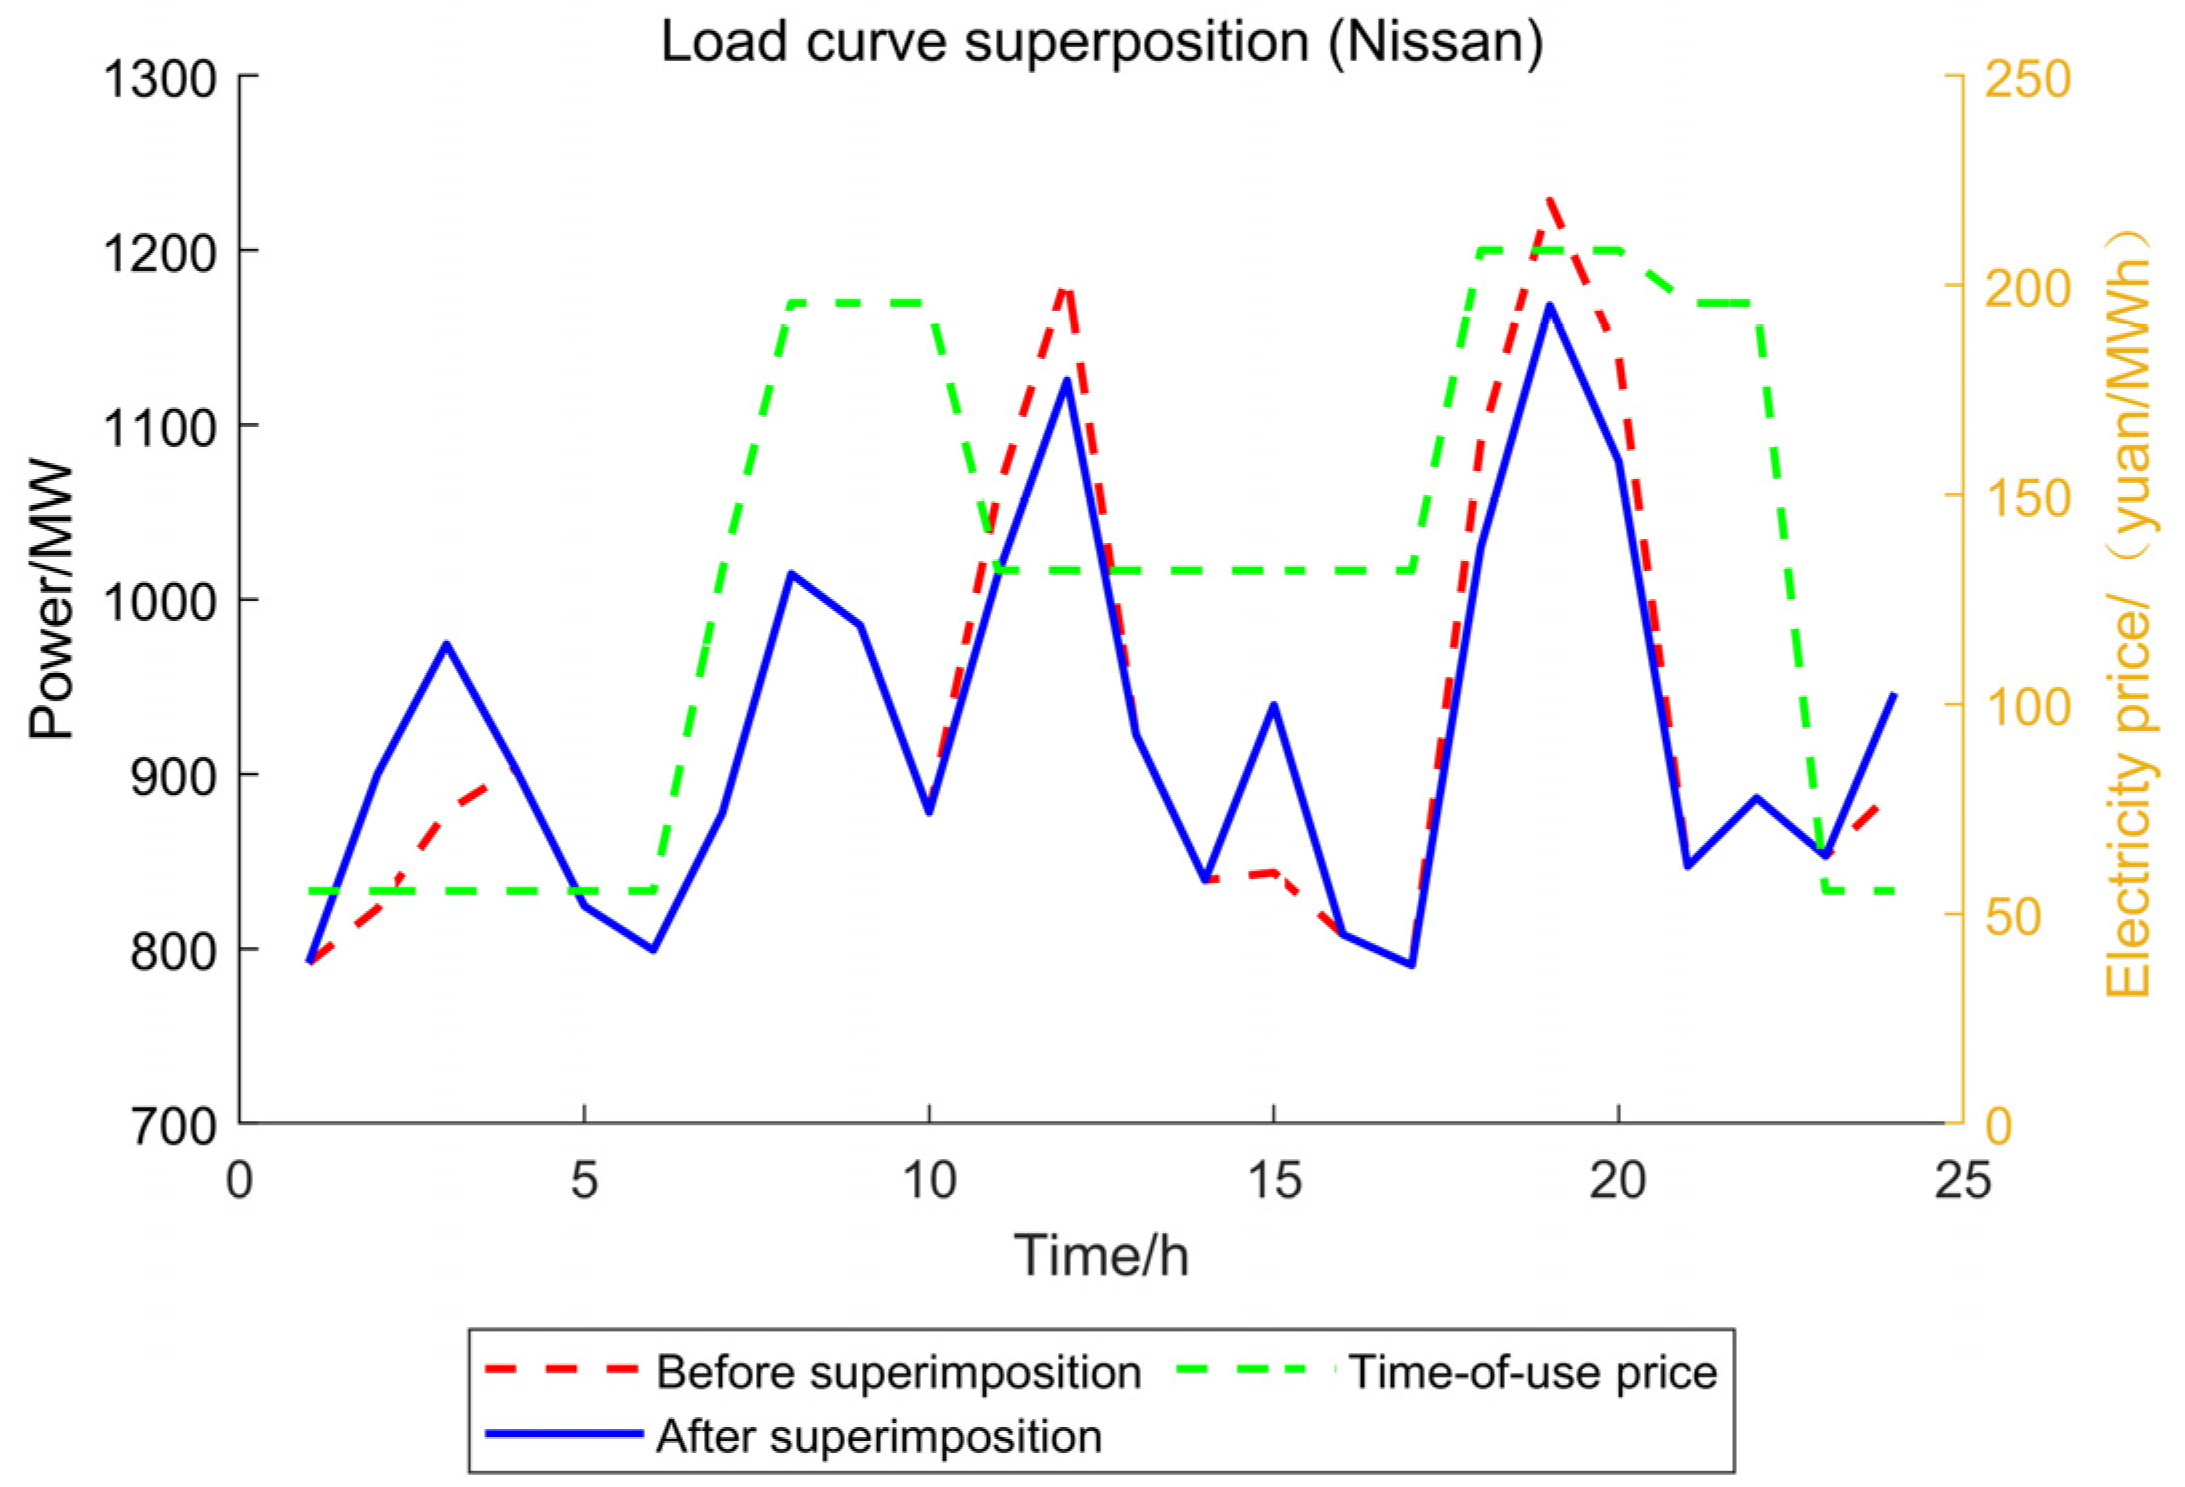
As shown in Figure 8, Nissan electric vehicles charge during the low-price periods of 2–3 a.m. and midnight, and during the mid-price period at 3 p.m., and discharge during the high-price periods of 6–8 p.m. and the mid-price period of 11 a.m.–12 p.m. Electric vehicles adjust their charging and discharging states according to different electricity prices, thereby playing a certain role in regulating power load.
In Figure 9, after electric vehicles participate, the load increases during the low-load periods from 1 a.m. to 4 a.m., 2 p.m. to 4 p.m., and 11 p.m. to midnight, and decreases during the peak load periods from 10 a.m. to 1 p.m. and 5 p.m. to 9 p.m., demonstrating a good load-smoothing effect.
It can be concluded that electric vehicle fleets, as shared energy storage systems, can actively respond to time-of-use electricity prices by discharging during peak load periods and charging during off-peak periods. This not only helps to stabilize system load fluctuations but also provides electric vehicle users with significant economic benefits due to the varied charging and discharging states based on different electricity prices.

5.2. Intraday Analysis

In the intraday stage, the main consideration is the positive interaction between the green certificate–carbon joint trading market and the IES. Through a joint reward and punishment mechanism, it is possible to improve the system’s carbon emissions and renewable energy consumption capacity.
As shown in Table 3, the curtailment costs for wind power and photovoltaic power in Scenario 2 decreased by 1904.3328 yuan and 1306.6058 yuan, respectively. The cost of coal consumption decreased by 113,722.8117 yuan. The cost of energy procurement decreased from 1,392,051.4516 yuan to 1,324,739.6795 yuan. However, after introducing electric vehicles into the system dispatch, the charging and discharging compensation cost for electric vehicles changed from 0 yuan to 59,938.1443 yuan. Nevertheless, the total cost in Scenario 2 is 141,151.6036 yuan lower than in Scenario 1, showing a decreasing trend. This indicates that electric vehicles, with their rapid response capabilities and spatiotemporal flexibility, can facilitate the integration of renewable energy sources such as wind and photovoltaic power, while balancing the power output of coal-fired units and combined cooling, heat, and power (CCHP) units, reducing carbon dioxide emissions, and enhancing system dispatch flexibility.
In Scenario 3, the costs of coal-fired power generation, energy procurement, and charging/discharging compensation increased by 5.798%, 6.903%, and 7.071%, respectively. Despite these cost increases, the system generated a profit of 535,402.3241 yuan from the green certificate–carbon joint trading market, resulting in total costs decreasing from 3,112,109.508 yuan to 2,778,761.6073 yuan. This indicates that by implementing a green certificate–carbon joint incentive-and-penalty mechanism, it is possible to promote the larger-scale integration of renewable energy sources such as wind power and photovoltaics, while capturing more carbon dioxide emissions from the system through carbon capture and storage (CCS) technology, thereby reducing environmental pollution.
Due to the presence of several demand response resources, Scenario 4 requires additional consideration of demand response costs in comparison to Scenario 3. Demand response expenses total 162,839.8771 yuan in Scenario 4. The whole cost savings; however, come to 37,456.3701 yuan. This suggests that load shedding can be successfully reduced, unit production can be optimized, load fluctuations can be smoothed, and load levels can be stabilized over time, all of which have a good impact on the system dispatch as a whole.
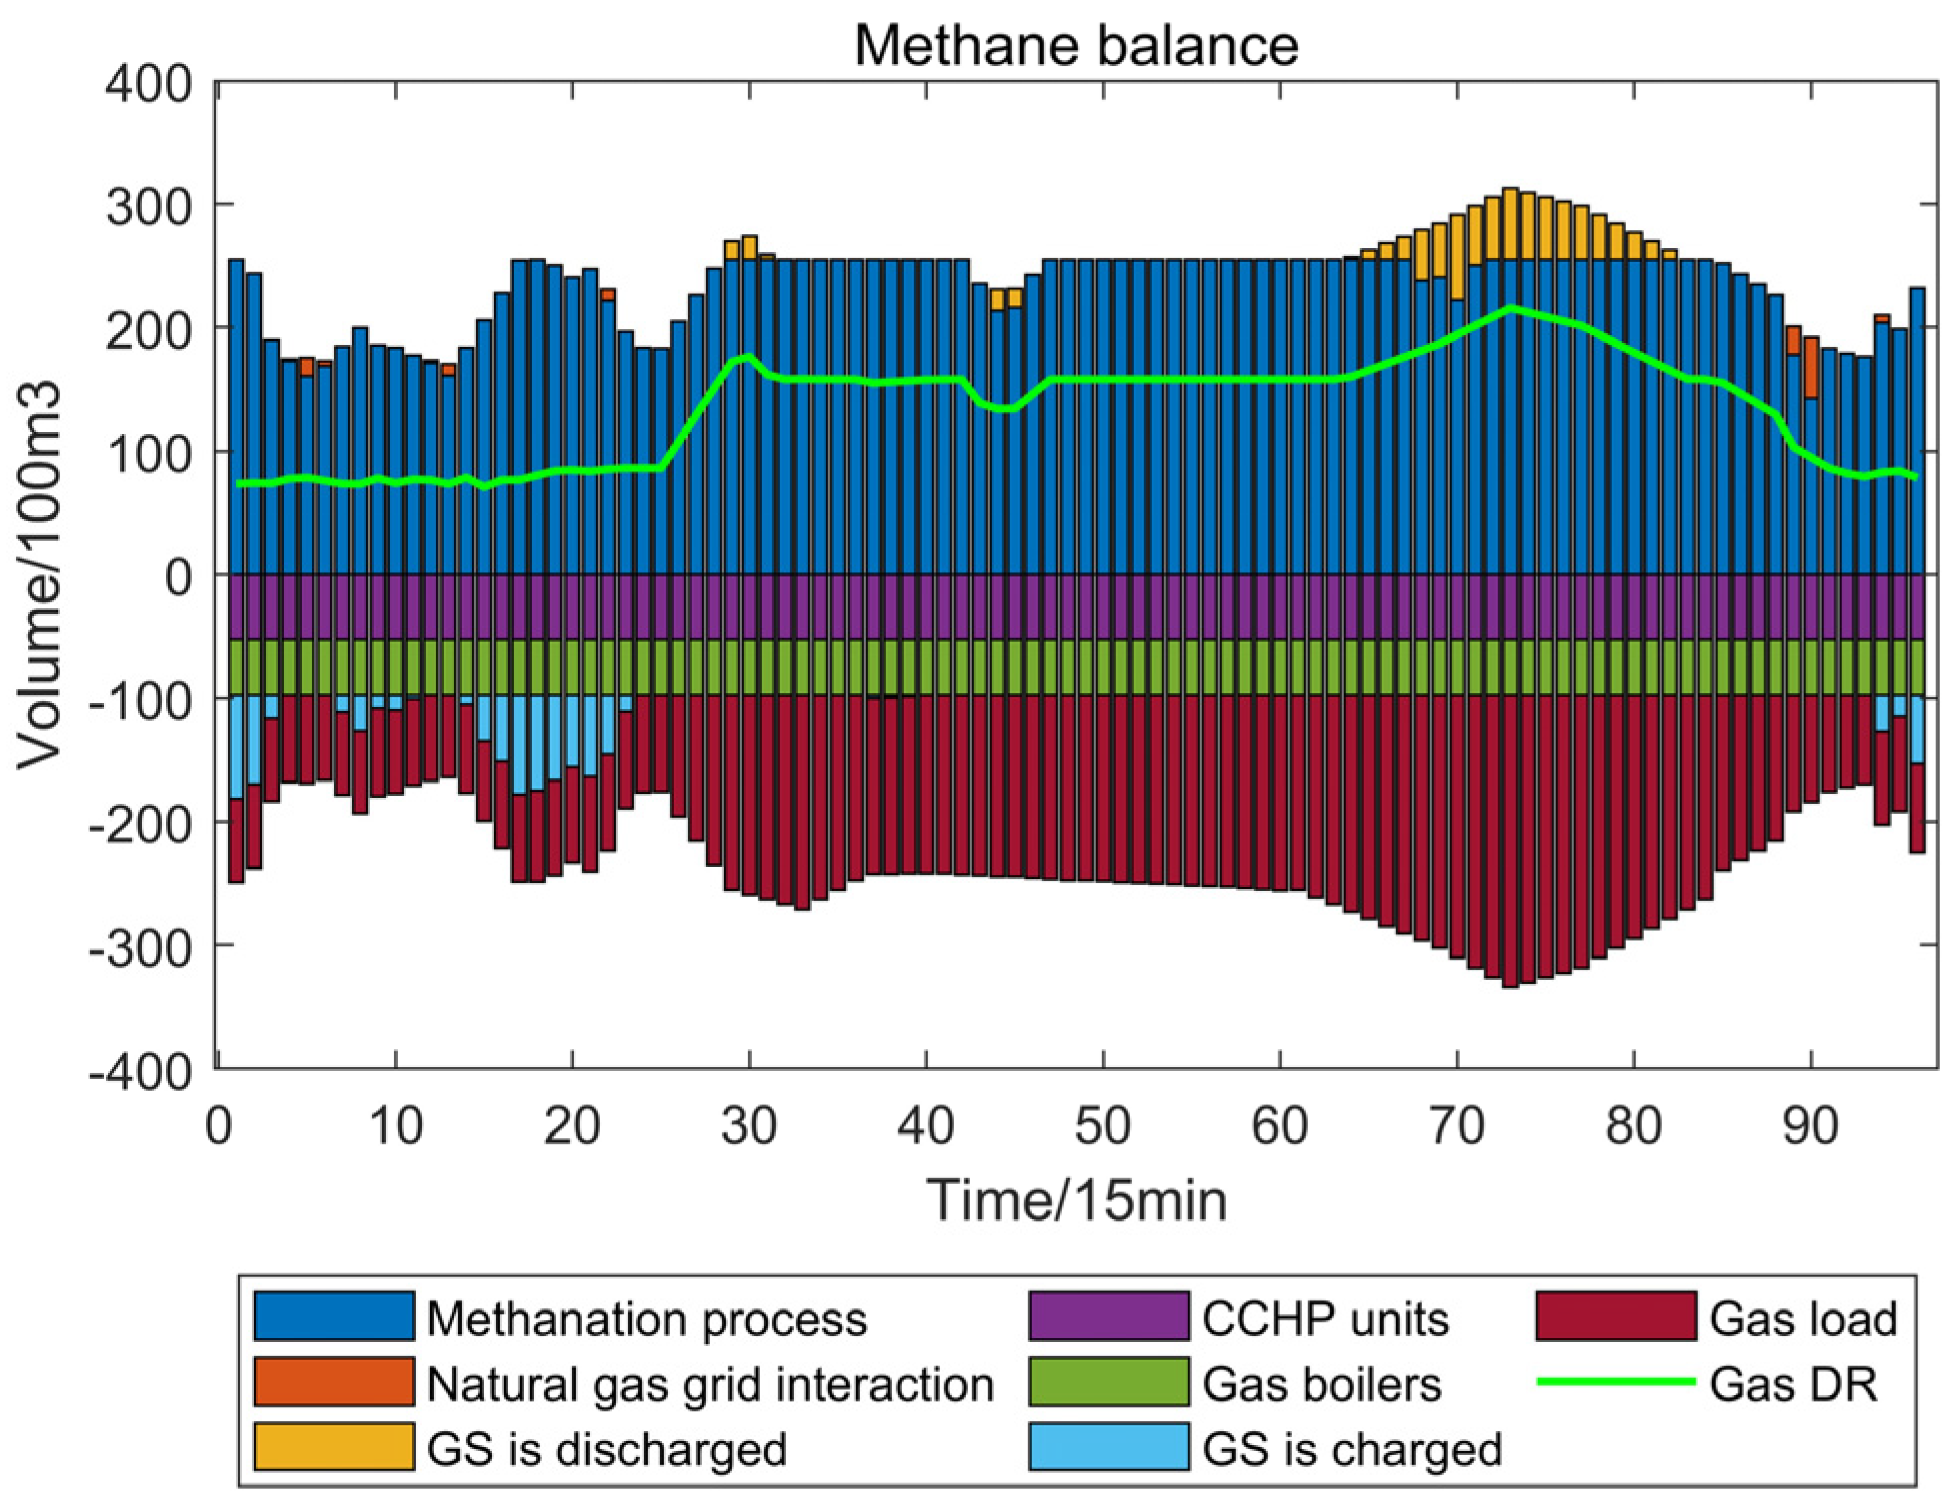
As shown in Figure 10, in the natural gas balance, the system’s natural gas supply is primarily generated by P2G equipment. During peak gas load periods such as 435–450 min, 675–690 min, and 960–1245 min, the gas storage facility participates in the natural gas balance, supplying natural gas. Due to P2G output constraints, a small quantity of natural gas must be acquired from the gas network during individual low gas load times. CCHP units and gas boilers consume natural gas to convert it into other forms of energy for system use. The remaining periods are primarily gas load periods, during which the gas storage facility stores the remaining natural gas in the system at intervals of 15 min, 45 min, 105 min to 150 min, 225 min to 345 min, and 1410 min to 1440 min.
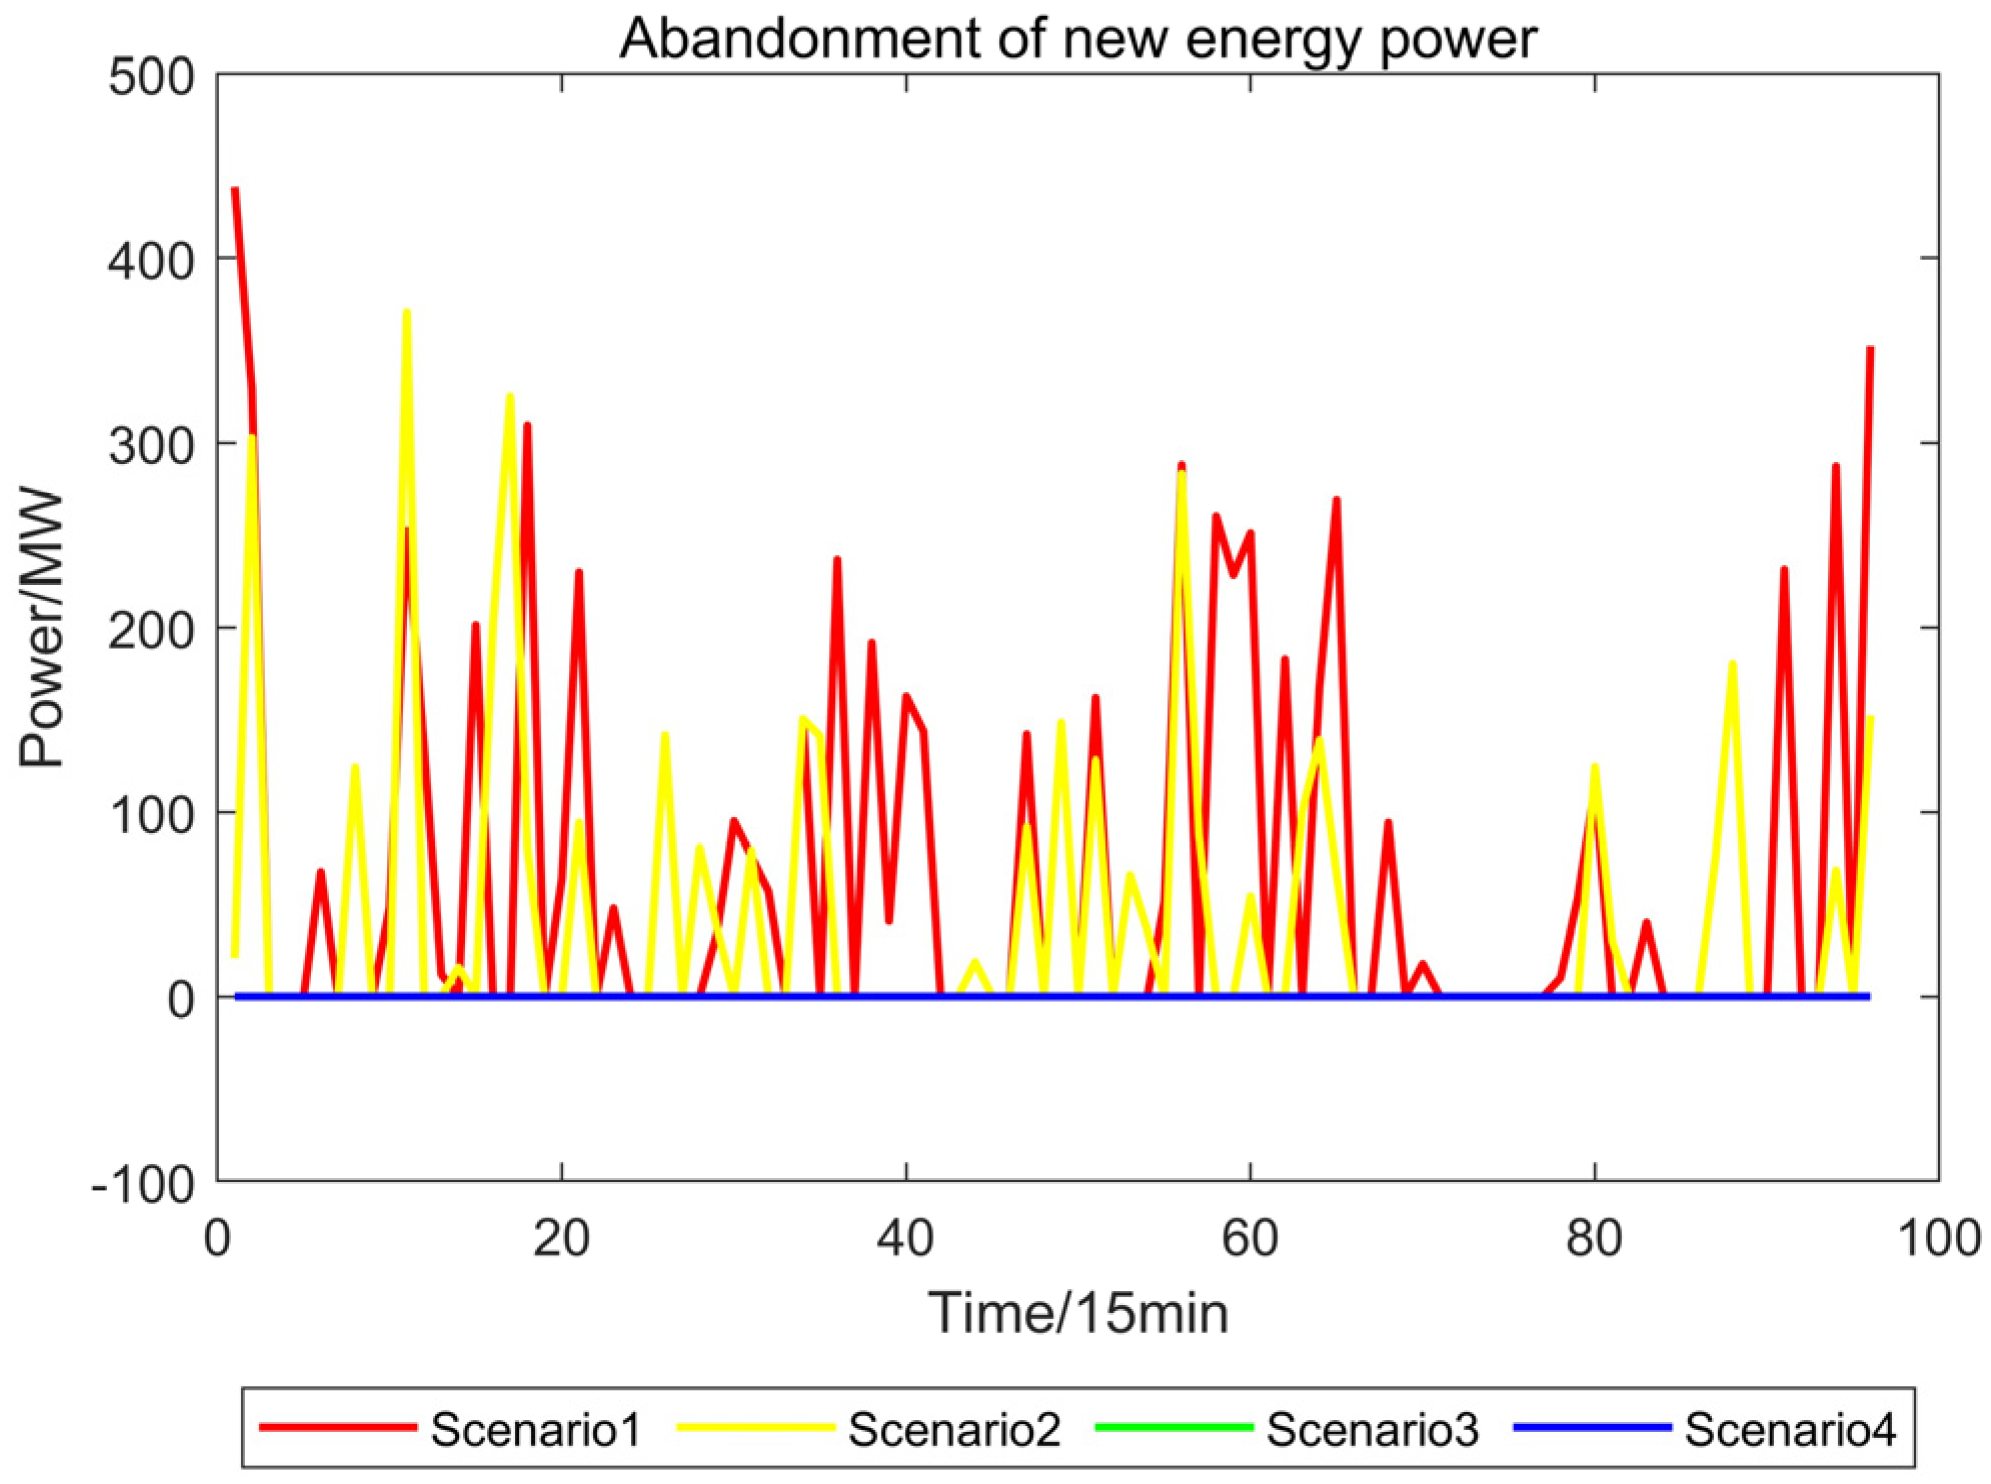
As shown in Figure 11, the wind and PV power curtailment rates in Scenario 1 are relatively high during the three time periods of 150–300 min, 855–1005 min, and 1335–1440 min. Scenario 2 incorporates electric vehicles as shared energy storage participating in the integrated energy system dispatch, and the curves in Scenario 2 are generally lower than those in Scenario 1, indicating that electric vehicles can enhance the consumption of wind and PV energy. Given that the wind and PV curtailment rates in Scenario 3 are almost negligible, it is possible that a green certificate–carbon joint trading market would encourage the use of renewable energy sources and increase the system’s capacity for consumption.
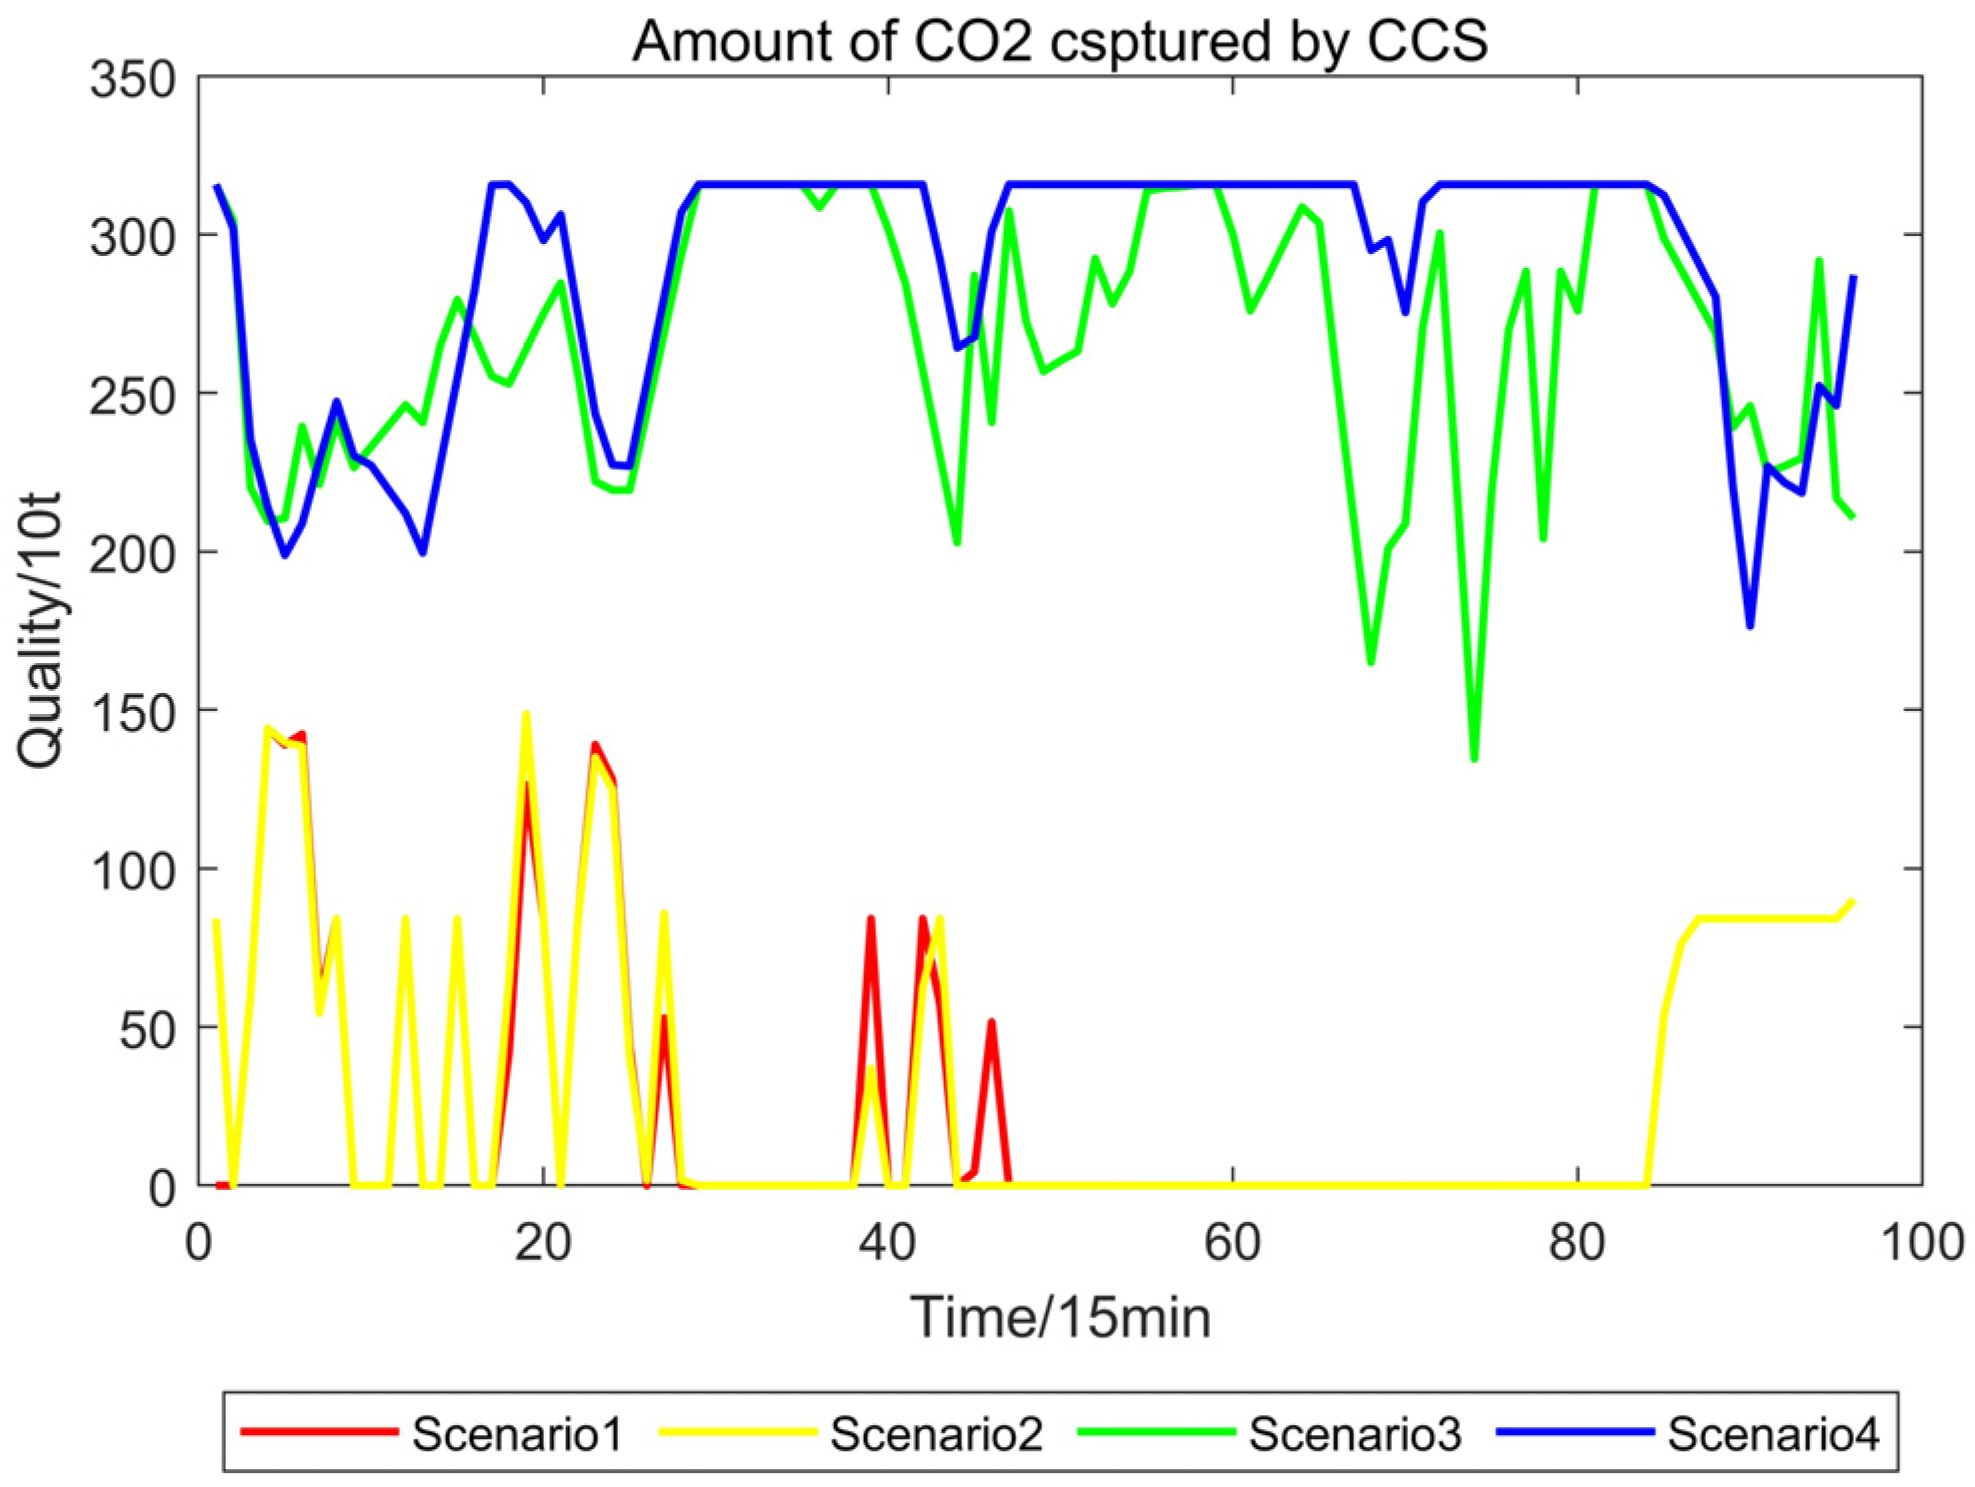
As shown in Figure 12, the carbon capture curves for Scenario 2 and Scenario 1 are similar. However, carbon capture is higher in Scenario 2 than in Scenario 1 during the time periods from 135 min to 330 min and from 690 min to 1440 min. For most of the time, Scenario 2 has lower carbon emissions, indicating that the participation of shared energy storage flexibility resources in system scheduling can reduce carbon emissions. By adding the function of the green certificate–carbon joint trading mechanism, Scenario 3 expands on Scenario 2. As shown in the curve, the amount of CO2 captured is significantly higher across all time periods, indicating that through incentive and disincentive mechanisms, CO2 emissions are effectively reduced. Scenario 4 further improves upon Scenario 3, particularly during the 225 min to 375 min and 435 min to 1320 min periods, where carbon capture exceeds that of Scenario 3. This reflects the participation of demand response resources, leading to more reasonable and smooth output from carbon capture devices and enhancing the system’s CO2 capture efficiency.

5.3. Real-Time Analysis

Think about adding demand response for other energy sources, including heat, cold, and electricity, into the real-time system. These matters as different energy sources have unique load traits, and integrating their response boosts system flexibility. For example, heat demand can use storage: store extra heat off-peak and release it at peaks to ease supply pressure. Cooling loads can adjust via electric refrigeration unit and absorption refrigeration unit, avoiding peak use surges.
Price changes and law-backed incentives work together. Higher peak prices reduce use; lower off-peak prices encourage it. Incentives like subsidies push user participation. These methods can achieve peak shaving, smoothing load swings. Real-time cost trends in Table 4 match intraday ones in Table 3 and are not repeated here. See Table 4 for specific data.
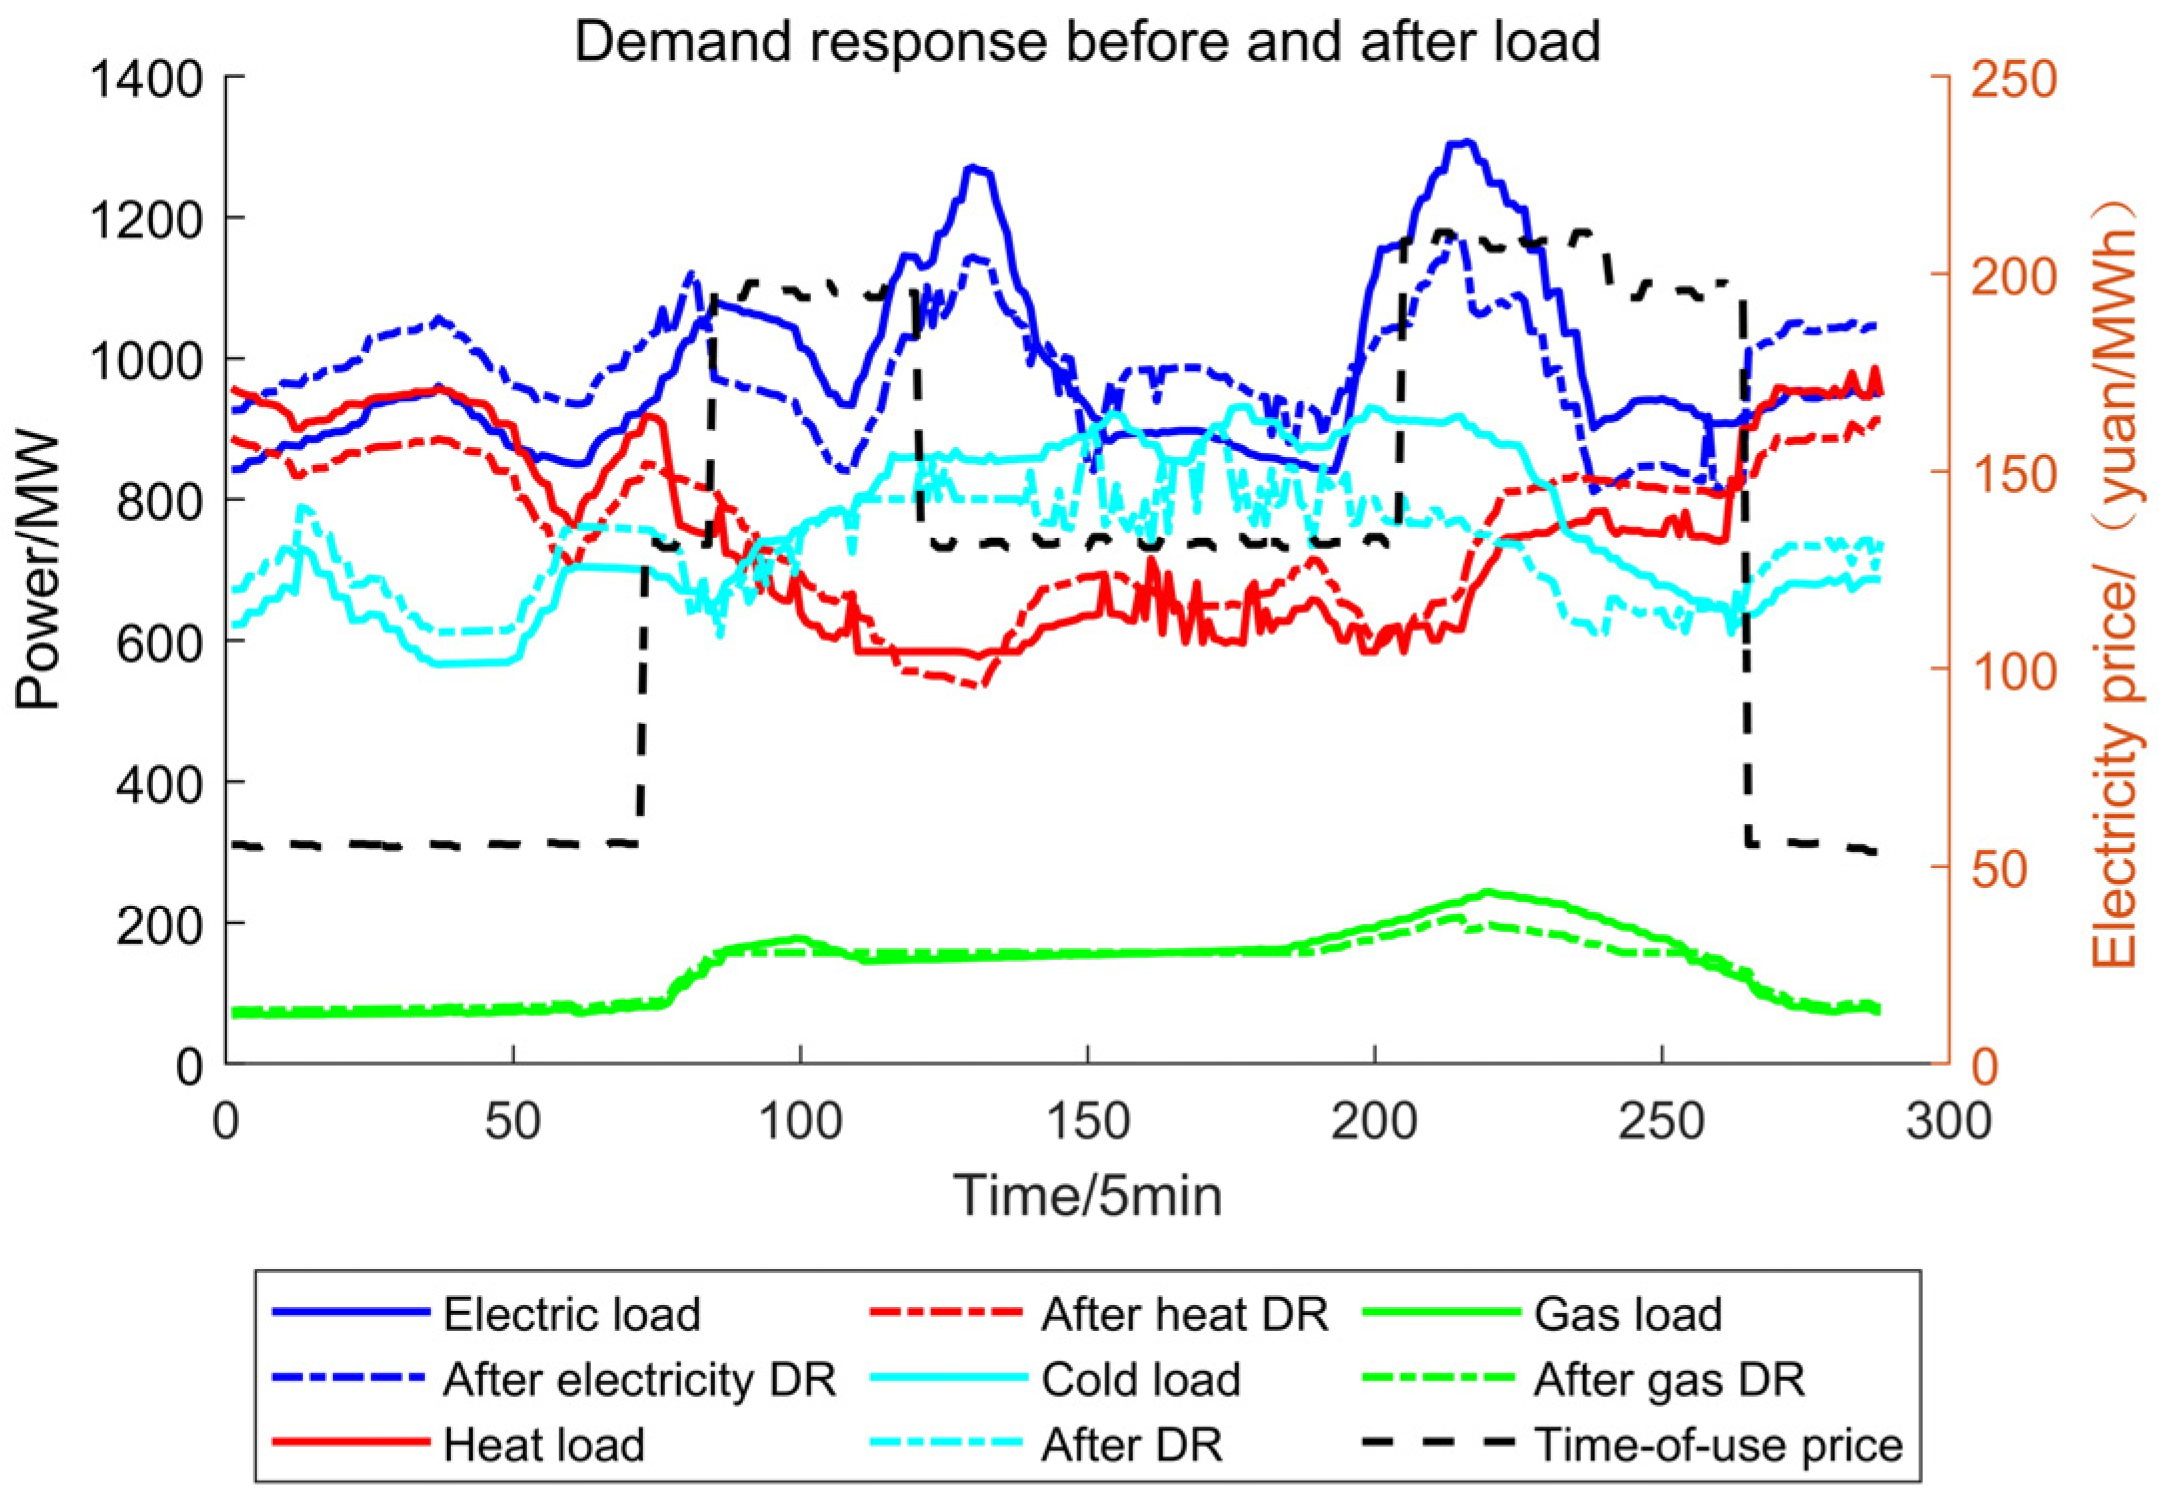
As shown in Figure 13, the various loads of heating, cooling, and electricity are reduced during their respective peak load periods, thereby reducing the system load. During their respective off-peak periods, the loads increase, thereby increasing the system load during that period. Peak shaving and valley filling can be achieved by heating, cooling, and electrical demand response, according to this, making each unit’s output more stable, lowering significant variations, saving money, and increasing system dispatch flexibility.

6. Conclusions

Through multi-timescale optimization scheduling research for integrated energy systems that considers sustainability and low-carbon characteristics is presented in this work. Demand response from a range of heterogeneous energy sources, such as gas, electricity, heating, and cooling, as well as shared energy storage, such as electric vehicles, and the reward and punishment mechanisms of the green certificate–carbon joint trading market, are all taken into consideration in the multi-timescale scheduling of integrated energy systems. The following are some benefits of the scheduling approach suggested in this paper:
  • Shared energy storage systems, such as electric vehicles, with their flexible spatial and temporal characteristics and rapid response capabilities, can charge during off-peak periods and discharge during peak periods. This alleviates peak-period load pressure, prevents energy waste during off-peak periods, enhances the integration of renewable energy sources like wind and PV power, and reduces curtailment of wind and PV energy.
  • Mechanisms for incentives and penalties are used in the green certificate–carbon joint trading market. On the one hand, by trading excess green certificates, the green certificate trading market encourages the system’s continued incorporation of renewable energy sources like PV and wind. On the other hand, it lowers the system’s CO2 emissions and improves CCS’s capacity to collect carbon through the carbon trading market. The system’s overall economic efficiency can be increased by converting extra green certificates into carbon emission rights.
  • Cold, heat, gas, and electricity demand response can be achieved through price-based and incentive-based mechanisms to transfer and reduce various loads, thereby smoothing load fluctuations, reducing output fluctuations of power generation units, making output more reasonable, lowering energy costs, improving energy utilization efficiency, enhancing energy supply flexibility, and promoting interaction between users and the energy system.

Author Contributions

Conceptualization, H.J.; Methodology, H.J. and X.L.; Software, X.L.; Validation, H.J. and X.L.; Formal Analysis, H.J. and X.L.; Investigation, H.J.; Resources, H.J.; Data Curation, X.L.; Writing—Original Draft Preparation, X.L.; Writing—Review and Editing, H.J.; Supervision, H.J. All authors have read and agreed to the published version of the manuscript.

Funding

This work was supported by the National Natural Science Foundation of China (62203311, 62473269), Liaoning Province Key Research and Development Project (2024JH2/102500093), Liaoning Province Outstanding Youth Fund Program (2025-YQ-19), and Basic Scientific Research Project of Liaoning Provincial Department of Education (LJ222411632036).

Institutional Review Board Statement

Not applicable.

Informed Consent Statement

Not applicable.

Data Availability Statement

The original contributions presented in this study are included in the article. Further inquiries can be directed to the corresponding author.

Conflicts of Interest

The authors declare that they have no known competing financial interests or personal relationships that could have appeared to influence the work reported in this paper.

Abbreviations

The following abbreviations are used in this manuscript:
IESIntegrated energy systems
EVsElectric vehicles
V2GVehicle-to-grid
TGCsTradable green certificates
ETSEmission trading schemes
ISOsIndependent System Operators
P2GPower-to-gas
IDRIntegrated demand response
CETCarbon trading
GCTGreen certificate trading
CCERChinese Certified Emission Reductions
CCHPCombined cooling, heat, and power
GBGas boiler
ACAbsorption chiller
EBElectric boiler
ECElectric chiller
CCSCarbon capture and storage

References

  1. Yuan, Y.; Miao, A.K.; Wu, H.; Zhu, J.P.; Wang, Z.M.; Qian, K. Research framework and key issues in low-carbon integrated energy systems. High Volt. Eng. 2024, 50, 4019–4036. [Google Scholar] [CrossRef]
  2. Mei, S.; Li, B.; Wang, H.; Wang, J.; Wang, Y.; Liu, Z.; Chen, Y.; Zhang, L.; Wu, W.; Guo, X. Multi-objective optimal scheduling of microgrid with electric vehicles. Energy Rep. 2022, 8, 4512–4524. [Google Scholar] [CrossRef]
  3. Yue, Y.; Zhang, Q.; Zhang, J.; Yu, F.; Chen, X.; Mao, L.; Liu, Y.; Zhao, H. Orderly charging and discharging group scheduling strategy for electric vehicles. Appl. Sci. 2023, 13, 13156. [Google Scholar] [CrossRef]
  4. Kapoor, A.; Patel, V.S.; Sharma, A.; Kumar, R.; Singh, S.N.; Reddy, M.J.B.; Thomas, T.; Wei, L. Centralized and decentralized pricing strategies for optimal scheduling of electric vehicles. IEEE Trans. Smart Grid 2022, 13, 2234–2244. [Google Scholar] [CrossRef]
  5. Mahato, D.; Aharwal, V.K.; Sinha, A. Multi-objective optimization model and hybrid optimization algorithm for electric vehicle charge scheduling. J. Exp. Theor. Artif. Intell. 2024, 36, 1645–1667. [Google Scholar] [CrossRef]
  6. Li, M.; Aksoy, M.; Samad, S.; Wong, K.P.; Lie, T.T.; Tang, Y.; Wang, C.; Liu, F. Optimal energy management and scheduling of a microgrid with integrated electric vehicles and cost minimization. Soft Comput. 2024, 28, 2015–2034. [Google Scholar] [CrossRef]
  7. Chen, J.; Mao, L.; Liu, Y.; Wang, X.; Li, Z.; Wei, F.; Zhang, H.; Sun, L. Multi-objective optimization scheduling of active distribution network considering large-scale electric vehicles based on NSGAII-NDAX algorithm. IEEE Access 2023, 11, 97259–97273. [Google Scholar] [CrossRef]
  8. Yang, F.; Yu, S.; Meng, C.; Zhang, H.; Wu, L.; Zhou, Q.; Li, X. A three-stage optimization of charging scheduling of electric vehicles considering electricity price and user selection. Electr. Eng. 2024, 106, 4737–4746. [Google Scholar] [CrossRef]
  9. Yang, J.; Yu, F.; Ma, K.; Jiang, T.; Sun, W.; Li, Y.; Wang, Z.; Liu, L. Optimal scheduling of electric-hydrogen integrated charging station for new energy vehicles. Renew. Energy 2024, 224, 120224. [Google Scholar] [CrossRef]
  10. Xie, T.; Ma, K.; Zhang, G.; Zhao, Y.; Wang, H.; Chen, L.; Liu, X. Optimal scheduling of multi-regional energy system considering demand response union and shared energy storage. Energy Strategy Rev. 2024, 53, 101413. [Google Scholar] [CrossRef]
  11. Qiao, J.; Mi, Y.; Shen, J.; Wang, C.; Li, X.; Zhang, Z. Optimization schedule strategy of active distribution network based on microgrid group and shared energy storage. Appl. Energy 2025, 377, 124681. [Google Scholar] [CrossRef]
  12. Sun, X.; Chen, J.; Yang, S.; Liu, H.; Wang, Y.; Li, R.; Zhang, W.; Xu, F. Optimal scheduling of multi-regional integrated energy systems with shared energy storage under dynamic rental prices mechanism. J. Energy Storage 2025, 106, 114902. [Google Scholar] [CrossRef]
  13. Chai, Z.; Liu, J.; Zhang, Y.; Wang, H.; Chen, L.; Zhou, Q.; Yang, X. Optimal scheduling strategy of regional power system dominated by renewable energy considering physical and virtual shared energy storage. Energies 2023, 16, 2506. [Google Scholar] [CrossRef]
  14. Li, X.; Deng, J.; Liu, J. Energy-carbon-green certificates management strategy for integrated energy system using carbon-green certificates double-direction interaction. Renew. Energy 2025, 238, 121937. [Google Scholar] [CrossRef]
  15. Tan, J.; Pan, W.; Li, Y.; Zhang, C.; Yang, F.; Liu, S.; Wu, H. Energy-sharing operation strategy of multi-district integrated energy systems considering carbon and renewable energy certificate trading. Appl. Energy 2023, 339, 120835. [Google Scholar] [CrossRef]
  16. Li, J.; Xu, L.; Wang, L.; Zhao, Y.; Zhang, H.; Chen, T.; Liu, X. Operation optimization of regional integrated energy systems with hydrogen by considering demand response and green certificate-carbon emission trading mechanisms. Energies 2024, 17, 3190. [Google Scholar] [CrossRef]
  17. Chen, H.; Wu, H.; Li, H.; Wang, X.; Zhang, Y.; Liu, Z.; Yang, F. Bi-level optimal scheduling of integrated energy systems considering incentive-based demand response and green certificate-carbon trading mechanisms. Energy Rep. 2025, 13, 330–344. [Google Scholar] [CrossRef]
  18. Ma, T.; Peng, L.; Wu, G.; Zhou, Y.; Li, X.; Wang, C.; Zhang, Z. Research on multi-scale electricity-carbon-green certificate market coupling trading based on system dynamics. Processes 2025, 13, 109. [Google Scholar] [CrossRef]
  19. Ma, X.; Zhang, Z.; Chen, J.; Wang, L.; Liu, Y.; Zhang, H.; Zhao, F. Optimization of low-carbon operation in a combined electrical, thermal, and cooling integrated energy system with liquid carbon dioxide energy storage and green certificate and carbon trading mechanisms. Processes 2025, 13, 372. [Google Scholar] [CrossRef]
  20. Zheng, B.; Bao, Z.; Yang, L. Design and equilibrium analysis of integrated market of ISO-led carbon emissions, green certificates and electricity considering their interplay. Energy Econ. 2023, 126, 107022. [Google Scholar] [CrossRef]
  21. Li, L.; Song, K.; Xu, W.; Zhang, Y.; Wang, H.; Liu, J.; Yang, C. System dynamics simulation of policy synergy effects: How tradable green certificates and carbon emission trading shape electricity market sustainability. Appl. Sci. 2025, 15, 4086. [Google Scholar] [CrossRef]
  22. Hou, H.; Ge, X.; Yan, Y.; Chen, L.; Wang, Z. An integrated energy system ‘green-carbon’ offset mechanism and optimization method with Stackelberg game. Energy 2024, 294, 130617. [Google Scholar] [CrossRef]
  23. Gong, X.; Li, X.; Zhong, Z. Strategic bidding of virtual power plants in integrated electricity-carbon-green certificate market with renewable energy uncertainties. Sustain. Cities Soc. 2025, 121, 106176. [Google Scholar] [CrossRef]
  24. Tang, Z.; Yin, Y.; Chen, C.; Zhang, L.; Wu, H.; Zhou, F.; Liu, X. A synergistic planning framework for low-carbon power systems: Integrating coal-fired power plant retrofitting with a carbon and green certificate market coupling mechanism. Energies 2025, 18, 2403. [Google Scholar] [CrossRef]
  25. Xiong, Z.; Zhang, D.; Wang, Y.; Li, H.; Chen, X.; Liu, L. Optimal operation of integrated energy systems considering energy trading and integrated demand response. Energy Rep. 2024, 11, 3307–3316. [Google Scholar] [CrossRef]
  26. Hua, H.; Du, C.; Chen, X.; Wang, Y.; Zhang, Z.; Li, T.; Liu, W. Optimal dispatch of multiple interconnected-integrated energy systems considering multi-energy interaction and aggregated demand response for multiple stakeholders. Appl. Energy 2024, 376, 124256. [Google Scholar] [CrossRef]
  27. Lyu, X.; Liu, T.; Liu, X.; Zhang, Y.; Wu, H.; Wang, S. Low-carbon robust economic dispatch of park-level integrated energy system considering price-based demand response and vehicle-to-grid. Energy 2023, 263, 125739. [Google Scholar] [CrossRef]
  28. Guo, W.; Wang, Q.; Liu, H.; Chen, L.; Zhao, Y.; Yang, F.; Li, X. Multi-energy collaborative optimization of park integrated energy system considering carbon emission and demand response. Energy Rep. 2023, 9, 3683–3694. [Google Scholar] [CrossRef]
  29. Li, W.; He, M.; Cai, T. Low-carbon economic dispatch of hydrogen-containing integrated energy system considering stepped demand response. Energy Rep. 2024, 11, 4222–4232. [Google Scholar] [CrossRef]
  30. Zheng, B.; Hou, X.; Xu, S.; Zhang, Y.; Wang, L.; Liu, C.; Zhao, H. Strategic optimization operations in the integrated energy system through multitime scale comprehensive demand response. Energy Sci. Eng. 2024, 12, 2236–2257. [Google Scholar] [CrossRef]
  31. Meng, Z.; Dong, F.; Chi, L. Optimal dispatch of integrated energy system with P2G considering carbon trading and demand response. Environ. Sci. Pollut. Res. 2023, 30, 104284–104303. [Google Scholar] [CrossRef]
  32. Tang, J.; Liu, J.; Sun, T.; Zhang, H.; Wang, Y.; Chen, L.; Yang, X. Multi-time-scale optimal scheduling of integrated energy system considering demand response. IEEE Access 2023, 11, 135891–135904. [Google Scholar] [CrossRef]
  33. Luo, Y.; Hao, H.; Yang, D.; Li, X.; Wu, Z.; Zhang, F.; Wang, L. Multi-objective optimization of integrated energy systems considering ladder-type carbon emission trading and refined load demand response. J. Mod. Power Syst. Clean Energy 2023, 12, 828–839. [Google Scholar] [CrossRef]
  34. Li, Y.; Li, R.; Shi, L.; Wang, C.; Zhang, X. Adjustable capability evaluation of integrated energy systems considering demand response and economic constraints. Energies 2023, 16, 8048. [Google Scholar] [CrossRef]
  35. Ma, C.; Hu, Z. Low-carbon economic scheduling of integrated energy system considering flexible supply-demand response and diversified utilization of hydrogen. Sustainability 2025, 17, 1749. [Google Scholar] [CrossRef]
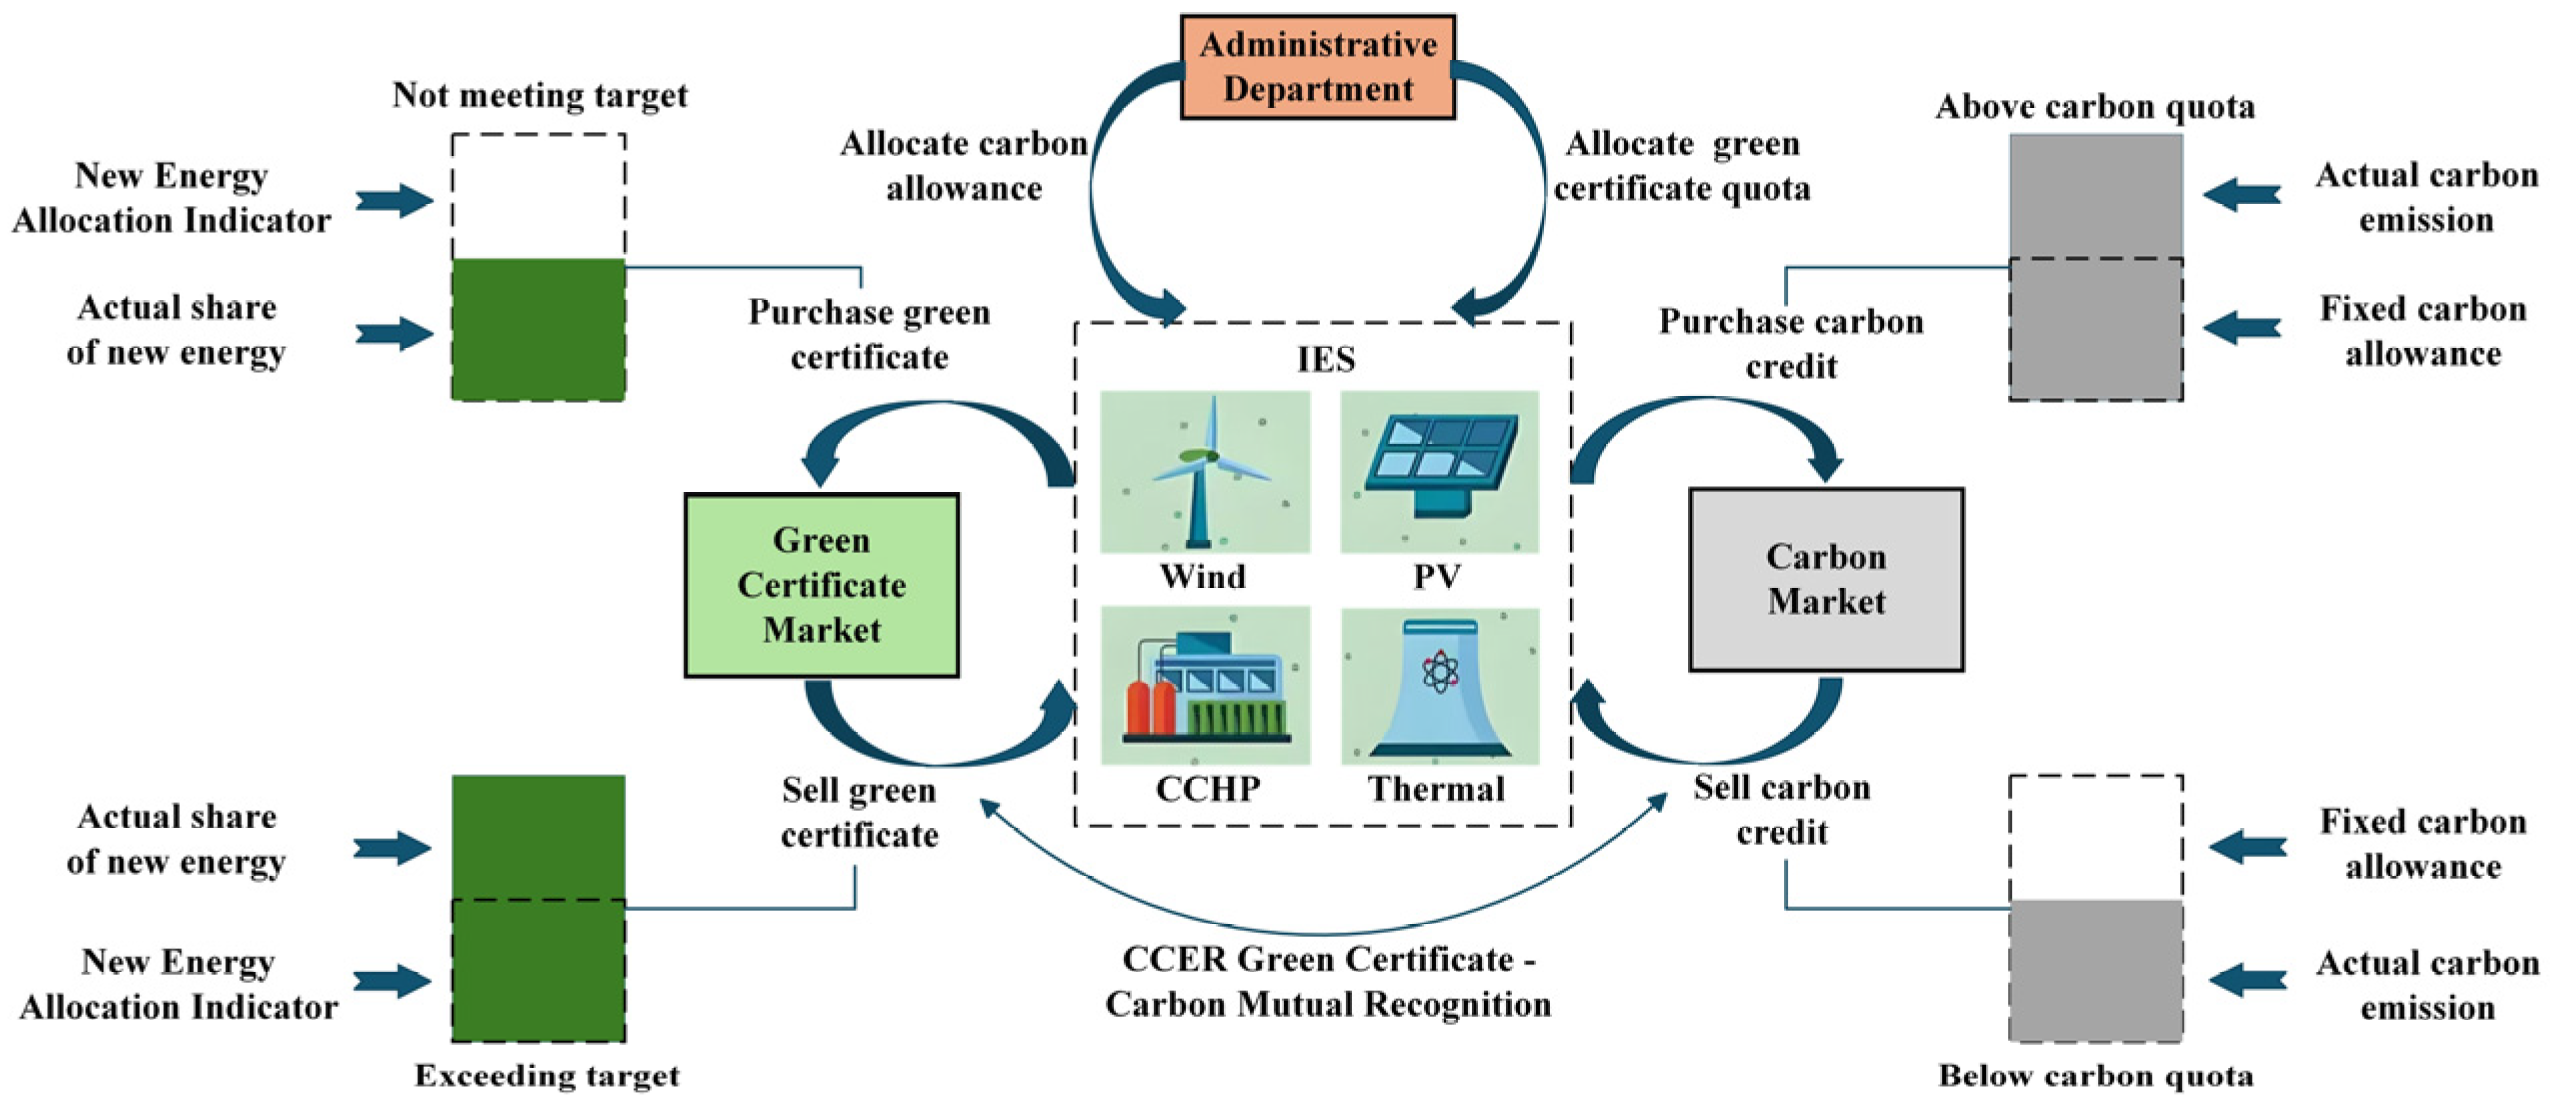
Figure 1. Green certificate–carbon joint trading model.
Sustainability 17 08899 g001
Figure 2. Structure diagram of integrated energy system.
Sustainability 17 08899 g002
Figure 3. Multi-timescale scheduling strategy.
Sustainability 17 08899 g003
Figure 4. BYD charging and discharging power.
Sustainability 17 08899 g004
Figure 5. Curves before and after BYD’s participation.
Sustainability 17 08899 g005
Figure 6. BMW charging and discharging power.
Sustainability 17 08899 g006
Figure 7. Curves before and after BMW’s participation.
Sustainability 17 08899 g007
Figure 8. Nissan charging and discharging power.
Sustainability 17 08899 g008
Figure 9. Curves before and after Nissan’s participation.
Sustainability 17 08899 g009
Figure 10. Intraday gas balance.
Sustainability 17 08899 g010
Figure 11. Power curves for abandoned new energy.
Sustainability 17 08899 g011
Figure 12. Intraday carbon capture volume.
Sustainability 17 08899 g012
Figure 13. Energy demand response curves for various energy sources.
Sustainability 17 08899 g013
Table 1. System parameters.
FormulaNumerical ValueFormulaNumerical ValueFormulaNumerical ValueFormulaNumerical Value
a 0.00033 P C C S min 0 E e min 10 η e i n 0.92
b 16.7 P C C S max 400 E e max 800 η e o u t 0.92
c 890 P P 2 G min 0 E h min 10 η h i n 0.95
P C C H P min 200 P P 2 G max 300 E h max 600 η h o u t 0.95
P C C H P max 500 P E B min 0 E c min 10 η c i n 0.96
H G B min 50 P E B max 100 E c max 550 η c o u t 0.96
H G B max 400 P E C min 0 E g min 10 η g i n 0.94
C A C min 0 P E C min 200 E g max 750 η g o u t 0.94
C A C max 300
Table 2. Costs during day-ahead stage.
Day-Ahead Costs/YuanScenarios
1234
Total3,308,602.19023,178,548.82472,869,491.01962,845,294.0451
Coal consumption1,782,701.25331,665,088.61321,769,101.64591,689,070.8571
Start-stop89,674.646490,870.308487,881.153588,837.683
Wind power curtailment4430.3132405.368600
Abandoned photovoltaic2512.89561209.37500
Green certificate–carbon joint00−528,682.7552−542,965.7424
Purchase1,395,970.17591,327,779.16681,438,416.61621,344,359.9088
DR call000163,840.5373
Daily depreciation33,312.90632,535.928637,974.770434,963.9829
Charging and discharging compensation058,660.064264,799.578956,657.4737
Table 3. Intraday stage costs.
Intraday Costs/YuanScenarios
1234
Total3,253,261.13863,112,109.5082,778,761.60732,741,305.2372
Coal consumption1,798,454.22681,684,731.41511,788,427.96641,691,084.0524
Deadweight22,388.77015578.5103530.845153.2271
Wind power curtailment4434.84982530.51700
Abandoned photovoltaic2521.81221215.206400
Green certificate–carbon joint00−535,402.3241−543,638.8248
Purchase1,392,051.45161,324,739.67951,422,971.25381,339,330.5876
DR call cost000162,839.8771
Daily depreciation33,410.028133,376.035437,294.915134,876.573
Charging and discharging compensation059,938.144364,938.95156,759.7448
Table 4. Real-time stage costs.
Real-Time Costs/YuanScenarios
1234
Total3,208,027.4023,112,262.60162,751,033.70282,722,225.8371
Coal consumption1,763,133.11281,679,983.1741,758,867.17361,678,414.2587
Deadweight22,645.11275674.5475574.616563.7128
Wind power curtailment4513.81122573.477300
Abandoned photovoltaic2486.16651200.719900
Green certificate–carbon joint00−538,757.3568−544,455.1625
Purchase1,381,839.17061,329,145.4741,427,959.33281,334,742.1386
DR call000162,171.4956
Daily depreciation33,410.028133,701.394737,362.900735,070.8173
Charging and discharging compensation059,983.814465,027.036156,218.5765
Disclaimer/Publisher’s Note: The statements, opinions and data contained in all publications are solely those of the individual author(s) and contributor(s) and not of MDPI and/or the editor(s). MDPI and/or the editor(s) disclaim responsibility for any injury to people or property resulting from any ideas, methods, instructions or products referred to in the content.