Article

The Variability in the Thermophysical Properties of Soils for Sustainability of the Industrial-Affected Zone of the Siberian Arctic

by
Tatiana V. Ponomareva
1,2,
Kirill Yu. Litvintsev
3,
Konstantin A. Finnikov
4,
Nikita D. Yakimov
5,
Georgii E. Ponomarev
2 and
Evgenii I. Ponomarev
1,2,*
1
V.N. Sukachev Institute of Forest, Federal Research Center “Krasnoyarsk Science Center of the Siberian Branch of the Russian Academy of Sciences”, Krasnoyarsk 660036, Russia
2
Institute of Ecology and Geography, Department of Ecology and Environment, Siberian Federal University, Krasnoyarsk 660041, Russia
3
Kutateladze Institute of Thermophysics, Siberian Branch of the Russian Academy of Sciences, Novosibirsk 630090, Russia
4
Institute of Engineering Physics and Radio Electronics, Department of Thermophysics, Siberian Federal University, Krasnoyarsk 660074, Russia
5
Laboratory of Remote Sensing Systems, Federal Research Center “Krasnoyarsk Science Center of the Siberian Branch of the Russian Academy of Sciences”, Krasnoyarsk 660036, Russia
*
Author to whom correspondence should be addressed.
Sustainability 2025, 17(19), 8892; https://doi.org/10.3390/su17198892
Submission received: 29 August 2025 / Revised: 26 September 2025 / Accepted: 1 October 2025 / Published: 6 October 2025
(This article belongs to the Special Issue Land Use Strategies for Sustainable Development)

Abstract

The sustainability of Arctic ecosystems that are extremely vulnerable is contingent upon the state of cryosoils. Understanding the principles of ecosystem stability in permafrost conditions, particularly under external natural or human-induced influences, necessitates an examination of the thermal and moisture regimes of the seasonally thawed soil layer. The study concentrated on the variability in the soil’s thermophysical properties in Central Siberia’s permafrost zone (the northern part of Krasnoyarsk Region, Taimyr, Russia). In the industrially affected area of interest, we evaluated and contrasted the differences in the thermophysical properties of soils between two opposing types of landscapes. On the one hand, these are soils that are characteristic of the natural landscape of flat shrub tundra, with a well-developed moss–lichen cover. An alternative is the soils in the landscape, which have exhibited significant degradation in the vegetation cover due to both natural and human-induced factors. The heat-insulating properties of background areas are controlled by the layer of moss and shrubs, while its disturbance determines the excessive heating of the soil at depth. In comparison to the background soil characteristics, degradation of on-ground vegetation causes the active layer depth of the soils to double and the temperature gradient to decrease. With respect to depth, we examine the changes in soil temperature and heat flow dynamics (q, W/m2). The ranges of thermal conductivity (λ, W/(m∙K)) were assessed using field-measured temperature profiles and heat flux values in the soil layers. The background soil was discovered to have lower thermal conductivity values, which are typical of organic matter, in comparison to the soil of the transformed landscape. Thermal diffusivity coefficients for soil layers were calculated using long-term temperature monitoring data. It is shown that it is possible to use an adjusted model of the thermal conductivity coefficient to reconstruct the dynamics of moisture content from temperature dynamics data. A satisfactory agreement is shown when the estimated ( W c a l c , %) and observed ( W e x p , %) moisture content values in the soil layer are compared. The findings will be employed to regulate the effects on landscapes in order to implement sustainable nature management in the region, thereby preventing the significant degradation of ecosystems and the concomitant risks to human well-being.

1. Introduction

Soil cover in the continuous permafrost zone north of 67° N in Central Siberia is created under a wide range of ecological and natural circumstances. The presence of permafrost is the main natural factor that controls and limits the formation of soil in the region. At the same time, the long-term dynamics of physical properties, the thermal and moisture regimes of soils, and the patterns of seasonal thawing are all influenced by global climate change [1,2,3].
According to the results of 2D numeric simulations [4], which assessed the impact of four climate scenarios (SSP1-2.6, SSP2-4.5, SSP3-7.0, and SSP5-8.5) on permafrost dynamics within the continuous permafrost zone of Siberia, the mean ground temperature will increase from +1.4 °C to +5.2 °C between 2014 and 2100. The tundra of Western Siberia had the fastest rates of permafrost warming, with temperatures rising up to 0.056 °C yr−1 despite variability in vegetation and soil characteristics. Conversely, the northern taiga experienced the lowest warming rates (0.035 °C yr−1). Southern tundra and mixed forest–tundra experienced relatively moderate permafrost warming, with rates ranging from 0.04 °C to 0.05 °C yr−1 [5]. In consequence, the active layer thickness in Siberia is expected to increase between 2014 and 2100 in all climate scenarios. SSP1-2.6 results in a +14 % increase in the norm under current conditions, whereas the hottest scenario (SSP5-8.5) results in a more dramatic 61–65% increase [4].
The Arctic’s rapid industrial development must also be considered at this time, as it contributes to the artificial alteration of the cryolithozone’s landscapes across the northern hemisphere [6]. This issue is also pertinent to the Arctic region of Siberia, where active human-made intervention has been ongoing for more than seven decades [7]. The effect of these impacts frequently shows up as notable alterations at both the landscape and ecosystem levels [8]. It is reasonable to assume that external factors increase the variability of the state and thermophysical properties of soils in the region, necessitating a comprehensive investigation as soils are the foundation of the sustainability of cryolithozone ecosystems.
Siberia currently lacks a comprehensive system for monitoring the condition of cryosoils and permafrost. The properties and characteristics of frozen soils and the seasonally thawed layer in the Arctic sub-regions of Siberia are the subject of only a few individual publications [9,10,11]. These publications demonstrate the local features of soil thermal profiles and the level of seasonal thawing. Due to the inaccessibility of specific regions, it is imperative to implement the indirect technique of soil characteristics. Because the condition of the vegetation cover, which serves as a heat-insulating layer, largely determines changes in the thermophysical characteristics of cryolithozone soils, this strategy may be successful. For these purposes, it is feasible to evaluate changes in vegetation cover and the extent to which the landscape deviates from the background state characteristics of cryolithozone conditions using remote sensing and spectral indices based on satellite data [12]. Although on-ground temperature modeling from satellite data is a well-known task, sub-ground temperature as well as active layer thickness cannot be directly captured with remote sensing in optical range. According to a review by Philipp et al., 2021 [13], more than half (55%) of permafrost-related studies applied optical imagery, followed by Synthetic Aperture RADAR (SAR) scenes (20%). Thus, the Interferometric Synthetic Aperture Radar (InSAR) images were useful for the freeze–thaw of Cryosols deformation responses to wildfires [14] or for the long-term monitoring of regional permafrost thaw [15]. Spectral indices from optical data of Landsat evaluated Arctic peatland’s state dynamics in the study of Crichton et al., 2025 [16]. The monitoring of related surface features and landscape changes are issues for further investigation with satellite data, which could be implemented for simulating solves. These issues have been well-summarized by Bartsch at al., 2023 [17].
In the present study, based on the variability of external features that characterize the state of landscapes within the Norilsk industrial region (Krasnoyarsk Region, Taimyr, Russia), we evaluated the differences in soil characteristics, comparing them to two contrasting variants that are present in the area of interest. On the one hand, these are soils that are characteristic of the natural landscape of flat shrub tundra with a well-developed moss–lichen cover. An alternative is the soils in the landscape, which have shown signs of substantial degradation in the vegetation cover due to both natural and human-induced factors. The soil profile of these sites is characterized by a reduced thickness of the organogenic horizon. Within the study area, the percentage of territory exhibiting signs of transformation as a result of human-made and aerotechnogenic impacts varies from 5% in the background area to 77% in areas with transformation [18].
In forest and tundra landscapes, the permafrost has a thick transition layer that acts as a high heat capacity buffer to stop deep thawing and heat penetration [19]. The permafrost stability necessitates a combination of insulating (vegetation cover) and high heat capacity (transition layer) soil layers [20]. Thus, the destruction of vegetation cover and soil structure characteristics could result in the observation of both seasonal thawing anomalies and non-stable thermal profiles in soils. In general, adjustments to the vegetation cover results in a reduction in the accumulation of organic matter in the soil, a reduction in the intensity of metabolic processes, a modification of the hydrothermal regime, and subsequently, a change in soil types [21,22].
It is of great interest to investigate the issue of monitoring and forecasting [10,23] changes in the thermal regime of soils in the cryolithozone that are linked to the transformation of the heat-insulating properties of the soil and vegetation cover [24,25,26]. Both the fundamental characteristics of soil thermal diffusivity and the unique characteristics of permafrost soils should be considered in the proposed solutions [27,28,29].
By utilizing an existing set of external and boundary conditions, numerical methods enable the modeling of soil thermal regimes. Data from in-kind surveys and the satellite monitoring of surface temperature conditions can both be used to calibrate modeling results. Additionally, it is imperative to have numerical solutions for the dynamics of moisture content in soil layers, which is a separate task [4,23]. The thermophysical properties of soils are a critical component in the analysis and modeling of thermal processes in the context of forecasting the sustainability of ecosystems. However, the Siberian Arctic region is particularly lacking in instrumental measurements and the databases of parameters such as thermal diffusivity, thermal conductivity, and heat flow dynamics. Therefore, in this study, we investigate the variations in soil temperature and heat flow dynamics as well as the ranges of thermal conductivity in the soil layers with respect to depth. Moreover, thermal diffusivity coefficients for soil layers were calculated using long-term temperature monitoring data. Finally, we attempt to reconstruct the moisture content dynamics from temperature dynamics data using an adjusted model of the thermal conductivity coefficient.
The novelty of our multidisciplinary study lies in the combined analysis of field instrumental thermophysical measurements, remote landscapes characterization, and the implementation of these data to the numerical simulation of the thermal and humidity characteristics of cryogenic soils in the Siberian Arctic. This work is of significant theoretical and practical importance for the continued sustainable development of the region. The results obtained in this manner can be used as the foundation for a systematic prediction of the thermal and humidity regimes of soils and the seasonal thawing in the cryolithozone in the presence of landscape disturbance.
Thus, the present research objective was to investigate the variation in the thermophysical properties of the soils in the industrial-affected zone of the Siberian Arctic, utilizing a comparison of field measurements, satellite monitoring data, and the outcomes of numerical simulation analysis. We considered the following aspects of the problem:
(i)
The spectral characteristics of the ground cover in order to evaluate the homogeneity of plots and the level of transformation within the plots in comparison to the background landscapes;
(ii)
The range of the soil thermal regime in comparison to the typical disturbed and background landscapes;
(iii)
Changes in the values of the thermal conductivity coefficient calculated from the field measurement data of vertical profiles of temperature and heat flow;
(iv)
Changes in the values of the thermal diffusivity coefficient and moisture content determined by numerical methods using long-term temperature observation data.

2. Materials and Methods

2.1. Territory of Research

Field soil surveys were carried out in the north of Central Siberia (69° N, 87° E) in the Norilsk industrial region (the northern part of Krasnoyarsk Region, Taimyr, Russia). The study area is located at the intersection of the Central Siberian Plateau and North Siberian lowland. The western part of the region is characterized by a foothill in the aqua glacial hilly upland that reaches absolute elevations of 100 to 200 m [30,31,32]. The Putorana Plateau mountains encircle the region from the east. Divided into river valleys and lake basins, the region is characterized by a flat, terraced surface [33]. The forest–tundra and tundra landscapes in the study area were formed under conditions of consistent distribution of permafrost (PMF).
The region is characterized by a subarctic climate with long, cold winters and short summers. The average annual air temperature is –9.7 °C; the average amount of precipitation is about 440 mm per year. The period of intensive vegetation, which corresponds to a temperature of more than +10 °C, is approximately 60 days, while the growing season with a temperature surpassing +5 °C does not exceed 80–90 days.
A series of field experiments were carried out in the study region in 2022–2025 (Figure 1). In total, we investigated 9 sites during field trips. We created three to four soil pits per site, taking into account the heterogeneity of the vegetation cover. For each site, the most typical soil profiles were selected to measure thermophysical properties. For this study, we selected two landscapes that share similar soil formation conditions but exhibit significantly different soil morphological characteristics from the diverse landscapes that were examined. These two flat tundra sites are characterized by the prevalence of the most common cryogenic soil types in the region. The thermophysical properties of the background landscape soil were determined through measurements conducted at the Boganida River test site (SB). To investigate the thermophysical properties of soil in an industrial-affected landscape, data from the Ambarnaya River test site (SA) were utilized (Figure 1). We took measurements at two different locations at the SA test site, which showed high mosaicity of the on-ground vegetation. Observation point 1 (SA1) was for soil with a mineralized top layer, devoid of vegetation, and observation point 2 (SA2) was for soil beneath the non-disturbed vegetation.

2.2. Vegetation

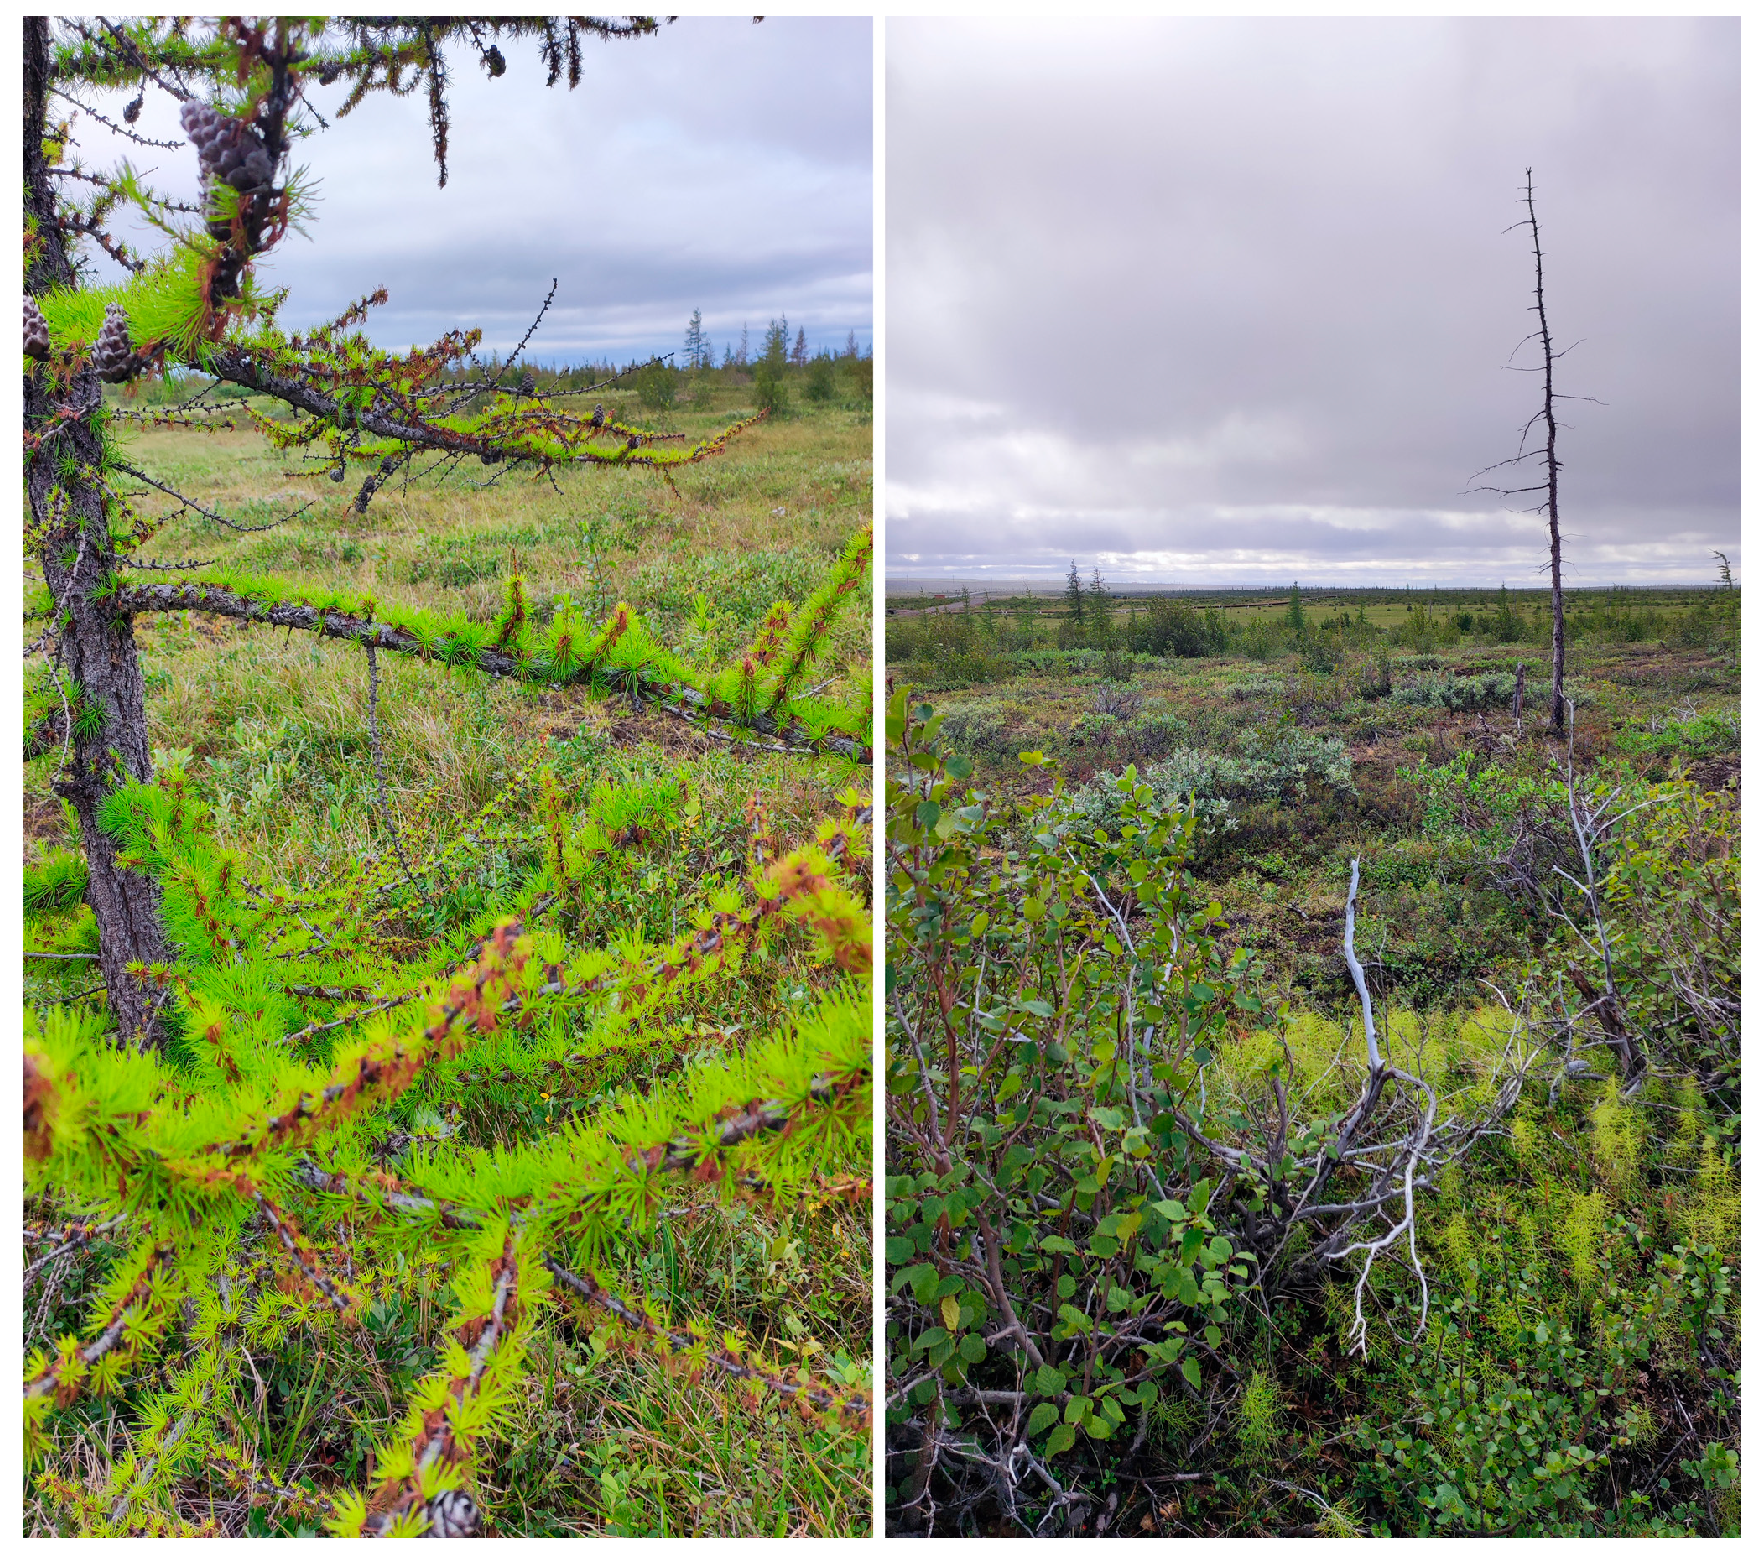
The background landscapes are characterized by low-growing birch (Betula nana) and sparse larch (Larix gmelinii) curtains, which are interspersed with a long moss–sphagnum and sedge–dwarf shrub layer and grass–lichen–moss bogs. The vegetation in industrial-affected areas exhibits signs of severe degradation as a result of the predominant type of impact, which is air pollution from enterprise emissions [21,22]. This is apparent in the replacement of typical moss and lichen species with grass and forb–grass groups, the severe damage to the shrub layer and living ground cover, and the drying out of the tree layer. These attributes, which suggest a significant alteration of the original ecosystems, are indicative of the transformed area (SA) that was examined (Figure 2).
During the field expeditions, no fire impact signs were recorded for these sites. Information regarding fires within the sites is absent from the satellite monitoring fire data bank for 1996–2024 [34]. In this instance, the fire factor was not regarded as a contributing factor to the destruction of on-ground vegetation.

2.3. Soils

Quaternary deposits are extensively developed in the flat part of the study area. The depth of loose deposits exceeds 100 m. These types of deposits include glacial, fluvio–glacial, lacustrine–glacial, alluvial, proluvial, and eluvial–deluvial formations. Their composition is primarily composed of clays, sandy loams, sands, boulder loams, and pebbles.
The territory under consideration is dominated by cryoturbated soils (Cryosols), which are the result of permafrost occurring in close proximity to the surface (seasonal thawing depth is ~100 cm). The soils that primarily distributed on northern-facing slopes and lower parts of southern-facing slopes, as well as river and lake terraces, are known as cryozems (Turbic Cryosols) and peat cryozems (Histic Cryosols). They are formed on stony and homogeneous trap rocks, surrounded by shrub–green moss–lichen and shrub–green moss and shrub–moss vegetation.
The soils under investigation are classified as cryogenic and possess a comparable distribution of mineral horizons. The soil types are distinguished based on the thickness of the organic horizon. Histic Cryosols have an organic horizon thickness of 20 cm, while Turbic Cryosols have an organic horizon thickness of less than 10 cm. In this case, the organic horizon has changed a lot over the more than 30-year period of aerotechnogenic impact in the SA area, including a reduction in thickness and compaction as a result of the destruction of organic matter from the surface. It is conceivable that the organic horizons of soils being studied were more similar prior to the onset of technogenic impact.
Data on the content of sulfur and heavy metal in soils has been presented in previous studies conducted throughout the ecosystems of the Norilsk Industrial Region [8,21,35,36,37]. These findings indicate that the soils at the SB site have a background level of heavy metal content, whereas the soils at the SA site have an elevated content.

2.4. Methods

Preliminary overview classifications of the study areas were performed using satellite data of medium spatial resolution (15–100 m) Landsat–8 OLI/TIRS (Operational Land Imager/Thermal Infrared Sensor), which are freely available in The United States Geological Survey (USGS) catalogs (https://earthexplorer.usgs.gov, accessed on 25 August 2025) [38]. To obtain an expert opinion on the state of the landscapes, we analyzed images in combination of Landsat-8/OLI channels B4-B3-B2 (natural colors) and B6-B5-B4 channels. Landsat-8 OLI/TIRS channels have the following wavelength (in µm): 0.43–0.45 for B1 (Aerosol); 0.45–0.51 for B2 (Blue); 0.53–0.59 for B3 (Green); 0.64–0.67 for B4 (Red); 0.85–0.88 for B5 (Near-Infrared); 1.57–1.65 for B6 (SWIR1, Short-Wavelength Infrared); 2.11–2.29 for B7 (SWIR2, Short-Wavelength Infrared); and 10.6–11.19 for B10 (TIR1, Long-Wavelength Infrared). Spatial resolution is equal to 100 m for the B10 channel and 30 m for the other channels.
We use data from the Level-1 Data Products Landsat Collections. The images in these data products have been scaled to 55,000 gray levels and were calibrated to the Top of Atmosphere (TOA) spectral radiation using radiometric coefficients provided in the Landsat file’s product metadata. Obtained TOA spectral radiance values are measured in W/(m2·sr·μm) (https://www.usgs.gov/landsat-missions/using-usgs-landsat-level-1-data-product, accessed on 25 August 2025) [39].
To classify Landsat images, we used the GIS package Quantum GIS (Geographic Information System, ver. 3.16.3, https://www.qgis.org, accessed on 1 August 2025) [40] and standard Maximum Likelihood Classification method. For the classification process, a set of raster bands consisting of channels B1–B7 and standard spectral indices NDVI (the normalized difference in vegetation index) and LST (land surface temperature) were employed. To generate training signatures, we utilized field observation data and medium/high-resolution data from Landsat/WorldView-4. Furthermore, we implemented spectral indices in conjunction with expert evaluation of landscapes within the study area. Landscape states were classified into four primary categories: background shrub tundra, disturbed tundra, sparse tree stands, and technogenic plots.
Calibrated data from the B10 channel (Landsat-8/TIRS) was employed to investigate the underlying surface temperature within the experimental plots area. Additionally, we used data from channels B2–B7 to generate spectrograms for each of the identified classes of surface conditions in the SA and SB plots.
Comparative morphogenetic methods and laboratory processing were used to characterize the soil profiles. The soil’s texture was identified using the Kachinskii classification [41]. Soil analysis was performed using well-known methods. Organic matter (OM) content of a soil sample in organic horizons was obtained by loss on ignition [42]. Organic matter in mineral horizons was determined using Walkley-Black method [43]. The bulk density (BD) of the soil was evaluated as the weight of the dry soil per unit volume of soil, which encompasses both solid particles and pore spaces. The BD was determined by collecting core samples in the field measurements using a metal cylinder of known volume (Core method). The specific density (SD) is the ratio of the solid phase of the soil in the dry state to the weight of water of equal volume. Thus, it is the weight in grams of one cubic centimeter of the solid phase of dry soil, indicating the density of the solid phase of the soil. The soil moisture content (MC) was calculated by dividing the weight of water by the weight of dry soil. The physical clay (PC) was defined as a finely dispersed fraction of the soil, with particles smaller than 0.01 mm in diameter. The grain size distribution was determined by pipette method [44].
The moisture content was determined using a weight method for each of the identified soil layers. Soil temperature measurements were conducted along the soil profile using contact method. With a step of 5–10 cm, the set of temperature sensors were inserted into the soil pit wall (Figure 3a). The temperature measurements were collected at depths as low as the permafrost boundary. Another set of temperature measurements was conducted for an extended period (36 days) at four distinct depths (ranging from 0 to 30 cm) with a temporal interval of 10 min. The EClerk data logger’s sensors were vertically inserted into the soil at varying depths. The 10 min interval between temperature measurements was less than the characteristic time of the temperature field change at the depths of sensor installation (5 cm and more) and provided the necessary detail of the time series, which was subsequently used to estimate thermal diffusivity coefficients for soil layers.
Heat fluxes in the soil profile were measured by the heat flux density meter ITP-MG4.03/5(III) “POTOK” (OOO SKB Stroypribor, Chelyabinsk, Russia) and TEMPOS Thermal Properties Analyzer (METER Group, Pullman, WA, USA) thermophysical properties measuring device. The sensors were installed into the wall of the soil pits. Three separate measurements were conducted to determine the heat flow density (q, W/m2) of each layer in a soil profile. At the SA test site, we took measurements at two different locations for soil with a mineralized top layer, devoid of vegetation (SA1) and for soil beneath the non-disturbed vegetation (SA2). For SA1 soil, measurements were conducted at 10, 20, and 30 cm depth, while for SA2 soil, measurements were made at 15, 20, and 30 cm depth. These datasets were used to verify the modeling outcomes. The measurements were conducted in June, August 2023, and July 2024.
The subsequent step involved estimating the thermal conductivity by utilizing the heat flux density values and temperature profiles data. The calculations were executed utilizing the following:
λ = q / d T h d h
where λ is the thermal conductivity (W/(m·K)), h is the depth (m), and T h is the result of quadratic interpolation of the measured temperature profile.
Furthermore, λ may be represented as follows within the context of Kersten’s thermal conductivity model [45]:
λ = K e λ s a t + 1 K e λ d r y , λ s a t = λ s 1 θ s λ w θ s
where Ke is the Kersten number; λ s a t , λ d r y , λ s , and λ w are the values of thermal conductivity coefficients for water-saturated soil, for the dry soil, for the soil solids, and for pure water, respectively; and θ s is the saturated volumetric water content.
Values of λ s and λ d r y were chosen so that the values calculated through (1) matched the measured soil water content.
The initial dataset, which was derived from one-time measurements of soil pits, offers comprehensive information regarding the thermophysical properties of the soil at a specific location. It was crucial to ascertain whether these data agree with the data that can be obtained through the analysis of the temperature dynamics. There are numerous methods that have been developed to determine the thermophysical properties of soil from temporal dependencies of temperature at multiple depths in the absence of alternative data, such as the heat flow density.
It is a well-established fact that the amplitude of temperature oscillations ΔT decreases with depth (coordinate h ) in presence of uniform soil properties and a harmonic time dependence of the surface temperature:
Δ T exp h   π / 2 a τ   ,
where a is the thermal diffusivity and τ is the period of the harmonic time dependency that is equal to 1 day for upper layers of soil. In addition, the phase of the oscillations is altered in accordance with
ϕ = c o n s t h   π / 2 a τ
If the daily temperature oscillations are nearly harmonic, Equations (3) and (4) are employed to determine thermal diffusivity by measuring temperature at various depths. Deviations from harmonic dependencies, such as second harmonics, are considered by proposed enhanced methods [28,46]. However, these methods are ineffective in situations where harmonic dependencies are exceedingly deviant. The values of thermal diffusivity that are determined by (3) and (4) may differ by several dozen percent.
In such circumstances, practical methods of a broader category have been developed as solutions to the inverse problem of heat transfer. A methodology comparable to that of [47] was implemented in the current investigation. The issue is set up as follows.
A set of vertical coordinates is provided for the N points z 1 > z 2 > > z N , where temperature measurements T i m e a s ( t ) are taken over a period of time. The problem of heat conduction is as follows:
C z T t z λ z T z = 0 ,
where C is the volumetric heat capacity, λ is the thermal conductivity and is set on the domain z [ z 1 ; z N ] and augmented with Dirichlet boundary conditions:
T z 1 , t = T 1 m e a s t ,     T z N , t = T N m e a s t .
We seek for the dependencies λ z ,   C z such that
i = 2 N 1 T z i ,   t T i m e a s t 2 d t = m i n ,
with the time integration being conducted over the analyzed time period. The time integration here involves methods of numerical integration of functions with known values in a set of points, as both the T z i ,   t and T i m e a s t are such functions.
The minimum possible value of N is 3. In this case, the measured temperature values in the first and third points are considered as the boundary conditions, while the calculated temperature in the second point is compared to the measured value, thereby minimizing the integral square deviation.
The method’s (Equations (5)–(7)) limitations are as follows:
(1)
The heat transfer process must be nearly one-dimensional, which is accurate in the absence of a sufficient amount of large-scale horizontal heterogeneity in the soil properties and the surface heat flow;
(2)
The soil properties must not undergo abrupt changes in time, but the model is still applicable if there is sufficient spatial dependency.

2.5. The Error Analysis

The instrumental uncertainties of the used measurement devices were ±0.5 °C for the thermometers and temperature loggers and ±0.1 W/m2 for the heat flux meter.
When determining thermal conductivity using heat flow measurements, the main source of error in the results is random measurement error. The heat flow density in the soil varies significantly in the horizontal direction, which is due to random local deviations in the soil structure (the presence of mineral and organic inclusions whose thermal conductivity differs from the average). Heat flow measurements in a given area at the same depth yield results that vary within 10–20%. The heat flow measurement results for a given depth were averaged, and the random error was determined as the product of the standard deviation and Student’s t-value for a confidence level of 0.95. The instrumental measurement error and the error of the correlation created to calculate the temperature gradient also contribute to the error of the thermal conductivity coefficient, but this contribution is significantly smaller.
When determining the thermal diffusivity coefficients by solving the inverse problem, i.e., minimizing the objective function (the expression on the left side of Equation (7)), the error in the result is determined by calculating the covariance matrix for the objective function.

3. Results

3.1. The State of Vegetation in Landscapes

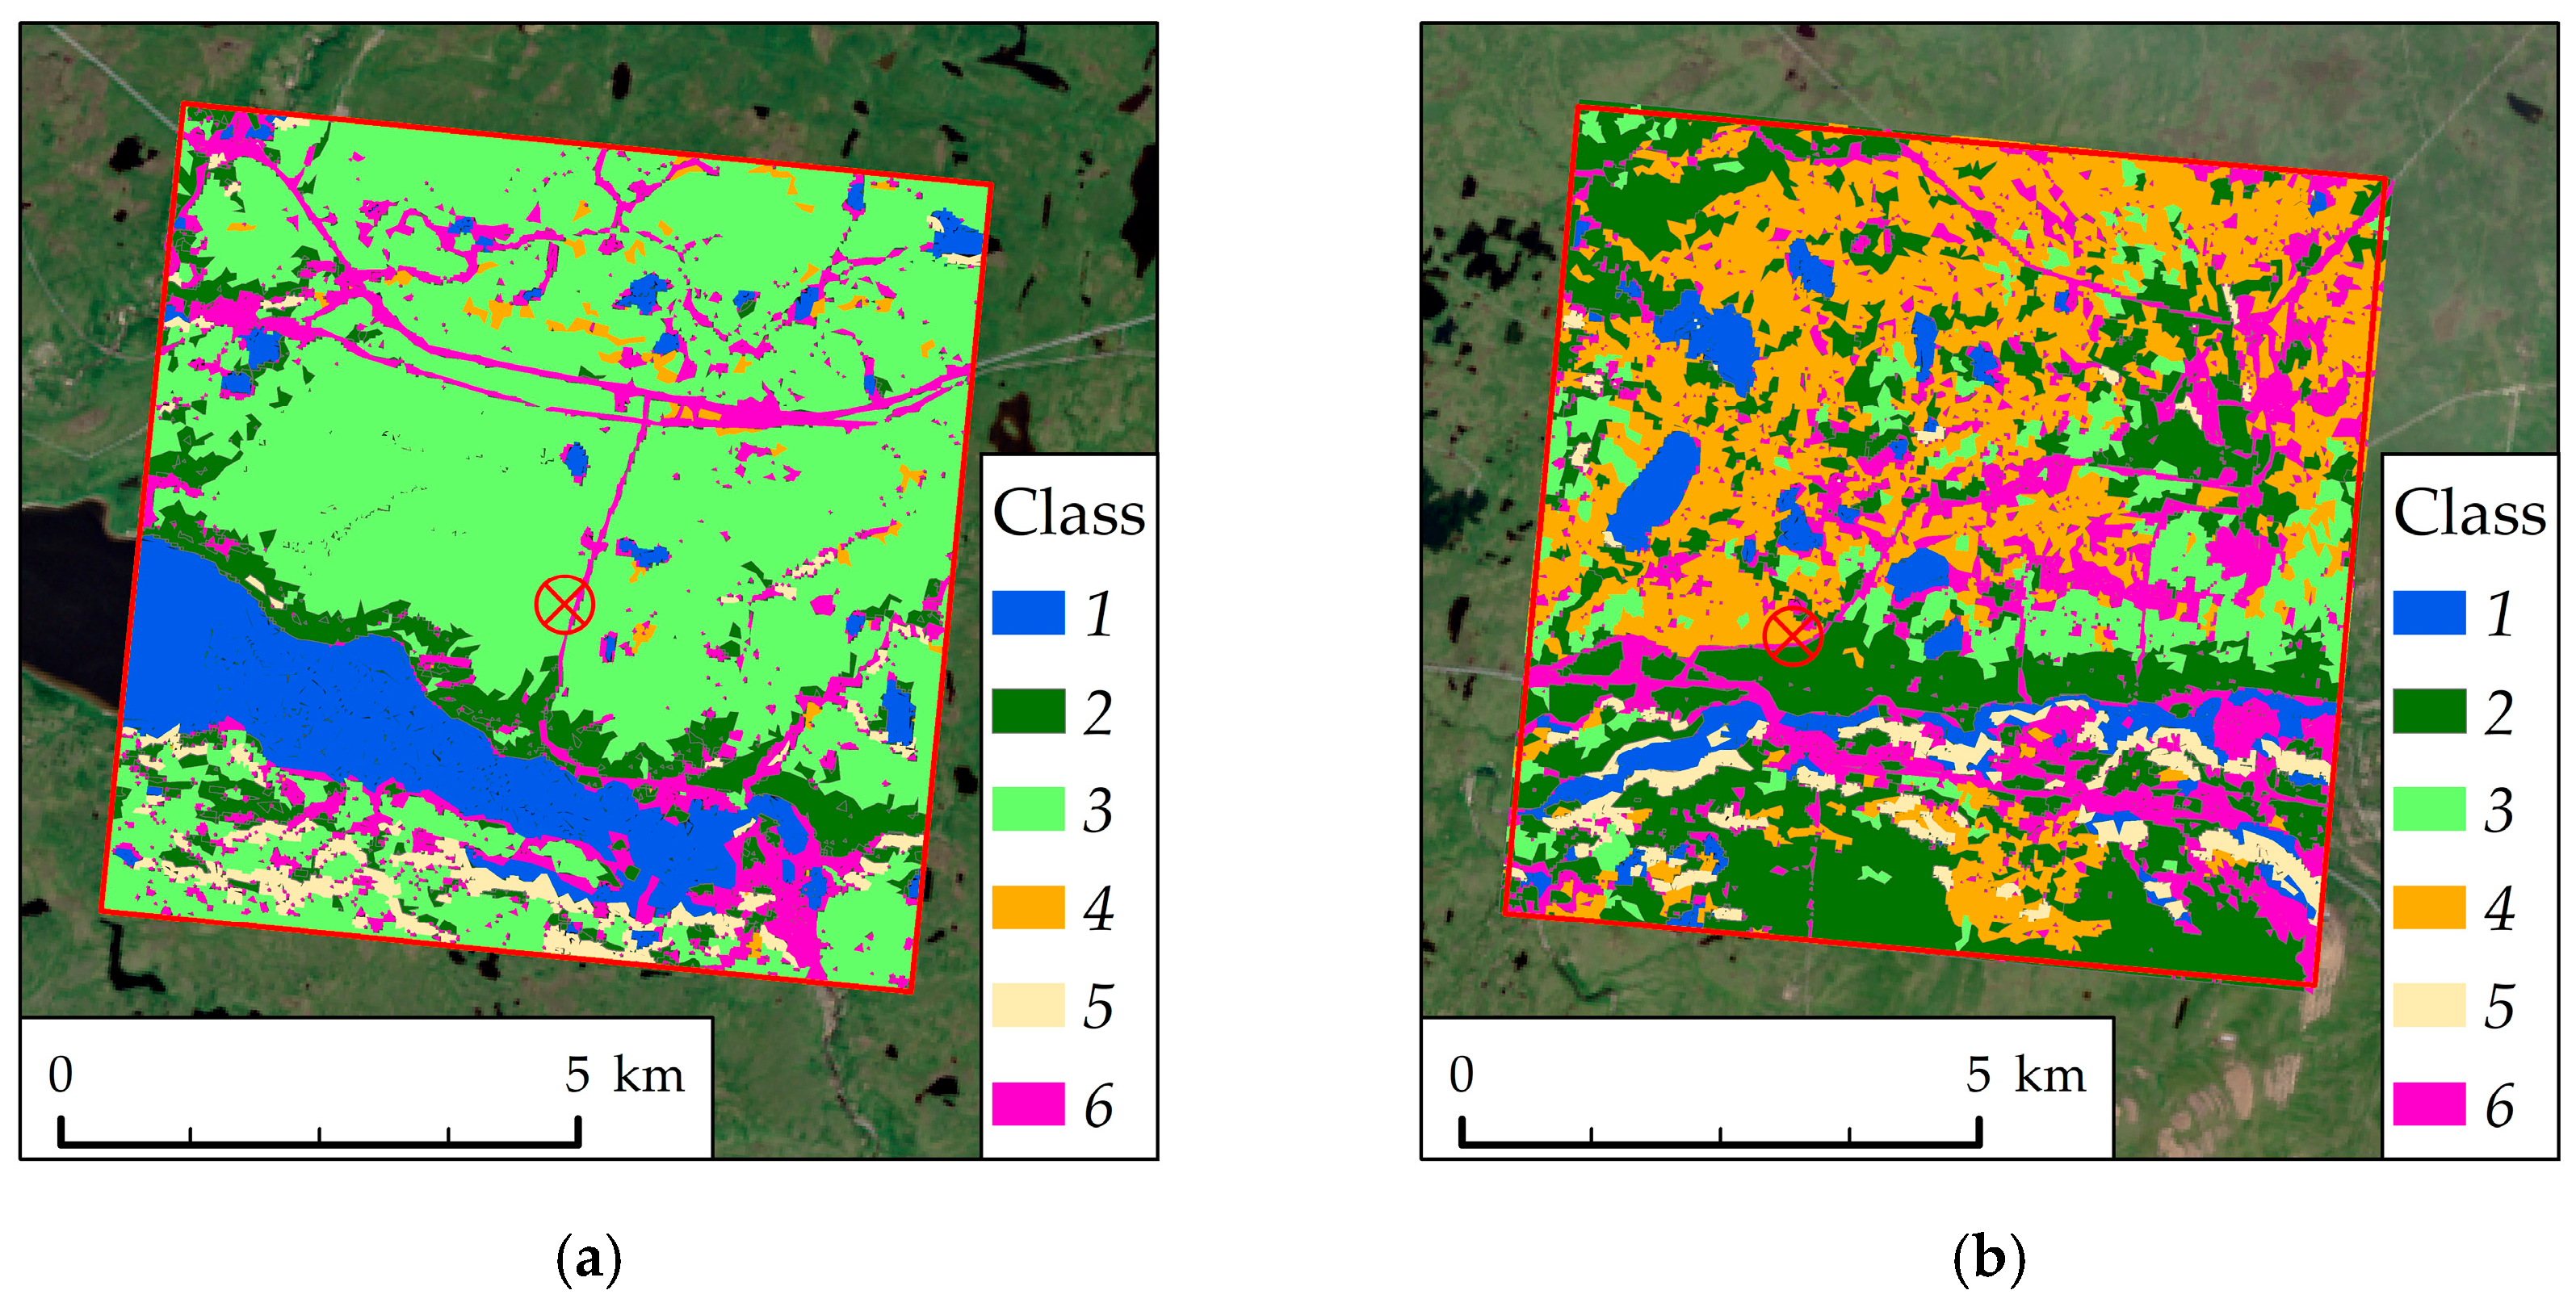
Considering the ratio of vegetation classes, the territory of the SB test site should be attributed to the background plot as a whole (Figure 4a).
The background shrub tundra dominates the background state, occupying over 57% of the SB site area. The transformed tundra class occupies less than 4% of the site’s total area. At the same time, the category of technogenic transformations does not exceed 8% of the SB territory (Table 1). The landscape condition of the SA test plot is significantly different from that of the previous test site. The classes of disturbed tundra vegetation (28% of the area) and technogenic objects (15%) are the most prevalent. Additionally, there is a category of sparse tree stands that take up 33% of the SA site area and up to 12% of the SB plot (Figure 4). Nevertheless, this investigation prioritizes the soil categories associated with tundra vegetation.
Therefore, the SB site should be classified as background in terms of spectral characteristics, whereas the SA site should be classified as a significantly transformed landscape.
The vegetation states in the background territory of the SB test site that have been identified are distinguished by spectral curves that are similar. The differences between spectral curves are within the range of two standard deviations across the entire spectrum (Figure 5a). The class of “technogenic transformation” is used to classify the aerotechnogenic impact on vegetation in the landscape of the SA site (Figure 5b). The spectral curves of the SB and SA neighborhoods do not reveal any substantial differences; however, the degree of mosaicity of the landscapes and the distribution of classes do. The SA landscape is characterized by a high degree of mosaicism, which includes industrial-affected transformations. The background SB site is largely homogeneous (Figure 4).
The primary objective of the Landsat image preprocessing was to evaluate the homogeneity of the territory surrounding the experimental sites. While seasonal variations in spectral classes’ manifestation may occur, the primary objective of satellite image processing was successfully accomplished. The results of classification verify the hypothesis that the SB site is a background area, with over 70% of the territory classified as non-disturbed shrub tundra vegetation and sparse larch stands. Contrarily, the SA site exhibits a significant degree of spectral heterogeneity, which implies that transformed vegetation covers the majority of the surrounding area (approximately 50%).

3.2. The Test Sites’ Soil Characteristics

The examined sites SA and SB are located within the same landscape and are separated by a maximum of 25 km (Figure 1b). The landscape exhibits minimal elevation variation across the flat terrain. According to GMTED (Global Multi-resolution Terrain Elevation Data available at (https://earthexplorer.usgs.gov/, accessed on 20 August 2025), the mean elevations are within the range of 85–120 m. The more precise elevation values for the field experiment locations were 82 m (SB) and 116 m (SA), which were derived from the Copernicus GLO-30 Digital Elevation Model (https://portal.opentopography.org/raster?opentopoID=OTSDEM.032021.4326.3, accessed on 20 August 2025).
The original (for the SB site) or current (for the SA) vegetation cover’s essentially identical composition confirms that the vegetation growth conditions are determined not only by the climate but also by the soils characteristic of the study area. The sites surrounding the research area have also been investigated and described in previous studies in the context of aerotechnogenic dispersion impacts. According to [8,35,36,37,48], site SA is classified within the buffer zone, where the cumulative effects of anthropogenic pressures are not insufficiently studied. Site SB is located at the boundary of the impacted and buffer zones and is characterized by non-significant technogenic landscape modification.
Soils of technogenic landscapes are frequently very diverse, making accurate classification challenging. The WRB framework [49] accommodates technogenic soils primarily through the Technosol Reference Soil Group (RSG). This RSG is specifically designed for soils that are primarily influenced by human activities. However, the soils of aerotechnogenic landscapes do not neatly fit into the Technosol category. Although, they are still predominant, the underlying natural soil properties have been significantly influenced by air pollution. These soils exhibit chemical and physical anomalies, including high pollutant levels, unusual pH-values, and altered water retention and drainage properties.
The classification names of the soils in the regions we examined are the same as those for natural soil types, while it is observed that the morphological properties of soils in organogenic horizons change (as the density and degree of organic matter decomposition increase, the thickness decreases), and the amount of organic matter decreases.
At the Boganida River test site, the soil is represented by gleyic peat cryozems (Histic Cryosols according to WRB [49]) and a profile formula T-CRg-CR┴. In August, at the end of summer, the active layer’s thickness was approximately 45 cm. Three layers of soil are distinguished in the soil profile of the SB site, as follows.
T is located at a depth of 0–20 cm. The layer T is peaty, dark brown, and wet, with plant residues of varying degrees of decomposition intertwined and compacted by the roots of dwarf shrubs. It separates easily from the underlying layer.
CRg is located at a depth of 20–47 cm. This layer is cryogenic, gleyic, grayish-brown with a greenish-gray tint and greenish-rusty spots of gleyization, medium loam, dense, and waterlogged, with plant residues and thin roots. The color of the layer has a gradual transition.
CR┴ is located at a depth of 47–50 cm. This layer exhibits characteristics such as suprapermafrost, cryogenic, gleyic, brown with rusty spots, and medium loam, and it contains numerous plant residues, which results from cryogenic processes. The layer is wet; the cut is flooded with water.
At the Ambarnaya River site, the soil is represented by coarse-humus cryozem (Turbic Cryosols according to WRB [49]) and a profile formula Oao-CR-C. In August, the thickness of the active layer was approximately 90–100 cm. Three layers of soil are distinguished in the soil profile of the SA site, as follows.
Oao is located at a depth of 0–5 cm. The primary features include coarse-humus, which consists of organic matter with varying degrees of decomposition, which is in a mechanical mixture with the mineral components of the layer and is readily separated from them. It is grayish-brown, densely intertwined, and compacted by roots. It is moist. The color transition is sharp.
CR is located at a depth of 5–42 cm. The layer is cryogenic, gray with a brownish tint, turbated, heavy loam, structureless, and wet with thin roots. In a state of dryness, the layer exhibits loos lumpiness. The color transition is barely noticeable.
C is located at a depth of 42–90 cm. This layer exhibits characteristics such as suprapermafrost, cryogenic, gray-brown, somewhat darker than the overlying, heavy loam, and wet with isolated fine roots. In a state of dryness, the layer exhibits loos lumpiness. The soil profile lacks any morphological signs of stable suprapermafrost gleyzation.
The upper organogenic layer is the primary location where the morphological properties of soils in industrial-affected and natural landscapes are mostly evident. The upper horizon’s thickness is significantly reduced due to the reduced supply of fresh organic materials following the death of trees and shrubs, as well as the death of moss–lichen vegetation under the influence of aerotechnogenic factors, such as acidic precipitation and an increase in the concentration of mobile forms of heavy metals. In the disturbed landscape SA, soils are primarily identified as coarse-humus cryozems with an organic layer thickness of 5–7 cm. In contrast, peat cryozems are prevalent in the background SB site, with an upper peat organic layer thickness exceeding 10 cm. A higher density of upper organogenic horizons (0.16 g/cm3) is observed in the soils of the SA area in comparison to the background landscape SB (0.13 g/cm3). The fragmentation of organic matter from the surface and the redistribution of small particles deep into the horizon may be the cause of the compaction of the top layer. The organic matter content of the upper layers of transformed soils is approximately 2-fold lower than that of the background landscape soil of SB with a value of 48%. Compaction of the upper layer may also be ascribed to a reduction in the intensity of the loosening activity of the roots of trees and shrubs. In the upper part of the mineral layer, density fluctuations were also noted. It is likely that the process of cryogenic structuring of soil material is evident to a lesser extent in soils that have been disturbed.
The signs of mineralization in peat soils and soils with a powerful organogenic horizon are a reduction in the content of organic matter in the surface layers. For the background soils in the area of our research, the organic matter content in the upper organogenic horizons is 80–98% (Table 2). A decrease to 48% indicates a strong degree of decomposition of organic residues, which is not typical for the upper layers of peat horizons. This is possible in the absence of fresh litter, which is observed in disturbed areas where the stand, mosses, and lichens have died.
The physical and chemical properties of the soil are indicative of the landscape transformation. In disturbed landscapes, the pH of the water extracts in the upper soil layer may shift upward, potentially as a result of the partial mineralization of organic matter from the surface. A comparable scenario is observed in peat soils during the drainage of peatlands [50]. The moisture content of both the upper organogenic layers and the underlying mineral layers has been observed to decrease in landscapes that have been disturbed. The disruption of vegetation results in the drainage of soil. It has been established [51,52] that the degree and depth of peat mineralization are significantly and consistently inversely correlated with the soil moisture level.

3.3. Field Measurements and Modeling of Temperatures and Heat Flow in Soil

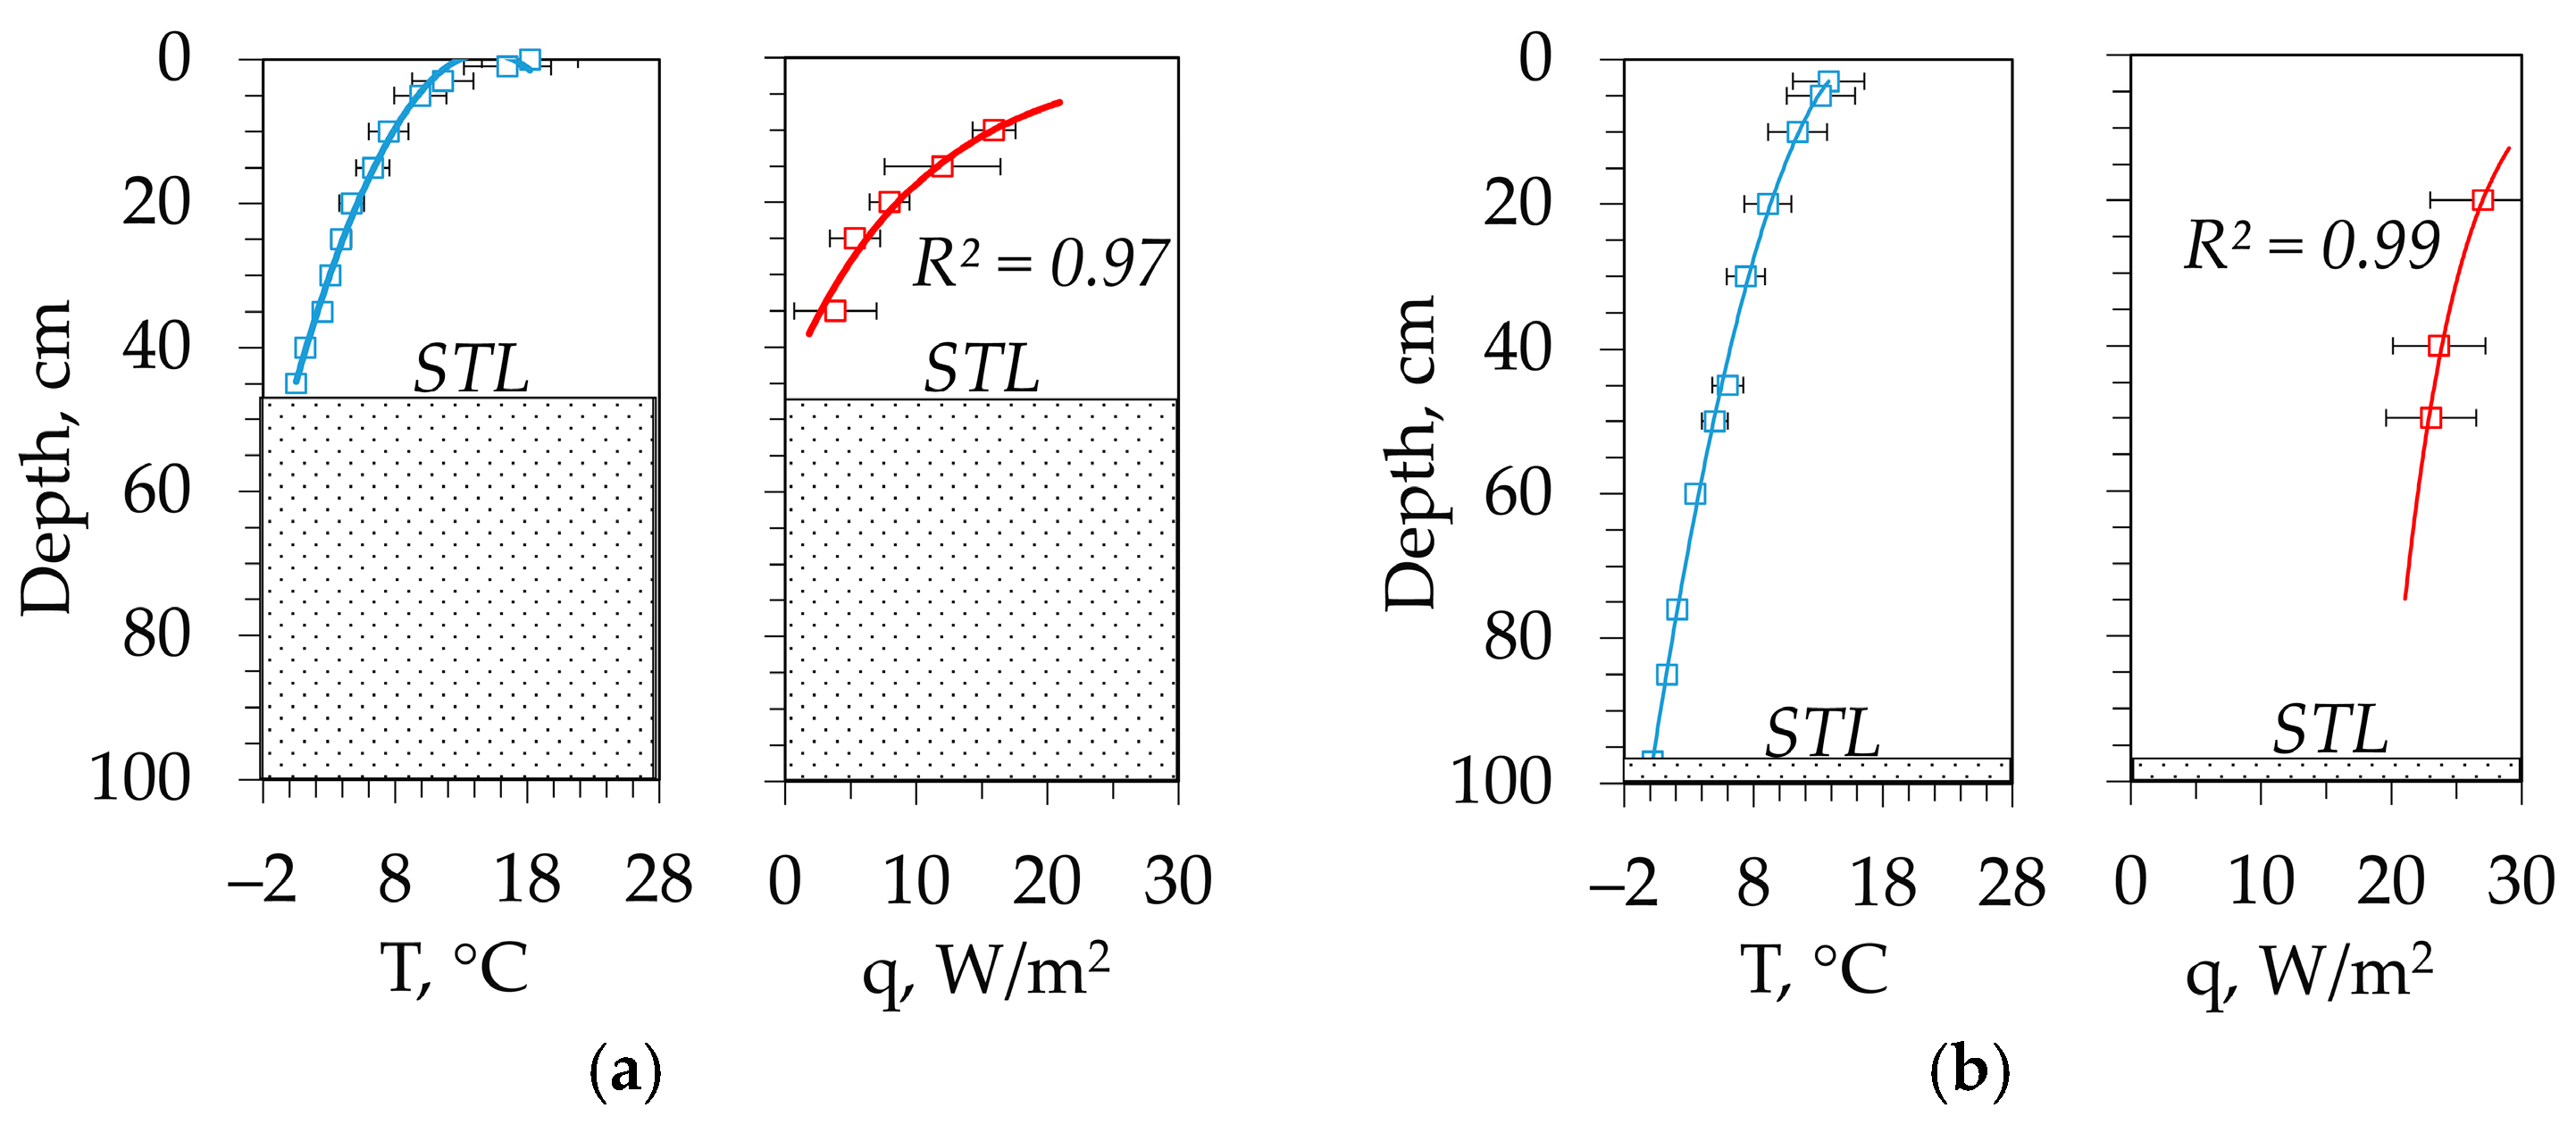
Structural changes in the soils resulted in a significant alteration in heat exchange processes, as evidenced by the temperature and heat flow measurements conducted in the background SB (Figure 6a) and transformed SA landscapes (Figure 6b).
The heat flow value of the 20 cm thick organogenic peat layer in peat cryozems, which is moderately decomposed, is 3.5 times lower than that of the organogenic coarse-humus layer in coarse-humus cryozems, which is 3–5 cm and followed by a mineral layer of loam. Namely, in the upper layer of the peat cryozem, the value of q = 8 W/m2 was discovered at a depth of 20 cm, whereas the value of q = 27 W/m2 was obtained in the coarse-humus cryozem. Values of heat flow decrease exponentially as the depth increases. The exponential function’s approximation (R2) was reliable within the range of 0.87 to 0.99. A rapid decrease in the heat flow is observed as the depth of peat cryozems increases. When the depth is increased from 10 to 35 cm, the heat flux is reduced from 15.3 to 3.8 W/m2, which is approximately four times. For comparison, the heat flow in coarse-humus cryozems did not exceed 15% when the depth was increased from 20 to 50 cm (q ranged from 27.0 to 23.1 W/m2).
For background (SB) and disturbed (SA) landscapes, the thermophysical properties of the soils were ascertained through field measurements of the soil’s temperature and heat flow. For the background landscape’s soil, two interpolation functions were derived. One function described the upper layer T, while the other function described the layer CR (refer to Table 2 for clarification):
T T 1 ( h ) = 80 h 2 53.6 h + c o n s t ,
T C R 1 ( h ) = 14.3 h 2 7.4 h + c o n s t ,
The interpolation function was exclusively applied to the CR layer, as only one soil sample was collected for the technogenic-affected landscape of the SA (see Table 2 for details):
T C R 2 ( h ) = 20 h 2 27.8 h + c o n s t ,
The thermal conductivity coefficients of the upper layers of the background soil pit (T and CR) have been determined in this manner (Table 3), and they are in significant agreement with the model (2), which was based on the thermal conductivity coefficients of soil solids λ s and dry soil λ d r y , as proposed in [25]. The disturbed landscape SA exhibits soils that are denser and more homogeneous, with a thermal conductivity that is significantly higher (Table 4), which means the soil is more mineralized. The depth of soil thawing is significantly increased as a result of the higher thermal conductivity in comparison to the background landscape SB (Figure 6).
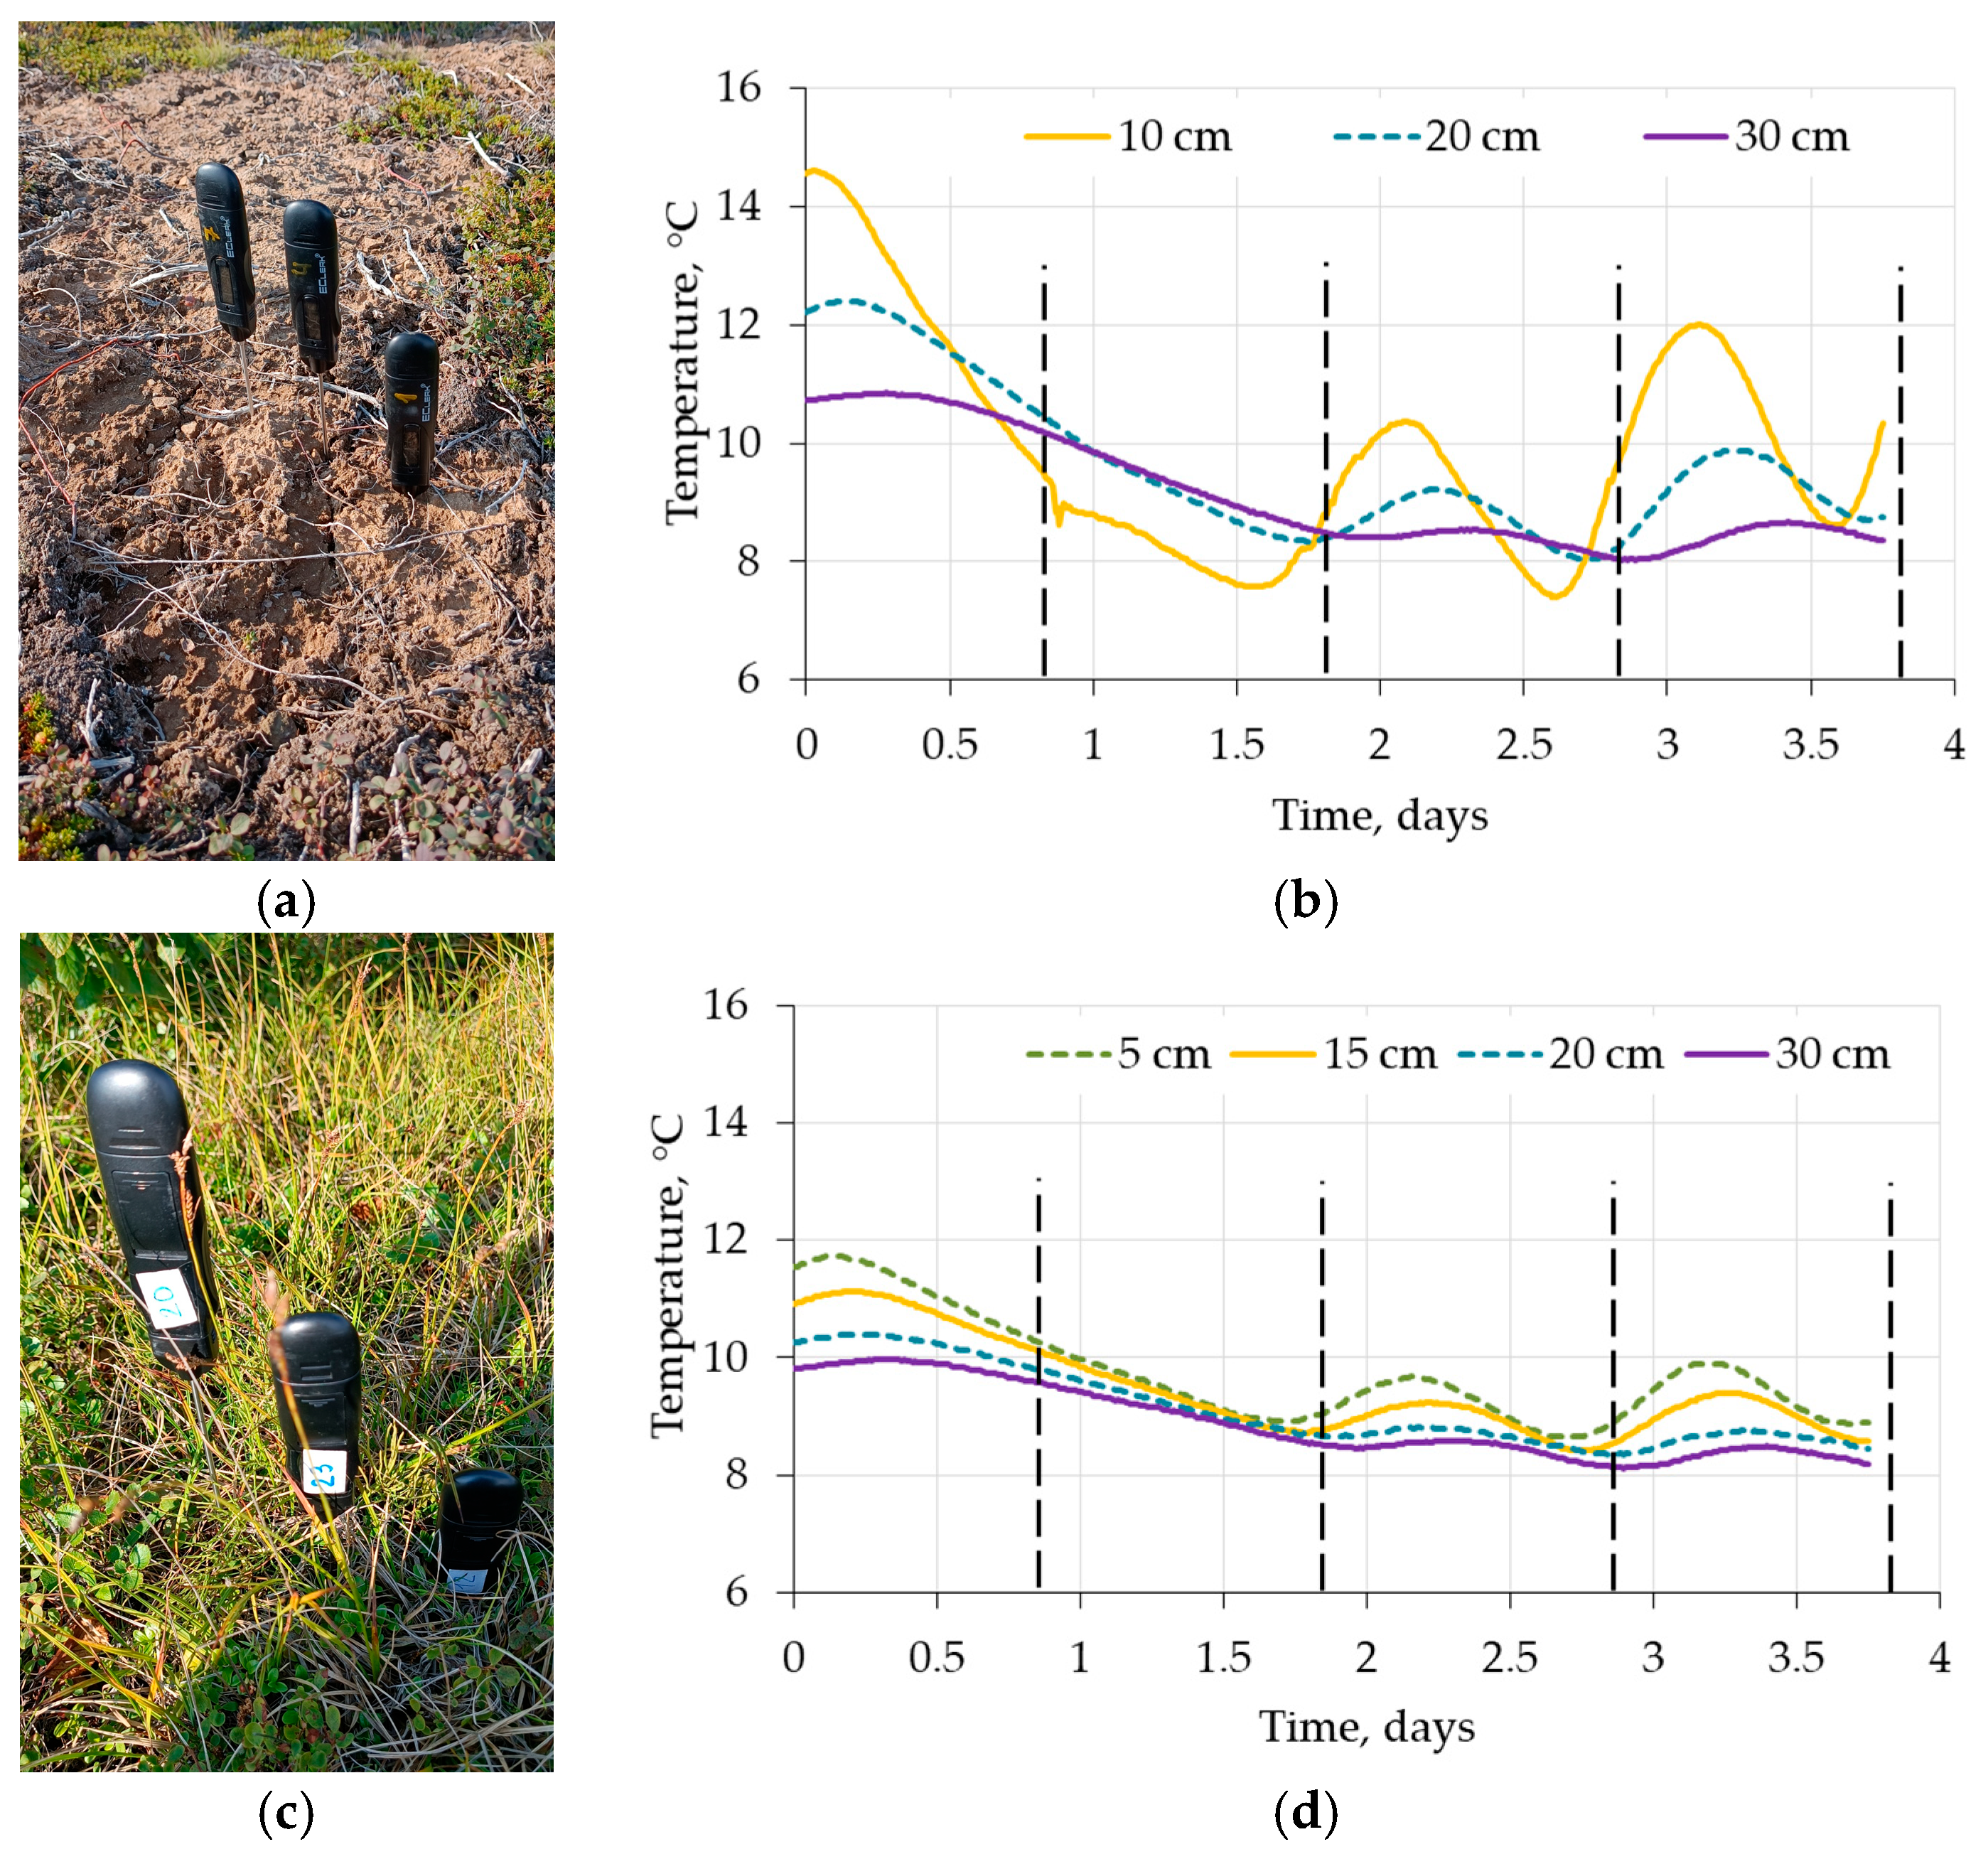
For the soil of the SA site, the averaged coefficients of thermal diffusivity and moisture content were determined by employing the method previously described. Data on temperature fluctuations at various depths were collected for a period exceeding three days. We utilized field measurements of the temperature dynamics at depths of 10, 20, and 30 cm for soil with a mineralized top layer (Observation point 1, SA1, Figure 7a,b) and 15, 20, and 30 cm for soil covered with herbaceous vegetation (Observation point 2, SA2, Figure 7c,d) for the calculations. The coefficients were reconstructed by minimizing the discrepancy between the calculated and measured temperatures at a depth of 20 and 15 cm, respectively (Figure 7). The preservation of periodic temperature dynamics at depths during the observation period suggests a relatively homogeneous soil structure and the absence of abrupt changes in thermal conductivity, such as those associated with precipitation. To resolve the inverse thermal conductivity problem, the moisture content was assumed to be the desired value, and the thermal conductivity was determined according to (2) using the coefficients that had been previously obtained (Table 3). Soil density and porosity were used in accordance with Table 2.
For SA1, the calculated temperature distributions (Figure 8a) exhibited deviations from the monitoring data of less than 0.18 °C. The root mean square error (RMSE) was 7.7% (Figure 8b). In the case of SA2, the deviation was less than 0.12 °C, and RMSE was 4.4% (Figure 9). It is much less than the uncertainty of the temperature meters that is equal to 0.5 °C. A notable temperature disparity is observed at the conclusion of the initial day for the initial point (Figure 8a). This is attributable to the calculation algorithm, which employs the initial linear temperature distribution as the starting point. Moreover, it is presumed that the desired values for the temperature distribution function will remain constant throughout the day. This effect is also observed at SA2, albeit to a much lesser extent (Figure 9a).
The results of the calculation are the values of the thermal conductivity and heat capacity at different depths. The issue of the error of the calculated coefficients was considered in terms of the sensitivity of the integral square deviation of temperatures (the left part of Equation (7)) to these coefficients. It has been found that what causes the most significant effect on the integral square deviation is the relation of the thermal conductivity to the heat capacity, i.e., the thermal diffusivity coefficient. As the integral square deviation is the most sensible with respect to this parameter, the latter is determined with lower uncertainty, as compared with the thermal conductivity and the heat capacity. The moisture content values calculated with use of the determined thermal diffusivity coefficients are presented in the table as well. Their values are in good agreement with the measurement data (Table 2, Table 3 and Table 4).

4. Discussion

During the research, more than 50 soil pits were investigated at sites with varying levels of vegetation disturbance. In the current paper, two sections on contrast soil states were presented. The availability of long-period temperature data with depths, which was collected for these sites in the field, was the primary factor in their selection. This was important for the thermophysical properties’ numerical simulating stage of the current study.
The two locations (SA, SB) that are being examined are situated within 25 km of one another. The flat terrain across the landscape exhibits minimal elevation variation within the 85–120 m range. In these circumstances, the climatic factor is not considered when determining the recorded differences in soil features. The precipitation regime is the same for these sites and should be regarded as consistent. Consequently, the state of the landscape and the state of the soil are the determining factors in the characteristics of differences in soil moisture rather than external conditions (Table 3). We are confident that the hydrothermal regime of the soils is determined by the significant degradation of the vegetation cover in the SA site, as opposed to the SB site, which has a predominance (>70%) of the background shrub tundra vegetation class (Figure 4). The vegetation at the SA site showed no signs of mechanical or pyrogenic impact. However, the loss of the tree layer and the destruction of the moss–lichen cover are indications of the aerotechnogenic impact on the territory [8]. The area up to 50 km away from the Norilsk industrial region is actually affected in this way by air pollution [8,21,35,36,37,53].
The thickness, density, and percentage of humus content of the organic horizon of the soil profile at the SA site are distinct from those at the SB in (Table 2). At the same time, the mineral component of the profile remains unaltered. The seasonal thawing depth also increases as a result of the alteration in the soil profile’s structure (Figure 6). These processes are influenced by the thermal conductivity coefficients that are recorded when comparing data on temperatures and heat flows in the soil of the SB site in comparison with the soil of the SA site, which exhibits strong landscape heterogeneity (Figure 4). The challenge is that satellite images are reliant on the spectral characteristics of vegetation and are unable to directly determine the extent of soil variety. In the event of minor restoration following technogenic impacts, the appearance of spectral curves is maintained and is in close proximity to the background (Figure 4). Therefore, the accumulation of field data on soils and instrumental measurements of their physical characteristics (temperature, heat flux, etc.) is a critical source of information.
As it was mentioned before, the moss–lichen cover and snow obstruct the exchange of heat between the atmosphere and the underlying soil [54,55]. The altered thickness, density, and humidity of upper organogenic layers on landscapes with disturbed vegetation and organic layers have a significant impact on the thermal regime. From the first view, the modifications in heat transport processes that occur as a consequence of landscape disturbance are comparable to those that occur as a result of the physical removal of the upper organic layer [26]. The temperature gradient values in the soils of the SA are comparable to those observed beneath the heat-insulating upper (peat) soil layer of the background landscape’s soil (Figure 6). Nevertheless, an analysis of the heat flux measurements reveals that the rate of heat flux decreases with depth and is significantly higher in the soil of the background landscape (SB) than in the site with disturbed vegetation (SA).
The substantial disparity in heat fluxes for temperature gradients that are relatively close suggests that the thermal conductivity in soil is sufficiently higher under the conditions of industrial-affected landscape SA. This suggests the existence of a soil mineralization process. Ultimately, this leads to a significant increase in the depth of thawing (Figure 6), as demonstrated by the findings of the field experiments [2] and numerical simulations [56].
The heat-insulating properties of the vegetation cover and upper organogenic horizons have previously been considered in many studies of heat exchange in soils. According to the research [57], the moss–lichen cover exhibits these characteristics to a greater extent than the grass cover. This is in accordance with the temperature measurement data in the present study (Figure 6), which show that the temperature difference in the upper 5 cm of the vegetation cover formed by moss is significantly greater than the temperature difference observed for the grass cover under identical conditions.
The theoretical justification provided in [25,56] posits that the local removal of the upper organogenic horizon may result in an increase in heat input into the soil during the summer period, which is not offset by an increase in heat outflow during the winter period. Consequently, the active layer thickness may experience a significant increase. These theoretical considerations are not in opposition to the data of our study for the territory of interest. The present study demonstrates that the active layer thickness was doubled in the SA site, which differed from the background landscape site both in the absence of moss and having a significantly smaller thickness of the upper organic horizon.
Our findings suggest that the thermophysical characteristics of soils are highly variable within similar landscapes and may differ from those of natural soils in the presence of disturbed vegetation.
Therefore, it is important to develop methods for evaluating the thermophysical properties of soils, particularly those that are based on long-term temperature observations. The potential for the use of the considered approaches to determine thermal diffusivity coefficients is illustrated by the results presented for cryolithozone soils [47].
It has been demonstrated that the method under consideration is effective in recovering the thermophysical properties of soils from in situ temperature time series. This is a direct consequence of the fact that the numerical calculation can accurately reproduce the measured time dependence of temperature at multiple depths by selecting the coefficients of thermal diffusivity of multiple soil horizons. The proposed method for regarding the thermophysical properties of soil, in conjunction with soil water content measurements, enabled the evaluation of the thermal conductivity coefficients for the solid substance of soil (λs) and for the dry soil (λdry), in addition to determining the instant value of thermal conductivity. The latter allows one to determine a soil’s thermal conductivity based on measurements of the soil’s density and water content. In this way, the method under consideration can be effectively employed in conjunction with other instrumental methods of measuring thermophysical properties or as a substitute for them when their use is not feasible.
The obtained values of thermal conductivity, the measured values of heat flux, soil porosity, and water content form a unified and consistent picture. It was found that the soils of background landscapes have a lower thermal conductivity coefficient than the coefficient for soils of the affected area, which is determined by the value of organic matter. The thermal conductivity coefficients for the solid substance of soil (λs) and for dry soil (λdry) in the background landscape do not significantly vary with depth despite the observed change in the dry soil density. The solid soil material has a significantly higher thermal conductivity in the disturbed landscape. This aligns with observational data, which indicates that identical depths in this location exhibit greater mineralization in comparison to the intact area.
Thermal conductivity was successfully employed to ascertain moisture content due to the interdependence of moisture content, thermal conductivity, and soil properties. It was discovered that the thermal conductivity value can be calculated using Equation (1) and the measured heat flux and instantaneous temperature distribution, or it can be acquired by processing the temperature time dependences. The results presented in Table 3 and Table 4 demonstrate that both approaches enable the creation of a cohesive and consistent moisture content picture. The calculated values of the moisture content are in good agreement with the measurements in both the high-porous organic soil and the dense mineral soil.
Potential synergistic effects with climate warming are also present in the soils of the Arctic zone. The investigation of this issue is a distinct problem that necessitates the precise analysis of long-term climate data and the spatially distributed field measurement of soil properties and thermophysical features.
According to our estimates [11], in Central Siberia, the increase in STL thickness may rise by 3–12 cm every 10 years. We previously assessed that the average annual soil temperature rises to a depth of 320 cm at a rate of 0.66–0.70 °C/10 years. By predicting the temperature regimes of soils in the region until 2050, we can anticipate substantial changes in seasonally thawed layers. Nevertheless, the dynamics of vegetation growth [16,57] may serve as a stabilizing factor for the soils’ state. This issue is still going to be a problem for more complicated further investigations.

5. Conclusions

In conditions of cryolithozones, changes in the landscape caused by both technogenic and natural factors can result in a significant mosaicity of the soil cover and an increase in the variability of soil properties. A modification in the thermophysical properties and dynamics of heat exchange processes is observed in cryozems, which are characterized by a decrease in thickness and an increase in density of the upper organogenic horizons due to external influences. This phenomenon is common for cryozems located in the permafrost zone of Central Siberia.
Preliminary documentation of vegetation and thermal anomalies on the surface, which are suggestive of shifts in soil temperature regimes and landscape states, may benefit from satellite data.
One of the most significant outcomes of soil property transformations is a change in the temperature profile of the soil compared to the background landscape’s soil, a decrease in the heat flow gradient, and a thawing depth that is more than twice as deep. It has been established that cryozems are distinguished by an increase in the thermal conductivity coefficient as the thickness of the organogenic horizon decreases.
Further research will require the examination of the dynamics of changes in the moisture content of permafrost soils through the use of an approach that is based on the monitoring of temperature dynamics in the soil profile.
In the context of sustainability, the state of cryosoils is a critical factor in the vulnerability of Arctic ecosystems in Siberia. Examining the thermal and moisture regimes of the seasonally thawed soil layer is necessary to gain a deeper understanding of the principles of ecosystem stability in permafrost conditions, especially when subject to external natural or human-induced influences. The combination of warming temperatures and land-use changes results in the formation of “neo-technogenic ecosystems” with distinct soil thermal regimes differing from natural background conditions and requiring long-term monitoring and adaptation. In order to ensure sustainable nature management in the region, the findings should serve as the foundation for regulating the impact on landscapes. This will prevent the substantial degradation of ecosystems and the corresponding risks to human well-being.

Author Contributions

Conceptualization, E.I.P., T.V.P., K.Y.L. and K.A.F.; methodology, K.Y.L. and E.I.P.; software, K.Y.L., K.A.F., N.D.Y. and G.E.P.; validation, T.V.P., K.A.F., E.I.P. and K.Y.L.; resources, E.I.P. and T.V.P.; data curation, T.V.P.; writing—original draft preparation, T.V.P., K.Y.L. and E.I.P.; writing—review and editing, E.I.P. and K.A.F.; visualization, N.D.Y., E.I.P., G.E.P. and K.Y.L.; supervision, T.V.P. and E.I.P.; funding acquisition, T.V.P. All authors have read and agreed to the published version of the manuscript.

Funding

Research was supported by the Russian Science Foundation (Grant No. 23-14-20007) and Krasnoyarsk Regional Science Foundation, https://rscf.ru/project/23-14-20007/, accessed on 20 August 2025.

Institutional Review Board Statement

Not applicable.

Informed Consent Statement

Not applicable.

Data Availability Statement

Publicly available datasets were analyzed in this study. Satellite data can be found here: https://ladsweb.modaps.eosdis.nasa.gov/ (accessed on 20 August 2025), The United States Geological Survey (USGS) database (https://earthexplorer.usgs.gov/, accessed on 20 August 2025), and https://worldview.earthdata.nasa.gov (accessed on 20 August 2025).

Acknowledgments

The satellite data-receiving equipment used was provided by the Centre of Collective Usage of Federal Research Center “Krasnoyarsk Science Center, Siberian Branch of Russian Academy of Sciences”, Krasnoyarsk, Russia. Preliminary processing of data was conducted according to the project of IF SB RAS no. FWES-2024-0007. The development of 1D model of heat transfer was carried out according to the project of IT SB RAS no. 124062400029-2.

Conflicts of Interest

The authors declare no conflicts of interest.

Abbreviations

The following abbreviations are used in this manuscript:
PMFPermafrost
RSGReference soil group
STLThe depth of the seasonally thawed layer
PCPhysical clay (<0.01 mm) content
MCSoil moisture content
SDSpecific density
OMOrganic matter
BDBulk density
GMTEDGlobal multi-resolution terrain elevation data
SAAmbarnaya River test site
SA1Observation point 1 at SA test site
SA2Observation point 2 at SA test site
SBBoganida River test site

References

  1. Orgogozo, L.; Prokushkin, A.S.; Pokrovsky, O.S.; Grenier, C.; Quintard, M.; Viers, J.; Audry, S. Water and energy transfer modeling in a permafrost-dominated, forested catchment of Central Siberia: The key role of rooting depth. Permafr. Periglac. Process. 2019, 30, 75–89. [Google Scholar] [CrossRef]
  2. Anisimov, O.A.; Sherstiukov, A.B. Evaluating the effect of environmental factors on permafrost in Russia. Earth’s Cryosph. 2016, 2, 78–86. (In Russian) [Google Scholar]
  3. Ponomareva, T.V.; Litvintsev, K.Y.; Finnikov, K.A.; Yakimov, N.D.; Sentyabov, A.V.; Ponomarev, E.I. Soil Temperature in Disturbed Ecosystems of Central Siberia: Remote Sensing Data and Numerical Simulation. Forests 2021, 12, 994. [Google Scholar] [CrossRef]
  4. Xavier, T.; Orgogozo, L.; Prokushkin, A.S.; Alonso-González, E.; Gascoin, S.; Pokrovsky, O.S. Future permafrost degradation under climate change in a headwater catchment of central Siberia: Quantitative assessment with a mechanistic modelling approach. Cryosphere 2024, 18, 5865–5885. [Google Scholar] [CrossRef]
  5. Vasiliev, A.A.; Drozdov, D.S.; Gravis, A.G.; Malkova, G.V.; Nyland, K.E.; Streletskiy, D.A. Permafrost degradation in the Western Russian Arctic. Environ. Res. Lett. 2020, 15, 045001. [Google Scholar] [CrossRef]
  6. Langer, M.; von Deimling, T.S.; Westermann, S.; Rolph, R.; Rutte, R.; Antonova, S.; Rachold, V.; Schultz, M.; Oehme, A.; Grosse, G. Thawing permafrost poses environmental threat to thousands of sites with legacy industrial contamination. Nat. Commun. 2023, 14, 1721. [Google Scholar] [CrossRef]
  7. Anisimov, O.A. Retrospective Analysis of Permafrost Bearing Capacity during the Period of Intensive Arctic Development (1950–2022). Russ. Meteorol. Hydrol. 2025, 50, 42–49. [Google Scholar] [CrossRef]
  8. Yurkevich, N.V.; Eltsov, I.N.; Gureev, V.N.; Mazov, N.A.; Yurkevich, N.V.; Edelev, A.V. Technogenic effect on the environment in the Russian Arctic by the example of the Norilsk industrial area. Bull. Tomsk. Polytech. University. Geo Assets Eng. 2021, 332, 230–249. (In Russian) [Google Scholar] [CrossRef]
  9. Lebedeva, L.; Semenova, O.; Vinogradova, T. Simulation of Active Layer Dynamics, Upper Kolyma, Russia, using the Hydrograph Hydrological Model. Permafr. Periglac. Process. 2014, 25, 270–280. [Google Scholar] [CrossRef]
  10. Desyatkin, R.V.; Desyatkin, A.R.; Fedorov, P.P. Temperature regime of taiga cryosoils of Central Yakutia. Earth’s Cryosph. 2012, 16, 70–78. (In Russian) [Google Scholar]
  11. Ponomareva, T.V.; Tretyakov, P.D.; Ponomarev, E.I. Long-Term Dynamics of Soil Temperature Regime along the Latitude Gradient in the Permafrost Zone of Central Siberia. Contemp. Probl. Ecol. 2025, 18, 160–170. (In Russian) [Google Scholar] [CrossRef]
  12. Yakimov, N.D.; Ponomarev, E.I.; Ponomareva, T.V. Variation in spectral indices in the context of natural and technogenic transformations of landscapes. Sovrem. Probl. Distantsionnogo Zondirovaniya Zemli Iz Kosm. 2024, 21, 131–140. (In Russian) [Google Scholar] [CrossRef]
  13. Philipp, M.; Dietz, A.; Buchelt, S.; Kuenzer, C. Trends in Satellite Earth Observation for Permafrost Related Analyses—A Review. Remote Sens. 2021, 13, 1217. [Google Scholar] [CrossRef]
  14. Yanagiya, K.; Furuya, M.; Danilov, P.; Iwahana, G. Transient freeze-thaw deformation responses to the 2018 and 2019 fires near Batagaika megaslump, Northeast Siberia. J. Geophys. Res. Earth Surf. 2023, 128, e2022JF006817. [Google Scholar] [CrossRef]
  15. Sadeghi Chorsi, T.; Meyer, F.J.; Dixon, T.H. Toward long-term monitoring of regional permafrost thaw with satellite interferometric synthetic aperture radar. Cryosphere 2024, 18, 3723–3740. [Google Scholar] [CrossRef]
  16. Crichton, K.A.; Anderson, K.; Fewster, R.E.; Charman, D.J.; Garneau, M.; Väliranta, M.; Mleczko, M.; Handley, J.N.; Hodson, S.; Parker, R.E.; et al. Satellite data indicates recent Arctic peatland expansion with warming. Commun. Earth Environ. 2025, 6, 461. [Google Scholar] [CrossRef]
  17. Bartsch, A.; Strozzi, T.; Nitze, I. Permafrost Monitoring from Space. Surv. Geophys. 2023, 44, 1579–1613. [Google Scholar] [CrossRef]
  18. Syroezhko, M.Y.; Ponomarev, E.I.; Ponomareva, T.V. Spectral features of landscape transformation as characteristics of thermal regimes of soils of Central Siberia cryolithozone. Sovrem. Probl. Distantsionnogo Zondirovaniya Zemli Iz Kosm. 2025, 22, 182–192. (In Russian) [Google Scholar] [CrossRef]
  19. Fedorov, A.N.; Konstantinov, P.Y.; Vasilyev, N.F.; Shestakova, A.A. The influence of boreal forest dynamics on the current state of permafrost in Central Yakutia. Polar Sci. 2019, 22, 100483. [Google Scholar] [CrossRef]
  20. Zhirkov, A.; Sivtsev, M.; Lytkin, V.; Kirillin, A.; Séjourné, A.; Wen, Z. An Assessment of the Possibility of Restoration and Protection of Territories Disturbed by Thermokarst in Central Yakutia, Eastern Siberia. Land 2023, 12, 197. [Google Scholar] [CrossRef]
  21. Ponomareva, T.V.; Trefilova, O.V.; Bogorodskaya, A.V.; Shapchenkova, O.A. Ecological and functional estimation of soil condition within the zone of technogenic impact of Norilsk industrial complex. Contemp. Probl. Ecol. 2014, 7, 694–700. (In Russian) [Google Scholar] [CrossRef]
  22. Vedrova, E.F.; Mukhortova, L.V. Biogeochemical evaluation of forest ecosystems in the area affected by Norilsk industrial complex. Contemp. Probl. Ecol. 2014, 7, 669–678. (In Russian) [Google Scholar] [CrossRef]
  23. Wen, W.; Lai, Y.; You, Z. Numerical modeling of water–heat–vapor–salt transport in unsaturated soil under evaporation. Int. J. Heat Mass Transf. 2020, 159, 120114. [Google Scholar] [CrossRef]
  24. Hinzman, L.; Chapin, F.S.; Fukuda, M. Chapter 6: Current Fire Regimes, Impacts and the Likely Changes—III: Boreal Permafrost Biomes. In Vegetation Fires and Global Change: Challenges for Concerted International Action, 2nd ed.; Goldammer, J.G., Ed.; Kessel Publishing House: Remagen, Germany, 2013; pp. 79–88. [Google Scholar]
  25. Porada, P.; Ekici, A.; Beer, C. Effects of bryophyte and lichen cover on permafrost soil temperature at large scale. Cryosphere 2016, 10, 2291–2315. [Google Scholar] [CrossRef]
  26. Ponomareva, T.V.; Ponomarev, E.I.; Litvintsev, K.Y.; Finnikov, K.A.; Yakimov, N.D. Thermal state of disturbed soils in the permafrost zone of Siberia according the remote data and numerical simulation. J. Comput. Technol. 2022, 27, 16–35. [Google Scholar] [CrossRef]
  27. Johansen, O. Thermal Conductivity of Soils. Ph.D. Thesis, Norwegian University of Science and Technology, Trondheim, Norway, 1975; p. 291. [Google Scholar]
  28. Horton, R.; Wierenga, P.J.; Nielsen, D.R. Evaluation of methods for determining the apparent thermal diffusivity of soil near the surface. Soil Sci. Soc. Am. J. 1983, 47, 25–32. [Google Scholar] [CrossRef]
  29. Vinogradov, Y.B.; Semenova, O.M.; Vinogradova, T.A. Hydrological modeling: The approach to simulation of heat dynamics in soil profile (part 1). Earth’s Cryosph. 2015, 19, 11–21. (In Russian) [Google Scholar]
  30. Telyatnikov, M.Y. Dynamics of the Phytodiversity of Natural Ecosystems Affected by Oil Products in the Norilsk Industrial District. Contemp. Probl. Ecol. 2022, 15, 160–179. (In Russian) [Google Scholar] [CrossRef]
  31. Abaimov, A.P.; Bondarev, A.I.; Zyryanova, O.A.; Shitov, S.A. Polar Forests of Krasnoyarsk Region; Nauka: Novosibirsk, Russia, 1997; p. 208. (In Russian) [Google Scholar]
  32. Gerasimov, I.P. (Ed.) Central Siberia. Natural Conditions and Natural Resources of the USSR; Nauka: Moscow, Russia, 1964; 481p. (In Russian) [Google Scholar]
  33. State Geological Map of the Russian Federation. Scale: 1:1,000,000. 3rd Generation; Norilsk Series. Map of Quaternary Formations; Radko, V.A., Ed.; FGBU “VSEGEI”: St. Petersburg, Russia, 2016. (In Russian) [Google Scholar]
  34. Ponomarev, E.I.; Ponomareva, T.V. Fire Impact in the Cryolithozone of Siberia for the Period 1996–2023, Certificate of State Registration of the Database No. 2024623184 (RU), 18.07.2024; The Federal Institute of Industrial Property (FIPS): Moscow, Russia, 2024; (In Russian). Available online: https://www1.fips.ru/ofpstorage/BULLETIN/PrEVM/2024/07/20/INDEX.HTM (accessed on 25 August 2025).
  35. Syso, A.I.; Sokolov, D.A.; Siromlya, T.I.; Ermolov, Y.V.; Makhatkov, I.D. Anthropogenic Transformation of Soil Properties in Taimyr Landscapes. Eurasian Soil Sci. 2022, 55, 541–555. [Google Scholar] [CrossRef]
  36. Bogorodskaya, A.V.; Ponomareva, T.V.; Shapchenkova, O.A.; Shishikin, A.S. Assessment of the state of soil microbial cenoses in the forest-tundra zone under conditions of airborne industrial pollution. Eurasian Soil Sci. 2012, 45, 521–531. [Google Scholar] [CrossRef]
  37. Efremova, T.T.; Efremov, S.P. Ecological and geochemical assessment of heavy-metal and sulfur pollution levels in hilly peatbogs of southern Taimyr. Contemp. Probl. Ecol. 2014, 7, 685–693. [Google Scholar] [CrossRef]
  38. United States Geological Survey (USGS). Earth Explorer, Landsat Collection 2, Level 1. Available online: https://earthexplorer.usgs.gov (accessed on 28 January 2025).
  39. Using the USGS Landsat Level-1 Data Product. Available online: https://www.usgs.gov/landsat-missions/using-usgs-landsat-level-1-data-product (accessed on 28 January 2025).
  40. Geographic Information System. Version 3.16.3. Available online: https://www.qgis.org (accessed on 20 August 2025).
  41. Yudina, A.V.; Fomin, D.S.; Valdes-Korovkin, I.A.; Churilin, N.A.; Kovda, I.V.; Milanovskiy, E.Y.; Aleksandrova, M.S.; Golovleva, Y.A.; Phillipov, N.V.; Dymov, A.A. The ways to develop soil textural classification for laser diffraction method. Eurasian Soil. Sci. 2020, 53, 1579–1595. [Google Scholar] [CrossRef]
  42. Black, C.A. Methods of Soil Analysis: Part I Physical and Mineralogical Properties; American Society of Agronomy: Madison, WI, USA, 1965. [Google Scholar]
  43. Kalra, Y.P.; Maynard, D.G. Methods Manual for Forest Soil and Plant Analysis; Forestry Canada Northwest Region Information Report NOR-X-319; Forestry: Edmonton, AB, Canada, 1991. [Google Scholar]
  44. Kachinsky, N.A. Soil Physics; Vysshaya Shkola: Moscow, Russia, 1970; 324p. (In Russian) [Google Scholar]
  45. Kersten, M.S. The thermal conductivity of soils. Highw. Res. Board Proc. 1949, 28, 391–409. [Google Scholar]
  46. Seemann, J. Measuring technology. In Agrometeorology; Seemann, J., Chirkov, Y.I., Lomas, J., Primault, B., Eds.; Springer: Berlin/Heidelberg, Germany, 1979; pp. 40–45. [Google Scholar] [CrossRef]
  47. Karashbayeva, Z.; Berger, J.; Orlande, H.R.B.; Rysbaiuly, B. Estimation of ground thermal diffusivity using the conjugate gradient method with adjoint problem formulation. Urban Clim. 2023, 52, 101676. [Google Scholar] [CrossRef]
  48. Bazova, M.M.; Koshevoi, D.V. The assessment of the current state of water quality in the Norilsk industrial region. Arct. Ecol. Econ. 2017, 3, 49–60. (In Russian) [Google Scholar] [CrossRef]
  49. IUSS Working Group WRB. World Reference Base for Soil Resources. In International Soil Classification System for Naming Soils and Creating Legends for Soil Maps, 4th ed.; International Union of Soil Sciences (IUSS): Vienna, Austria, 2022. [Google Scholar]
  50. Dubrovina, I.A. Features of profile distribution and nutrient stocks in drained peat soils. Ecosyst. Transform. 2023, 6, 49–63. [Google Scholar] [CrossRef]
  51. Efremova, T.T.; Ovchinnikova, T.M. The assessment of the organic matter state in drained peat soils as related to the environmental conditions by the methods of multidimensional statistics. Eurasian Soil Sci. 2007, 40, 1298–1307. [Google Scholar] [CrossRef]
  52. Leiber-Sauheitl, K.; Fuss, R.; Voigt, C.; Freibauer, A. High CO2 fluxes from grassland on Histic Gleysol along soil carbon and drainage gradients. Biogeosciences 2014, 11, 749–761. [Google Scholar] [CrossRef]
  53. Yakovlev, A.S.; Plekhanova, I.O.; Kudryashov, S.V.; Aimaletdinov, R.A. Assessment and regulation of the ecological state of soils in the impact zone of mining and metallurgical enterprises of Norilsk Nickel Company. Eurasian Soil Sci. 2008, 41, 648–659. [Google Scholar] [CrossRef]
  54. Derzhavina, L.M.; Bulgakova, D.S. (Eds.) Methods of Multiple Monitoring of Fertility of Agricultural Soils; Russian Research Institute of Information and Technical and Economic Research on the Engineering and Technical Support of the Agroindustrial Complex: Moscow, Russia, 2003; 240p. (In Russian) [Google Scholar]
  55. Pavlov, A.V. Monitoring kriolitozony [Permafrost Monitoring], 3rd ed.; Academic Publishing House “GEO”: Novosibirsk, Russia, 2008; 229p. (In Russian) [Google Scholar]
  56. Finnikov, K.A.; Ponomareva, T.V.; Ponomarev, E.I.; Litvintsev, K.Y. Impact of wildfire on heat and moisture transfer in a seasonally thawed layer of soil studied by numerical simulation. Thermophys. Aeromechanics 2023, 30, 1149–1156. [Google Scholar] [CrossRef]
  57. Osokin, N.I.; Sosnovsky, A.V. Influence of meteorological conditions on the thermal insulation properties of moss cover according to measurements on Svalbard. Earth’s Cryosph. 2021, 25, 17–25. [Google Scholar] [CrossRef]
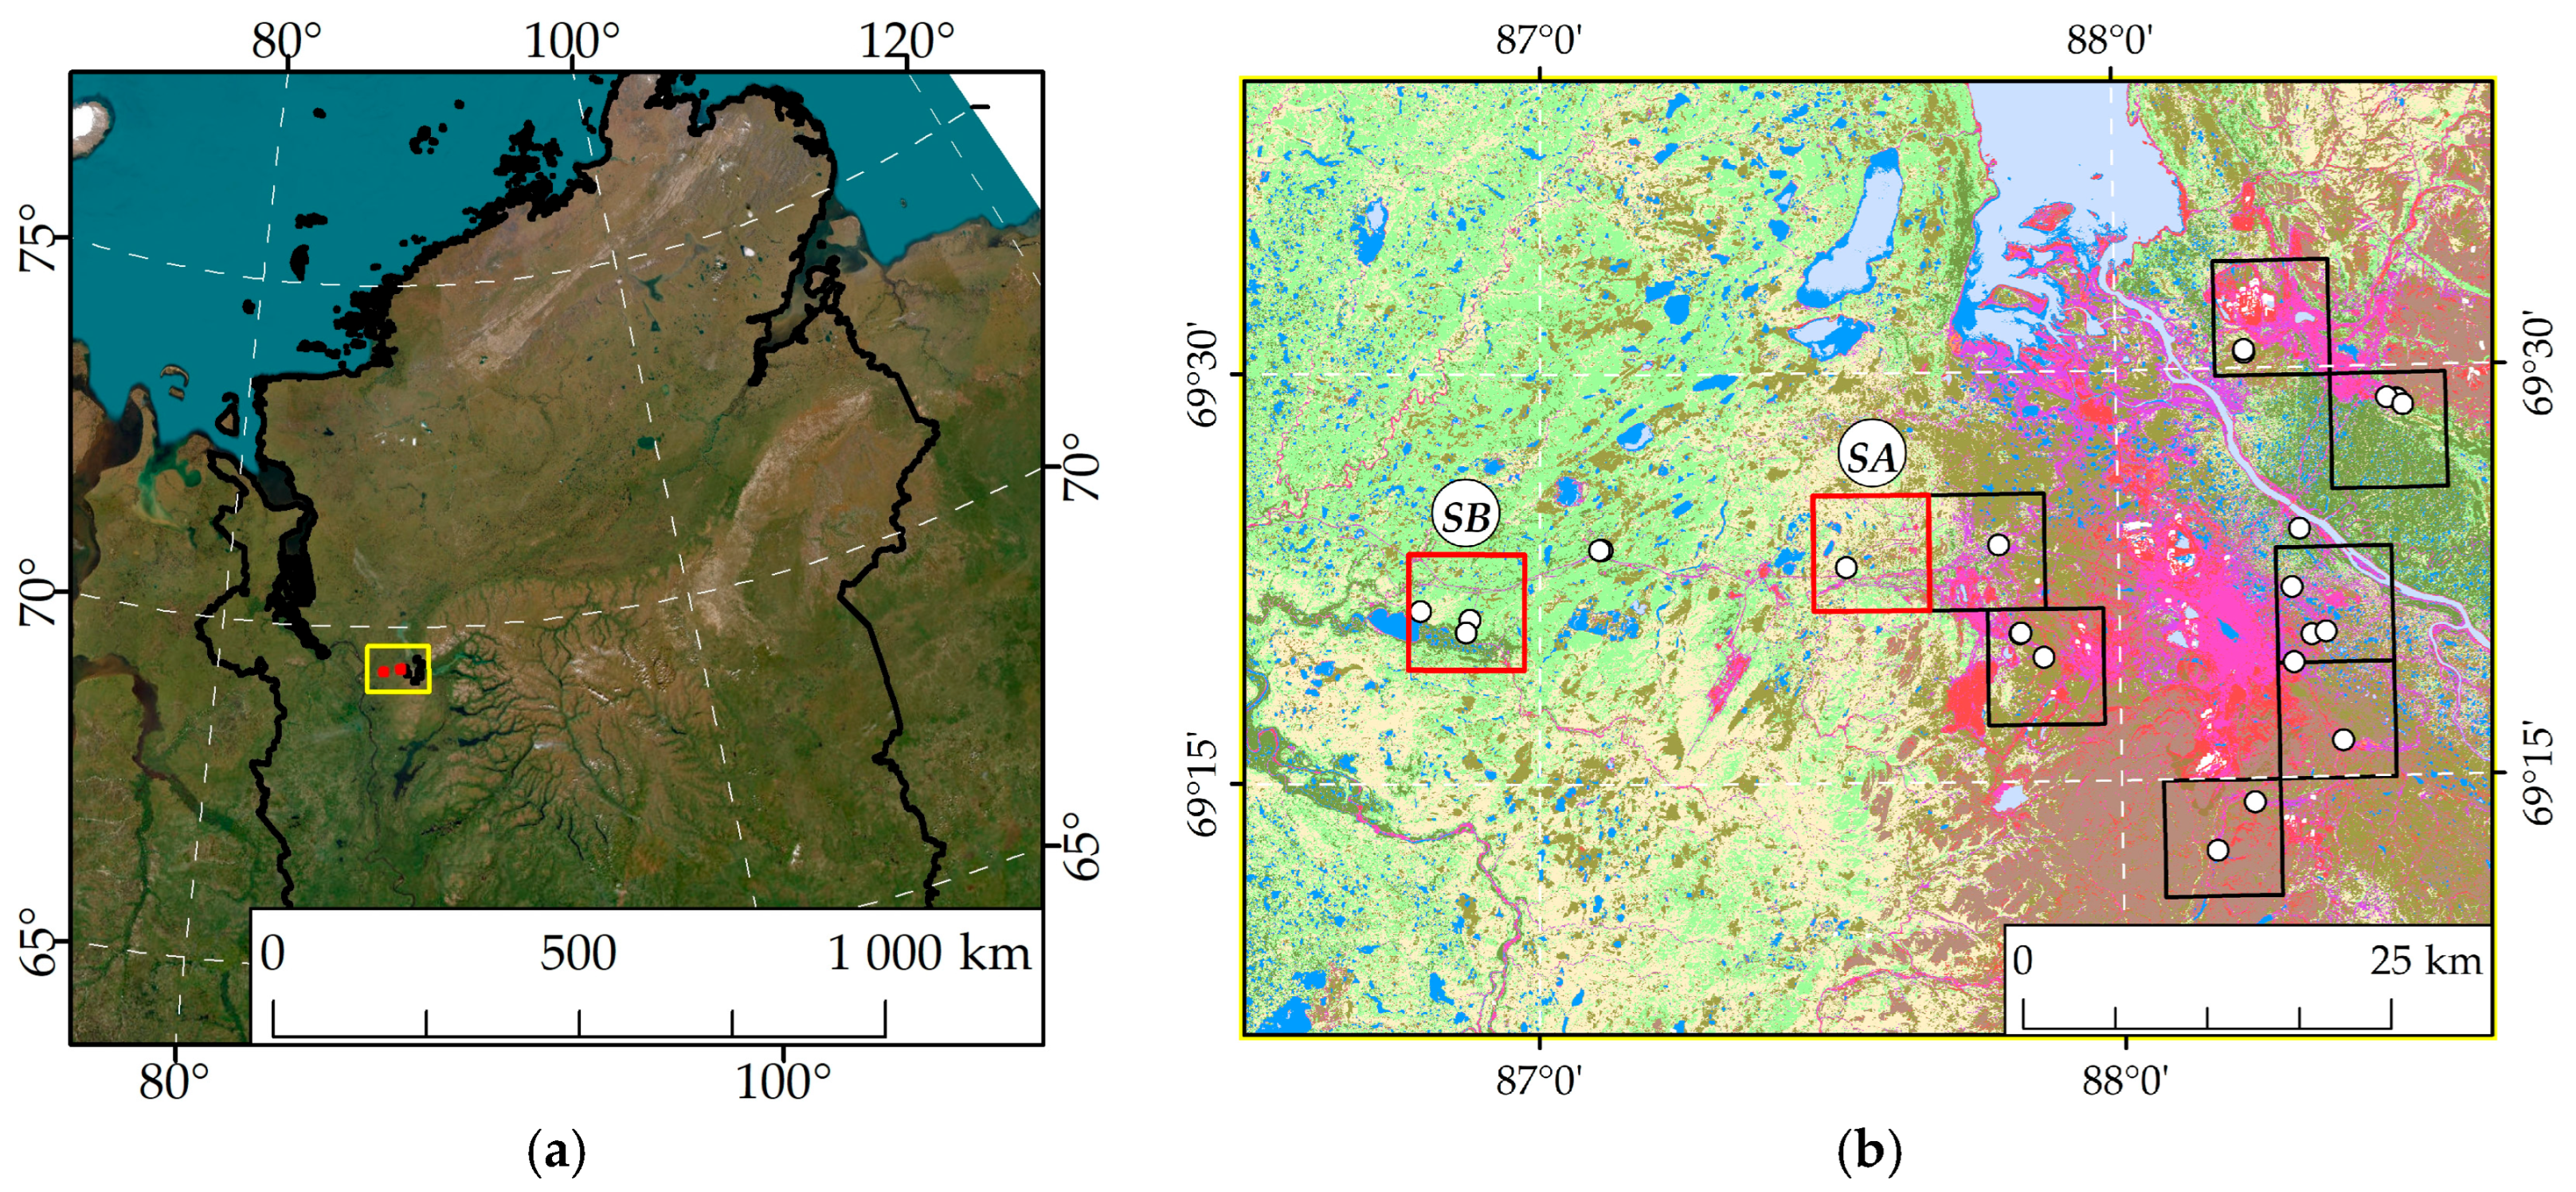
Figure 1. The study area in the northern part of Krasnoyarsk Region, Taimyr, Russia (a), and sites of field experiments conducted in 2022–2025. (b) SB (Boganida River test site) is the background landscape; SA (Ambarnaya River test site) is situated in a landscape that has been industrial-affected and has a disturbed vegetation cover. The soil pits locations are indicated by the white dots on the Landsat image’s vegetation cover classification, July 2024 (b).
Sustainability 17 08892 g001
Figure 2. The condition of the vegetation cover of the background landscape Boganida River test site SB (left) and disturbed landscape of the Ambarnaya River test site (SA) (right). A photo taken in August 2025.
Sustainability 17 08892 g002
Figure 3. Vegetation cover of the surface and soil profiles at the locations of field experiments: (a) test site SB, soil type refers to Histic Cryosols, (b) test site SA, soil type refers to Turbic Cryosols. A photo taken in August 2023.
Sustainability 17 08892 g003
Figure 4. The results of the classification (see Table 1 for details for classes 1–6) for the polygons that surround the field experiment sites 2022–2025: (a) the set of allocated classes for the background undisturbed SB test site, (b) the set of classes of the industrial-affected vegetation state in the SA site. The red symbols indicate the locations of soil pits.
Sustainability 17 08892 g004
Figure 5. Spectral brightness curves for the selected classes of on-ground vegetation states in the landscapes of the Boganida River (a) and Ambarnaya River (b) test sites.
Sustainability 17 08892 g005
Figure 6. The temperature profiles (blue lines) and average heat flow (red lines) rates (q, W/m2) for the soil of the background landscape at the SB site (a) and the soil of the technogenic-affected landscape at the SA site (b) have been recorded along the soil profile. STL (the shadow area) is the depth of the seasonally thawed layer in August 2023. The confidence intervals are provided at a significance level of 0.05.
Sustainability 17 08892 g006
Figure 7. The dynamics of temperatures in soil layers on the SA test site: (a,b) for the case of mineralized top layer, devoid of vegetation (Observation point 1, SA1); (c,d) under conditions of partial restoration of herbaceous vegetation (Observation point 2, SA2). The dashed vertical lines indicate 12 a.m. local time for each day.
Sustainability 17 08892 g007
Figure 8. Comparison between calculated and experimental data: (a) temperature dynamics; (b) absolute difference. SA1; the depth is 20 cm. The dashed vertical lines indicate 12 a.m. local time for each day.
Sustainability 17 08892 g008
Figure 9. Comparison between calculated and experimental data: (a) temperature dynamics; (b) absolute difference. SA2; the depth is 20 cm. The dashed vertical lines indicate 12 a.m. local time for each day.
Sustainability 17 08892 g009
Table 1. Classes of vegetation states surrounding the field experiment sites.
Class NumberClass NameSB Test SiteSA Test Site
S, km2% of TotalS, km2% of Total
1Water5.844.91.332.2
2Sparse tree stand7.2612.020.3833.5
3Shrub tundra vegetation (background state)34.8957.56.9811.5
4Tundra vegetation transformed2.474.117.1128.1
5Alluvial zone5.078.43.245.3
6Technogenic transformation5.098.49.1115.0
Table 2. The physical and chemical characteristics of the soils studied.
Test SiteSoil TypeHorizonsDepth, cmHumus/OM *, %pH, WaterBD **, g/cm3SD ***, g/cm3MC ****PC *****
SBHistic CryosolsT0–20–/914.60.131.43.35
CRg20–473.25.60.612.30.7638
CR┴47–502.06.02.352
SATurbic CryosolsOao0–5–/485.00.161.41.22
CR5–424.95.81.072.40.3340
C42–903.55.91.172.40.3457
┴ is frozen horizon’s marker, OM * is organic matter content of a soil sample by loss on ignition, BD ** is bulk density, SD *** is specific density, MC **** is soil moisture content, and PC ***** is physical clay (<0.01 mm) content.
Table 3. Calculated coefficients of thermal conductivity and calculated and measured gravimetric water content W for the soils of the SB and SA test sites.
Depth, cm q e x p , W m 2 λ s / λ c a l c / λ d r y , W m · K W c a l c W e x p W c a l c W e x p W e x p
SB test site, background state soil
1015.9 ± 2.10.42/0.25/0.053.5 ± 10%3.354.4%
1512.0 ± 5.70.41/0.25/0.05
208.0 ± 2.00.37/0.25/0.05
256.1 ± 2.10.42/0.25/0.050.68 ± 30%0.76−10%
355.1 ± 1.00.29/0.25/0.05
SA test site, soil of transformed landscape
2033.1 ± 1.41.35/4.3/0.150.38 ± 12%0.3412%
Table 4. Calculated values of thermal diffusivity and gravimetric water content for the soils of technogenic-affected landscape in the SA test site.
The Soil of Area with a Mineralized Top Layer (Observation Point 1, SA1)
DaysSoil Layer
10–20 cm20–30 cm10–20 cm20–30 cm
Thermal Diffusivity, mm2/s W c a l c
20.5 ± 0.120.51 ± 0.170.35 ± 8%0.34 ± 12%
30.5 ± 0.140.5 ± 0.150.33 ± 10%0.33 ± 11%
The Soil of Area with Regenerating Herbaceous Vegetation (Observation Point 2, SA2)
DaysSoil Layer
15–20 cm20–30 cm15–20 cm20–30 cm
Thermal Diffusivity, mm2/s W c a l c / W e x p
20.52 ± 0.180.52 ± 0.10.26 ± 15%/–0.27 ± 8%/–
30.51 ± 0.120.49 ± 0.090.32 ± 10%/0.340.34 ± 7%/0.34
Disclaimer/Publisher’s Note: The statements, opinions and data contained in all publications are solely those of the individual author(s) and contributor(s) and not of MDPI and/or the editor(s). MDPI and/or the editor(s) disclaim responsibility for any injury to people or property resulting from any ideas, methods, instructions or products referred to in the content.