Article

Doing Good or Doing Better? Comparing Freelance and Employment Models for a Social Sustainable Food Delivery Sector

by
Riccardo Tronconi
* and
Francesco Pilati
*
Department of Industrial Engineering, University of Trento, Via Sommarive 9, 38123 Trento, Italy
*
Authors to whom correspondence should be addressed.
Sustainability 2025, 17(19), 8876; https://doi.org/10.3390/su17198876
Submission received: 15 July 2025 / Revised: 27 September 2025 / Accepted: 30 September 2025 / Published: 4 October 2025
(This article belongs to the Section Sustainable Engineering and Science)

Abstract

Delivery platforms in urban logistics connect providers with customers through distribution riders, who are usually distinguished by low incomes and limited social rights. This paper aims to compare and analyze the freelance and employment models for riders in different European countries in terms of social sustainability, i.e., work motivation and labor rights. To reach this goal, two activities were performed. On the one hand, qualitative interviews with German and Italian riders were carried out. On the other hand, a dynamic metaheuristic algorithm was developed and implemented to simulate an employment model with a central provider that manages order requests in real-time. The qualitative interviews indicate that riders’ motivations differ between freelance riders and employed riders: freelance riders do feel more controlled. Using a quantitative algorithm, this manuscript shows that when an efficient centralized order–rider assignment strategy is applied, a socially sustainable and simultaneously profitable employment model for food delivery businesses is possible. The results have the potential to legitimize adequate rights and salaries for riders while allowing digital platforms to operate profitably. Such win–win situations could support the implementation of platform structures across different logistics sectors and overcome conflicts regarding working rights in such contexts.

1. Introduction

Heralded platform services and sharing economy principles are widely seen to affect organizations and logistics processes. However, how data-driven algorithmic management specifically affects organizational management decisions, such as the motivation and employment status of riders in platform logistics systems, is seldom explained [1]. Such platform organizations and issues relate to on-demand access to products and services, facilitated by online platforms that are dedicated to linking several companies with many individual customers [2]. Due to COVID-19 pandemic, the rise of online platforms is accelerated, with an additional growth rate of 21.3% [3]. The food delivery sector is one of the most known examples since its market size tripled from 2019 to 2023 [4]. This business typically offers a flexible work schedule, allowing distribution riders to perform deliveries according to their preferences with the help of digital systems [5,6]. Such food distribution riders are typically self-employed operators whose earnings are based on the number of deliveries performed—most of the time without any social security or healthcare assistance [7], which is in contrast to calls for logistics as a contribution to a better world [8]. This food delivery platform business model incentivizes riders to drive fast, resulting in poor road safety and a high risk of accidents. Indeed, the rapid development of urbanization intensifies serious problems like accidents and traffic [9]. More specifically, 25% of riders have been involved in at least one accident while working, and 13% have suffered injuries [10]. Riders may accept or refuse a food delivery assignment, thereby impacting logistics efficiency. If rejected, all routes must be recalculated, resulting in a delay in calculation and delivery times [11]. Not much is known about the interplay between riders’ employment statuses, work motivation, and routing algorithms.
This study fills this gap by analyzing logistics operation strategies regarding employment type, motivation, and routing management for urban food distribution riders. Indeed, the question of whether employment or freelancer concepts are more successful in platform economy models is connected to employee motivation and performance considerations [12]. Therefore, on the one hand, this manuscript sheds light on the interaction between employment status and worker perception through data collection from 136 qualitative interviews with riders from Italy and Germany. On the other hand, it introduces a real-time assignment algorithm that matches customer orders and delivery riders. While this algorithm shares the objective function of minimizing the overall route distance of existing models, it advances the capabilities of order delivery management and it helps to prove that these online platforms can benefit from an economic perspective by ensuring fair contracts for riders through a socially sustainable employment model.
Topics regarding perceived autonomy and control of workers are especially relevant for work motivation and performance and related to the economic, environmental, and especially social dimensions of sustainability [13]. Regarding this latter aspect, the “European pillars for social rights” aims at establishing fairer and more inclusive labor markets with better job quality [14]. However, it is unclear how the role of employment status is related to the riders’ motivation, leading to the first hypothesis:
H1: 
Compared to freelance riders, riders employed by the platform with a centralized order routing and allocation scheme are connected to increased individual work motivation.
In addition, work motivation is connected to underlying constructs, such as work autonomy perception and work control perception. The former is the rider’s subjective experience of freedom in his/her job, while the latter implies the feeling of being constantly observed and evaluated in his/her activity. The relation between work motivation and the two aforementioned concepts is outlined by the following two hypotheses [15]:
H2: 
Compared to freelance riders, employment models with a centralized order routing and allocation scheme for riders are connected to lower levels of workers’ autonomy perceptions.
H3: 
Compared to freelance riders, employment models with a centralized order routing and allocation scheme for riders are connected to higher levels of workers’ control perceptions.
This paper continues as follows: Section 2 describes state-of-the-art research in the scientific literature. Section 3 outlines the combined qualitative and quantitative methods. Section 4 presents the results of the studies. Section 5 discusses theoretical and managerial learning and Section 6 provides an outlook on future research.

2. Literature Review

The literature on urban logistics and last-mile delivery has snowballed substantially in recent years. Contributions are carried out to analyze the economic and environmental performance of the urban logistics supply chain in the food delivery sector, with practical implications in real-world case studies, e.g., in Milan, Italy [16]. Still rare are contributions addressing the interactions between end customers and logistics systems adopting a quantitative perspective, which limits the potential efficiency of last-mile delivery processes [17]. Some articles describe improvements in urban transport services, but the adopted approaches are typically static; for example, vehicles follow predetermined routes that are not modifiable [18]. A prominent mathematical problem concerning urban logistics is the vehicle routing problem (VRP), which entails planning and designing the “best” delivery route from one or more depots to several customers [19]. For instance, VRP models are integrated through informatic technology on vehicles to inform them on the best routing and to improve the efficiency of urban logistics [20]. In real-world problems, the system is usually distinguished by dynamic events that cause uncertainties and parameter perturbation [21]. Thus, routing planners must implement algorithms that can quickly adapt according to the situation [22]. Recent debates in the operations management literature have focused on the emerging topic of real-time urban logistics, with food delivery being one of the most relevant applications. In this field of study, the minimization of late deliveries represents one of the most important concepts, since it improves the service quality for final consumers. Researchers have developed mathematical models in which late deliveries represent a decrease in customer satisfaction and an additional cost for the delivery company [23]. If vehicles arrive after the customer’s desired time, the company must pay a penalty. However, these studies do not elaborate on the difference between late and on-time deliveries, for example, by considering different delay interval ranges. Other contributions, develop an accurate quantitative procedure to optimize order assignment to riders by minimizing delivery delays by first considering the application of riders’ working contracts regarding rights, shifts, and salary [24]. In the presented paper, an original heuristic algorithm for food delivery platforms is proposed to optimize customer orders assigned to riders in real time.
It is unclear to what extent the business models of the platform economy are aligned with economic, ecological, and social sustainability [25]. From an economic point of view, platform models reduce transaction costs, increase competition, and increase efficiency [26]. The negative environmental impact of platform models is extremely relevant since transportation is considered one of the most polluting activities [27]. Concerning social aspects, employees typically have a low level of qualifications and belong to a low-income group. Existing regulations are insufficient to ensure fundamental social rights in the platform economy [28]. Freelancer models reward hard-working riders who accept many orders, leading to efficiency and competition among them [29]. Although this model allows an above-average income for riders willing to accept many orders, it can lead to self-exploitation and an increased risk of accidents or health hazards [30]. Physically less capable riders are disadvantaged, which might lead to social hardships for elderly riders. The freelance model decreases the labor rights of the riders, both economically and in terms of social security [31]. In the employment model, the platform provider can determine routes for individual riders centrally by selecting the one best suited for a route and ensuring a balance between the entire fleet (e.g., a similar number of orders). Compared to the freelancer model, this substantially lowers competition between riders and can be seen as fair in terms of social justice, for example, by enabling older riders to participate in professional life.
This work presents a set of heuristics, generated from the reference algorithm, that differ in their logic and approach to the queue management of customer orders, but they dynamically assign customer orders to riders, as no delivery route has been previously defined. Thus, customer order requests are managed in real time, thereby minimizing the delivery time. The integration between the qualitative survey and the quantitative heuristic algorithm generates a detailed analysis regarding social sustainability (in terms of working conditions for riders) and operational costs for platforms.

3. Materials and Methods

From a qualitative point of view, to provide an empirical answer to H1, a survey instrument for riders was developed based on existing measurement items and constructs [32,33]. Items used to measure work motivation are based on a five-point Likert scale [34]. Items regarding perceived autonomy are included as a major impact factor for work motivation and performance, especially in digital work environments [35,36,37]. Finally, individual items regarding perceived control are included to capture the major (negative) impact it has on work motivation and work performance [38,39].
On the other hand, since defining an adequate order assignment strategy is convenient for both the platform and the riders, a quantitative model is developed that efficiently assigns orders to riders. It is dynamic because, while general parameters are set before its run, the input data on customers and restaurants are provided by the food delivery platform during the algorithm iterations, allowing for situation-based changes in real time. The restaurant information consists of an identifier and address used to determine polar coordinates and to calculate distances. From the customer side, the food platform provides several inputs, including the following:
  • Order ID;
  • Number of ordered items;
  • Date and time of order creation;
  • Order price;
  • Customer address;
  • ID of the restaurant whose products are ordered;
  • Restaurant address.
The model makes the following assumptions. (A1) Each rider uses a single means of transportation, i.e., bike, at a constant speed, and he/she delivers only one order at a time. This is primarily because the bike food delivery has constantly increased since the beginning of COVID-19 pandemic [40]. In addition, the platforms analyzed in the case study section employ riders who only ride bikes to deliver goods. Due to bike dimensions, to assure safety and satisfy the bike weight capacity, it is supposed that each rider delivers one order at a time. The endpoints of riders’ previous routes are also the starting points of their next delivery routes. (A2) The order preparation time is fixed at 10 min, starting when the order is assigned to a rider. A pre-order (i.e., an order created before being delivered at a particular hour) is not considered in our model; thus, all the orders need to be processed as soon as possible. (A3) Late deliveries (i.e., orders whose delivery time exceeds their predetermined time) generate costs for the platform since the platform organization reimburses a share of the price as a penalty. This share is determined by the amount of delay, with different ranges of penalties defined beforehand. (A4) Riders are assumed to work for a single platform.
Several general parameters are defined to complete the input section of the model, including the following:
  • Constant speed of the bike;
  • Total number of riders available;
  • Cost of a rider per hour (c_rider);
  • Constant preparation time for the order by the restaurant;
  • Number of hours per shift (n_hours);
  • Time intervals: useful to define whether an order is on time or late and, if it is late, whether the delay is considered acceptable, normal, or serious.
The model aims to assign each order to the rider closest to the pick-up point, thereby minimizing the total travelled distance. The adopted distance-based approach reduces the number of late deliveries because riders travel fewer kilometers and they spend less time delivering an order (i.e., starting from their current position, they pick up the goods from the restaurant and then carry it to the customer). By reducing the number of late deliveries, this approach also reduces costs, since increasing delays implies higher costs to be paid by the platform. The developed metaheuristic algorithm (named “reference algorithm”) follows two different flowcharts (Figure 1) running, respectively, when a new order arrives and a rider turns idle, and it leverages a set of model parameters listed in Table 1. The first flowchart starts with module A′, where a new order arrives at the platform at a specific time, and the number of total orders (n_ord) is updated. The first decision module (module B′) checks whether all riders are busy by counting the indicator qi, a binary parameter with qi = 1 if the rider is busy and qi = 0 if the rider has no order assigned. If there are no idle riders, the new order is put in the order queue, waiting for a free rider, and the number of orders in the queue (n_ord_queue) is increased by one unit (module C′). Otherwise, if at least one rider is idle a second decision module (module D′) is addressed to check if there are older orders waiting in the queue. Indeed, older orders have precedence over the new ones. Therefore, if the queue is not empty, the selection of the order to be satisfied is defined according to one of the three assignment heuristics described in Figure 2 (module E′). After processing one of the orders in the queue through the queue management heuristic selected, the flow returns to module B′ to check whether other riders are available, and the loop is restarted. On the other hand, if no orders are waiting in the queue, the new order is directly assigned to the rider closest to the pickup point (module F′). The second flowchart (Figure 1b) runs when a rider becomes available, and its first step (module A″) updates the situation of all riders. In particular, for each rider i, the rider is set to “idle” if its delivery time Tdeli is lower than the current time of the day Tnow since this means that the rider has fulfilled its order and he/she becomes available. The decision module (module B″) checks whether there is at least one order in the queue. If so, the order is processed following one of the three queue management heuristics described in Figure 2 (module C″); otherwise, the available riders are placed in the riders queue n_rid_queue, waiting for a new order.
This reference algorithm contains three heuristics that differ in the order queue management to decide which order to take first (Figure 2). The first heuristic follows first-in-first-out (FIFO) logic. Each order o is considered, and the heuristic chooses the one with the minimum time of arrival in queue To. This order is assigned to the idle rider closest to the position of the restaurant of the order o. The second heuristic is based on minimum distances, prioritizing the order that minimizes the rider–restaurant geographical distance. This does not imply a structural data bias since bicycle transportation allows riders to cross narrow streets and parks and, thus, Euclidean distance-based algorithms accurately approximate real network distances in this kind of logistics distribution [41]. This heuristic analyses each order combination in the queue and available riders to find the pair that minimizes the total travelled distance Dtoti,o. Thus, in this second heuristic, the time spent in queue is not considered and, thus, a recent order could be selected first if it is closer than the others to one of the idle riders. The last heuristic considers the order price because it prioritizes the most expensive order in the queue; it checks all the orders o and selects the one with the highest price Po. This reduces losses related to delays for the platform because delays cause a cost based on the order price; this heuristic ensures that expensive orders are on time and minimizes penalties paid. The last two heuristics are distinguished by a time boundary related to the waiting time in queue. If an order is waiting in queue for a time greater than the time constraint defined, it earns priority independent of the heuristic logic. This helps reduce the number of late orders and the amount of delay because if planners followed just the heuristic logic, several orders would accumulate a huge delay, as they would never be the best (i.e., they would never optimize the objective function of the specific heuristic considered). Besides the parameters in Table 1, these three heuristics require additional parameters, listed in Table 2.

4. Case Study

4.1. Survey Set-Up

The implemented multi-method approach starts with a qualitative survey of 136 urban food delivery riders to ascertain the research question and hypotheses. Participants include, on one side, two groups of 50 riders each from Germany surveyed in December 2019–January 2020 and March–April 2021 and, on the other side, a group of 36 riders from Italy surveyed in March–April 2021. Of these 136 participants, 104 are male (76.47%), and 32 are female (23.53%). The share of women is similar in both Germany (24.00%) and Italy (22.22%). The average age of the total sample is 30.89 years (Germany: 29.50; Italy: 34.75).

4.2. Instances for the Quantitative Algorithm

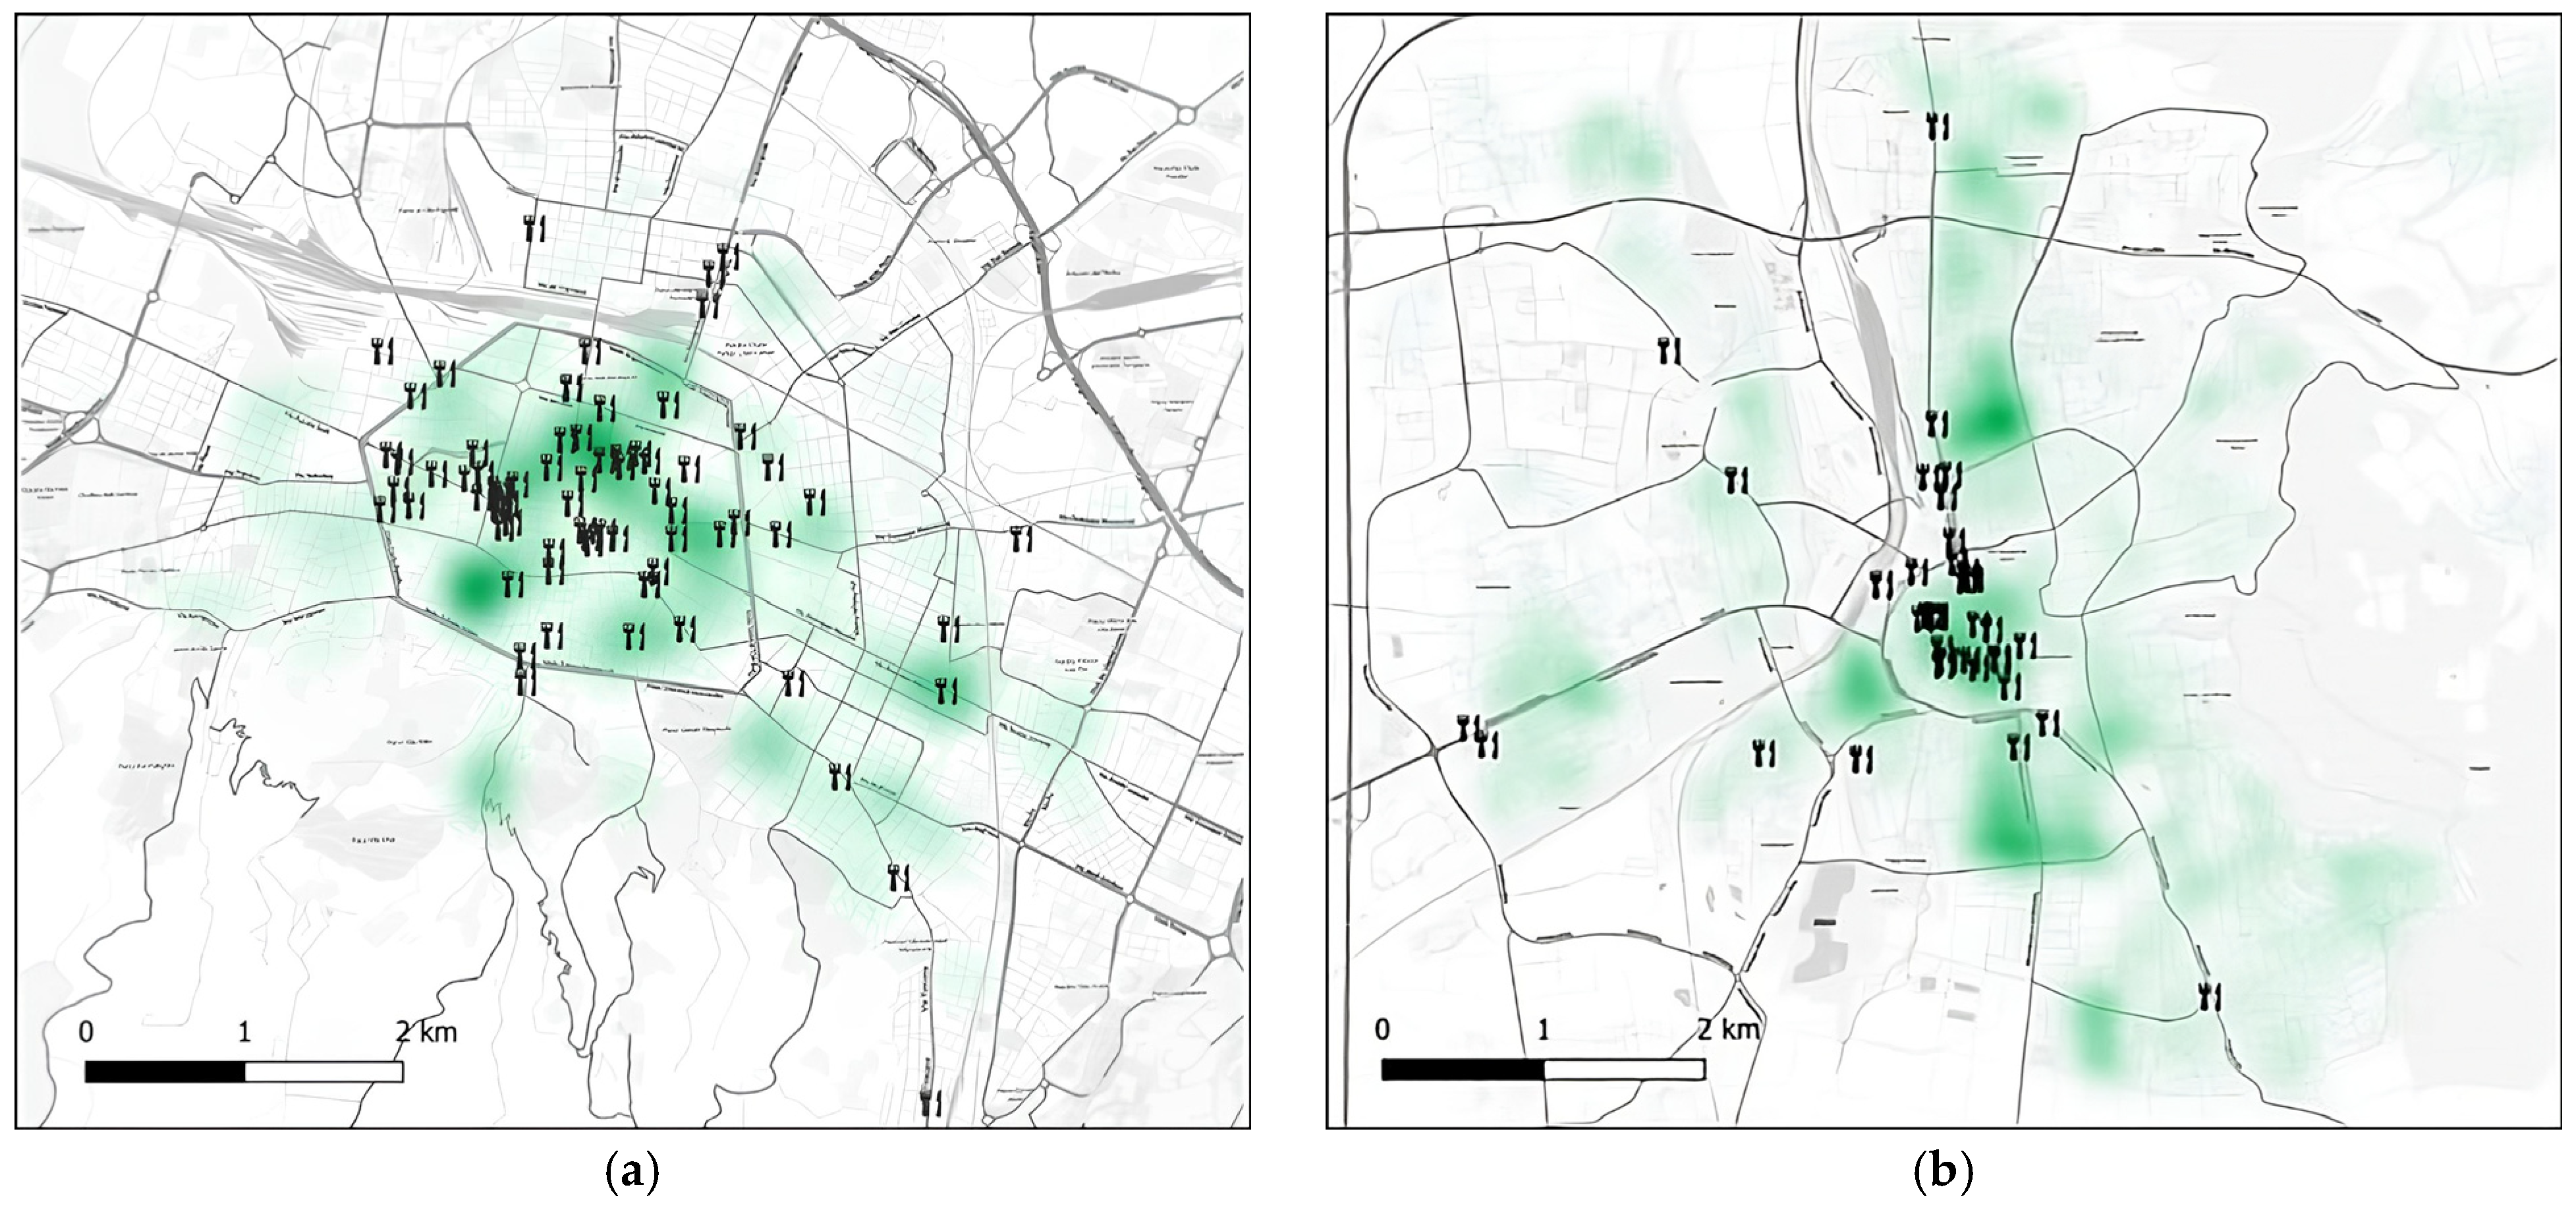
Two different instances, one in Bologna (Italy) and one in Gottingen (Germany), are represented in our comparative setting (Figure 3).
The data are available as an Excel spreadsheet containing all relevant parameters (see Section 2) of some working evenings in the period October–November 2019 (Table 3). These instances differ in terms of weather conditions and type of working day, i.e., weekday or weekend. Therefore, the presented model could find the best queue management heuristic for several situations. The platform also provided data for the average speed of their riders’ bikes—9.3 km/h—which was used in both models. Each evening contained 80–120 orders processed in a 4 h shift, from 6:30– to 10:30 p.m. in Italy and from 6 to 10 p.m. in Germany. Figure 4 illustrates the two demand types. During a weekday, there is just one peak of orders around the typical dinner hour of the country observed; however, during a weekend day, there are two peaks, one early and one afterwards in the evening.
The total number of considered restaurants is 75 for Italy and 41 for Germany, while the total number of customers is 290 for Italy and 192 for Germany. Furthermore, in Italy, the hourly income of a rider is EUR 8.91/h, while in Germany, this income is EUR 9.19/h. Another difference between the two countries is the delivery charge earned by the platform, which amounts to EUR 0.50/km in Italy, while this variable does not exist in Germany. As stated by A3, some intervals are defined to quantify the order delay, since customers want their meal as soon as possible. For Italy and Germany, the business model includes the following time ranges within which the delivery time (Td) can fall:
  • Td <= 45 min: order in time (no penalty for the platform)
  • 45 min < Td <= 60 min: medium delay and, thus, 50% discount for the customer of the current order
  • Td > 60 min: high delay and, thus, 100% discount for the customer in the current order
This data allows us to calculate the economic indicator (Keco) for each scenario, which represents the platform’s profit per order (Equation (1)):
K e c o = o = 1 n_ord P o · 0.3 + i = 1 n_riders_tot o = 1 n_ord D i , o tot · 0.5 · penalty c_rider · n_riders_tot · n_hours n_ord
where penalty is the discount for the customer applied to a delayed order. In the numerator, the first term represents the revenues of the platform due to both orders and travel, while the second term represents the costs of the platform due to the riders’ salary.

5. Results

5.1. Rider Survey

In 2020 and 2021, 136 food distribution riders in Germany and Italy have been interviewed on their work situation. All riders in the survey deliver an average order number of 11.00 deliveries per day and shift (12.61 for the German riders and 8.69 for the Italian riders). The average number of delayed orders at the customer address is 2.49 per rider (3.36 in Germany, 1.21 in Italy), two-thirds of which have less than a 15 min delay, and one-third have a 15–30 min delay. It can be observed that riders transport fewer orders with greater accuracy in Italy than in Germany. This is connected to specific regulations (e.g., addressing late deliveries). Individual country and platform model regulations differ in terms of the possibility for riders to reject orders. In the Italian freelancer model, riders usually had the option to reject single and multiple orders from the platform, while for the German riders in the employment model, this was usually not an option. These results related to Hypothesis H1 and are presented in Table 4. For H1, we find the following results among German and Italian riders: on average, work motivation items earn 0.05 to 0.62 times better approval scores with Italian freelance riders. The difference was least for the item “I am enthusiastic about my job” and largest for “I put all my effort into the job”. Therefore, Hypothesis H1 was rejected. This is also affected by the specific country regulations regarding the gig economy, since Italian freelance riders have gained more legal protection and labor rights [42]. Regarding this aspect, a recent literature review revealed that the exploration and analysis of freelance work in urban distribution logistics already addresses two of the four major factors for work motivation in sharing economy research [43]. Therefore, the observation of this manuscript that freelance work in urban logistics is associated with a greater level of work motivation is an important contribution to the theory in this field. Therefore, this paper shows that formal characteristics, such as specific employment status, might not be as crucial for business success or worker motivation as was assumed. In light of the presented results, we propose that internal processes (e.g., order allocation to riders and rating systems for riders) are important for the platform’s overall success.
The second and third hypotheses focus on workers’ autonomy and control perceptions in platform systems in Germany and Italy. Regarding H2 (Table 5), Italian freelance riders perceive, on average, higher levels of autonomy. For the statement, “I can decide for myself in which way I complete my work,” Italian freelance riders respond with a high average value of 1.42. In contrast, German-employed riders report an average of 2.09. The lowest autonomy is associated with the item, “Do you have any influence on the amount of work you are given?” with an average of 3.35 in Italy and 3.52 in Germany. In this case, the freelance riders’ ability to reject orders does not impact their perception of autonomy. Therefore, H2 is accepted.
Regarding control perception (Table 6), the data indicate that, on average, the German employment model leads to a lower perception of control than the Italian freelance model. Among the different control modes, the least control is perceived from colleagues (average 4.27 in Italy and 4.41 in Germany), and the most from technology (1.57 in Italy and 2.07 in Germany). This highlights the central role that digital platforms and smartphone applications play for riders, including individual order and location tracking. As a result, H3 is rejected.
Therefore, the findings, especially regarding work motivation, are ambivalent, and the crucial question is whether social sustainability can be reached based on these work perceptions and motivation results.

5.2. Heuristic Analysis

After defining the input parameters for the case study, the quantitative model runs for weekdays and weekends in both Italy and Germany by varying the number of riders in each cycle. The goal is to identify the number of riders that maximizes the economic indicator in each scenario, thereby optimizing the platform’s profit. As stated in Section 1, the main objective of this metaheuristic algorithm is to assess the economic sustainability of the employment model when directed by a central server implementing specific order assignment and routing algorithms.
In both countries, the price-based heuristic proves most profitable during weekends, while the distance-based heuristic performs best on weekdays (see Table 7). On weekends, the price-based heuristic works best because the percentage of expensive orders (i.e., >EUR 50) is higher than during weekdays. As a result, the price-based heuristic prioritizes these orders to ensure timely deliveries. This limits the platform’s penalties, which then apply only to cheaper orders. Conversely, on weekdays, the distance-based heuristic yields better results, as order price variation is minimal, and the key concern becomes minimizing the number of delayed orders rather than their value. This heuristic reduces the travel distance and, subsequently, the time required for deliveries. The platform’s profit is slightly lower in Germany than in Italy because, in Italy, the platform gains an additional delivery charge of EUR 0.50/km paid by the customer, and the cost of labor is lower. To improve comparability between the two countries and journey types, the number of riders is expressed as riders per 100 orders instead of an absolute value.
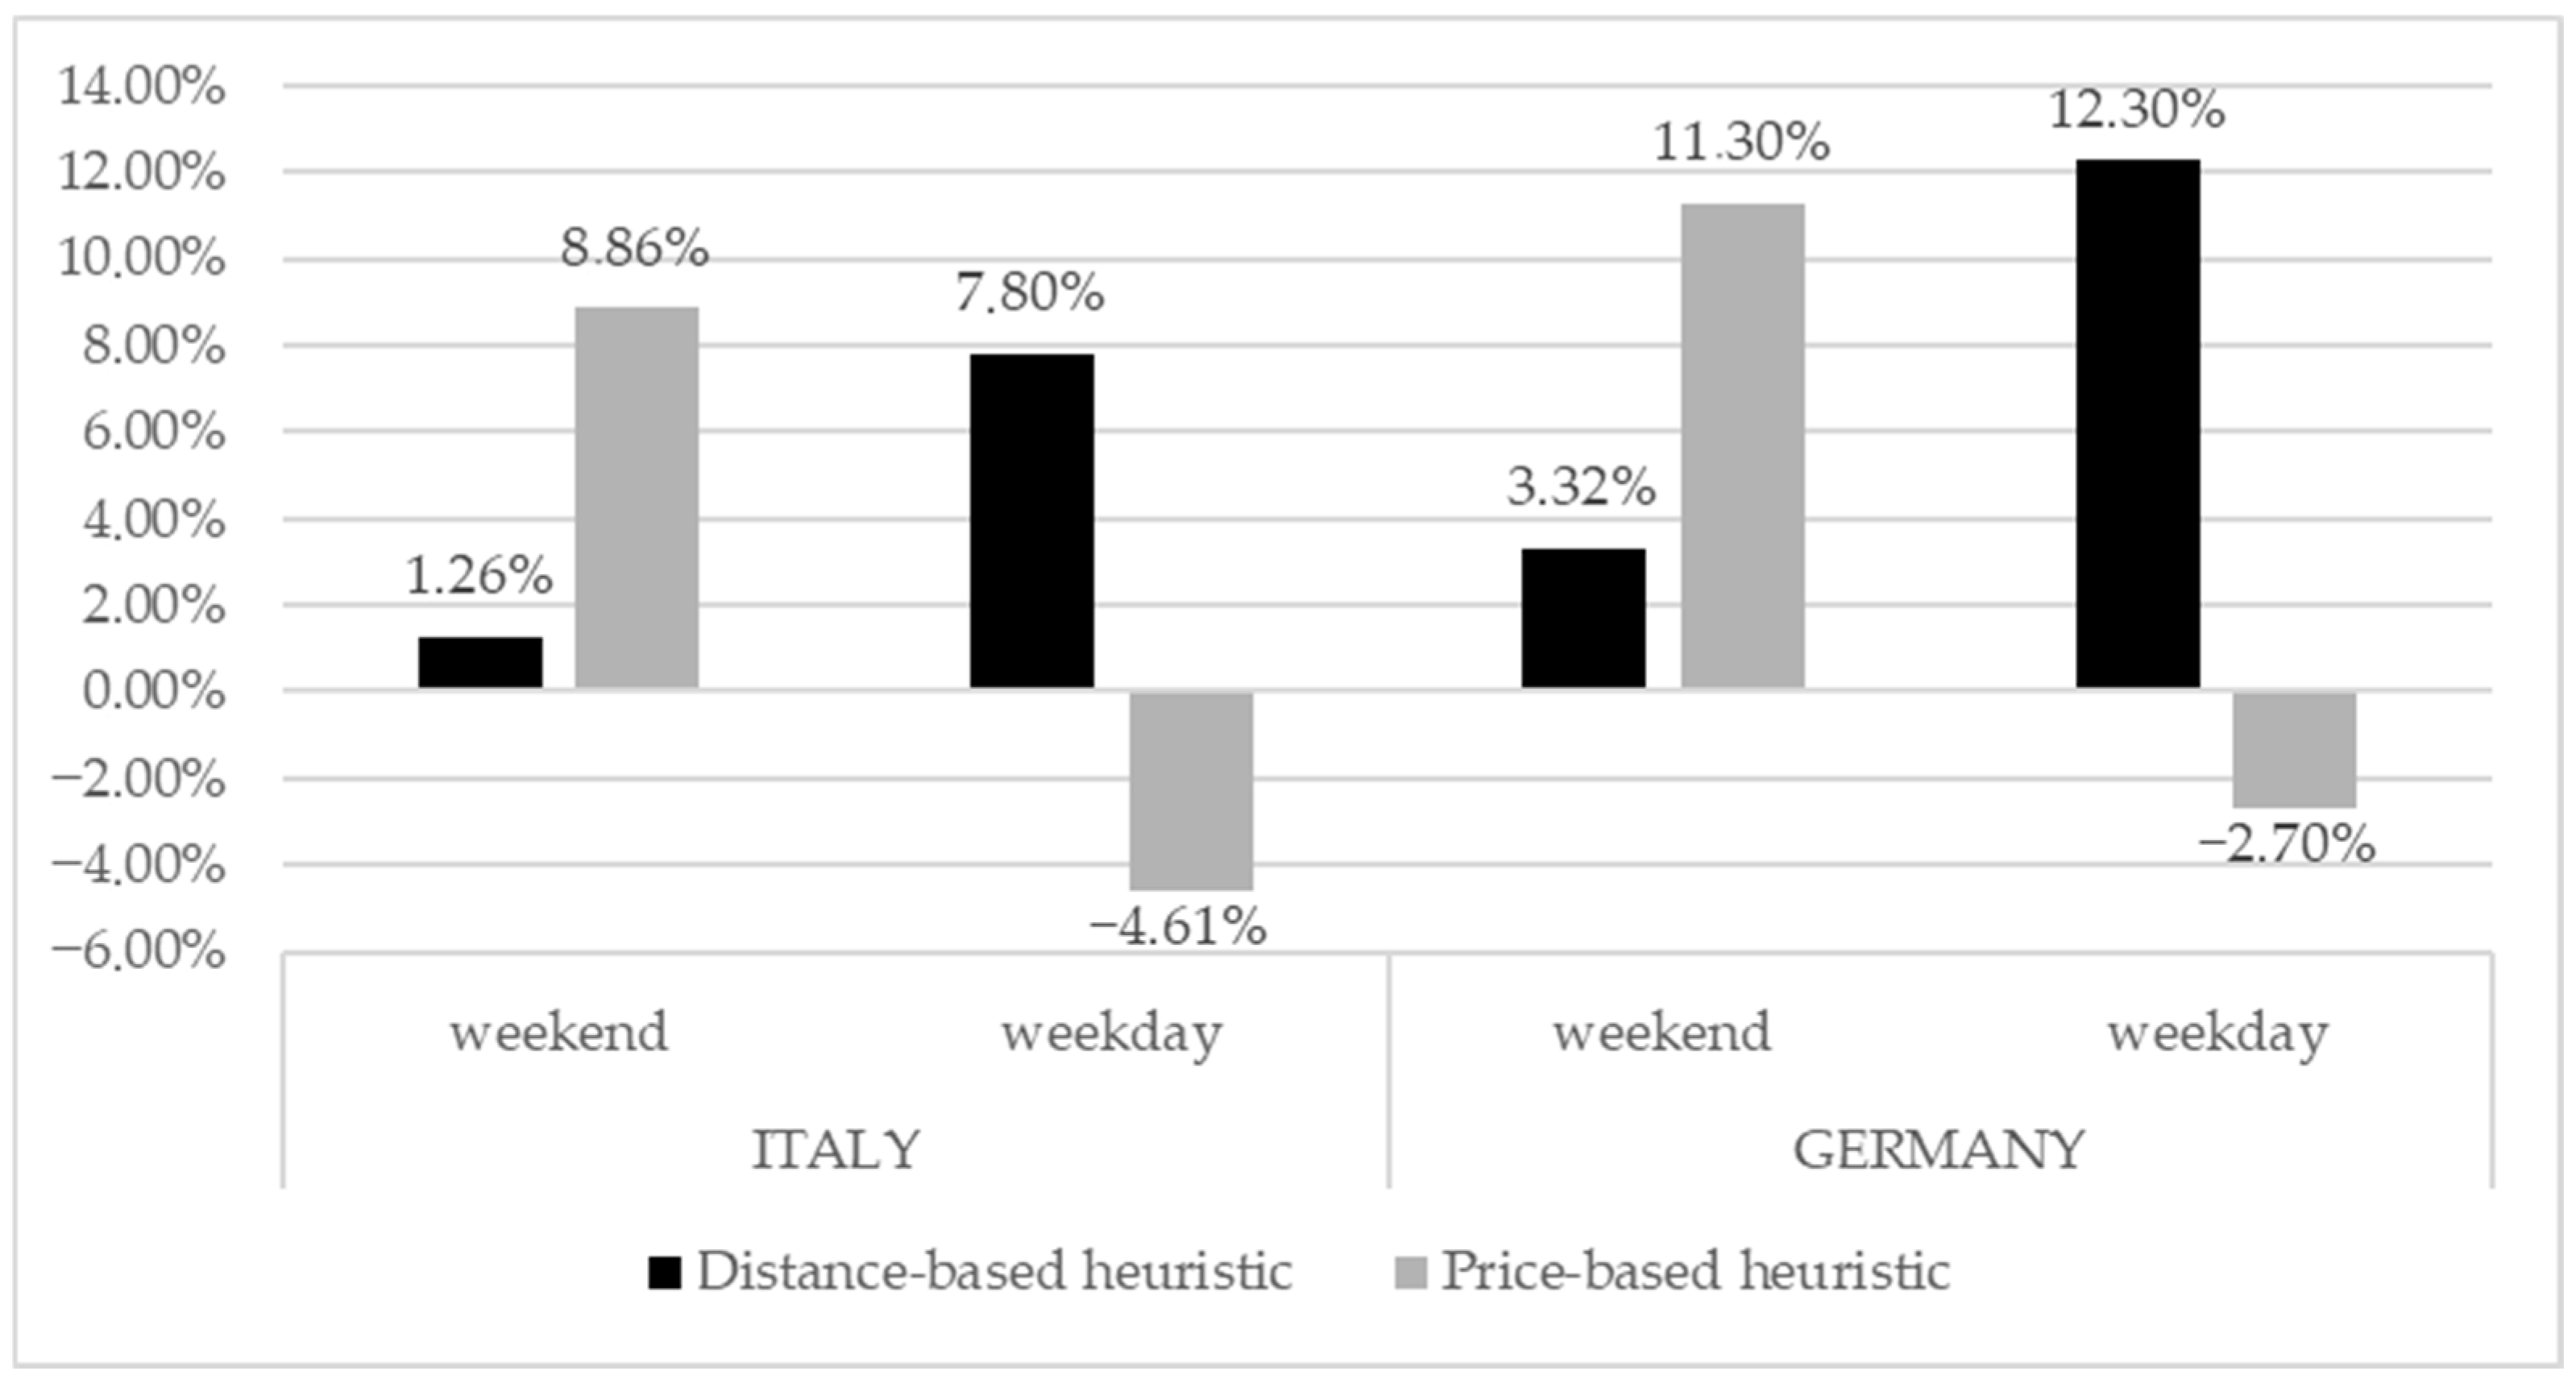
It is important to dynamically change the adopted heuristic according to the specific situation. Otherwise, a less optimal heuristic can cause a lower profit for the platform. Indeed, when considering FIFO logic as the base heuristic, it is possible to calculate the profit rate of the other heuristics compared to the FIFO one. As shown in Figure 5, the price-based heuristic allowed the greatest profit increment on the weekend compared to FIFO logic. However, when the price-based heuristic was applied to a weekday, it became worse because the profit was even lower than the profit obtained using FIFO logic.
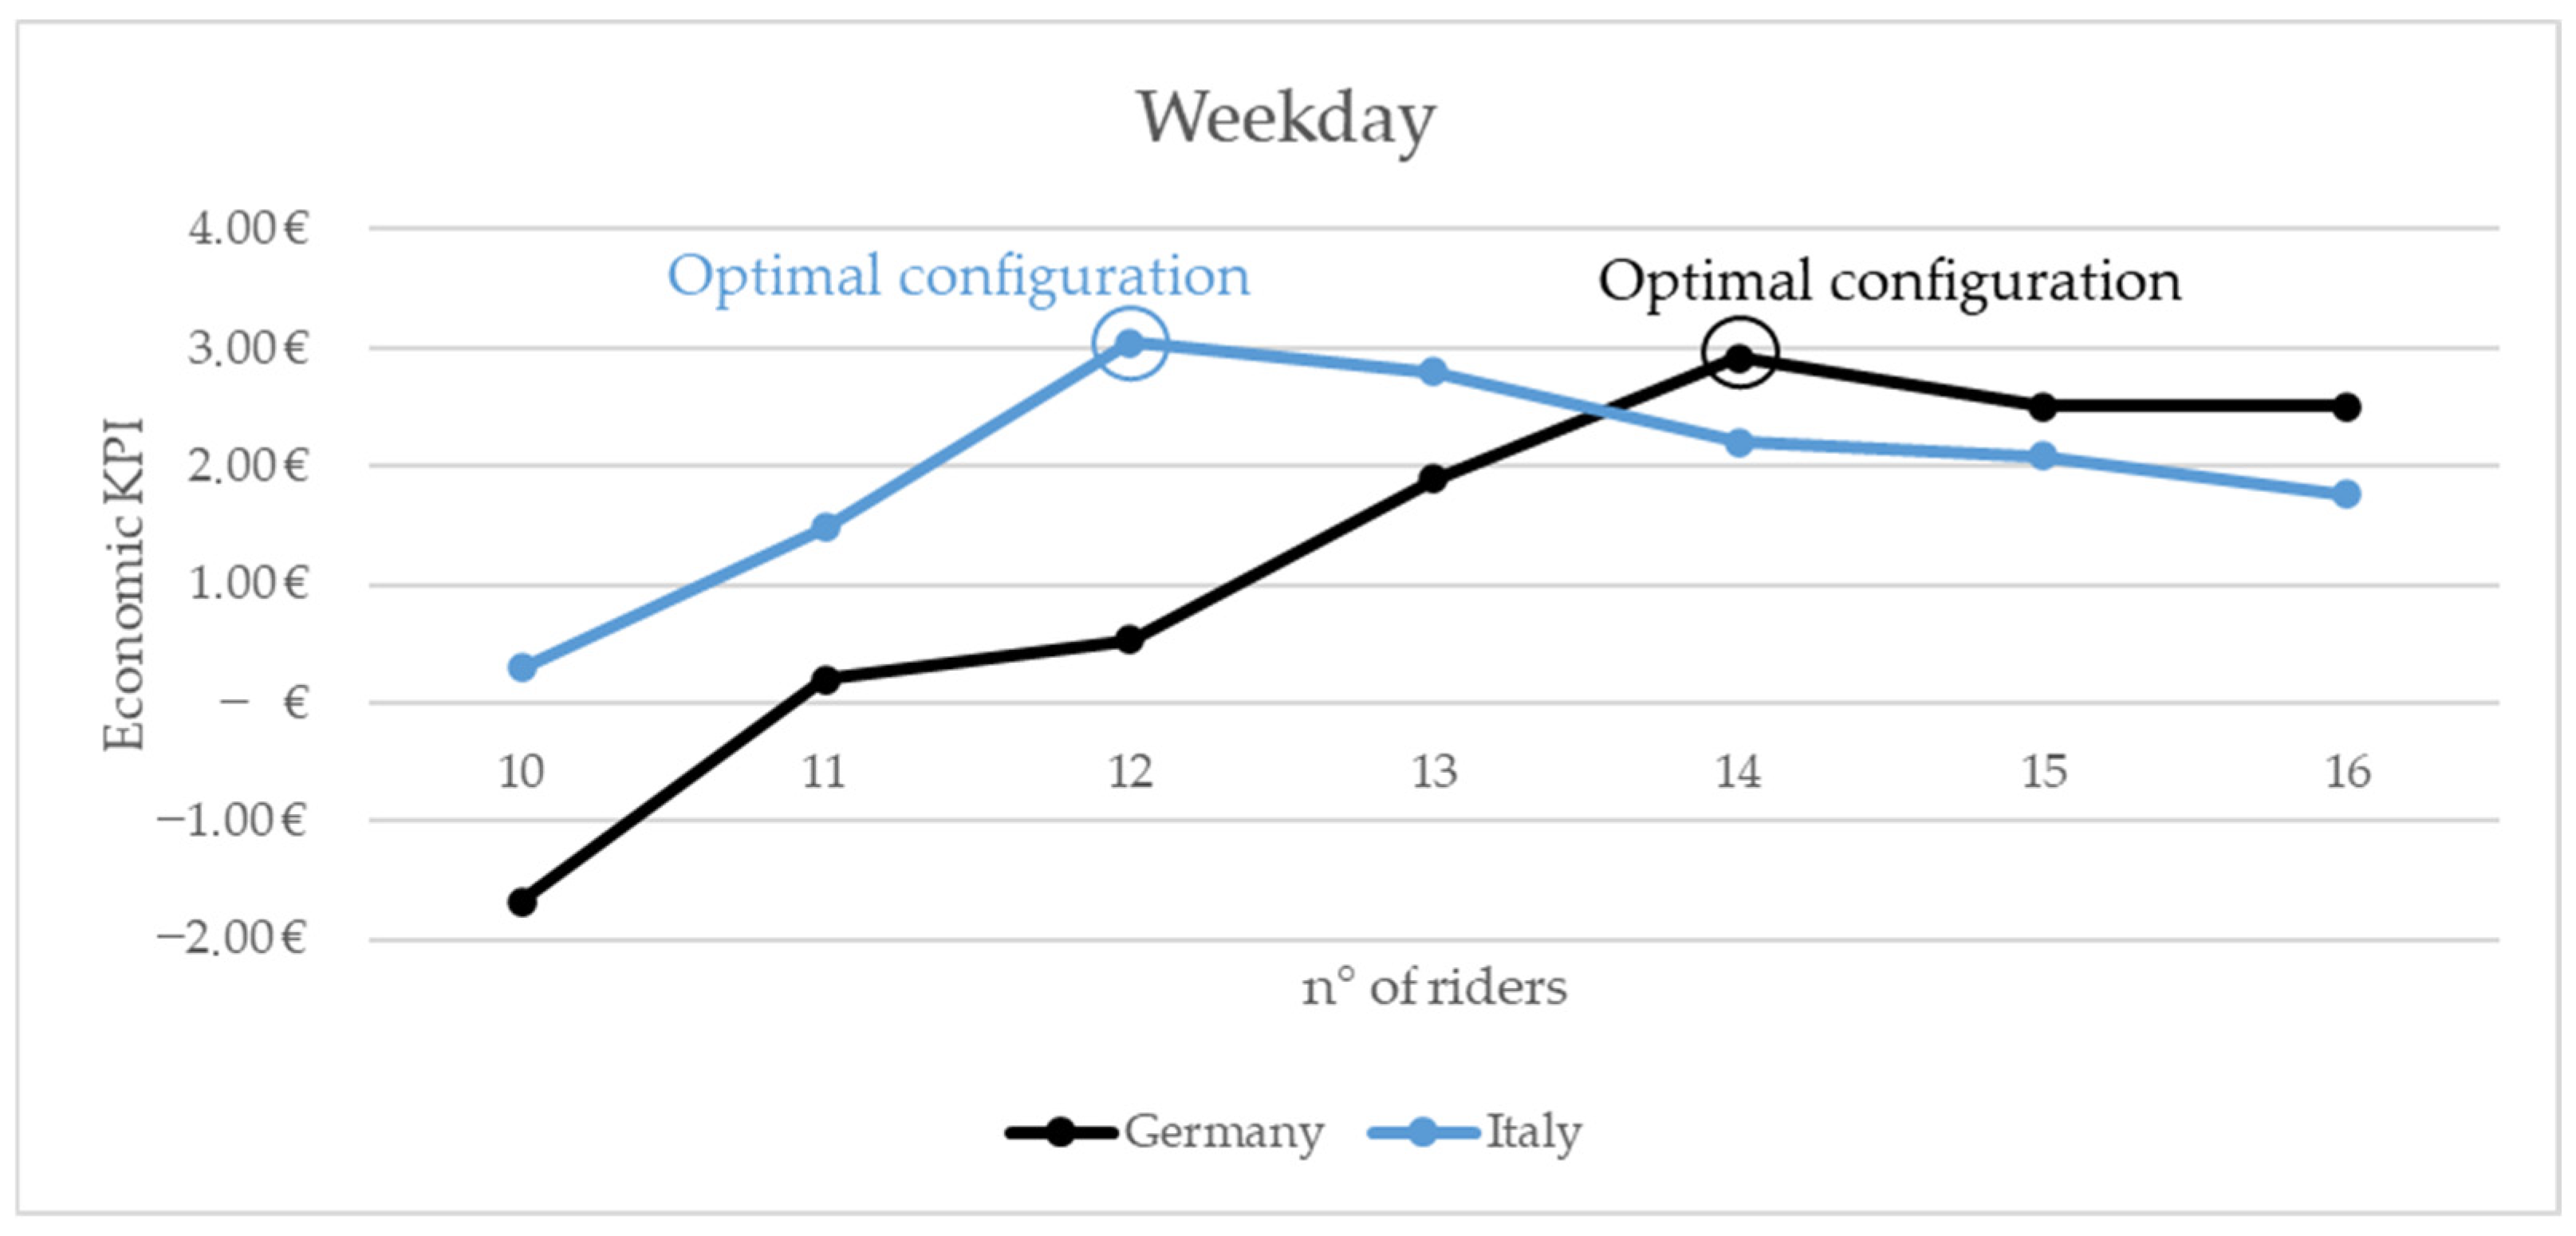
Besides choosing the best heuristic, the model is implemented for different number of riders to find the best configuration within that heuristic. The distance-based variant reports that incorrect rider scheduling significantly affects the platform’s profit. Underestimating riders is worse than overestimating them. In the former case, the platform risks a low profit, while in the latter, the profit does not decrease significantly compared to the optimal configuration (Figure 6).
After having found the best heuristics for each situation regarding economic aspects, the analysis focused on the logistic ones (Table 8). The average time to deliver an order ranged from 30 to 39 min and it was substantially less than the boundary of 45 min set for on-time orders. Furthermore, the average rate of delayed orders ranged between 11% and 18% for Italy and between 22% and 26% for Germany. The average distances travelled ranged from 3.4 to 5.0 km. The results show that a centralized business model was still profitable for the platform, even with fairer contracts for riders compared to the ones currently deployed in the freelance model.
It is important to highlight that these findings can also be affected by the national or regional regulations of each case study. Indeed, Italy and Germany are distinguished by different norms in terms of labor rights in gig economy [39].

6. Conclusions

With the applied rider survey and data calculation model, the detailed analysis conducted in this study, comparing employment and freelance models, shows the following. First, work motivation is, on average, greater in the Bologna (Italian) freelance model compared to the Göttingen (German) employment model, with the only exception being that the perception of being “enthusiastic” about the job is at a similarly low level (H1 rejected). Second, workers’ autonomy perception reaches greater levels with the freelance model (Italian case, H2 accepted). Third, workers control perception reaches greater levels with the freelance model (Italian case, H3 rejected). Finally, it is possible to show that a centralized route planning approach in an employment model can generate operational profits linked to the allocation and routing decision principles of FIFO, distance-based, and price-based (depending on weekday/weekend) propositions. Data access for this study is limited to the two cities of Bologna and Göttingen. However, as platform business models are generally reluctant to provide any data access, the opportunity to analyze these data for the two cities is unique. Further research should replicate the analysis of workers’ perceptions to further strengthen the knowledge related to the findings presented here. For the survey study within Italy, the accessed sample might not entirely reflect the total rider population, since some of the migrant riders might have been repelled by the questionnaire’s required language and comprehension capabilities. In general, we provide a starting point for further research in addition to these limitations. Future research could leverage additional research opportunities. Other countries could be included to generalize the findings, which is promising because the specific sharing economy principles and characteristics found in different countries, even within a homogeneous market such as the European Union, are diverse. The employment model for urban food riders has also been implemented in the Netherlands and France, whereas the freelance model is used in Denmark, Spain, and Finland. For this reason, possible future research could focus on the implementation of this developed algorithm to other countries and the comparison among all the different case studies. In this future development, the policies of different country regarding food delivery platforms could also be considered to increase the reliability of the study. Another further research direction could include the renewal of the case studies, both by considering platform data collected in 2025, and by administering the survey again to a rider sample. In the end, in the future the correlation between urban traffic and delivery time could be an interesting topic to further explore. Additional decision parameters might exist for the configuration of platform systems in logistics areas, especially the employment scheme. Therefore, results obtained are crucial for further verification and discussion in operations, logistics, and supply chain management.

Author Contributions

Conceptualization, R.T. and F.P.; methodology, R.T.; software, R.T.; validation, F.P.; formal analysis, R.T.; resources, F.P.; data curation, R.T. and F.P.; writing—original draft preparation, R.T.; writing—review and editing, R.T. and F.P.; supervision, F.P. All authors have read and agreed to the published version of the manuscript.

Funding

This research received no external funding.

Institutional Review Board Statement

This study is waived for ethical review as the data being processed was anonymous and aggregated by Institution Committee.

Informed Consent Statement

Informed consent for participation was obtained from all subjects involved in the study.

Data Availability Statement

Dataset available on request due to restrictions for privacy reasons.

Acknowledgments

We would like to express gratitude to Matthias Klumpp and Andreas Wieland, as well as to Mathias Willnat for their invaluable support and for their insightful contributions.

Conflicts of Interest

The authors declare no conflicts of interest.

References

  1. Alaimo, C.; Kallinikos, J. Managing by Data: Algorithmic Categories and Organizing. Organ. Stud. 2021, 42, 1385–1407. [Google Scholar] [CrossRef]
  2. Chiang, Y.C.; Huang, J.; Chou, C.J. A study on the business model of food delivery platform. Int. J. Organ. Innov. 2024, 16, 125–141. [Google Scholar]
  3. Suguna, M.; Shah, B.; Raj, S.K.; Suresh, M. A Study on the Influential Factors of the Last Mile Delivery Projects during COVID-19 Era. Oper. Manag. Res. 2022, 15, 399–412. [Google Scholar] [CrossRef]
  4. Poon, W.C.; Tung, S.E.H. The Rise of Online Food Delivery Culture during the COVID-19 Pandemic: An Analysis of Intention and Its Associated Risk. Eur. J. Manag. Bus. Econ. 2024, 33, 54–73. [Google Scholar] [CrossRef]
  5. Collignon, S.E.; Sternberg, H.S. Adoption of Multiple Electronic Marketplaces: Antecedents from a Grounded Theory Study. J. Bus. Logist. 2020, 41, 310–333. [Google Scholar] [CrossRef]
  6. Ulmer, M.W.; Thomas, B.W.; Campbell, A.M.; Woyak, N. The Restaurant Meal Delivery Problem: Dynamic Pickup and Delivery with Deadlines and Random Ready Times. Transp. Sci. 2021, 55, 75–100. [Google Scholar] [CrossRef]
  7. Tassinari, A.; Maccarrone, V. Riders on the Storm: Workplace Solidarity among Gig Economy Couriers in Italy and the UK. Work. Employ. Soc. 2020, 34, 35–54. [Google Scholar] [CrossRef]
  8. Davis-Sramek, B.; Richey, R.G. Logistics for a Better World. J. Bus. Logist. 2022, 43, 294–296. [Google Scholar] [CrossRef]
  9. Chen, X.; Wu, S.; Shi, C.; Huang, Y.; Yang, Y.; Ke, R.; Zhao, J. Sensing Data Supported Traffic Flow Prediction via Denoising Schemes and ANN: A Comparison. IEEE Sens. J. 2020, 20, 14317–14328. [Google Scholar] [CrossRef]
  10. Wang, Q.; Churchill, B. Risky Business: How Food-Delivery Platform Riders Understand and Manage Safety at Work. J. Sociol. 2025, 61, 291–307. [Google Scholar] [CrossRef]
  11. Hildebrandt, F.D.; Ulmer, M.W. Supervised Learning for Arrival Time Estimations in Restaurant Meal Delivery. Transp. Sci. 2022, 56, 1058–1084. [Google Scholar] [CrossRef]
  12. Peng, L.; Shui, S.; Li, Z.; Yang, J. Food Delivery Couriers and Their Interaction with Urban Public Space: A Case Study of a Typical “Takeaway Community” in the Wuhan Optics Valley Area. Sustainability 2022, 14, 6238. [Google Scholar] [CrossRef]
  13. Lin, P.M.C.; Au, W.C.; Leung, V.T.Y.; Peng, K.-L. Exploring the Meaning of Work within the Sharing Economy: A Case of Food-Delivery Workers. Int. J. Hosp. Manag. 2020, 91, 102686. [Google Scholar] [CrossRef]
  14. Leschke, J.; Scheele, L. Predictability and Transparency of Working Conditions for Food Delivery Platform Workers across Selected EU Countries. Soc. Policy Adm. 2024, 58, 638–657. [Google Scholar] [CrossRef]
  15. Van Yperen, N.W.; Wörtler, B.; De Jonge, K.M.M. Workers’ Intrinsic Work Motivation When Job Demands Are High: The Role of Need for Autonomy and Perceived Opportunity for Blended Working. Comput. Hum. Behav. 2016, 60, 179–184. [Google Scholar] [CrossRef]
  16. Borghetti, F.; Caballini, C.; Carboni, A.; Grossato, G.; Maja, R.; Barabino, B. The Use of Drones for Last-Mile Delivery: A Numerical Case Study in Milan, Italy. Sustainability 2022, 14, 1766. [Google Scholar] [CrossRef]
  17. Galkin, A.; Obolentseva, L.; Balandina, I.; Kush, E.; Karpenko, V.; Bajdor, P. Last-Mile Delivery for Consumer Driven Logistics. Transp. Res. Procedia 2019, 39, 74–83. [Google Scholar] [CrossRef]
  18. Pilati, F.; Tronconi, R. Tri-Objective Vehicle Routing Problem to Optimize the Distribution Process of Sustainable Local E-Commerce Platforms. Sustainability 2024, 16, 1810. [Google Scholar] [CrossRef]
  19. Toth, P.; Vigo, D. (Eds.) Vehicle Routing: Problems, Methods, and Applications, 2nd ed.; MOS-SIAM series on optimization; Society for Industrial and Applied Mathematics: Philadelphia, PA, USA, 2014; ISBN 978-1-61197-358-7. [Google Scholar]
  20. Zheng, T.; Grosse, E.H.; Morana, S.; Glock, C.H. A Review of Digital Assistants in Production and Logistics: Applications, Benefits, and Challenges. Int. J. Prod. Res. 2024, 62, 8022–8048. [Google Scholar] [CrossRef]
  21. Liu, X.; Qiu, L.; Fang, Y.; Wang, K.; Li, Y.; Rodríguez, J. Event-Driven Based Reinforcement Learning Predictive Controller Design for Three-Phase NPC Converters Using Online Approximators. IEEE Trans. Power Electron. 2025, 40, 4914–4926. [Google Scholar] [CrossRef]
  22. Xu, H.; Qian, W.; Guo, K.; Wang, X. Research on Takeaway Delivery Route Optimization Problem Considering Merchant Priority. Sustainability 2024, 16, 11127. [Google Scholar] [CrossRef]
  23. Rajabi-Bahaabadi, M.; Shariat-Mohaymany, A.; Babaei, M.; Vigo, D. Reliable Vehicle Routing Problem in Stochastic Networks with Correlated Travel Times. Oper. Res. Int. J. 2021, 21, 299–330. [Google Scholar] [CrossRef]
  24. Dai, H.; Tao, J.; Jiang, H.; Chen, W. O2O On-Demand Delivery Optimization with Mixed Driver Forces. IFAC-PapersOnLine 2019, 52, 391–396. [Google Scholar] [CrossRef]
  25. Geissinger, A.; Laurell, C.; Öberg, C.; Sandström, C. How Sustainable Is the Sharing Economy? on the Sustainability Connotations of Sharing Economy Platforms. J. Clean. Prod. 2019, 206, 419–429. [Google Scholar] [CrossRef]
  26. Lehdonvirta, V.; Kässi, O.; Hjorth, I.; Barnard, H.; Graham, M. The Global Platform Economy: A New Offshoring Institution Enabling Emerging-Economy Microproviders. J. Manag. 2018, 45, 567–599. [Google Scholar] [CrossRef] [PubMed]
  27. Gao, L.; Zhan, M. Route Optimization of Multimodal Transport Considering Regional Differences under Carbon Tax Policy. Sustainability 2025, 17, 5743. [Google Scholar] [CrossRef]
  28. Fabo, B.; Karanovic, J.; Dukova, K. In Search of an Adequate European Policy Response to the Platform Economy. Transf. Eur. Rev. Labour Res. 2017, 23, 163–175. [Google Scholar] [CrossRef]
  29. Huang, N.; Burtch, G.; Hong, Y.; Pavlou, P.A. Unemployment and Worker Participation in the Gig Economy: Evidence from an Online Labor Market. Inf. Syst. Res. 2020, 31, 431–448. [Google Scholar] [CrossRef]
  30. Li, C.; Mirosa, M.; Bremer, P. Review of Online Food Delivery Platforms and Their Impacts on Sustainability. Sustainability 2020, 12, 5528. [Google Scholar] [CrossRef]
  31. Muszyński, K.; Pulignano, V.; Marà, C. Product Markets and Working Conditions on International and Regional Food Delivery Platforms: A Study in Poland and Italy. Eur. J. Ind. Relat. 2022, 28, 295–316. [Google Scholar] [CrossRef]
  32. Rauch, E.; Linder, C.; Dallasega, P. Anthropocentric Perspective of Production before and within Industry 4.0. Comput. Ind. Eng. 2020, 139, 105644. [Google Scholar] [CrossRef]
  33. Robijn, W.; Euwema, M.C.; Schaufeli, W.B.; Deprez, J. Leaders, Teams and Work Engagement: A Basic Needs Perspective. Career Dev. Int. 2020, 25, 373–388. [Google Scholar] [CrossRef]
  34. Rich, B.L.; Lepine, J.A.; Crawford, E.R. Job Engagement: Antecedents and Effects on Job Performance. Acad. Manag. J. 2010, 53, 617–635. [Google Scholar] [CrossRef]
  35. Junge, A.L.; Straube, F. Sustainable Supply Chains—Digital Transformation Technologies’ Impact on the Social and Environmental Dimension. Procedia Manuf. 2020, 43, 736–742. [Google Scholar] [CrossRef]
  36. Hu, Q.; Lu, Y.; Pan, Z.; Gong, Y.; Yang, Z. Can AI Artifacts Influence Human Cognition? The Effects of Artificial Autonomy in Intelligent Personal Assistants. Int. J. Inf. Manag. 2021, 56, 102250. [Google Scholar] [CrossRef]
  37. Cirillo, V.; Rinaldini, M.; Staccioli, J.; Virgillito, M.E. Technology vs. Workers: The Case of Italy’s Industry 4.0 Factories. Struct. Change Econ. Dyn. 2021, 56, 166–183. [Google Scholar] [CrossRef]
  38. Wallenburg, C.M.; Johne, D.; Cichosz, M.; Goldsby, T.J.; Knemeyer, A.M. Alignment Mechanisms for Supplier-Initiated Innovation: Results from the Logistics Service Industry. J. Purch. Supply Manag. 2019, 25, 100575. [Google Scholar] [CrossRef]
  39. Schedlinsky, I.; Schmidt, M.; Wöhrmann, A. Interaction of Information and Control Systems: How the Perception of Behavior Control Affects the Motivational Effect of Relative Performance Information. Account. Organ. Soc. 2020, 86, 101171. [Google Scholar] [CrossRef]
  40. McKinsey&Company. The Two-Wheeled Commute: Micromobility and Your Future. Available online: https://www.mckinsey.com/industries/automotive-and-assembly/our-insights/the-two-wheeled-commute-micromobility-and-your-future (accessed on 6 September 2025).
  41. Hartmann, V.; Schuhmacher, D. Semi-Discrete Optimal Transport: A Solution Procedure for the Unsquared Euclidean Distance Case. Math. Methods Oper. Res. 2020, 92, 133–163. [Google Scholar] [CrossRef]
  42. PwC Legal. Gig Economy 2021. Available online: https://www.pwclegal.be/en/FY21/gig-economy-report-v3-2021.pdf (accessed on 2 September 2025).
  43. Klarin, A.; Suseno, Y. A State-of-the-Art Review of the Sharing Economy: Scientometric Mapping of the Scholarship. J. Bus. Res. 2021, 126, 250–262. [Google Scholar] [CrossRef]
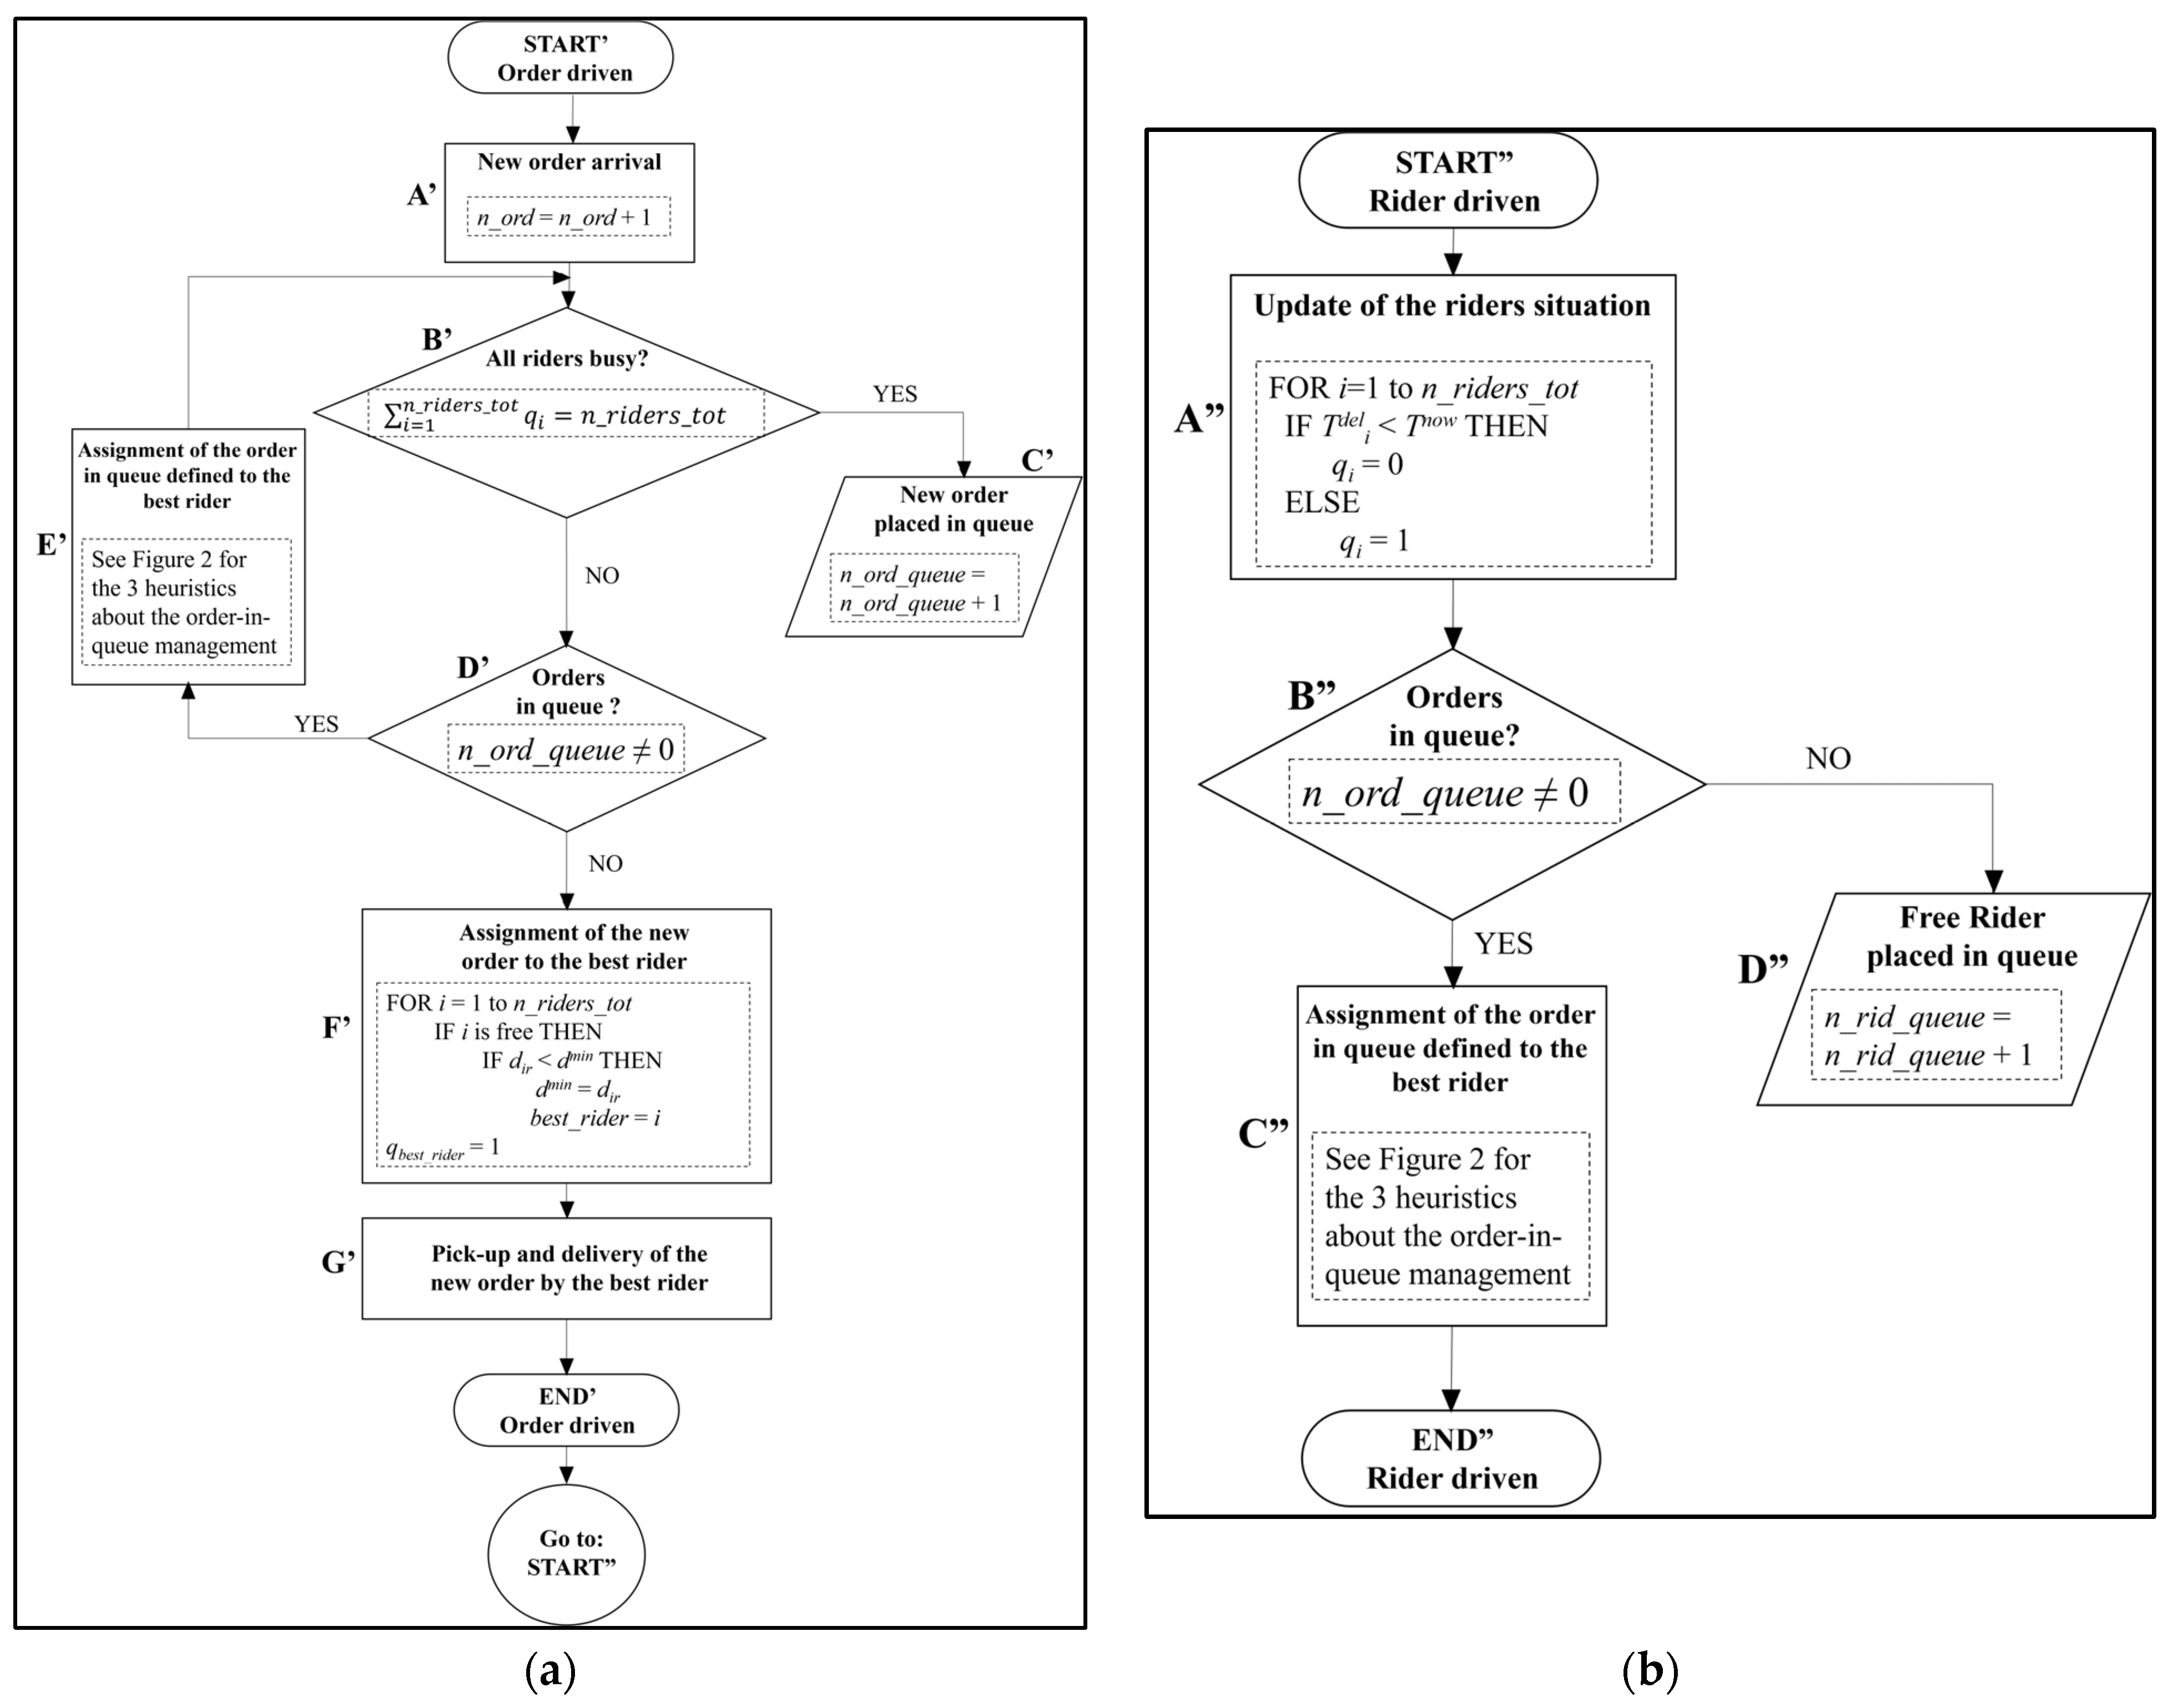
Figure 1. Flowcharts of the reference algorithm for the order assignment. (a) Flowchart when a new order arrives; (b) Flowchart when a rider becomes idle.
Sustainability 17 08876 g001
Figure 2. Three different heuristics for queue management.
Sustainability 17 08876 g002
Figure 3. Restaurant locations (black icons) and heatmap of demand points (green): (a) Bologna and (b) Göttingen.
Sustainability 17 08876 g003
Figure 4. Diurnal distribution of orders’ arrival (a) on working days and (b) during the weekend both in Germany and Italy.
Sustainability 17 08876 g004
Figure 5. Profit increment of distance-based and price-based heuristics compared to the FIFO heuristic.
Sustainability 17 08876 g005
Figure 6. The trend of economic KPIs according to the number of riders for the distance-based heuristic in a workday scenario (both in Germany and Italy).
Sustainability 17 08876 g006
Table 1. Model parameters of the reference algorithm.
ParameterDefinition
n_ordTotal number of orders
n_riders_totTotal number of riders employed
n_rest_totTotal number of restaurants
iRider (from 1 to n_riders_tot)
rRestaurant (from 1 to n_rest_tot)
qiBinary variable related to each rider i:
1 if rider i is busy
0 if rider i is idle
n_ord_queueNumber of orders in the queue
n_rid_queueNumber of idle riders waiting for a new order to arrive
dminMinimum distance rider–restaurant (initialized to a high value)
di,rDistance between rider i and restaurant r of the new order
best_riderRider that minimizes the distance to the restaurant
TnowCurrent time of the day
TdeliTime of the delivery of the current order of rider i
Table 2. Additional parameters of the three heuristic algorithms.
ParameterDefinition
oOrder (from 1 to n_ord)
TminMinimum order creation time (initialized to a high value)
ToCreation time of order o
PoPrice of order o
rest(o)Restaurant of order o
PmaxMaximum order price (initialized to zero)
dminMinimum distance: rider–restaurant (initialized to a high value)
best_orderOrder in the queue that optimizes the objective function of the specific heuristic considered
di,rest(o)Distance between rider i and the restaurant of the order o
drest(o), oDistance between the restaurant of the order o and the customer who placed the order o
Dtoti,oTotal distance traveled by rider i to deliver order o
Dtot-minMinimum total distance travelled
Table 3. Example of the input dataset provided by the platform with customer and restaurant information.
Order IDDay of the WeekDateOrder Creation TimeOrder Price (€)Costumer AddressN° of ItemsRestaurant IDRestaurant Address
BO51011531668Saturday5 October 201918:2825.0Via Carlo Francioni, 4, 40137 Bologna BO, Italy2REST44Via Augusto Murri 103
BO35254531707Saturday5 October 201918:5332.0Via Farini, 6, 40124 Bologna BO, Italy1REST91Via Collegio di Spagna 7/3
BO67446531731Saturday5 October 201919:0017.5Via Augusto Murri, 84, 40137 Bologna BO, Italy2REST21Via del Parco 13/D
BO71744531753Saturday5 October 201919:1122.0Via Broccaindosso, 23, 40125 Bologna BO, Italy3REST21Via del Parco 13/D
Table 4. Work motivation results for German and Italian platform riders in urban delivery.
ItemI Am Proud of My Job.I Put All My Effort into the Job.I Am Very Concentrated at Work.My Attention Is Fully Focused at Work.I Am Enthusiastic About My Job.I Work with High Intensity in My Job.
GroupDE aIT bDEITDEITDEITDEITDEIT
1-Agree14113023392338211672923
2-Partly agree28134483893593712498
3-Either/or33 c6133122143249112
4-Partly disagree1326010011212381
5-Disagree12361112010421
N/A011101011111
Arithmetic mean2.812.232.131.511.961.492.041.602.622.572.041.54
Standard deviation1.201.211.100.891.010.851.070.881.191.240.960.95
a DE: n = 100; b IT: n = 36; c median marking in bold.
Table 5. Autonomy perception results for German and Italian platform riders in urban delivery.
ItemWithin My Working Time, I Can Decide for Myself When to Complete Which Task.I Can Adjust My Work Objectives Myself.I Can Decide for Myself in Which Way I Complete My Work.I Do Have Any Influence on the Amount of Work Given.I Do Have Much Influence on Decisions That Affect My Work.I Have Influence over What I Do at Work.
GroupDEITDEITDEITDEITDEITDEIT
1-Agree191623153924646576
2-Partly agree27 a63073651961471910
3-Either/or14611593226238267
4-Partly disagree15217391205283242
5-Disagree253183703110289236
N/A031303251415
Arithmetic mean2.812.232.131.511.961.492.041.602.622.572.041.54
N10033993310033983199329931
a median marking in bold.
Table 6. Control perception results for German and Italian platform riders in urban delivery.
ItemI Am Controlled in My Work.I Am Controlled in My Work by Clients.I Am Controlled in My Work by Colleagues.I Am Controlled in My Work by Superiors.I Am Controlled in My Work by Technology.
GroupDEITDEITDEITDEITDEIT
1-Very strongly29116120420124022
2-Strongly30 a15191080338269
3-Medium144329102204192
4-Weak911311223451
5-Very weak144253652217261
N/A4151567641
Arithmetic mean2.472.203.342.234.414.272.612.202.071.57
N96359535953093309635
a median marking in bold.
Table 7. Results of the algorithm implementation from an economic point of view.
HeuristicItalyGermany
WeekendWeekdayWeekendWeekday
Economic KPIn° of Riders/100 OrdersEconomic KPIn° of Riders/100 OrdersEconomic KPIn° of Riders/100 OrdersEconomic KPIn° of Riders/100 Orders
FIFOEUR 3.95/order16.8EUR 2.82/order13.1EUR 3.01/order18.5EUR 2.59/order16.7
Distance-basedEUR 4.00/order15.9EUR 3.04/order14.3EUR 3.11/order17.6EUR 2.91/order16.7
Price-basedEUR 4.30/order a16.8EUR 2.69/order14.3EUR 3.35/order17.6EUR 2.52/order17.9
a best value marking in bold.
Table 8. Results of the algorithm implementation from a logistic point of view.
CountryType of DayHeuristicAverage Time to Deliver 1 Order% of Delayed OrdersAverage Distance to Deliver 1 Order
ItalyWeekdayFIFO38.58 min34.52%3.41 km
Distance-based a32.28 min17.86%3.44 km
Price-based36.73 min30.95%3.59 km
WeekendFIFO31.02 min11.50%3.59 km
Distance-based30.93 min15.04%3.41 km
Price-based30.50 min11.50%3.58 km
GermanyWeekdayFIFO38.75 min28.57%4.53 km
Distance-based34.62 min22.62%4.26 km
Price-based38.08 min26.19%4.63 km
WeekendFIFO34.66 min26.85%4.86 km
Distance-based37.08 min27.78%4.88 km
Price-based38.38 min25.93%4.97 km
a best heuristic marking in bold.
Disclaimer/Publisher’s Note: The statements, opinions and data contained in all publications are solely those of the individual author(s) and contributor(s) and not of MDPI and/or the editor(s). MDPI and/or the editor(s) disclaim responsibility for any injury to people or property resulting from any ideas, methods, instructions or products referred to in the content.