Prediction and Analysis of Abalone Aquaculture Production in China Based on an Improved Grey System Model
Abstract
1. Introduction
1.1. Background of Abalone Aquaculture in China
1.2. The Application and Limitations of Grey System Models
1.3. Literature Review on Grey Models and Aquaculture Determinants
2. Methodology
2.1. Grey Correlation Analysis
- Step 1: Determine the reference sequence and the comparative sequences
- Step 2: Data normalization
- Step 3: Correlation Coefficient Calculation
- Step 4: Calculate the relational degree
- Step 5: Factor prioritization
2.2. FGMC(1,N,2r) Model
- Step 1: Data Preparation and Preprocessing
- Step 2: Factor prioritization
- Step 3: Model Construction and Parameter Estimation
- Step 4: Time Response Function and Prediction Value Reconstruction
- Step 5: Parameter Optimization
- Step 6: Model Evaluation
3. Model Application
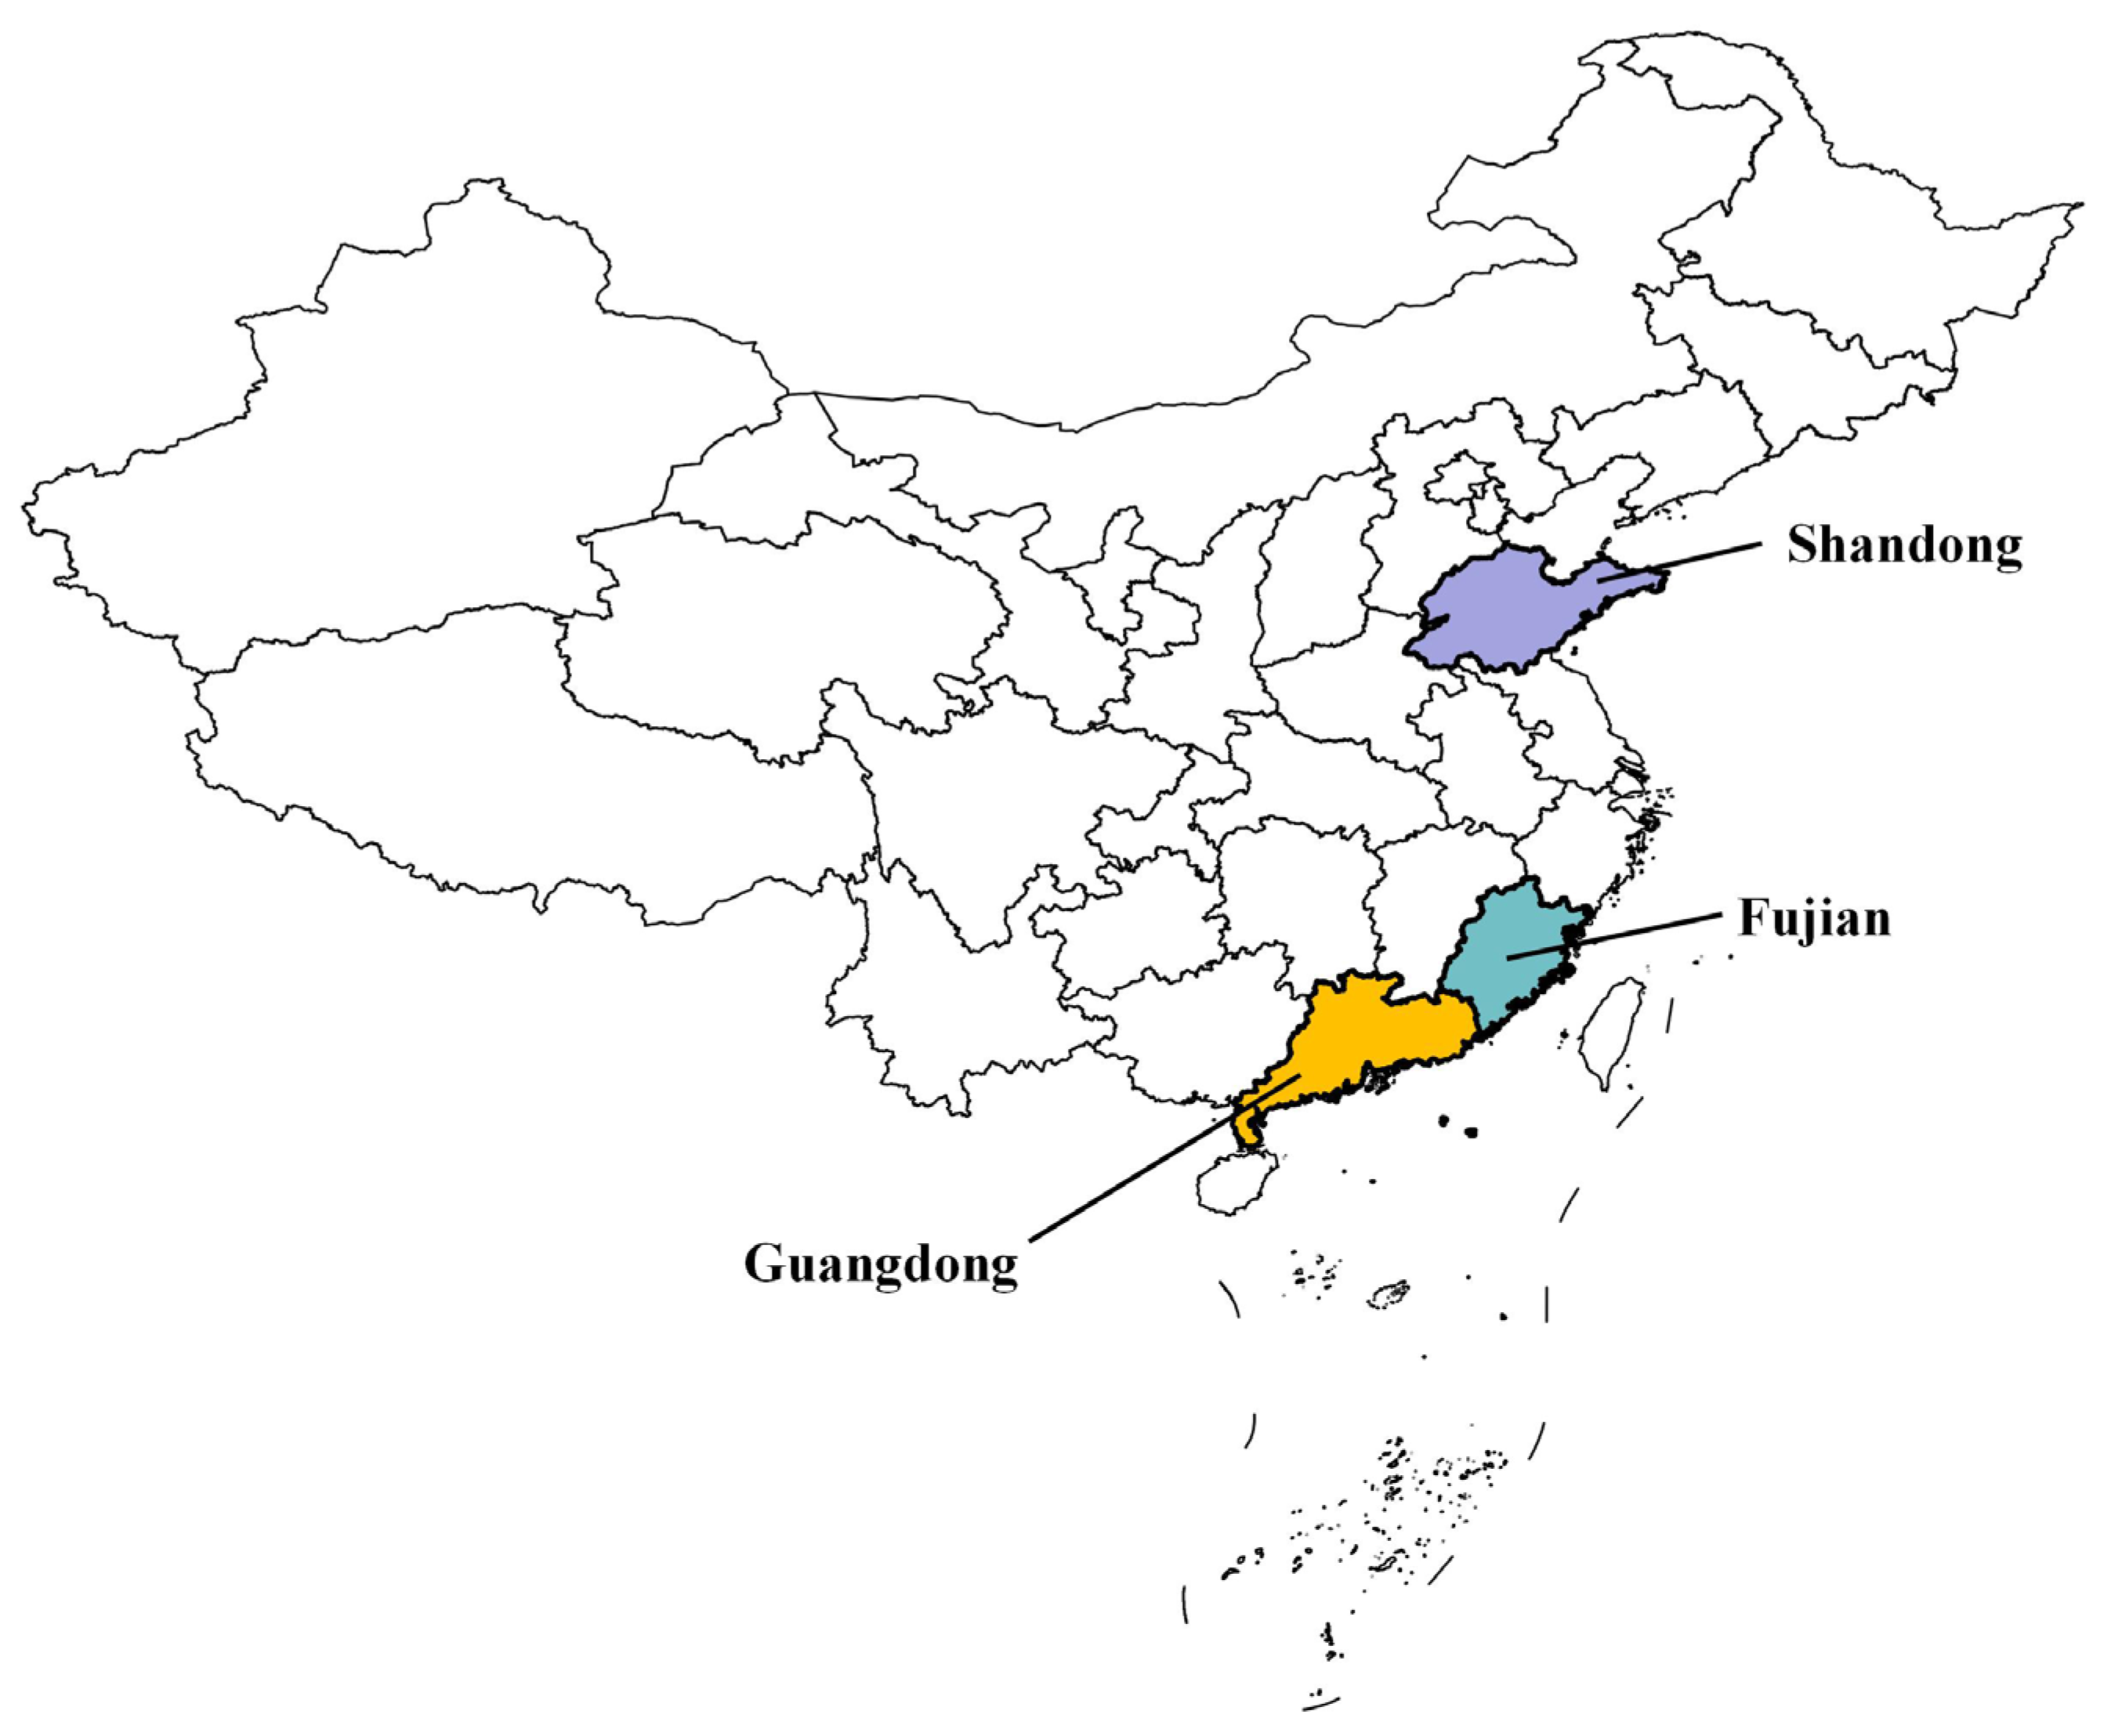
3.1. Study Areas
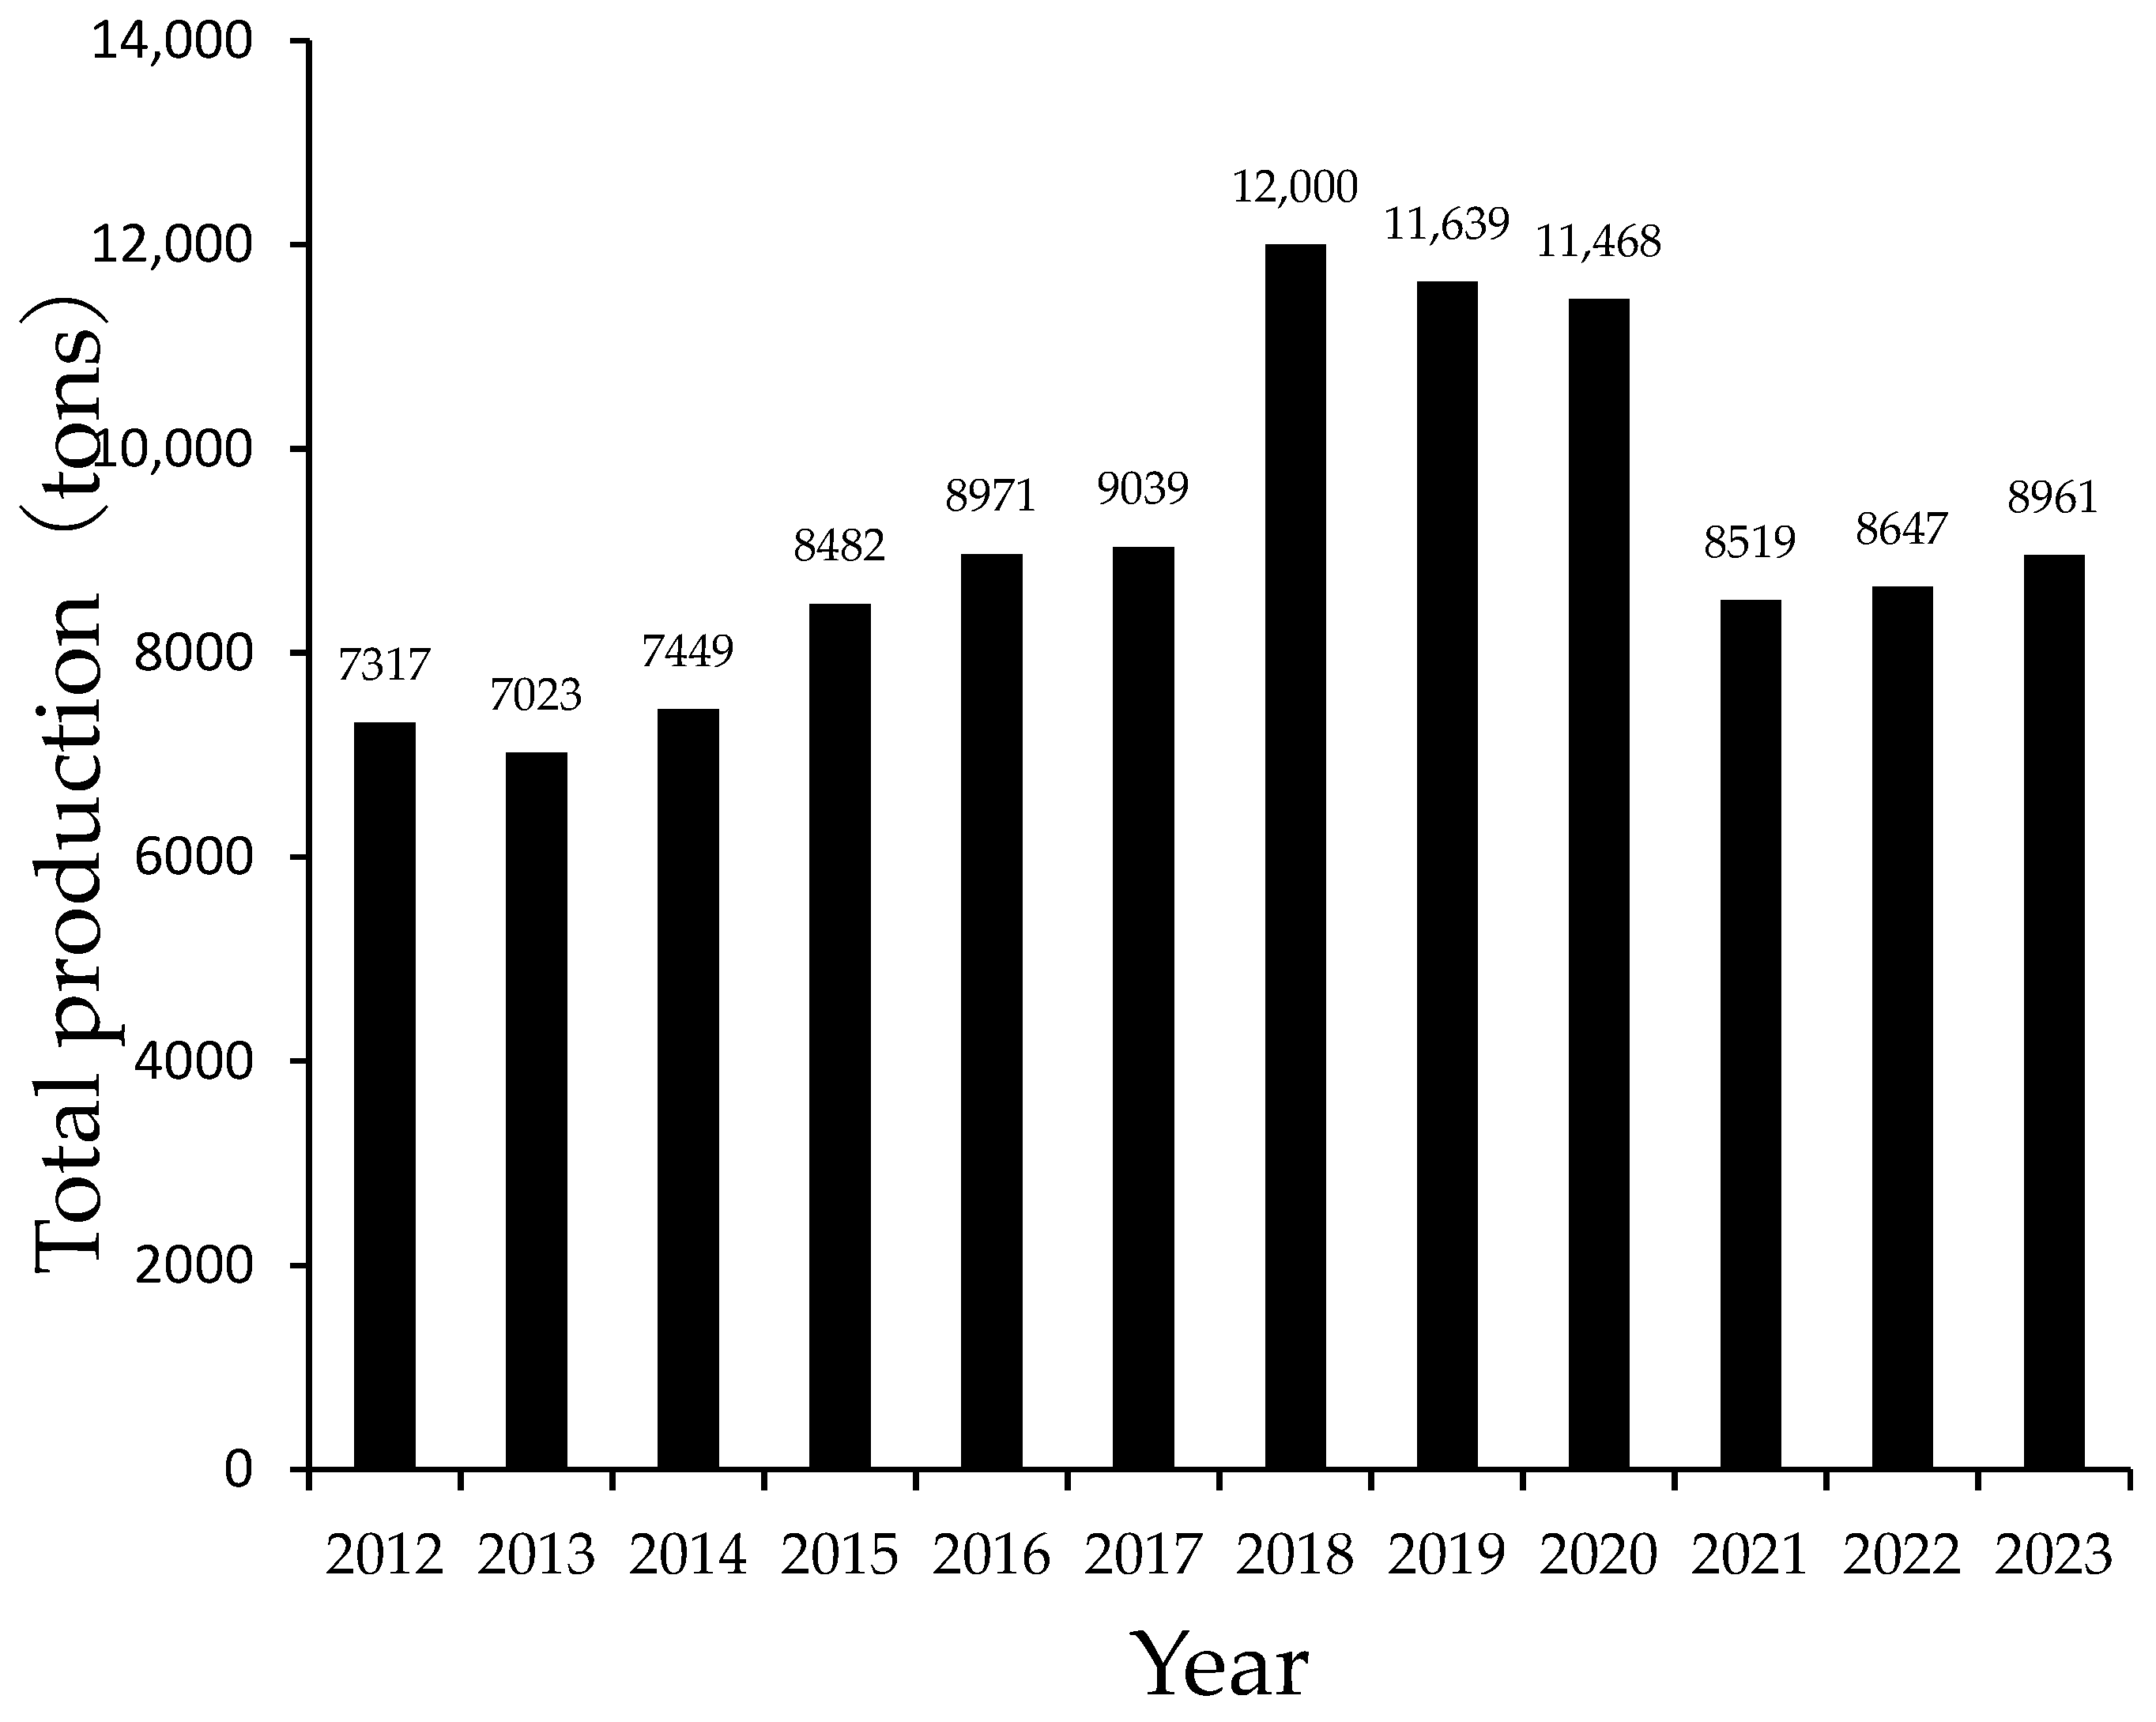
3.2. Data Collections
3.3. Model Comparison and Analysis
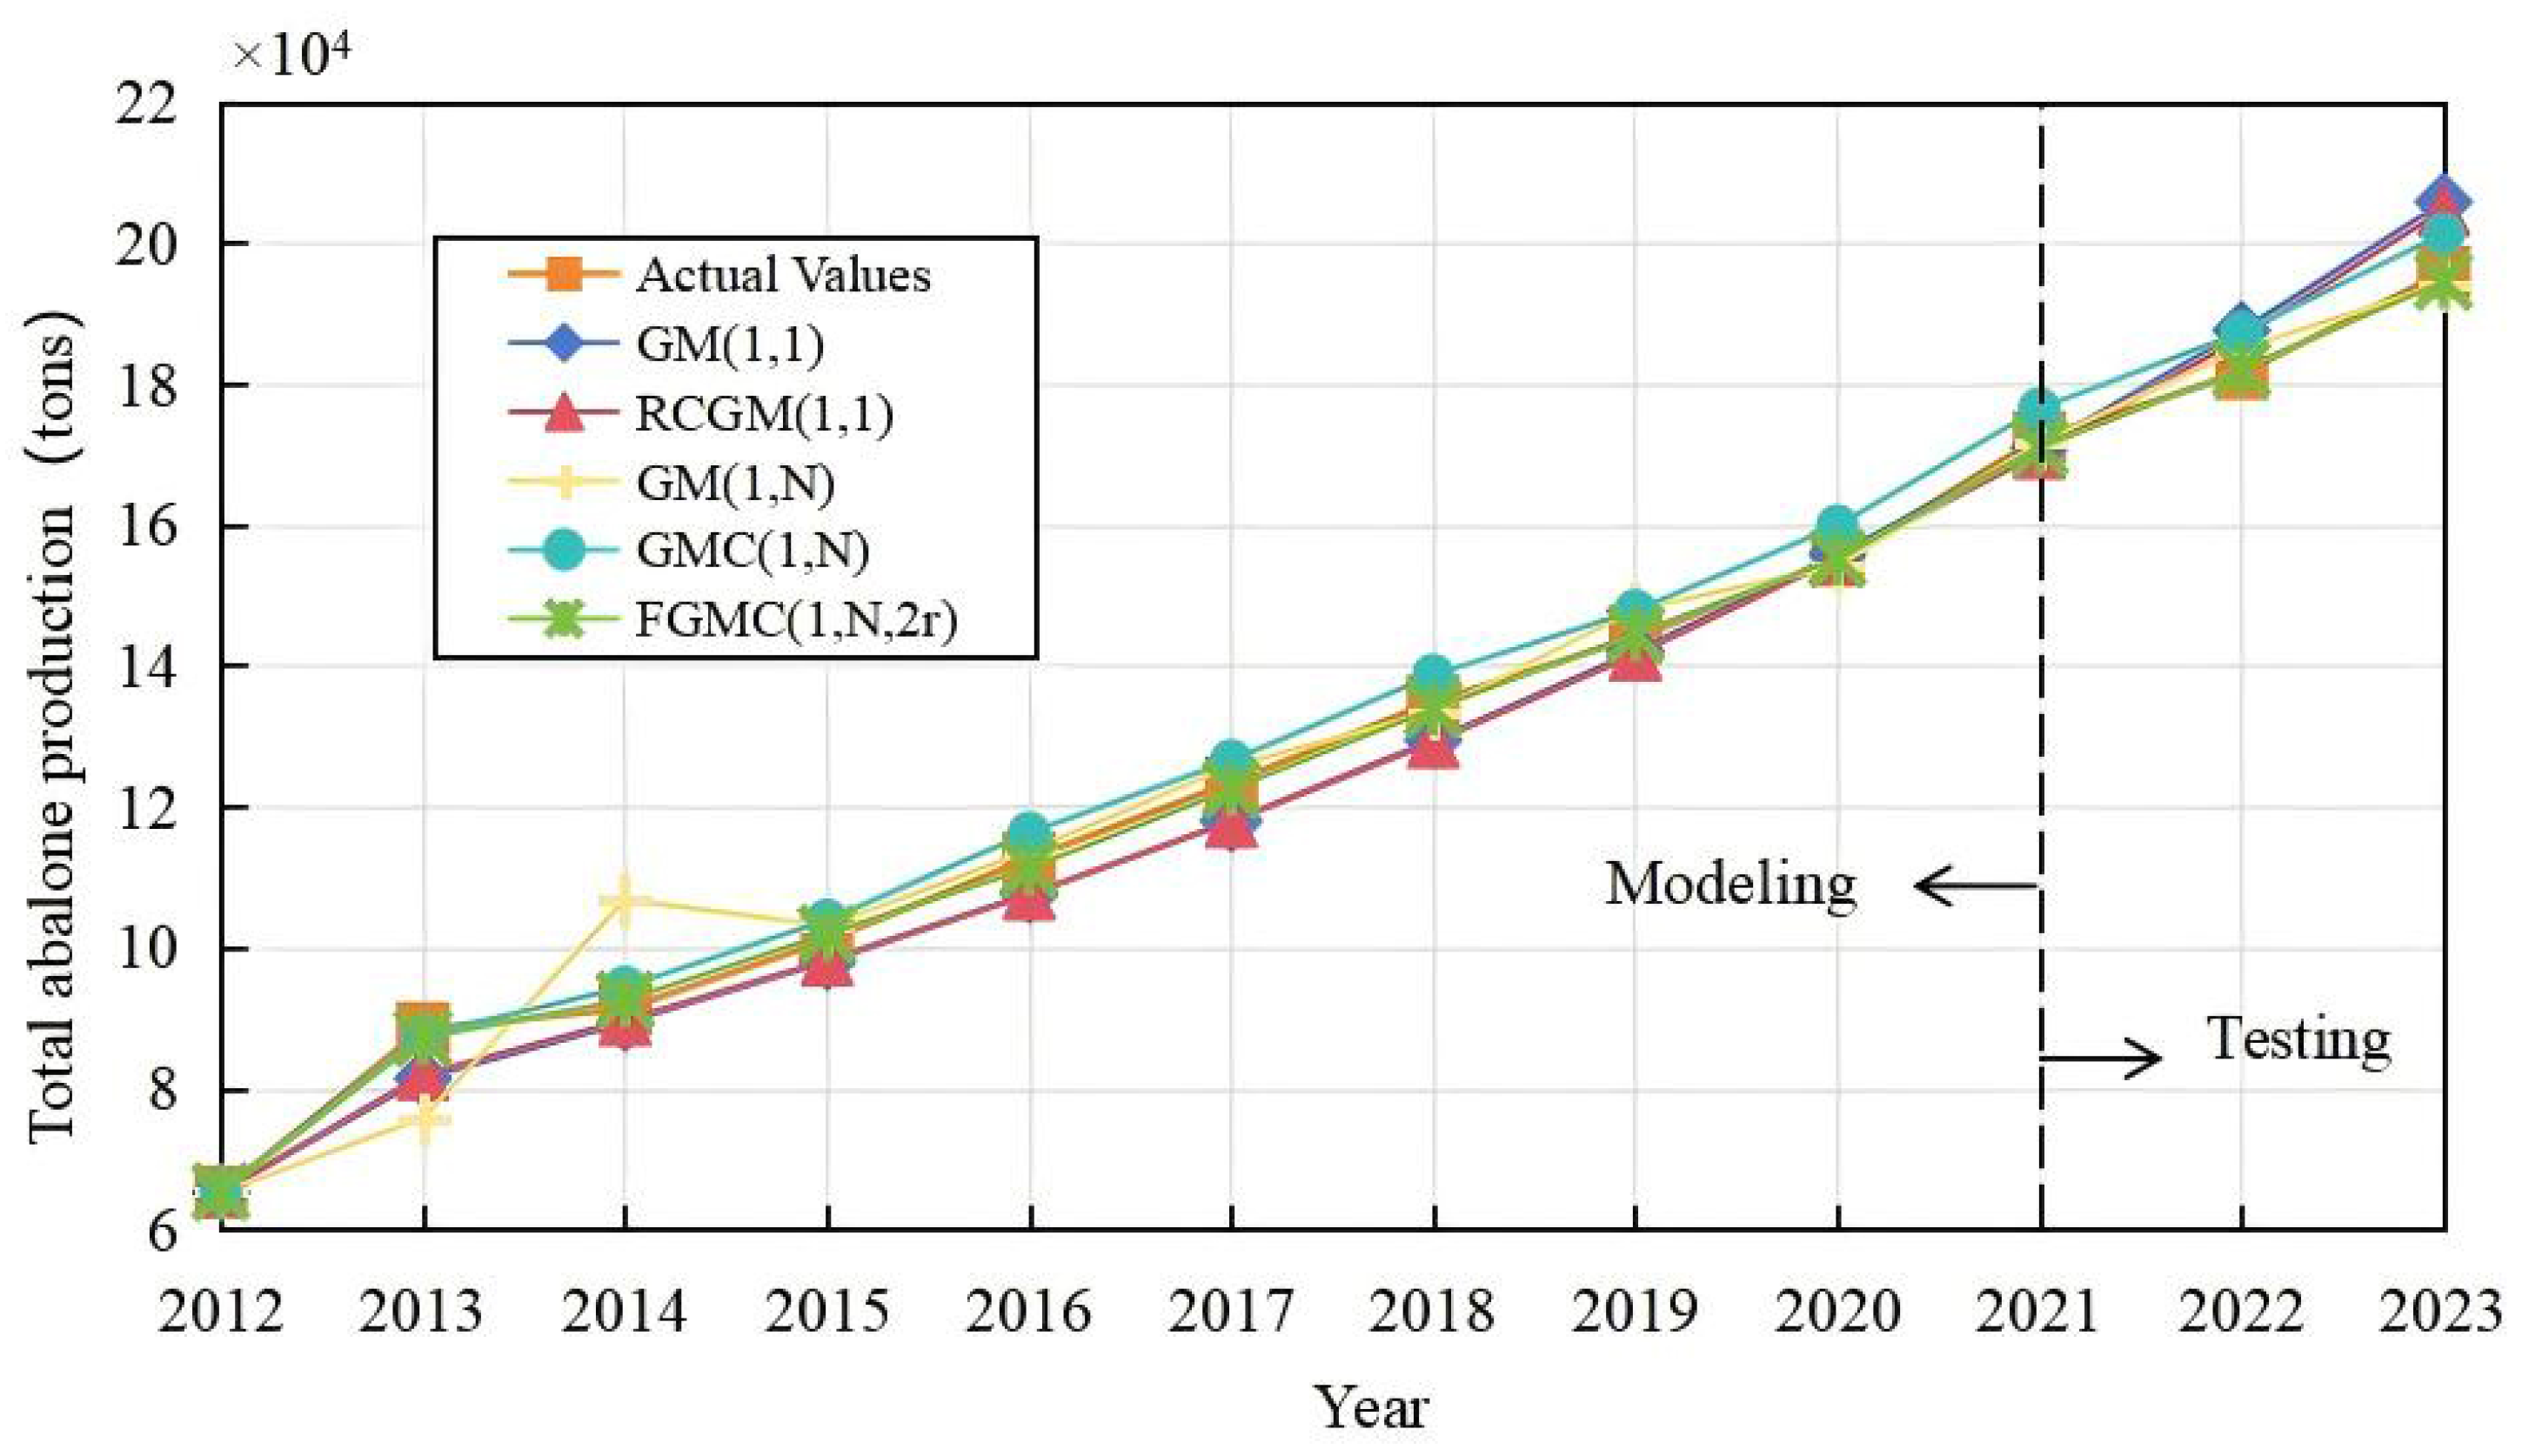
3.3.1. Abalone Production in Fujian Province
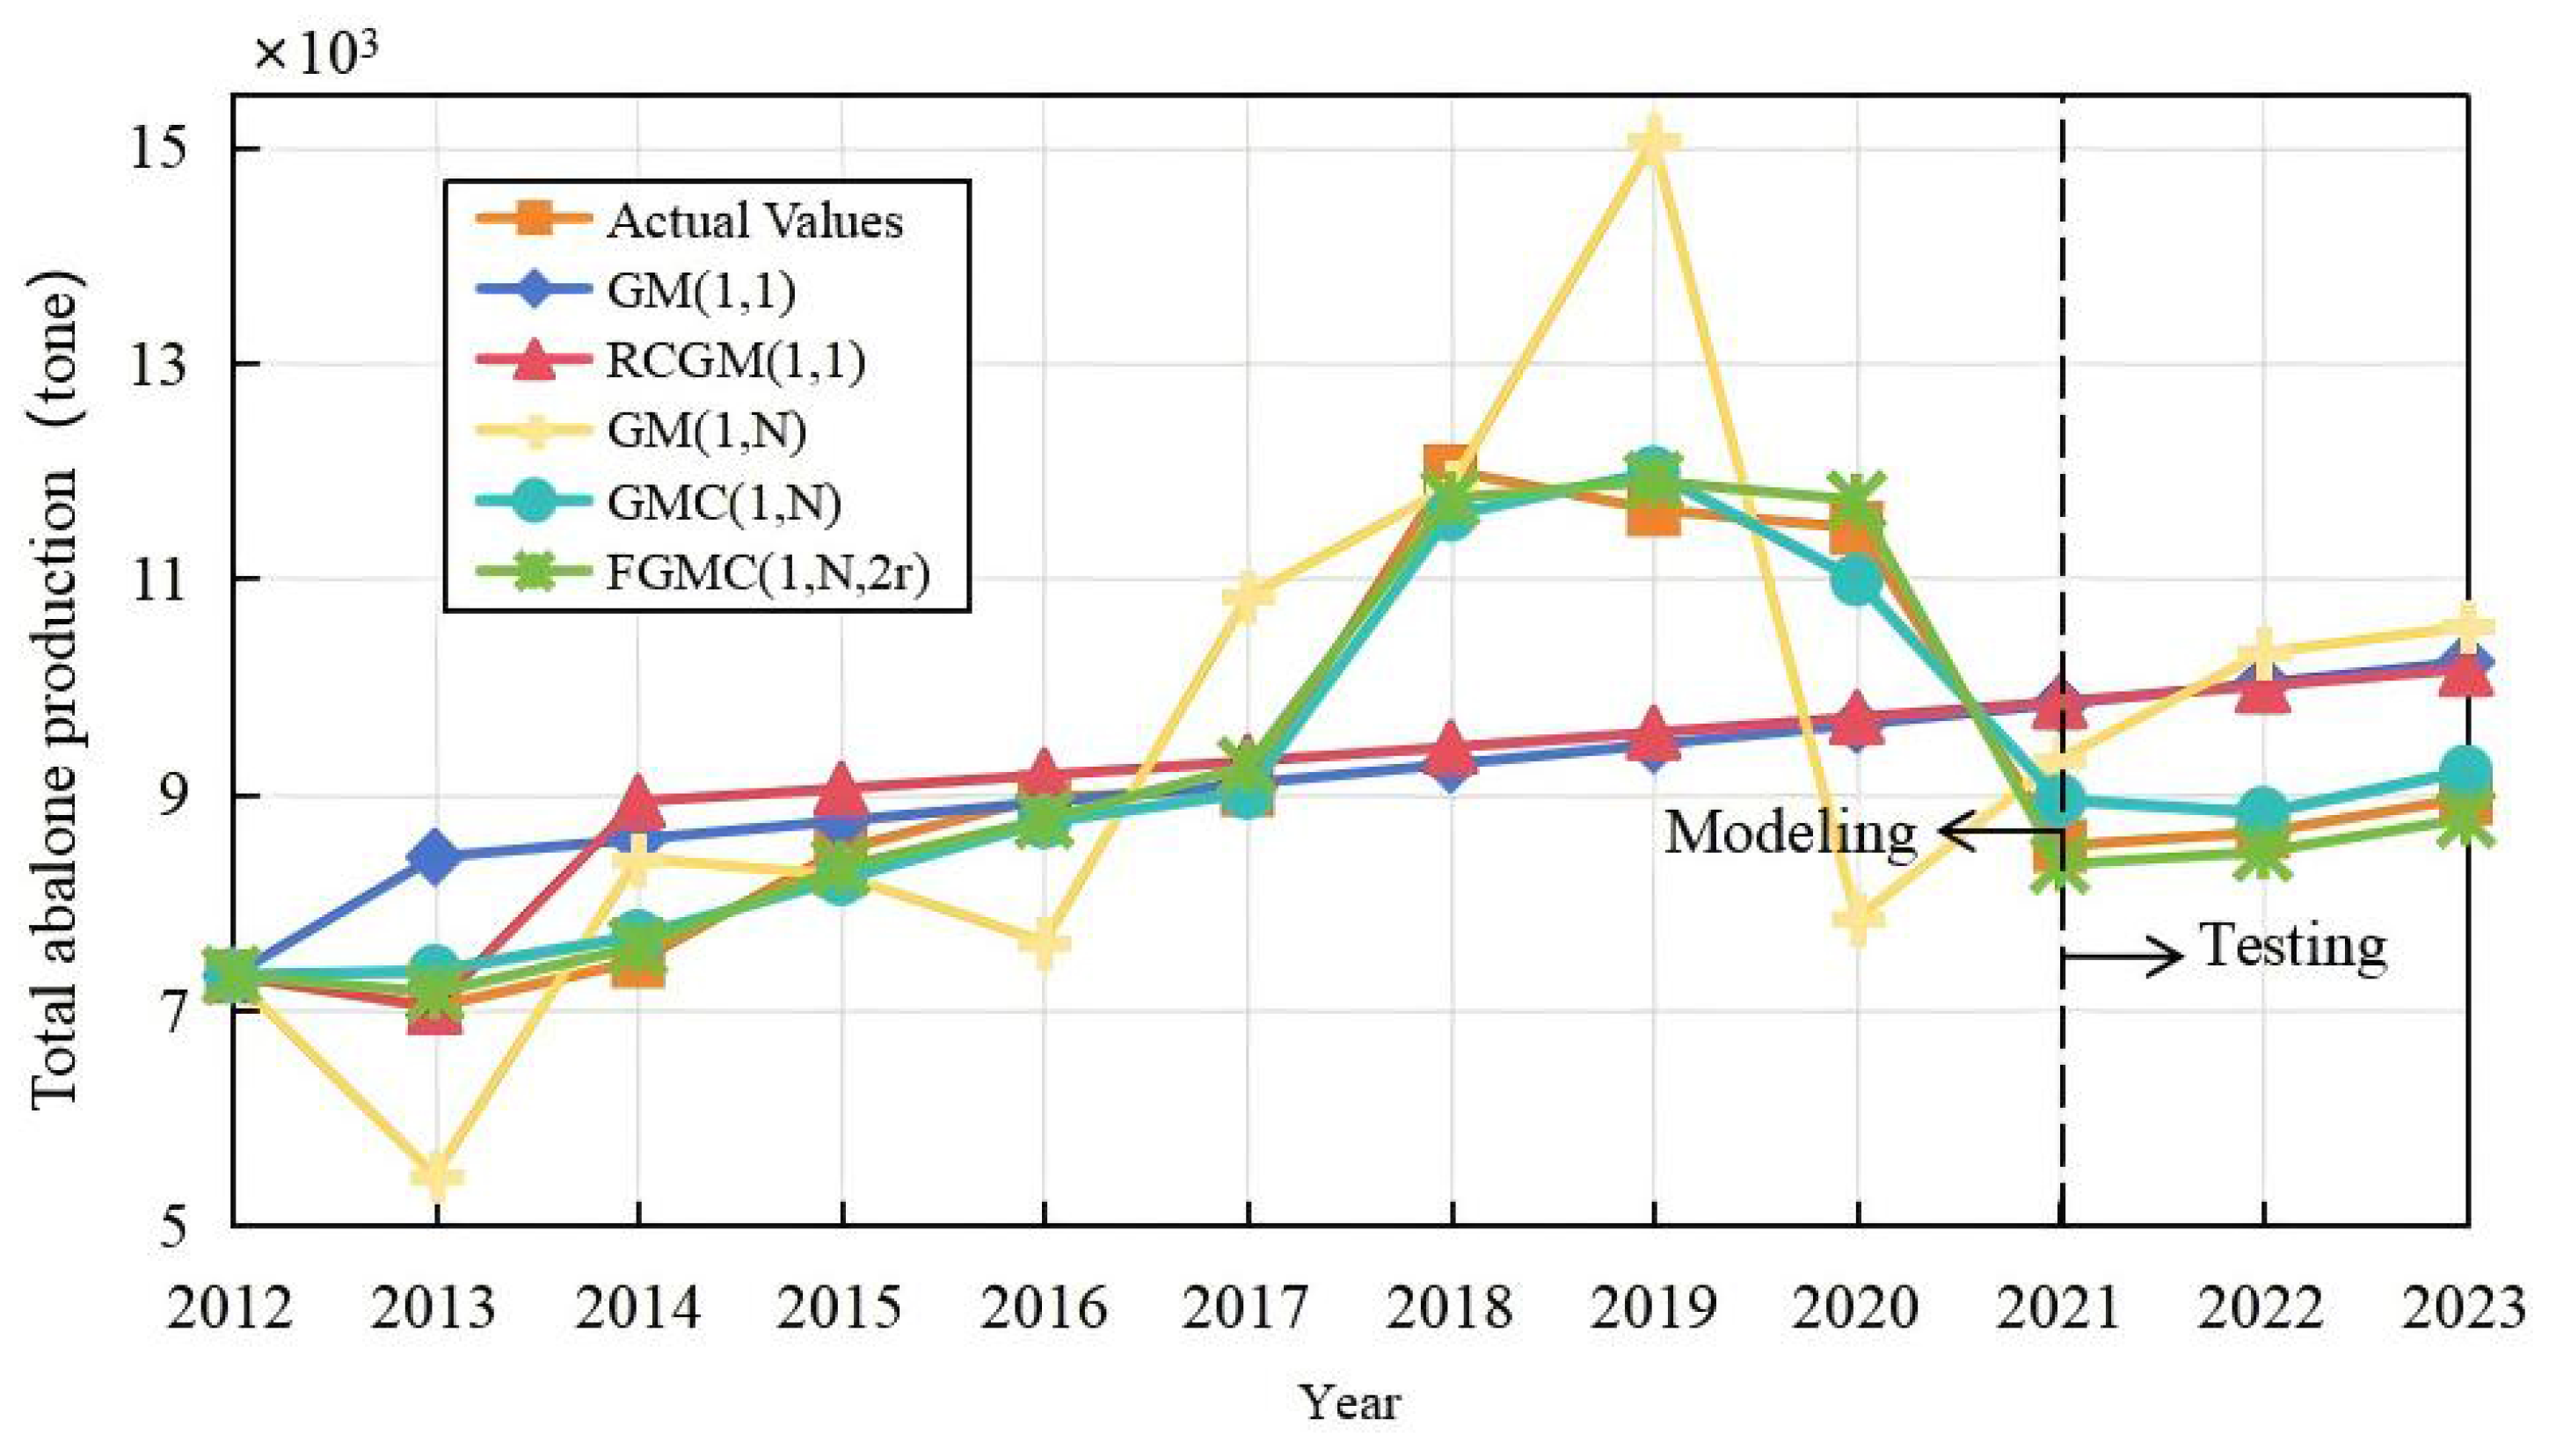
3.3.2. Abalone Production in Shandong Province
3.3.3. Abalone Production in Guangdong Province
4. Discussion
4.1. Model Performance and Production Trends
4.2. Sustainability Implications and Environmental Considerations
5. Conclusions
Author Contributions
Funding
Data Availability Statement
Conflicts of Interest
References
- Grandiosa, R. Increasing awareness of abalone culture to support sustainable aquaculture in Indonesia. Glob. Sci. J. 2020, 8, 315–321. [Google Scholar]
- Lou, Q.M.; Wang, Y.M.; Xue, C.H. Lipid and fatty acid composition of two species of abalone, Haliotis discus hannai Ino and Haliotis diversicolor Reeve. J. Food Biochem. 2013, 37, 296–301. [Google Scholar] [CrossRef]
- Suleria, H.A.; Masci, P.P.; Gobe, G.C.; Osborne, S.A. Therapeutic potential of abalone and status of bioactive molecules: A comprehensive review. Crit. Rev. Food Sci. Nutr. 2017, 57, 1742–1748. [Google Scholar] [CrossRef]
- Oakes, F.R.; Ponte, R.D. The abalone market: Opportunities for cultured abalone. Aquaculture 1996, 140, 187–195. [Google Scholar] [CrossRef]
- Hernández-Casas, S.; Seijo, J.C.; Beltrán-Morales, L.F.; Hernández-Flores, Á.; Arreguín-Sánchez, F.; Ponce-Díaz, G. Analysis of supply and demand in the international market of major abalone fisheries and aquaculture production. Mar. Policy 2023, 148, 105405. [Google Scholar] [CrossRef]
- Zhang, W.; Zhuang, X.; Chen, C.A.; Huang, T. The impact of Kuroshio water on the source water of the southeastern Taiwan Strait: Numerical results. Acta Oceanol. Sin. 2015, 34, 23–34. [Google Scholar] [CrossRef]
- Duan, P.; Li, J.; Wang, M.; Wu, J. Spatial-temporal analysis of the coastline changes in Fujian Province, China from 1995 to 2015. J. Environ. Sci. Manag. 2021, 24, 1–9. [Google Scholar] [CrossRef]
- Liu, G.J.; Wu, X.Y.; Wei, Y.; Xu, T.; Li, D.; Luo, X.; You, W.; Ke, C. Applying deep learning algorithms for non-invasive estimation of carotenoid content in the foot muscle of Pacific abalone with different colors. Food Chem. 2025, 480, 143913. [Google Scholar] [CrossRef]
- Chen, N.; Luo, X.; Lu, C.; Lu, C.; Ke, C.; You, W. Effects of artificial selection practices on loss of genetic diversity in the Pacific abalone, Haliotis discus hannai. Aquaculture 2017, 48, 4923–4933. [Google Scholar] [CrossRef]
- Chen, N.; Shen, Y.; Yu, F.; Luo, X.; You, W.; Ke, C. A new indicator of hypoxia tolerance in abalone, developed based on heart rate fluctuations. Aquaculture 2020, 519, 734903. [Google Scholar] [CrossRef]
- Li, J.; Lu, H.; Zhu, J.; Wang, Y.; Li, X. Aquatic products processing industry in China: Challenges and outlook. Trends Food Sci. Technol. 2009, 20, 73–77. [Google Scholar] [CrossRef]
- Wang, C.; Liao, S.; Wu, X.; Liu, D.; Yu, Y. Coupling coordination analysis of the marine low-carbon economy and carbon emission reduction from the Perspective of China’s Dual Carbon Goals. Sustainability 2025, 17, 4100. [Google Scholar] [CrossRef]
- Zhou, Y.; Zhang, Q.; Bai, G.; Zhao, H.; Shuai, G.; Cui, Y.; Shao, J. Groundwater dynamics clustering and prediction based on grey relational analysis and LSTM model: A case study in Beijing Plain, China. J. Hydrol. Reg. Stud. 2024, 56, 102011. [Google Scholar] [CrossRef]
- Ju-Long, D. Control problems of grey systems. Syst. Control Lett. 1982, 1, 288–294. [Google Scholar] [CrossRef]
- Wang, Y.; Ni, M.; Lu, Z.; Ma, L. Prediction and analysis of sturgeon aquaculture production in Guizhou Province based on grey system model. Sustainability 2025, 17, 3292. [Google Scholar] [CrossRef]
- Du, X.; Wu, D.; Yan, Y. Prediction of electricity consumption based on GM (1, Nr) model in Jiangsu Province, China. Energy 2023, 262, 125439. [Google Scholar] [CrossRef]
- Tien, T. The indirect measurement of tensile strength by the new model FGMC (1, n). Measurement 2011, 44, 1884–1897. [Google Scholar] [CrossRef]
- Kuo, Y.; Yang, T.; Huang, G. The use of grey relational analysis in solving multiple attribute decision-making problems. Comput. Ind. Eng. 2008, 55, 80–93. [Google Scholar] [CrossRef]
- Liu, S. Grey Systems Analysis: Methods, Models and Applications, 2nd ed.; Springer Singapore: Singapore, 2025; p. 395. [Google Scholar]
- Candan, G.; And Cengiz Toklu, M. Sustainable industrialization performance evaluation of European Union countries: An integrated spherical fuzzy analytic hierarchy process and grey relational analysis approach. Int. J. Sustain. Dev. World Ecol. 2022, 29, 387–400. [Google Scholar] [CrossRef]
- Rehman, E.; Rehman, S. Modeling the nexus between carbon emissions, urbanization, population growth, energy consumption, and economic development in Asia: Evidence from grey relational analysis. Energy Rep. 2022, 8, 5430–5442. [Google Scholar] [CrossRef]
- Yang, T.; Zhao, X.; Sun, Q.; Zhang, Y.; Xie, J. Elucidating the anti-inflammatory activity of platycodins in lung inflammation through pulmonary distribution dynamics and grey relational analysis of cytokines. J. Ethnopharmacol. 2024, 323, 117706. [Google Scholar] [CrossRef]
- Su, W.; Ai, Z.; Yang, B. A new personalized environment control system for hospital beds with design optimization by Taguchi-based grey relational analysis. Build. Environ. 2025, 267, 112206. [Google Scholar] [CrossRef]
- Alam, M.D.; Khan, I.A. Optimization of ergonomic parameters in overhead arc welding using grey relational analysis. J. Biomech. 2025, 189, 112823. [Google Scholar] [CrossRef]
- Kichouh-Aiadi, S.; Gallardo-Rodríguez, J.J.; Cerón-García, M.C.; López-Rosales, L.; Sánchez-Mirón, A.; García-Camacho, F. Selecting phytohormone treatments through Grey Relational and Principal Component Analysis for microalgal bioactives production. Algal Res. 2025, 90, 104152. [Google Scholar] [CrossRef]
- Cai, Y.; Wang, J.; An, Y.; Dang, Y.; Ye, L. Research on accumulative time-delay effects between economic development and air pollution based on a novel grey relational analysis model. J. Clean. Prod. 2025, 497, 145128. [Google Scholar] [CrossRef]
- Wu, H.; Han, X.; Yang, Y.; Hu, A.; Li, Y. A contribution-driven weighted grey relational analysis model and its application in identifying the drivers of carbon emissions. Expert. Syst. Appl. 2025, 287, 128039. [Google Scholar] [CrossRef]
- Chen, P.; Qiu, S.; Liu, Z. Correlation analysis of structural parameters and dynamic responses of offshore floating wind turbine platforms using grey relational theory. Adv. Wind. Eng. 2025, 2, 100041. [Google Scholar] [CrossRef]
- Zhao, H.Y.; Zhang, J.; Hu, G.P.; Zhang, J.Q. Research on the application of weighted grey relational analysis on the failure diagnosis of complicated electronic equipment. Meas. Technol. Eng. Res. Ind. 2013, 333, 1543–1547. [Google Scholar] [CrossRef]
- Qazi, T.F.; Niazi, A.A.K.; Aurangzaib, A.; Mushtaq, H.; Rashid, Z.; Mojdin, H.; Qamar, H.; Jamil, A. Evaluation of Pakistan’s fisheries production as compared to other countries: A grey relational analysis. J. Soc. Signs Rev. 2024, 2, 856–884. [Google Scholar]
- Wang, Z.; Li, D.; Zheng, H. Model comparison of GM (1, 1) and DGM (1, 1) based on Monte-Carlo simulation. Phys. A Stat. Mech. Its Appl. 2020, 542, 123341. [Google Scholar] [CrossRef]
- Marín, T.; Wu, J.; Wu, X.; Ying, Z.; Lu, Q.; Hong, Y.; Wang, X.; Yang, W. Resource use in mariculture: A case study in Southeastern China. Sustainability 2019, 11, 1396. [Google Scholar] [CrossRef]
- Bostock, J.; Lane, A.; Hough, C.; Yamamoto, K. An assessment of the economic contribution of EU aquaculture production and the influence of policies for its sustainable development. Aquac. Int. 2016, 24, 699–733. [Google Scholar] [CrossRef]
- You, W.; Luo, X.; Ke, C. Progress in genetics and breeding of abalone. J. Xiamen Univ. (Nat. Sci.) 2021, 60, 417–424. [Google Scholar]
- Valenti, W.C.; Kimpara, J.M.; Preto, B.D.L.; Moraes-Valenti, P. Indicators of sustainability to assess aquaculture systems. Ecol. Indic. 2018, 88, 402–413. [Google Scholar] [CrossRef]
- Sun, M.; Bi, C.; Huang, L. China’s mariculture net cages in typhoon and sea ice disasters: Challenges and prevention strategy. Sea Exploit. Environ. 2024, 1, 1–7. [Google Scholar] [CrossRef]
- Lin, W.; Chen, S.; Hu, Y.; Li, D. The characteristics of RSDs before and after the landing Typhoon Meranti. Trop. Cyclone Res. Rev. 2020, 9, 218–224. [Google Scholar] [CrossRef]
- Yin, W.; Liu, B.; Yao, D.; Chen, G. Property insurance demand in response to climate risk: The role of green finance, economic policy uncertainty, and non-linearity. Technol. Soc. 2025, 83, 102957. [Google Scholar] [CrossRef]
- Jiang, Q.; Bhattarai, N.; Pahlow, M.; Xu, Z. Environmental sustainability and footprints of global aquaculture. Resour. Conserv. Recycl. 2022, 180, 106183. [Google Scholar] [CrossRef]
- Bridson, P.B.; Stoner, J.M.S.; Fransen, M.H.; Ireland, J. The aquaculture sustainability continuum—Defining an environmentale performance framework. Environ. Sustain. Indic. 2020, 8, 10050. [Google Scholar]
- Sun, Y.; Zhang, F. Grey multivariable prediction model of energy consumption with different fractional orders. Sustainability 2022, 11, 14. [Google Scholar] [CrossRef]
- Xu, Y.; Wang, H.; Hui, N.L. Prediction of Agricultural Water Consumption in 2 Regions of China Based on Fractional-Order Cumulative Discrete Grey Model. J. Math. 2021, 2021, 3023385. [Google Scholar] [CrossRef]
- Ren, X.; Tan, J.; Qiao, Q.; Wu, L.; Ren, L.; Meng, L. Demand forecast and influential factors of cold chain logistics based on a grey model. Math. Biosci. Eng. 2022, 19, 7669–7686. [Google Scholar] [CrossRef]
- Wang, Y.; Yang, Z.; Luo, Y.; Yang, R.; Sun, L.; Sapnken, F.E.; Narayanan, G. A novel structural adaptive Caputo fractional order derivative multivariate grey model and its application in China’s energy production and consumption prediction. Energy 2024, 312, 133622. [Google Scholar] [CrossRef]
- Wu, L.; Wang, C.; Wang, C.; Gong, W. Forecasting Carbon Sequestration Potential in China’s Grasslands by a Grey Model with Fractional-Order Accumulation. Fractal Fract. 2024, 8, 536. [Google Scholar] [CrossRef]
- Wu, Y.; Chen, J.; Jia, C.; Gui, F.; Xu, J.; Yin, X.; Feng, D.; Zhang, Q. Recent Advances in the Hydrodynamic Characteristics of Industrial Recirculating Aquaculture Systems and Their Interactions with Fish. Sustainability 2025, 17, 7946. [Google Scholar] [CrossRef]
- Ding, Y.; Dang, Y. Forecasting renewable energy generation with a novel flexible nonlinear multivariable discrete grey prediction model. Energy 2023, 277, 127664. [Google Scholar] [CrossRef]
- Gao, X.; Zhang, M.; Luo, X.; You, W.; Ke, C. Transitions, challenges and trends in China’s abalone culture industry. Rev. Aquac. 2023, 15, 1274–1293. [Google Scholar] [CrossRef]
- Wu, Z.H.; Yu, X.J.; Chen, P.; Pan, M.; Liu, J.; Sahandi, J.; Zhou, W.; Mai, K.; Zhang, W. Dietary Clostridium autoethanogenum protein has dose-dependent influence on the gut microbiota, immunity, inflammation and disease resistance of abalone Haliotis discus hannai. Fish. Shellfish. Immunol. 2024, 151, 109737. [Google Scholar] [CrossRef]
- Sun, X.H.; Zhao, L.T.; Li, J.; Liu, Z.; Xu, S.; Zhao, L.; Yin, Z. International comparison, forecast and promotion strategy of shellfish consumption in China. Aquac. Int. 2025, 33, 294. [Google Scholar] [CrossRef]
- Yin, C.; Su, X.; Wang, W.; Cui, Y. Structural imbalance and integrated economic development of RCEP countries on perspective of industrial network. Technol. Forecast. Soc. Change 2024, 209, 123728. [Google Scholar] [CrossRef]
- Yu, J.; Yan, T.; Ma, X. Evolution of support policies for the development of distant-water fishing bases in China: Review, performance, challenges and prospects. Mar. Policy 2025, 171, 106489. [Google Scholar] [CrossRef]
- Hu, F.; Zhong, H.; Wu, C.; Wang, S.; Guo, Z.; Tao, M.; Zhang, C.; Gong, D.; Gao, X.; Tang, C.; et al. Development of fisheries in China. Reprod. Breed. 2021, 1, 64–79. [Google Scholar] [CrossRef]
- Hou, H.; Han, F.; Song, J.; Jia, F.; Bai, Y.; Ma, Z.; Huo, Z.; Liu, Y. Quantifying the Environmental Performance of the Oyster (Crassostrea gigas) Supply Chain: A Life Cycle Assessment in Dalian, China. Sustainability 2025, 17, 7392. [Google Scholar] [CrossRef]
- Zheng, H.; Shang, M.; Zhao, X. Chinese policy on fishery insurance: Evolution, characteristics and challenges. Mar. Policy 2020, 119, 104099. [Google Scholar] [CrossRef]


| R0i(X0,X1) | R0i(X0,X3) | R0i(X0,X5) | R0i(X0,X4) | R0i(X0,X2) | R0i(X0,X6) | |
|---|---|---|---|---|---|---|
| Relational degrees | 0.9156 | 0.8862 | 0.8840 | 0.7595 | 0.7242 | 0.5730 |
| Year | Actual Values | GM(1,1) | RCGM(1,1) | GM(1,N) | GMC(1,N) | FGMC(1,N,2r) r1 = 0.6319, r2 = 0.0041 | |||||
|---|---|---|---|---|---|---|---|---|---|---|---|
| Predicted Values | APE (%) | Predicted Values | APE (%) | Predicted Values | APE (%) | Predicted Values | APE (%) | Predicted Values | APE (%) | ||
| Modeling | |||||||||||
| 2012 | 65,247.00 | 65,247.00 | 0.00 | 65,247.00 | 0.00 | 65,247.00 | 0.00 | 65,274.00 | 0.00 | 65,247.00 | 0.00 |
| 2013 | 88,470.00 | 81,376.73 | 8.02 | 81,961.00 | 7.36 | 75,809.07 | 14.32 | 87,535.42 | 1.06 | 87,125.41 | 1.52 |
| 2014 | 91,252.00 | 89,291.32 | 2.15 | 89,696.88 | 1.71 | 106,776.47 | 17.01 | 94,387.63 | 3.43 | 92,511.88 | 1.38 |
| 2015 | 100,979.00 | 97,975.68 | 2.97 | 98,203.30 | 2.75 | 103,074.64 | 2.07 | 103,892.17 | 2.88 | 101,899.23 | 0.91 |
| 2016 | 112,611.00 | 107,504.66 | 4.54 | 107,555.12 | 4.49 | 113,763.34 | 1.02 | 116,288.45 | 3.27 | 111,255.67 | 1.20 |
| 2017 | 123,387.00 | 117,960.43 | 4.40 | 117,834.48 | 4.50 | 125,728.43 | 1.90 | 126,543.88 | 2.56 | 122,488.01 | 0.73 |
| 2018 | 134,924.00 | 129,433.10 | 4.07 | 129,131.52 | 4.29 | 133,444.53 | 1.10 | 138,672.31 | 2.78 | 133,890.15 | 0.77 |
| 2019 | 143,970.00 | 142,021.60 | 1.35 | 141,545.14 | 1.68 | 147,993.69 | 2.79 | 147,856.24 | 2.70 | 144,501.36 | 0.37 |
| 2020 | 155,009.00 | 155,834.43 | 0.53 | 155,183.86 | 0.11 | 154,165.14 | 0.54 | 159,872.53 | 3.14 | 155,211.73 | 0.13 |
| 2021 | 172,413.00 | 170,990.69 | 0.83 | 170,166.75 | 1.30 | 171,650.43 | 0.44 | 176,543.92 | 2.40 | 171,005.81 | 0.82 |
| MAPE (%) | 3.21 | 3.13 | 4.92 | 2.69 | 0.87 | ||||||
| RMSPE (%) | 3.90 | 3.77 | 5.12 | 2.87 | 0.98 | ||||||
| Testing | |||||||||||
| 2022 | 181,503.00 | 187,621.02 | 3.37 | 186,624.47 | 2.82 | 185,028.47 | 1.94 | 187,322.81 | 3.21 | 182,110.59 | 0.33 |
| 2023 | 195,878.00 | 205,868.79 | 5.10 | 204,700.38 | 4.51 | 194,225.61 | 0.84 | 201,345.67 | 2.79 | 194,552.33 | 0.68 |
| MAPE (%) | 4.24 | 3.67 | 1.39 | 3.00 | 0.51 | ||||||
| RMSPE (%) | 4.32 | 3.75 | 1.42 | 3.00 | 0.52 | ||||||
| Year | 2024 | 2025 | 2026 | 2027 | 2028 |
|---|---|---|---|---|---|
| Predicted Values | 209,876.54 | 224,531.89 | 240,187.26 | 256,923.74 | 274,828.41 |
| R0i(X0,X1) | R0i(X0,X3) | R0i(X0,X2) | R0i(X0,X4) | R0i(X0,X5) | R0i(X0,X6) | |
|---|---|---|---|---|---|---|
| Relational degrees | 0.8357 | 0.8099 | 0.7728 | 0.7236 | 0.7111 | 0.5862 |
| Year | Actual Values | GM(1,1) | RCGM(1,1) | GM(1,N) | GMC(1,N) | FGMC(1,N,2r) r1 = 0.8715, r2 = 0.2564 | |||||
|---|---|---|---|---|---|---|---|---|---|---|---|
| Predicted Values | APE (%) | Predicted Values | APE (%) | Predicted Values | APE (%) | Predicted Values | APE (%) | Predicted Values | APE (%) | ||
| Modeling | |||||||||||
| 2012 | 11,470.00 | 11,470.00 | 0.00 | 11,470.00 | 0.00 | 11,470.00 | 0.00 | 11,470.00 | 0.00 | 11,470.00 | 0.00 |
| 2013 | 11,957.00 | 10,090.37 | 15.61 | 11,957.00 | 0.00 | 12,188.91 | 1.94 | 12,188.45 | 1.94 | 12,185.26 | 1.91 |
| 2014 | 14,716.00 | 11,610.30 | 21.10 | 11,546.41 | 21.54 | 14,225.43 | 3.33 | 14,225.83 | 3.33 | 14,912.37 | 1.33 |
| 2015 | 15,165.00 | 13,359.19 | 11.91 | 13,354.95 | 11.94 | 15,401.27 | 1.56 | 15,401.27 | 1.56 | 15,711.84 | 3.61 |
| 2016 | 15,399.00 | 15,371.51 | 0.18 | 15,427.17 | 0.18 | 16,792.35 | 9.05 | 16,792.35 | 9.05 | 16,325.91 | 6.02 |
| 2017 | 13,411.00 | 17,686.95 | 31.88 | 17,802.76 | 32.75 | 16,162.41 | 20.51 | 16,162.41 | 20.51 | 14,131.05 | 5.37 |
| 2018 | 13,195.00 | 20,351.17 | 54.23 | 20,527.38 | 55.57 | 16,904.97 | 28.11 | 16,904.97 | 28.11 | 14,905.63 | 12.97 |
| 2019 | 21,428.00 | 23,416.71 | 9.28 | 23,653.58 | 10.39 | 21,985.66 | 2.60 | 21,985.66 | 2.60 | 20,589.41 | 3.91 |
| 2020 | 34,021.00 | 26,944.02 | 20.80 | 27,241.80 | 19.93 | 29,495.04 | 13.3. | 29,495.04 | 13.30 | 32,345.77 | 4.93 |
| 2021 | 35,430.00 | 31,002.65 | 12.50 | 31,361.59 | 11.48 | 37,102.58 | 4.72 | 37,102.58 | 4.72 | 35,461.92 | 0.09 |
| MAPE (%) | 19.72 | 20.47 | 9.46 | 4.46 | |||||||
| RMSPE (%) | 24.64 | 25.99 | 12.98 | 5.42 | |||||||
| Testing | |||||||||||
| 2022 | 36,973.00 | 35,672.64 | 3.52 | 36,093.00 | 2.38 | 38,412.21 | 3.89 | 39,001.83 | 5.49 | 38,812.14 | 4.97 |
| 2023 | 38,800.00 | 41,046.08 | 5.79 | 41,528.12 | 7.03 | 40,781.34 | 2.53 | 42,056.21 | 8.39 | 39,589.66 | 2.04 |
| MAPE (%) | 4.66 | 4.71 | 6.94 | 3.51 | |||||||
| RMSPE (%) | 4.79 | 5.25 | 7.09 | 3.69 | |||||||
| Year | 2024 | 2025 | 2026 | 2027 | 2028 |
|---|---|---|---|---|---|
| Predicted Values | 41,150.47 | 42,519.60 | 43,888.73 | 45,257.86 | 46,626.99 |
| R0i(X0,X5) | R0i(X0,X2) | R0i(X0,X4) | R0i(X0,X3) | R0i(X0,X1) | R0i(X0,X6) | |
|---|---|---|---|---|---|---|
| Relational degrees | 0.9312 | 0.9304 | 0.9242 | 0.8687 | 0.7626 | 0.7357 |
| Year | Actual Values | GM(1,1) | RCGM(1,1) | GM(1,N) | GMC(1,N) | FGMC(1,N,2r) r1 = 0.9583, r2 = 0.3261 | |||||
|---|---|---|---|---|---|---|---|---|---|---|---|
| Predicted Values | APE (%) | Predicted Values | APE (%) | Predicted Values | APE (%) | Predicted Values | APE (%) | Predicted Values | APE (%) | ||
| Modeling | |||||||||||
| 2012 | 7317.00 | 7317.00 | 0.00 | 7317.00 | 0.00 | 7317.00 | 0.00 | 7317.00 | 0.00 | 7317.00 | 0.00 |
| 2013 | 7023.00 | 8415.78 | 19.83 | 7023.00 | 0.00 | 5463.56 | 22.19 | 7358.42 | 4.77 | 7158.42 | 1.93 |
| 2014 | 7449.00 | 8581.43 | 15.2 | 8931.85 | 19.91 | 8407.68 | 12.87 | 7684.19 | 3.16 | 7582.16 | 1.79 |
| 2015 | 8482.00 | 8750.34 | 3.16 | 9051.28 | 6.71 | 8246.82 | 2.77 | 8211.05 | 3.20 | 8321.59 | 1.89 |
| 2016 | 8971.00 | 8922.57 | 0.54 | 9174.81 | 2.27 | 7631.35 | 14.93 | 8738.91 | 2.59 | 8764.83 | 2.30 |
| 2017 | 9039.00 | 9098.20 | 0.65 | 9302.51 | 2.92 | 10,831.13 | 19.82 | 9011.27 | 0.31 | 9255.47 | 2.39 |
| 2018 | 12,000.00 | 9277.28 | 22.69 | 9434.42 | 21.38 | 11,852.39 | 1.23 | 11,588.36 | 3.43 | 11,742.36 | 2.15 |
| 2019 | 11,639.00 | 9459.88 | 18.72 | 9570.59 | 17.77 | 15,063.73 | 29.42 | 11,984.25 | 2.97 | 11,902.18 | 2.26 |
| 2020 | 11,468.00 | 9646.08 | 15.89 | 9711.09 | 15.32 | 7846.00 | 31.58 | 10,987.53 | 4.19 | 11,725.91 | 2.25 |
| 2021 | 8519.00 | 9835.94 | 15.46 | 9855.97 | 15.69 | 9326.55 | 9.47 | 8945.61 | 5.01 | 8346.28 | 2.03 |
| MAPE (%) | 12.46 | 12.75 | 16.03 | 3.29 | 2.11 | ||||||
| RMSPE (%) | 14.88 | 14.62 | 19.87 | 3.61 | 2.13 | ||||||
| Testing | |||||||||||
| 2022 | 8647.00 | 10,029.54 | 15.99 | 10,005.31 | 15.71 | 10,311.65 | 19.25 | 8824.73 | 2.05 | 8462.64 | 2.14 |
| 2023 | 8961.00 | 10,226.96 | 14.13 | 10,159.16 | 13.73 | 10,553.96 | 17.77 | 9211.89 | 2.80 | 8771.97 | 2.11 |
| MAPE (%) | 15.06 | 14.54 | 18.51 | 2.43 | 2.12 | ||||||
| RMSPE (%) | 15.09 | 14.59 | 18.52 | 2.44 | 2.13 | ||||||
| Year | 2024 | 2025 | 2026 | 2027 | 2028 |
|---|---|---|---|---|---|
| Predicted Values | 9081.35 | 9390.72 | 9700.09 | 10,009.46 | 10,318.83 |
Disclaimer/Publisher’s Note: The statements, opinions and data contained in all publications are solely those of the individual author(s) and contributor(s) and not of MDPI and/or the editor(s). MDPI and/or the editor(s) disclaim responsibility for any injury to people or property resulting from any ideas, methods, instructions or products referred to in the content. |
© 2025 by the authors. Licensee MDPI, Basel, Switzerland. This article is an open access article distributed under the terms and conditions of the Creative Commons Attribution (CC BY) license (https://creativecommons.org/licenses/by/4.0/).
Share and Cite
Yu, Q.; Ye, J.; Xu, X.; Lu, Z.; Ma, L. Prediction and Analysis of Abalone Aquaculture Production in China Based on an Improved Grey System Model. Sustainability 2025, 17, 8862. https://doi.org/10.3390/su17198862
Yu Q, Ye J, Xu X, Lu Z, Ma L. Prediction and Analysis of Abalone Aquaculture Production in China Based on an Improved Grey System Model. Sustainability. 2025; 17(19):8862. https://doi.org/10.3390/su17198862
Chicago/Turabian StyleYu, Qing, Jinling Ye, Xinlei Xu, Zhiqiang Lu, and Li Ma. 2025. "Prediction and Analysis of Abalone Aquaculture Production in China Based on an Improved Grey System Model" Sustainability 17, no. 19: 8862. https://doi.org/10.3390/su17198862
APA StyleYu, Q., Ye, J., Xu, X., Lu, Z., & Ma, L. (2025). Prediction and Analysis of Abalone Aquaculture Production in China Based on an Improved Grey System Model. Sustainability, 17(19), 8862. https://doi.org/10.3390/su17198862


