Article

Developing Intelligent Integrated Solutions to Improve Pedestrian Safety for Sustainable Urban Mobility

by
Irina Makarova
1,*,
Larisa Gubacheva
2,
Larisa Gabsalikhova
1,
Vadim Mavrin
1 and
Aleksey Boyko
1
1
Naberezhnye Chelny Institute, Kazan Federal University, Syuyumbike Prosp. 10A, Naberezhnye Chelny 423832, Russia
2
Institute of Civil Protection, Vladimir Dahl Lugansk National University, Molodezhnyj Quar., 20-A, Lugansk 91000, Russia
*
Author to whom correspondence should be addressed.
Sustainability 2025, 17(19), 8847; https://doi.org/10.3390/su17198847
Submission received: 8 July 2025 / Revised: 26 September 2025 / Accepted: 29 September 2025 / Published: 2 October 2025
(This article belongs to the Special Issue Smart Mobility for Sustainable Development)

Abstract

All over the world, the problem of ensuring the safety of pedestrians, who are the most vulnerable road users, is becoming more acute due to urbanization and the growth of micromobility. In 2013, according to WHO data, more than 270 thousand pedestrians were dying each year worldwide (accounting for 22% of all traffic accidents). Currently, experts report that around 1.3 million people die every year globally from road crashes. The roads in developing countries are particularly hazardous, according to experts, because the increase in the number of vehicles far exceeds the development of road infrastructure and safety systems. Since the risk of hitting a pedestrian depends on many factors that can have different natures, and the severity of the consequences can be determined by a set of other factors, the risk of an accident can only be reduced by influencing all these factors in a comprehensive manner. The novelty of our approach is to create an intelligent system that will gradually accumulate all the best practices into a single complex aimed at reducing the risk of an accident with pedestrians and the severity of the consequences if an accident does occur. The distinction lies in offering an integrated system where each module addresses a particular task, so by mitigating risks at every stage, one achieves a synergistic outcome. From the analysis of existing and applied developments, it is known that many specialists mainly solve a narrowly focused problem aimed at ensuring the one subsystems sustainability in the “vehicle-infrastructure-driver-pedestrian” system. Some of these ideas are given as practical examples. The relevance of the designated problem increases with the emergence of autonomous vehicles and smart cities, the sustainability of which depends on the sustainable interaction between all road users. As experience shows, only the implementation of comprehensive solutions allows us to solve strategic problems, including improving road safety. Here, by complex solutions we mean solutions that combine technical issues, as well as environmental, social, and managerial aspects. To account for different kinds of effects, indicator systems are developed and composite indices are computed to choose the most rational solution. The novelty of our approach consists in combining within a unified DSS algorithms for assessing the efficiency of the proposed solution with respect to technological soundness, environmental sustainability, economic viability, social acceptability, as well as administrative rationality and computation of interrelated effects resulting from implementing any given project. In our opinion, the proposed system will lead to a synergistic effect due to the integrated application of various developments, which will ensure increased sustainability and safety of the transport system of smart cities. Our paper proposes a conceptual approach to addressing pedestrian safety, and the examples provided illustrate how the same model or algorithm can lead to positive changes from different perspectives.

1. Introduction

In the 21st century, trends in the design of urban transport systems have changed, due to the transition to a new mobility based on a “human-centric” (anthropocentric) approach [1,2]. Within the framework of this approach, a human-centric metropolis is a city that can satisfy the changing needs of citizens at any stage of their lives, and the resident becomes the basis for planning and design. The anthropocentricity of the city is determined by the principles of accessibility, safety, comfort and citizen involvement—everything that makes the city sustainable. The transport ecosystem in this paradigm must ensure the safety of any participant in the movement, especially pedestrians, as the most vulnerable category of city residents.
Currently, under the concept of transition to green transport in cities, healthy, environmentally friendly options for transportation are walking, cycling, e-scooters and other means of individual mobility [3,4,5]. Micromobility programs (rental of bicycles and scooters) are being implemented in various cities around the world [6,7]. In addition, when improving the infrastructure, conditions are created for more comfortable and safe movement of these categories of road users. However, despite the measures taken, pedestrians, cyclists and scooter riders are the most vulnerable road users. More than half of road deaths occur among this group of road users. Every year, more than a million pedestrians die on the world’s roads, and about 50 million are injured. The situation is aggravated by the growth of megacities and the increasing population’s motorization. As vehicles and road infrastructure become increasingly intelligent, efforts are being made to minimize the human factor, which creates unjustified risks on city roads. At the same time, measures are being developed to protect pedestrians by creating passive safety devices, as well as intelligent systems for alerting pedestrians, controlling their attention, and monitoring and analyzing pedestrian flows. These systems can warn drivers about dangerous pedestrian behavior and the risk of accidents. Both scientists in different countries and specialists in the field of traffic management are concerned about solving the problem of pedestrian safety. This problem is acute both in megacities and in small towns. It should also be noted that road accidents with victims seriously affect national economies, costing countries about 3% of their annual GDP, since about two thirds of road deaths occur among people of working age. The high risk of injury and death of children and young people is of concern. Given these facts, the sustainable development agenda includes a goal to reduce the number of deaths from road accidents by 50% by 2030 [8,9].
Since the reasons for the increase in the number of road accidents and the severity of the consequences are different and depend on different factors, the methods of solution are also different. These can be technical solutions (passive safety methods), infrastructure solutions (underground and overground crossings, traffic light control), as well as “smart” solutions that allow avoiding situations that lead to conflicts between road users.
Global trends in road safety in addressing mobility issues in large cities are aimed at promoting the use of environmentally friendly solutions, such as abandoning personal cars in favor of public transport, cycling and walking. This is why the issue of ensuring the safety of the most vulnerable road users, such as pedestrians and cyclists, is becoming even more urgent.
In recent years, the growth of micromobility has created problems with pedestrian safety, which is especially noticeable in the southern regions and large cities.
According to the conclusions of the Government Commission to ensure road safety, despite the measures taken, it becomes more difficult to hold positive dynamics on road safety. So, according to the statistics of an accident, the rating of regions by the number of accidents due to the fault of pedestrians is headed by Moscow, St. Petersburg, Krasnodar Territory, Moscow and Nizhny Novgorod Regions. And if in four of the named subjects the number of accidents in 2024 decreased, then growth is observed in St. Petersburg. In addition, according to the number of accidents involving pedestrians, a similar rating is headed by Moscow, Krasnodar Territory, Chelyabinsk Region and St. Petersburg, and the numbers exceed the same indicators of the previous year. It should be noted separately that in 2024 in Russia, 6.7 thousand road accidents involving collisions with pedestrians occurred in the dark hours of the day, out of a total of 23 thousand incidents. At the same time, only 300 pedestrians had reflective elements on clothes.
Official statistics can be found on websites such as:
Despite the measures and activities undertaken under the implemented strategies and activities of transport departments, the problem remains acute. Therefore, in the national project “Infrastructure for Life” [10] adopted in April 2025, the federal project “Road Safety” was singled out, the target indicator of which is “Reduction of mortality as a result of road accidents by 1.5 times (1.58 people per 10 thousand vehicles)”. To achieve this indicator, comprehensive solutions are needed that combine both technical and infrastructural measures, as well as raising the awareness of citizens and ensuring responsible behavior on the roads.
The article proposes solutions that will help improve pedestrian safety. It presents both technical measures to regulate traffic and solutions that help choose a safer route.
The article is structured as follows: Section 2 provides an overview of studies focused on investigating factors affecting pedestrian safety, developing technologies for enhancing pedestrian safety, and improving interactions between pedestrians and drivers of connected and autonomous vehicles. Section 3 outlines the materials and methods used. Section 4 presents the results and discussions. Finally, Section 5 summarizes key findings and highlights the limitations of the study.

2. Problem Background: Measures to Ensure Pedestrian Safety

2.1. Study of Pedestrian Behavior Patterns and Identification of the Most Critical Factors Influencing Safety

The influence of the age factor has been studied in the works of many scientists, who concluded that the groups at increased risk are children and the elderly, although the reasons for the higher risk in these groups differ. Therefore, recommendations for improving safety will be different for children, the elderly, as well as for low-mobility citizens. In addition, it is necessary to take into account social aspects, such as the perception of safety in the urban environment. The summary information is shown in Table 1.
Thus, the authors of the paper [11] analyze articles focusing on child safety. This review presents studies conducted over the past 10 years and devoted to parameters affecting child safety at intersections and crosswalks. The article [12] examines the issues of road safety for children and schoolchildren. The authors found significant changes in children’s behavior under and without parental or adult supervision.
Despite the lack of a single solution, the need to take measures to reduce the likelihood of traffic accidents involving child pedestrians and child injuries is universally acknowledged, and there are positive examples developed for specific localities. Both traditional problem-solving methods (such as regression analysis) and new ones (e.g., neural networks) are used for this purpose. So, the study [13] analyzes 36 parameters that potentially influence children’s behavior. The authors account for the correlation between the speed at which children cross the street in the conflict zone and parameters such as child behavior, driver behavior, as well as traffic and road infrastructure characteristics using neural network-based models. In the article [14], microsimulation is proposed for selecting the optimal solution for reconstructing urban transport infrastructure in terms of road safety, as the authors identified road safety issues, particularly concerning the behavioral responses of children and elderly pedestrians, at the selected uncontrolled crosswalk. Using microsimulation modeling (VISSIM), traffic parameters were analyzed under various conditions for the existing and redesigned layouts of the conflict zone.
Some authors recommend using multicriteria analysis for future studies by introducing additional criteria: environmental, economic, social, etc. So, the paper [15] demonstrates that factors such as language barriers, lack of familiarity with local traffic rules, and differences in cultural approaches to safety can increase the risk of pedestrian to engage vulnerable groups, including children, the elderly, and CALD communities injury and fatality. Therefore, pedestrian safety strategies must consider the regional context (e.g., urban and non-urban communities, including vulnerable groups of children from low- and middle-income backgrounds). The study [16] predicted the regional vulnerability to traffic accidents involving elderly pedestrians in South Korea (which currently occur 7.7 times more often than in OECD countries) in connection with the future growth of the elderly population and examined possible risk reduction measures. The authors argue that to create an age-friendly city in preparation for the aging era, it is essential to re-examine the safety of older pedestrians and predict the likelihood of such accidents under current and future demographic conditions.
Despite the orientation towards a human-centered approach in developing urban strategies, including the creation of a safe and accessible environment, there remains a scarcity of research devoted to studying pedestrians’ subjective perception of physical safety while walking. However, the study [16] established that there is no clear correlation between environmental factors (e.g., traffic safety facilities and pedestrian crossings) and perceived safety, which is why it is necessary to consider both physical and perceived pedestrian safety. The aim of the study [18] was to investigate factors affecting pedestrian satisfaction based on land use and street type in Changwon City, South Korea. The results of the analysis using binary and ordered logit models showed that fewer illegal parking spaces, more pedestrian space, pedestrian guidance devices, and green areas are associated with higher pedestrian satisfaction.
The regional factor is also significant. So, according to data from the European Road Safety Observatory, approximately 21% of all fatal road accidents in the EU occur due to the fault of pedestrians. The article [19] presents an analysis of pedestrian behavior at a signalized pedestrian crossing equipped with a safety island, based on the presence or absence of a pedestrian countdown timer, in the Belgrade urban area (Serbia). The aim of the study was to observe and compare behavioral patterns of a specific pedestrian category at the 1st (before the safety island) and 2nd (from the safety island) sections of the pedestrian crossing, both with and without the pedestrian countdown timer. In urban areas, which account for 40% of all road fatalities, the probability of pedestrians being killed in traffic accidents is 2.8 and 15 times higher than in rural areas and on highways, respectively. The methodology proposed in the study [20] utilizes both traditional logistic regression models and artificial neural networks, using traffic accident data from Berlin, Germany, obtained from the Berlin Open Data portal. As the results show, the implementation of traffic calming measures and providing adequate lighting on all roads can have a positive effect on pedestrian safety.
The specifics of traffic management in the Asia-Pacific region are also reflected in the research of many authors who are concerned with ensuring pedestrian safety. The aim of the study [21] was to examine experts’ opinions on the factors affecting the number of pedestrian collisions in Iran. As a result, two main categories were identified: direct factors and underlying factors. The authors also identified key risk factors associated with pedestrian collisions. Safety is indirectly influenced by cultural factors: civic culture and traffic culture, as well as the religious aspect, as pedestrians who attribute events to divine will, luck, and fate exhibit riskier behavior. The study [22] focuses on school safety in Delhi, India. It investigates the challenges of safe school travel and performs microscopic scenario modeling using the Social Force Model (SFM) within the PTV Vissim/Viswalk software environment both before and after implementing measures like installing barriers, widening sidewalks, lowering vehicle speeds, etc.
Studies [23,24] analyzed and evaluated critical factors affecting safety perception and crash risk at intersections in the central business district of Patiala, Punjab, India. Using ordered logit models, it was found that both infrastructural design features and socio-psychological factors substantially affect pedestrians’ perceptions of safety and their overall satisfaction levels. Pedestrians knowledgeable about traffic rules and road safety regulations tend to be more cautious, which underscores the importance of public awareness through road safety campaigns, systematic training and education programs, and in areas with high bus route density, priority should be given to constructing safe crossings. The study [25] focuses on examining the time pedestrians spend crossing the road, depending on their movement patterns. The authors investigated factors influencing road-crossing time. A limitation of the study was the visual estimation of pedestrian age from video data. The rapid urbanization of the Kathmandu Valley, combined with growing vehicle and pedestrian traffic, has revealed a critical need to ensure pedestrian safety, particularly at intersections in Nepal [26]. This study demonstrates that vehicle control by traffic police significantly enhances pedestrian safety; therefore, it is recommended to control vehicles through traffic police enforcement during peak pedestrian hours.
As the analysis shows, despite similar pedestrian safety issues across countries, researchers identify numerous factors that affect pedestrian safety. Therefore, there is no single solution that can be applied across different regions, in urban and rural areas, or for different population groups, including those with different ages and mentalities. Given this, it is essential to analyze the entire range of factors affecting pedestrian safety when developing a management system.

2.2. Infrastructure Solutions to Reduce Accidents

As identified in the previous section, infrastructure solutions often have a significant impact on pedestrian safety. These range from physical infrastructure such as roads themselves, junctions (including roundabouts, pedestrian crossings, and refuge islands), and traffic calming measures, to operational systems like traffic signals, other traffic control devices, and driver-pedestrian communication systems. In this section, we summarize the results of research on the impact of infrastructure solutions on pedestrian safety (Table 2). For example, the article authors [27] are convinced that in order to achieve safety at urban intersections where pedestrian and vehicle flows intersect and merge, a systematic approach is needed to optimize traffic even at controlled crossings. The authors conclude that when crossing controlled pedestrian crossings, pedestrian safety largely depends on the start time. The authors [28] argue that it is necessary to assess risk exposure from a road safety perspective. To this end, they developed a hybrid approach and conducted experimental studies. It is assumed that pedestrian activity estimates can be integrated with traffic data, including vehicle speed, and such an approach will allow planners to estimate accident risk in the absence of real pedestrian collision data.
The study [29] examines the feasibility of introducing 30 km/h speed limit zones in urban areas to improve road safety as part of a comprehensive urban traffic management strategy. The authors highlight the importance of considering parameters such as effectiveness, barriers, social impacts and fairness goals, adopting evidence-based practices and engaging in participatory decision-making processes. Since pedestrian safety is a critical issue worldwide, one of the areas of pedestrian safety is related to the implementation of infrastructure solutions. So, the authors of the study [30] analyze changes in safety indicators (“before and after”) at pedestrian crossings where an additional lighting system was installed. The main objective of the study [31] is to evaluate infrastructure solutions for reducing speed at pedestrian crossings, as a result of which three categories of devices were identified: highly effective (good), moderately effective (intermediate) and low-effective or ineffective (bad).
The authors of the article [32] consider the problems and needs of the infrastructure of a smart city to improve road safety for child pedestrians and child cyclists. The main objective of the study [33] is to determine the optimal distance between roundabouts and pedestrian crossings to maximize their throughput, considering the complex relationship between pedestrian flow, pedestrian crossing placement, and the overall performance of roundabouts. In typical traffic scenarios such as unsignalized roads or shared spaces, situations are complicated by the unpredictability of pedestrians’ intentions. To address the collision avoidance problem, the authors of the study [34] proposed a strategy using adaptive parameters based on the social force model. Understanding and predicting pedestrians’ behavior when crossing the road is important for improving the driving safety of connected vehicles, especially at unsignalized crossings due to the ambiguous right-of-way that requires pedestrians to constantly interact with vehicles and other pedestrians. The study [35] addresses these issues using a neural network and a simulator to study scenarios involving multiple vehicles and pedestrians.
Infrastructure solutions are becoming increasingly intelligent, as reflected in numerous scientific articles. Since well-lit pedestrian crossings play an important role in improving visibility, recognition and driver reaction time, reducing the risk of accidents and increasing overall pedestrian safety, the article [36] proposes an intelligent system of additional lighting for pedestrian crossings. This is a convenient solution based on round LEDs embedded in the ground that can be applied to any existing pedestrian crossings. The study [37] presents a new innovative solution for intelligent pedestrian crossings based on alarm signals generated by sensor signals. In heavy fog or rain, the intense light signal becomes visible much earlier than the pedestrian crossing.
The authors of the article [38] propose solutions to improve traffic light control. The authors propose using image processing technologies to detect pedestrians to improve the traditional traffic light system so that it can make decisions taking into account the number of pedestrians at the crossing and their waiting time. The authors of the study [39] found that deep learning methods can be effective tools for improving intelligent traffic lights. The light and sound warning can warn both drivers and pedestrians to reduce traffic accidents. For these purposes, in paper [40] proposed a scheme for constructing intelligent zebra crossings based on cloud-network convergence, which is activated when pedestrians are detected at the crossing. The study [41] presents an intelligent zebra crossing using sensor fusion and machine learning techniques to distinguish between the presence of pedestrians and drivers. The system integrates data from radio detection and ranging sensors and magnetic field sensor using a hierarchical classifier.
Based on this brief overview, it can be observed that researchers focus either on behavioral aspects, examining pedestrian movement patterns at crossings, or on the influence of infrastructure solutions on street-crossing safety. However, although some scholars acknowledge the necessity of systemic measures, a comprehensive approach incorporating both technical and social components is rarely applied. In our view, it is undeniable that these aspects are interrelated; therefore, the following section addresses how technical tools can be utilized to detect behavioral patterns of pedestrians.

2.3. The Influence of Pedestrian Characteristics and Their Behavior on Traffic Safety

As the previous analysis shows, despite efforts to improve road infrastructure, pedestrian safety issues remain a persistent concern. This is largely due to behavioral differences among pedestrians of different age groups, which are exacerbated by differences in mentality, education level, disregard for traffic rules, and other factors (Table 3).
Pedestrians, as one of the interactive agents, exhibit different behavior at road crossings, which does not follow a single pattern and can change depending on the situation. The paper [42] aims to understand effective communication methods, as well as the factors affecting the negotiation and decision-making process of pedestrians. In the paper [43], the authors proposed a method that combines pedestrian detection and tracking to extract pedestrian information in real time to identify abnormal behavior on the road. The paper [44] presents a system that uses convolutional neural networks to recognize a pedestrian moving in a certain direction. The study [45] examines the factors that affect pedestrian walking speed and classifies them into pedestrian flow characteristics, pedestrian attributes, layout configuration, environmental conditions, and pedestrian behavior patterns.
An important aspect highlighted by many researchers is distracting factors. As gadgets become increasingly popular, their negative impact on pedestrians, particularly while crossing intersections, continues to grow. Research shows that distraction by smartphones may be the main reason for the increase in pedestrian injuries and deaths. Since using a mobile phone while walking is becoming increasingly dangerous in traffic and leads to an increased risk of accidents, the aim of the experiment [46] was to find out whether using a mobile phone while walking affects walking speed, as well as step rhythm, width and length in young people. It was shown that changes in gait parameters can lead to an increased risk of accidents at pedestrian crossings and tripping while walking. The authors [47] have developed a system based on a Bluetooth beacon that warns pedestrians distracted by their smartphones with a visual or sound signal when approaching a potentially dangerous intersection. Timely interruption of traffic can also prevent fatalities. The study [48] aims to mitigate the problem of distraction while walking by installing a mobile application that can detect movement and remind users to be aware of their surroundings while walking. Since the topic of using mobile devices and headphones at pedestrian crossings has been studied much less compared to using a mobile phone while driving, the aim of the article [49] is to draw attention to this problem. Overall, the study showed that on weekdays, every 2 min someone used a crossing without fully concentrating on crossing the road safely.
In recent times, several negative factors have arisen that compromise pedestrians’ sense of comfort when they are out in streets. On the one hand, this relates to health conditions and limitations in mobility; on the other hand, it involves the necessity to interact with autonomous vehicles entering public roads. In response to these challenges, intelligent solutions are being developed to help mitigate these arising problems. A number of authors point out subjective factors that may worsen pedestrian safety conditions and raise the probability of traffic accidents. This concerns pedestrians with health problems. To address the issue, technical solutions are proposed.
As the number of visually impaired people in Japan is increasing, and many of them experience falls or collisions when going outside, the study [50] proposes a walking assistance method using images obtained by MY VISION and deep learning. The authors created a sidewalk recognition model and a sidewalk center direction model. The study [51] presents a comprehensive smartphone application for the visually impaired. The core of VisionPal is a smartphone application that integrates functions such as obstacle detection, vacant space identification, road sign recognition, and road crossing assistance. The paper [52] proposes an assistive system based on AI edge computing techniques to help visually impaired consumers safely use marked pedestrian crossings or zebra crossings.
Recently, problems related to the transition to greener and smarter transport have been worsening. For instance, public transport is acknowledged to have advantages over private cars. However, at the same time, attention should be paid to pedestrian safety near public transport stops, since this issue often receives insufficient attention in low-income countries, where stop infrastructure tends to be less advanced. The study [53] is the first to compare factors affecting pedestrian safety at bus stops in countries with different income levels. Pedestrians near bus stops are often at high risk of collisions and fatalities due to unsafe pedestrian behavior (e.g., rushing when crossing the road), lack of safe pedestrian pathways at bus stops, high speed and intensity of traffic, multi-lane traffic, and parked vehicles that obstruct visibility.
The emergence of autonomous technologies requires a deeper understanding of pedestrian behavior and safety in environments where pedestrians need to interact with driverless vehicles (DVs). The study [54] examines how pedestrians perceive and respond to DVs compared to human-driven vehicles (HDVs), focusing on objective metrics such as distance acceptance (DA) and psychophysiological metrics such as electrodermal activity (EDA), using research tools like immersive virtual reality (VR) simulation to analyze pedestrian responses to various traffic scenarios. As the number of vehicles equipped with autonomous driving technology increases, the degree of interaction between vehicles and pedestrian changes. In [55], the k-means clustering method is applied to cluster people into those who ignore rules (risky type), those who follow rules flexibly (stable type), and those who strictly follow rules (cautious type). Current pedestrian collision avoidance techniques focus on integrating visual pedestrian detectors with automatic emergency braking systems that can issue warnings and apply the brakes when a pedestrian steps into the path of a vehicle. The system proposed by the authors of [56] addresses such issues using an online pedestrian detection aggregation system based on maps that learn pedestrian locations. The paper [57] evaluates the use of low-resolution 4D radar in real-world urban settings using machine learning and deep learning to detect and classify pedestrian behavior in urban environments.

3. Materials and Methods

Since the purpose of the article is to improve pedestrian safety, it is necessary to determine:
  • pedestrian patterns whose behavior creates risky situations,
  • what types of risks exist for pedestrians and what external factors can cause them,
  • what solutions are implemented to prevent and reduce the severity of consequences in the event that a risky situation does occur.
In addition, it is necessary to classify risk factors of the external environment in order to develop response measures to reduce them. The optimal solution in terms of rapid response to changes in external conditions are intelligent systems and decision support systems, the intellectual core of which are analysis modules, as well as models and algorithms that answer the “what-if” question when combining various factors [58]. This section will describe the methods and models for such systems, and Section 4 will provide some examples of their implementation.
It is assumed that the transition to a new, human-centered mobility paradigm is impossible without creating integrated control systems utilizing intelligent solutions. Importantly, the transition to a human-centered smart city implies the enhancement of processes within the transport system. Furthermore, it is evident that this transition will proceed in all directions, including improvements in both hardware and software, as well as algorithms and management methods.
At the same time, it is crucial to acknowledge the existence of numerous beneficial and well-established solutions worldwide that have proven their effectiveness in practice. The accumulation of this positive experience and the testing of its applicability to the specific conditions of a particular city or province can only be accomplished by integrating all methodologies into a unified, comprehensive system. Within this system, these methods and algorithms will serve as the foundation for developing and implementing new projects.
Therefore, this article advances the hypothesis that integrated management systems incorporating diverse sustainability-enhancing proposals can generate synergistic effects capable of improving overall system performance metrics. We examine the application of ESG principles—including potential modifications—to evaluate how such solutions impact final outcomes. Furthermore, the proposed methodology enables validation of performance indicators across related domains. This section details data collection methodologies for performance metric computation, comparative evaluation criteria, and foundational research datasets.

3.1. Risks Due to the Characteristics of Pedestrian Groups and Their Behavior Patterns

When considering the safety issues of mixed traffic, the following are at increased risk: children, the elderly, drivers and pedestrians who are intoxicated. In addition, an aggravating factor is the excess speed of the vehicle, which increases the likelihood of a car hitting a pedestrian and the severity of injuries. A significant proportion of pedestrian deaths occur in residential areas, especially at night. The risk of injury or death in an accident is most likely for male pedestrians, especially those aged 15–29. In addition, about a third of pedestrians killed in accidents were intoxicated. Child pedestrians are at an even greater risk of injury or death in an accident [59], due to their short stature, inability to estimate distance and speed, and lack of knowledge of traffic rules.
However, accidents involving pedestrians can and should be prevented and their probability assessed, which is why they are not inevitable. The main risks to pedestrians include problems associated with a wide range of factors: driver behavior, especially in terms of speeding and drunk driving; the state of the infrastructure in terms of the lack of special devices for pedestrians, such as sidewalks and raised pedestrian crossings; the design of vehicles in terms of passive safety equipment to protect pedestrians in the event of a collision. In addition, there are regulatory documents that regulate the actions of pedestrians, drivers and special services that are aimed at ensuring maximum safety for pedestrians. Also, emergency services are created to save the lives of pedestrians in the event of an accident.

3.2. DSS and Its Modules for Responding to Risks and Developing Measures to Prevent Incidents

The search for effective solutions in the field of road safety, including in terms of ensuring pedestrian safety, is associated with multifactorial analysis. It should be taken into account that such analysis is based on monitoring the state of road traffic, processing and analyzing big data with the subsequent selection of the most favorable option from among possible ones. The development of technology and technologies for developing algorithms and methods of intelligent analysis make it possible (by summing up the obtained models into one intelligent decision support system) to automate the management of real processes, minimizing the likelihood of incidents and reducing the risks of accidents. The novelty of the proposed approach lies in the development and implementation of such an intelligent DSS, the intelligent core of which will generalize the applied calculation models with methods for finding optimal solutions, as well as algorithms for multifactorial intelligent data analysis. As a result, a database of optimal solutions for each specific situation will be accumulated [60].
In doing so, we proceeded from the fact that it is necessary to generalize in a single system all the directions that will allow us to determine the composition of measures that are rational both from the point of view of increasing safety, environmental friendliness and cost-effectiveness, and from the point of view of social problems. To solve the problems of a safe road environment for pedestrians, cyclists and owners of personal mobility vehicles, the most rational is the modular structure of the DSS, which allows us to expand the functionality as new problems arise by connecting new modules. The novelty of the proposed solution lies in the comprehensive approach and the choice of the best option from the available options.

3.2.1. Grouping Data by the Method of Their Use

Since the DSS is designed to achieve the goals of enhancing transport system sustainability within the transition to a human-centric approach for pedestrian safety, each module has its own interim objectives and corresponding implementation algorithms.
Since the adequacy of decisions depends on the quality of information, the main goal of the “collection and initial of data” module is to determine how the information will be used, and then transfer it to the DB for storage and processing. Therefore, we divided the information into groups based on the frequency of change and use. The first group is conditionally constant information that changes quite rarely, as a result of the implementation of large projects and can be used in strategic planning to check the effectiveness of certain decisions. We include, for example, data on infrastructure facilities, regulatory documents, calculation methods, etc., in this information. The second group of data changes more often and is used for tactical planning, that is, it determines the methods for implementing the strategy and goal for the medium term. We can foresee probable changes in such data and adjust them as changes are made. This is, for example, the structure of vehicle fleets. The third group refers to operational management data that changes constantly, depending on changes determined by the quality of feedback. This can be intelligent control tools, for example, smart traffic lights that respond to traffic flow, etc.
Accordingly, the means of obtaining information and its primary processing differ. Information can come from smart infrastructure sensors (cameras, smart traffic lights, smart cars, etc.) and from external information sources (government bodies—regulatory documents; developers of infrastructure projects; strategic planning bodies).
The data of the first group are included in the processing algorithms and models as constant information, and adjustments are made as changes occur. Therefore, when developing the corresponding models and programs, this possibility must be provided, for example, when updating the initial information. The data for the second group, due to more frequent changes, must be updated at specified points in time with a certain interval (month, quarter, year). Operational data are transmitted to the control center in real time and, accordingly, serve to adjust the control models and compile statistical reports.

3.2.2. Data Storage and Administration Module

This module is designed to organize data storage and access to them. This module stores various types of reference books, information needed for modeling, as well as approved versions of rational solutions obtained during experiments on simulation models and statistical analysis data on requests. The structure of databases and knowledge bases was developed in accordance with the task being solved in order to ensure quick access to information and its processing.

3.2.3. Data Processing Module

This module contains simulation tools that allow you to create models and conduct simulation experiments. In our studies, we mainly used micro modeling to solve problems of individual sections of the urban road network or adjacent territories. The choice of the modeling location was based on the problems identified during the study of open source data. For traffic modeling, these were areas with a concentration of accidents, sections with a complex road network configuration (junctions, intersections where traffic is often difficult, etc.). Models were built for the “as is” and “to be” options. Then an experiment was conducted to determine the most rational control parameters. We used such modeling systems as AnyLogic, MatLab and Simulink, for macromodeling—PTV products. In this study, we provide a number of examples of micromodels in the AnyLogic system. Simulation experiments were conducted in the same system using a built-in optimizer based on the OptQuest (Optimization of Complex Systems) heuristics. The theory of experimental design was used to determine the number of experiments (sets of input parameters).

3.2.4. Decision-Making Module

Decision making is performed by the head of the service (DM—decision-maker), who, with the help of the dispatcher, sends requests for receiving the results of the analysis in the form of reports, according to which analytics is carried out. The logistics and mobility specialist evaluates the results of the modeling and informs the DM whether it is possible to implement it in a real system. The decisions analyzed and evaluated in terms of admissibility and rationality are sent to storage in the knowledge base for use in similar situations. In this way, a base of rational models is formed.

3.3. Materials and Methodologies Used in the Study

Since it is impossible to completely separate the flows of ground transport and pedestrians in urban traffic, we began by studying the intersections of pedestrian and transport flows from a safety perspective. As has been said, there are many areas of research that develop both technical and organizational solutions for pedestrian safety, but none of them will provide a complete guarantee of safety, since the traffic processes are influenced by many factors that can be both controlled and random. For this reason, we propose combining all existing methods and models that have proven themselves in practice into a single complex, which will help to enhance the positive effect through mutual influence and synergy.

3.3.1. Development of a Pedestrian Classifier

Standard methods were used to develop the classifier. The goal of this stage was to organize pedestrians into separate groups according to various characteristics to study the influence of patterns on traffic safety measures that are more appropriate in each case. For these purposes, we used data from open sources. Since pedestrian flows in the city are heterogeneous and are formed depending on the places of attraction, traffic lights should be configured depending on the composition of the flow. The classifier will subsequently help optimize the settings of traffic lights with a pedestrian button.
Given that pedestrian walking speeds, behavioral patterns, and aggravating factors can influence both the likelihood of traffic accidents and the severity of their consequences, it is essential to understand the structure (composition) of pedestrian groups forming at crossings situated in different districts and at various times of day. The classifier assists in organizing the flow composition and accounting for characteristic behavioral traits.

3.3.2. Choosing the Least Dangerous Route

Risk management methods encompass such areas as the prevention of hazardous situations. When developing measures to enhance pedestrian safety, one approach involves selecting the safest route. This method is particularly effective for the most vulnerable pedestrian groups: children, the elderly, and low-mobility individuals. The essence of the method lies in excluding (where possible) from the route sections where incidents may occur (uncontrolled road crossings and other high-risk areas). For low-mobility pedestrians, the optimal route entails selecting a barrier-free environment and similar considerations.
Currently, there are a large number of navigation programs; however, although they allow you to choose a pedestrian mode of movement, in most cases, they are configured only to show the possibility of moving from point A to point B. There are difficulties with this, taking into account the terrain, ground transport traffic at the intersections of the road, the presence of obstacles that are difficult for low-mobility pedestrians and children to overcome. Therefore, we assumed that before setting off, it would be a good decision to choose the most suitable route taking into account the characteristics of the pedestrian. We proposed algorithms for choosing routes that can be implemented in navigators for different groups of city residents. These algorithms were tested in test examples and showed good results, for example, when choosing a route to school.

3.3.3. Using Simulation Models to Analyze Infrastructure Change Solutions

To evaluate the effectiveness of the proposed infrastructure solutions, we chose to use simulation models because they enable comparison of different options without significant changes to the model. In addition, modern simulation systems have visualization capabilities and built-in optimizers, which allows us to choose the best possible solution. Since simulation models require verification and validation, at the first stage, after selecting the most problematic places from a safety point of view, we conducted field studies, the results of which served to verify the adequacy of the model. Field studies consisted of video recording of pedestrian and traffic flows at different times of the day, followed by processing of the video recording data. Then, an “as is” model was built, verified and validated.
The “as is” model was validated for conformity with the real-world system by matching video surveillance data with results obtained from the modeling experiment. This provided the foundation for analyzing proposed modifications within the “to be” model.
After that, the model was modified into a “as will be” version and comparative experiments were conducted on the model) (this is described in more detail in Section 4).
The optimization experiment on the model was conducted using the OptQuest optimizer embedded in AnyLogic 8, in accordance with the theory of experimental design applied to search for combinations of varying input parameters, as the optimization was multiparametric.

3.4. Justification of Reproducibility of Methods and Results

As noted in the previous section, we used a standard observation method for our on-location filming. Video recording was taken with a standard camera, followed by processing of the footage and manual counting of pedestrians crossing the road and vehicles passing through the intersection. Filming was conducted over the course of a week on weekdays to identify rush hour traffic, and then during peak hours. After processing, the data was averaged.
The reproducibility of this methodology is ensured by the application of standard methods and is contingent upon the quality of the equipment used (which determines the recording quality) and the accuracy of data processing. The “as is” model was also verified and validated according to a standard procedure, further ensuring the reproducibility of the results. The pedestrian classifier was developed based on an analysis of open-source information. Since it does not contain numerical data, it is reliable. However, it can be expanded and supplemented as new classification features emerge.

4. Results and Discussion

4.1. DSS Structure

As the analysis of the state of the problem has shown, many efforts are being made to ensure pedestrian safety, including by the scientific community. However, since each author works in his own direction, an approach is needed that would allow combining all available developments in a single safety management system. As practice shows, only comprehensive solutions can provide a long-term and sustainable effect in solving safety problems.
We propose to classify security measures according to different criteria and then highlight the most effective measures, including those that have been tested and have yielded positive results, as well as our own developments.
We have developed the concept and structure of modules for such a system (Figure 1). The advantage is the ability to refine and expand the system as new problems arise, due to its modular architecture. At the same time, the system makes it possible to forecast potential risks at the stage of infrastructure design, evaluate the effectiveness of measures, and adjust them accordingly, as well as new technologies and calculation methods appear, supplement the composition of calculation models stored in the system. This will avoid irrational decisions and prevent risks of both economic and environmental and social nature.

4.2. Pedestrian Classification and Intelligent Analysis in Route Selection

Despite the measures taken, pedestrians continue to be injured and killed in road accidents. To understand the causes of such situations, it is necessary to consider not only subjective reasons (“human factor”), but also objective ones (what aggravates the situation and does not depend on the pedestrian).
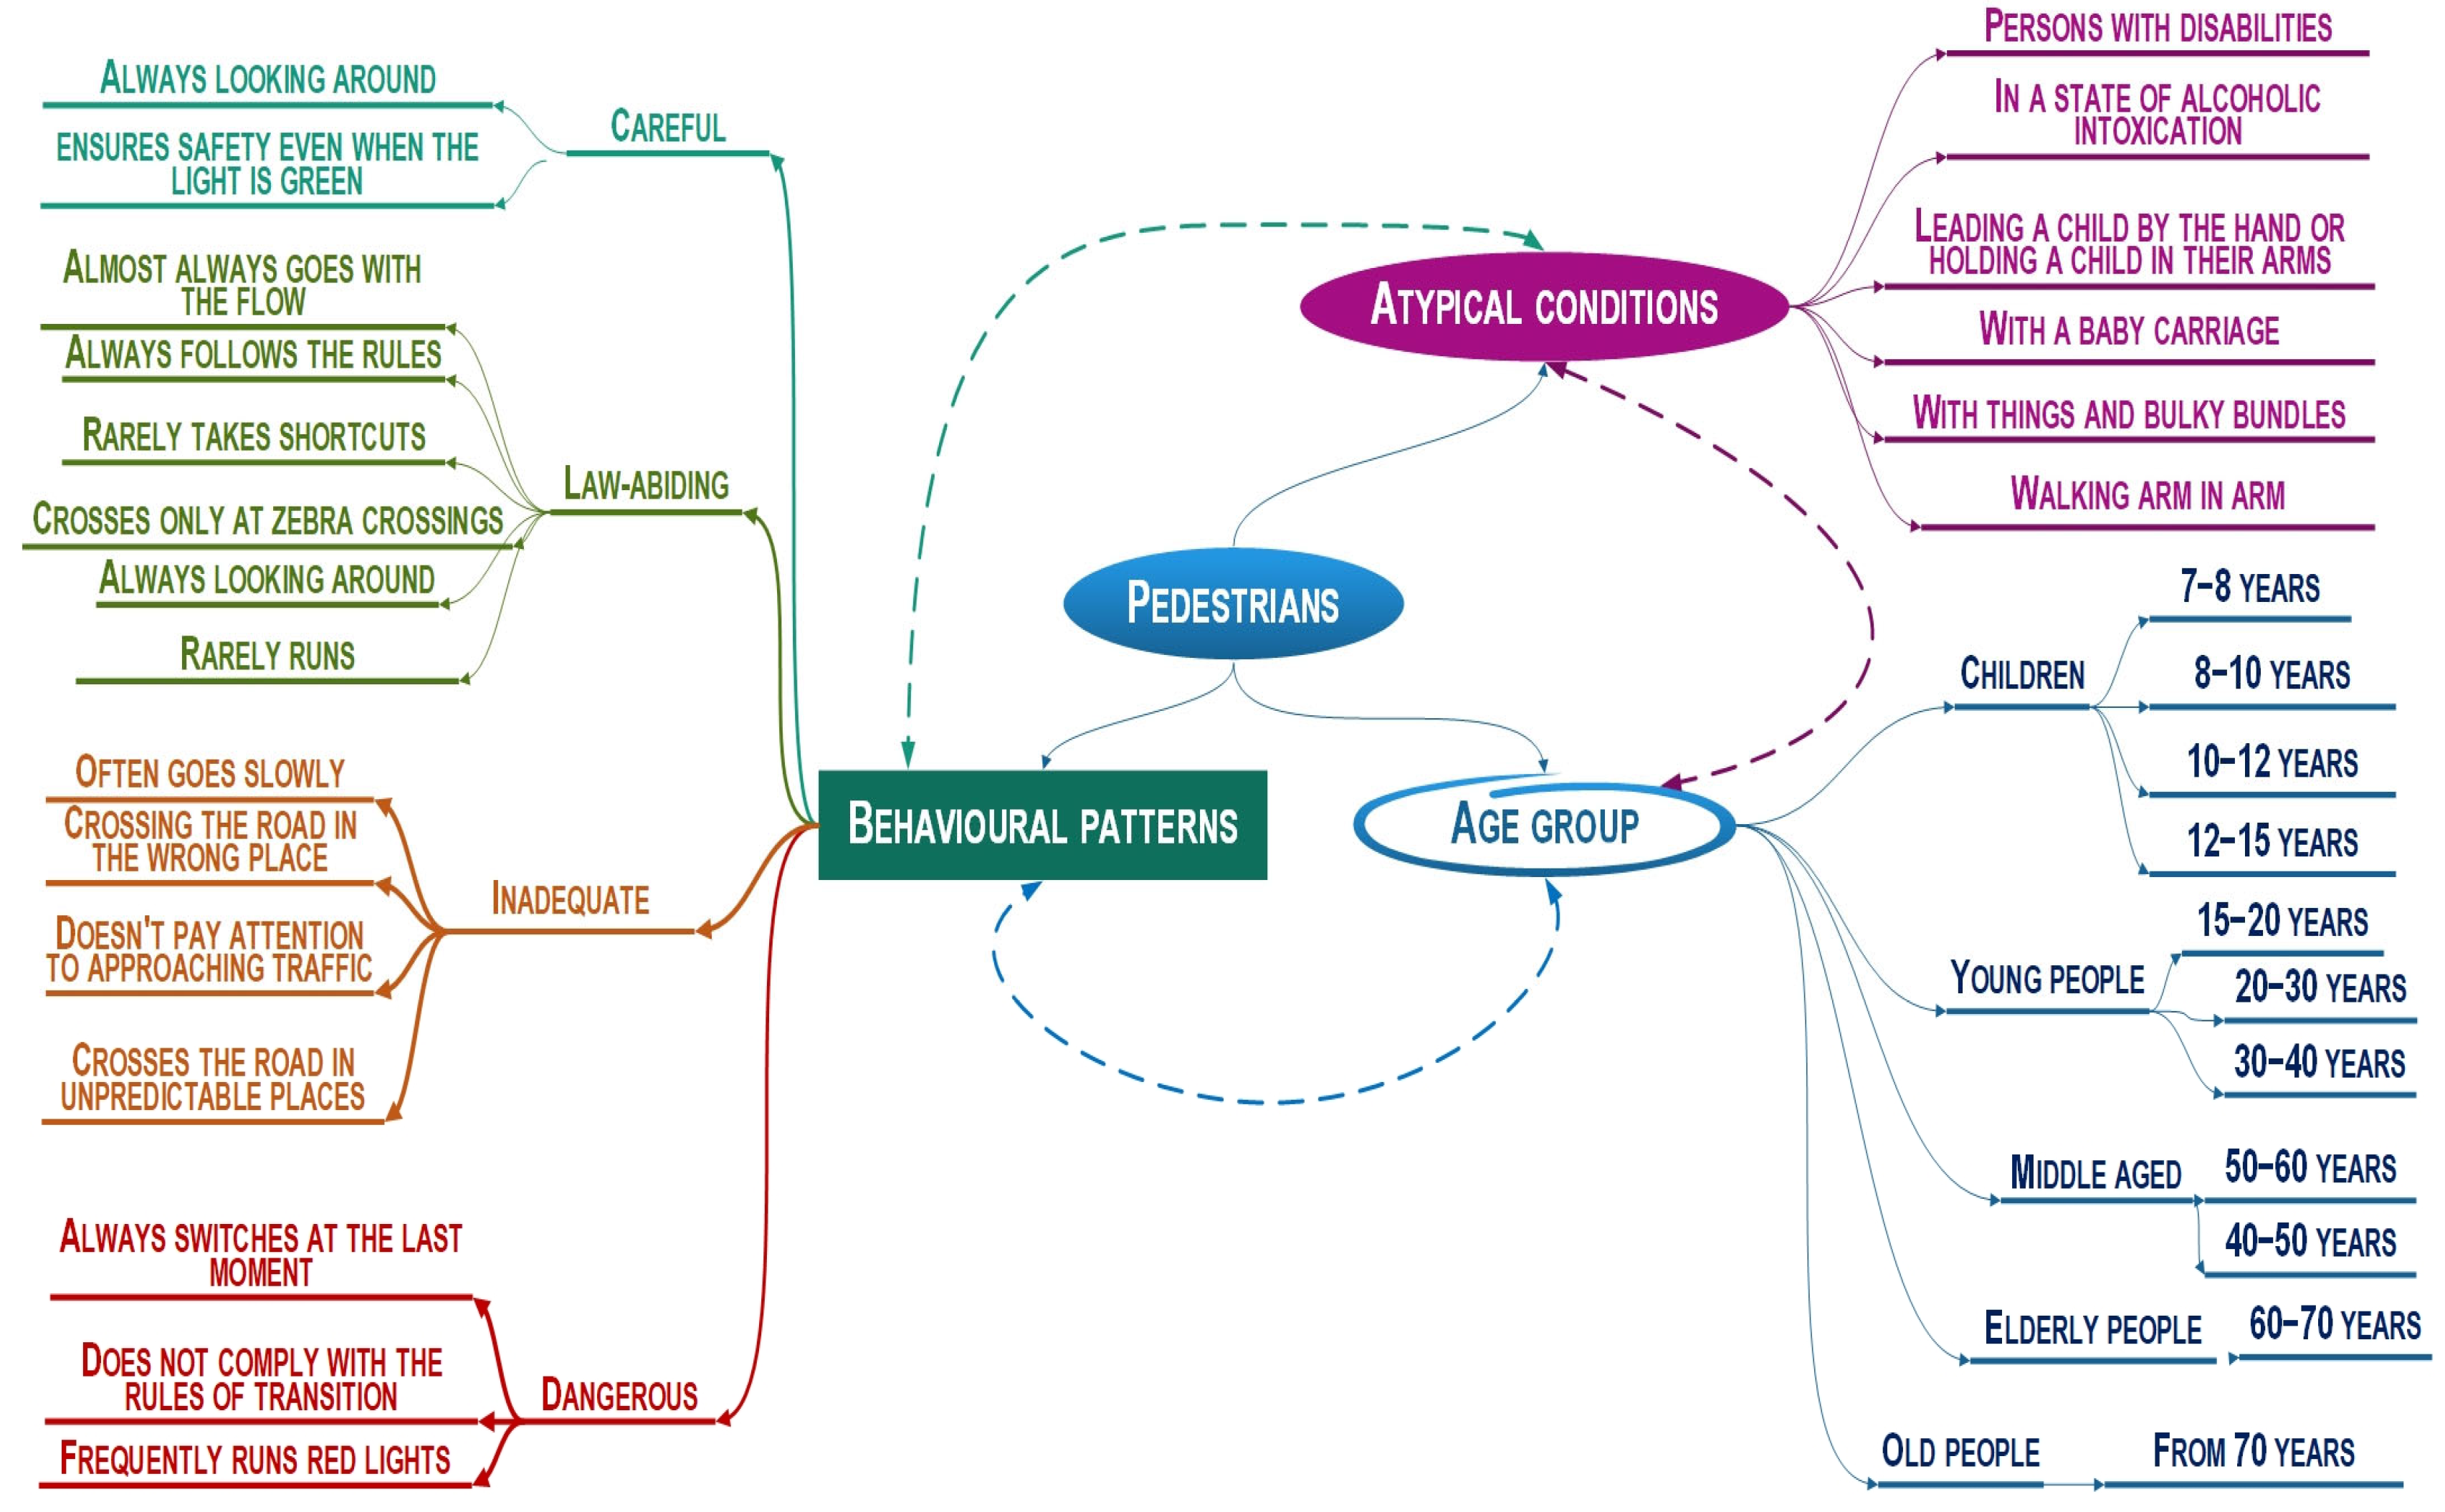
First of all, we identified pedestrian groups based on various characteristics (Figure 2). The main goal was to identify clusters based on various characteristics. In our case, these were age groups (influence on the speed of crossing the road), behavior patterns (influence on the probability of the risk of creating an emergency situation), and aggravating factors (what increases the risk of an accident many times over).
Average pedestrian speeds, depending on age group, are regulated; however, aggravating circumstances can affect these values, so it is necessary to introduce correction factors, setting the duration of the pedestrian phase of the traffic light.
Measures taken to reduce both the risk of accidents involving pedestrians and the severity of the consequences if an accident does occur can be divided into structural and organizational. In turn, structural measures (engineering solutions) can be divided into active and passive safety measures. We will focus on the study of traffic light regulation, since, firstly, it is an element of organizational support for traffic regulation, and secondly, the likelihood of an accident depends on the design of the traffic light. As practice shows, the most dangerous places for pedestrians are intersections and places where pedestrians cross the roadway (the so-called conflict points, places where pedestrian and traffic flows intersect).
To ensure pedestrian safety and separate pedestrian and traffic flows, overground and underground pedestrian crossings are created. These solutions are effective in conditions of heavy traffic and the presence of several traffic lanes. Since the speeds of traffic and pedestrians are incomparable, then in the absence of means to regulate the intersection of traffic and pedestrian flows, the probability of collisions is very high. As is known from practice, unregulated pedestrian crossings are the most dangerous. There are works devoted to the study of this problem, which indicate that the situation is aggravated by the role of the “human factor”. These are cases associated with both inadequate pedestrian behavior (sudden appearance on the road) and inattentive driving (especially in multi-lane traffic).
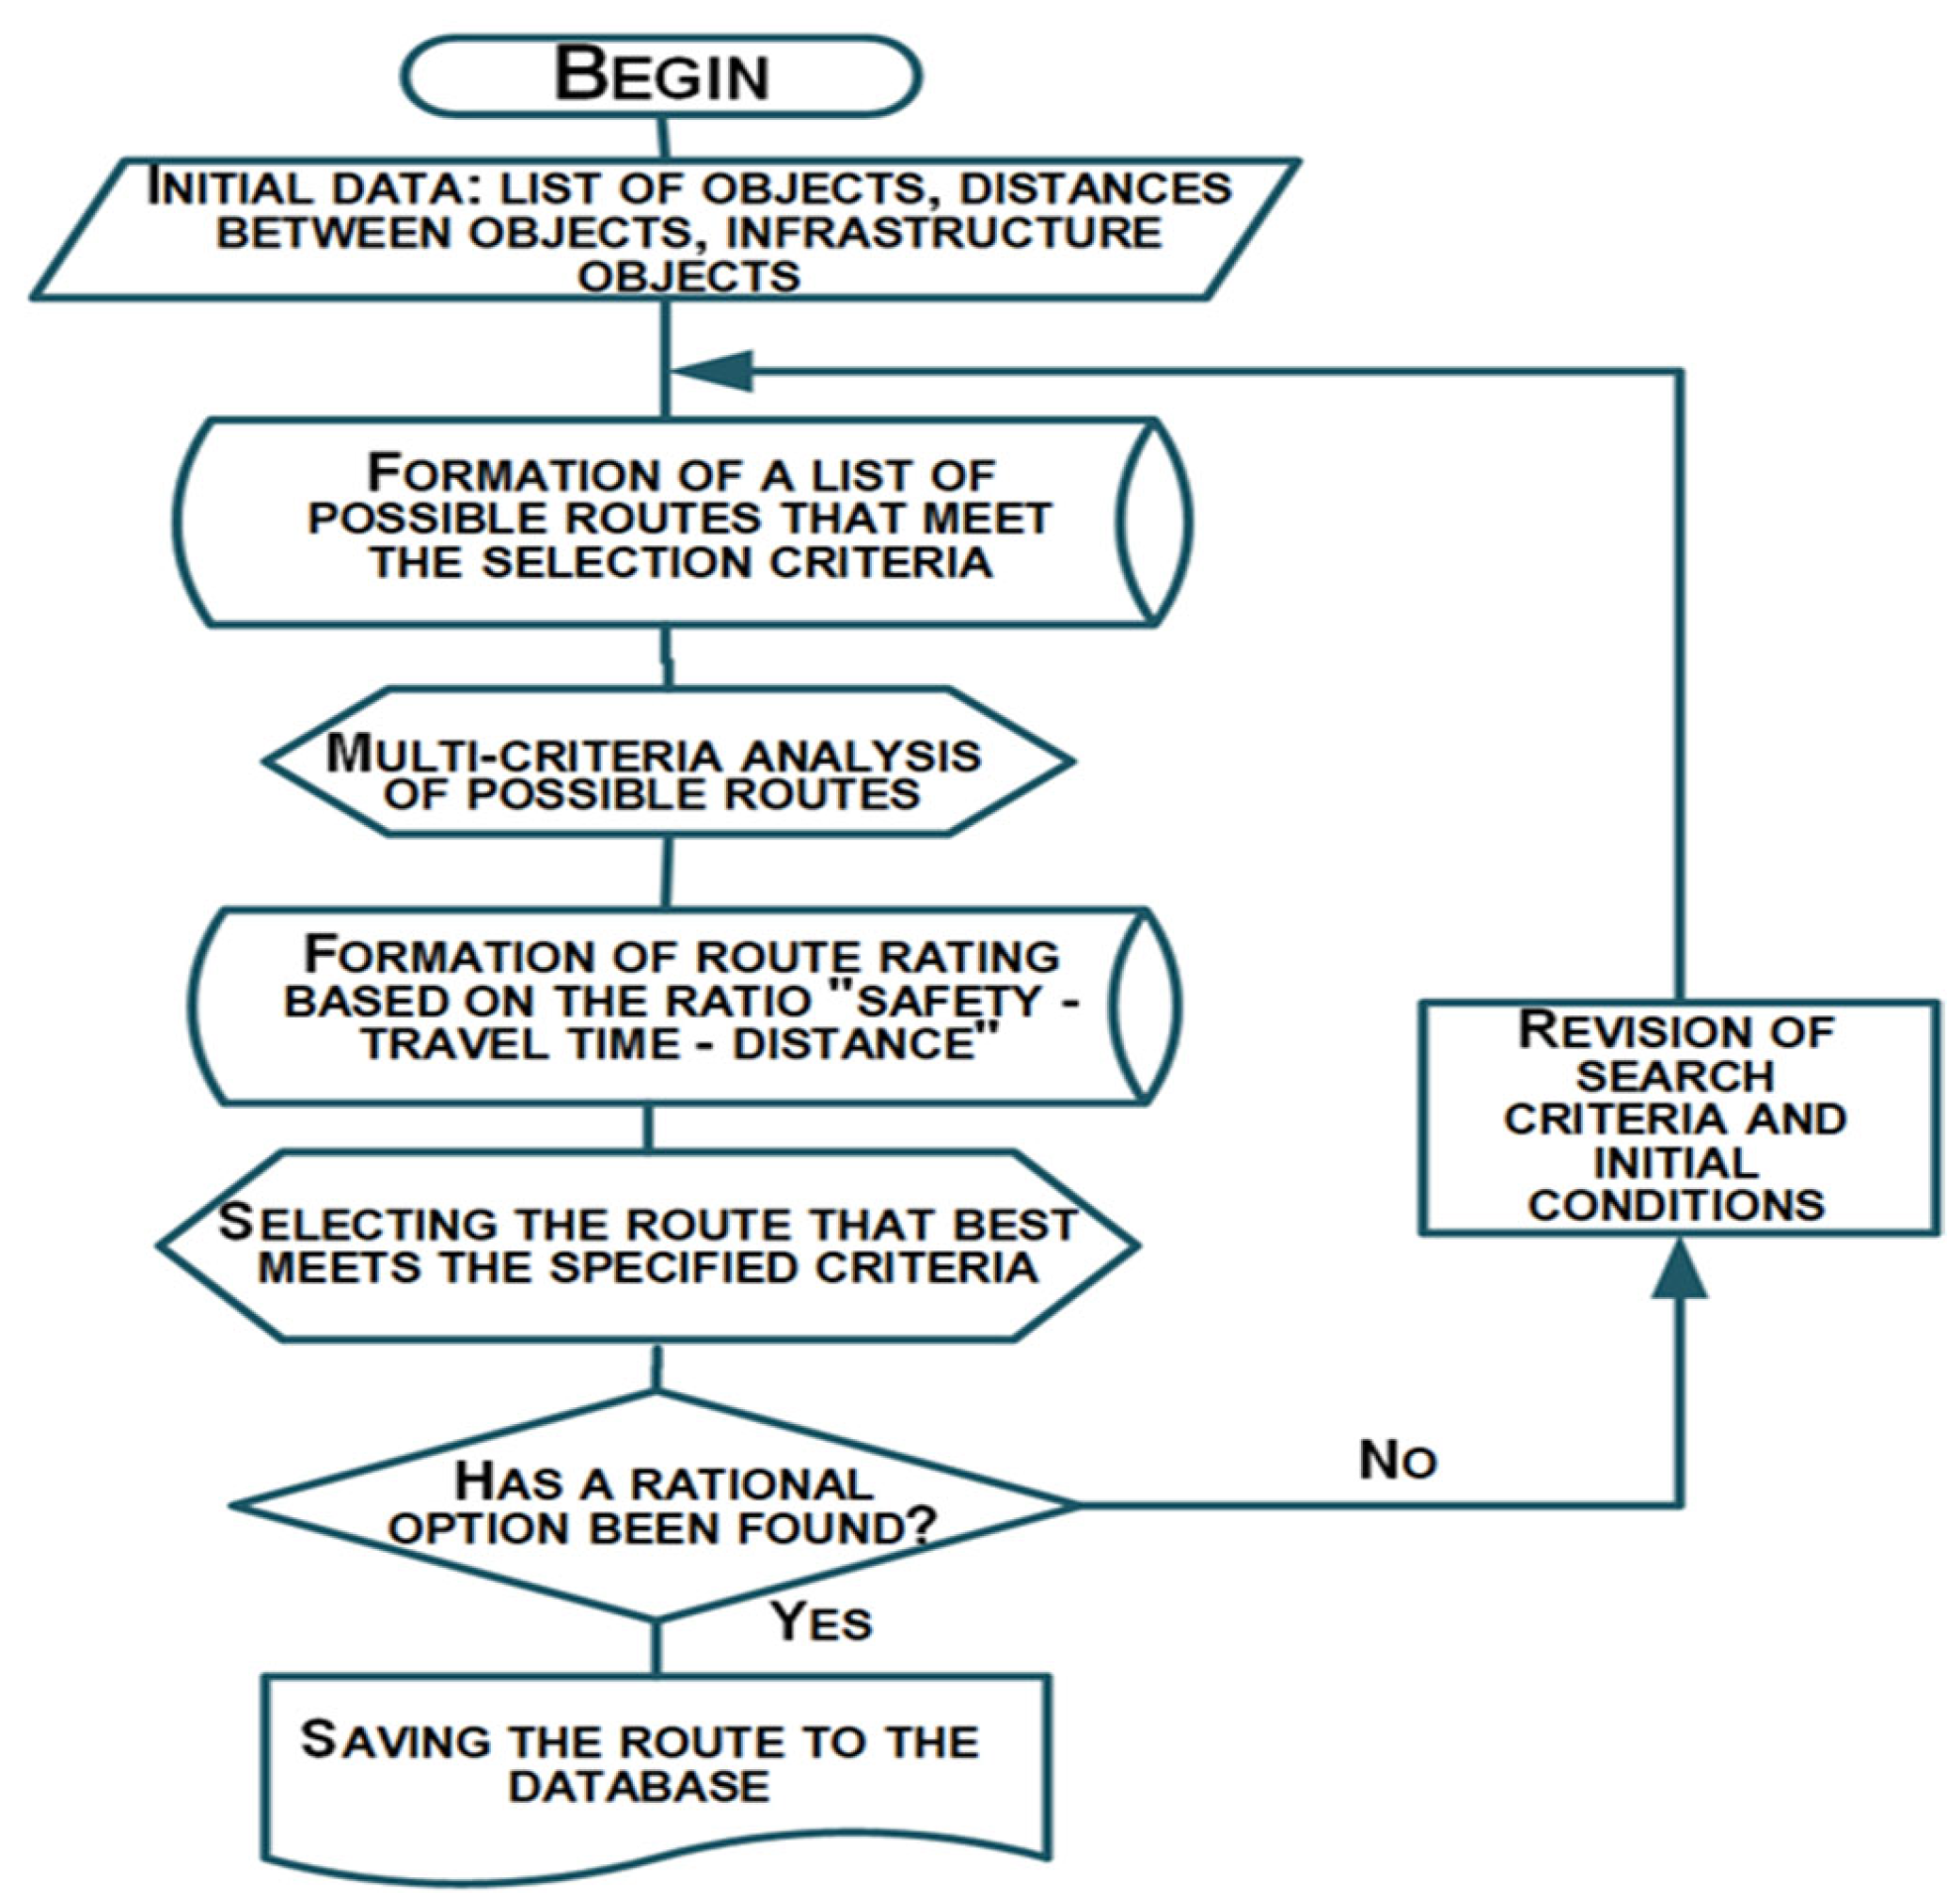
Usually, when making decisions about changing the infrastructure, they are guided by studying the places where accidents are concentrated (the causes are identified and recommendations for their elimination are developed). In many cases, this leads to an improvement in the traffic situation. The most vulnerable pedestrians are children and the elderly. Even at controlled intersections, this is due to the fact that their speed is lower than the average speed of pedestrians, which is taken into account when calculating the duration of traffic light phases. The situation is exacerbated during school holidays, when children are often on the street without adult supervision. During school hours, many countries make efforts to implement safety measures for children on the way to and from school (safe school route). The choice of route from a safety point of view should be carried out taking into account the minimization of dangerous areas. Similar conditions should be observed when choosing routes for the elderly and people with health problems. A simplified algorithm is presented in Figure 3.
When choosing a route using conventional navigators, you should adhere to the following algorithm. The algorithm is simplified one, since it mainly provides for a search by the criteria “distance–travel time”. You can assess the safety of the route if there are marks about the places of concentration of accidents, railway crossings and other places of increased danger.
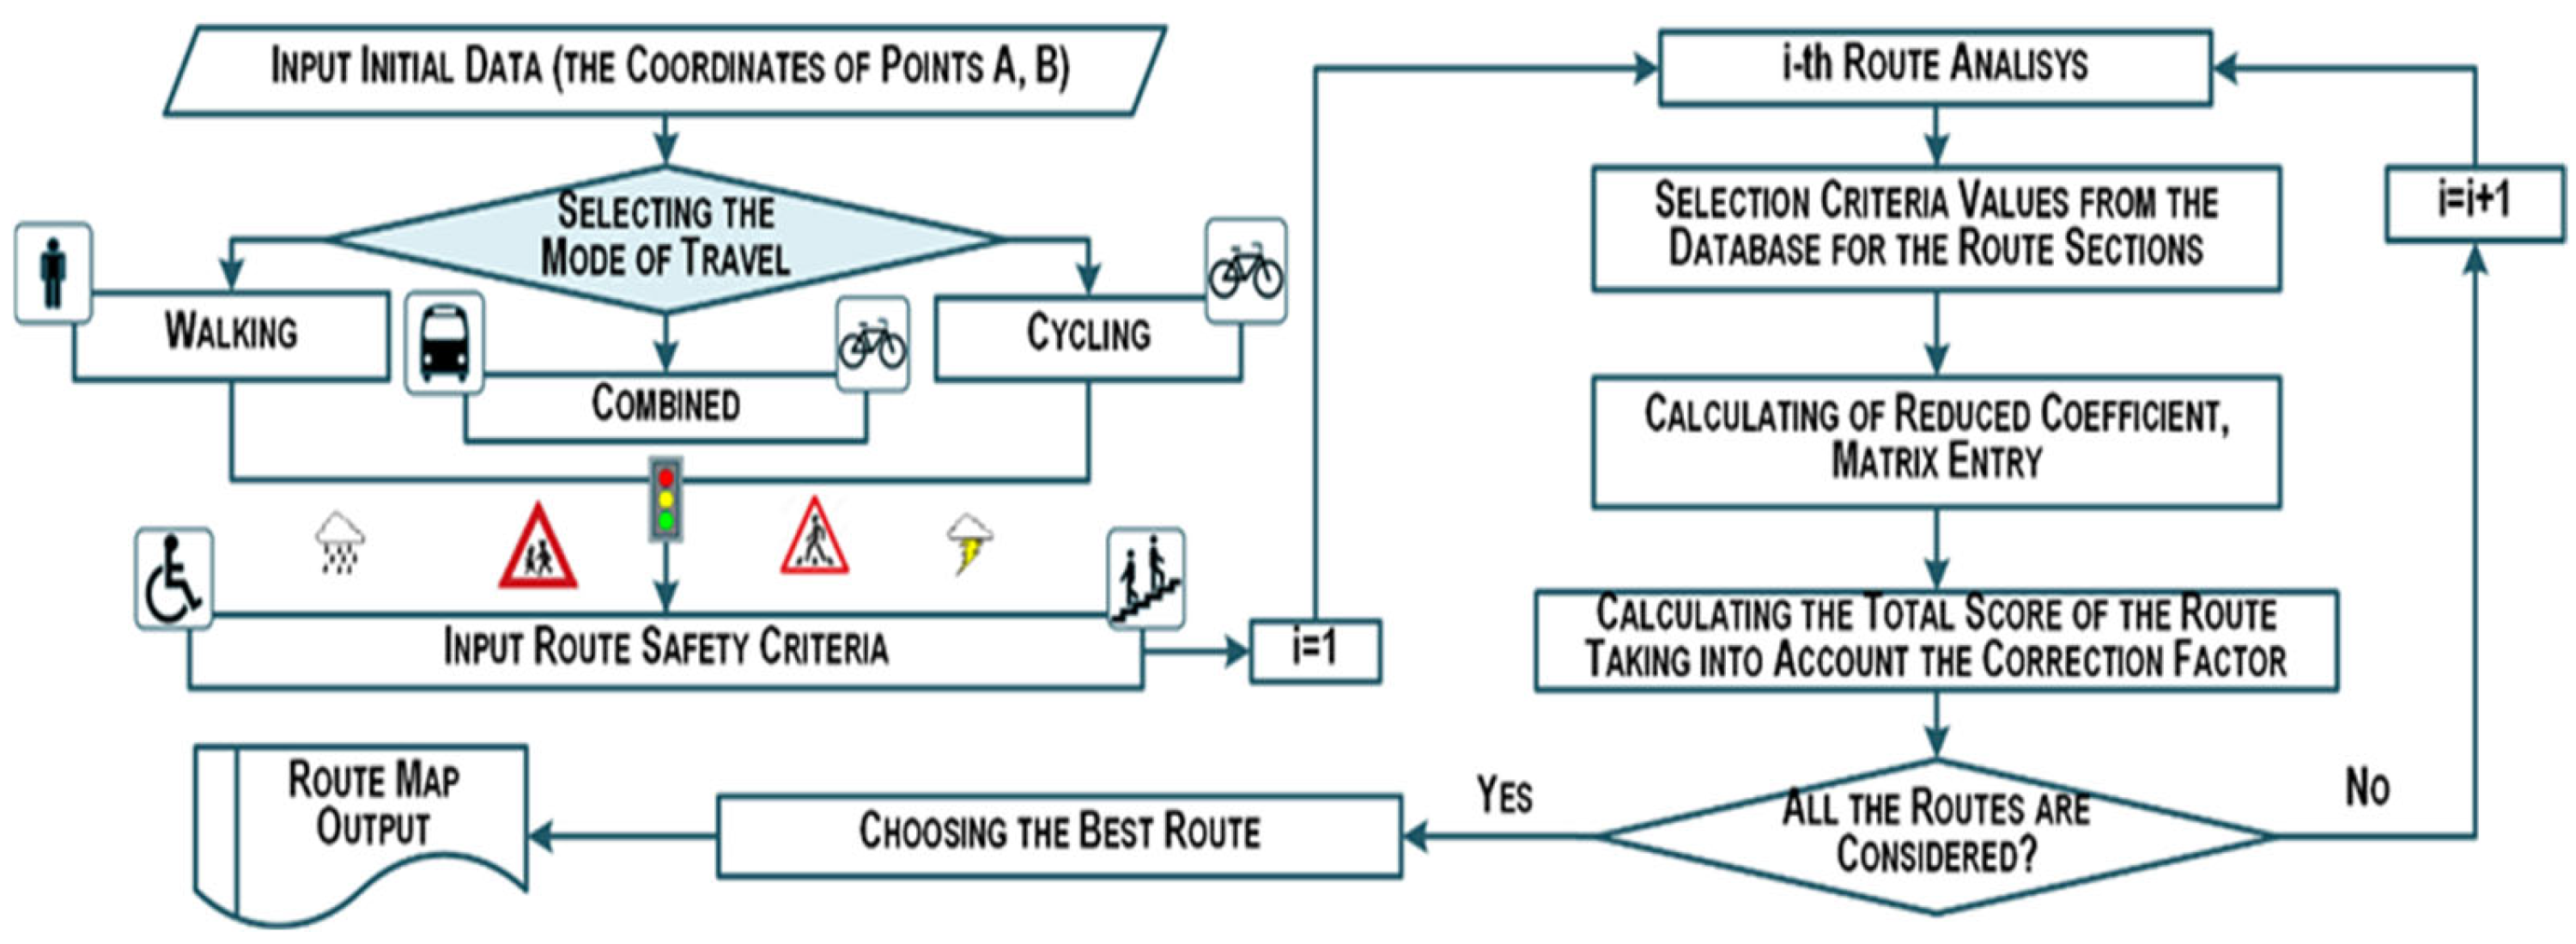
For a more detailed analysis, information on the characteristics of each section of the route is required, for which it is proposed to create a database with section characteristics (availability of terrain data: descents and ascents, presence of overground and underground pedestrian crossings, etc.). In addition, the algorithm shown in Figure 4 allows weather conditions to be taken into account. When conducting a multi-criteria analysis, the safest route for pedestrians and persons using personal mobility devices is selected.

4.3. Using Traffic Light with Pedestrian Button as a Way to Improve Pedestrian Safety

According to numerous studies, unregulated crossings are the most dangerous for pedestrians. Usually, unregulated pedestrian crossings are located where there is a non-stationary pedestrian flow and the intensity of pedestrian traffic is low. As a rule, such crossings are created in places with intensive traffic in order to prevent the formation of congestion and traffic jams. However, such solutions are not always safe for pedestrians, especially in multi-lane traffic, when the time to cross the road can be long. There are solutions in the form of safety islands, traffic calming devices, but they are not always effective. From a psychological point of view, a law-abiding driver does not commit offenses in conditions of certainty (for example, he clearly reacts to a red light). In the absence of a traffic light, a driver may simply not react to a pedestrian crossing sign due to the lack of a clear signal.
In order to determine the most dangerous intersections in terms of accidents, we examined official data from the State Traffic Safety Inspectorate to determine the locations of accident concentrations and the causes of accidents with pedestrians. The analysis showed that almost all cases of accidents with pedestrians are collisions with them, some of which are caused by pedestrians breaking the rules. However, unregulated crossings are places of increased danger.
Therefore, in places with heavy traffic and roads with more than two lanes in one direction, traffic lights with a button are installed. In order to study the efficiency of their work, simulation models are used. In this case, it is necessary to determine peak loads for both transport and pedestrians. This information is the initial data for modeling. To improve the efficiency of a traffic light with pedestrian button, its operation can be synchronized with the previous traffic light using fuzzy logic.
For the analysis, we selected unregulated pedestrian crossings located in close proximity to sports facilities, schools, and kindergartens. These locations were chosen on Chulman Avenue because this avenue is a concentration site of road accidents. At the same time, road accidents involving pedestrians (collisions) most often occur due to speeding, as well as failure to give priority to pedestrians, which was confirmed by video recording in these areas. The study was conducted on weekdays during peak hours using video cameras with subsequent computer processing of the images according to the following schedule: (1) 07:00–10:00; (2) 17:00–20:00. As a result of field observations, it was established that the braking distance when moving at the speed of the flow is about 40 m. The dividing strip with green spaces along the entire avenue limits visibility for drivers. This factor, along with the high speed of the flow and insufficient illumination of the area at night, makes the unregulated pedestrian crossing potentially dangerous for pedestrians crossing the avenue. The best solution to improve safety is to install a traffic light, which can reduce the risk of collisions with pedestrians.
In order to avoid creating congestion on the avenue, the best solution, in our opinion, was to install a traffic light with a button. In the case of a non-stationary pedestrian flow, such a solution will increase the driver’s concentration, but will not significantly affect the speed of the traffic flow in this section. At the same time, since in this case a significant part of the pedestrians are children, such a solution will reduce the influence of the behavioral factor on the safety of crossing the roadway. Thus, at the second stage, two models were built: “as is” and “as it will be when installing a traffic light”(Figure 5).
To ensure the adequacy of the first model, it was verified and validated by comparing it with the operation of the real system. To prove the acceptability of the proposed option, implemented in the second model, the most suitable parameters of traffic light regulation were determined by an enumeration method based on metaheuristics, allowing pedestrians to safely cross the avenue. The data obtained were summarized in a Table 4.
The next step in improving traffic organization was to study the possibility of synchronizing the traffic light installed at the intersection of avenues with the traffic light installed at the pedestrian crossing.
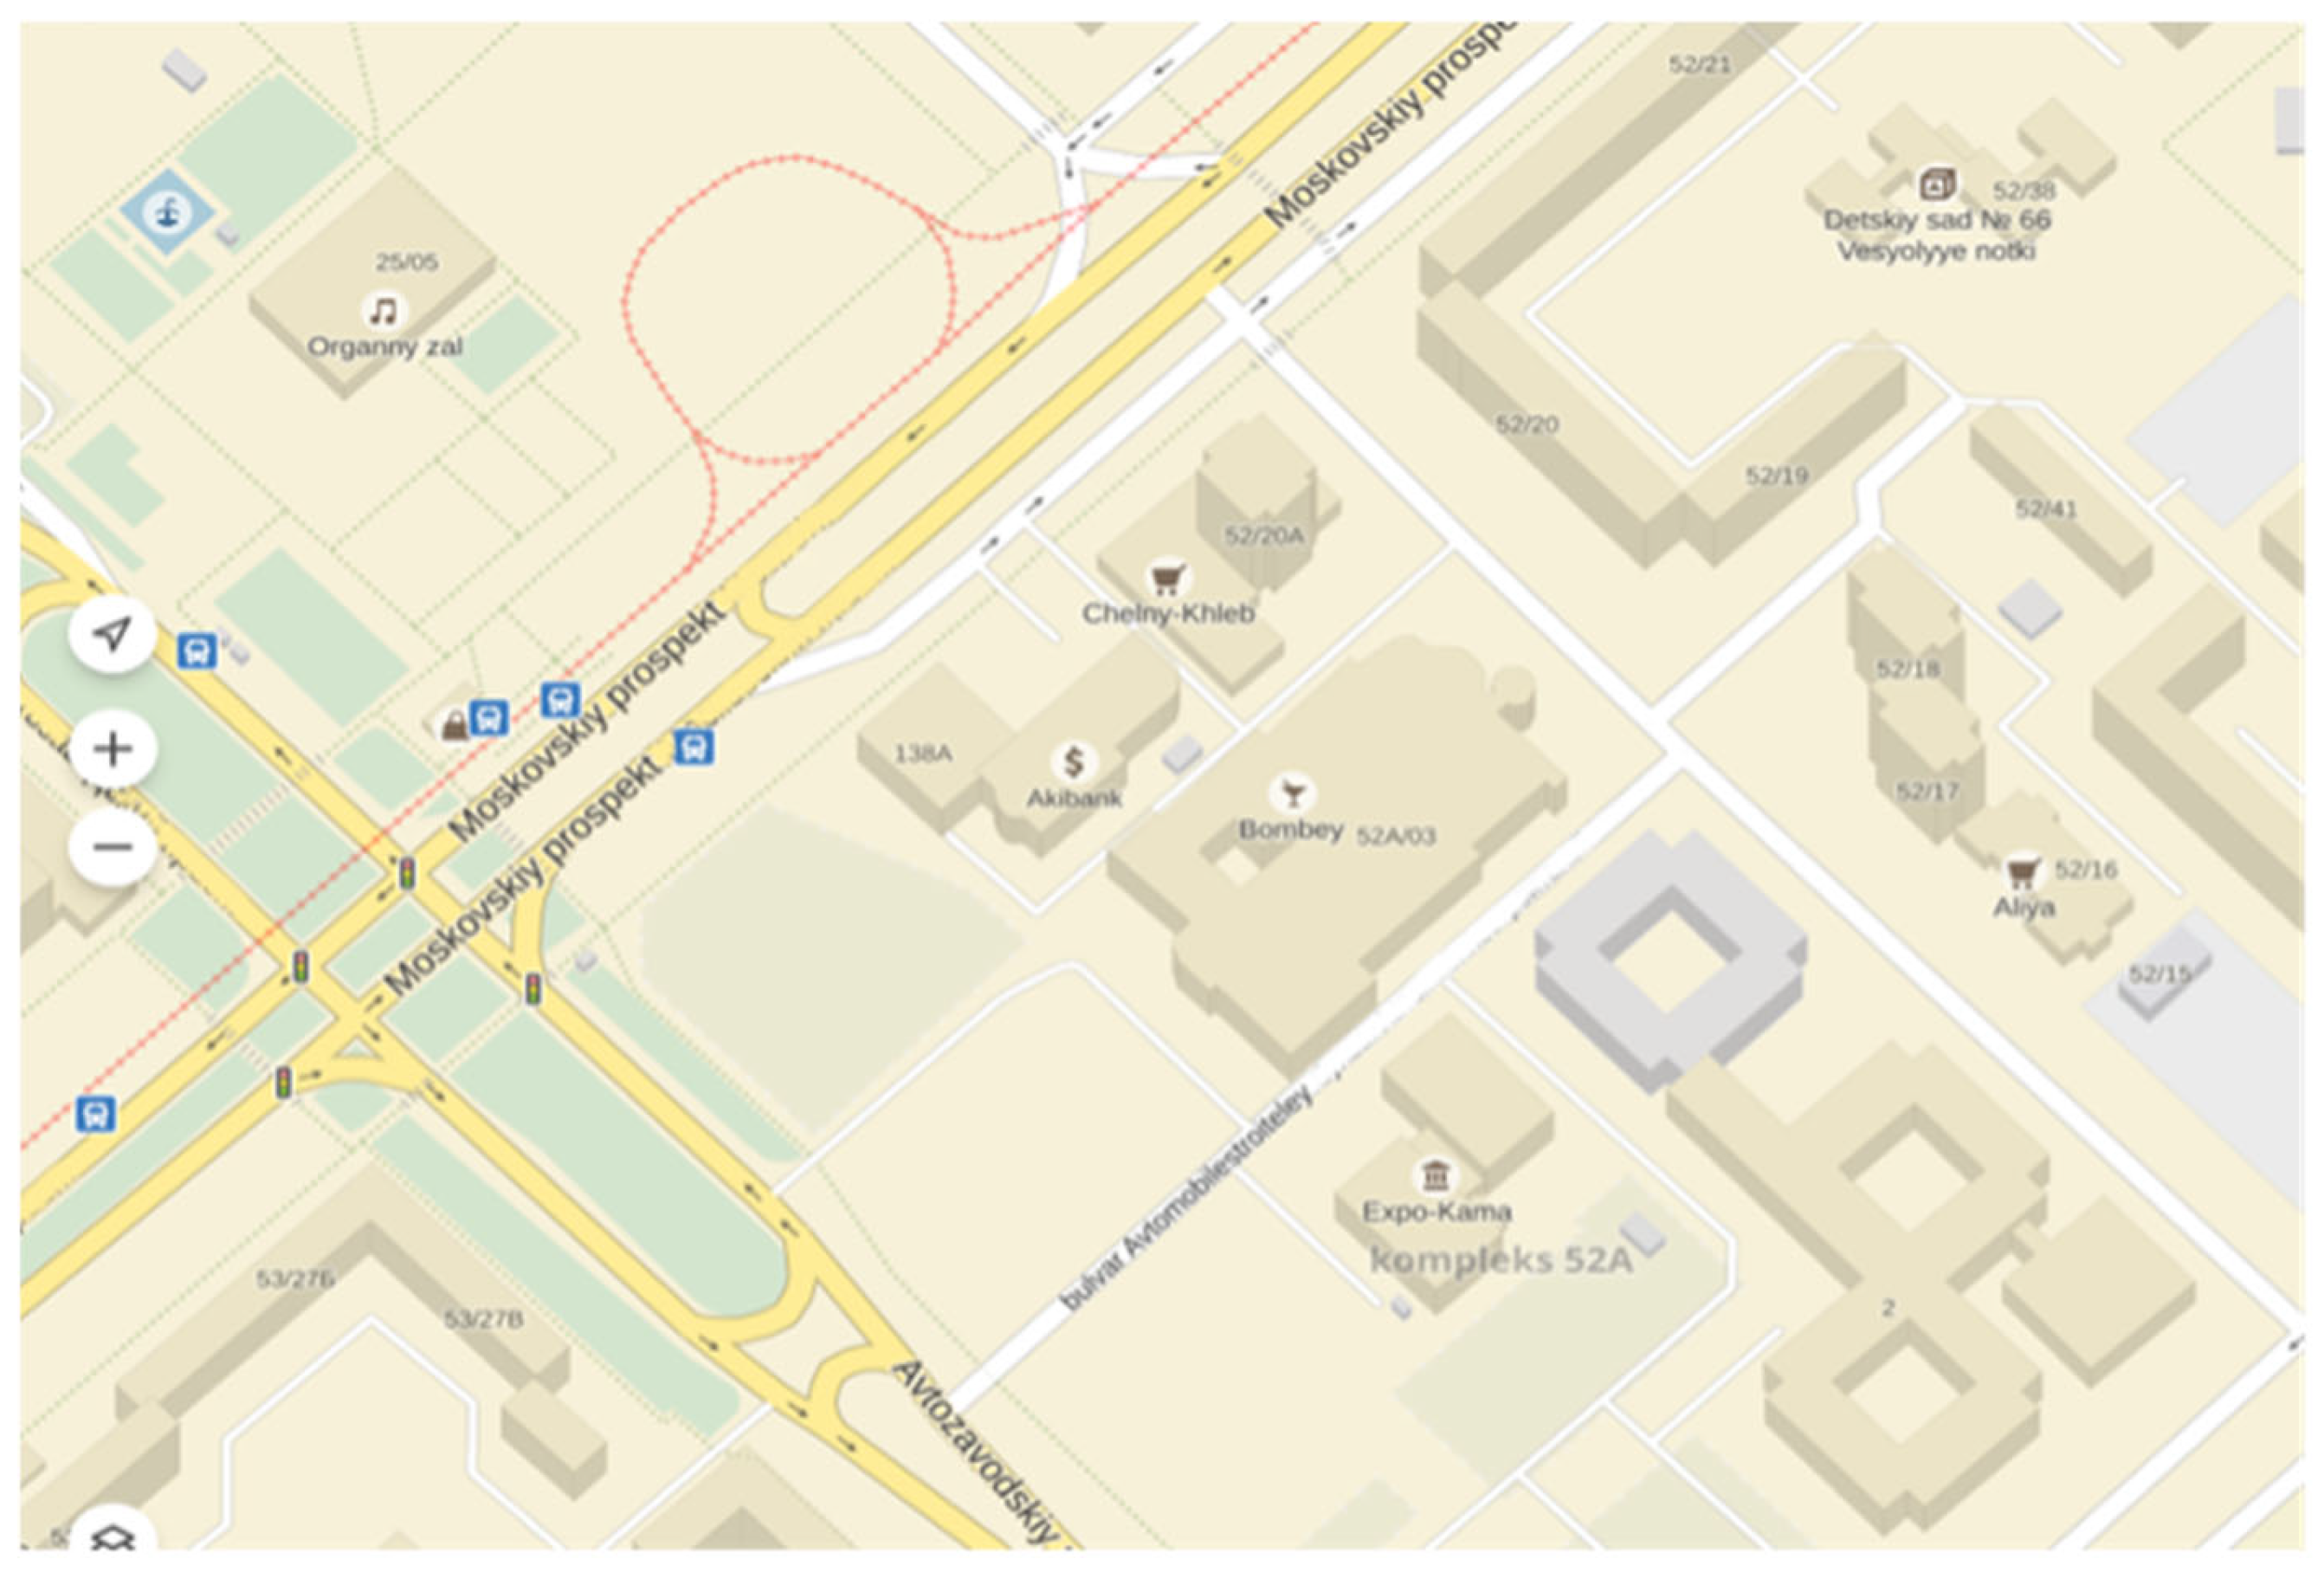
To improve the efficiency of a traffic light with pedestrian button, its operation can be synchronized with the previous traffic light using fuzzy logic. To test the efficiency of this management method, a section of Moskovsky Prospekt in Naberezhnye Chelny city was selected (Figure 6).
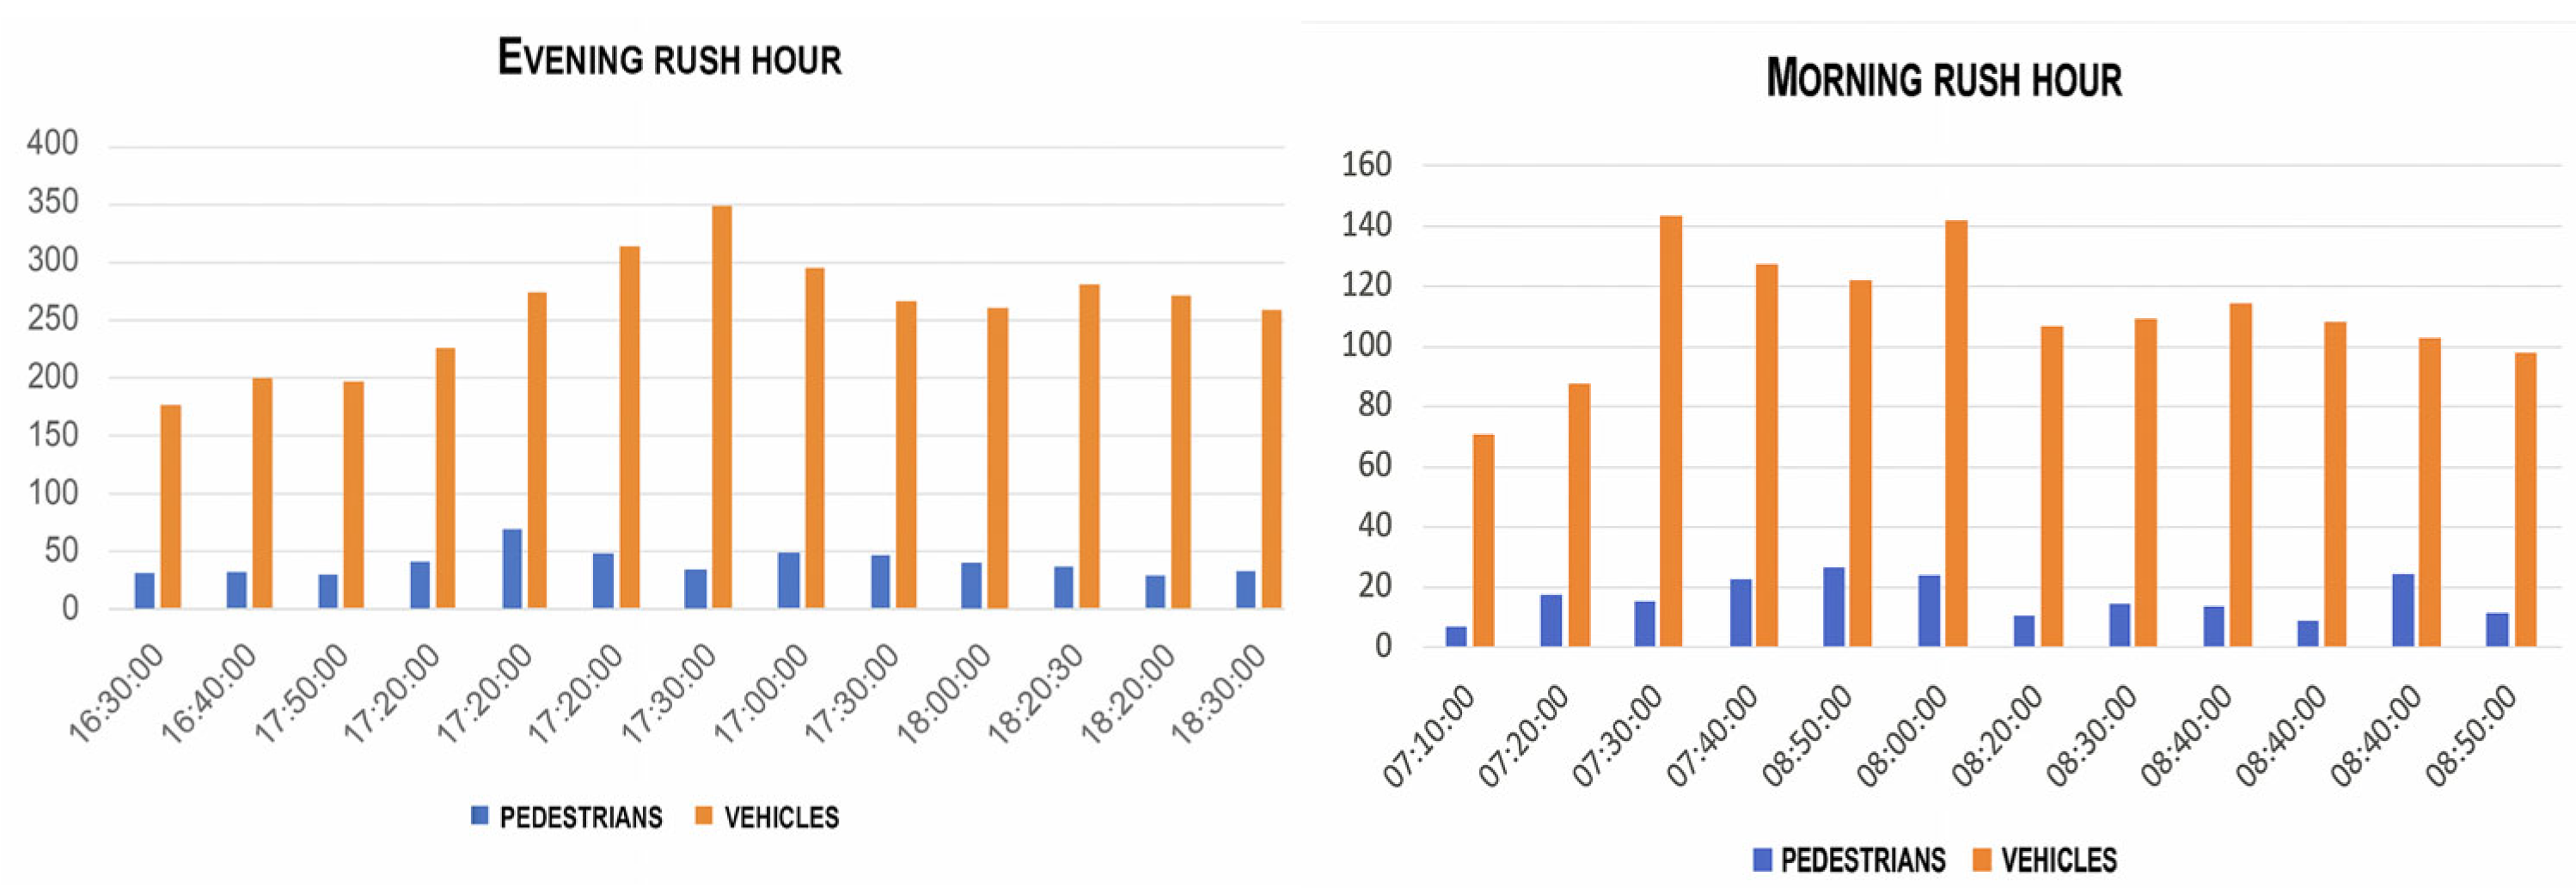
This is a three-lane avenue in each direction. The section under consideration has a regulated intersection with Avtozavodsky Prospekt, which has two-lane traffic in each direction. Since Avtozavodsky Prospekt connects the industrial and residential areas of the city, during rush hours the traffic intensity along Moskovsky Prospekt is often such that an unregulated pedestrian crossing contributes to the creation of traffic jams. This is the cause of frequent accidents, including accidents with pedestrians. To build an adequate simulation model, we selected an unregulated intersection and conducted a field survey to determine the parameters of traffic and pedestrian flows (Figure 7). This unregulated crossing is located near a regulated intersection, which during rush hours affects the density of the traffic flow depending on the duration of the traffic light phases and the traffic intensity along the intersecting avenues.
As can be seen from the graphs, peak values of transport and pedestrian flows occur in the morning and evening hours, and their time may not coincide. In addition, it can be seen that the intensity of evening peak flows is higher than that of morning ones.
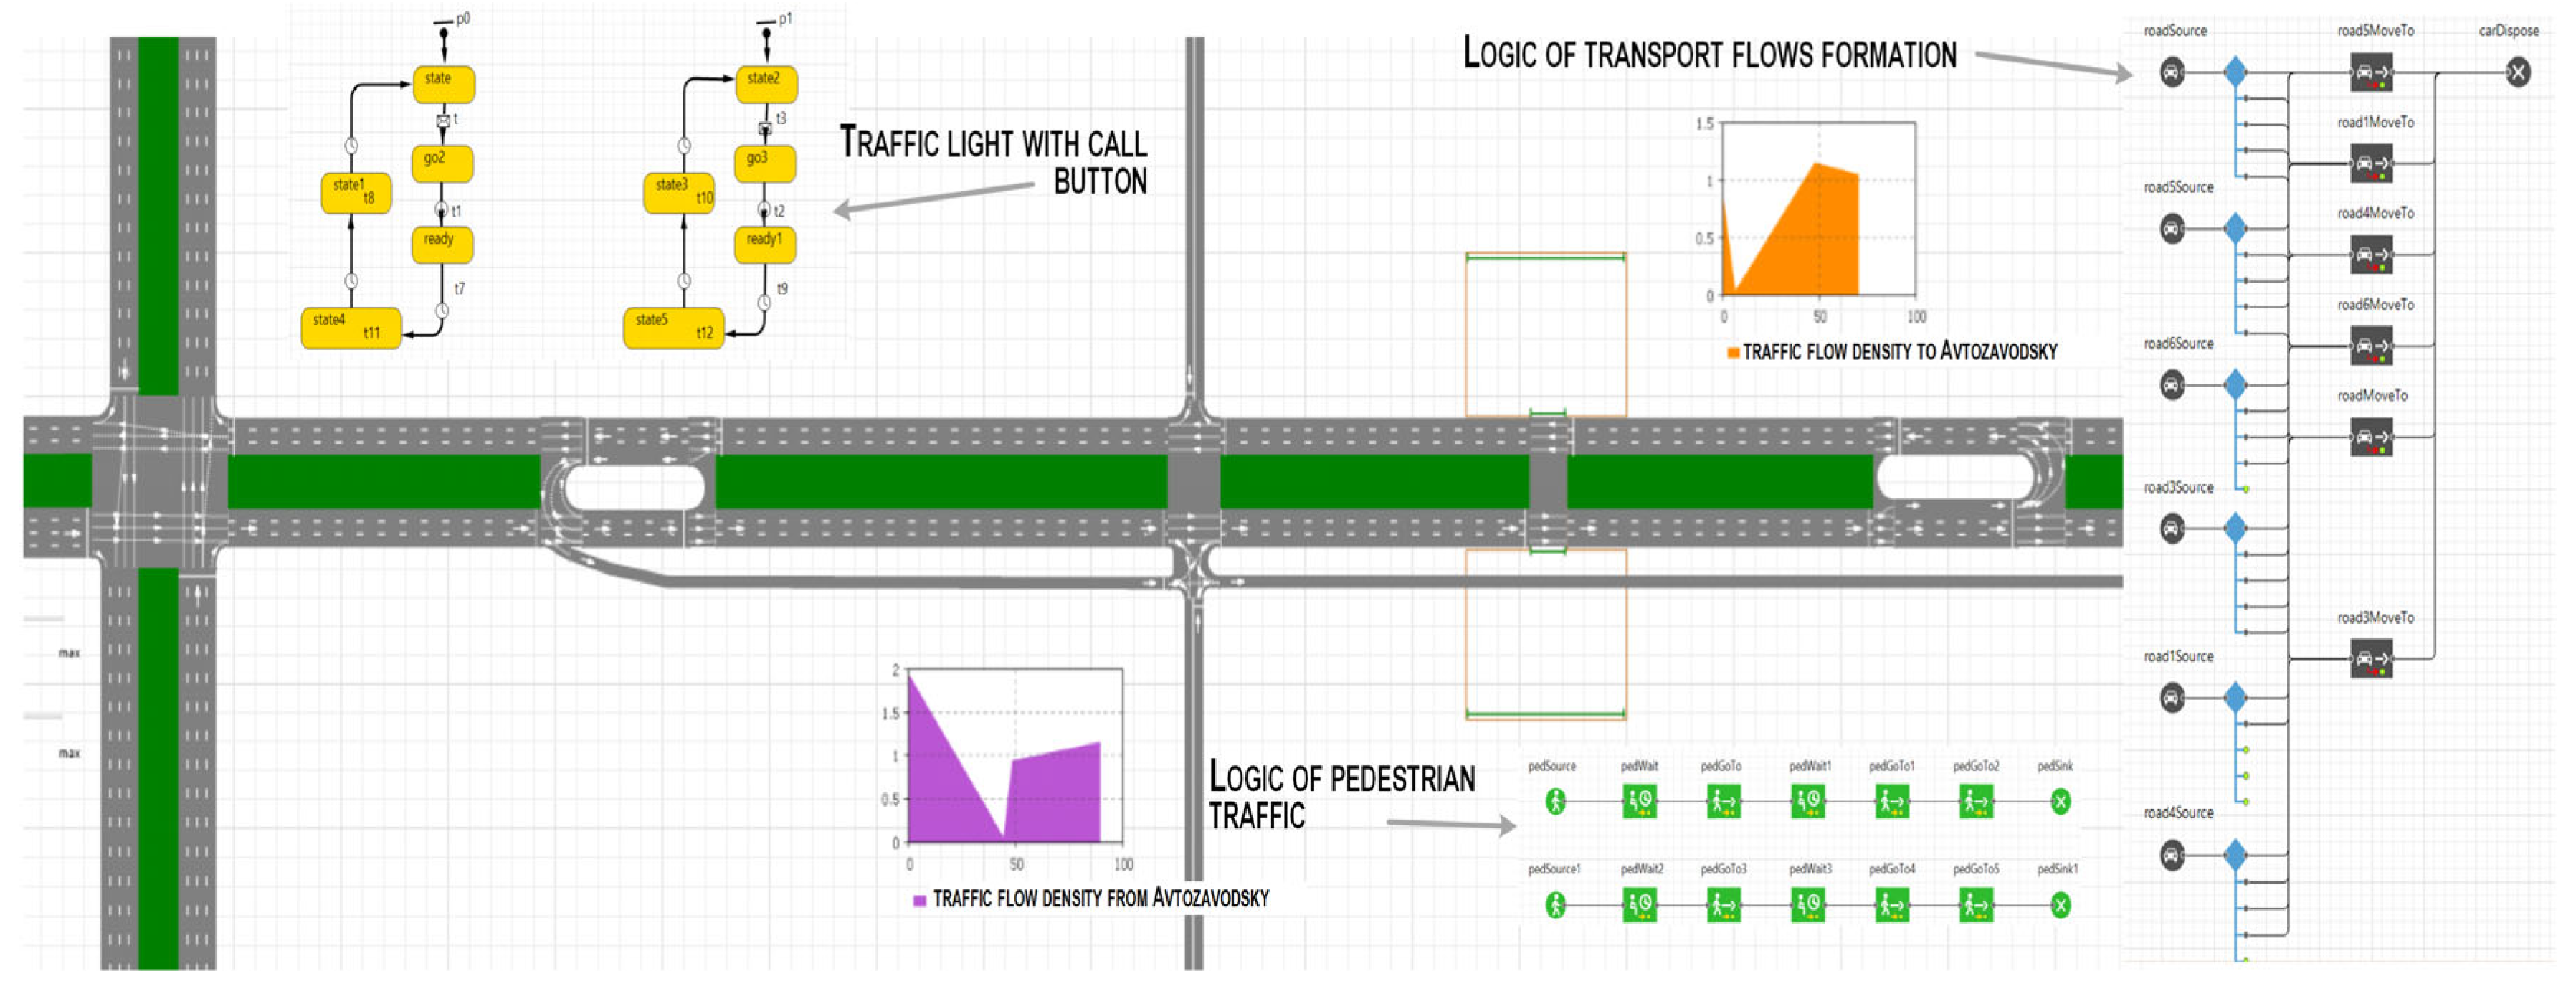
At the first stage, the research was conducted on a model built in accordance with the obtained parameters of the real system (the “as is” model). This allowed us to identify the causes of transport delays and prove the need to install traffic lights for pedestrians. The initial model was built in AnyLogic (Figure 8).
The input data of the traffic light object are shown in Table 5.
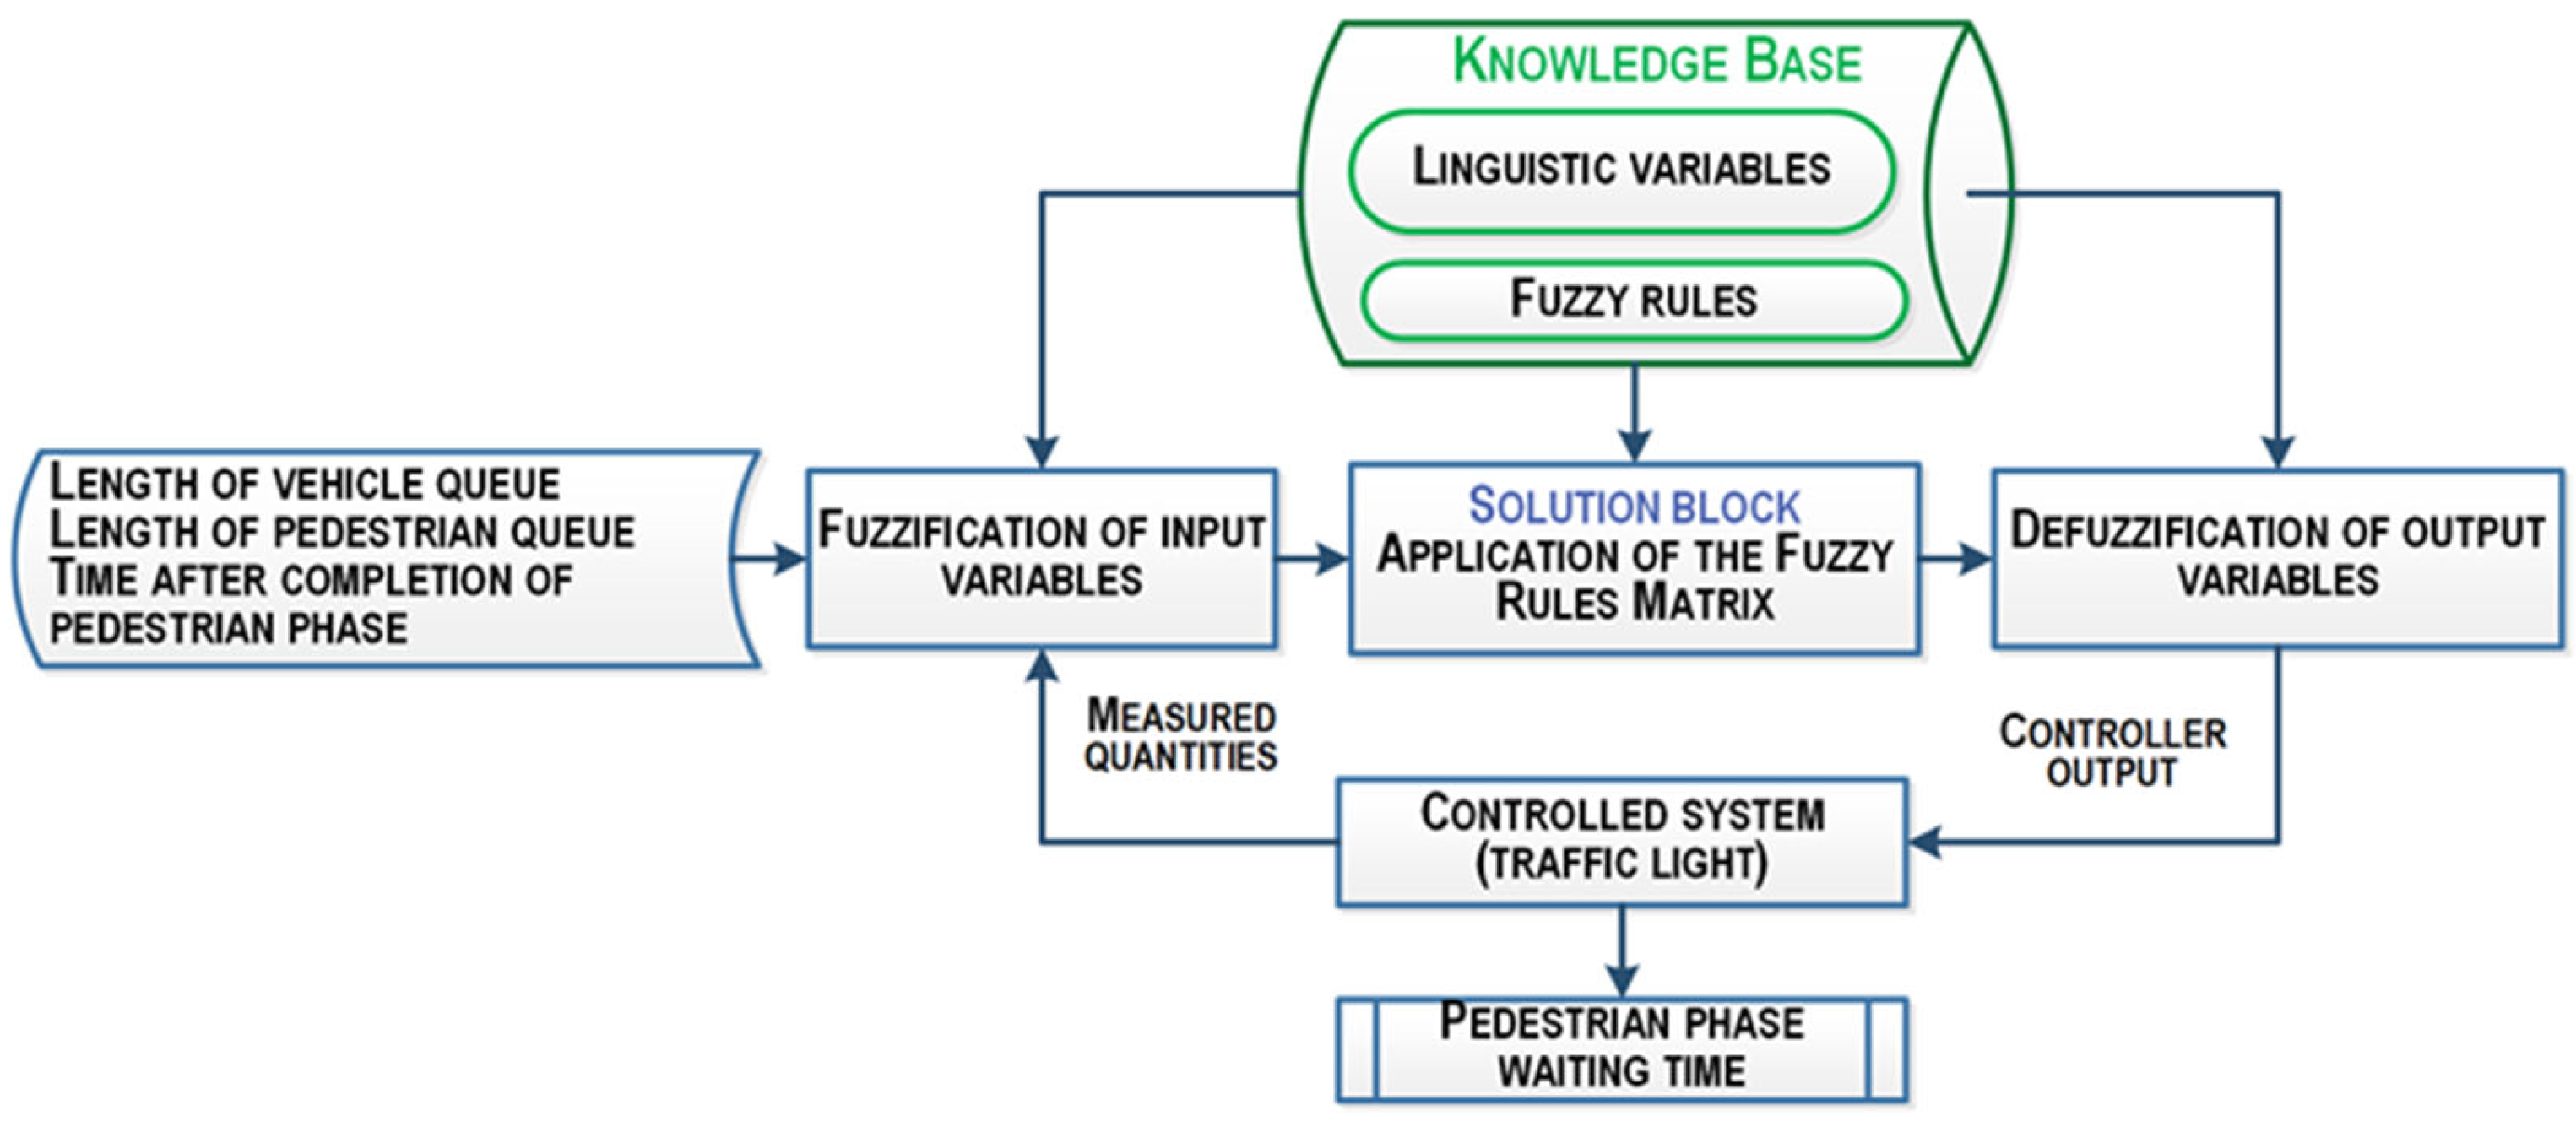
The time Tp elapsed since the last call of the pedestrian phase and the length Nq of the queue of cars accumulated in front of the pedestrian crossing during the previous pedestrian phase were used as input fuzzy variables. Since the distance from the nearest regulated intersection is significantly less than to the next one and, in addition, there are two U-turns and an exit from the adjoining road on the section, it is desirable to synchronize these two traffic lights using fuzzy logic to create more favorable conditions for the passage of cars during the red pedestrian phase. Since the time of the traffic light cycle at the regulated intersection is constant, a timer can be used in the model to determine which phase the moment of pressing the calling device will coincide with. The output fuzzy variable is the waiting time W for the called pedestrian phase. The term sets of the input variables were specified taking into account the experience of organizing traffic light regulation of similar crossings for this category of roads (Table 6).
When specifying the ranges of values of the term set of the output variable, it is advisable to limit ourselves to three terms. The values of the fuzzy output quantity W are determined depending on the combination of Nq and Tp. The values of the variables are located at the intersections of rows and columns. The fuzzy logic algorithm is shown in Figure 9.
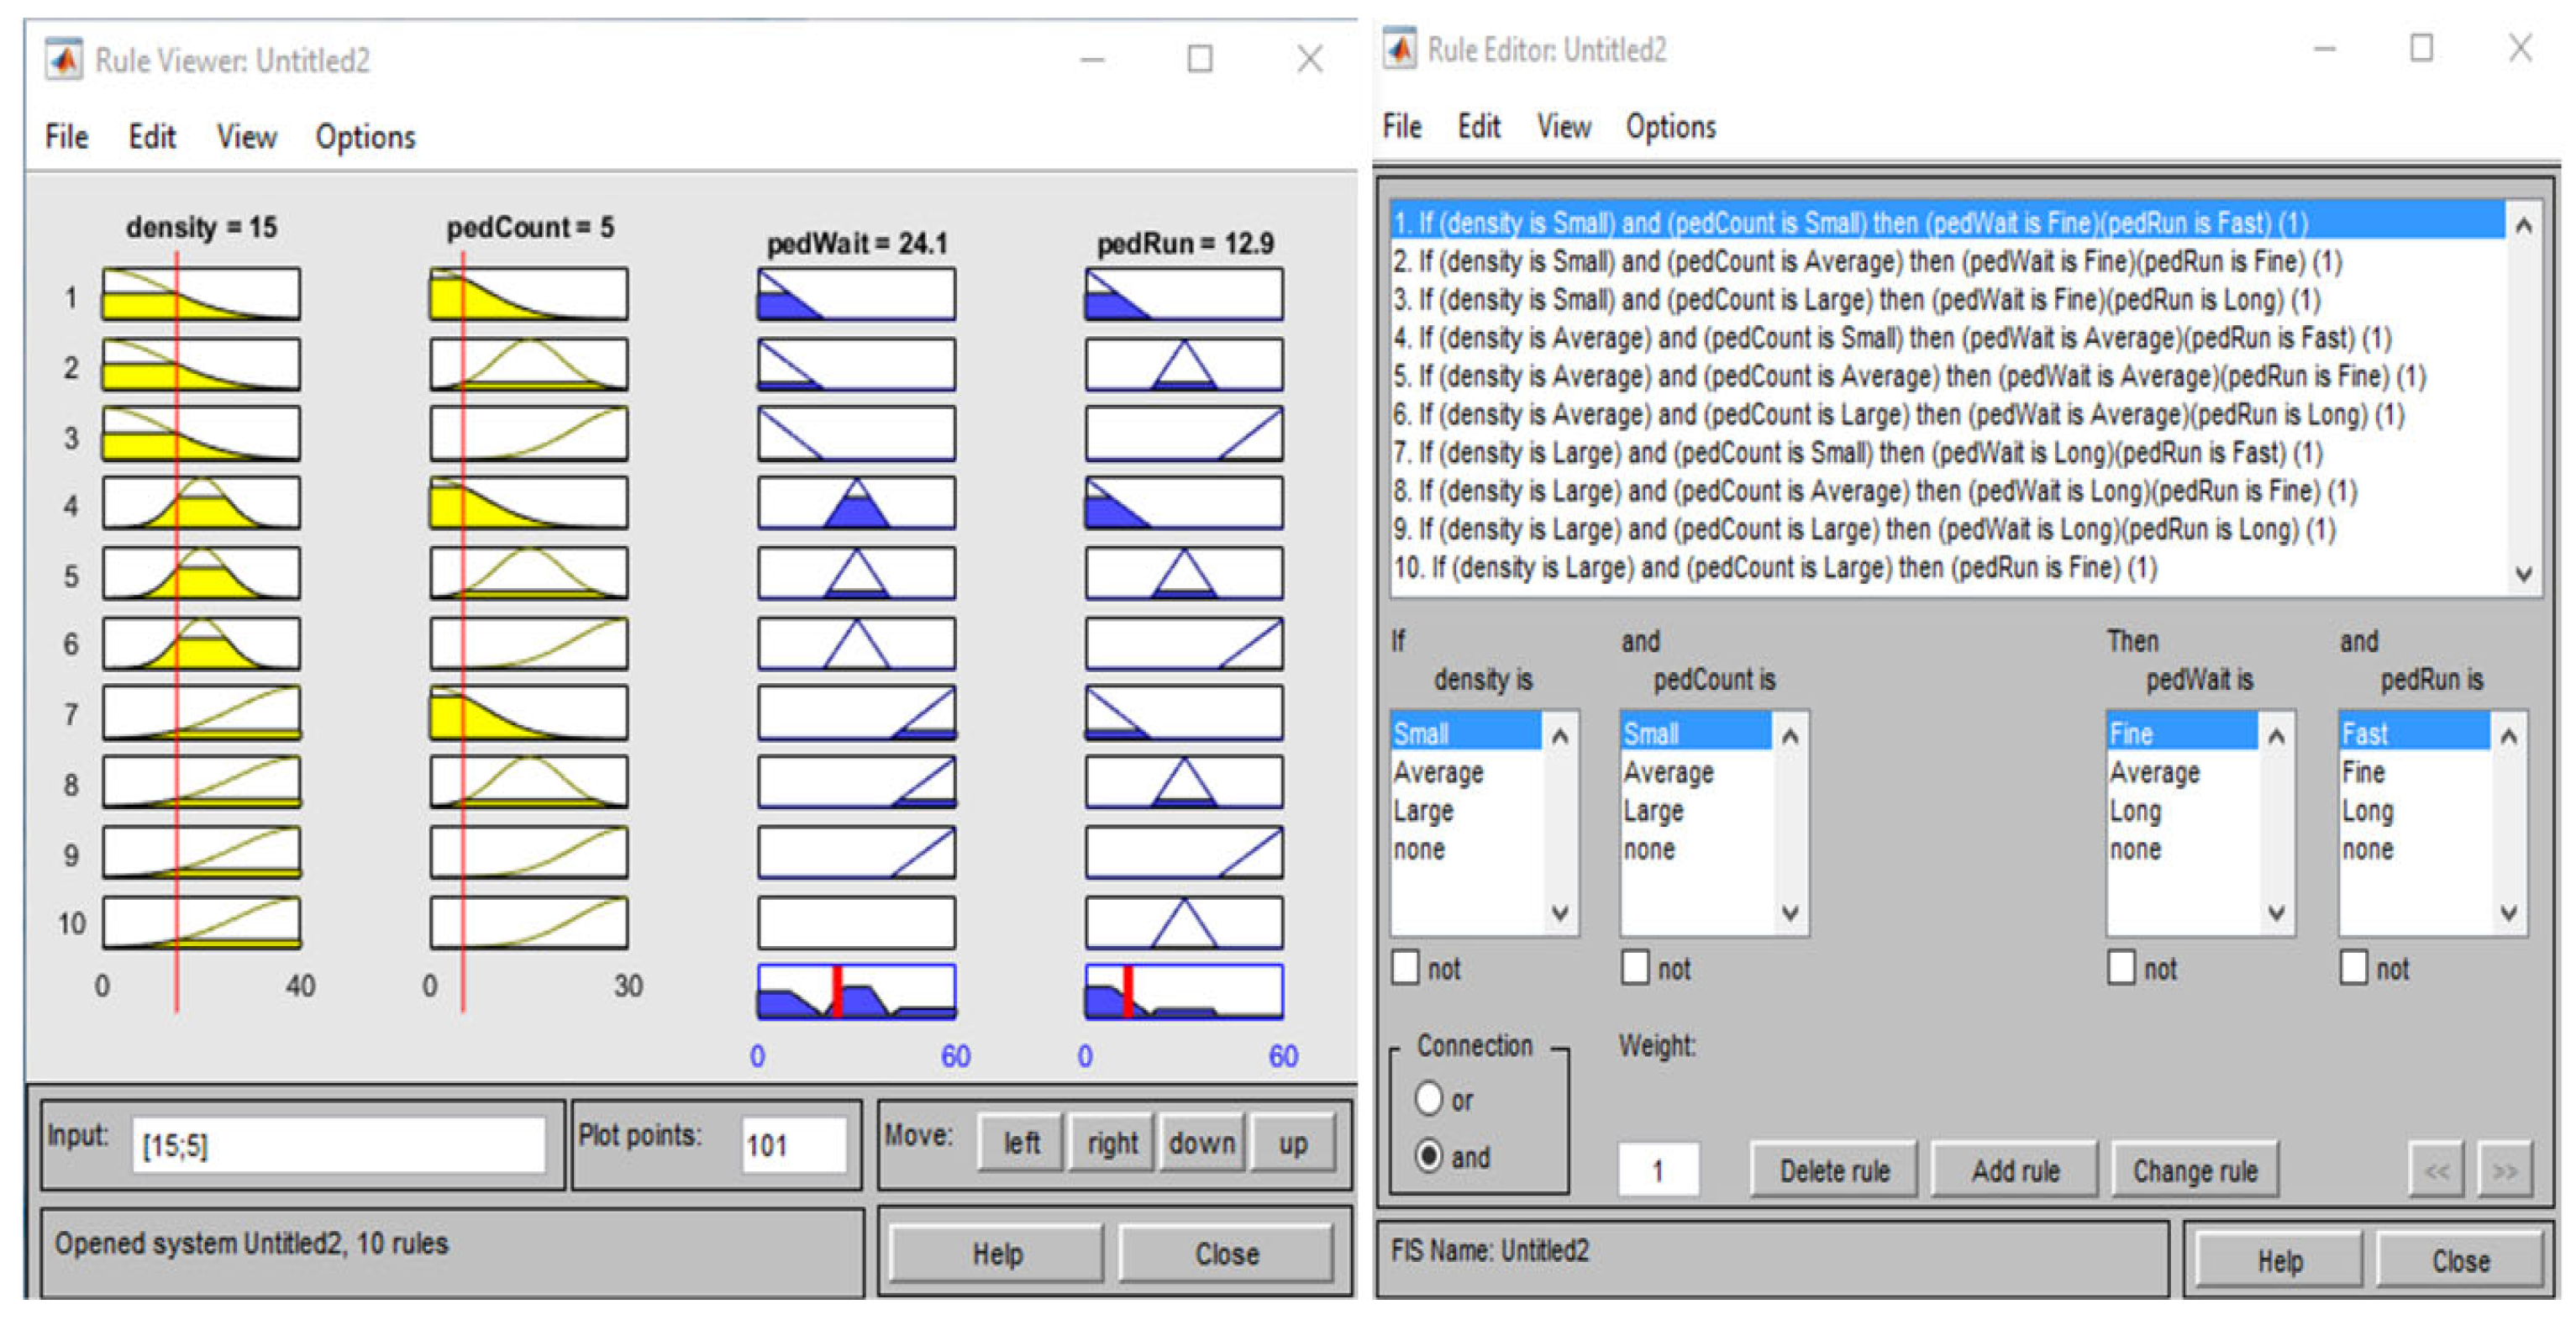
Depending on the membership of input variables in term sets, a list of fuzzy rules was defined for determining output variables.
The implementation of the fuzzy logic algorithm is shown in Figure 10.
The algorithm for setting up a pedestrian traffic light with a button by synchronizing with the traffic light of the previous intersection is shown in Figure 11.
As the experiments on the model have shown, the density of the traffic flow even at an intensity of over 2000 units varies in the range of 15–19 vehicles, which will be 40% of the maximum density. This result can be achieved by modifying the operation of traffic lights.
The results of the modeling indicate the effectiveness of the fuzzy approach to controlling the traffic light with a button. This method of traffic control reduces the average queue length and the possibility of a congestion situation, and when it occurs, it stops it in a finite number of operating cycles.
More effective results can be achieved by using image recognition technology to determine the situation near a traffic light with a button. When creating an algorithm for controlling the switching of signals, one can use the pedestrian classifier presented above to determine the qualitative composition of pedestrian groups intending to cross the road. If such a system is made self-learning, it can more accurately determine the time required to cross the road in different situations, including not only the composition of the pedestrian group, but also external conditions.

5. Conclusions

5.1. Conclusions of the Study

As the practice of traffic management shows, despite the efforts of scientists and officials, pedestrians and cyclists still remain the most vulnerable road users. Due to the fact that vehicles and transport infrastructure are becoming increasingly intelligent, it is necessary to work towards eliminating the human factor, as it creates unjustified risks on city roads.
An analysis of scientific papers has shown that existing research is being conducted in different directions, ranging from measures designed to protect pedestrians by developing passive safety devices to the creation of systems that can monitor pedestrians and warn drivers about dangerous behavior and the risk of accidents.
If we consider the city from the point of view of the implementation of the Sustainable Development Goals (SDGs), then in the context of urban mobility we can consider the implementation of SDG 11 as the achievement of the strategic goal of creating sustainable cities and communities with developed infrastructure and convenient mobility for all residents.
Simultaneously, indicator systems are being developed that enable the assessment of risks and consequences associated with implementing various types of projects at the design stage, while accounting for impacts across different domains: social, environmental, economic, and organizational. Such systems and concepts can be implemented, as advancements in IT and AI facilitate multifactor analysis based on big data.
For example, ESG (environmental, social, and governance) criteria are a set of non-financial indicators developed to assess how cities achieve these goals by focusing on the environmental, social, and governance aspects of their development, including mobility. This means that, in addressing the challenges of increasing urban resilience, this is a practical tool for implementing the global SDGs at the city level. This also means using non-financial metrics to assess progress in urban resilience.
It is evident that the implementation of such concepts enables a transition to human-centered systems and allows for the evaluation at the design stage of not only direct effects but also indirect positive impacts on related fields. For instance, by addressing a social issue in the educational domain aimed at enhancing the culture of behavior on urban roads, mutual respect, and compliance with traffic safety regulations, we reduce the probability of traffic accidents, the number of fatalities, and injuries. Ultimately, this alleviates the burden on the healthcare and social welfare systems, and the economy retains workers, which constitutes a positive factor.
The article proposes to create a complex system that would include, as an intellectual core, individual modules that implement both successfully used and developed means based on new methods and models aimed at improving pedestrian safety. Some of these ideas are given as practical examples.
The use of simulation models together with technical solutions in traffic management (such as recognition systems, “smart infrastructure,” assistance systems, etc.) will enhance pedestrian resilience and safety.
To substantiate the applicability of the proposed solutions, we analyzed case studies from Russian regions spanning different climatic zones. This approach allowed us to account for the influence of regional factors on road safety. In northern territories, aggravating factors include snowdrifts, black ice, and blizzards. These conditions not only impede pedestrian movement but also reduce drivers’ visibility. In southern regions, risks such as heatstroke, sunstroke, and consequent loss of consciousness for both pedestrians and drivers must be considered. These factors represent elevated risks, meaning a higher probability of traffic accidents. For countries located in similar climatic zones, the impact of these natural and climatic factors is expected to be comparable.
As experience shows, only the implementation of comprehensive solutions allows us to solve strategic problems, including improving road safety.

5.2. Limitations of the Study and Future Directions

Our research has a number of limitations conditioned by the study’s objectives. We confined ourselves to developing a conceptual approach for creating a decision support system (DSS) and implementing select ideas. We plan to further develop this direction and will present the results of these developments in future publications.
Since SDG 11.2 aims to ensure universal access to safe, affordable and sustainable transport systems, including pedestrian safety, we intend to address in future research related road safety targets for vulnerable groups such as women, children, people with disabilities and older people.
The main constraint on applying the proposed methods and algorithms lies in the unique urban planning and street network layout of each city, which are often the most significant factors. Literature review shows that such local specifics must be accounted for in simulation studies.
Our future research will include developing methodologies for incorporating pedestrian safety indicators such as road injury reduction; accessibility and safety of pedestrian infrastructure (including pedestrian areas, crossings, and sidewalks); access to public spaces; and improving public transport safety. Furthermore, in this context, we plan to develop risk ontologies to create a risk management system for achieving sustainable urban transport development goals.

Author Contributions

Conceptualization, I.M.; methodology, I.M.; formal analysis, I.M., L.G. (Larisa Gubacheva), L.G. (Larisa Gabsalikhova), V.M. and A.B.; resources, I.M.; writing—original draft preparation, I.M., L.G. (Larisa Gubacheva), L.G. (Larisa Gabsalikhova), V.M. and A.B.; writing—review and editing, I.M.; visualization, I.M., L.G. (Larisa Gubacheva) and L.G. (Larisa Gabsalikhova). All authors have read and agreed to the published version of the manuscript.

Funding

This research received no external funding.

Institutional Review Board Statement

Not applicable.

Informed Consent Statement

Not applicable.

Data Availability Statement

The data presented in this study are available on request from the corresponding author.

Conflicts of Interest

The authors declare no conflicts of interest.

References

  1. Avsec, S.; Jagiełło-Kowalczyk, M.; Żabicka, A.; Gil-Mastalerczyk, J.; Gawlak, A. Human-Centered Systems Thinking in Technology-Enhanced Sustainable and Inclusive Architectural Design. Sustainability 2024, 16, 9802. [Google Scholar] [CrossRef]
  2. Lee, S.H. Transformation by Human—Centered System Design. Des. Manag. Rev. 2024, 35, 88–93. [Google Scholar] [CrossRef]
  3. European Commission. European Road Safety Observatory: Road Safety Thematic Report—Personal Mobility Devices. Brussels, European Commission, Directorate General for Transport. 2021, pp. 1–22. Available online: https://road-safety.transport.ec.europa.eu/document/download/6f698f20-f43f-4066-816a-d1db217b3bc4_en?filename=road_safety_thematic_report_personal_mobility_devices_tc_final.pd (accessed on 15 September 2025).
  4. Emerging Modes of Personal Transportation. Available online: https://www2.gov.bc.ca/gov/content/transportation/driving-and-cycling/cycling/personal-mobility-devices (accessed on 31 July 2025).
  5. Rules for Personal Mobility Devices. Available online: https://www.qld.gov.au/transport/safety/rules/wheeled-devices/personal-mobility-devices (accessed on 17 September 2025).
  6. Shared Micromobility in the U.S. and Canada: 2023. Available online: https://nacto.org/wp-content/uploads/Shared-micro-in-2023-snapshot_FINAL_July22-2024.pdf (accessed on 15 September 2025).
  7. Sun, S.; Ertz, M. Can shared micromobility programs reduce greenhouse gas emissions: Evidence from urban transportation big data. Sustain. Cities Soc. 2022, 85, 104045. [Google Scholar] [CrossRef]
  8. Resolution Adopted by the General Assembly on 31 August 2020. Available online: https://docs.un.org/en/A/RES/74/299 (accessed on 17 September 2025).
  9. Global Road Safety. Available online: https://www.roadsafety.gov.au/global (accessed on 17 September 2025).
  10. National Project “Infrastructure for Life”. Available online: https://minstroyrf.gov.ru/trades/natsionalnye-proekty/natsionalnyy-proekt-infrastruktura-dlya-zhizni/ (accessed on 17 September 2025).
  11. Deluka-Tibljaš, A.; Šurdonja, S.; Ištoka Otković, I.; Campisi, T. Child-Pedestrian Traffic Safety at Crosswalks—Literature Review. Sustainability 2022, 14, 1142. [Google Scholar] [CrossRef]
  12. Gogola, M.; Ondruš, J. Road Safety Perspective of Small Children. In Proceedings of the 2020 XII International Science-Technical Conference AUTOMOTIVE SAFETY, Kielce, Poland, 21–23 October 2020; pp. 1–5. [Google Scholar] [CrossRef]
  13. Ištoka Otković, I.; Deluka-Tibljaš, A.; Zečević, Đ.; Šimunović, M. Reconstructing Intersection Conflict Zones: Microsimulation-Based Analysis of Traffic Safety for Pedestrians. Infrastructures 2024, 9, 215. [Google Scholar] [CrossRef]
  14. Otković, I.I.; Deluka-Tibljaš, A.; Šurdonja, S.; Campisi, T. Analysis of influencing parameters on children’s crossing speeds at non-signalized crosswalks using neural network models. Transp. Res. Procedia 2025, 90, 543–550. [Google Scholar] [CrossRef]
  15. Yang, J.; Gauli, N.; Shiwakoti, N.; Tay, R.; Deng, H.; Chen, J.; Nepal, B.; Li, J. Examining the Factors Influencing Pedestrian Behaviour and Safety: A Review with a Focus on Culturally and Linguistically Diverse Communities. Sustainability 2025, 17, 6007. [Google Scholar] [CrossRef]
  16. Habibzadeh, M.; Mirabimoghaddam, M.H.; Haghighi, S.M.S.; Ameri, M. Presentation of artificial neural network models based on optimum theories for predicting accident severity on rural roads in Iran. Transp. Res. Interdiscip. Perspect. 2024, 25, 101090. [Google Scholar] [CrossRef]
  17. Ostadtaghizadeh, A.; Kouchakinejad-Eramsadati, L.; Asgary, A.; Homaie Rad, E.; Hirshon, J.M. Factors Influencing Pedestrian Traffic Collision in Iran: A Qualitative Content Analysis. Bull. Emerg. Trauma 2025, 13, 2–13. [Google Scholar] [CrossRef]
  18. Kim, S.; Choi, S.; Kim, B.H.S. Analysis of factors affecting pedestrian safety for the elderly and identification of vulnerable areas in Seoul. Accid. Anal. Prev. 2025, 211, 107878. [Google Scholar] [CrossRef]
  19. Lee, S.; Han, M.; Rhee, K.; Bae, B. Identification of Factors Affecting Pedestrian Satisfaction toward Land Use and Street Type. Sustainability 2021, 13, 10725. [Google Scholar] [CrossRef]
  20. Marić, B.; Lipovac, K.; Nešić, M.; Đerić, M. The Influence of a Countdown Display on Pedestrian Behavior at a Signalized Pedestrian Crossing Equipped with a Pedestrian Refuge Island. Transp. Res. Procedia 2021, 55, 1720–1728. [Google Scholar] [CrossRef]
  21. Kopsacheilis, A.; Politis, I. Exploring factors influencing pedestrian accident severity: A multi-source study in the city of Berlin. Eur. Transp. Res. Rev. 2024, 16, 63. [Google Scholar] [CrossRef]
  22. Swami, M.; Pathak, C.; Swami, S.; Jeihani, M. Promoting Sustainable Mobility: A Walkability Analysis for School Zone Safety. Sustainability 2024, 16, 9118. [Google Scholar] [CrossRef]
  23. Mukherjee, D.; Abhinay, K. Identification of Factors Influencing Pedestrian Perceived Safety and Satisfaction Level Using Ordered Logit Models in an Indian Midsized City. Int. J. Transp. Dev. Integr. 2024, 8, 283–299. [Google Scholar] [CrossRef]
  24. Mukherjee, D. Assessing pedestrian safety at urban signalized intersections across various land use types: Insights from a mid-sized Indian city. Discov. Appl. Sci. 2025, 7, 384. [Google Scholar] [CrossRef]
  25. Prakash, S.; Karuppanagounder, K. Parametric Study on the Influence of Pedestrians’ Road Crossing Pattern on Safety. Open Transp. J. 2023, 17, e187444782303140. [Google Scholar] [CrossRef]
  26. Hari, K.C.; Thusitha, S. Assessment of Pedestrian Safety at Crosswalks of Unsignalized Intersection: A Case Study of Machhapokhari Intersection, Kathmandu. J. Transp. Syst. Eng. 2025, 1, 25–36. [Google Scholar] [CrossRef]
  27. Ristić, B.; Bogdanović, V.; Stević, Z. Urban Evaluation of Pedestrian Crossings Based on Start-Up Time Using the MEREC-MARCOS Model. J. Urban Dev. Manag. 2024, 3, 34–42. [Google Scholar] [CrossRef]
  28. Santilli, D.; D’Apuzzo, M.; Evangelisti, A.; Nicolosi, V. Towards Sustainability: New Tools for Planning Urban Pedestrian Mobility. Sustainability 2021, 13, 9371. [Google Scholar] [CrossRef]
  29. Jurak, J.; Ćosić, M.; Tišljar, A.; Nemet, I. Promoting safer and more sustainable urban mobility: Exploring reduced speed limits for improved road safety in urban environments. Transp. Res. Procedia 2025, 83, 465–471. [Google Scholar] [CrossRef]
  30. Ziółkowski, R.; Pérez-Acebo, H.; Gonzalo-Orden, H.; Linares-Unamunzaga, A. Changes in Safety Performance on Single-Carriageway Roads After Installation of Additional Lighting at Pedestrian Crossing. Land 2024, 13, 2134. [Google Scholar] [CrossRef]
  31. Kruszyna, M.; Matczuk-Pisarek, M. The Effectiveness of Selected Devices to Reduce the Speed of Vehicles on Pedestrian Crossings. Sustainability 2021, 13, 9678. [Google Scholar] [CrossRef]
  32. Cieśla, M. Modern Urban Transport Infrastructure Solutions to Improve the Safety of Children as Pedestrians and Cyclists. Infrastructures 2021, 6, 102. [Google Scholar] [CrossRef]
  33. Charef, A.; Jarir, Z.; Quafafou, M. Optimizing Traffic Flow and Pedestrian Safety: The Role of Crosswalk Distance in Roundabout Design. In Proceedings of the 2024 International Conference on Global Aeronautical Engineering and Satellite Technology (GAST), Marrakesh, Morocco, 24–26 April 2024; pp. 1–6. [Google Scholar] [CrossRef]
  34. Zhang, Y.; Zhang, X.; Fujinami, Y.; Raksincharoensak, P. Social Force Model-Based Adaptive Parameters Collision Avoidance Method Considering Motion Uncertainty of the Pedestrian. IEEE Access 2024, 12, 794–809. [Google Scholar] [CrossRef]
  35. Zhang, C.; Sprenger, J.; Ni, Z.; Berger, C. Predicting and Analyzing Pedestrian Crossing Behavior at Unsignalized Crossings. In Proceedings of the 2024 IEEE Intelligent Vehicles Symposium (IV), Jeju Island, Republic of Korea, 2–5 June 2024; pp. 674–681. [Google Scholar] [CrossRef]
  36. Mátyás, E.; Szabó, L. Intelligent Illumination of Crosswalks for Increasing Pedestrian Safety. In Proceedings of the 2024 IEEE International Conference on Automation, Quality and Testing, Robotics (AQTR), Cluj-Napoca, Romania, 16–18 May 2024; pp. 1–6. [Google Scholar] [CrossRef]
  37. Pogatsnik, M.; Fischer, D.; Nagy, L.; Dora, S. Autonomous Pedestrian Crossing in Smart City Environment. In Proceedings of the 2020 IEEE 24th International Conference on Intelligent Engineering Systems (INES), Reykjavík, Iceland, 8–10 July 2020; pp. 37–42. [Google Scholar] [CrossRef]
  38. Wickramasinghe, K.S.; Ganegoda, G.U. Pedestrian Detection, Tracking, Counting, Waiting Time Calculation and Trajectory Detection for Pedestrian Crossings Traffic Light Systems. In Proceedings of the 20th International Conference on Advances in ICT for Emerging Regions (ICTer), Colombo, Sri Lanka, 4–7 November 2020; pp. 172–177. [Google Scholar] [CrossRef]
  39. Deshmukh, S.; Parwekar, A.; Danej, B.; Chavhan, N.A.; Agrawal, R.; Dhule, C. Machine Learning Algorithm Comparison for Traffic Signal: A Design Approach. In Proceedings of the 8th International Conference on Communication and Electronics Systems (ICCES), Coimbatore, India, 1–3 June 2023; pp. 1107–1114. [Google Scholar] [CrossRef]
  40. Gao, L. Design of Intelligent Zebra Crossing System Based on Cloud-Network Convergence. In Proceedings of the 7th International Conference on Intelligent Computing and Signal Processing (ICSP), Xi’an, China, 15–17 April 2022; pp. 1332–1335. [Google Scholar] [CrossRef]
  41. Lozano Domínguez, J.M.; Redondo González, M.J.; Davila Martin, J.M.; Mateo Sanguino, T.D.J. Using Sensor Fusion and Machine Learning to Distinguish Pedestrians in Artificial Intelligence-Enhanced Crosswalks. Electronics 2023, 12, 4718. [Google Scholar] [CrossRef]
  42. Ezzati Amini, R.; Katrakazas, C.; Antoniou, C. Negotiation and Decision-Making for a Pedestrian Roadway Crossing: A Literature Review. Sustainability 2019, 11, 6713. [Google Scholar] [CrossRef]
  43. Kim, D.; Kim, H.; Mok, Y.; Paik, J. Real-Time Surveillance System for Analyzing Abnormal Behavior of Pedestrians. Appl. Sci. 2021, 11, 6153. [Google Scholar] [CrossRef]
  44. Deokar, S.; Khandekar, S. Identification of Pedestrian Movement and Classification Using Deep Learning for Advanced Driver Assistance System. In Proceedings of the 2022 International Conference on Augmented Intelligence and Sustainable Systems (ICAISS), Trichy, India, 24–26 November 2022; pp. 374–381. [Google Scholar] [CrossRef]
  45. Giannoulaki, M.; Christoforou, Z. Pedestrian Walking Speed Analysis: A Systematic Review. Sustainability 2024, 16, 4813. [Google Scholar] [CrossRef]
  46. Sajewicz, J.; Dziuba-Słonina, A. Texting on a Smartphone While Walking Affects Gait Parameters. Int. J. Environ. Res. Public Health 2023, 20, 4590. [Google Scholar] [CrossRef]
  47. Hasan, R.; Hoque, M.A.; Karim, Y.; Griffin, R.; Schwebel, D.C.; Hasan, R. Someone to Watch Over You: Using Bluetooth Beacons for Alerting Distracted Pedestrians. IEEE Internet Things J. 2022, 9, 23017–23030. [Google Scholar] [CrossRef] [PubMed]
  48. Marrapu, A. Utilizing Technology to Prevent Distracted Walking. In Proceedings of the 2024 IEEE Integrated STEM Education Conference (ISEC), Princeton, NJ, USA, 9 March 2024; pp. 1–7. [Google Scholar] [CrossRef]
  49. Mikusova, M.; Wachnicka, J.; Zukowska, J. Research on the Use of Mobile Devices and Headphones on Pedestrian Crossings—Pilot Case Study from Slovakia. Safety 2021, 7, 17. [Google Scholar] [CrossRef]
  50. Koike, Y.; Tanjo, Y. Development of a Navigation System Using MY VISION for Visually Impaired People—A Method to Guide the Direction of Travel. In Proceedings of the 2024 IEEE International Conference on Systems, Man, and Cybernetics (SMC), Kuching, Malaysia, 6–10 October 2024; pp. 3275–3280. [Google Scholar] [CrossRef]
  51. Caldera, S.; Madushika, V.; Herath, S.; Alwis, S.; Thelijjagoda, S.; Krishara, J. VisionPal: Visual Assistant System for the Visually Impaired People. In Proceedings of the 2023 International Conference on Innovative Computing, Intelligent Communication and Smart Electrical Systems (ICSES), Chennai, India, 14–15 December 2023; pp. 1–8. [Google Scholar] [CrossRef]
  52. Chang, W.-J.; Chen, L.-B.; Sie, C.-Y.; Yang, C.-H. An Artificial Intelligence Edge Computing-Based Assistive System for Visually Impaired Pedestrian Safety at Zebra Crossings. IEEE Trans. Consum. Electron. 2021, 67, 3–11. [Google Scholar] [CrossRef]
  53. Yendra, D.; Haworth, N.; Watson-Brown, N. A comparison of factors influencing the safety of pedestrians accessing bus stops in countries of differing income levels. Accid. Anal. Prev. 2024, 207, 107725. [Google Scholar] [CrossRef]
  54. Rezwana, S.; Shaon, M.R.R.; Lownes, N.; Jackson, E. Bridging the gap: Understanding the factors affecting pedestrian safety perceptions in the age of driverless vehicles. Traffic Saf. Res. 2025, 9, e000080. [Google Scholar] [CrossRef]
  55. Li, Y.; Zhou, H.; Fu, S.; Wang, W. Risky Behavior of Pedestrians Crossing the Street in Front of New Energy Vehicles. In Proceedings of the 2023 7th International Conference on Transportation Information and Safety (ICTIS), Xi’an, China, 4–6 August 2023; pp. 1230–1235. [Google Scholar] [CrossRef]
  56. Greer, R.; Desai, S.; Rakla, L.; Gopalkrishnan, A.; Alofi, A.; Trivedi, M. Pedestrian Behavior Maps for Safety Advisories: CHAMP Framework and Real-World Data Analysis. In Proceedings of the 2023 IEEE Intelligent Vehicles Symposium (IV), Anchorage, AK, USA, 4–7 June 2023; pp. 1–8. [Google Scholar] [CrossRef]
  57. Omri, A.; Sbiai, F.; Sayahi, S.; Besbes, H. Enhancing ADAS Safety: Pedestrian Motion Classification with mmWave Radar Point Cloud. In Proceedings of the 2024 31st IEEE International Conference on Electronics, Circuits and Systems (ICECS), Nancy, France, 18–20 November 2024; pp. 1–4. [Google Scholar] [CrossRef]
  58. Makarova, I.; Khabibullin, R.; Mavrin, V.; Belyaev, E. Simulation Modeling in Improving Pedestrians’ Safety at Non-Signalized Crosswalks. Transp. Probl. 2016, 11, 139–150. [Google Scholar] [CrossRef]
  59. Makarova, I.V.; Shubenkova, K.A.; Parsin, G.A. Children’s Safety on Roads: Development of the Method to Choose the School Route. In Proceedings of the International Forum KAZAN DIGITAL WEEK—2020, Kazan, Russia, 21–24 September 2020. [Google Scholar]
  60. Makarova, I.; Shubenkova, K.; Mavrin, V.; Buyvol, P. Improving Safety on the Crosswalks with the Use of Fuzzy Logic. Transp. Probl. 2018, 13, 97–109. [Google Scholar] [CrossRef]
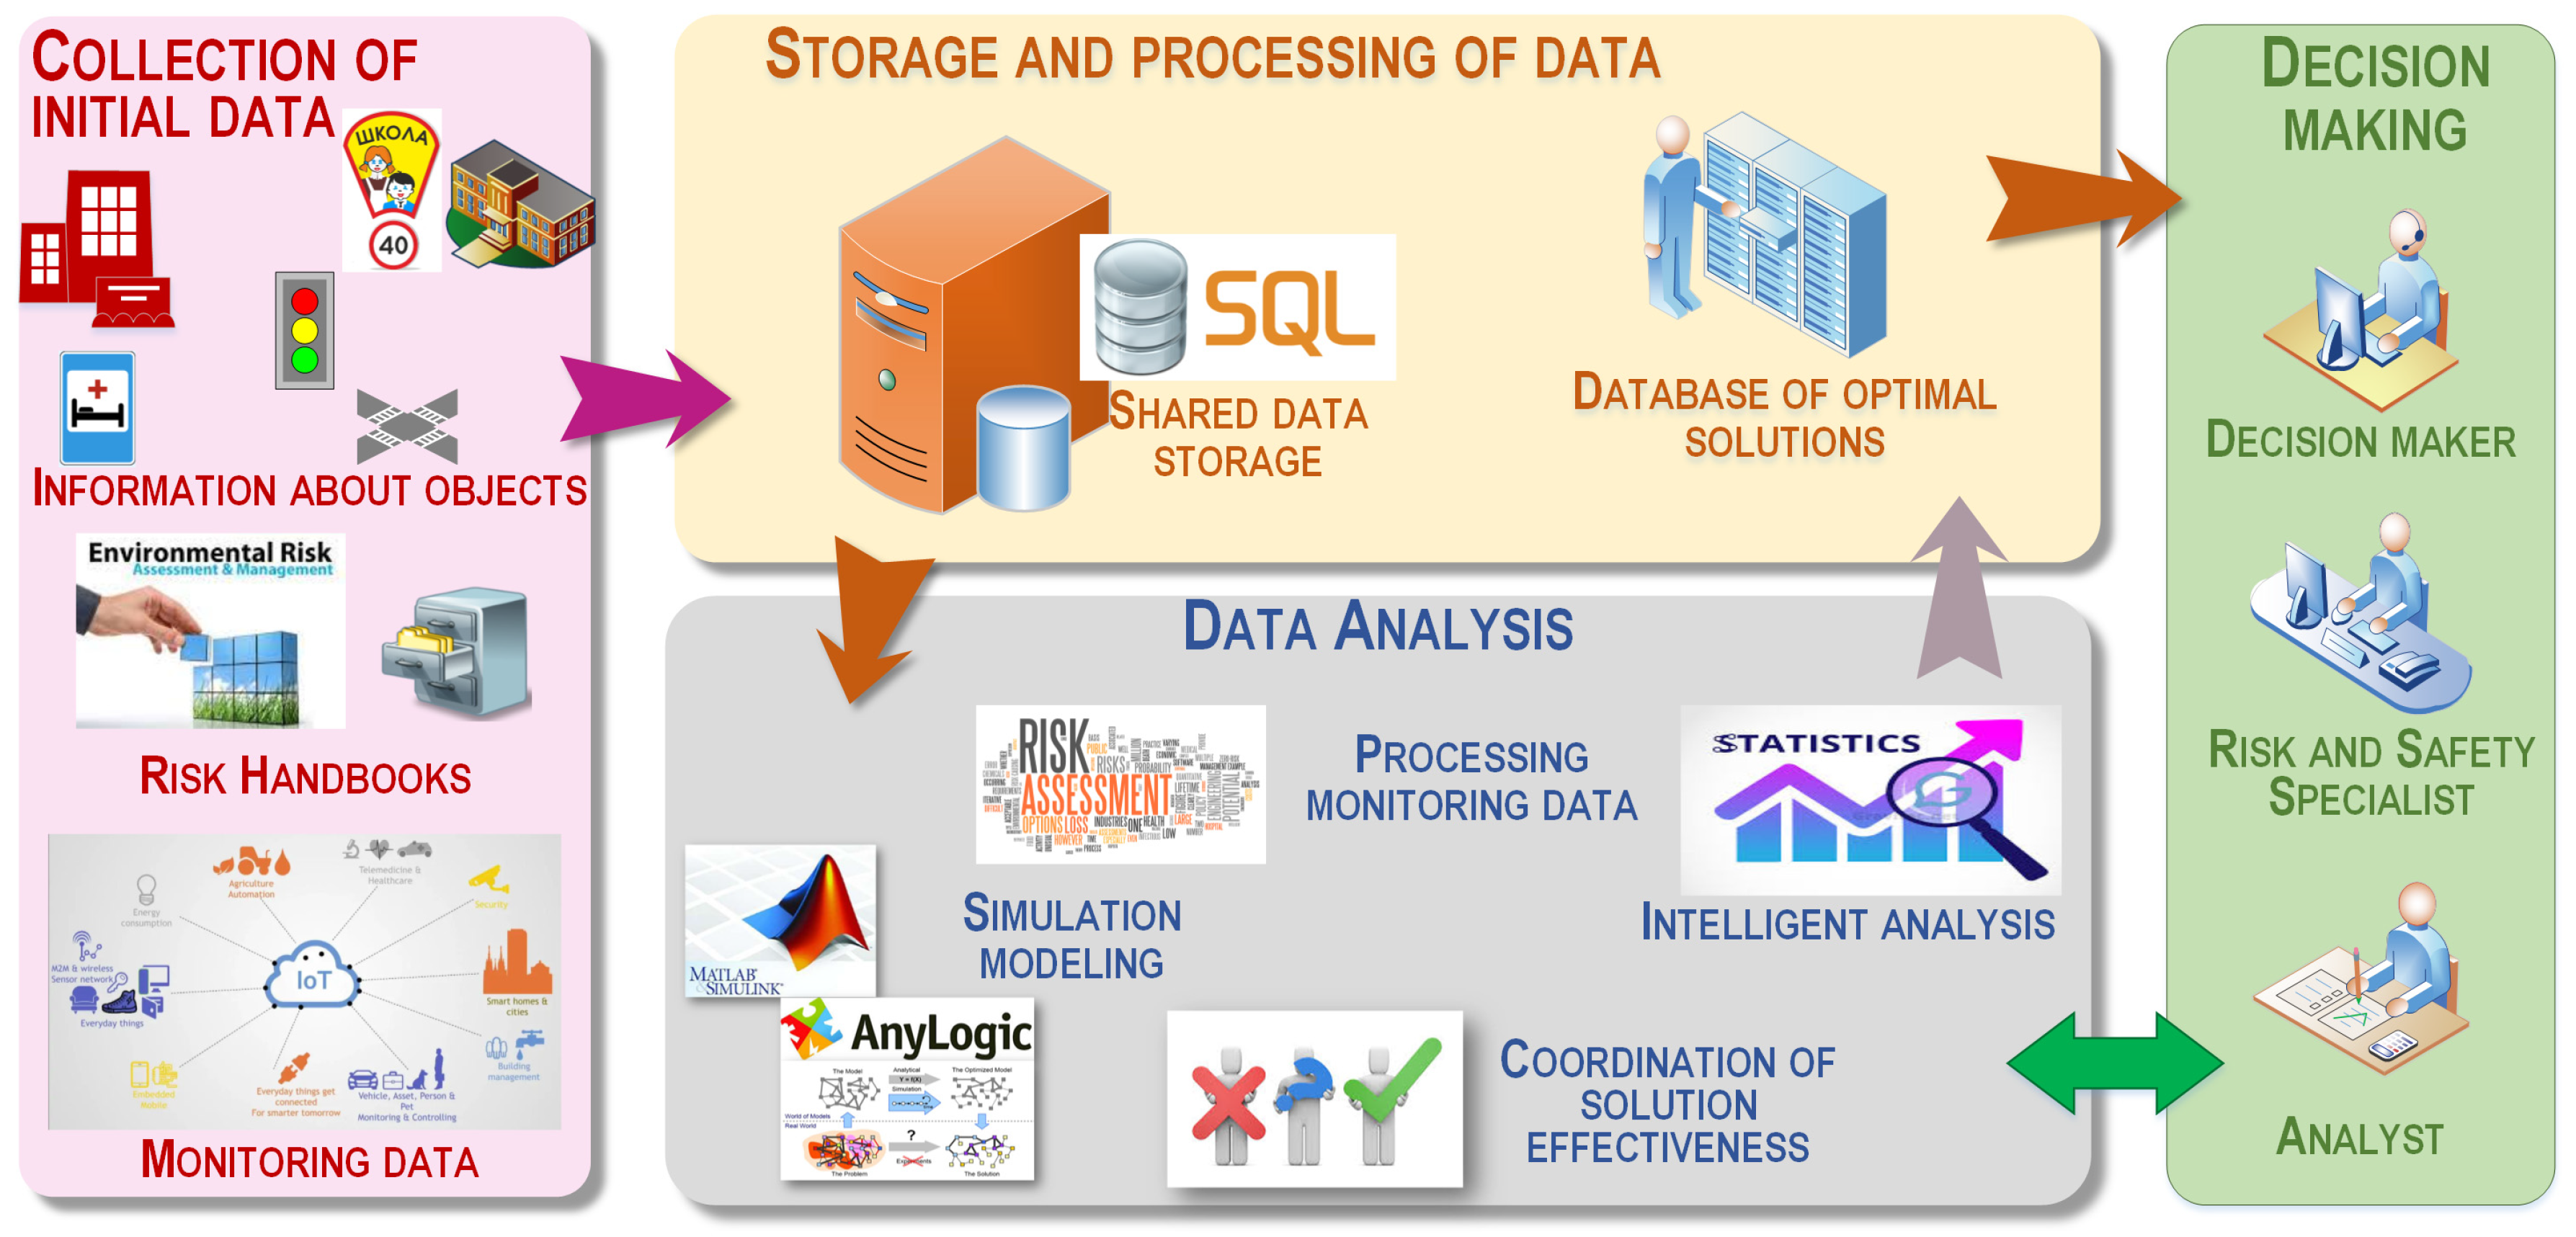
Figure 1. Conceptual diagram of an intelligent system (Developed by the authors).
Sustainability 17 08847 g001
Figure 2. Pedestrian classification (Developed by the authors).
Sustainability 17 08847 g002
Figure 3. Proposed algorithm for choosing a rational route (Developed by the authors).
Sustainability 17 08847 g003
Figure 4. The proposed algorithm for multi-criteria route analysis taking into account data on sections of the route (Developed by the authors).
Sustainability 17 08847 g004
Figure 5. Visualization of the model: (A)—as is, (B)—as will be (Developed by the authors).
Sustainability 17 08847 g005
Figure 6. The studied section of Moskovsky Prospect in Naberezhnye Chelny (Developed by the authors).
Sustainability 17 08847 g006
Figure 7. Results of field studies during peak hours (Developed by the authors).
Sustainability 17 08847 g007
Figure 8. Structure of crossroad model. (Developed by the authors).
Sustainability 17 08847 g008
Figure 9. Fuzzy logic algorithm (Developed by the authors).
Sustainability 17 08847 g009
Figure 10. Implementation of the fuzzy logic algorithm (Developed by the authors).
Sustainability 17 08847 g010
Figure 11. T Algorithm for setting up a pedestrian traffic light with a button (Developed by the authors).
Sustainability 17 08847 g011
Table 1. Summary information.
No. in the List of ReferencesAuthorsCity (Country, Region), YearSocial FactorsInfrastructureSolution Methods/ModelsEvents/Training
AgePerceptionBarriers That Reduce SafetyCrossroadMarking/Lighting
[11]Deluka-Tibljaš, A.; Šurdonja, S.; Ištoka Otković, I.; Campisi, T.Croatia, 2022childreninfrastructure solutionslack of a universal mechanismdifferent types of intersectionsdifferent typesregression analysis, neural networkstargeted training
[12]M. Gogola and J. OndrušSlovakia, 2020children and schoolchildrenunder the supervision of parents or adultsabsence of adultsdifferent typesdifferent typessurveys, observationTargeted training
[13]Ištoka Otković, I.; Deluka-Tibljaš, A.; Zečević, Đ.; Šimunović, M.Croatia, 2024children and elderly pedestrians unregulated microsimulation (VISSIM)Safety training
[14]Ištoka Otković, Irena & Aleksandra, Deluka & Šurdonja, Sanja & Campisi, Tiziana.Croatia, 2025childrendifferent parameters different types of intersections neural network based modelsTargeted training
[15]Yang, J.; Gauli, N.; Shiwakoti, N.; Tay, R.; Deng, H.; Chen, J.; Nepal, B.; Li, J. Australia, 2025vulnerable groups including children, older people and CALD communitiessuch as a language barrier, lack of knowledge of local traffic rules and differences in cultural approaches to safetyusing mobile phones when crossing the roaddifferent types of intersections thematic analysis of articlestargeted communication is needed to address specific risks
[16]Habibzadeh, Mohammad & Mirabimoghaddam, Mohammad & Haghighi, Mojde & Ameri, MahmoudIran, 2024different age groupslack of correlation between perceived and infrastructure security different types of intersections safety training with economic empowerment
[17]Kouchakinejad-Eramsadati L, Asgary A, Homaie Rad E, Hirshon JM, Ostadtaghizadeh A.Iran, Canada, USA, 2025different age groupsdifferent groups by age and behavior different types of intersections traditional content analysis with an inductive approach, data analysis using the Granheim and Lundman approachSafety training
[18]Soyoon Kim, Sangwon Choi, Brian H.S. Kim.Seoul, 2024elderlylack of pedestrian awarenesslack of separation of pedestrian and traffic flowsdifferent types of intersectionslack of separation of pedestrian and traffic flowsMaxEnt (maximum entropy) modelsafety training with infrastructure improvement
[19]Lee, S.; Han, M.; Rhee, K.; Bae, B. Korea, 2021different age groupssatisfaction different types of intersections binary logit model and ordered logit modelsurvey, satisfaction study
[20]Bojan Marić, Krsto Lipovac, Miladin Nešić, Miroslav ĐeriBelgrade, 2021different age groupscountdown board adjustable motion video analysisSafety training
[21]Kopsacheilis, A., Politis, I.Thessaloniki, 2024different age groupslighting, traffic calming measures lighting, traffic calming measurestraditional logistic regression models and artificial neural networksSafety training
[22]Swami, M.; Pathak, C.; Swami, S.; Jeihani, M.USA, India, 2024schoolchildrencomprehensive improvement of the pedestrian school zoneparking on sidewalks, no barriers lighting, traffic calming measures, widening of sidewalksmicroscopic scenario modeling using the SFM model in the PTV Vissim/Viswalk softwaretraining in road safety rules
[23]Mukherjee, Dipanjan & Kumar, Abhinay. India, 2024different age groups width of the roadway, presence of a curved section at the intersection, vehicle speedpresence of pedestrian traffic lightswidth of the roadway, presence of a curved section at the intersectionLogit ModelsSafety training
[24]Mukherjee, D. India, 2025different age groupspedestrian education levelinadequate infrastructure, vehicle speed ANOVA Method for Pedestrian Risk Analysistraffic police control
[25]Prakash S, Karuppanagounder K. India, 2023different age groupsage of pedestriansnon-linear route, no cars on the road inadequate infrastructuremotion video analysis, binary logit modeltraffic police control
[26]K.C., Hari & Shahi, ThusithaNepal, 2025different age groupsPedestrian age, previous accident history, pedestrian behaviorlow perception of safety structured questionnaire surveytraffic police control
Table 2. Summary information.
No. in the List of ReferencesAuthorsCity, Country, Region, YearInfrastructureSolution Methods
Purpose of the StudyIntersection/Markings/LightingModelsRestrictions
[27]Ristić, B., Bogdanović, V., & Stević, Z. Doboj, Sarajevo, and Novi Sad, 2024assessment of the impact of pedestrian movement start time on the efficiency of pedestrian flowadjustable transitioncriteria-elimination and trade-off decision models for measuring alternatives and rankingmodel sensitivity to input parameters
[28]Santilli, D.; D’Apuzzo, M.; Evangelisti, A.; Nicolosi, V.Italy, 2021Road Safety Risk Assessment hybrid approach and innovative “moving observer” approachWe need to create conditions that support active transport, improve public health and advance equitable goals.
[29]Julijan Jurak, Mario Ćosić, Antonijo Tišljar, Ivan NemeZagreb, Republic of Croatia, 2026the possibility of creating zones with a speed limit of up to 30 km/h in urban areasvertical and horizontal signaling registration and automatic traffic countersdrone video, processing tests in the Data software solution from Sky, processing of data on road accidents.There are significant barriers to public acceptance, enforcement and compliance.
[30]Ziółkowski, R.; Pérez-Acebo, H.; Gonzalo-Orden, H.; Linares-Unamunzaga, A.Poland, Spain, 2024Changes in safety indicators (before and after) at pedestrian crossingspedestrian crossings with additional lighting“before and after” methodComparison of data on night and daytime accidents is necessary
[31]Kruszyna, M.; Matczuk-Pisarek, M. Poland, 2021Evaluation of infrastructure solutions to reduce speeddevices from the group of “speed control measures” and “means for intermediate transitions”Determination of the main characteristics of road traffic (speed and intensity) using the SR4 deviceOnly issues of traffic management without taking into account the impact on vehicles and pedestrian behavior
[32]Cieśla, M.Poland, 2021problems of improving children’s safety on the roads as pedestrians and cyclists in a smart citypedestrian and bicycle infrastructurediagnostic survey, multi-criteria assessment of infrastructure solutions
[33]A. Charef, Z. Jarir and M. QuafafouMarrakesh, Morocco, 2024determine the optimal distance between roundabouts and pedestrian crossingsroundabouts and pedestrian crossingsVissim modelingthe presence of pedestrian crossings adds complexity, requiring careful planning to achieve a balance
[34]Y. Zhang, X. Zhang, Y. Fujinami and P. RaksincharoensakTokyo, Japan, 2024solutions to collision avoidance problemmixed traffic, differences between streets and pedestrian areasparticle swarm optimization (PSO) to generate optimal parameters of a dynamic vehicle model based on the social force model (SFM)For simplicity, a point mass vehicle model was used
[35]Chi Zhang; Janis Sprenger; Zhongjun Ni; Christian BergerGothenburg, Sweden, 2024improving traffic safety at unregulated crossingswithout “zebra” and using “zebra”Application of neural network and simulator for scenario studyobserved behavior may be influenced by cultural effects
[36]E. Mátyás and L. SzabóCluj-Napoca, Romania, 2024improving traffic safetyintelligent system of additional lighting of pedestrian crossings based on round LEDs mounted in the groundThe Doppler effect has also been used to determine the direction of a pedestrian’s movement.
[37]M. Pogatsnik, D. Fischer, L. Nagy and S. DoraSzekesfehervar, Hungary, 2020increasing visibility in heavy fog or rainintelligent pedestrian crossings based on alarm signals generated by sensors.The system projects a virtually uniform laser plane over the roadwayTo obtain accurate traffic data, the sensor system needs to be expanded. This may lead to increased energy consumption.
[38]K. S. Wickramasinghe and G. U. GanegodaKatubedda, Sri Lanka, 2020improvement of time-based traffic lights and push-button traffic lightsimprovements to the traditional traffic light system.Image processing technologies for pedestrian detection Haar Cascade Classifierit will be possible to improve the trajectory determination function by using a voting system to predict the location of a pedestrian in a given period of time
[39]S. Deshmukh, A. Parwekar, B. Danej, N. A. Chavhan, R. Agrawal and C. DhuleNagpur, India, 2023improving intelligent traffic lightscoordination of traffic lights at intersectionsdeep learning methods data learning strategies using data mining and image processing techniquesThe quality and quantity of data used to train algorithms determine the success of these methods. Implementing these strategies requires significant investment in infrastructure such as communication networks, sensors, and cameras.
[40]L. GaoXi’an, China, 2022construction of intelligent pedestrian crossings “zebra”Activated when pedestrians are detectedconvergence of cloud technologies and networks
[41]Lozano Domínguez, J.M.; Redondo González, M.J.; Davila Martin, J.M.; Mateo Sanguino, T.d.J. Huelva, Spain, 2023intelligent pedestrian crossingspeed bump designSensor fusion and machine learning methods for pedestrian and driver recognition
Table 3. Summary information.
No. in the List of ReferencesAuthorsCity, (Country, Region), YearThe Purpose of Behavioral ResearchBehavioral FactorInfrastructure (Intersection/Markings/Lighting) or VehicleSolution Methods
ModelsLimitations and Future Work
[42]Ezzati Amini, R.; Katrakazas, C.; Antoniou, C. Munich, Germany; Athens, Greece 2019understanding effective communication methods and the factors that influence pedestrian interactions and decision makingdistraction, lack of communication with the vehicle driver A holistic approach to modeling interactions at road crossings is presented and discussed.It is necessary to first detect distracted pedestrians and then respond appropriately to avoid conflict
[43]Kim, D.; Kim, H.; Mok, Y.; Paik, J.Seoul, Korea, 2021Detect and track pedestrians to extract information about them in real timedetecting abnormal road behavior such as trespassing, falling and violencevideo surveillance systemThe object detection network uses YOLOv4, a tracking algorithm to estimate the coordinates of an objectcan be improved with additional algorithms such as pose estimation and further dataset tuning
[44]S. Deokar and S. KhandekaPune, India, 2022creating a driver assistance system for ADAS vehicles to improve pedestrian safety and reduce pedestrian accidentsrecognizes a pedestrian moving in a certain directioncar cctv systemConvolutional neural networks are used to train and classify both binary and categorical pedestrian datadifficulty in forming a database of images of pedestrians
[45]Giannoulaki, M.; Christoforou, Z. Pedestrian Patras, Greece, 2024factors influencing pedestrian walking speed are being studiedThe factors influencing pedestrian walking speed are studied, classifying them into pedestrian flow characteristics, pedestrian attributes, layout configuration, environmental conditions and pedestrian behavior patterns a comprehensive review of the literature studying pedestrian walking speed in different environments and conditions, classification of factors and synthesis of results using meta-analysisFactors such as environmental conditions, technological limitations and human error may introduce bias or inaccuracies into the data collected.
[46]Sajewicz, J.; Dziuba-Słonina, A. Wroclaw, Poland, 2023does using a mobile phone while walking affect walking speed and other parametersincreased risk of accidents at pedestrian crossings and tripping while walking while texting on a smartphone Experiment in the measurement workshop using the FDM−1.5 Zebris dynamograph platform More respondents are needed. The survey can be conducted in other age groups (primary and high school students).
[47]R. Hasan, M. A. Hoque, Y. Karim, R. Griffin, D. C. Birmingham, AL, USA, 2022warning pedestrians distracted by their smartphones with a visual and/or sound signalincreased risk of accidents at pedestrian crossingsStreetBit system at the intersection: (1) BLE beacons; (2) StreetBit mobile application; (3) internal server for data storageStreetBit mobile apps for Android and iOS In the future, it is planned to develop a system with fewer beacons. It is necessary to develop safe behavior on the road.
[48]A. MarrapuVA, USA, 2024warning with a mobile app to prevent road accidentsdistractions while walking, especially when using a mobile phone The application uses Google API Activity for tracking user activity and Map API for defining paths and transitions
[49]Mikusova, M.; Wachnicka, J.; Zukowska, J. Zilina, Gdansk, Poland, 2021Improving pedestrian safetyuse of mobile devices and headphones on pedestrian crossings Observation, survey by recording data on a census form, where pedestrians were grouped by estimated age to assess pedestrian safety riskslimited time and number of measurements taken
[50]Y. Koike and Y. TanjoJapan, 2024Improving pedestrian safetyfalls or collisions of visually impaired personsthe instrument consists of a cartographic information system and a navigation system, which uses optical beacons and their receiverusing images obtained with MY VISION and deep learning.There are limitations in recognizing color markings of routes.
[51]S. Caldera, V. Madushika, S. Herath, S. Alwis, S. Thelijjagoda and J. KrisharaSri Lanka, 2023obstacle detection, identification of free spaces, recognition of road signs and assistance when crossing the roadHelp for the visually impairedcomprehensive smartphone application for the visually impairedReact was used to develop the mobile application Native. The code was written using Python and TensorFlow to build machine learning models.To improve the accessibility of the application for visually impaired users, future research may consider developing smart glasses.
[52]W. -J. Chang, L. -B. Chen, C. -Y. Sie and C. -H. YangTainan, Taiwan, 2024assisting visually impaired consumers to safely use marked pedestrian crossings or zebra crossingsWearable assistance system based on AI edge computing methods for recognizing zebra crossings at intersectionsan AI-based assistance system consisting of a pair of smart sunglasses, a smart waist-mounted device, and a smart walking stickAI-based deep learning method is used
[53]Delvis Yendra, Narelle Haworth, Natalie Watson-BrownAustralia, 2024Comparison of factors influencing pedestrian safety at bus stops in countries with different income levels systematic reviewIt is recommended to focus on developing additional safety measures to identify dangerous bus stops
[54]Rezwana, S., Shaon, M. R. R., Lownes, N., & Jackson, E. USA, 2025studying the perception of autonomous vehicles and pedestrian reactionsSafer coexistence between pedestrians and driverless cars Pre-survey to assess public perception, immersive simulation of real traffic scenarios in a VR environment, post- experimental surveyTransport authorities can develop more effective communication strategies and educational programs
[55]Y. Li, H. Zhou, S. Fu and W. WangWuhan, China, 2023study of the degree of interaction between vehicles and pedestriansobtaining data on pedestrians’ intention to take risks when crossing the street K-means clustering method, Risk taking survey, Leuckart scale processingthe number of questionnaires collected is small, the study participants do not have a clear understanding of the driver assistance function in cars
[56]R. Greer, S. Desai, L. Rakla, A. Gopalkrishnan, A. Alofi and M. TrivediSan Diego, USA, 2023preventing collisions with pedestriansCHAMP can reduce risks to pedestrians in poor visibilityThe advantages of CHAMP: (1) online autonomous vehicle detectors can be used; (2) any car with a navigation system can benefit from the safety recommendations.CHAMP can process information, apply noise reduction and threshold, online pedestrian detection aggregation systems based on maps learning pedestrian locations
[57]A. Omri, F. Sbiai, S. Sayahi and H. BesbesAriana, Tunisia, 2024detection and classification of pedestrian behavior in urban environmentsvarious types of pedestrian movement including “walk”, “cross the road”, “hesitate” and “raise hand”Using low-resolution 4D radar in real urban environmentsPedestrian Clustering Using Machine Learning and Deep Learningfurther development of the algorithms, including expanding the dataset with more realistic scenarios and collecting vehicle data to improve efficiency
Table 4. Parameters of the transport system.
Traffic Flow ParametersUnregulated CrossingAdjustable Crossing
Not During Rush HourDuring Rush Hour
average traffic density121137168
average traffic speed717066
probability of accident0.670.290.24
Table 5. Input data of the traffic light object.
AvenueRedGreenArrow
Avtozavodsky272523
Moskovsky252723
Table 6. Membership functions of input and output variables.
Term Set ValueMembership Functions of Input VariablesMembership Function of Output Variables
Number of Vehicles, Nq, UnitsNumber of
Waiting
Pedestrians, People
Time to the
Beginning of the Red Phase, Tp, s
Pedestrian Phase
Waiting Time, s
Transition Time, s
Small0–130–81–70–200–20
Medium13–278–217–1520–4020–40
Large27–4021–3030 and more40–6040–60
Disclaimer/Publisher’s Note: The statements, opinions and data contained in all publications are solely those of the individual author(s) and contributor(s) and not of MDPI and/or the editor(s). MDPI and/or the editor(s) disclaim responsibility for any injury to people or property resulting from any ideas, methods, instructions or products referred to in the content.