Abstract
The construction sector has a prominent role in raw materials consumption and environmental depletion due to waste and emissions connected to the production of construction materials and construction/demolition operations. Thus, research is pushing to develop sustainable construction materials, mainly recycling waste and by-products. Following this trend, the present study explores the possible use of two different blends of cement-based waste powder and biomass ashes as filler for the production of asphalt concretes. The materials have been tested following the EN 13043 standard requirements for fillers for bituminous mixtures. Still, the basic performances of hot mix asphalts produced with the recycled materials have been evaluated on a laboratory scale. The physical, chemical, and mechanical characterization of the waste fillers and the bituminous mixtures showed advantages and downsides in the use of the recycled powders for hot mix asphalt production. Despite final performances in line with traditional hot mix asphalt, the chemical composition of the proposed fillers has a negative influence mainly on the water susceptibility of the mixture. However, the findings of the study open new perspectives on future possible applications of the recycled fillers in the road pavements sector.
1. Introduction
Mineral filler represents the finest aggregate, which completes the grading distribution of an asphalt mixture either naturally present in or separately added to the fine and coarse aggregates. According to EN 13043, most of the filler particles pass the 0.063 mm sieve [1]. The filler has a dual role: it acts as an extension of the aggregate skeleton, providing specific mechanical performances, such as stiffness and fatigue resistance, of the final asphalt concrete (contact points between individual particles), and it affects the rheological behavior of the bituminous film that coats the aggregates themselves, being suspended particles in the bituminous binder matrix (no contact points) [2,3]. Hence, mineral fillers contribute significantly to the performance of asphalt pavements at both bituminous mastic and mixture scales.
The mineral fillers coming either from natural rocks, like limestone, granite, and dolomite, or industrial processes, such as hydrated lime, cement (including Portland), and fly ash, are commonly employed in asphalt mixes to gain specific volumetric and rheo-mechanical properties. In detail, the presence of filler allows the mixture to meet the gradation requirement and thus the quantity of air voids [4,5]. At the mastic scale, several studies have demonstrated the stiffening effect of mineral fillers when added to a bituminous binder that results in increased softening points and reduced penetration values; these features turn into improved high-temperature performances [6,7]. The experienced stiffening effect of fillers at the bituminous mastic level is generally reflected at the asphalt mixture level as well as the enhanced rutting resistance [6]. However, the rheo-mechanical behavior of bituminous mastics, and thus asphalt mixtures, is affected by the filler type, size, concentration, or grading of the filler [8], especially concerning the low-temperature behavior and aging resistance [5,8]. Previous studies have demonstrated the higher indirect tensile strength and the lower moisture susceptibility of mixes containing hydrated lime [7,9]. Regarding the particle size, filler particles with higher specific surface area (SSA) were found to enhance the bituminous binder content and aging susceptibility [8,9]. Nonetheless, a proper mineral filler should ensure good passive and active adhesions between bituminous binders and aggregates [10,11]. As a result, the studies that have been carried out so far highlighted the influence of filler quality on the rheo-mechanical behavior of the final asphalt product and, consequently, the durability of road pavements to some extent. Thus, a comprehensive analysis of the potential performances of the resulting bituminous mastic and mixture should be completed for either traditional or alternative fillers.
In fact, the increased awareness of environmental concerns and the aim to address sustainability and circular economy goals led to the definition of innovative road construction materials employing urban and industrial wastes and/or by-products. An asphalt mixture can consist of up to 10% wt. of filler approximately, which can be substituted for a more sustainable product. The total replacement of virgin mining material with wastes and/or by-products will have a significant impact on the road industry’s carbon footprint since 90% of the European road network, i.e., more than 4.5 million kilometers, is made up of asphalt concrete in 2020 [12,13,14]. The use of alternative filler has a twofold aim, as it reduces the use of non-renewable materials, and it promotes the recycling of materials, preventing their disposal. Previous studies [5,15] investigated the possibility of substituting mineral filler with the following:
- Agricultural waste, in the form of biomass ash;
- Industrial waste, like cement and ceramic powder or dust coming from the processing of natural rocks or the metal industry;
- Construction and demolition waste, such as copper, brick, and concrete powder
- Urban waste, including glass powder;
- Mining waste such as coal mine waste.
Based on the nature of recycled filler, the rheo-mechanical responses of the final bituminous products may differ [5].
Among the available products, the present study proposes the use of two alternative fillers that mainly include waste cement powder and a small amount of biomass ash coming from non-hazardous materials. The potential use of cement, such as cement bypass dust or waste cement dust, as a substitution for traditional mineral filler in asphalt mixes has been demonstrated by various researchers. The asphalt mixtures produced with recycled cement fillers showed adequate Marshall stability, or even higher than the reference asphalt concrete [16,17], moisture and freeze-thaw resistances, and tensile and unconfined compressive strengths meeting the specification requirements [16,18]. Asphalt mixtures containing either mineral filler or waste cement filler behaved similarly in terms of volumetric and mechanical properties [18], or it has been found to increase the total air voids in the mix [17]. The researchers attributed the positive results to the similar intrinsic properties of cement and mineral powders [18]. The enhancement of asphalt concrete mechanical properties, i.e., strength, stiffness, and permanent deformation, was also found by combining waste cement and fly ash as a substitution of mineral filler even if these changes may be ascribed to the presence of cement [19]. On the other hand, the fly ash could positively contribute to increasing the stripping resistance of the final mix [20]. In order to deal with the sustainability goals without compromising the road performances, a full characterization of the potential alternative fillers and the resulting asphalt mixes has been carried out. A traditional limestone filler has been considered as reference material, both for filler properties and for hot mix asphalt (HMA) performances.
2. Materials and Methods
2.1. Materials
Two different recycled fillers were tested and compared with a common limestone filler, traditionally adopted for the production of asphalt concretes (Figure 1). The two experimental fillers, labelled C1 and C2, are a blend of calcium carbonate, residue powders from the Portland cement production, polycarboxylates, and biomass ashes obtained from the organic residues in the production of sunflower oil. The fillers were purchased from CAL.ME. S.p.A. (S. Maria di Catanzaro, Italy), and they are from the same industrial production plant but are made by mixing different amounts of grade materials. Depending on the dosage of each material, two different fillers can be obtained, whose chemical and physical properties are presented in the following sections.
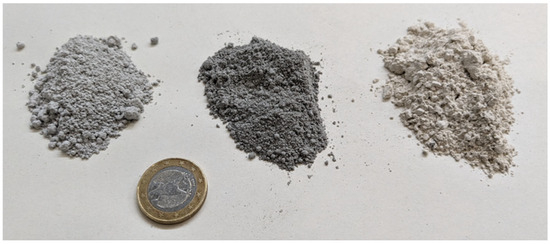
Figure 1.
C1 (left), C2 (center), and limestone filler (right).
The reference filler is a limestone filler, labelled as LF.
A traditional 50/70 pen bitumen was adopted as a binder. The rheological properties of the bitumen are highlighted in Table 1.

Table 1.
Bitumen rheological properties.
A traditional AC 12.5 SURF 50/70 pen mixture was produced with the reference limestone filler (AL). The two experimental mixtures had the same grading distribution but C1 and C2 in total replacement of the limestone filler. The mixtures are presented as AC1 and AC2, respectively.
The particle distribution is represented in Figure 2.
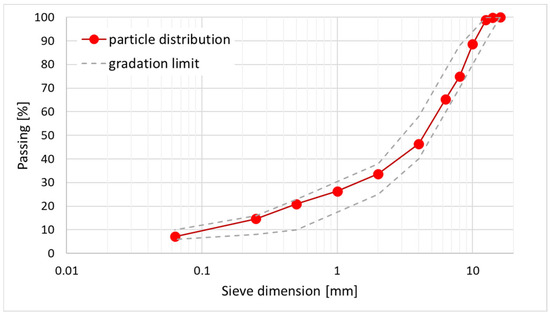
Figure 2.
Particle size distribution.
Based on previous lab analysis, for the mix design of the reference AC, 6% of limestone filler and 5.2% of bitumen were considered. Considering that no relevant differences were found between the fillers in terms of particle density, the same amount of filler was fixed for the experimental AC.
However, taking into account the different physical properties of the waste fillers, a preliminary study on the optimum bitumen content (OBC) was performed for the experimental mixture. The OBC considered the evaluation of air void content (EN 12697-8 [24]) and indirect tensile strength (ITS) properties at 25 °C (EN 12697-23 [25]). Four mixtures with increasing bitumen content from 5 to 5.8% were produced and tested. Based on results, the OBC for AC1 and AC2 was found to be equal to 5.5% and 5.7%, respectively. As expected, an increased amount of bitumen was needed in order to improve the workability and compactability properties of the mixtures (air void content) as well as their cohesion (ITS). These results follow the data obtained from the previous filler characterization, with C2 being richer in porosity and with a higher absorption power. The final mix designs adopted in the research are summarized in Table 2.
Table 2.
Final mix design.
2.2. Methods
The experimental program was divided into two consecutive steps: a preliminary characterization of the waste powder and a comprehensive laboratory characterization of asphalt mixtures produced with the waste materials in total substitution of the limestone filler.
2.2.1. Characterization of the Waste Powders
Aiming to evaluate the possible use of the proposed waste powders as filler within bituminous mixtures, their chemical, physical, and mechanical properties were evaluated based on the indication of the EN 13043 standard. The aforementioned standard refers to the application of filler in the production of asphalt concretes and suggests tests and reference values. In the case under study, the following tests were performed:
- Mineralogical analysis;
- Physical analysis of particles and size distribution (EN 10343 [26]);
- Water content (EN 1097-5 [27]);
- Particle density (EN 1097-7 [28]);
- Voids of dry compacted filler (EN 1097-4 [29]);
- Variation in “Ring and Ball” temperature (EN 13179-1 [30]);
- Harmful fines (EN 933-9 [31]).
The obtained data were compared to values obtained for a traditional limestone filler and ranges suggested by the EN 13043 standard.
2.2.2. Characterization of the Asphalt Concretes
Once the properties of the experimental fillers were defined, their application within bituminous mixtures was evaluated based on a physical and mechanical characterization. Three different asphalt concretes were produced, containing or not containing the waste powders as filler (AC1, AC2, AF).
A standard mix design for wearing course was adopted for the reference mixture. However, considering the possible difference related to the use of the non-conventional fillers, a preliminary evaluation on the optimum bitumen content (OBC) was carried out for the experimental mixtures.
For the final optimized mixtures, the experimental program considered the following tests:
- Analysis of the compactability [32,33];
- Air voids analysis (EN 12697-8);
- Indirect tensile strength (EN 12697-23);
- Indirect tensile stiffness modulus (EN 12697-26 [34]);
- Indirect tensile strength ratio (EN 12697-12 [35]);
- Hamburg wheel tracking test (AASHTO T 324 [36]).
The evaluation of the performances of the experimental asphalt concretes was based on the comparison with the reference mixture and considering the ranges and threshold values traditionally considered in some Italian technical specifications for asphalt concretes for surface layers.
2.2.3. Scanning Electron Microscope (SEM)
The analysis of the samples was acquired by a scanning electron microscope (SEM) ultra-high resolution SEM (UHR-SEM)—ZEISS CrossBeam 350 (Carl Zeiss AG, Oberkochen, Germany). The SEM analysis conditions: HV: 15 KeV; probe current: 100 pA; working distance: 11 mm; image: BSE signal; detector image: solid state detector (SSD), Everhart–Thornley detector (SE); image size: 2560 × 1920 pixels.
The samples were fixed on pin stubs using conductive adhesive. Before analysis, the surface of the samples was coated by a 5 nm thick layer of carbon by a Sputter—Carbon Coater QUORUM Q150T-ES, Quorum Technologies, Lewes, UK (current pulse: 70 A; time pulse: 2.5 s).
2.2.4. Powder X-Ray Diffraction (PXRD)
Powder X-ray diffraction (PXRD) patterns were acquired on a Bruker D2-Phaser (Mannheim, Germany) equipped with a Cu Kα radiation (λ = 1.5418 Å) and a Lynxeye detector, at 30 kV and 10 mA, with a step size of 0.01° and a step time of 3 s, over an angular range of 5–75° 2θ. The obtained powder patterns were analyzed with DIFFRAC.EVA diffraction software (version 6).
3. Results
3.1. Filler Characterization
3.1.1. Mineralogical Composition
The mineralogical composition of the two experimental fillers was evaluated with the X-ray diffraction analysis (XRD). This technique allows the identification of the crystalline phases present in a material and reveals its mineralogical composition. The spectra and related peak attributions are reported in Figure 3, and XRD results are summarized in Table 3.
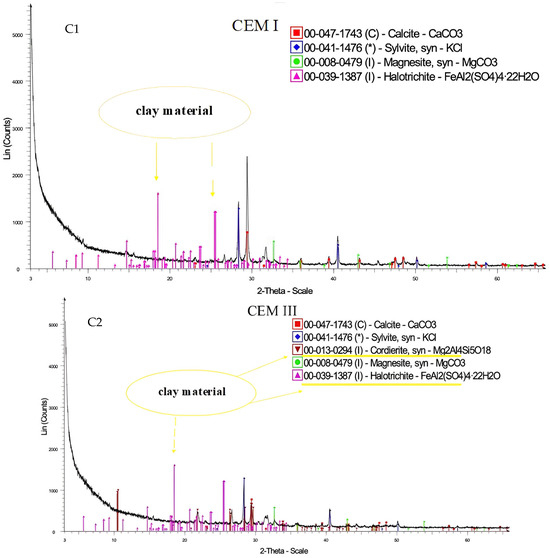
Figure 3.
XRD spectra of the two fillers together with the peak attributions.
Table 3.
Filler mineralogical composition.
The main difference in the mineralogical composition of the two fillers is given by the presence of cordierite for C2. Both fillers exhibit the presence of calcium carbonate, which is highly compatible with bitumen. However, the presence of CaCO3 is limited if compared to traditional limestone fillers whose CaCO3 content is generally higher than 95%. These results might have a prominent role in the final performance of the bituminous mixtures produced with the recycled filler, as discussed in the coming sections.
3.1.2. Physical Analysis of Particles and Size Distribution
Based on EN standards, fillers are defined as materials with a maximum size of less than 63 μm. Following the EN 13043 standard, the quantity of material passing the 0.063 mm sieve (P63) was verified. The results are reported in Table 4.
Table 4.
Filler size distribution.
Considering that the aforementioned standard defines the minimum quantity of P63 as 70%, both the experimental powders can be considered as filler for bituminous pavements in terms of particle dimension.
The analysis of the two innovative fillers was deeply investigated in terms of pore dimensions following the Brunauer–Emmett–Teller (BET) surface area analysis and Barrett–Joyner–Halenda (BJH) pore size and volume analysis. The BET analysis provides a specific surface area evaluation of materials, and it is used to describe the adsorption on surfaces by vapor phase. This model allows us to have information on the dimensional distribution and pore volume of solids and powders with gas physisorption techniques. According to the specific surface area calculated by BET, C1 and C2 have a remarkable difference between them (7.933 m2/g for C1 and 15.973 m2/g for C2).
The analysis of pore size is obtained from the BJH model, which can determine pore area and specific pore volume using adsorption and desorption techniques. Based on these analyses, both fillers consist of pores in the range of 2–30 nm, with a composition of slightly bigger pores for C3. Generally, a common limestone filler has the smallest surface area, with values ranging from 1.800 to 1.899 m2/g and pore size distribution in the order of 4–20 nm [37].
It is worth noting that differences in the pore volume and specific surface area of the fillers have a great influence on the absorption properties of the materials when blended with bitumen, affecting the rheological behavior of the bituminous mastic and so the final properties of the HMA [16].
A scanning electron microscope (SEM) was used to evaluate the micromorphology of the experimental fillers, as shown in Figure 4.
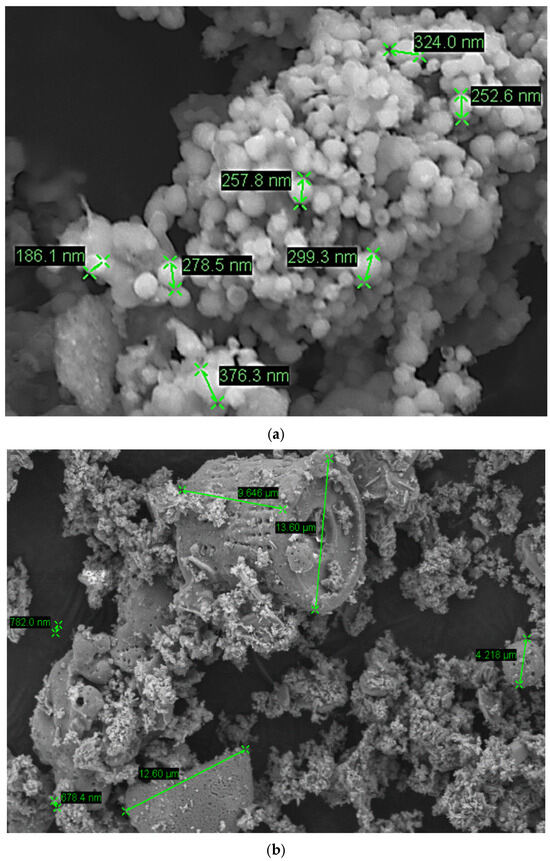
Figure 4.
SEM images for C1 (a) and C2 (b).
As visible, the morphology and texture of the particles of the two recycled powders are considerably different. C1 particles are relatively smooth, with dimensions in the magnitude below 50 nm. On the contrary, C2 particles have a rough texture, with some coarse cylindrical agglomerates with dimensions below 1 µm, suggesting the presence of fossils and silicates.
3.1.3. Water Content
The water content is calculated considering the variation in percentage from the dried and wet mass of a sample (EN 1097-5). The average results are presented in Table 5.
Table 5.
Filler water content.
Both experimental fillers show a limited water content, below the 1%, which is the maximum water content reported in the EN 13043 standard for fillers for bituminous pavements. As a consequence, no particular limitation would occur in case of silo storage of the recycled fillers in the asphalt concrete production plants as well as in the production process.
3.1.4. Particle Density
Following the EN 1097-7 standard, the density of the different fillers was calculated using the pycnometer procedure. The tests were carried out on three samples for each type of filler. The average values are presented in Table 6.
Table 6.
Filler particle density.
The density of the different fillers ranges between 2.71 and 2.62 Mg/m3 due to the different chemical and mineralogical compositions of the materials.
3.1.5. Voids of Dry Compacted Filler
The percentage of voids of dry compacted filler (Rigden voids, Rv) is a significant property of the filler when used for bituminous materials, since it plays a key role in the formation of the bituminous mastic. Based on the EN 1097-4 standard, the Rv are considered as the space filled with air in the bulk filler after a specific compaction procedure.
The average results are presented in Table 7.
Table 7.
Voids of dry compacted fillers.
Considering the great impact of Rv in affecting the rheological and mechanical properties of the bituminous mastic, the EN 13043 standard suggest a limited range for the porosity of the filler, ranging from 28 to 55%. While the LF falls in this range, both experimental fillers are below the maximum suggested Rv. This will affect the mechanical and physical properties of the final asphalt concretes, as verified in the following sections. Furthermore, these data are in line with the outcomes of the previous physical analysis of particles.
3.1.6. Variation in “Ring and Ball” Temperature
The filler interacts with bitumen at a chemical and rheological level. Considering the different absorption properties, chemical composition, dimensions of particles, and Rv of the experimental fillers, the variation in the softening point of the bitumen blended with the filler needs to be investigated. The EN 13179-1 Standard identifies the ring and ball delta as the difference in the softening point of a bitumen with and without filler. The mix proportion and blending method are specified in the standard.
The average results are presented in Table 8.
Table 8.
Variation in ring and ball temperature.
It is clear from the results the remarkable increase in the softening point of the bitumen due to the addition of the experimental fillers. This phenomenon is mainly due to the presence of very fine particles in the two recycled fillers, which lead to higher absorption properties [4]. However, it is worth mentioning that the test procedure was defined for common fillers with standard properties. As a consequence, mixing problems occurred during the production of test samples, making their testing hard.
3.1.7. Harmful Fines
The assessment of fines (methylene blue test) is used to evaluate the presence of fine particles in the filler. The EN 933-9 standard suggests as a detection method a methylene blue solution, which is absorbed by fines, considering that they are mainly composed of clayey minerals.
The average results are given in Table 9.
Table 9.
Methylene blue values.
Both experimental fillers show a very limited presence of clay particles, lower than the reference limestone filler. These results are remarkable, considering the proposed application of fillers within bituminous mixtures. The low presence of clayey particles is in line with the origin of these cement-based waste powders, considering that Portland cement has methylene blue values lower than 1.7 g/kg.
3.2. Asphalt Mixture Characterization
Once completed, the preliminary screening analysis on the properties of the experimental fillers and their application within bituminous mixtures was evaluated. Results are presented in the following sections.
3.2.1. Analysis of the Compactability
To improve understanding of the mixtures’ workability and compactability, two samples for each type were compacted through a gyratory compactor (EN 12697-31 [38], 210 gyrations) for the calculation of key parameters to evaluate the mixture resistance to densification and traffic loads. The compaction data collected allows us to obtain the densification and the resistive effort (shear stress) curves, which can be divided into two zones. As shown in Figure 5, the densification indexes, such as the compaction densification index (CDI) and the traffic densification index (TDI), quantify the energy needed to reduce air voids or change the volume of the asphalt mixture and can be computed through integration. Concerning resistive effort curves, the compaction force index (CFI) and the traffic force index (TFI) can be defined. Both are indicative of mix stability and describe the mix’s resistance to distortion, specifically shear resistance. These are derived through integration, where the resistive effort (w) is a function of the machine parameters and the geometric properties of the test sample, calculated under the assumption that the material behaves as perfectly viscous or plastic [39,40].
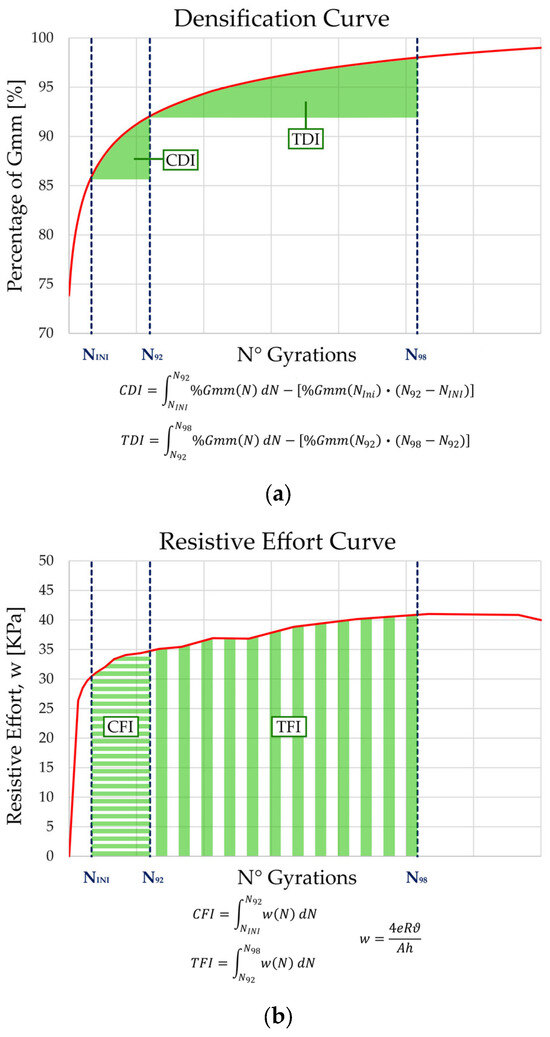
Figure 5.
Graphical explanation and formulas of indexes derived from Densification (a) and Resistive Effort (b) curves.
The regions bounded by densification or resistive effort functions and the range of gyrations from NINI (10 gyrations) to N92 (target density in construction) are identified as the “construction effort”. This represents the mix’s compactability during laying operations until it reaches an air voids value of approximately 8%. Given the same functions and the range between N92 and N98 (critical density), the identified area denotes the post-compaction action under traffic load during the pavement’s service life until achieving a final air voids value of about 2%.
Mixtures with relatively higher CDI/CFI values exhibit poor workability due to limited compaction properties, while higher TDI/TFI values are associated with mixtures characterized by better stability under traffic loads [39,40].
Finally, the locking point (LP) of the mixture is the number of gyratory cycles required to reduce the sample height by less than 0.05 mm for three consecutive cycles [39]. It indicates the energy needed to compact the mixture, and it is higher for mixtures that are more difficult to compact. Studies have shown that mixtures with a high LP are more stable, durable, and resistant to cracking and permanent deformation [41]. Typically, the LP occurs at a number of gyrations lower than NDESIGN, predicted by the Superpave design methodology criteria.
Table 10 presents the indicators aforementioned and obtained for the mixtures, while in Table 11 the values are calculated as a percentage difference (Δ) compared to the indexes obtained by the reference mixture AL.
Table 10.
Results of the densification and resistive effort indexes and LP.
Table 11.
Percentage difference of the densification and resistive effort indexes, and LP with respect to the AL mixture.
The data demonstrate that mixture AC1 exhibits better workability compared to mixture AL, as confirmed by both the CDI/CFI indices and the LP, but has a lower stability under traffic loads. On the other hand, mixture AC2 requires a higher compaction effort to reduce the air voids in the mixture but will have greater resistance during the pavement’s service life in comparison to AC1 and AL.
3.2.2. Air Void Content
The evaluation of the workability and compactability properties of the three different mixtures was based on the calculation of the air void content (Av), following the EN 12697-8 standard. For this purpose, 5 different samples for each mixture were compacted with the gyratory compactor (EN 12697-31, 80 gyrations) and tested. The average results are presented in Table 12.
Table 12.
Average air void content and density.
Overall, the mixtures show a high level of densification, considering that the Av are below 2%. In terms of difference between the fillers, a slight increase in the porosity is registered for the experimental mixtures. However, from the results it is evident that the substitution of limestone filler with AC1 or AC2 does not negatively affect the volumetric properties of the mixtures, as verified in the previous compactability analysis.
3.2.3. Indirect Tensile Strength
The indirect tensile strength test is generally performed to evaluate the cohesion properties of bituminous mixtures, being a direct indicator of the bond strength between bituminous mastic and aggregates. The test was carried out on gyratory samples (80 gyrations) after conditioning at 25 °C for 4 h, following the indications of the EN 12697-23 standard.
The average results are reported in Table 13.
Table 13.
Average Indirect Tensile Strength at 25 °C.
In terms of ITS, all the mixtures show a high level of cohesion. Despite the higher mechanical values recorded for the reference AC, the application of both experimental fillers does not lead to a significant reduction in the performance of the bituminous mixture. No difference was found between the two experimental ACs.
3.2.4. Indirect Tensile Stiffness Modulus
The evaluation of the dynamic behavior of the material is based on the indirect tensile stiffness modulus (ITSM) characterization, following the indirect tensile configuration on cylindrical samples (EN 12697-26, Annex C). Three gyratory specimens (80 gyrations) were prepared and tested. Furthermore, the tests were performed at different temperatures (10, 20, and 30 °C) in order to evaluate the thermal sensitivity of the material and its possible modification due to the filler substitution.
The average results are summarized in Table 14.
Table 14.
Average ITSM results.
In terms of thermal sensitivity, the relation between the material’s behavior and the temperature is described through the following equation:
where S is the stiffness modulus at reference temperature (T); α and β are experimental parameters related to the material. In particular, α is directly responsible for the thermal sensitivity of the material, where high values correspond to a high thermal sensitivity. The equations are represented in Figure 6.
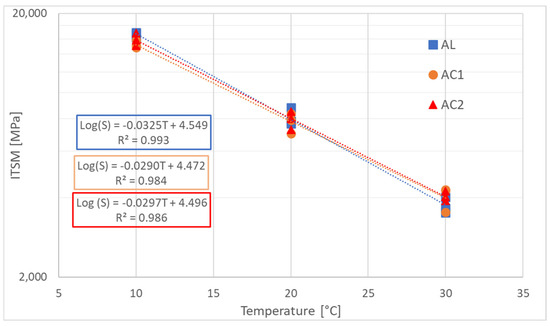
Figure 6.
ITSM results and thermal sensitivity.
From the analysis of the results, the addition of the experimental fillers does not imply a detrimental effect on the dynamic behavior of the material. The ITSM values for all the mixtures are homogeneous and comparable. In terms of thermal sensitivity, the presence of the waste fillers does not modify significantly the performance of the material, even if both experimental mixtures are slightly stiffer at high temperatures. This data could be related to a stiffening effect of the waste filler when mixed in the bitumen, as suggested by different absorption properties of the recycled fillers verified in the preliminary screening investigation on the waste powders.
3.2.5. Water Susceptibility Characterization
The filler–bitumen interaction has a key role in the moisture damage potential of bituminous mixtures. In order to evaluate the possible effects given by the addition of the experimental powders as filler in the mixture, the water susceptibility was verified through the indirect tensile strength ratio (ITSR, EN 12697-12) and Hamburg wheel tracking test (HWT, AASHTO T 324) in wet conditions.
The indirect tensile strength ratio (ITSR) is traditionally used to evaluate the water susceptibility of a bituminous mixture. Based on the EN 12697-12 standard, the ITSR is evaluated as the reduction between ITS verified on unaltered samples and samples conditioned in water for a specified range of time. In the case under study, a set of 3 samples for each mixture was placed in a water bath at 40 °C for 72 h.
The final results are shown in Table 15.
Table 15.
ITSR results.
From the results, it is evident that there is a reduction in the cohesion properties after water conditioning for the experimental mixture. However, it should be considered that the Italian technical specification for bituminous mixtures for surface layers imposes ITSR values below 75%. Thus, while AC2 exceeds this limit, AC1 is in line with the threshold ITSR value, making the water susceptibility a parameter that needs to be further investigated.
The evaluation of the rutting resistance of the different mixtures was based on the Hamburg wheel tracking (HWT) test. Following the AASHTO T 324 standard, the Hamburg wheel tracker device (Matest Spa, Treviolo, Italy) speeds up the deterioration of asphalt concrete samples, which leads to the formation of ruts, with a couple of steel wheels passing over two samples (52 ± 2 passes per minute) at 0.305 m/s. The increase in the deformation vs. the number of passes is recorded. The test ends with the achievement of a prefixed deformation (20 mm) or 20,000 passes. When the HWT test is performed with samples in a water bath, the results can be related to the water susceptibility of the material. In the case under study, the samples were submerged in a water bath at 40 °C during the test.
The results are presented in Figure 7.
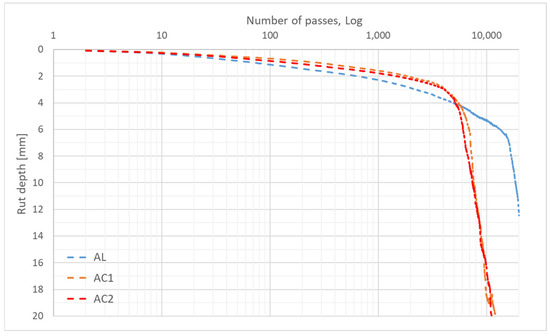
Figure 7.
HWT results.
From the results, it is clear the difference between the reference mixture and the experimental ones in terms of rutting resistance. A total deformation of 12.45 mm was recorded for the AF mixture at 20,000 passes. On the contrary, tests were interrupted between 11,000 and 12,000 passes for AC2 and AC1, respectively, due to the achievement of the maximum rut depth. From the analysis of the slopes, the trends of the rut depth for the mixtures were similar only in the post-consolidation phase, which ends after around 1000 passes. After this initial phase, the curve is generally divided into a second section, called the creep slope, and a final stage, called the stripping slope. The intercept of the creep and stripping slope is called the stripping inflection point (SIP), and it is generally used as an estimation of the moisture damage potential of bituminous mixtures.
In the case under study, the creep stage is considerably limited for the AC1 and AC2 mixture, despite the rut depth recorded for both being lower than the AF. The SIP was recorded after 5998 and 5218 passes for AC1 and AC2, respectively. At this stage, the increase in the rut depth is coupled with the progressive dislodgement of aggregate particles from the sample’s surface. For the reference mixture, despite the higher displacement rate after the post-consolidation phase, the SIP was recorded after 17,050 passes, highlighting a better resistance to water damage. These data are in line with the trend verified during the water susceptibility test (ITSR), confirming the limited performance of the bituminous mixtures in terms of moisture damage resistance.
The possible change in properties after water treatment of the waste powder was deeply investigated via infrared spectroscopy. Samples were analyzed before and after the treatment with water. Based on the results, there are no evident modifications of the intensity of the bands related to O-H symmetric and asymmetric stretching vibration of H2O moisture in the region 3600–3400 cm−1 or deformation vibration of water molecules at around 1640 cm−1 [42]. The same is true for the band centered at 1460 cm−1, attributed to the presence of CO32− from carbonates.
Visible modifications after hydration are in the “fingerprint region” containing the bands related to simple bond stretching, wagging, or bonding vibrations: in-plane and out-of-plane bending vibrations of CO32−, Si–O stretching vibrations, etc. The visible modification of the bands in these regions is due to structural changes and may be indicative of some degradation during water treatment [43].
Still, it is worth noting that immediately after the test in the water bath at 40 °C, the samples with the experimental fillers modified their coloration, as visible in Figure 8.
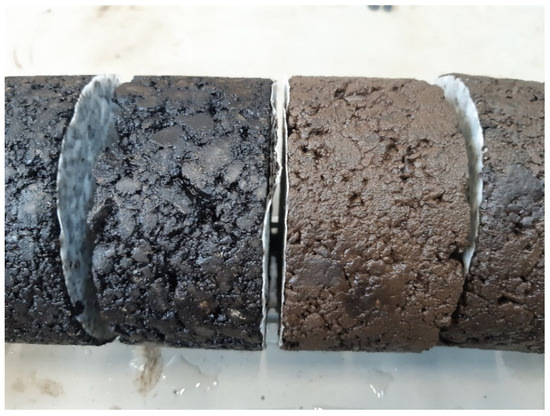
Figure 8.
Surface coloration after the water conditioning at 40 °C: AL (left) and AC1 (right) samples.
The typical black aspect of bituminous samples, observable in the reference samples in Figure 7, was modified in the experimental samples into a lighter coloration tending to brown. This phenomenon was verified for both AC1 and AC2 samples and might be related to the chemical properties of the waste powders, due to their cement-based composition. The same change in color is generally observable in cold mix asphalt (CMA) after curing, due to the interaction of bituminous emulsion and cement, and it is mainly related to the destabilization of asphalt emulsion by cement hydration [44].
4. Conclusions
In the present study, two waste powders have been tested as filler in bituminous mixtures. The materials are a blend of calcium carbonate, residue powders from the Portland cement production, polycarboxylates, and biomass ashes. In order to evaluate their possible application as filler for ACs, the materials were characterized and tested. The evaluation of the performances of the experimental mixtures was based on the comparison with a reference HMA produced with limestone filler and considering the ranges and threshold values traditionally considered for limestone fillers and ACs for surface layers.
Based on the data presented, the following conclusions can be drawn.
- Both experimental fillers have geometric characteristics in line with the range set out in EN 13043 for the maximum number of particles greater than 63 μm. However, there is a difference in the dimensions, shapes, pore volume, and specific surface area of particles between the recycled fillers and the reference one. As a consequence, the absorption properties of C1 and C2 are higher, as demonstrated in the optimum bitumen content evaluation of the experimental mixtures. Still, the RV is considerably higher than the standard values for limestone filler. This phenomenon can affect some rheological properties of the bitumen, as verified with the high variation in the softening point of the bitumen when blended with the experimental fillers.
- The addition of the waste fillers has minimal negative effect on the workability properties of the ACs. However, it is worth underlining that the OBC was different among the mixtures, due to the higher absorption power of the waste powders. Specifically, the analysis of compactability revealed that AC1 is slightly more workable than the reference mixture, whereas AC2 performed the worst among the others.
- As for the mechanical properties, the substitution of limestone filler with the waste powders does not limit the performance of the AC in terms of cohesion and stiffness. Furthermore, the thermal sensitivity of the mixture is not modified. This data is remarkable, considering the limited presence of CaCO3 in the recycled fillers and so a predictable lower compatibility with bitumen.
- The low ITSR, especially clear for AC1, and the early SIP recorded for both experimental mixtures during the HWT tests showed that the moisture damage potential of the bituminous mixtures is seriously increased by the use of C1 and C2 as filler. This phenomenon, as suggested by the change in color of the samples after the water conditioning, should be related to the hydration of the waste fillers, being of cement-based formation.
- The laboratory characterization of the waste fillers and the HMAs showed advantages and downsides in the use of the recycled powders for ACs production. The water damage potential is for sure a limit that must be overcome for a possible application of the waste materials as filler for bituminous mixtures. Some chemical treatments might be applied in order to limit the possible still active hydration of the cement-based waste powder. Still, the obtained results can also be useful indications for other possible experimental applications and future studies of these recycled powders in the road construction sector. As an example, if the reactivity of the waste powders is confirmed, it might be used as a total or partial replacement of Portland cement in the production of cold mix asphalts with bituminous emulsion.
Author Contributions
Conceptualization, P.T., R.V. and C.O.R.; methodology, P.T., R.V. and C.O.R.; validation, P.T., R.V. and C.O.R.; formal analysis, Y.G., G.T., P.C. and M.D.R.; investigation, Y.G., G.T., P.C. and M.D.R.; resources, C.O.R.; data curation, P.T. and P.C.; writing—original draft preparation, P.T., G.T., P.C. and M.D.R.; writing—review and editing, P.T., G.T., P.C., M.D.R. and C.O.R.; supervision, P.T., R.V. and C.O.R. All authors have read and agreed to the published version of the manuscript.
Funding
This research received no external funding.
Institutional Review Board Statement
Not applicable.
Informed Consent Statement
Not applicable.
Data Availability Statement
Data are available on request from the corresponding author.
Acknowledgments
The authors want to thank Filippo Balzano for his contribution in the laboratory investigation regarding the mixtures’ analysis of compactability. The authors are thankful to the CAL.ME. S.p.A., Italy, for providing fillers and analysis support.
Conflicts of Interest
Author Giulia Tarsi was employed by the company Pesaresi Giuseppe SpA. The remaining authors declare that the research was conducted in the absence of any commercial or financial relationships that could be construed as a potential conflict of interest.
References
- EN 13043; BSI Standards Publication—Aggregates for Bituminous Mixtures and Surface Treatments for Roads, Airfields and Other Trafficked Areas. BSI: London, UK, 2013.
- Wu, W.; Jiang, W.; Yuan, D.; Lu, R.; Shan, J.; Xiao, J.; Ogbon, A.W. A review of asphalt-filler interaction: Mechanisms, evaluation methods, and influencing factors. Constr. Build. Mater. 2021, 299, 124279. [Google Scholar] [CrossRef]
- Xing, B.; Fang, C.; Lyu, X.; Fan, W.; Lyu, Y. Influence of mineral filler characteristics on the filler–asphalt interfacial behavior. Adv. Powder Technol. 2024, 35, 104636. [Google Scholar] [CrossRef]
- De Pascale, B.; Tarsi, G.; Tataranni, P.; Sangiorgi, C. Potential application of waste bivalve shells as recycled filler in porous asphalt concrete through rheo-mechanical analysis. Resour. Conserv. Recycl. 2024, 209, 107830. [Google Scholar] [CrossRef]
- Caroscio, L.; De Pascale, B.; Tataranni, P.; Chiavetta, C.; Lantieri, C.; Bonoli, A. Preliminary study on the application of waste bivalve shells as biofiller for the production of asphalt concrete. Clean. Eng. Technol. 2024, 20, 100743. [Google Scholar] [CrossRef]
- Chen, Y.; Xu, S.; Tebaldi, G.; Romeo, E. Role of mineral filler in asphalt mixture. Road Mater. Pavement Des. 2020, 23, 247–286. [Google Scholar] [CrossRef]
- Grabowski, W.; Wilanowicz, J. The structure of mineral fillers and their stiffening properties in filler-bitumen mastics. Mater. Struct. 2008, 41, 793–804. [Google Scholar] [CrossRef]
- Diab, A.; Enieb, M. Investigating influence of mineral filler at asphalt mixture and mastic scales. Int. J. Pavement Res. Technol. 2018, 11, 213–224. [Google Scholar] [CrossRef]
- Varveri, A.; Jing, R.; Tarsi, G.; Erkens, S. Effect of filler properties on the hydrothermal ageing of bituminous mastics. Road Mater. Pavement Des. 2021, 22, S2–S22. [Google Scholar] [CrossRef]
- Zulkati, A.; Diew, W.Y.; Delai, D.S. Effects of fillers on properties of asphalt-concrete mixture. J. Transp. Eng. 2012, 138, 902–910. [Google Scholar] [CrossRef]
- Alvarez, A.E.; Ovalles, E.; Caro, S. Assessment of the effect of mineral filler on asphalt-aggregate interfaces based on thermodynamic properties. Constr. Build. Mater. 2012, 28, 599–606. [Google Scholar] [CrossRef]
- Pasandín, A.; Pérez, I. The influence of the mineral filler on the adhesion between aggregates and bitumen. Int. J. Adhes. Adhes. 2015, 58, 53–58. [Google Scholar] [CrossRef]
- European Asphalt Pavement Association—EAPA. Asphalt in Figures 2020; EAPA: Brussels, Belgium, 2022. [Google Scholar]
- Eurostat—EU Commission. Length of Motorways and E-Roads. 2022. Available online: https://ec.europa.eu/eurostat/databrowser/view/road_if_motorwa__custom_11520463/default/table?lang=en (accessed on 3 August 2022).
- Eurostat—EU Commission. Total Road by Type of Surface. 2022. Available online: https://share.google/GC2K7yhj6CJus98Dt (accessed on 3 August 2022).
- Choudhary, J.; Kumar, B.; Gupta, A. Utilization of solid waste materials as alternative fillers in asphalt mixes: A review. Constr. Build. Mater. 2020, 234, 117271. [Google Scholar] [CrossRef]
- Ahmed, H.Y.; Othman, A.M.; Mahmoud, A.A. Effect of using waste cement dust as a mineral filler on the mechanical properties of hot mix asphalt. Ass. Univ. Bull. Environ. Res. 2006, 9, 51–60. [Google Scholar]
- Abed, A.; Eyada, S. The Use of Cement Production Waste to Improve the Properties of Hot Mix Asphalt Concrete. Jordan J. Civ. Eng. 2019, 13, 394–404. [Google Scholar] [CrossRef]
- Wang, J.; Guo, M.; Tan, Y. Study on application of cement substituting mineral fillers in asphalt mixture. Int. J. Transp. Sci. Technol. 2018, 7, 189–198. [Google Scholar] [CrossRef]
- Likitlersuang, S.; Chompoorat, T. Laboratory investigation of the performances of cement and fly ash modified asphalt concrete mixtures. Int. J. Pavement Res. Technol. 2016, 9, 337–344. [Google Scholar] [CrossRef]
- EN 1426:2024; Bitumens and Bituminous Binders. Determination of Needle Penetration. European Committee for Standardization (CEN): Brussels, Belgium, 2024.
- EN 1427:2015; Bitumen and Bituminous Binders. Determination of the Softening Point. Ring and Ball Method. European Committee for Standardization (CEN): Brussels, Belgium, 2015.
- EN 12596:2023; Bitumen and Bituminous Binders. Determination of Dynamic Viscosity by Vacuum Capillary. European Committee for Standardization (CEN): Brussels, Belgium, 2023.
- EN 12697-8:2018; Bituminous Mixtures. Test Methods. Determination of Void Characteristics of Bituminous Specimens. European Committee for Standardization (CEN): Brussels, Belgium, 2018.
- EN 12697-23:2017; Bituminous Mixtures. Test Methods. Determination of the Indirect tensile Strength of Bituminous Specimens. European Committee for Standardization (CEN): Brussels, Belgium, 2017.
- EN 13043:2013; Aggregates for Bituminous Mixtures and Surface Treatments for Roads, Airfields and Other Trafficked Area. European Committee for Standardization (CEN): Brussels, Belgium, 2013.
- EN 1097-5:2008; Tests for Mechanical and Physical Properties of Aggregates. Determination of the Water Content by Drying in a Ventilated Oven. European Committee for Standardization (CEN): Brussels, Belgium, 2008.
- EN 1097-7:2022; Tests for Mechanical and Physical Properties of Aggregates. Determination of the Particle Density of Filler. Pyknometer Method. European Committee for Standardization (CEN): Brussels, Belgium, 2022.
- EN 1097-4:2008; Tests for Mechanical and Physical Properties of Aggregates. Determination of the Voids of Dry Compacted Filler. European Committee for Standardization (CEN): Brussels, Belgium, 2008.
- EN 13179-1:2013; Tests for Filler Aggregate Used in Bituminous Mixtures. Delta Ring and Ball Test. European Committee for Standardization (CEN): Brussels, Belgium, 2013.
- EN 933-9:2022; Tests for Geometrical Properties of Aggregates. Assessment of Fines. Methylene Blue Test. European Committee for Standardization (CEN): Brussels, Belgium, 2022.
- Bahia, H.U.; Friemel, T.P.; Peterson, P.A.; Russell, J.S.; Poehnelt, B. Optimization of constructibility and resistance to traffic: A new design approach for HMA using the superpave compactor. J. Assoc. Asph. Paving Technol. 1998, 67. [Google Scholar]
- Fattah, M.Y.; Hilal, M.M.; Flyeh, H.B. Evaluation of the mechanical stability of asphalt mixture using the gyratory compactor. Int. J. Pavement Res. Technol. 2019, 12, 508–518. [Google Scholar] [CrossRef]
- EN 12697-26:2018+A1:2022; Bituminous Mixtures. Test Methods. Stiffness. European Committee for Standardization (CEN): Brussels, Belgium, 2022.
- EN 12697-12:2018; Bituminous Mixtures. Test Methods. Determination of the Water Sensitivity of Bituminous Specimens. European Committee for Standardization (CEN): Brussels, Belgium, 2018.
- AASHTO T 324-19; Hamburg Wheel Track Testing of Compacted Asphalt Mixtures. American Association of State Highway and Transportation Officials: Washington, DC, USA, 2019.
- E, G.; Zhang, J.; Shen, Q.; Ji, P.; Wang, J.; Xiao, Y. Influence of Filler Type and Rheological Properties of Asphalt Mastic on the Asphalt Mastic–Aggregate Interaction. Materials 2023, 16, 574. [Google Scholar] [CrossRef]
- EN 12697-31:2019; Bituminous Mixtures. Test Methods. Specimen Preparation by Gyratory Compactor. European Committee for Standardization (CEN): Brussels, Belgium, 2019.
- Vaiana, R.; Iuele, T.; Gallelli, V.; Tighe, S.L. Warm mix asphalt by water-containing methodology: A laboratory study on workability properties versus micro-foaming time. Can. J. Civ. Eng. 2014, 41, 183–190. [Google Scholar] [CrossRef]
- Al Shamsi, K.; Mohammad, L. Laboratory Optimization of Asphalt Concrete Mixture Design. In Proceedings of the Third Gulf Conference on Roads, Muscat, Oman, 6–8 March 2006. [Google Scholar]
- Dessouky, S.; Diaz, M. Evaluation of Asphalt Mixes Workability and Compactability Using Laboratory and Accelerated Field Testing. In Proceedings of the TMS Middle East—Mediterranean Materials Congress on Energy and Infrastructure Systems (MEMA 2015); Karaman, I., Arróyave, R., Masad, E., Eds.; Springer: Cham, Switzerland, 2015. [Google Scholar] [CrossRef]
- Horgnies, M.; Chen, J.J.; Bouillon, C. Overview about the use of Fourier Transform Infrared spectroscopy to study cementitious materials. In Proceedings of the 6th International Conference on Computational Methods and Experiments in Materials Characterization, WIT Transactions on Engineering Sciences, Siena, Italy, 4–6 June 2013; Volume 77. [Google Scholar] [CrossRef]
- Kusuma, H.S.; Agung, A.M.S.; Putri, N.A.; Shifu, M.; Illiyanasafa, N.; Widyaningrum, B.A.; Amenaghawon, A.N.; Darmokoesoemo, H. Production and characterization of eco-cement using eggshell powder and water hyacinth ash. Hybrid Adv. 2025, 9, 100403. [Google Scholar] [CrossRef]
- Fang, L.; Zhou, J.; Yang, Z.; Yuan, Q.; Que, Y. Interaction between cement and asphalt emulsion and its influences on asphalt emulsion demulsification, cement hydration and rheology. Constr. Build. Mater. 2022, 329, 127220. [Google Scholar] [CrossRef]
Disclaimer/Publisher’s Note: The statements, opinions and data contained in all publications are solely those of the individual author(s) and contributor(s) and not of MDPI and/or the editor(s). MDPI and/or the editor(s) disclaim responsibility for any injury to people or property resulting from any ideas, methods, instructions or products referred to in the content. |
© 2025 by the authors. Licensee MDPI, Basel, Switzerland. This article is an open access article distributed under the terms and conditions of the Creative Commons Attribution (CC BY) license (https://creativecommons.org/licenses/by/4.0/).