Article

Influence of Loadshedding on Air Quality: A South African Scenario

1
Earth Observation Directorate, South African National Space Agency, Pretoria 0001, South Africa
2
School of Geography, Archaeology and Environmental Studies, University of the Witwatersrand, Johannesburg 2050, South Africa
*
Author to whom correspondence should be addressed.
Sustainability 2025, 17(19), 8758; https://doi.org/10.3390/su17198758
Submission received: 26 June 2025 / Revised: 23 September 2025 / Accepted: 28 September 2025 / Published: 29 September 2025
(This article belongs to the Special Issue Air Pollution and Sustainability)

Abstract

In many developing countries, including South Africa, electricity providers have consistently faced challenges in meeting rising energy demands. Since 2008, South Africa has implemented widespread electricity rationing—commonly referred to as “loadshedding”—due to a combination of operational inefficiencies and structural constraints. Loadshedding continues to be a critical challenge in South Africa, significantly affecting the economy, livelihoods, public health, and broader socio-economic conditions. This study explores the link between loadshedding and air quality by analyzing atmospheric emissions during two contrasting periods: 2019, a year with minimal loadshedding; and 2023, which experienced severe and prolonged outages. The analysis reveals a decline in nitrogen dioxide (NO2) and sulfur dioxide (SO2) levels during the intense loadshedding period of 2023. The results indicate that, beyond the influence of weather patterns, reductions in emissions—such as those caused by decreased electricity generation—contribute meaningfully to improved air quality. Overall, the data suggest that reduced power production during high levels of loadshedding links with lower emissions and enhanced air quality. These findings reinforce the potential benefits of transitioning to cleaner, alternative energy sources for achieving long-term reductions in air pollution and fostering a healthier environment. Remote sensing is a critical tool for environmental monitoring in developing countries, offering cost-effective, wide-area data collection to address issues like air pollution, and climate impact. It supports policy-making by providing timely, objective insights for sustainable development, resource management, and disaster response, aligning with SDGs.

1. Introduction

In numerous developing nations, including South Africa, power utilities have consistently faced challenges in meeting rising energy needs [1,2]. Since 2008, South Africa has implemented widespread electricity rationing, known as “load shedding,” due to a range of operational and structural issues. These include inadequate maintenance (both planned and unplanned) [3], excessive demand [4], corruption, internal mismanagement, design flaws, shifting capital expenditure priorities, poor coal quality, and cable theft [3,5,6]. Eskom, the state-owned energy utility, defines loadshedding as a deliberate reduction in electricity supply by temporarily turning off distribution in specific areas to protect the national grid [7].
Loadshedding has escalated in both frequency and severity. In 2008, rotational power outages reached 4000 MW over four-hour periods, but, by December 2019, Stage 6 was implemented, reducing up to 6000 MW for as long as six hours daily [8]. By 2023, many South Africans were experiencing Stage 4 loadshedding, roughly four hours of electricity loss every day [9]. For over 16 years, daily power cuts have become a normal part of life, with wide-ranging implications for the country.
While the economic, political, and social impacts of loadshedding are well documented [10], less attention has been paid to its environmental effects, especially on air quality. This is a significant gap, given South Africa’s heavy dependence on coal-fired power stations, which emit large volumes of sulfur dioxide (SO2) and nitrogen dioxide (NO2) [11]. These pollutants are directly linked to respiratory illnesses and cardiovascular diseases and remain key indicators of poor air quality [12]. A prior study [13] estimates that air pollution contributes to 36% of lung cancer deaths, 34% of stroke deaths, and 27% of heart disease deaths, underscoring the severe health risks of exposure to polluted air.
In this context, the United Nations Sustainable Development Goals (SDGs) offer a valuable framework for understanding wider implications. SDG 3 (“Good Health and Well-Being”) and SDG 11 (“Sustainable Cities and Communities”) advocate for reducing exposure to harmful pollutants, while SDG 13 (“Climate Action”) encourages strategies to combat air pollution [14]. Poor air quality, particularly in areas reliant on coal-based power generation, poses risks to ecological systems [15] and public health, especially for vulnerable groups like children, the elderly, and individuals with pre-existing conditions [16].
South Africa’s SO2 emissions, entirely human-induced, saw a 15% reduction in 2019, the lowest in 15 years, yet levels remain concerningly high. Initial findings suggest this decline may align with loadshedding events, possibly due to decreased energy output, though the relationship is intricate and requires further study. Emalahleni, in Mpumalanga, is at the core of the Highveld Priority Area (HPA), established in 2007 for consistently exceeding National Ambient Air Quality Standards (NAAQS), and is recognized as a global hotspot for sulfur and nitrogen oxides [17]. Power stations like Duvha, Kendal, and Kriel, located near or within Emalahleni, significantly contribute to elevated SO2 levels. The HPA’s closeness to Gauteng, South Africa’s most populous province, heightens public health risks. Likewise, Lephalale in Limpopo Province falls within the Waterberg-Bojanala Priority Area (WBPA), designated in 2012 to tackle air quality issues from coal-fired power generation and industrial activities [17]. Despite these regulatory measures, in April 2020, the South African government doubled the permissible SO2 emission limits for coal power plants, citing high compliance costs from utilities like Eskom and Sasol, even as pollution in these priority areas remained severe [18].
The potential silver lining is that loadshedding could unintentionally reduce pollutant emissions during periods of lower energy production. Understanding this relationship could open avenues for sustainable energy transition and emission mitigation strategies.
Satellite-based remote sensing (RS) has become an essential and cost-effective approach for monitoring atmospheric pollution, offering wide spatial coverage and consistent, repeatable measurements over time. In recent years, instruments, such as the Ozone Monitoring Instrument (OMI) and the Tropospheric Monitoring Instrument (TROPOMI) aboard the Sentinel-5P satellite, have enabled the near-daily high-resolution detection of key air pollutants, including SO2 and NO2 [19,20]. These satellite-based measurements are particularly valuable in regions with limited ground-based monitoring infrastructure, such as many areas in South Africa, where they serve as an important supplement to national monitoring systems like the South African Air Quality Information System (SAAQIS). The integration of remote sensing with in situ data enhances the country’s ability to assess air pollution trends, evaluate policy effectiveness, and respond to environmental health risks in both urban and industrialized areas.
Air quality is also influenced by meteorological conditions such as temperature, wind speed, wind direction, and precipitation. Wind can transport pollutants over large distances, while rain can remove particles from the atmosphere. Temperature affects the chemical reactivity and vertical mixing of pollutants in the atmosphere, often enhancing the formation of secondary pollutants under warmer conditions. Therefore, interpreting emission patterns without accounting for meteorological variables could lead to misleading conclusions. In this study, meteorological data will be incorporated to better understand the dispersion and concentration of pollutants during and after loadshedding periods.
This study seeks to examine the link between loadshedding and air quality by comparing atmospheric emissions during two distinct periods: 2019, with minimal loadshedding; and 2023, characterized by intense and extended loadshedding. It focuses on assessing changes in key pollutants, specifically SO2 and NO2, while accounting for meteorological factors such as temperature and precipitation. The study will utilize remote sensing data to analyze the spatiotemporal patterns of these pollutants during significant loadshedding periods. Additionally, it investigates correlations between energy production, emissions, and environmental conditions in two major industrial regions, Lephalale and Emalahleni, to gain deeper insights into the environmental consequences of South Africa’s energy crisis.

2. Study Area

In South Africa, air pollution is more prevalent in the regions where power stations are located, namely Mpumalanga, which has twelve power stations and Limpopo with two (see Figure 1) [21]. The regions of interest for this study are Nkangala in the Mpumalanga province (23.6° S, 28° E) which consists of 8 power stations, namely Kusile, Duvha, Arnot, Matla, Kriel, Kendal, Komati and Matla. Lephalale in the Limpopo province (23.66° S, 27.74° E) consists of two power stations namely, Medupi and Matimba [22,23]. The presence of these power stations is closely linked to the occurrence of rich coal deposits found on the northeast side of the country [24]. Emalahleni has about 22 collieries contributing more than 80% of coal produced in South Africa which supplies the neighboring power stations [25]. Grootgeluk mine is the main source of coal for both Matimba and Medupi in Lephalale [26,27]. In addition to coal mining and electricity generation, Lephalale and eMalahleni also have thriving agricultural and tourism sectors that contribute significantly to the country’s GDP [28,29].
Lephalale’s climate features dry winters and hot summers, with annual temperatures ranging from 7 °C to 32 °C [30]. In eMalahleni, temperatures in summer typically range from 12 C and 29 C, while winter lows can reach −3 °C [31]. These weather patterns, combined with anthropogenic activities, contribute to seasonal peaks in air pollution particularly in winter (June–August) due to increased domestic fuel burning, and in spring (September–November) as a result of wildfires and biomass burning [32,33].

3. Data and Methods

3.1. Sentinel-5P (TROPOMI)

Sentinel-5P is a satellite designed to monitor and provide data on atmospheric trace gases, aerosols, and cloud distribution, which are critical for understanding air quality and climate dynamics. It is equipped with the TROPOspheric Monitoring Instrument (TROPOMI), a hyperspectral imaging spectrometer that measures Earth’s radiance across multiple spectral bands, including ultraviolet–visible, near-infrared, and shortwave infrared, with a high spatial resolution of 7.0 km × 3.5 km per ground pixel. TROPOMI’s 2600 km swath width enables near-daily global coverage. The instrument detects various trace gases, including, methane, ozone, nitrogen dioxide (NO2), sulfur dioxide (SO2), carbon monoxide (CO), formaldehyde, and aerosols. More specifics on Sentinel-5P are accessible in Theys et al. [34], Tilstra et al. [35], and Verhoelst et al. [36]. This study focuses on utilizing the NO2 and SO2 data products.

3.2. Atmospheric Infrared Sounder (AIRS)

The Atmospheric Infrared Sounder (AIRS) is a hyperspectral instrument developed to support climate research on greenhouse gases and enhance the accuracy of weather forecasting. AIRS incorporates a cross-track scanning spectrometer with 2378 infrared (IR) channels spanning the spectral ranges of 3.74–4.61 µm, 6.20–8.22 µm, and 8.8–15.5 µm, which are essential for profiling atmospheric temperature and relative humidity. It also features four visible (VIS) and near-infrared (NIR) channels covering 0.40–0.94 μm, mainly for detecting clouds in the IR field of view. The instrument delivers an IR spatial resolution of 13.5 km horizontally and 1 km vertically, while the VIS/NIR channels provide a spatial resolution of approximately 2.3 km. Additional technical details are available in Aumann and Miller [37], Chahine et al. [38], and Menzel et al. [39]. This study employs surface temperature data derived from AIRS.

3.3. Global Precipitation Measurement (GPM)

The Global Precipitation Measurement (GPM) mission consists of a network of satellites that provides thorough global observations of snow and rain [40]. It advances our knowledge of Earth’s water and energy cycles, enhances predictions of extreme weather and associated natural hazards, and promotes the application of precise, real-time precipitation information for societal advantages [41]. In 2014, NASA and the Japan Aerospace Exploration Agency (JAXA) launched the GPM Core Observatory (GPM-CO), which is engineered to quantify rainfall rates from 0.2 to 110 mm per hour, identify moderate to intense snowfall, and serve as a research platform for precipitation studies [42]. More facts on the GPM mission are discussed in references [42,43]. This study employed the precipitation rate product.
A brief description of the products used in the study is presented in Table 1.

3.4. Pearson’s Correlation

Pearson’s correlation coefficient (r) quantifies the strength and direction of a linear relationship between two variables, with possible values ranging from −1 to +1. A positive r value signifies that the variables increase or decrease in tandem, whereas a negative value indicates an inverse relationship—when one variable increases, the other decreases. Values near zero imply a weak or nonexistent linear correlation, while those approaching −1 or +1 suggest a strong linear connection [44].
This study utilized Pearson correlation analysis to evaluate the relationships between meteorological variables and vegetation parameters. The variables analyzed included loadshedding stages (LS), precipitation (PRECIP), nitrogen dioxide (NO2), sulfur dioxide (SO2), and surface temperature (TEMP).
The correlation coefficient ( r ) of the random variables x and y is defined by Equation (1) as
r = ( x i x ¯ ) ( y i y ¯ ) ( x i x ¯ ) 2 ( y i y ¯ ) 2
where r is the correlation coefficient, variables x i and y i represent values for each respective variable x and y , respectively, and x ¯ and y ¯ are mean values of the x and y variables, respectively. More information on the Pearson correlation test can be found in Benesty et al. [45].

4. Results

4.1. Loadshedding Stages Timeseries

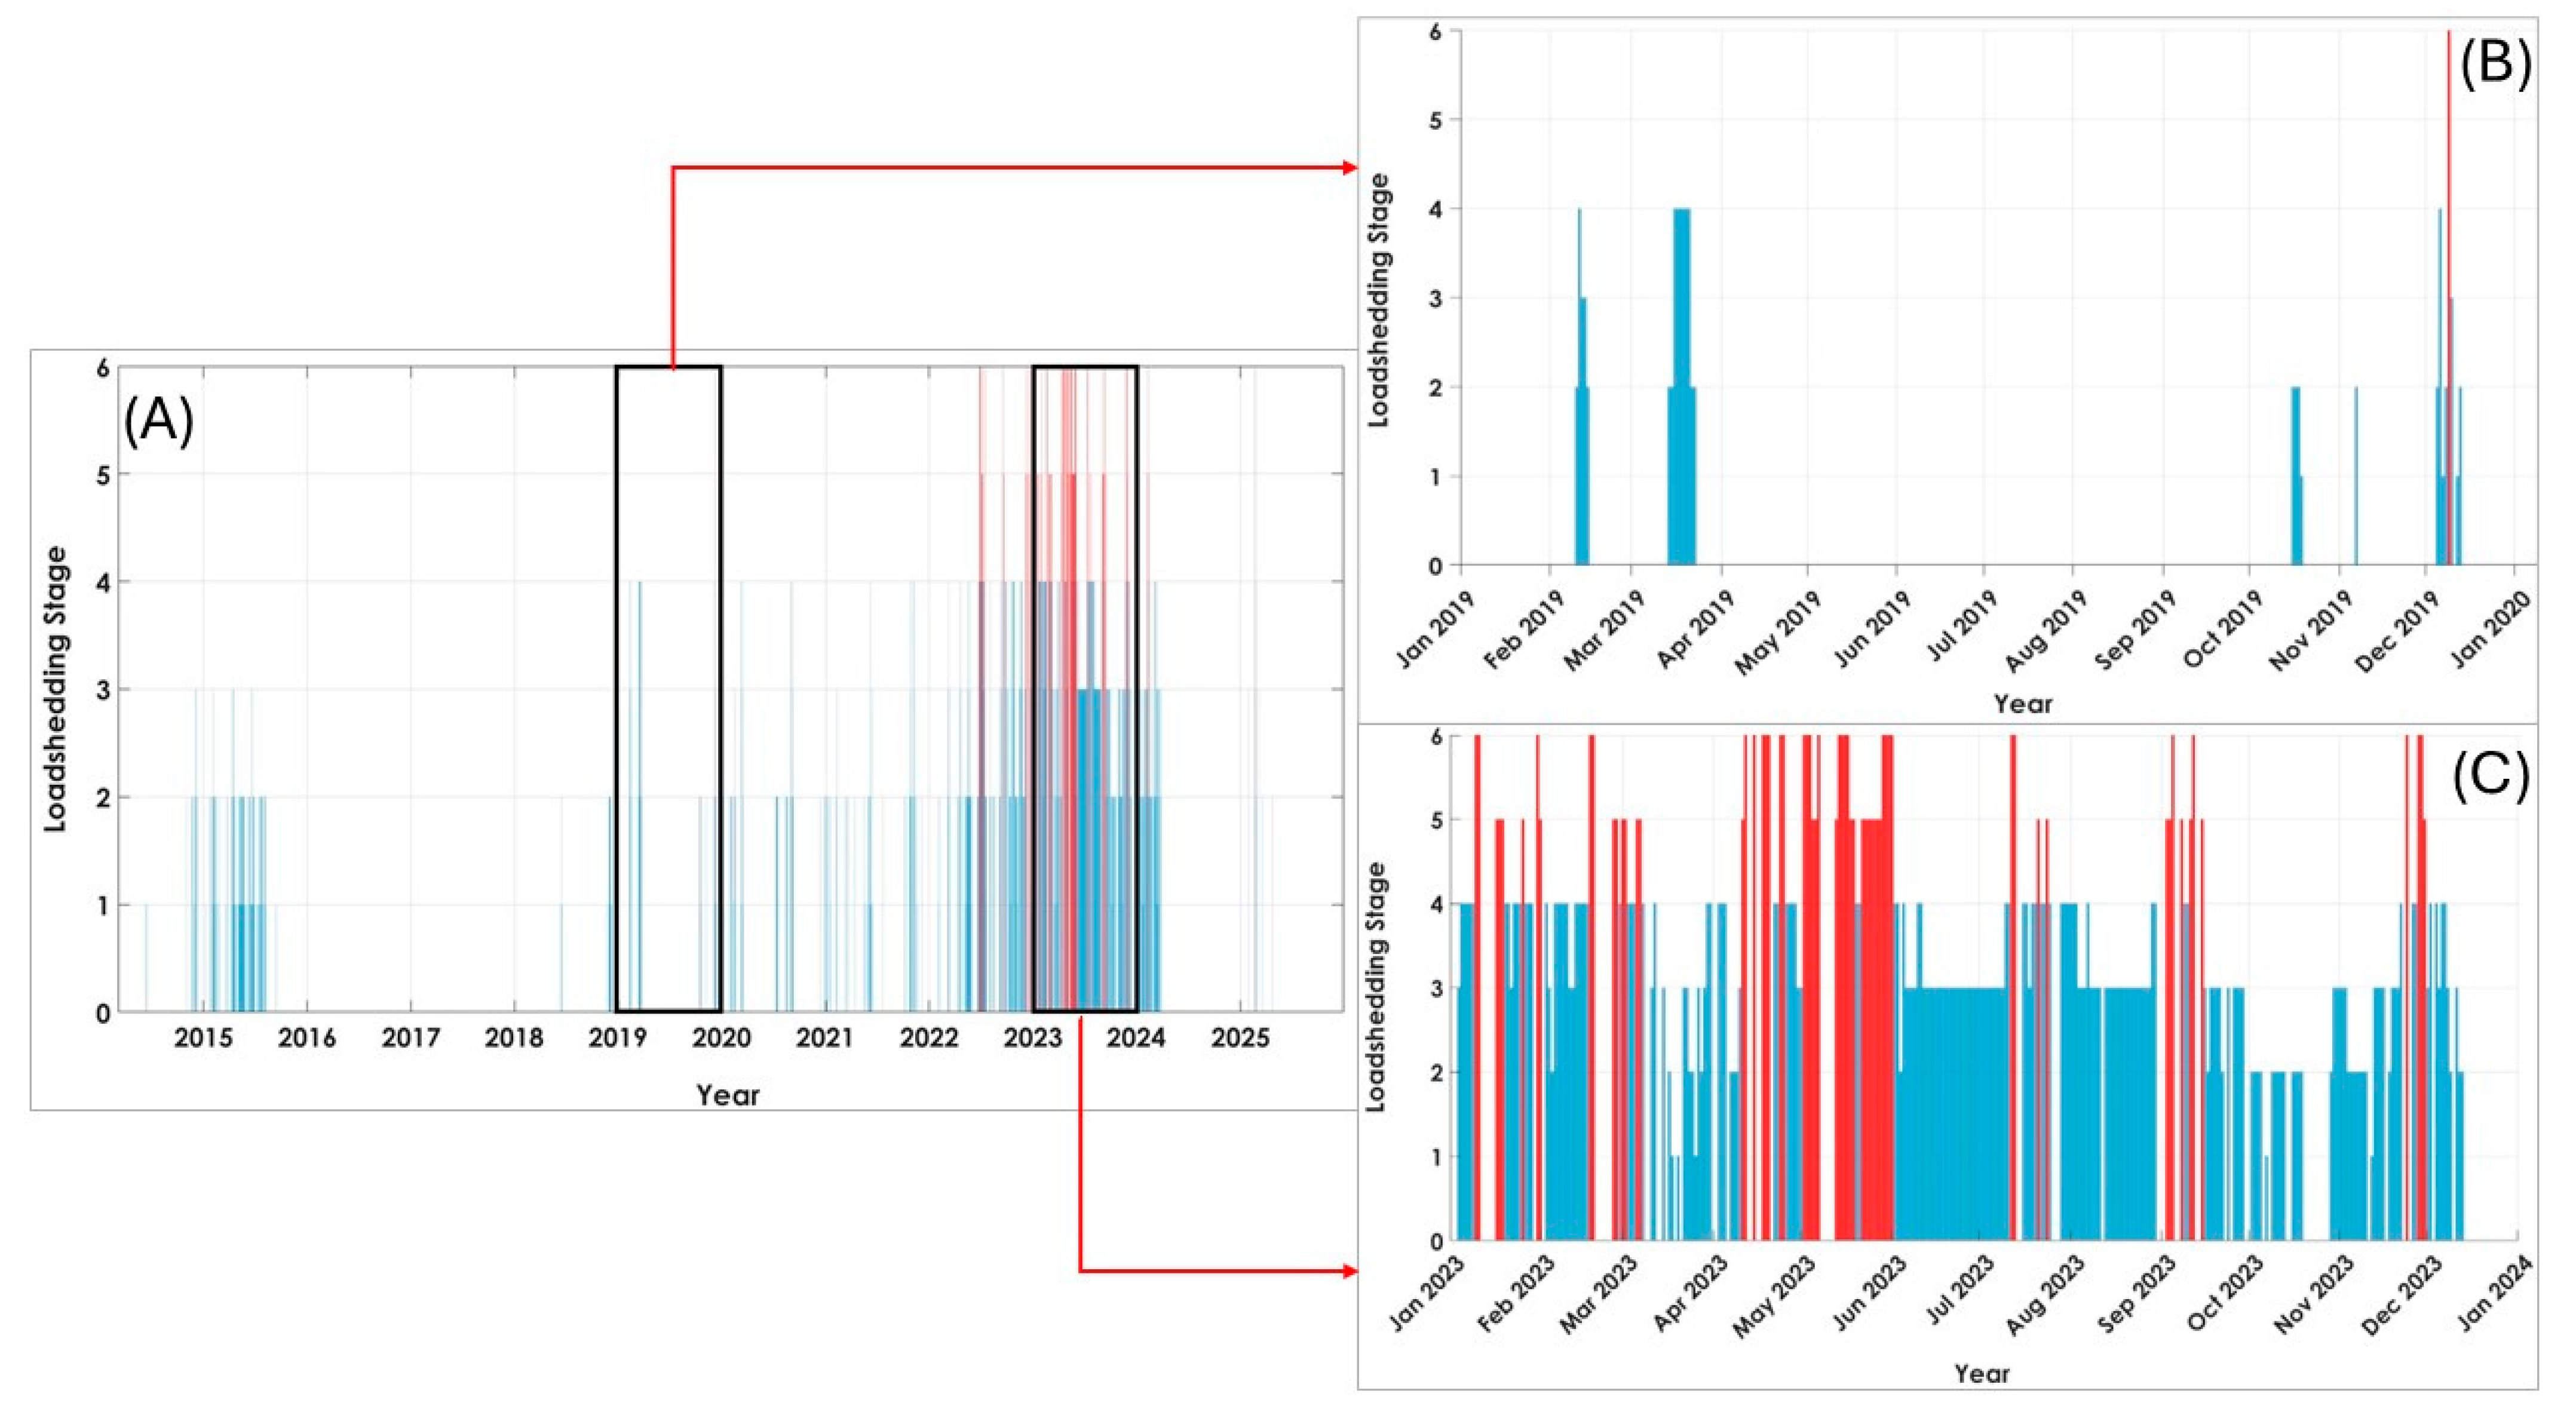
Figure 2 depicts the progression of loadshedding stages experienced in South Africa from 2015 to 2023. In 2015, moderate loadshedding at stages 2 and 3 was recorded, primarily due to operational failures at several power stations. From 2016 to 2018, no loadshedding was implemented, largely as a result of increased electricity generation capacity, improved energy availability, and the successful execution of Eskom’s maintenance program. In 2019, as shown in Figure 2B, the country experienced a relatively low number of loadshedding incidents. However, when implemented, the stages ranged from moderate (2–3) to high (4–6), reflecting underlying pressure on the electricity generation system that posed a risk to the national grid. The year 2023 marked the most severe period, with loadshedding occurring on 335 days—often at higher stages. This indicates that a substantial portion of the year was affected by power outages due to the ongoing electricity crisis. The most intense loadshedding events, with stages exceeding 5, occurred between May and June. Key contributing factors included reduced energy availability at power stations, rising electricity demand, and prolonged outages at major generating units.

4.2. NO2 and SO2 Concentrations in 2019 and 2023

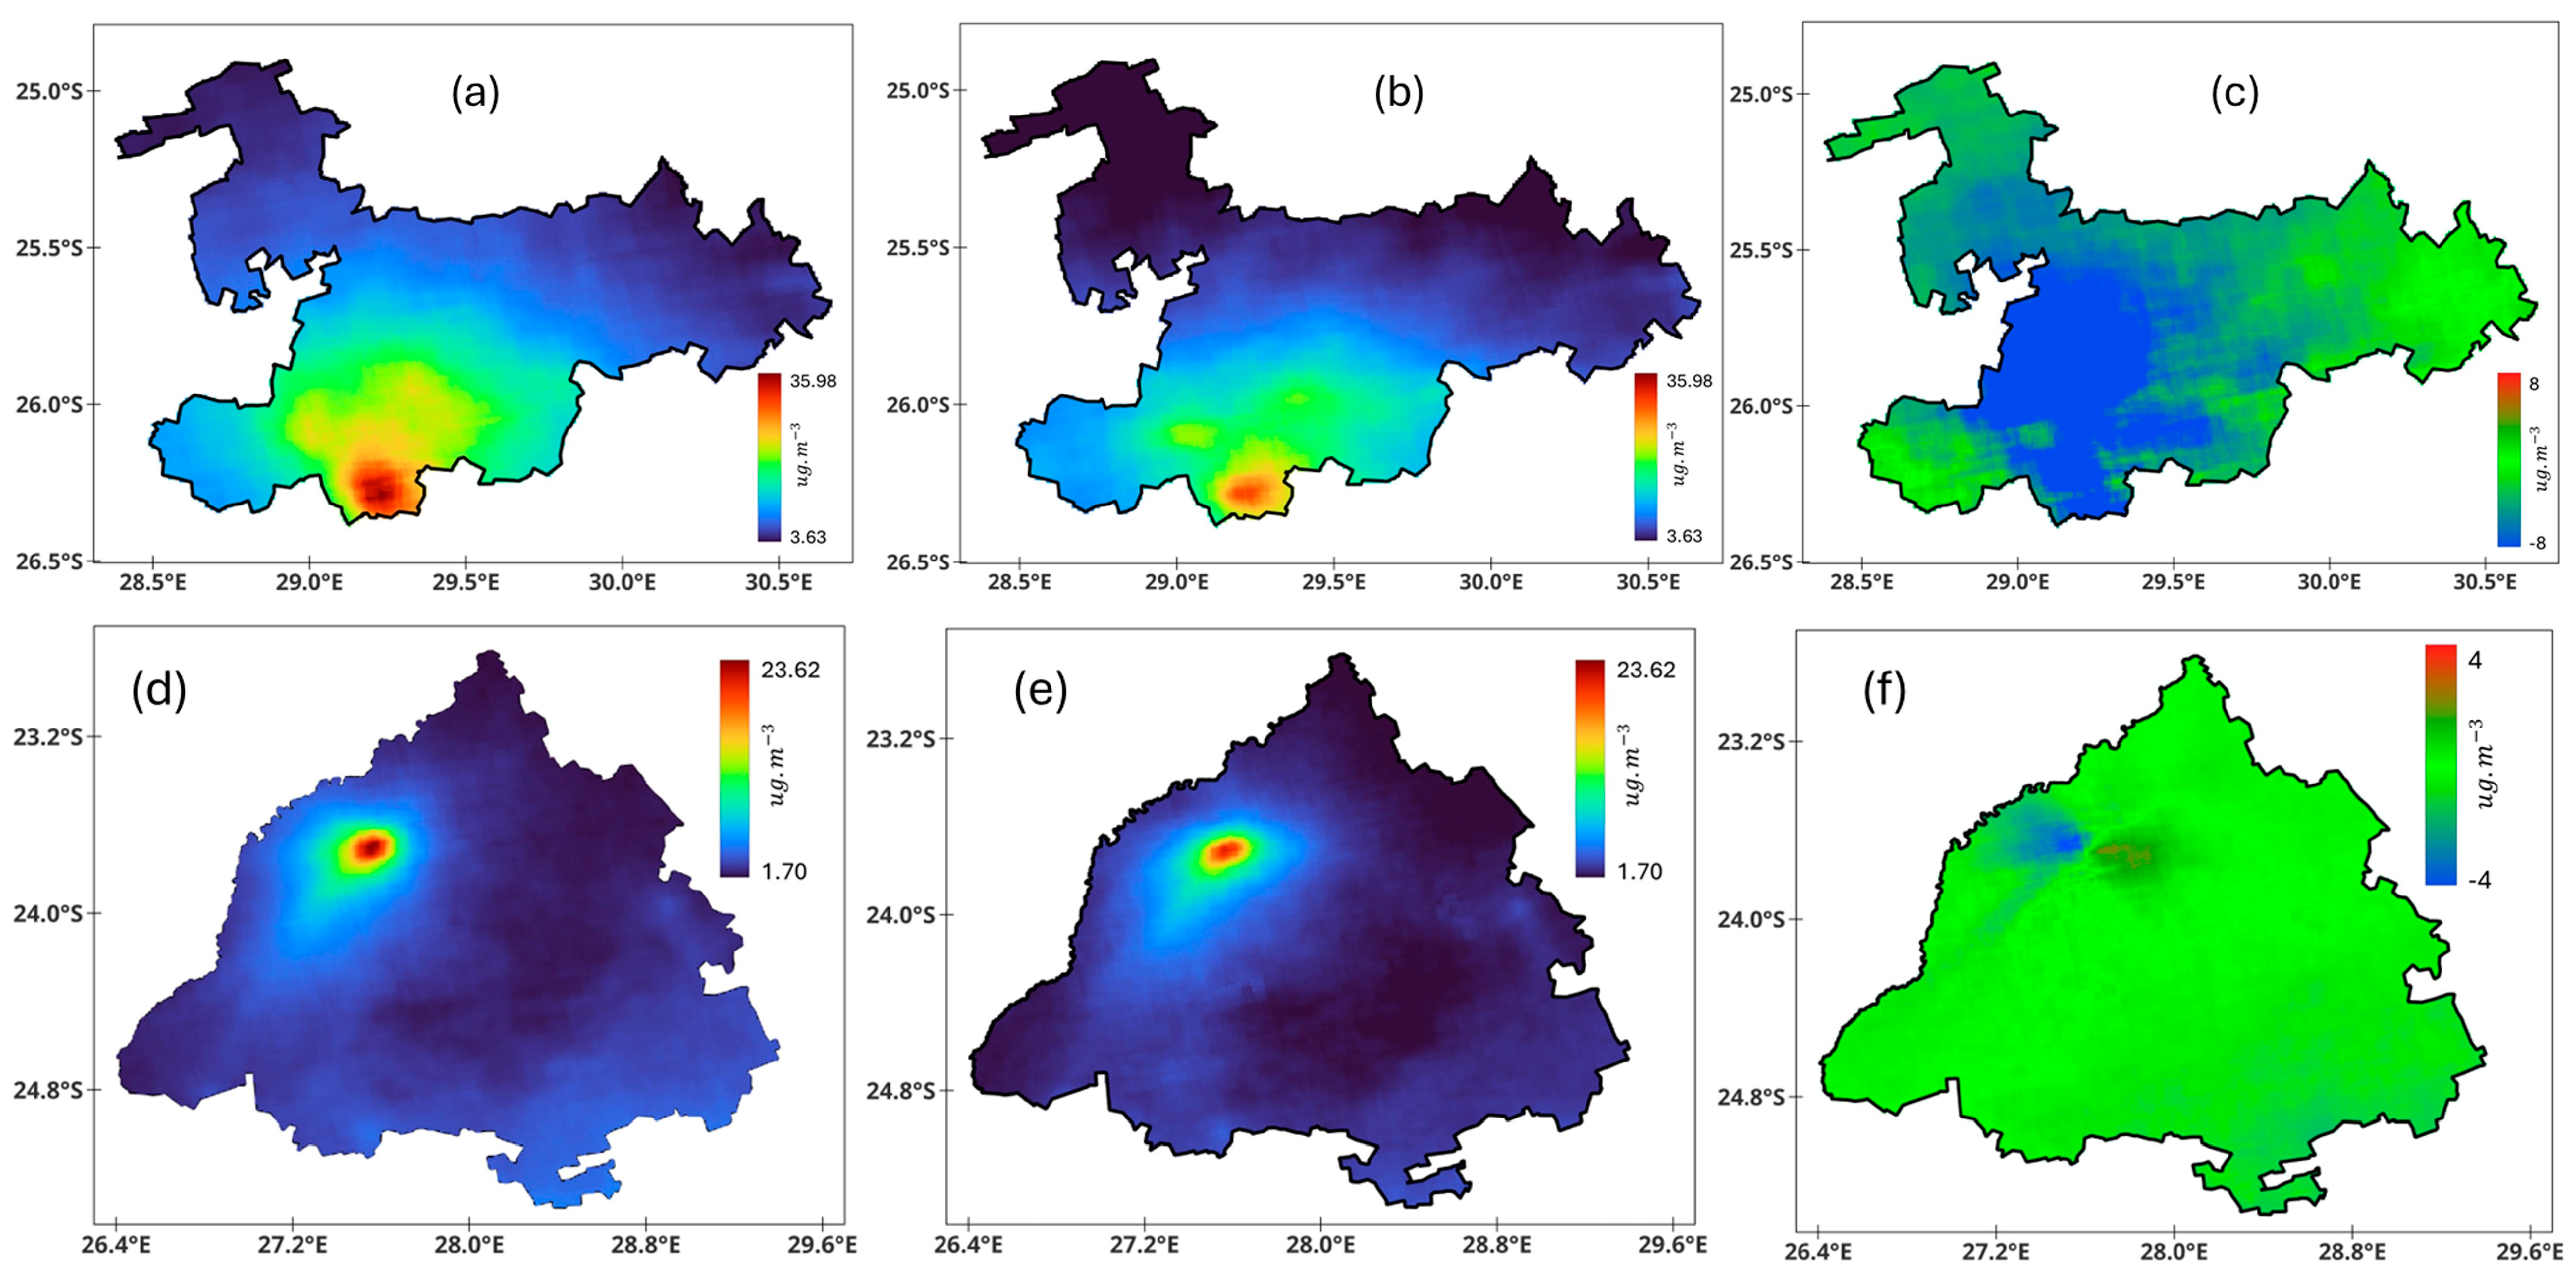
Figure 3 illustrates the distribution of NO2 concentrations over the Emalahleni and Lephalale regions for the years 2019 and 2023. A clear NO2 hotspot is evident in the southern part of Emalahleni, known as the Highveld (see Figure 3a,b), with concentrations reaching up to 35.98 µg·m−3. This area is significantly influenced by emissions from coal-fired power stations, heavy-duty vehicles, and mining operations. These activities emit nitrogen oxides (NOx), which convert to NO2 in the atmosphere.
In contrast, the northern section of Emalahleni, referred to as the Lowveld, shows lower NO2 levels, around 3.63 µg·m−3. This region hosts some industrial activities, mainly focused on manufacturing products from agricultural and raw forestry materials. However, these operations contribute minimally to NO2 emissions. Between 2019 and 2023, a slight decrease in NO2 levels was observed in the Highveld, while the Lowveld remained largely unchanged (see Figure 3c). The reduction in emissions is attributed to increased stages of loadshedding in 2023, during which power-generating units were offline, leading to reduced NO2 output.
A NO2 hotspot is also visible in northeastern Lephalale, near two coal-fired power stations. Concentrations in this area reach 23.62 µg·m−3, while surrounding regions exhibit much lower levels, around 1.70 µg·m−3. Lephalale’s industrial activity is dominated by mining and energy production, with agriculture also contributing. A slight decrease in NO2 levels over the hotspot was also noted in 2023, again linked to loadshedding and the temporary shutdown of power-generating units. The National air quality standards are given in Schedule 2 of the National Environmental Management: Air Quality Act (AQA) (Act no. 39 of 2004). The South African (AQA) for SO2 is 125 µg/m3 for maximum 24 h average and 188 µg/m3 for NO2.
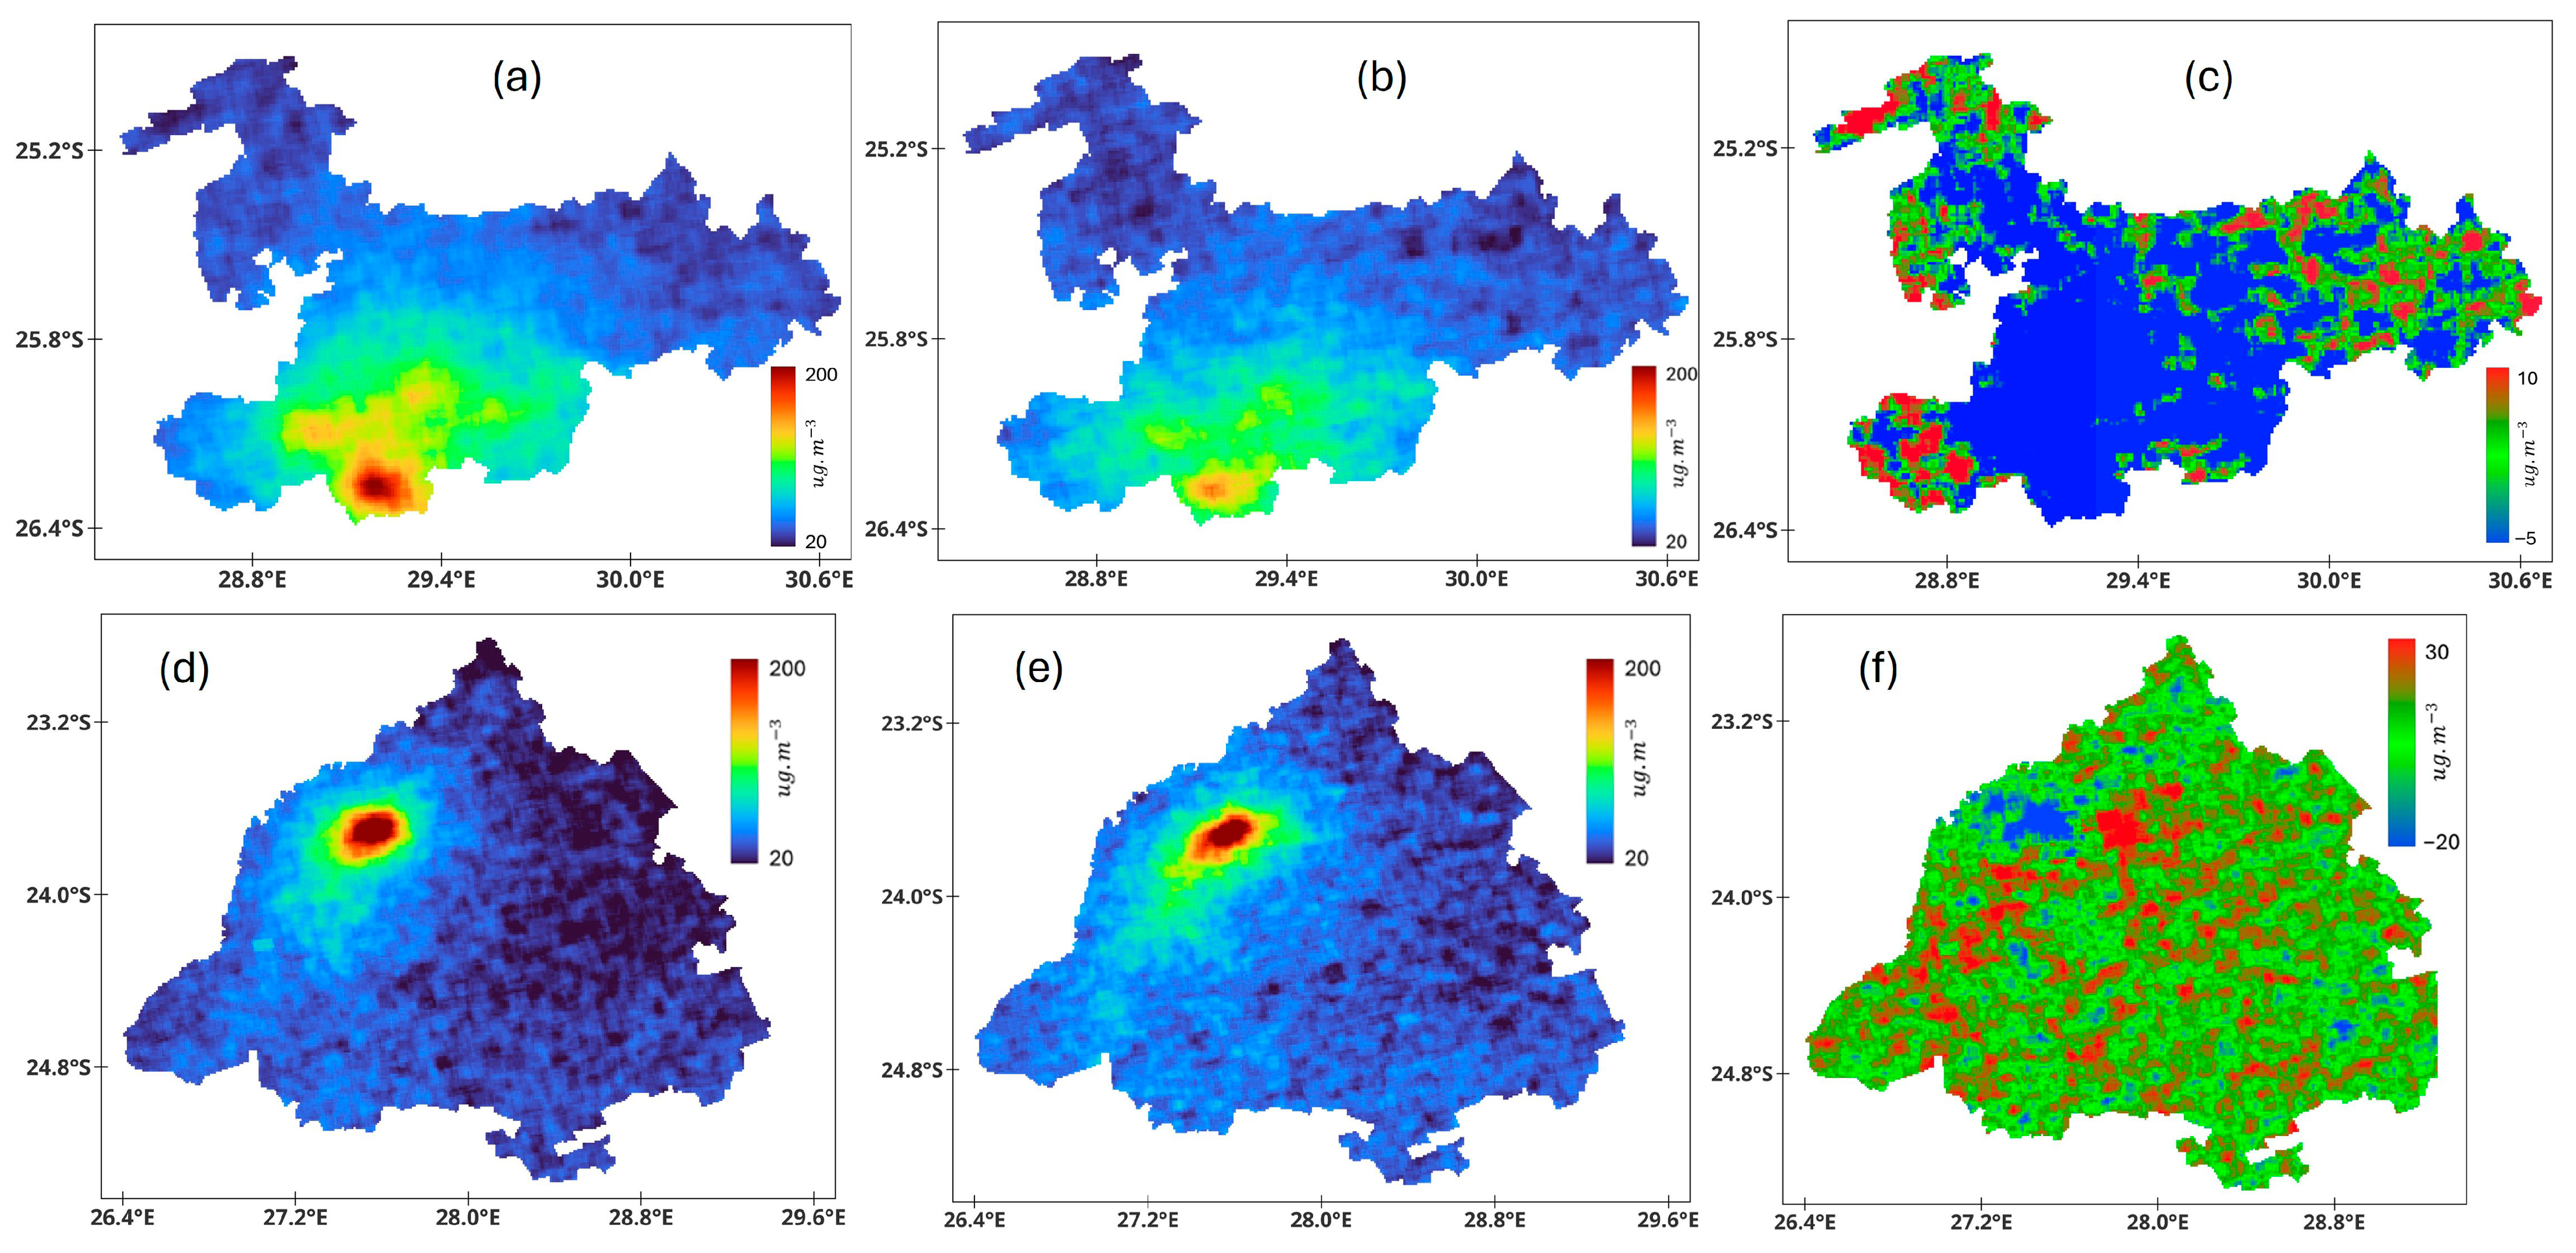
Figure 4 shows how SO2 concentrations are distributed across the Emalahleni and Lephalale areas in 2019 and 2023. In Emalahleni, similar to previous observations, a hotspot of elevated SO2 levels is evident in the southern part of the region (see Figure 4a,b). Concentrations reach up to 200 µg/m3 in this area, while surrounding regions show significantly lower levels, around 20 µg/m3. The difference map (Figure 4c) indicates a reduction in SO2 concentrations at the hotspot, primarily attributed to the effects of loadshedding. Notably, there is an increase in SO2 levels in areas that typically show low concentrations (Figure 4c), likely due to long-range atmospheric transport. It is well established that wind can carry SO2 from industrial zones over long distances, affecting areas far from the emission source.
In the Lephalale region, a hotspot of SO2 is detected in the northeastern part (Figure 4d,e). A noticeable decrease in SO2 concentrations is observed at this hotspot in 2023 (Figure 4f). Similarly to Emalahleni, some areas in Lephalale experienced increases in SO2 levels during periods of frequent loadshedding. Additionally, there are regions where SO2 concentrations remained unchanged over the two periods.

4.3. Temperature and Precipitation Timeseries for 2019 and 2023

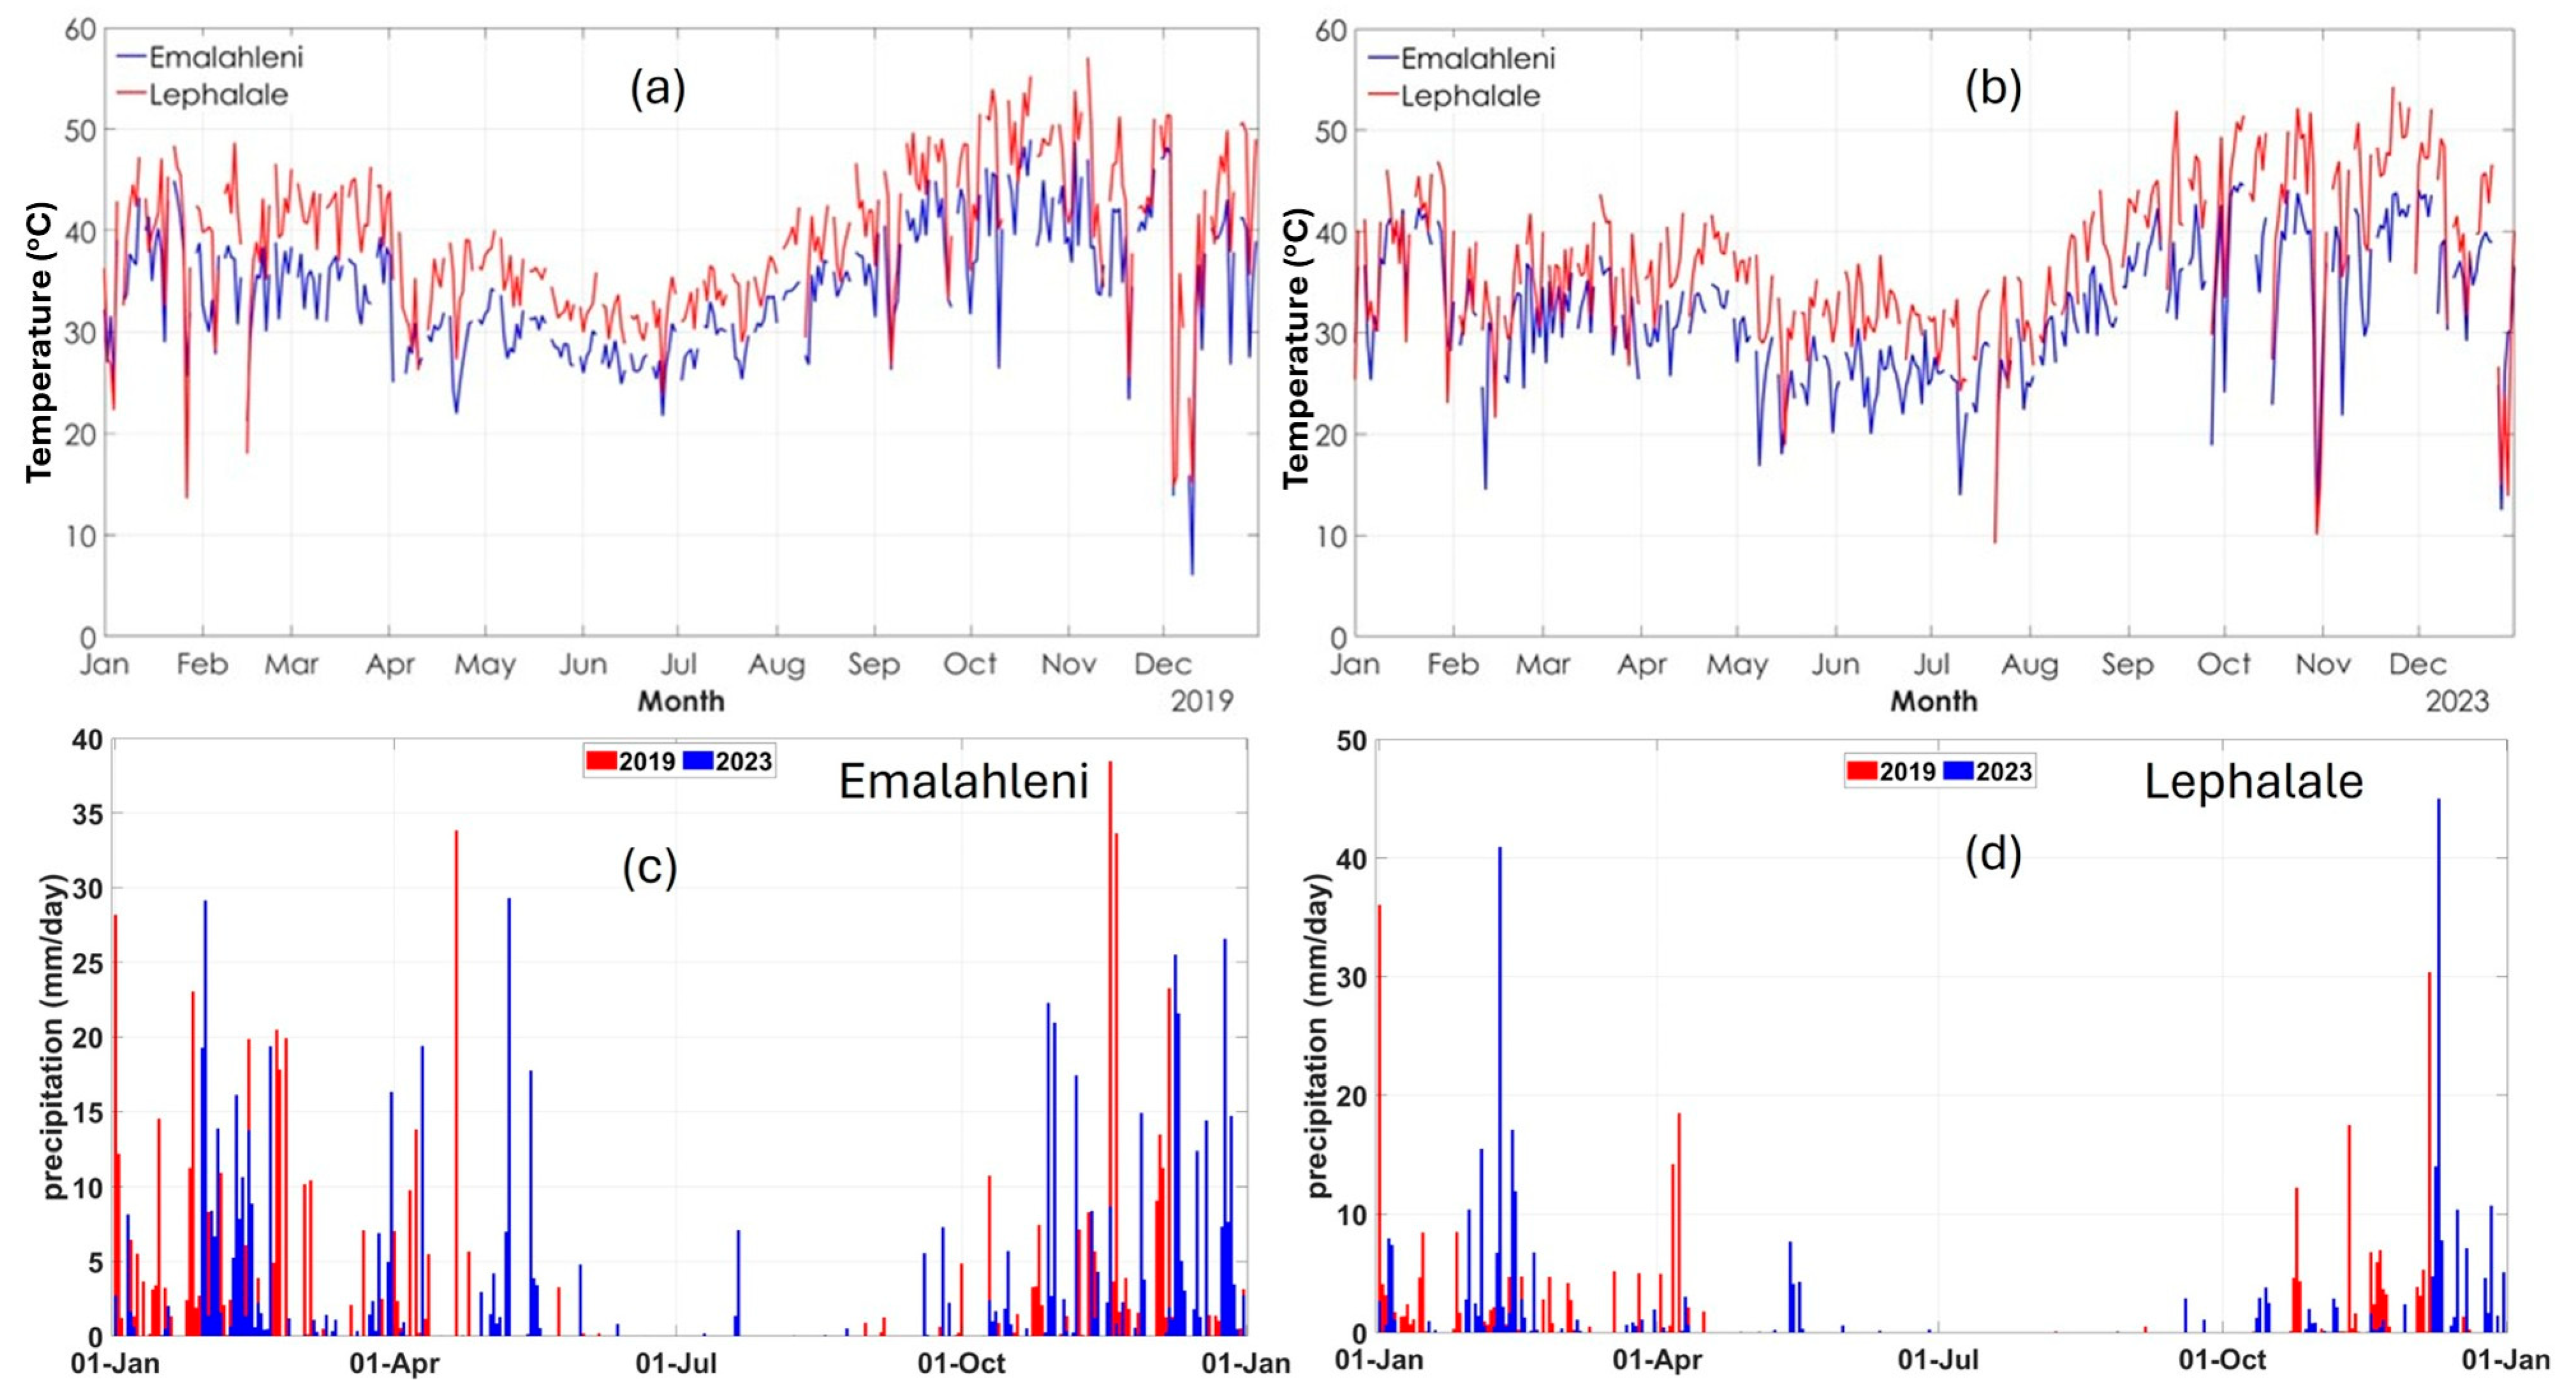
Figure 5 examines temperature and precipitation patterns during times of infrequent and frequent loadshedding in the Emalahleni and Lephalale regions. Figure 5a,b reveals that Lephalale is marginally warmer than Emalahleni. Both areas experience hot summers (December–February), with temperatures typically ranging from 30 °C to 40 °C. Notably, Lephalale saw temperatures surpass 50 °C in October and November, underscoring its warmer climate compared to Emalahleni. During winter (June–August), both regions cool down to 20–30 °C, with Emalahleni generally being cooler than Lephalale.
Figure 5c,d illustrates that winter is the driest season in both regions, with minimal to no rainfall. Conversely, spring and summer bring higher precipitation. Emalahleni recorded a peak rainfall of 29 mm/day in May 2023, while Lephalale’s highest was 45 mm/day in December.
The interplay between pollutant levels, temperature, and precipitation is intricate and often non-linear. Generally, higher temperatures correlate with increased air pollution, while rainfall reduces pollutant concentrations via wet deposition. The data suggests that, in addition to weather-related factors, emission reductions—such as those caused by loadshedding—significantly contribute to improved air quality.

4.4. Correlation Matrices

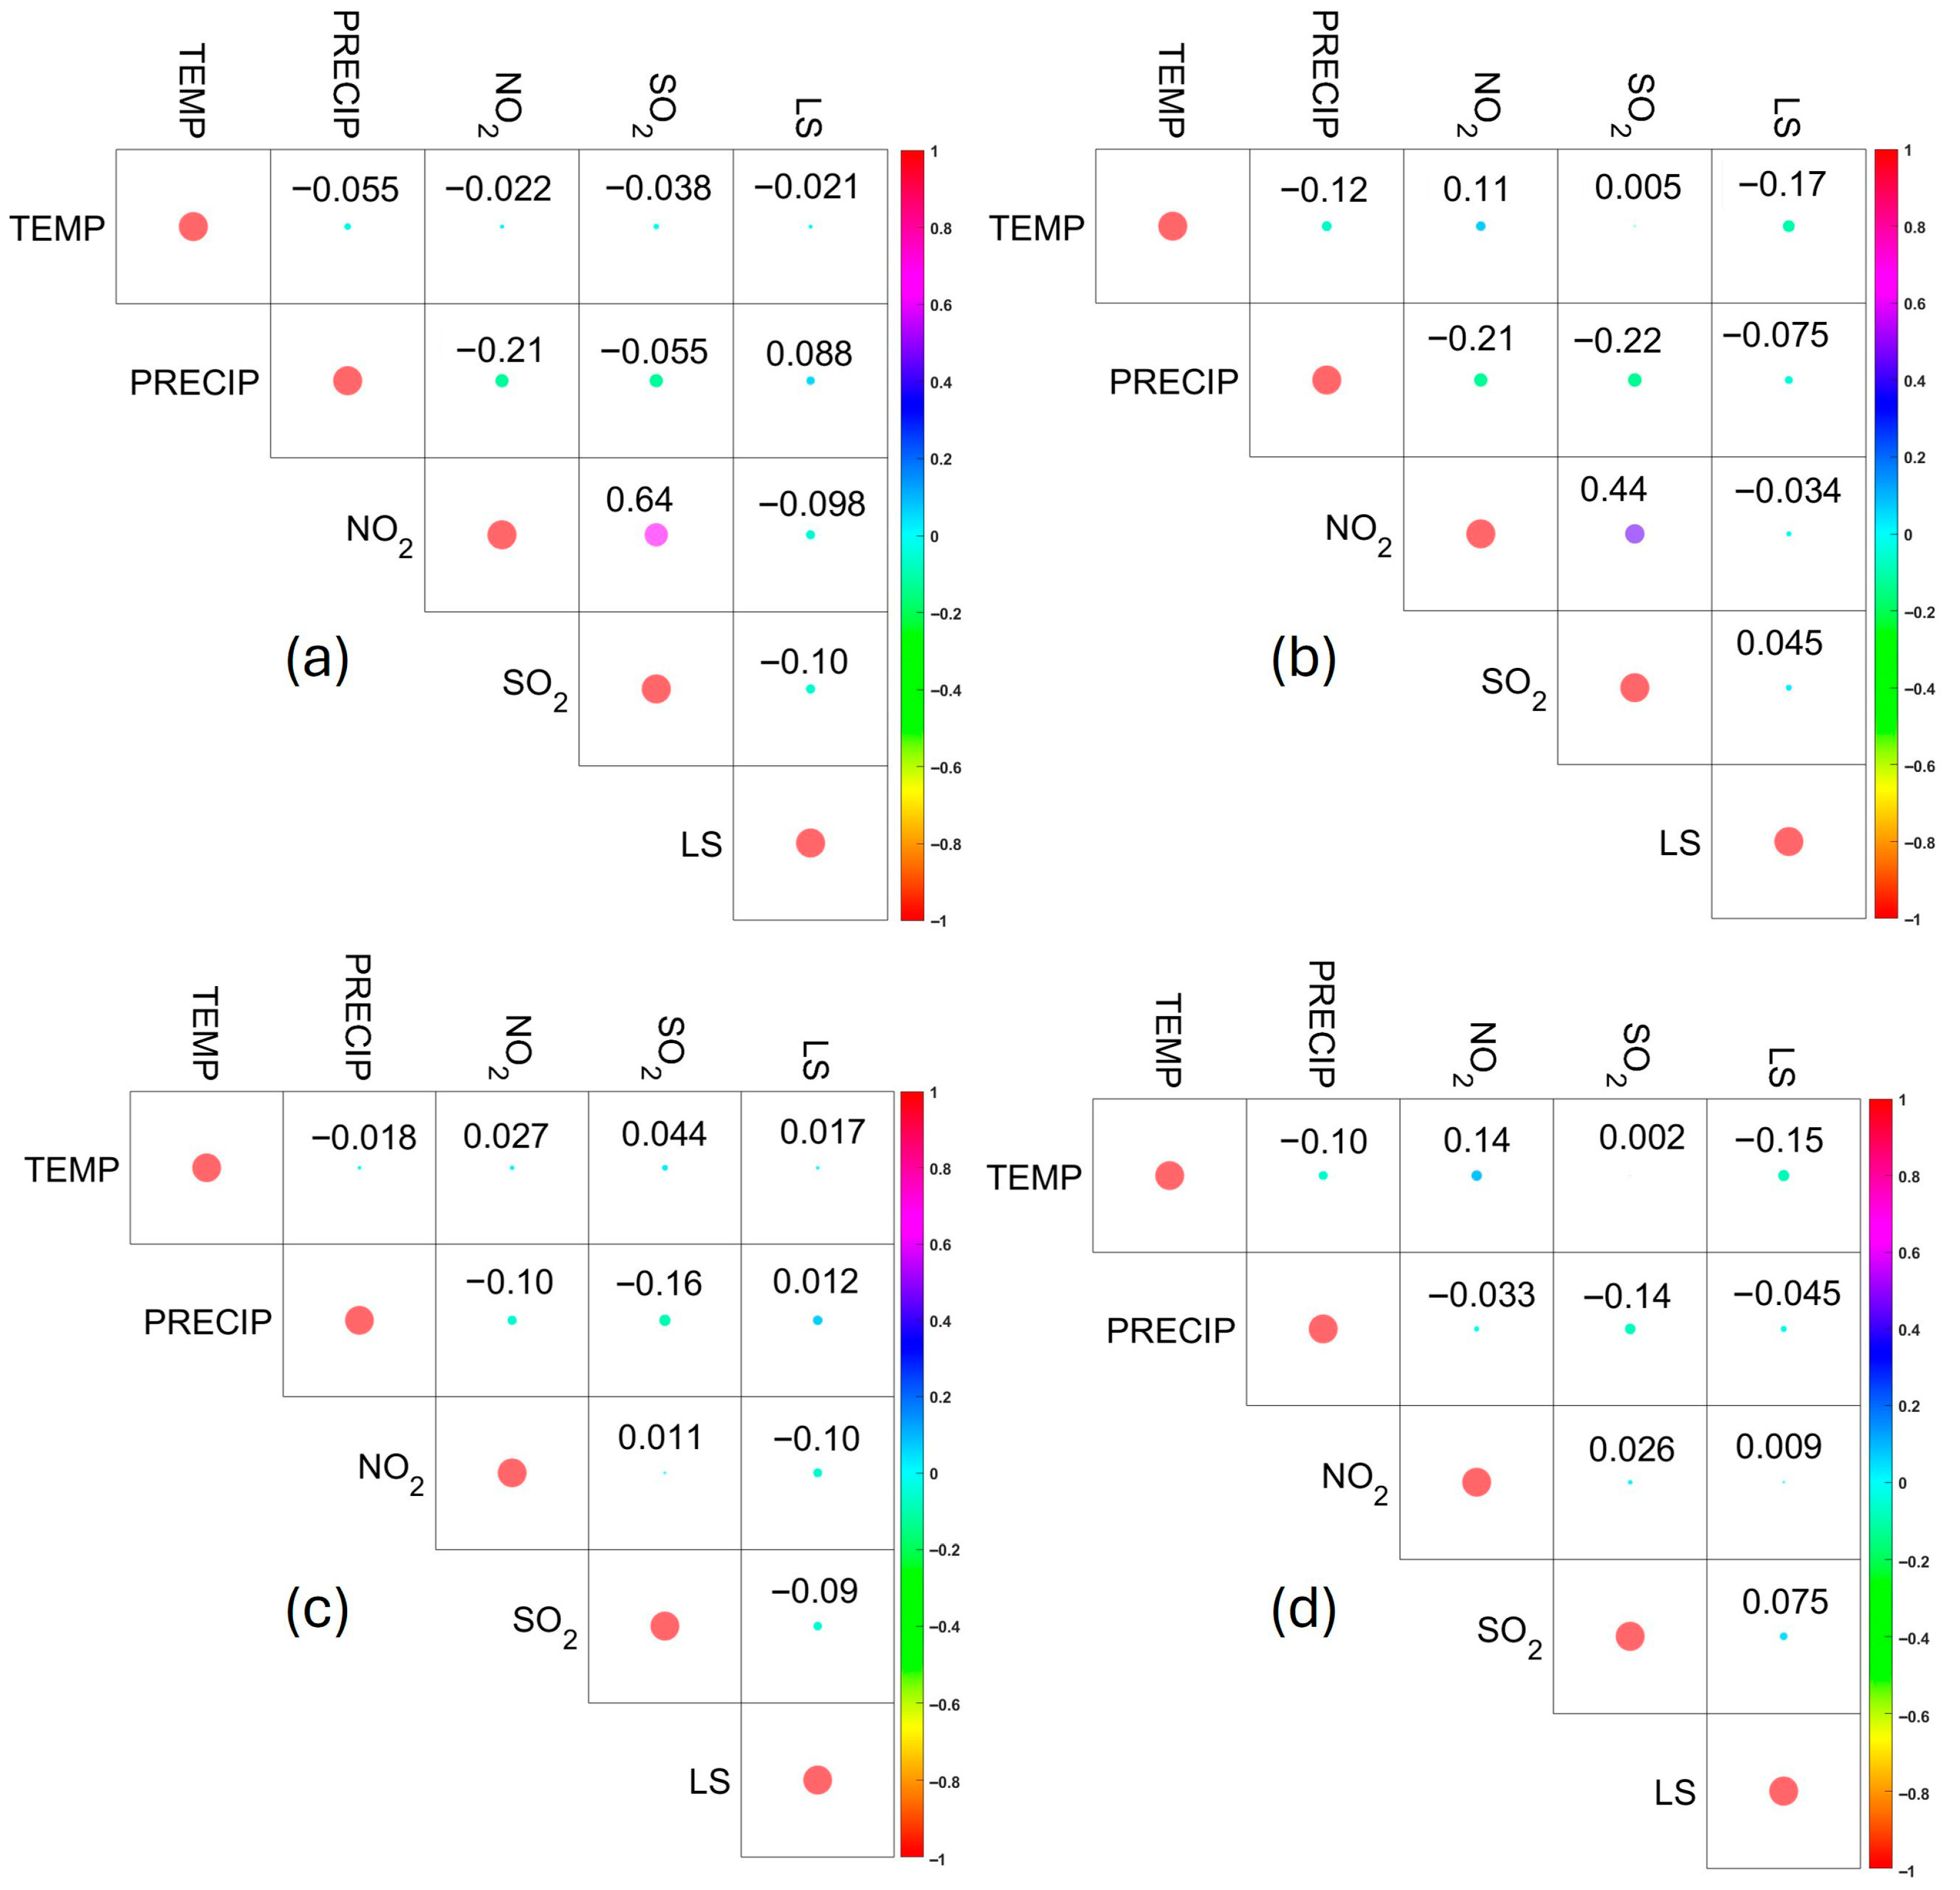
Figure 6 illustrates the statistical correlations between various parameters across the study period. To aid interpretation, correlation coefficients (r) are categorized as negligible (±0.0 to ±0.3), weak (±0.31 to ±0.5), moderate (±0.51 to ±0.7), high (±0.71 to ±0.9), and very high (±0.91 to ±1.0), encompassing both positive and negative relationships [46]. The analysis predominantly indicates negligible to weak correlations among loadshedding stages (LS), precipitation (PRECIP), temperature (TEMP), NO2, and SO2 for the years 2019 and 2023. A moderate correlation was observed exclusively between NO2 and SO2 in the Emalahleni region during both years.
In Figure 6a, which shows data for the Emalahleni region in 2019, a moderate correlation of 0.64 is observed between NO2 and SO2—an expected result, as both pollutants typically originate from similar sources such as power stations. However, in 2023 (Figure 6b), when loadshedding was more frequent and occurred at higher stages, the correlation between NO2 and SO2 drops to a weak level at 0.44. This suggests that reduced pollutant concentrations may weaken the correlation. While a moderate to high correlation between LS and pollutant levels was anticipated, the data instead show negligible relationships.
Figure 6c,d depicts the correlations for the Lephalale region for 2019 and 2023, respectively. Contrary to expectations, negligible correlations between NO2 and SO2 are observed in both years—0.011 in 2019 and 0.026 in 2023. This indicates that NO2 and SO2 emissions in this region are likely from unrelated sources, pointing to the presence of various emission contributors. Taken together, the results suggest that loadshedding has little to no direct relationship with the environmental variables examined in this study.
A statistical significance level of less than 0.05 (p < 0.05) between variables SO2, NO2, temperature, precipitation, and Loadshedding indicates that there is a less than 5% probability that the observed relationships among these variables occurred by chance. This suggests a statistically meaningful association, implying that changes in SO2 and NO2 or weather conditions (temperature, precipitation) may be significantly related to the frequency or occurrence of power cuts. However, statistical significance does not imply causation, so further analysis would be needed to establish direct cause-and-effect relationships.
In summary, the significant correlations observed suggest that NO2 and SO2 levels are typically positively correlated, largely because they originate from common sources such as coal-fired power stations. Temperature tends to show a positive correlation with both NO2 and SO2, as higher temperatures often lead to increased electricity demand for cooling (e.g., air conditioning), resulting in greater fossil fuel combustion and thus higher emissions. On the other hand, precipitation is generally negatively correlated with pollutant concentrations. Rainfall acts as a natural cleansing mechanism by removing airborne pollutants through wet deposition, thereby lowering ambient levels of NO2 and SO2. Loadshedding events exhibit complex and context-dependent relationships with emissions. In some cases, emissions may decrease during power cuts because major power plants temporarily reduce output. However, in areas where backup diesel generators are widely used during outages, local NO2 levels may increase due to the combustion of diesel fuel. The net impact of loadshedding on air pollution depends on factors such as the duration and frequency of outages, the energy mix, and the types of backup systems in use.

5. Discussion and Conclusions

Loadshedding in South Africa has been a topic of concern for several years due to its direct impact on the domestic economy, livelihoods, public health, and various socio-economic issues. One of the key effects at the household level is food spoilage [47]. Ongoing power outages have compelled many South Africans to turn to unhealthy fast food, due to the disruption of home cooking caused by electricity shortages. This shift in dietary habits contributes to unbalanced nutrition and a rise in health-related complications.
In response to the unreliable power supply, there has also been a noticeable increase in the use of diesel generators for electricity generation [48]. Consequently, there has been a rise in medical incidents such as carbon monoxide and cyanide poisoning, along with burn injuries, due to the use of alternative energy sources during electricity outages [49].
Beyond its impact on households, loadshedding has significantly affected the national economy. Industrial operations have been halted, productivity has dropped sharply, and unemployment has risen [48]. Additionally, loadshedding poses a barrier to progress toward a greener and more sustainable future. For instance, minibus taxis, which transport over 70% of South Africa’s commuters, present a major opportunity for reducing carbon emissions through electrification. However, the instability of the power supply complicates efforts to transition to electric vehicles [50].
Ironically, while loadshedding has devastating socio-economic consequences, it appears to offer short-term environmental benefits. Reduced electricity generation during periods of high-stage loadshedding has led to lower emissions and improved air quality. This finding supports the argument that transitioning to cleaner, alternative energy sources—such as solar, wind, hydro, and advanced bioenergy—can substantially reduce atmospheric pollution over time and promote a healthier environment. By reducing dependence on fossil fuels, such policies help limit emissions of harmful pollutants like SO2, NOx, and particulate matter, which are major contributors to air pollution and related health issues. Additionally, adopting clean energy aligns with climate goals, strengthens energy security, and supports sustainable economic development. In the long term, this transition not only protects the environment, but also lowers healthcare costs and enhances overall quality of life.
Future research could investigate the combined effects of loadshedding on greenhouse gas emissions and criteria pollutants, using integrated modeling to project outcomes under various loadshedding scenarios. Such analysis would support evidence-based policy reforms aimed at accelerating renewable energy adoption and contribute to ongoing discussions on restructuring the electricity sector.

Author Contributions

Conceptualization, K.X., M.M. and L.S.; methodology, K.X., M.M. and L.S.; validation, K.X., M.M. and L.S.; formal analysis, K.X. and M.M.; writing—original draft preparation, K.X.; writing—review and editing, M.M. and L.S. All authors have read and agreed to the published version of the manuscript.

Funding

The APC was funded by the South African National Space Agency.

Institutional Review Board Statement

Not applicable.

Informed Consent Statement

Not applicable.

Data Availability Statement

The data used in this study is freely accessible and available. AIRS and GPM data was obtained from https://giovanni.gsfc.nasa.gov/ (last accessed on 19 June 2025). NO2 and SO2 data was obtained from Google Earth Engine https://code.earthengine.google.com/ (last accessed 25 May 2025).

Acknowledgments

The authors express their gratitude to the European Space Agency (ESA) and its partners for supplying the Sentinel-5P/TROPOMI data utilized in this study. Appreciation is also extended to ESKOM for providing the loadshedding data publicly.

Conflicts of Interest

The authors declare no conflicts of interest.

References

  1. Pegels, A. Renewable Energy in South Africa: Potentials, Barriers and Options for Support. Energy Policy 2010, 38, 4945–4954. [Google Scholar] [CrossRef]
  2. Meles, T.H. Impact of Power Outages on Households in Developing Countries: Evidence from Ethiopia. Energy Econ. 2020, 91, 104882. [Google Scholar] [CrossRef]
  3. Harald, W.; Samantha, K.; Andrew, M. Climate Finance to Transform Energy as Part of a Just Transition in South Africa; University of Cape Town: Cape Town, South Africa, 2020. [Google Scholar]
  4. Kusakana, K. Techno-Economic Analysis of Hydro Aeropower Systems for Energy Cost Reduction in Farming Activities. Int. J. Smart Grid Clean Energy 2020, 9, 989–999. [Google Scholar] [CrossRef]
  5. Ateba, B.B.; Prinsloo, J.J.; Gawlik, R. The Significance of Electricity Supply Sustainability to Industrial Growth in South Africa. Energy Rep. 2019, 5, 1324–1338. [Google Scholar] [CrossRef]
  6. Schoeman, T.; Saunders, M. The Impact of Power Outages on Small Businesses in the City of Johannesburg. In Proceedings of the International Conference on Education, Business, Humanities and Social Science Studies, Cape Town, South Africa, 19–20 November 2018; pp. 328–333. [Google Scholar]
  7. Western Cape Government. Load Shedding Fact Sheet; Western Cape Government: Cape Town, South Africa, 2019.
  8. du Venage, G. South Africa Comes to Standstill with Eskom’s Load Shedding. Available online: https://www.e-mj.com/news/this-month-in-coal/south-africa-comes-to-standstill-with-eskoms-load-shedding (accessed on 18 June 2025).
  9. Daily Maverick It’s Now Official: South Africa Has Now Had More Load Shedding in 2023 to Date Than in 2022 Combined. Available online: https://www.dailymaverick.co.za/article/2023-05-12-its-now-official-south-africa-has-now-had-more-load-shedding-in-2023-to-date-than-in-2022-combined (accessed on 18 June 2025).
  10. Alhelou, H.H.; Hamedani-Golshan, M.E.; Njenda, T.C.; Siano, P. A Survey on Power System Blackout and Cascading Events: Research Motivations and Challenges. Energies 2019, 12, 682. [Google Scholar] [CrossRef]
  11. Shikwambana, L.; Mhangara, P.; Mbatha, N. Trend Analysis and First Time Observations of Sulphur Dioxide and Nitrogen Dioxide in South Africa Using TROPOMI/Sentinel-5P Data. Int. J. Appl. Earth Obs. Geoinf. 2020, 91, 102130. [Google Scholar] [CrossRef]
  12. Fouladi-Fard, R.; Naddafi, K.; Hosseini, M.R.; Yunesian, M.; Nodehi, R.N.; Dehghani, M.H.; Hassanvand, M.S.; Dehabadi, M.; Fiore, M.; Rahimi, N.R. The Effect of Power Plant Fuel Change on the Air Pollution (SO2 and NOX) of Surrounding Areas: A Passive Measurement Method and Health Risk Assessment. Res. Sq. 2022, 1–20. [Google Scholar] [CrossRef]
  13. Marais, E.A.; Wiedinmyer, C. Air Quality Impact of Diffuse and Inefficient Combustion Emissions in Africa (DICE-Africa). Env. Sci. Technol. 2016, 50, 10739–10745. [Google Scholar] [CrossRef] [PubMed]
  14. Rafaj, P.; Kiesewetter, G.; Gül, T.; Schöpp, W.; Cofala, J.; Klimont, Z.; Purohit, P.; Heyes, C.; Amann, M.; Borken-Kleefeld, J. Outlook for Clean Air in the Context of Sustainable Development Goals. Glob. Environ. Chang. 2018, 53, 1–11. [Google Scholar] [CrossRef]
  15. Emberson, L.D.; Ashmore, M.R.; Murray, F.; Kuylenstierna, J.C.I.; Percy, K.E.; Izuta, T.; Zheng, Y.; Shimizu, H.; Sheu, B.H.; Liu, C.P.; et al. Impacts of Air Pollutants on Vegetation in Developing Countries. Water Air Soil Pollut. 2001, 130, 107–118. [Google Scholar] [CrossRef]
  16. World Health Organization. Ambient Air Pollution: A Global Assessment of Exposure and Burden of Disease; WHO: Geneva, Switzerland, 2016.
  17. Department of Forestry, Fisheries & Environment. National Environmental Management: Air Quality Act: Second-Generation Highveld Priority Area Air Quality Management Plan; Department of Forestry, Fisheries & Environment: Pretoria, South Africa, 2025.
  18. Dahiya, S.; Anhäuser, A.; Farrow, A.; Thieriot, H.; Kumar, A.; Myllyvirta, L. Global SO2 Emission Database; Centre for Research on Energy and Clean Air (CREA): Delhi, India, 2020. [Google Scholar]
  19. Levelt, P.F.; Joiner, J.; Tamminen, J.; Veefkind, J.P.; Bhartia, P.K.; Zweers, D.C.S.; Duncan, B.N.; Streets, D.G.; Eskes, H.; Van Der, R.A.; et al. The Ozone Monitoring Instrument: Overview of 14 Years in Space. Atmos. Chem. Phys. 2018, 18, 5699–5745. [Google Scholar] [CrossRef]
  20. Veefkind, J.P.; Aben, I.; McMullan, K.; Förster, H.; de Vries, J.; Otter, G.; Claas, J.; Eskes, H.J.; de Haan, J.F.; Kleipool, Q.; et al. TROPOMI on the ESA Sentinel-5 Precursor: A GMES Mission for Global Observations of the Atmospheric Composition for Climate, Air Quality and Ozone Layer Applications. Remote Sens. Environ. 2012, 120, 70–83. [Google Scholar] [CrossRef]
  21. Garnham, B.L.; Langerman, K.E. Mercury emissions from South Africa’s coal-fired power stations. Clean Air J. 2016, 26, 14–20. [Google Scholar] [CrossRef]
  22. Keli, Z.; Mhangara, P.; Shikwambana, L. Monitoring the Trends in Emissions from Coal-Fired Power Stations in Lephalale (Limpopo) during the 2010–2022 Period Using Remotely Sensed Data. Clean Air J. 2024, 34, 1–10. [Google Scholar] [CrossRef]
  23. Sekonya, K.G. Development of a 6 MV Tandem Accelerator Mass Spectrometry Facility and Its Applications. Master’s Thesis, University of the Witwatersrand, Johannesburg, South Africa, 2019. [Google Scholar]
  24. Mwale, S.; Davidson, I. Power Deficits and Outage Planning in South Africa. J. Energy Chall. Mech. 2014, 1, 19–21. [Google Scholar]
  25. Data World. Mpumalanga Spatial Development Framework; Data World Pty Limited: Durban, South Africa, 2018. [Google Scholar]
  26. Chabedi, K.; Mhlongo, S. Mining of the Waterberg—A Unique Deposit Requiring Innovative Solutions. Int. J. Georesour. Environ. 2018, 4, 127–132. [Google Scholar]
  27. Myllyvirta, L.; Kelly, J. Health Impacts of Delaying Coal Power Plant Decommissioning in South Africa. Centre for Research on Energy and Clean Air. 2023. Available online: https://energyandcleanair.org (accessed on 9 June 2025).
  28. Lephalale Municipality. Lephalale Municipality Annual Report 2023–2024; Lephalale Municipality: Lephalale, South Africa, 2024.
  29. Campbell, M.; Nel, V.; Mphambukeli, T. eMalahleni. In Secondary Cities and Development; Campbell, M., Nel, V., Mphambukeli, T., Eds.; Routledge: London, UK, 2017; pp. 61–78. [Google Scholar]
  30. Maswanganyi, C.; Tshilongo, J.; Mkhohlakali, A.; Martin, L. Evaluation of Ambient NO2 and SO2 Concentrations at Lephalale, Polokwane, and Steelpoort Area in the Limpopo Province of South Africa. Open J. Air Pollut. 2024, 13, 111–126. [Google Scholar] [CrossRef]
  31. Magagula, M.; Atangana, E.; Oberholster, P. Assessment of the Impact of Coal Mining on Water Resources in Middelburg, Mpumalanga Province, South Africa: Using Different Water Quality Indices. Hydrology 2024, 11, 113. [Google Scholar] [CrossRef]
  32. Lourens, A.S.; Beukes, J.P.; van Zyl, P.G.; Fourie, G.D.; Burger, J.W.; Pienaar, J.J.; Read, C.E.; Jordaan, J.H. Spatial and Temporal Assessment of Gaseous Pollutants in the Highveld of South Africa. S. Afr. J. Sci. 2011, 107, 1–8. [Google Scholar] [CrossRef]
  33. Aurela, M.; Beukes, J.P.; Van Zyl, P.; Vakkari, V.; Teinilä, K.; Saarikoski, S.; Laakso, L. The composition of ambient and fresh biomass burning aerosols at a savannah site, South Africa. S. Afr. J. Sci. 2016, 112, 1–8. [Google Scholar] [CrossRef]
  34. Theys, N.; Hedelt, P.; De Smedt, I.; Lerot, C.; Yu, H.; Vlietinck, J.; Pedergnana, M.; Arellano, S.; Galle, B.; Fernandez, D.; et al. Global monitoring of volcanic SO2 degassing with unprecedented resolution from TROPOMI onboard Sentinel-5 Precursor. Sci. Rep. 2019, 9, 2643. [Google Scholar] [CrossRef] [PubMed]
  35. Tilstra, L.G.; de Graaf, M.; Wang, P.; Stammes, P. In-orbit Earth reflectance validation of TROPOMI on board the Sentinel-5 Precursor satellite. Atmos. Meas. Tech. 2020, 13, 4479–4497. [Google Scholar] [CrossRef]
  36. Verhoelst, T.; Compernolle, S.; Pinardi, G.; Lambert, J.-C.; Eskes, H.J.; Eichmann, K.-U.; Fjæraa, A.M.; Granville, J.; Nie-meijer, S.; Cede, A.; et al. Ground-based validation of the Copernicus Sentinel-5P TROPOMI NO2 measurements with the NDACC ZSL-DOAS, MAX-DOAS and Pandonia global networks. Atmos. Meas. Tech. 2021, 14, 481–510. [Google Scholar] [CrossRef]
  37. Hartmut, H.; Aumann, H.; Miller, C.R. Atmospheric infrared sounder (AIRS) on the earth observing system. In Advanced and Next-Generation Satellites; SPIE: Bellingham, WA, USA, 1995; Volume 2583. [Google Scholar]
  38. Chahine, M.T.; Pagano, T.; Aumann, H.; Atlas, R.; Barnet, C.; Blaisdell, J.; Chen, L.; Divakarla, M.; Fetzer, E.; Goldberg, M.; et al. AIRS: Improving weather forecasting and providing new data on greenhouse gases. Bull. Am. Meteorol. Soc. 2006, 87, 911–926. [Google Scholar] [CrossRef]
  39. Menzel, W.P.; Schmit, T.J.; Zhang, P.; Li, J. Satellite-Based Atmospheric Infrared Sounder Development and Applications. Bull. Am. Meteorol. Soc. 2018, 99, 583–603. [Google Scholar] [CrossRef]
  40. Skofronick-Jackson, G.; Kirschbaum, D.; Petersen, W.; Huffman, G.; Kidd, C.; Stocker, E.; Kakar, R. The Global Precipitation Measurement (GPM) mission’s scientific achievements and societal contributions: Reviewing four years of advanced rain and snow observations. Q. J. R. Meteorol. Soc. 2018, 144, 27–48. [Google Scholar] [CrossRef] [PubMed]
  41. National Aeronautics and Space Administration. Global Precipitation Measurement. Available online: https://gpm.nasa.gov/ (accessed on 27 September 2022).
  42. Skofronick-Jackson, G.; Petersen, W.A.; Berg, W.; Kidd, C.; Stocker, E.F.; Kirschbaum, D.B.; Kakar, R.; Braun, S.A.; Huffman, G.J.; Iguchi, T.; et al. The Global Precipitation Measurement (GPM) mission for science and society. Bull. Am. Meteorol. Soc. 2017, 98, 1679–1695. [Google Scholar] [CrossRef]
  43. Skofronick-Jackson, G.M.; Johnson, B.T.; Munchak, S.J. Detection thresholds of falling snow from satellite-borne active and passive sensors. IEEE Trans. Geosci. Remote Sens. 2013, 51, 4177–4189. [Google Scholar] [CrossRef]
  44. Kirch, W. (Ed.) Pearson’s Correlation Coefficient. In Encyclopedia of Public Health; Springer: Dordrecht, The Netherlands, 2008; pp. 1090–1091. [Google Scholar]
  45. Benesty, J.; Chen, J.; Huang, Y.; Cohen, I. Pearson Correlation Coefficient. In Noise Reduction in Speech Processing; Springer: Berlin/Heidelberg, Germany, 2009; Volume 2, pp. 37–40. [Google Scholar]
  46. Shikwambana, L.; Xongo, K.; Mashalane, M.; Mhangara, P. Climatic and Vegetation Response Patterns over South Africa during the 2010/2011 and 2015/2016 Strong ENSO Phases. Atmosphere 2023, 14, 416. [Google Scholar] [CrossRef]
  47. Masingaand, F.; Madzivhandila, T. Loadshedding Impact on Food Spoilage: An Analysis of Household Experiences in South Africa. Afr. J. Gov. Dev. 2023, 12, 182–197. [Google Scholar] [CrossRef]
  48. Naidoo, C. The Impact of Load Shedding on the South Africa Economy. J. Public Adm. 2023, 58, 7–11. Available online: https://hdl.handle.net/10520/ejc-jpad_v58_n1_a2 (accessed on 27 September 2025).
  49. Laher, A.E.; van Aardt, B.J.; Craythorne, A.D.; van Welie, M.; Malinga, D.M.; Madi, S. ‘Getting out of the dark’: Implications of load shedding on healthcare in South Africa and strategies to enhance preparedness. S. Afr. Med. J. 2019, 109, 899–901. [Google Scholar] [CrossRef] [PubMed]
  50. Booysen, M.J.; Abraham, C.J.; Rix, A.J.; Giliomee, J.H. Electrification of minibus taxis in the shadow of load shedding and energy scarcity. S. Afr. J. 2022, 118. [Google Scholar] [CrossRef] [PubMed]
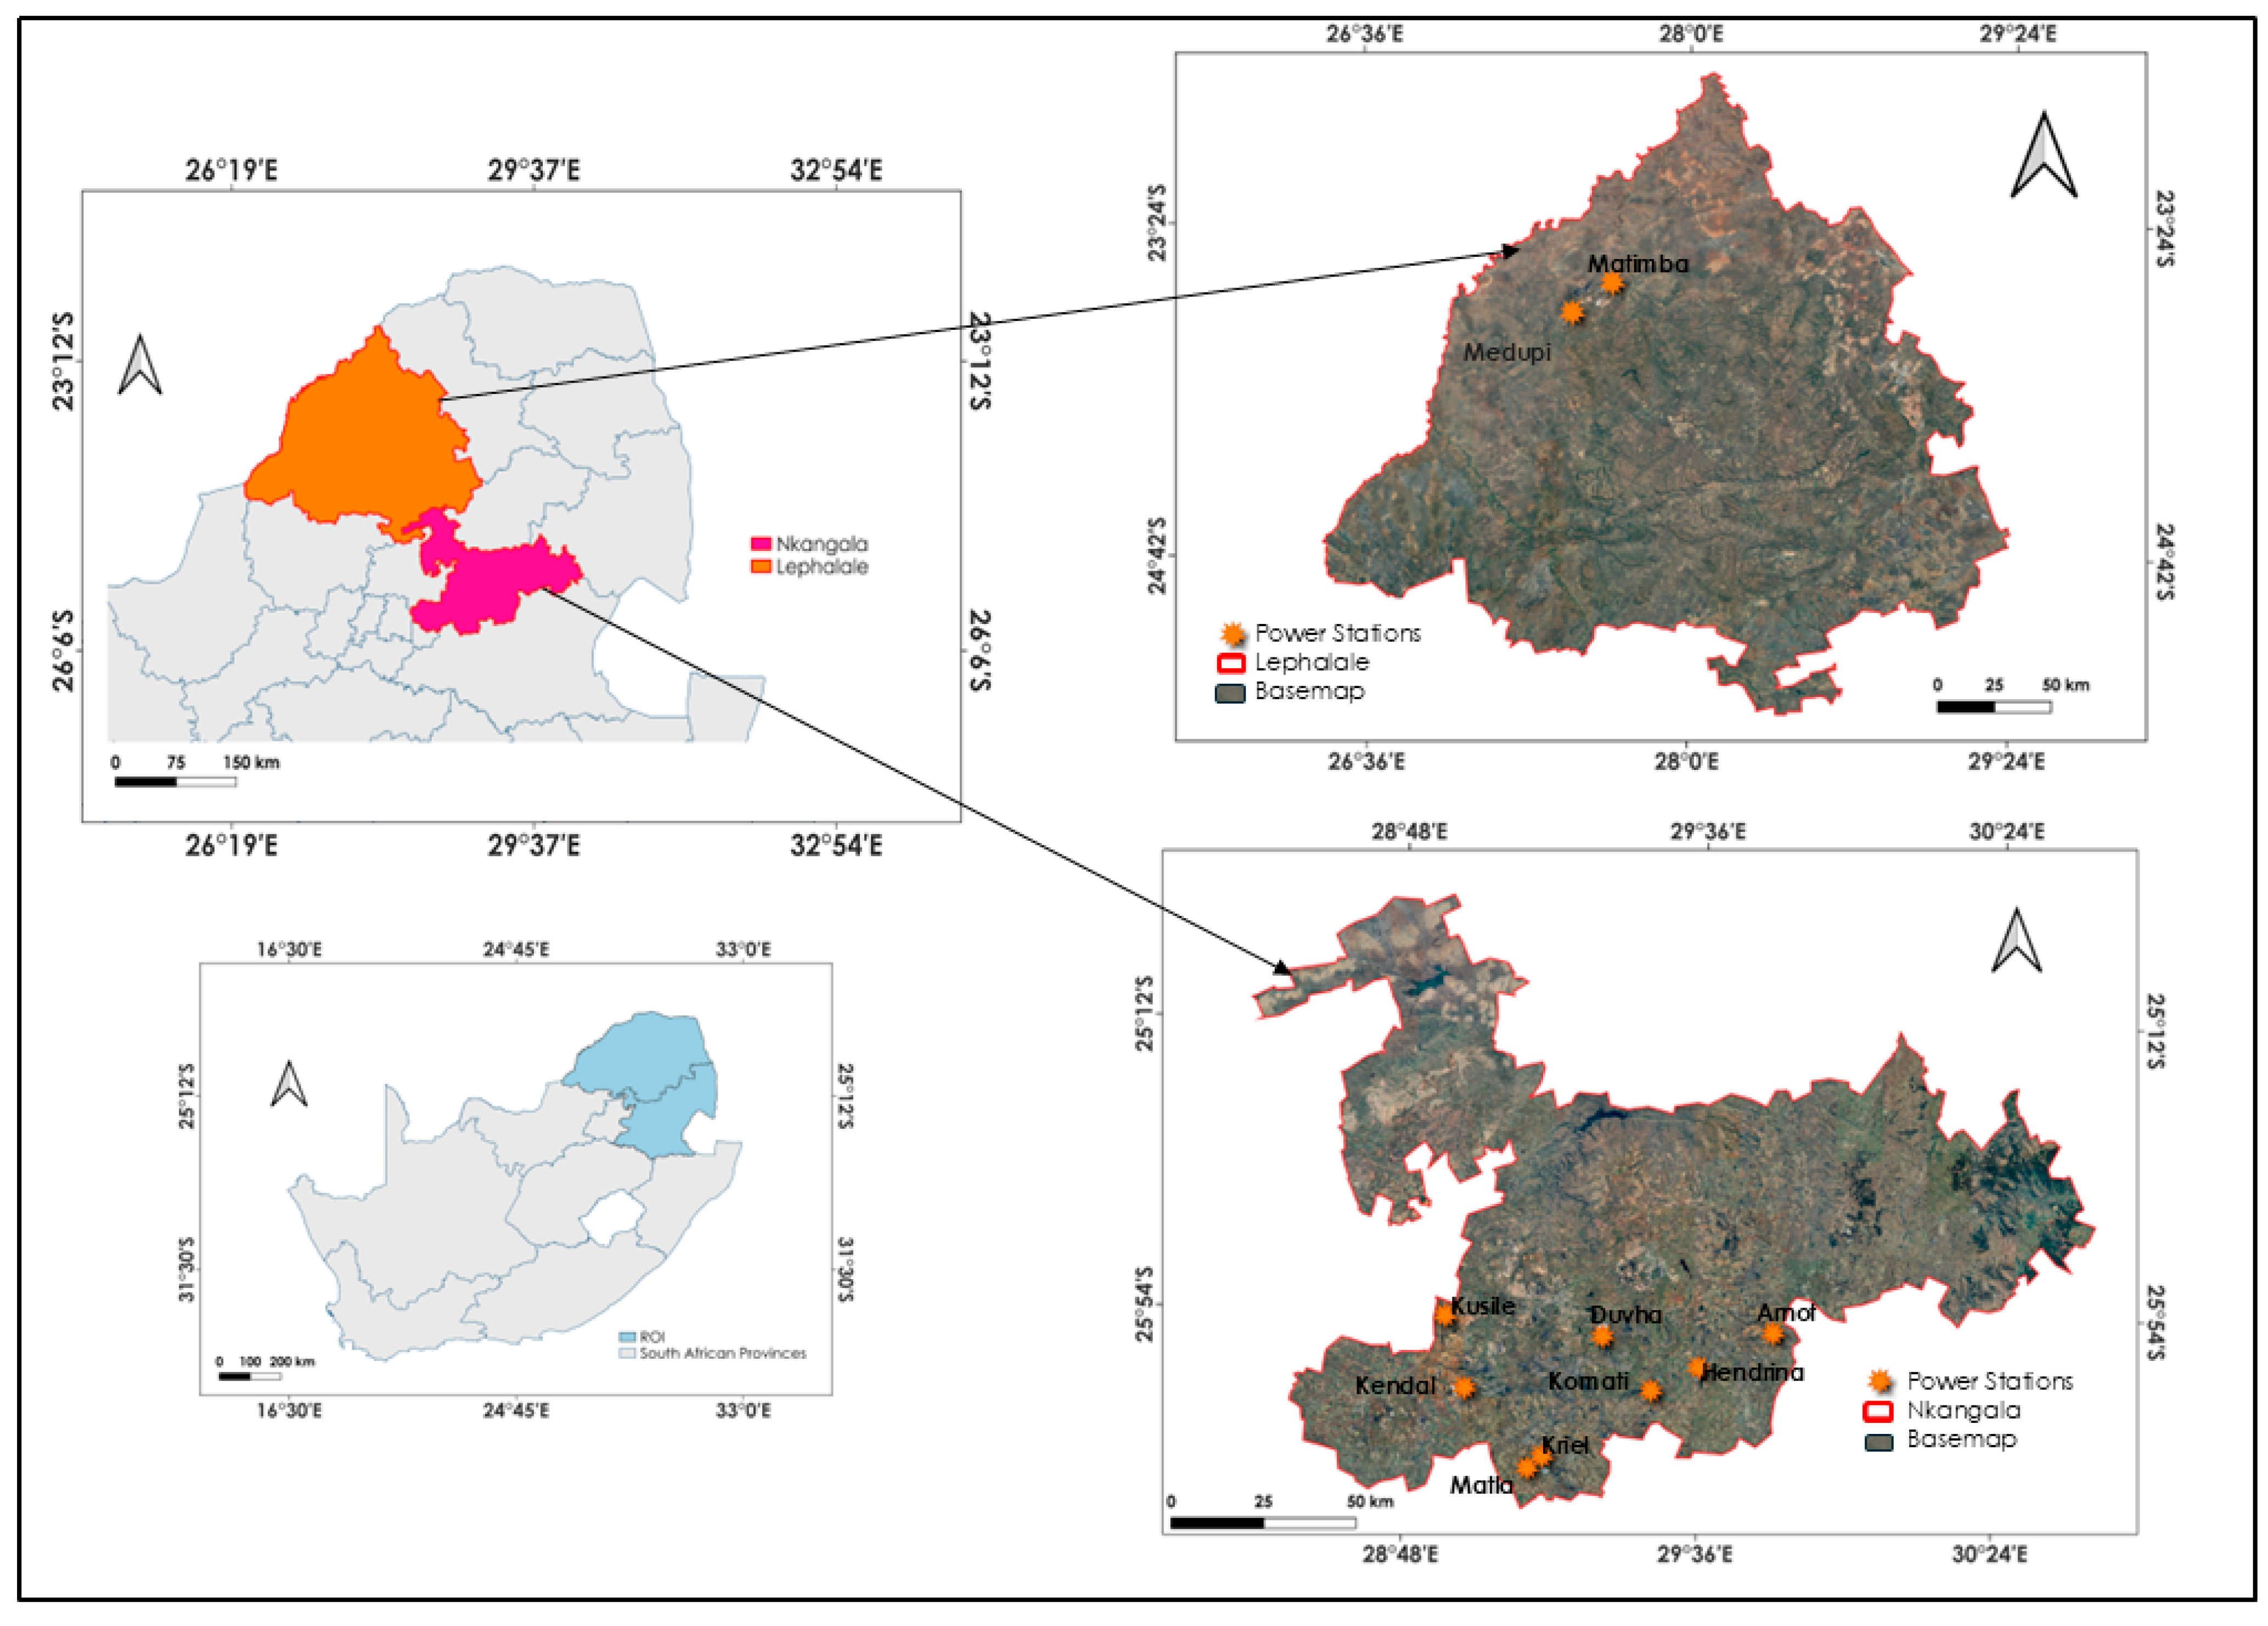
Figure 1. A map illustrating the locations of coal-fired power stations in South Africa’s Mpumalanga and Limpopo provinces. The orange color shows the Limpopo province, while the pink color shows the Mpumalanga province. The orange circles show the coal-fired power stations. The two arrows show the regions of interest for this study. The upper arrow shows the Nkangala region in the Mpumalanga province, and the lower arrow shows the Lephalale region in the Limpopo province of South Africa. The blue areas show the Mpumalanga and Limpopo provinces in South Africa.
Sustainability 17 08758 g001
Figure 2. Loadshedding stages in South Africa for the period (A) 2015–2023, (B) 2019, and (C) 2023. The blue lines show loadshedding stages 1–4 and the red lines show loadshedding stages 5–6. The upper arrow shows the loadshedding stages for the year 2019, and the lower arrow shows the loadshedding stages for the year 2023.
Sustainability 17 08758 g002
Figure 3. NO2 concentration distribution in Emalahleni in (a) 2019, (b) 2023, and (c) the difference. NO2 concentration in Lephalale in (d) 2019, (e) 2023, and (f) the difference.
Sustainability 17 08758 g003
Figure 4. SO2 concentration distribution in Emalahleni in (a) 2019, (b) 2023 and (c) the difference. SO2 concentration in Lephalale in (d) 2019, (e) 2023 and (f) the difference.
Sustainability 17 08758 g004
Figure 5. Temperature timeseries for the Emalahleni and Lephalale for (a) 2019 and (b) 2023. Precipitation timeseries for 2019 and 2023 over (c) Emalahleni and (d) Lephalale.
Sustainability 17 08758 g005
Figure 6. Pearson’s correlation was used to evaluate the associations between precipitation (PRECIP), temperature (TEMP), NO2, SO2, and loadshedding stages (LS). Correlation matrices over the Emalahleni region in (a) 2019 and (b) 2023. Correlation matrices in over the Lephalale region in (c) 2019 and (d) 2023.
Sustainability 17 08758 g006
Table 1. Dataset used in this study.
Input Data Source Product UsedOutput Data
Sentinel-5PNO2 and SO2 concentration (µg·m−3)Spatial distribution maps of NO2 and SO2
Timeseries plots of NO2 and SO2 (monthly)
AIRSTemperature (°C)Timeseries plot of temperature (monthly)
GPMPrecipitation (mm/month)Timeseries plot of precipitation (monthly)
ESKOMLoadshedding stagesTimeseries plot of loadshedding stages (monthly)
Disclaimer/Publisher’s Note: The statements, opinions and data contained in all publications are solely those of the individual author(s) and contributor(s) and not of MDPI and/or the editor(s). MDPI and/or the editor(s) disclaim responsibility for any injury to people or property resulting from any ideas, methods, instructions or products referred to in the content.