1. Introduction
As urbanization accelerates in cities across the globe, public parks are increasingly recognized not merely as esthetic or recreational amenities, but as critical components of urban infrastructure. In rapidly growing cities like Riyadh, Saudi Arabia’s capital, public green spaces play a vital role in promoting environmental sustainability, supporting mental and physical well-being, encouraging social interaction, and improving the overall quality of urban life [
1,
2]. With Riyadh’s population projected to exceed 8.5 million by 2030 [
3], the demand for accessible, high-quality public parks is more urgent than ever. However, while the strategic urban vision of Riyadh aims to enhance livability and environmental resilience—particularly through initiatives aligned with Saudi Vision 2030—not all the city’s parks currently meet the evolving expectations of design excellence and ecological performance.
Observations reveal stark variations in the quality, accessibility, and ecological integration of public parks throughout the city. Some parks demonstrate thoughtful planning, inclusive amenities, and sustainable landscape practices, while others suffer from issues such as limited accessibility, inadequate facilities, lack of ecological sensitivity, and poor maintenance [
4,
5].
These inconsistencies often persist due to the absence of a comprehensive, standardized framework for evaluating the quality and performance of different park types—such as neighborhood parks, local parks, and large urban parks. In the absence of empirical tools to systematically assess and compare public green spaces, planners and decision-makers face challenges in identifying performance gaps, prioritizing investments, and aligning urban green infrastructure with broader environmental and social goals [
6].
This study aims to address this gap by proposing and applying a structured assessment framework to evaluate a representative sample of public parks in Riyadh. The evaluation focuses on two key dimensions: environmental sustainability and design quality. Through on-site observations and a comparative scoring method, the study investigates how different park types perform relative to these criteria. The central research question is, “How do Riyadh’s public parks perform in terms of environmental sustainability and design quality?”
By systematically analyzing public parks across various scales, this research seeks to offer evidence-based insights that can guide future planning and policy interventions. The goal is to support the creation of more inclusive, sustainable, and resilient public spaces that align with the environmental and social aspirations of a 21st-century Riyadh.
2. Literature Review
2.1. User Participation, Perception, and Satisfaction
User engagement in public space planning is a cornerstone of sustainable and inclusive urban development. In the context of urban parks, studies have consistently emphasized that active user participation enhances satisfaction by ensuring that design interventions reflect actual needs and preferences. Ref. [
7] argues that participatory design approaches not only promote higher usage rates but also improve the sense of ownership and stewardship among local communities. Similarly, ref. [
8], through their case study of Wadi Hanifa Park in Riyadh, observed that while the park was visually appreciated, issues related to lighting, accessibility, and user comfort pointed to a gap between intended design and user expectations.
In a Malaysian context, ref. [
9] established a clear relationship between user satisfaction and the presence of supportive green infrastructure such as shading, seating, and landscape maintenance. Comparable results were observed by [
10] in their study of two public parks in the UAE, where park users emphasized the significance of safety, spatial enclosure, and intuitive design layout in determining satisfaction. Collectively, these studies underscore the need to include qualitative dimensions—such as esthetics, perceived safety, and comfort—within any park evaluation tool, particularly in regions with diverse climatic and cultural contexts such as the Middle East.
2.2. Inclusive and Sustainable Design Frameworks
The evolution of urban park design has increasingly centered around concepts of inclusivity and environmental sustainability. Ref. [
11] introduced the Park Inclusive Design Index (PIDI), a pioneering tool that assesses parks based on cognitive, sensory, and physical accessibility—dimensions that are particularly relevant for accommodating people with diverse abilities. Their work contributes to the growing understanding that inclusivity goes beyond physical access to encompass emotional and experiential inclusivity as well.
In parallel, ref. [
12] proposed a multidimensional assessment model that integrates environmental resilience, user experience, and socio-cultural engagement. These perspectives are crucial in ensuring that parks serve not just as recreational facilities, but as nodes of urban resilience [
13]. Further stress this point by revealing a disconnection between intended design objectives and actual usage patterns among vulnerable populations. These disconnects, they argue, stem from a failure to adopt an equity-focused approach to public space design.
In terms of broader impacts, ref. [
14] established robust correlations between urban green space quality and public health outcomes, reinforcing the role of park maintenance and accessibility in promoting equity in urban well-being. These insights directly inform the criteria used in our case study for evaluating Riyadh’s parks, particularly in relation to environmental justice, universal accessibility, and long-term usability.
2.3. Evaluation Tools and Observational Approaches
A variety of tools have been developed to measure the performance of urban parks across physical, social, and environmental dimensions. Among the most widely used is the System for Observing Play and Recreation in Communities (SOPARC), described by [
15]. SOPARC captures data on park usage patterns, demographic information, and activity levels. Though inherently quantitative, it is often paired with qualitative feedback to create a more nuanced understanding of user behavior.
Other context-specific tools offer adaptable frameworks for regional analysis. For example, ref. [
16] applied an evaluation checklist focusing on elements such as seating arrangements, shading, cleanliness, and signage in Herat’s Taraqi Park. Their findings underscored how small design interventions could significantly affect park functionality. Meanwhile, ref. [
17] emphasized that factors like location, maintenance, and perceived safety are among the strongest determinants of park use and satisfaction.
Moreover, ref. [
18] highlighted the importance of translating academic research into actionable urban policies. This is a guiding principle of the present study, which uses checklist-based fieldwork not only for empirical analysis but also for informing local planning strategies tailored to Riyadh’s specific urban conditions.
2.4. Gaps, Contradictions, and Debates
Despite broad consensus on the significance of user-centered, sustainable design principles, key contradictions remain in the literature. Some studies, such as [
19], emphasize spatial optimization and technical infrastructures, such as land use efficiency and network connectivity, as primary concerns in park design. In contrast, scholars like [
20] focus on the emotional, psychological, and spiritual experiences afforded by green spaces. This divergence presents a challenge for constructing evaluation frameworks that are both holistic and contextually grounded.
Another critical gap involves the classification of park types in urban studies. Many investigations treat urban parks as a homogeneous category, without differentiating based on scale, function, or location. This oversight can obscure important insights related to the specific needs and performance expectations of different park typologies. The present study addresses this limitation by analyzing neighborhood, local, and large parks in Riyadh independently, recognizing that each type serves unique user groups and spatial functions.
Finally, while evaluation tools like SOPARC and the PIDI are well-established, they are predominantly developed in Western contexts. Their direct application in cities like Riyadh may overlook cultural, climatic, and spatial particularities. Our study adapts these tools to better fit the socio-environmental context of Saudi Arabia, contributing to the ongoing conversation around the localization of global planning models.
2.5. Relevance to the Case Study
This literature review establishes the conceptual and methodological groundwork for the case study by synthesizing established frameworks on participatory planning, inclusive design, and park performance evaluation. These frameworks inform the development of a context-sensitive evaluation checklist, specifically tailored to Riyadh’s distinct urban fabric and environmental conditions. The study examines 16 public parks of varying typologies through a hybrid evaluation approach that integrates both objective indicators—such as pathway connectivity, availability of seating, lighting—and subjective assessments, including user perceptions of comfort, esthetics, and safety.
By categorizing the parks according to their type and size, the study further investigates how these factors influence design outcomes and user satisfaction—an aspect that remains underexplored in the current literature. This dual focus not only bridges the gap between theoretical discourse and practical urban design but also offers actionable insights for improving public park development in Riyadh and other rapidly growing cities in similar climatic and cultural contexts.
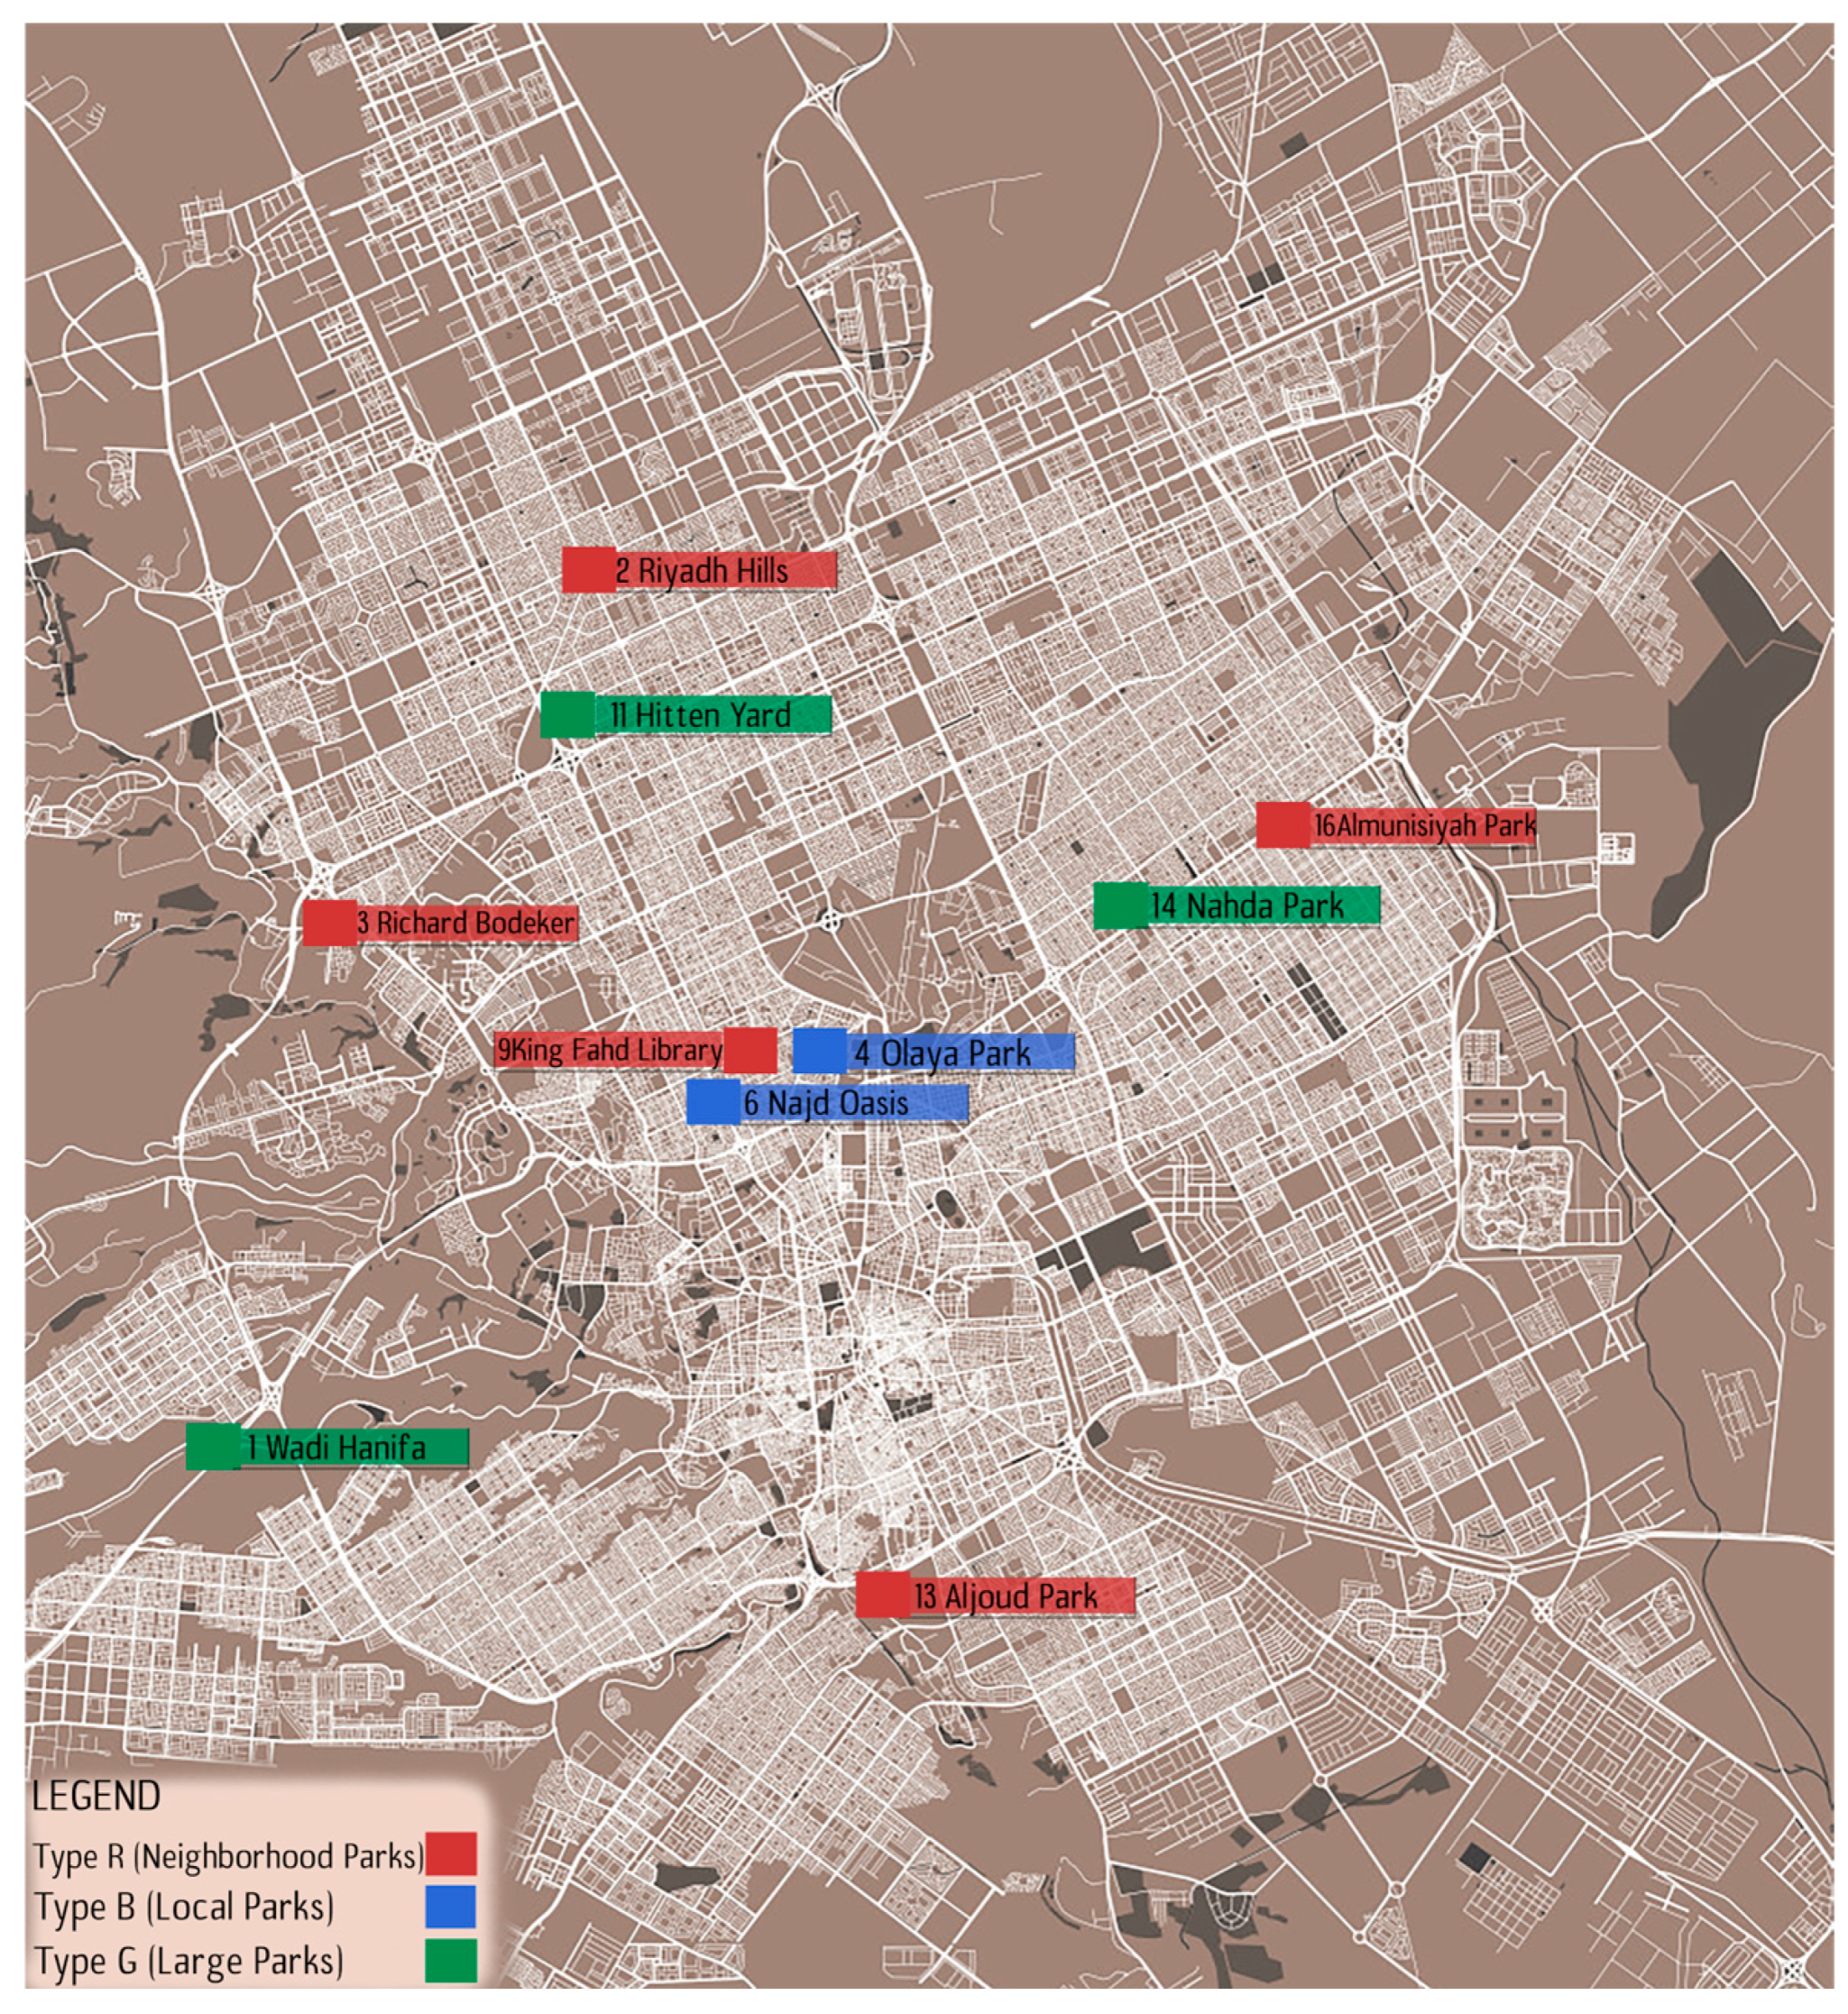
For in-depth analysis, 10 parks were selected based on strategic location to ensure spatial diversity and to investigate patterns of redundancy or scarcity across different park categories. This selection aimed to identify which types of parks—categorized as neighborhood (red), large (green), or local (blue)—are overrepresented or underrepresented across the urban landscape. Such classification supports a more nuanced understanding of the distribution and performance of urban parks within the city.
3. Materials and Methods
The research question for this study is: How do parks in Riyadh, Saudi Arabia, perform in terms of quality, functionality, and accessibility, and what improvements can be made to enhance their overall usability? To address this question, the research design follows a descriptive and comparative approach. The study evaluates 10 selected parks in Riyadh using a standardized framework of nine main categories, 50 criteria, and 155 specific descriptions. This structured method ensures a comprehensive evaluation across local, neighborhood, and large parks.
The evaluation framework consisted of nine categories, 50 criteria, and 155 specific descriptions, each operationally defined (see
Appendix A for the complete list). Categories included: (1) Landscape & Natural Elements, (2) Water Features & Cooling Systems, (3) Infrastructure & Facilities, (4) Accessibility & Mobility, (5) Safety & Security, (6) Signage & Information, (7) Sustainability & Maintenance, (8) Amenities & Services, and (9) Waste Management.
This study adopts a mixed-methods approach, integrating both qualitative and quantitative data collection to provide a comprehensive evaluation of public green spaces. Qualitative tools included systematic on-site observations, detailed descriptive field notes, and photographic documentation, all aimed at capturing contextual and experiential aspects of each park. Quantitatively, a structured rating system was employed, wherein each of the 155 assessment criteria was evaluated using a four-point scale: 3—Strongly meets the criteria, 2—Partially meets the criteria, 1—Present but not functional or effective, and 0—Completely absent or non-functional. The rationale for using a mixed-methods methodology lies in its ability to combine measurable, objective comparisons with rich, contextual insights. While the numerical scoring system facilitates a standardized evaluation across multiple sites, the qualitative observations and visual evidence illuminate real-world conditions and nuances that numbers alone may overlook. To further enhance the objectivity and reliability of the analysis, case studies—particularly two benchmark parks from London—were integrated into the framework. These served not only as reference points for best practices but also as tools to minimize bias and enhance interpretive depth. Each park’s maximum possible score was 255, enabling clear comparison across the parks.
In assessing the features of a park or public space, it is essential to prioritize elements based on their significance to user experience, safety, and functionality. To achieve this, a weighted criteria system is applied, where each feature is assigned a weight that reflects its relative importance. Features considered critical—such as accessibility, safety and security, and emergency access—are assigned the highest priority with a weight of ×2, recognizing their fundamental role in ensuring the park is inclusive, secure, and responsive to urgent needs. Important features—such as shaded seating, water fountains, waste disposal, and maintenance frequency—receive a moderate weight of ×1.5, acknowledging their significant contribution to comfort, usability, and environmental sustainability. Lastly, features categorized as standard—including esthetic landscaping, seasonal flowers, event spaces, and digital kiosks—are assigned a weight of ×1, as they enhance the overall appeal and functionality but are not essential for basic operation and safety. This weighted approach ensures a balanced and strategic evaluation, emphasizing the elements that most directly impact accessibility, safety, and quality of experience for diverse user groups.
The 10 parks in Riyadh were selected to represent a diverse range of types and sizes, including local, neighborhood, and large-scale parks. The selection criteria focused on accessibility, functionality, and diversity to ensure a comprehensive, citywide representation. To support validation and provide benchmarking references, additional parks from outside Riyadh were included for comparison. These examples featured prominent and well-regarded parks such as Hyde Park and Regent’s Park in London. The map (
Figure 1) illustrates the distribution and typology of all selected parks across Riyadh, highlighting their locations and classifications.
All the selected parks are under the jurisdiction of Riyadh Municipality (Amanat Al-Riyadh). Strategic planning, design guidelines, and maintenance funding are administered centrally through the General Administration of Parks and Landscaping, while day-to-day upkeep of smaller neighborhood and local parks is carried out by local sub-municipalities (baladiyahs). This unified governance framework ensures standardized policies, although implementation quality may vary across districts.
According to Riyadh Municipality records, the city contains over 2300 public parks distributed across three typologies: approximately 1800 neighborhood parks (Type R) embedded within residential districts, around 350 local parks (Type B) serving multiple neighborhoods, and roughly 150 large urban parks (Type G) acting as city-scale destinations.
The 10 parks in Riyadh were selected using a stratified purposive sampling approach to ensure representation of different park typologies (neighborhood, local, and large-scale) and geographic spread across the city. The inclusion criteria were (i) designation as a public park by Riyadh Municipality, (ii) operational and accessible during the data collection period (March–April 2024), and (iii) containing baseline features (pathways, seating, or open green areas) that allowed evaluation under the assessment framework. Parks undergoing extensive renovation or closed for maintenance were excluded. Stratification by size and function (small neighborhood parks, medium local parks, and large-scale urban parks) was applied to capture diversity in spatial scale and user profiles. This ensured that the sample reflected not only geographic distribution but also variation in ecological and social roles.
For benchmarking and validation, two internationally recognized parks—Hyde Park and Regent’s Park in London—were included as reference cases, falling under Type G Category, Large Parks.
Figure 1 illustrates the geographic distribution and typology of the Riyadh parks.
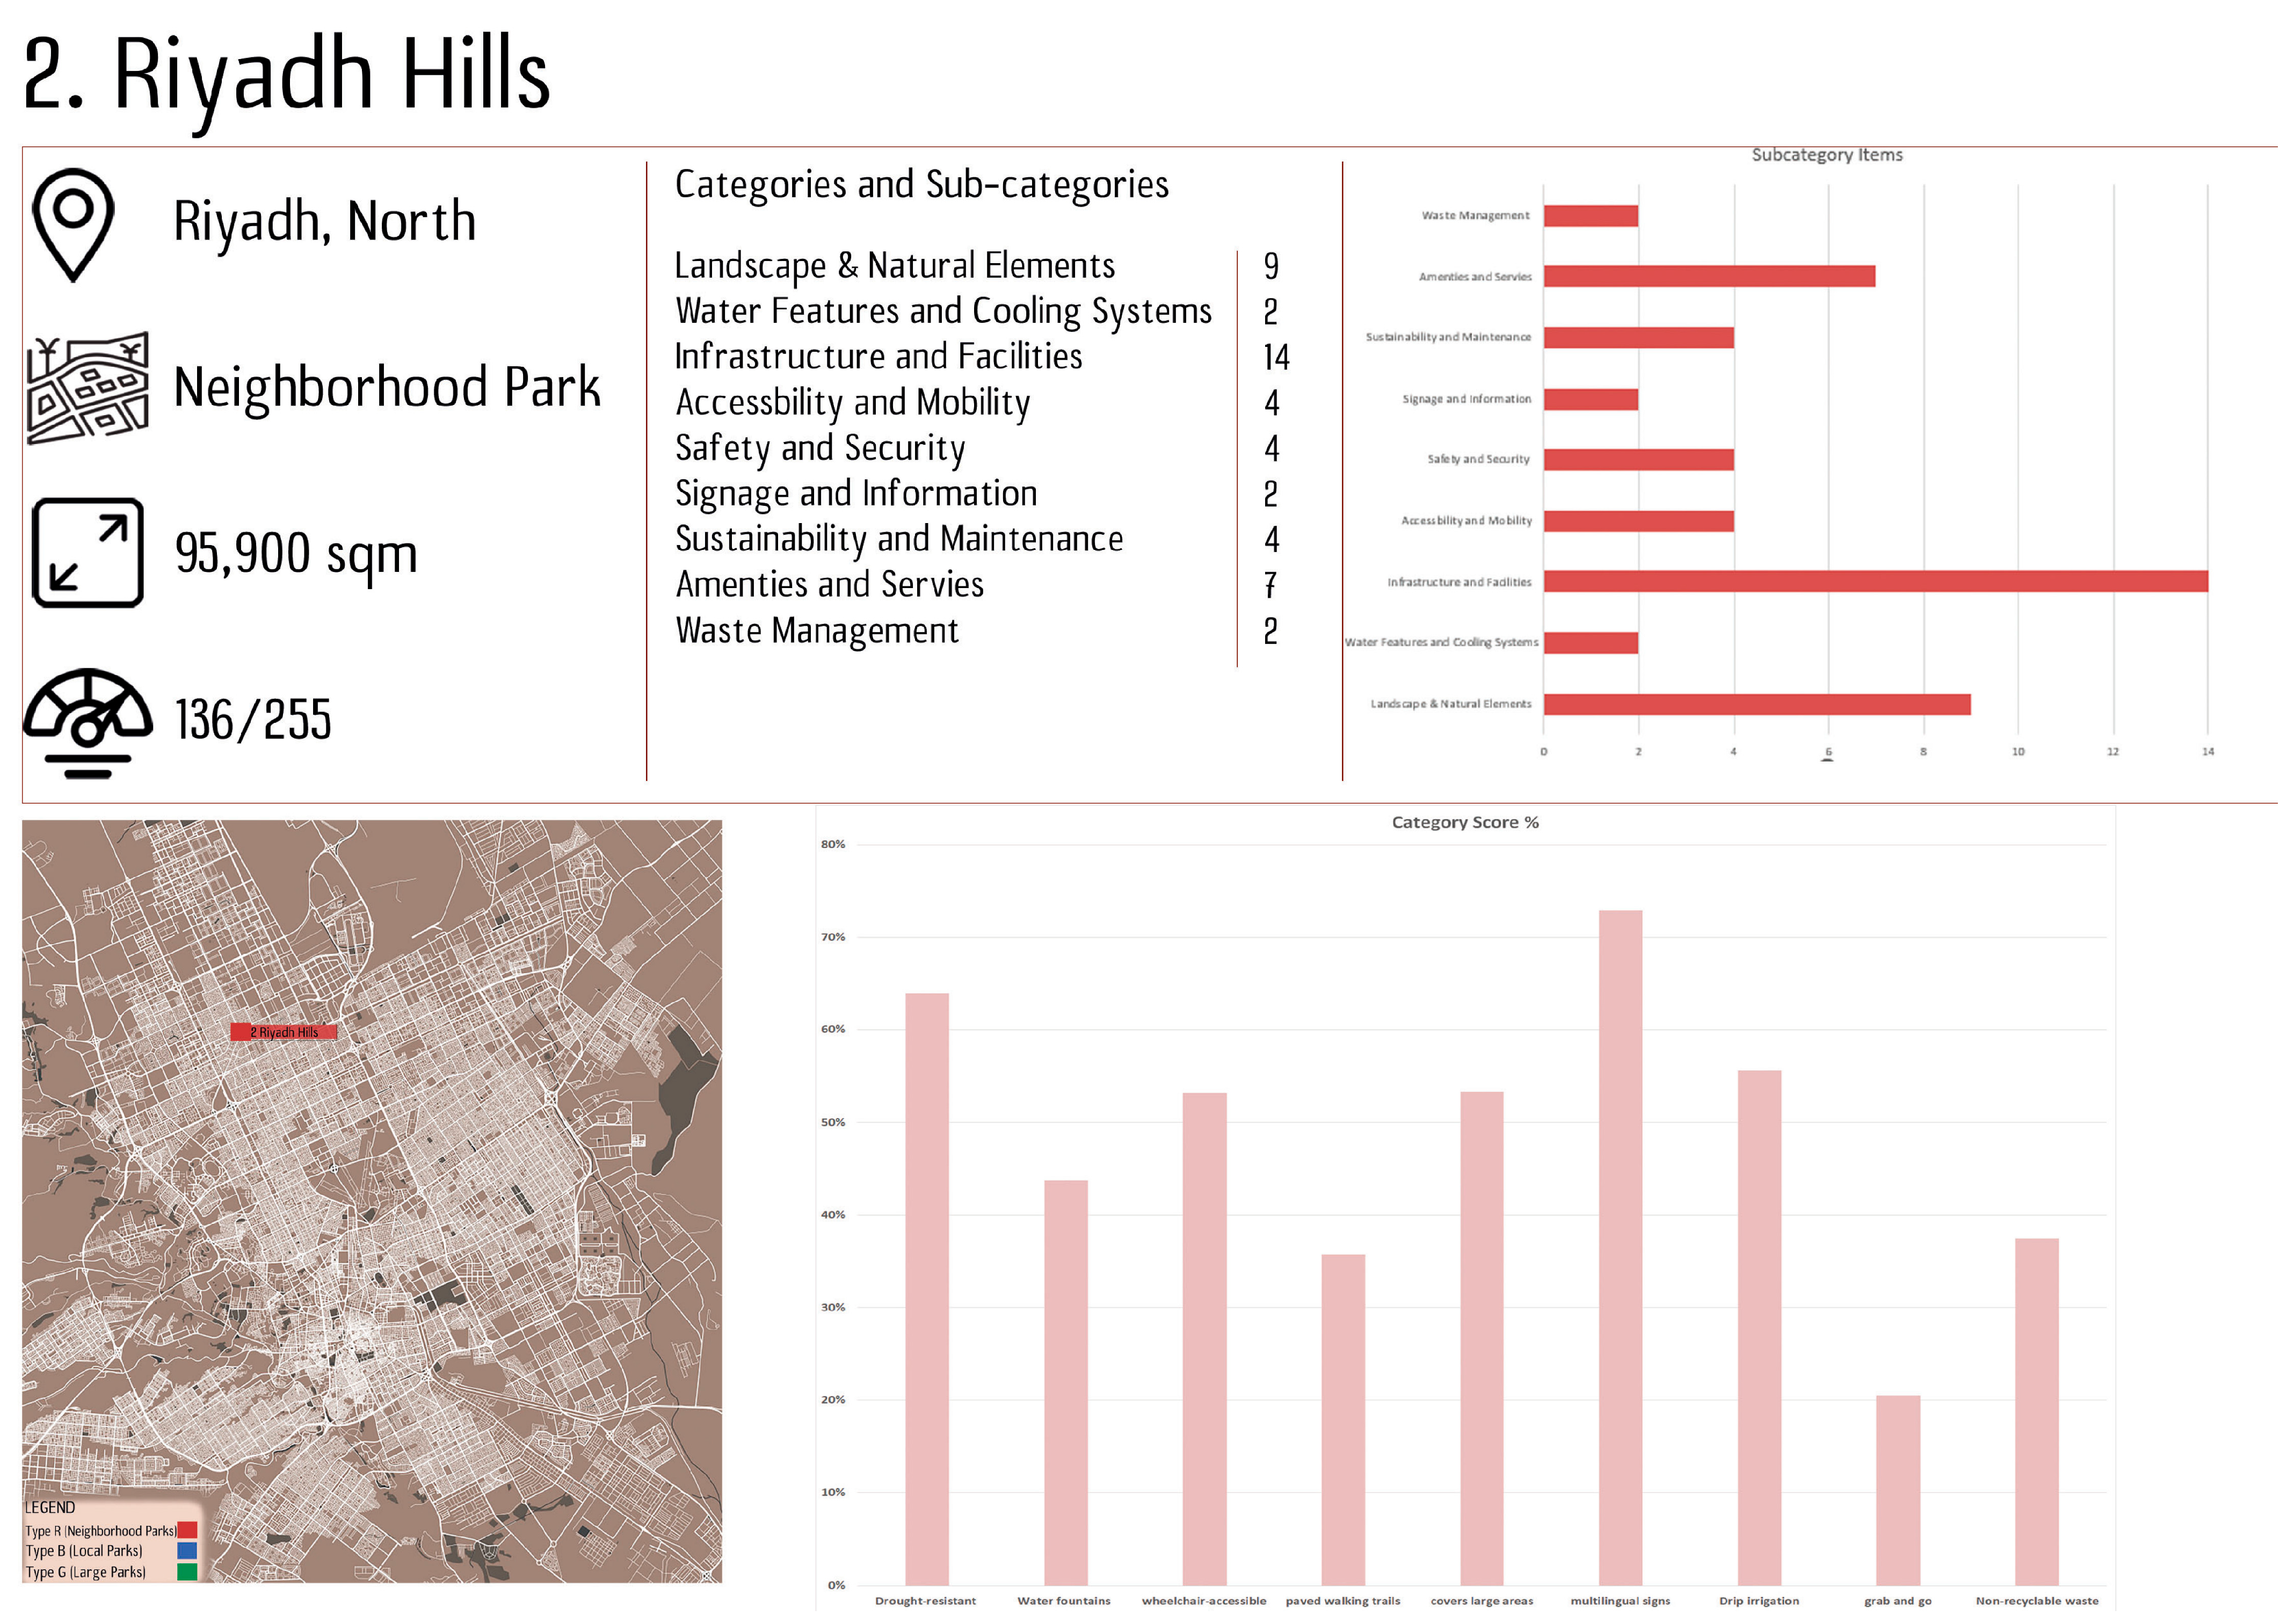
Figure 2 presents high-resolution dashboards, with enlarged labels, that detail typology, area, and scoring for each park to ensure legibility and facilitate independent verification of the representativeness claims. In addition to typology and spatial distribution, the approximate age of each park was recorded from Riyadh Municipality documents and on-site plaques to contextualize design and maintenance differences. Parks established before 2010 were classified as older, and those established after 2015 as newer, as shown in
Table 1.
3.1. Scoring Methodology for Park Assessment
To assess each park’s performance across various domains, category scores were calculated by summing the products of each criterion’s rating and its assigned weight (Standard = 1, Important = 1.5, Critical = 2). The weighted sum for each category was then normalized to a percentage, allowing for comparative evaluation across parks of different sizes and feature distributions. The category score percentage was computed using the following formula:
This approach ensures that each category’s contribution reflects both the presence and quality of its features relative to their potential maximum score.
The final score for each park was calculated by aggregating all normalized and weighted category scores. To reflect their varying significance in park design and functionality, categories were assigned relative weights (e.g., Accessibility = 20%, Safety = 15%, Amenities = 10%, etc.). The final overall score was then calculated as a weighted sum of the individual category scores:
This method allows for a balanced, multidimensional evaluation of each park’s performance, accounting for both quantitative scoring and thematic importance.
3.2. Data Collection Process
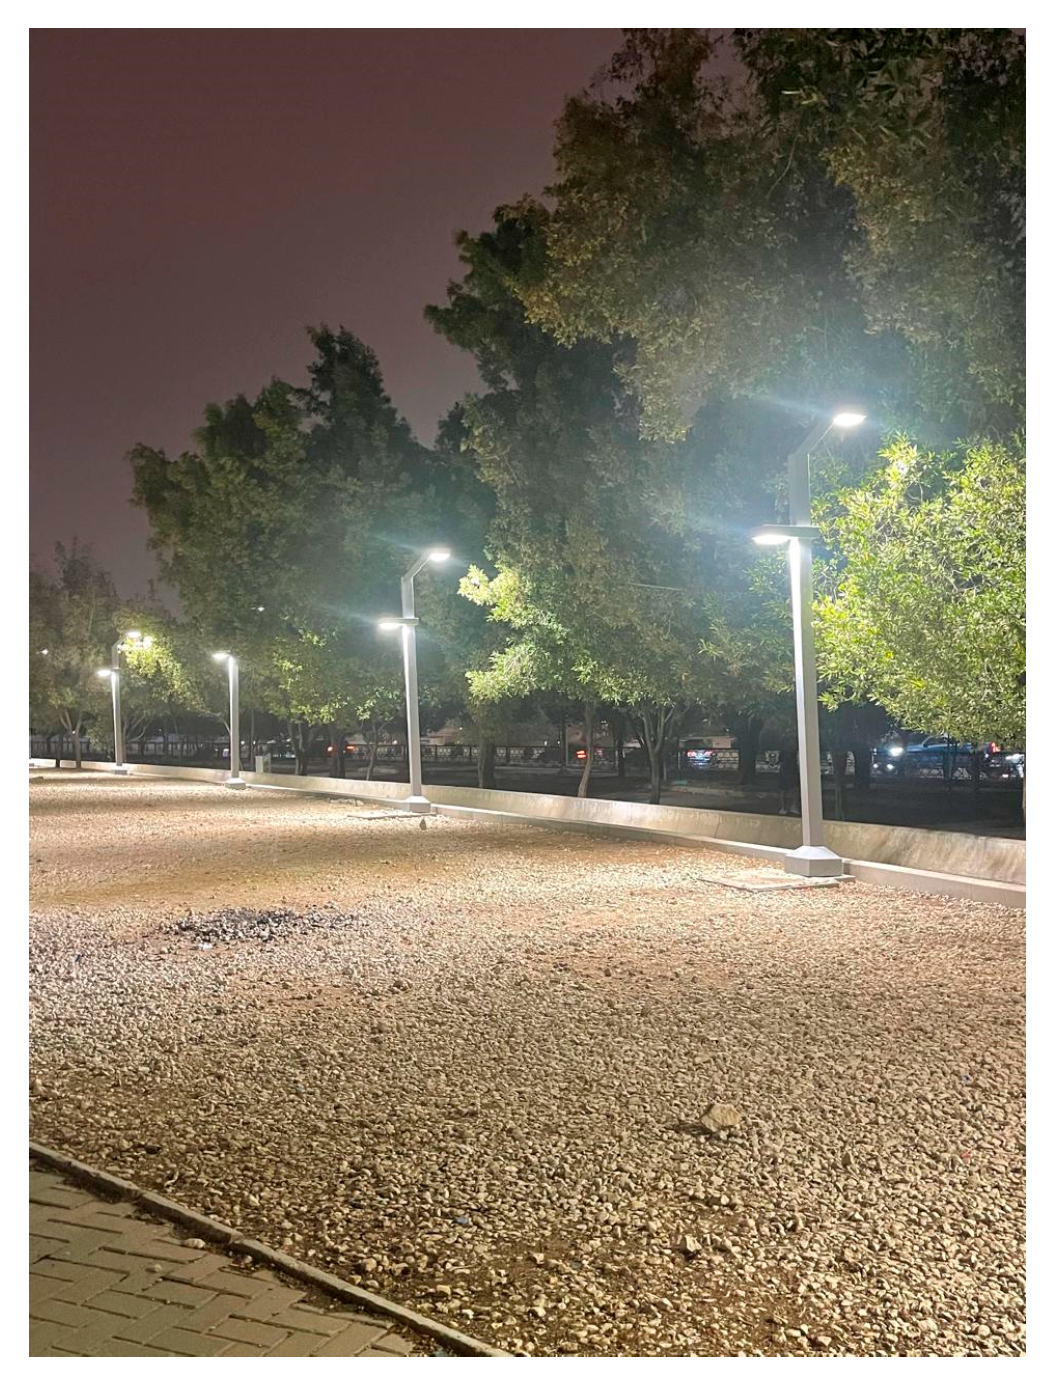
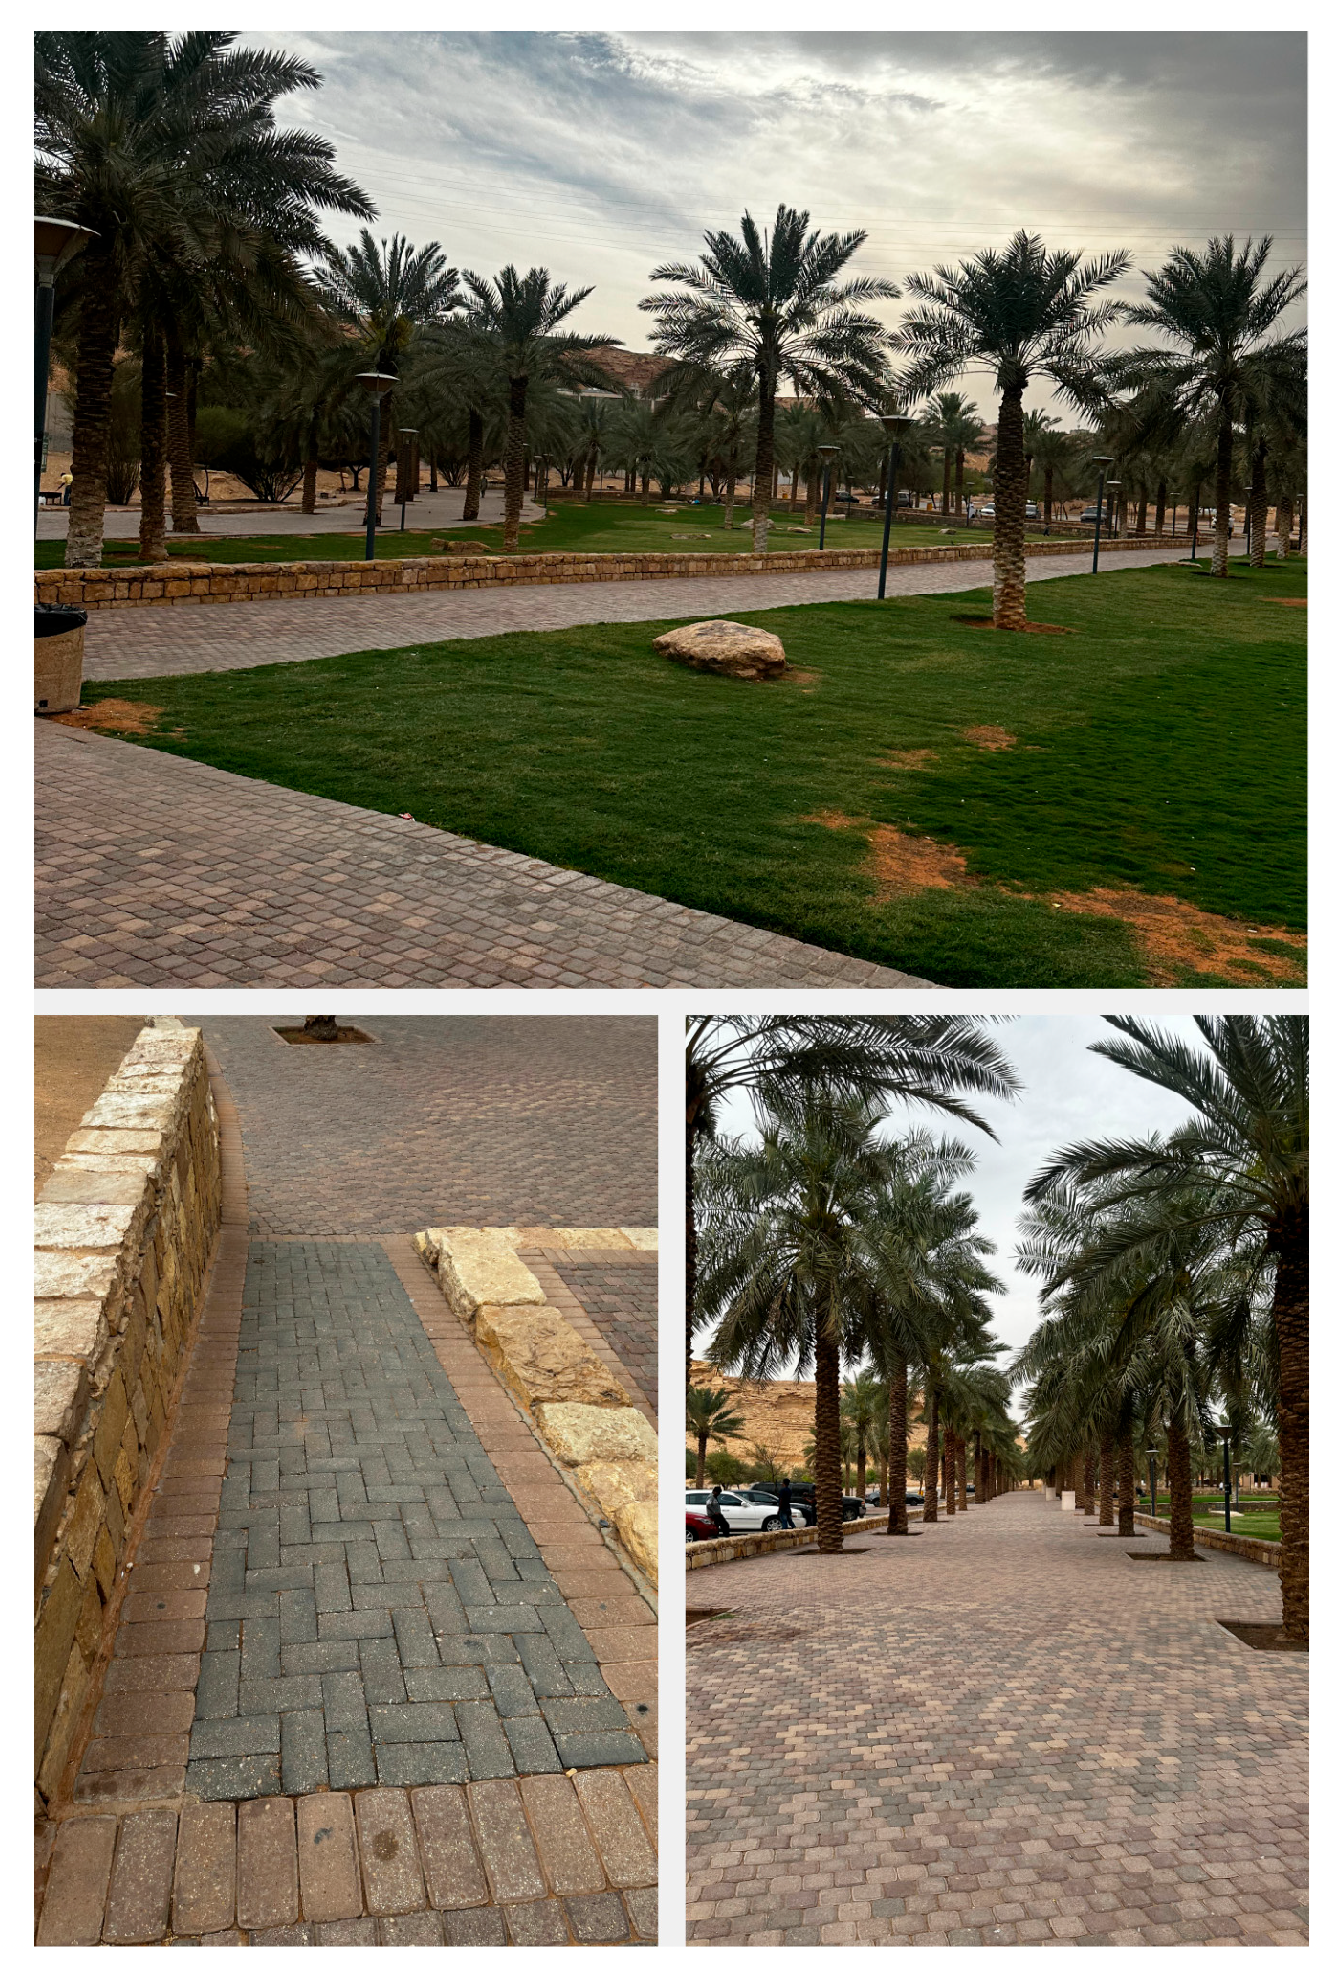
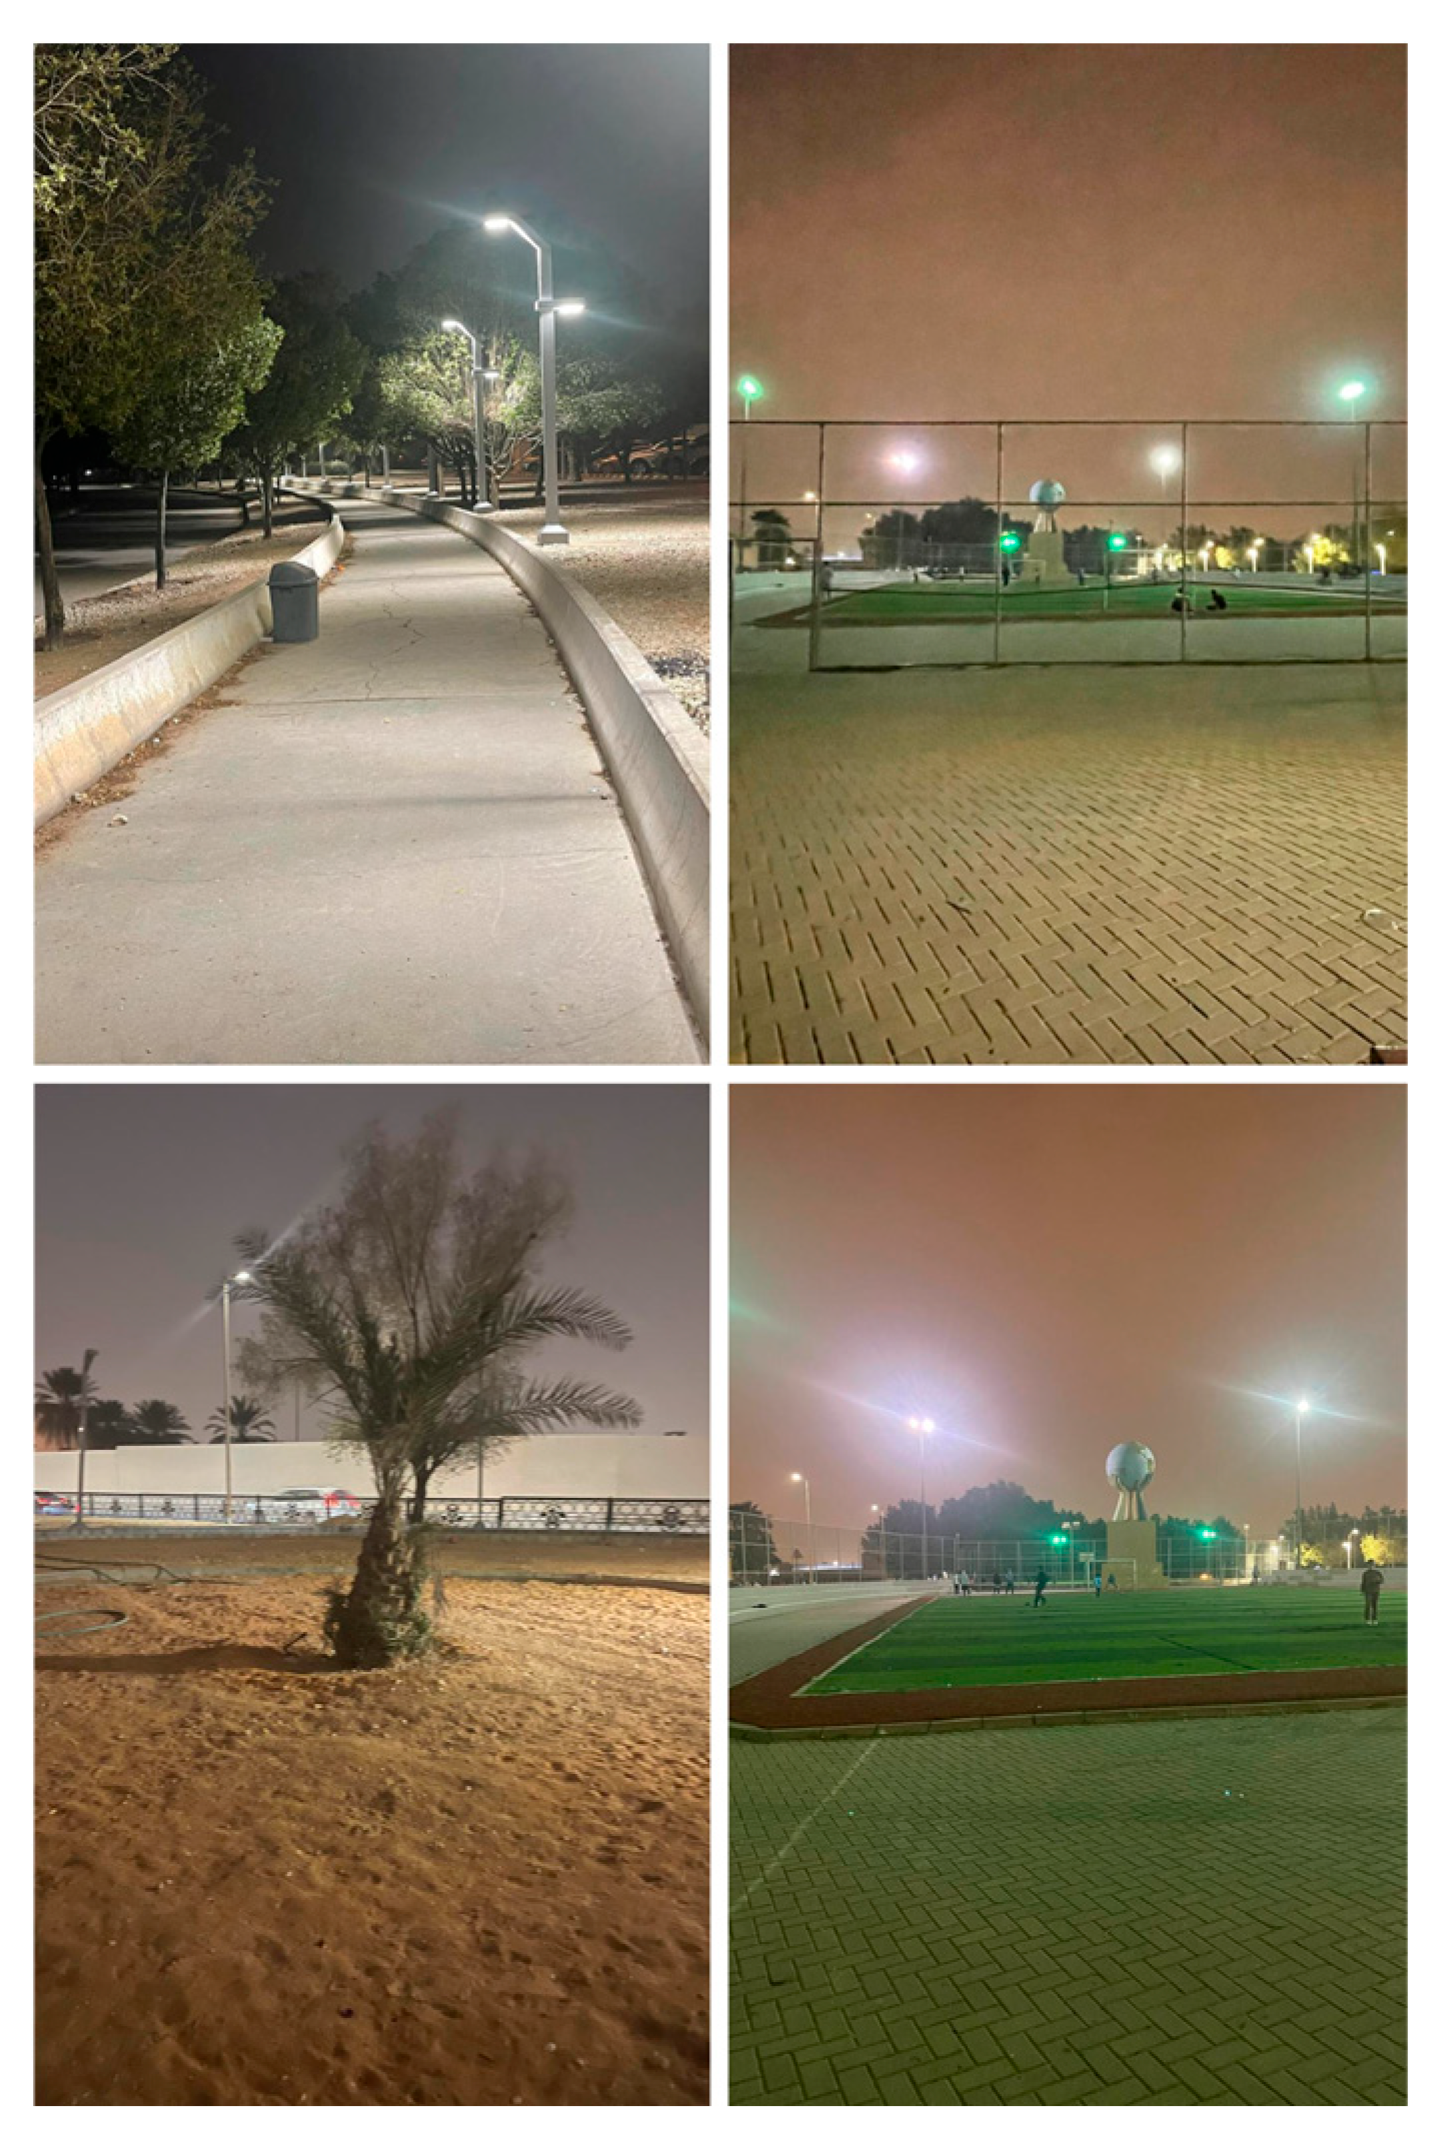
Field visits were conducted for each park between March and April 2024, coinciding with the end of the winter season in Riyadh. This timing was ideal due to moderate weather conditions, ensuring that the parks were in regular use and easier to evaluate under typical usage patterns. During these visits, data were recorded in structured tables and supported by photographs. Researchers assessed each description across the nine categories to maintain consistency. To minimize subjectivity, case studies and international park benchmarks were referenced throughout the evaluation process. Below are site photographs taken throughout the data collection process.
4. Results
4.1. Neighborhood Parks (Type R)
Table 2 and
Figure 3 and present a summary table and corresponding graphs that illustrate the evaluation results for each Neighborhood Park. A total of five parks—Munisyah Park, Al Joud Park, Riyadh Hills, King Fahd Library Park, and Richard Bodeker Park—were assessed across nine performance categories.
The analysis reveals significant variations across both parks and categories, underscoring key strengths and weaknesses in design and operational aspects. Al Joud Park and Riyadh Hills emerged as the top performers, with several category scores exceeding 60%, and peak scores reaching 76% and 73% in Signage & Information. This suggests that these parks offer well-structured navigation and communication systems, contributing to better user experience and accessibility.
In contrast, Munisyah Park and King Fahd Library Park demonstrated the lowest overall performance, with most category scores falling below 40%. Particularly low scores were recorded in Waste Management (8% in Munisyah Park) and Water Features & Cooling Systems (0% in King Fahd Library Park and 13% in Munisyah Park), indicating critical deficiencies in environmental comfort and maintenance provisions.
The presence of wide error bars further emphasizes the inconsistency in quality among Neighborhood Parks. This variability prompts deeper investigation into the spatial distribution of underperforming parks and raises important questions about alignment with the development priorities outlined in Saudi Arabia’s Vision 2030. Addressing these disparities is essential to ensure equitable access to well-designed public spaces across all neighborhoods.
Within the Neighborhood Parks category, Safety and Security emerged as the highest-performing aspect, particularly in Richard Bodeker Park (77%), followed by Al Joud Park (55%) and Riyadh Hills (53%). These results suggest a thoughtful integration of safety measures such as adequate lighting, surveillance systems, and overall security planning. Similarly, the Landscape and Natural Elements category showed strong performance in Al Joud Park (65%) and Riyadh Hills (64%), contrasting sharply with the lower score observed in King Fahd Library Park (34%), highlighting inconsistent landscape quality and vegetation strategies.
The Water Features and Cooling Systems category displayed extreme variability. While Richard Bodeker Park scored the highest at 75%, indicating effective microclimate interventions, King Fahd Library Park scored 0%, and Munisyah Park only 13%, pointing to a lack of investment in climate-responsive features in some locations. Al Joud Park and Riyadh Hills performed moderately well in this category, at 44% each.
Infrastructure and Facilities received mid-range scores across all parks, suggesting a relatively uniform but average provision of essential amenities. Scores ranged from 40% in King Fahd Library Park to 58% in Al Joud Park, with a standard deviation of 8, indicating modest variation.
The Signage and Information category showed the greatest disparity: Al Joud Park achieved the highest score at 76%, reflecting clear and accessible signage, while Richard Bodeker Park recorded the lowest score at just 4%, suggesting a lack of navigational aids and informational displays.
Accessibility and Mobility also varied significantly, ranging from just 14% in Munisyah Park to 58% in Al Joud Park. This disparity leads to inconsistent attention to inclusive and barrier-free design features that support diverse user needs.
Sustainability and Maintenance showed more stable performance, with scores ranging from 37% to 57%, indicating a moderate and more consistent effort across the parks in terms of upkeep and sustainable practices.
By contrast, Amenities and Services were underdeveloped in most parks, with all scoring below 35%, signaling limited availability of restrooms, kiosks, and recreational features.
Finally, Waste Management emerged as the weakest overall category. Munisyah Park scored a critically low 8%, while King Fahd Library Park and Richard Bodeker Park both achieved 50%, suggesting uneven levels of cleanliness and waste handling practices across the neighborhood parks. These findings highlight the need for targeted interventions to raise the baseline performance and ensure equitable service delivery citywide.
Within the Neighborhood Parks typology, the Signage and Information category exhibited the highest standard deviation at 33%, reflecting the greatest variability across the evaluated parks. This wide disparity underscores the inconsistency in prioritizing wayfinding and informational elements, pointing to a lack of unified strategy for enhancing user navigation throughout the city’s park network.
Similarly, Accessibility and Mobility showed considerable variation, with scores ranging from a low of 14% to a high of 58%. This significant gap highlights uneven commitments to inclusive design principles, suggesting that equitable pedestrian access—especially for individuals with disabilities or limited mobility—is not uniformly integrated into park planning and implementation.
In contrast, Amenities and Services demonstrated the lowest standard deviation at just 5%, indicating minimal variation among the parks. While the scores in this category were generally low, the consistency suggests a uniformly modest provision of services such as restrooms, food kiosks, and recreational features—highlighting an opportunity for city-wide upgrades that could enhance overall user experience in a balanced manner.
4.2. Local Parks (Type B)
Table 3 and
Figure 4 show the Local Parks typology, represented by Najd Oasis Park and Al Olaya Park, demonstrates a generally well-balanced performance, with comparable scores across several evaluation categories. However, Najd Oasis Park consistently outperforms Al Olaya Park in multiple aspects, as shown in the accompanying table and graph. This performance suggests a higher level of attention to operations, maintenance, and user-centered infrastructure design in Najd Oasis Park.
Most notably, Waste Management achieved a perfect score of 100% in Najd Oasis Park, making it the highest-scoring category across both parks. This reflects effective sanitation strategies and a strong commitment to cleanliness. Meanwhile, Infrastructure and Facilities emerged as the strongest category in Al Olaya Park, scoring 71%, indicating a well-developed provision of essential amenities and structural elements.
These results point to differing priorities and management practices between the two parks, offering insights into how localized planning approaches can impact park quality within the same typological category.
At the category level within the Local Parks typology, both Landscape and Natural Elements (55–59%) and Water Features and Cooling Systems (56–59%) demonstrated strong and consistent performance across the two parks. These results highlight a clear emphasis on integrating environmental sensitivity and climate-responsive design strategies in both Najd Oasis Park and Al Olaya Park.
In terms of Infrastructure and Facilities, Al Olaya Park stood out with a score of 71%, indicating a well-developed provision of built features. In contrast, Najd Oasis Park scored significantly lower at 44%, revealing a disparity in structural amenities and physical infrastructure.
The most pronounced variation was observed in the Safety and Security category. Najd Oasis Park excelled with a score of 70%, whereas Al Olaya Park lagged considerably at 31%, reflecting inconsistencies in implementing security measures such as lighting, surveillance, and visibility.
Accessibility and Mobility and Signage and Information were consistently weak in both parks, with nearly identical scores ranging from 31% to 34%. This suggests limited attention to inclusive access and navigational clarity, which are essential for enhancing user experience across diverse demographic groups.
The Sustainability and Maintenance category also revealed a notable performance gap, with Najd Oasis Park scoring 63% compared to 41% in Al Olaya Park, indicating better upkeep and long-term environmental stewardship in the former.
Amenities and Services remained underdeveloped in both parks, although Najd Oasis Park scored 44%, exactly double that of Al Olaya Park (22%), suggesting a more user-oriented approach in providing features like seating, kiosks, or play areas.
Finally, Waste Management emerged as the strongest-performing category in both parks, with Najd Oasis Park achieving a perfect score of 100%, underscoring its exemplary maintenance and cleanliness standards.
In terms of performance variability within the Local Parks typology, the differences between Najd Oasis Park and Al Olaya Park were generally moderate; however, three categories exhibited significant disparities. Safety and Security showed a substantial gap of 39%, followed by Infrastructure and Facilities with a 27% difference. Waste Management stood out with both the highest score gap of 50% and the highest standard deviation of 35, reflecting stark contrasts in sanitation and maintenance practices between the two parks.
In contrast, Accessibility and Mobility and Signage and Information demonstrated the lowest variability, with score differences ranging from 1% to 3% and standard deviations of just 1–2 points. This suggests a consistently underwhelming performance across both parks in these categories, indicating a lack of formal design standards or investment in wayfinding and inclusive access within this typology.
4.3. Large Parks (Type G)
It is to note that Large Parks,
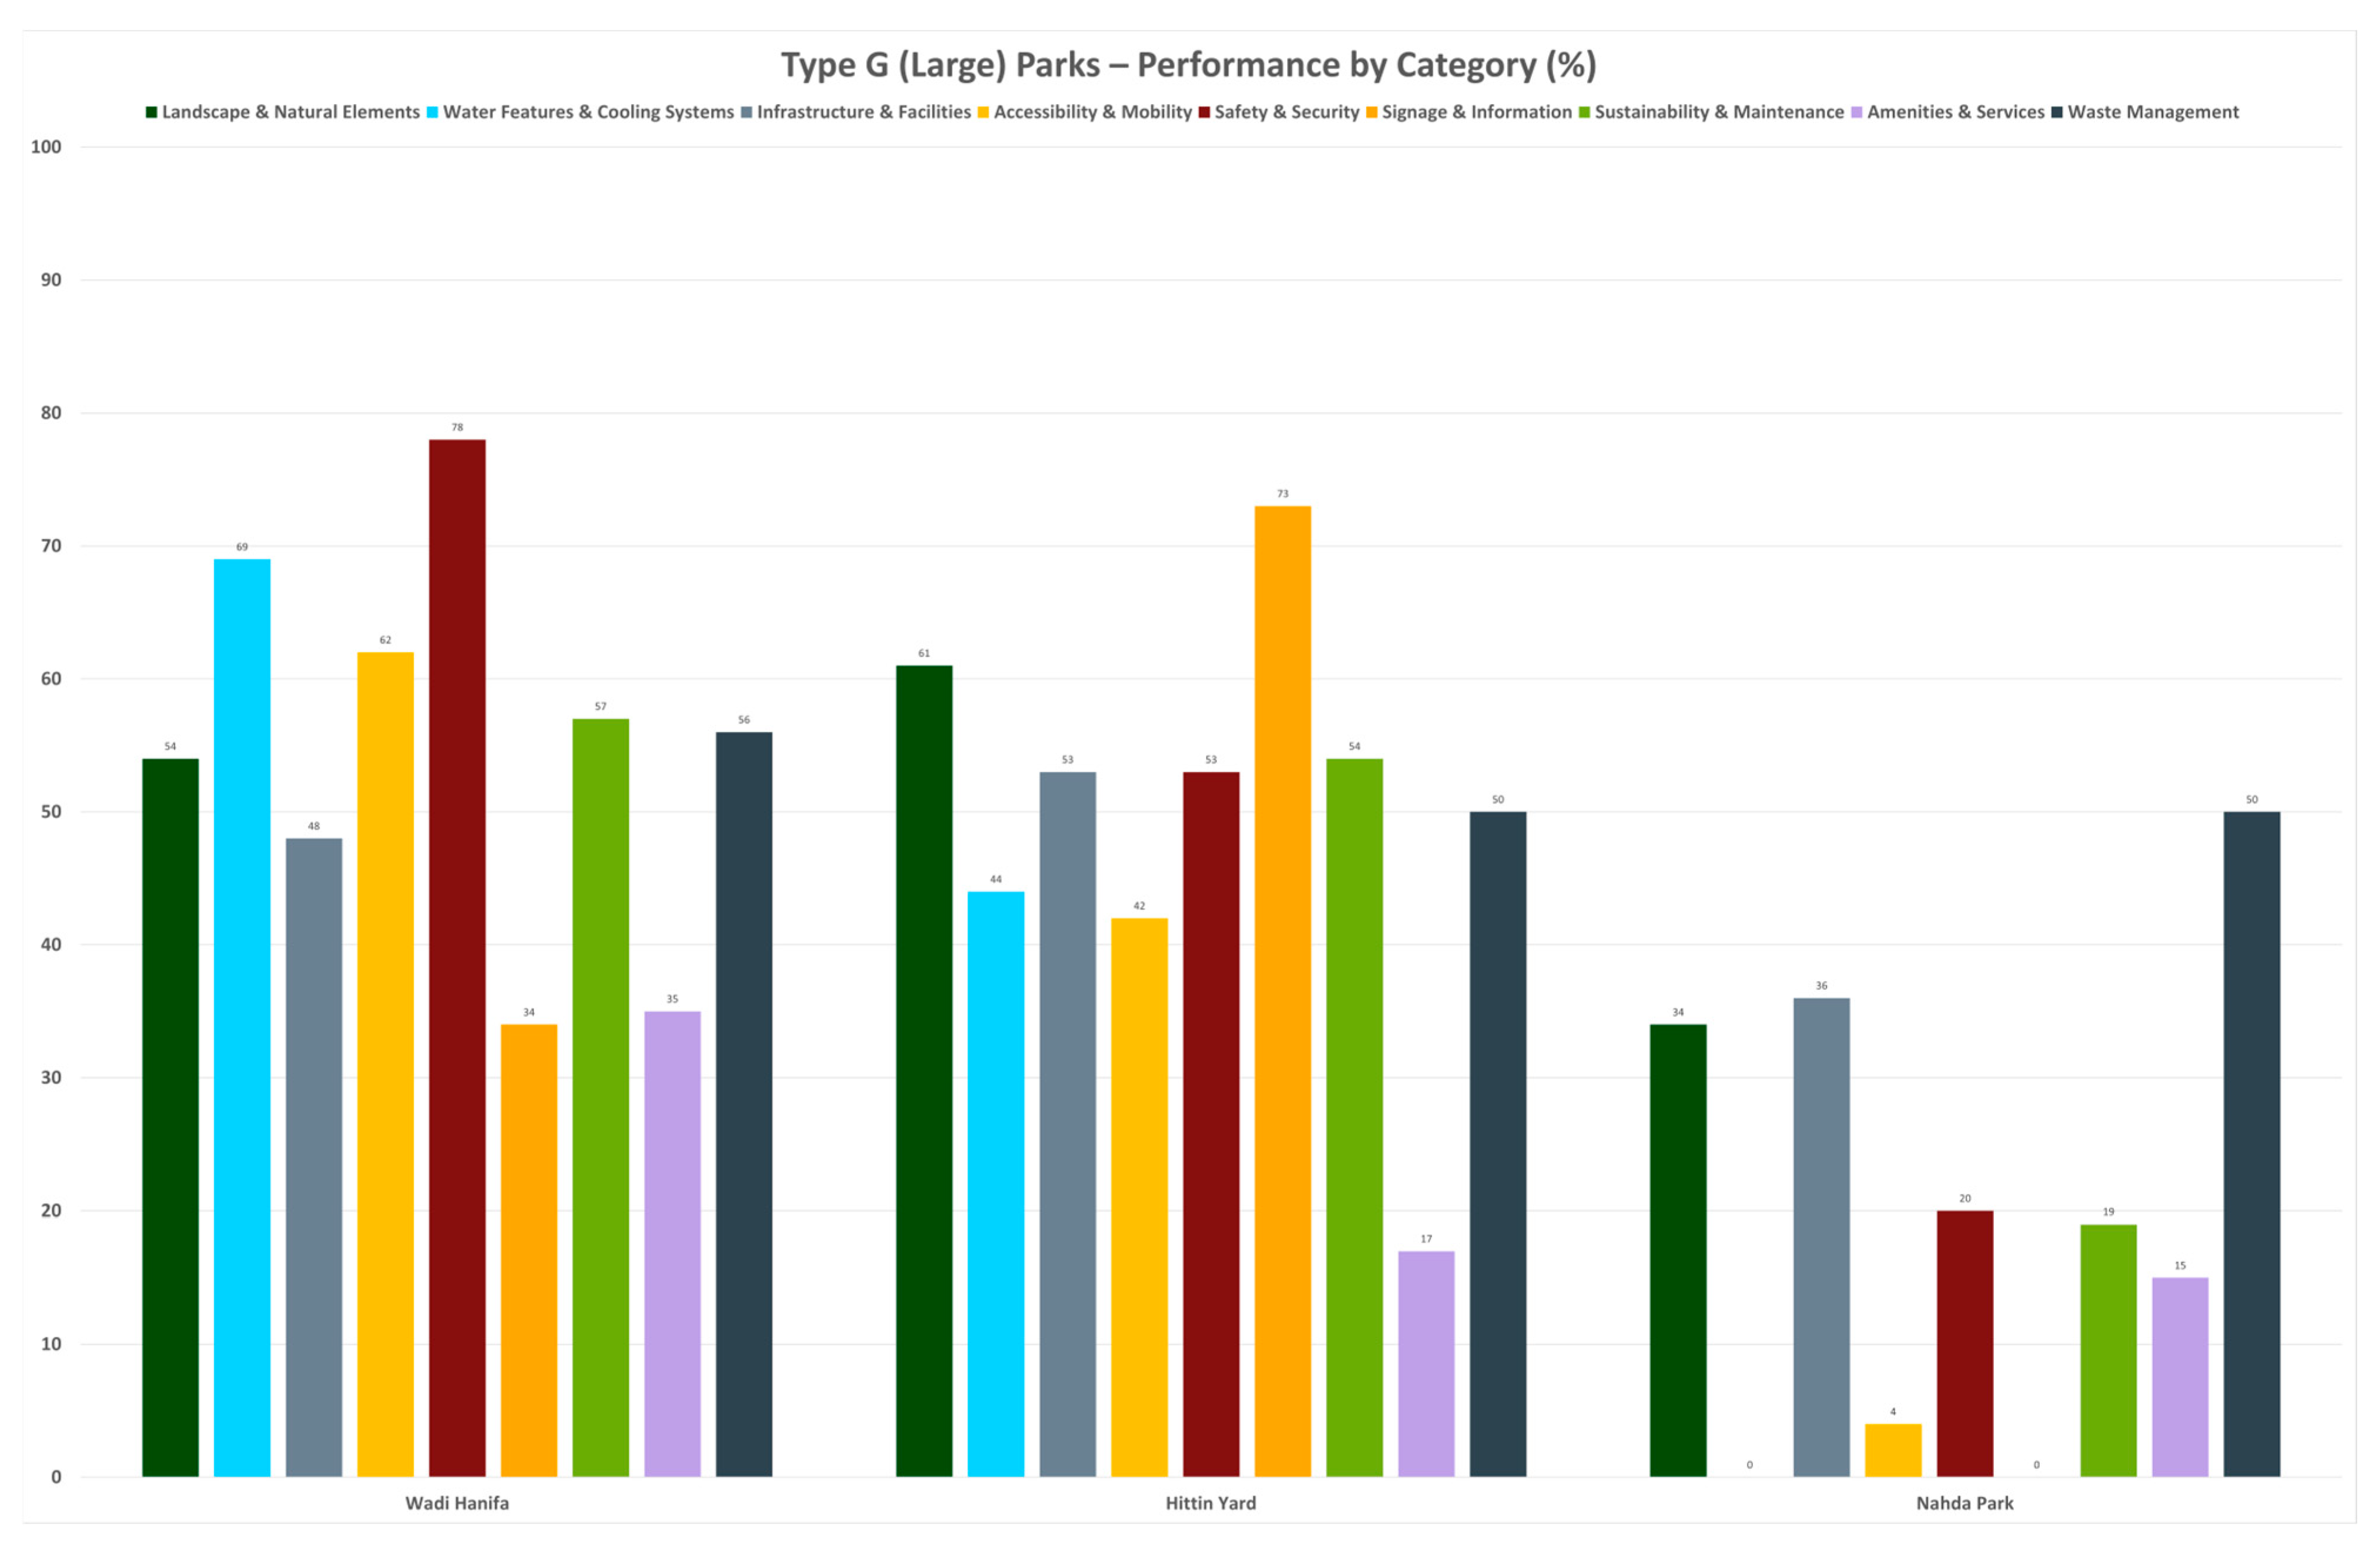
Table 4 and
Figure 5, had the widest performance range among all the typologies. Wadi Hanifa Park outperforms the other two parks, and Al Nahda Park is the poorest in most of the categories. Wadi Hanifa’s Safety and Security category scored the highest amongst all parks, and Al Nahda Park scored the lowest in Signage and Information and Water Features, and Cooling Systems. Hittin Yard had the highest score in the Signage and Information category across all.
In this level, Safety and Security is the strongest performing category, 78% in Wadi Hanifa, 53% in Hittin Yard, and 20% in Nahda Park; however, the variance shows unequal levels of surveillance, lighting, and other security-tied aspects not considered in an equal basis. Water Features and Cooling Systems and Accessibility and Mobility also show large contrasts; Wadi Hanifa has the lead in both categories, 69–62%, respectively, Hittin Yard in the middle of both parks, 44–42%, respectively, and Nahda Park with the poorest score of 0% and 4%, respectively. The scores’ variance shows a lack of both basic climate adaptive and pedestrian-inclusive design. Landscape and Natural Elements and Sustainability and Maintenance show mid-range performance in Wadi Hanifa and Hittin Yard; again, with Nahda Park underperforming in these areas. Moreover, Infrastructure and Facilities have lower variation in comparison with previous categories, 36% to 53%. On the other hand, Signage and Information has a dramatic range, Hittin Yard achieves 73%, Wadi Hanifa 53%, and 0% for Nahda Park, indicating a major imbalance of wayfinding throughout this typology. Waste Management was the most consistent, with similar scores of 50% to 56% in all parks, showing a shared baseline for this aspect.
In the Large Parks, the variability is profound, especially in categories like Accessibility and Mobility with a range of scores of 62% to 4%, Water Features and Cooling Systems, 69% to 0%, and Signage and Information 73% to 0%, all of which having the highest standard deviations of 27, 31, and 52, respectively. This highlights major discrepancies in prioritizing essential user-facing features. In contrast, Waste Management has a value of 0 standard deviations, indicating a remarkably similar score between the three parks 50–56%. In conclusion, the data given shows that while some categories achieve almost optimum levels, others fall drastically, showing inconsistency in service qualities in this typology.
5. Key Insights Across All Parks’ Typology
In all the three parks’ typologies, the category-level performance shows recurring strengths and weaknesses. Safety and Security always ranked in the top-performing categories, especially in Wadi Hanifa (78%, large parks) and Richard Bodeker (77%, neighborhood parks) indicating strong investments in protection and security for the users. Both Water Features and Cooling Systems and Landscape and Natural Elements categories have witnessed strong results in several parks, which emphasize how keen designers are to environmental aspects in selected locations; however, Amenities and Services and Signage and Information categories were always underdeveloped across most sites, reflecting systemic neglect of user comfort and wayfinding.
In terms of variability, Type G parks, large parks, had the highest disparities among each other–especially in Accessibility, Signage and Water Features–with some parks having optimal scores and others scoring zeros. Local Parks, Type B, displayed somehow balanced results but inevitably some uneven results too. Neighborhood Parks, type R, had very inconsistent quality results and the highest gaps, especially in operational areas like Waste Management, showing how some zones are clearly getting developed more than others.
Collectively, the analysis of these parks highlights the necessity of standardizing parks design, setting a clear benchmark, and targeting essential updates in user-centered and sustainability-related elements to improve parks across Riyadh and across all typologies of parks.
6. Site Observations
To validate the evaluation results, site visits were conducted across all 10 parks in this research. The visits aimed to justify the results and the scoring performed. Performance gaps were measured to identify missing elements such as absent signages, poor accessibility, lack of shading, lack of water features, and poor maintenance etcetera.
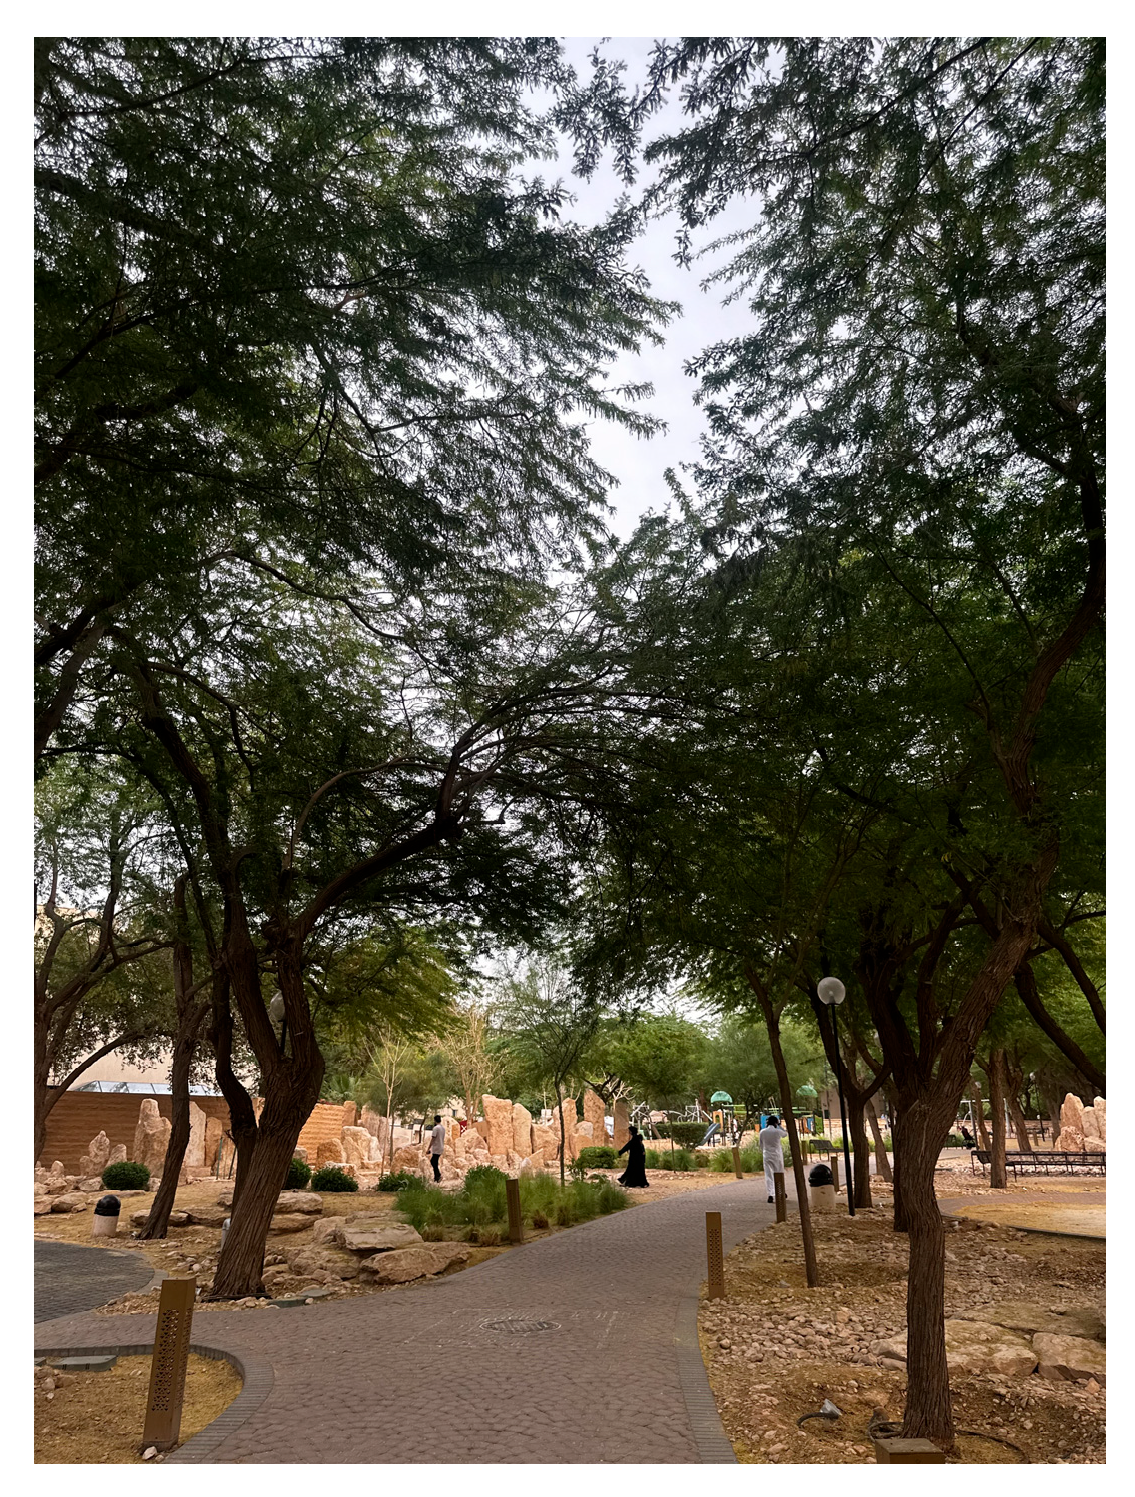
Figure 6 shows the pebbles in the Al Nahda park and their lack of water features, making breeze and cooling a challenging aspect in this park. On the other hand, one can observe the keen care in Al Joud Park with irrigation systems distributed where necessary, shown in
Figure 7.
Moreover, in
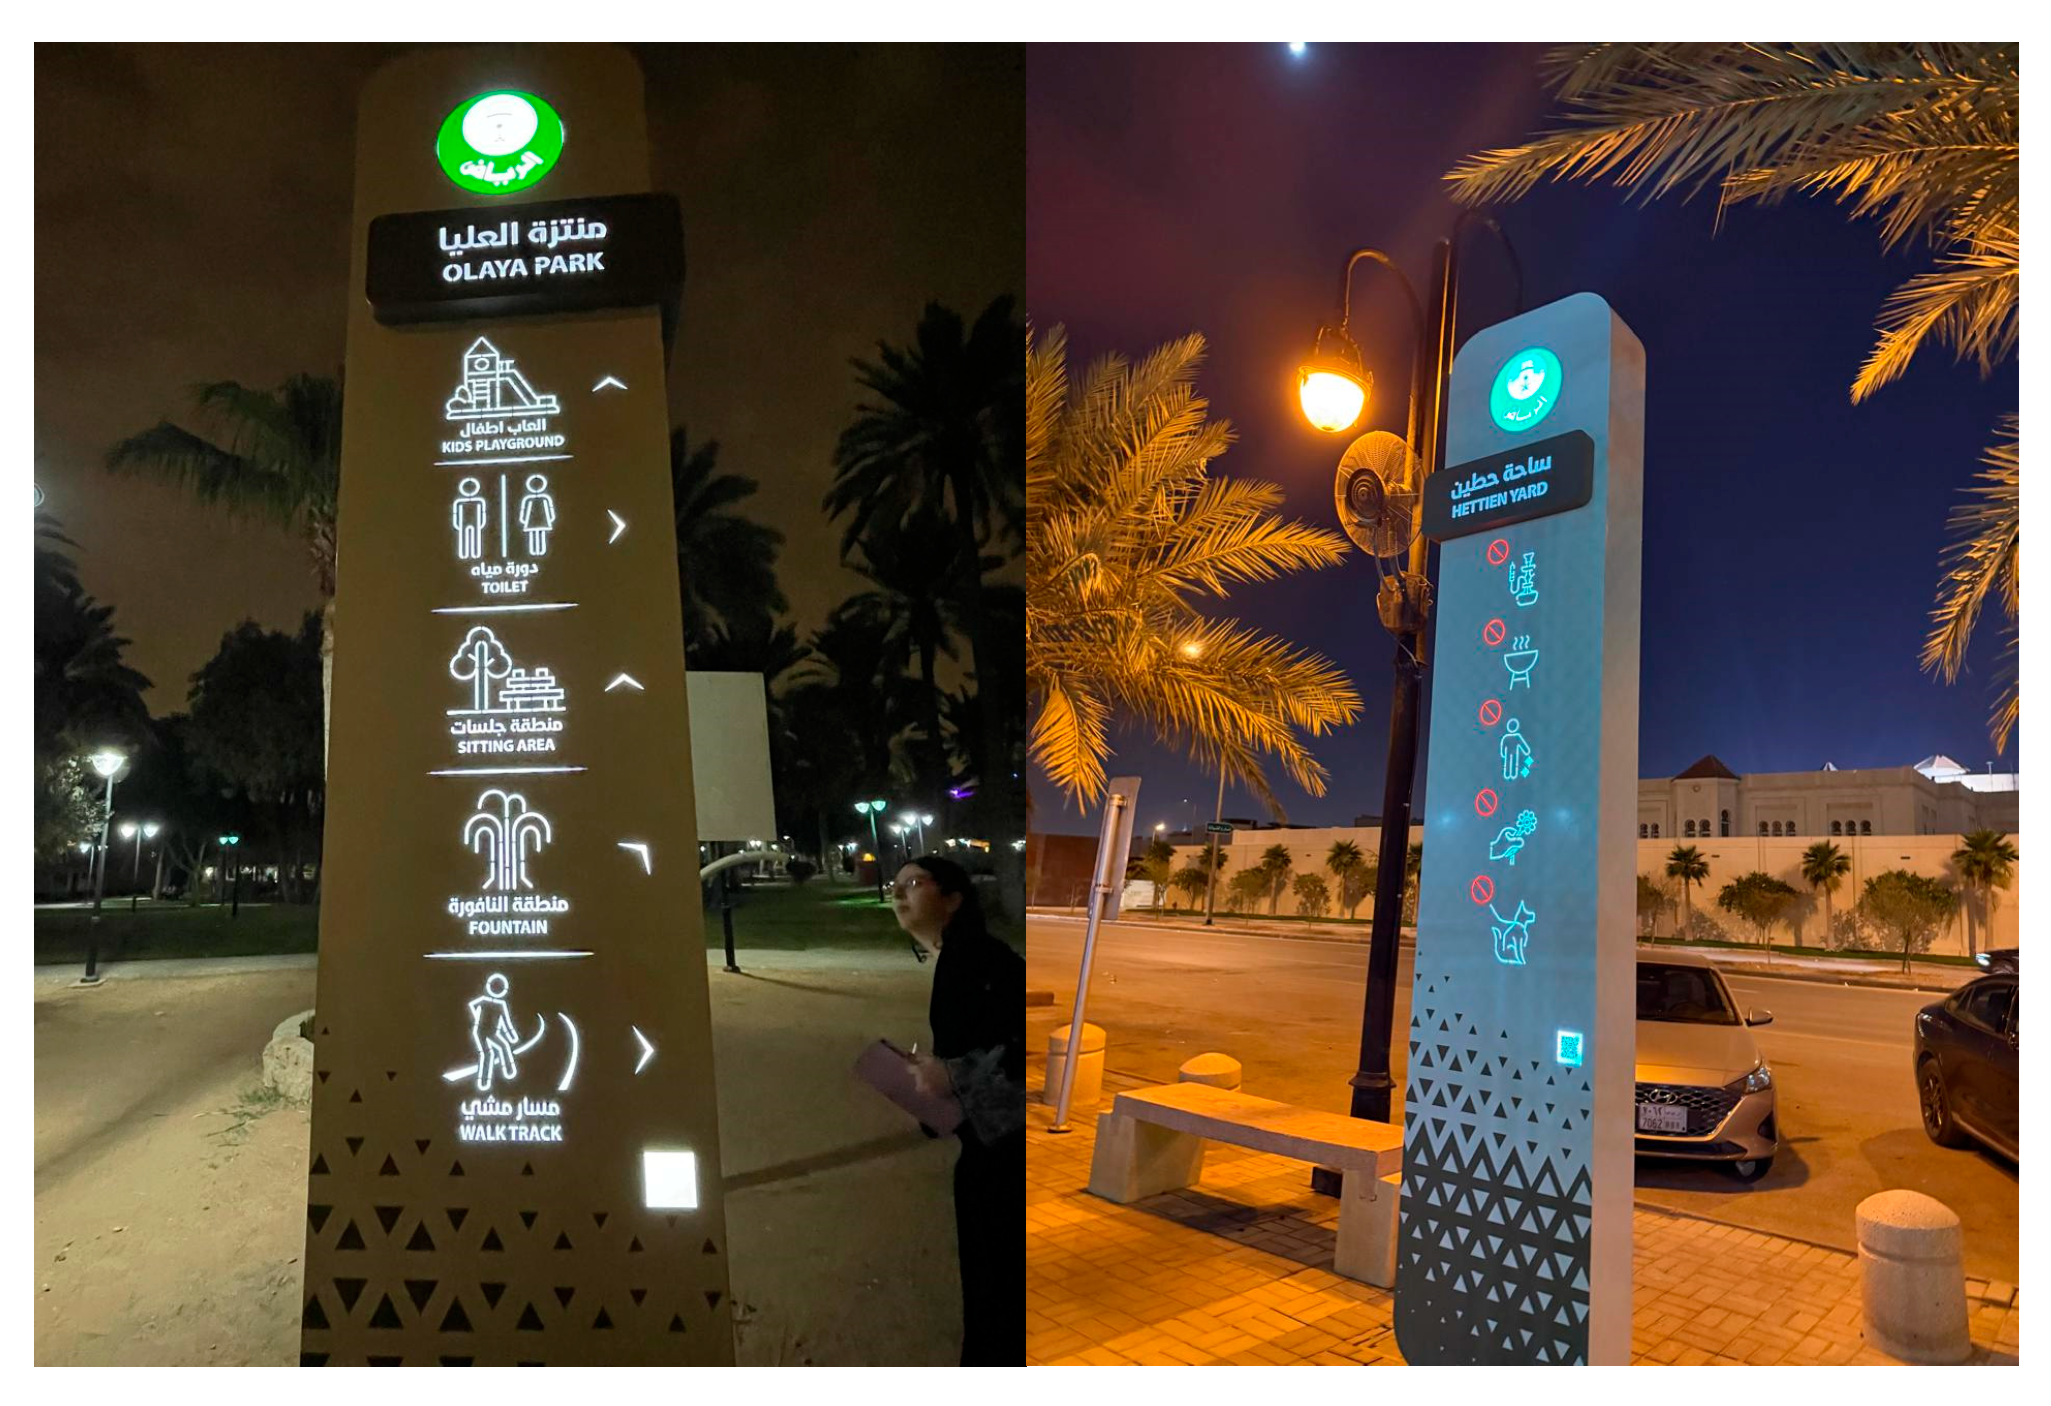
Figure 8, both Hittin Yard and Olaya Park show clear signage information that symbolizes the designer’s focus on wayfinding. Richard Bodeker Park.
Figure 9 shows no waste bins in the entire footage area. Al Joud Park emerged as the top performer, excelling particularly in Accessibility & Mobility and Landscape, illustrated in
Figure 10 with smart bins, recyclable bins, and ramps distributed all over the park.
King Fahd Library Park presents balanced scores across most categories, with a score of 29% in Amenities & Services, as shown in
Figure 11 below, with poor storage of all utilities.
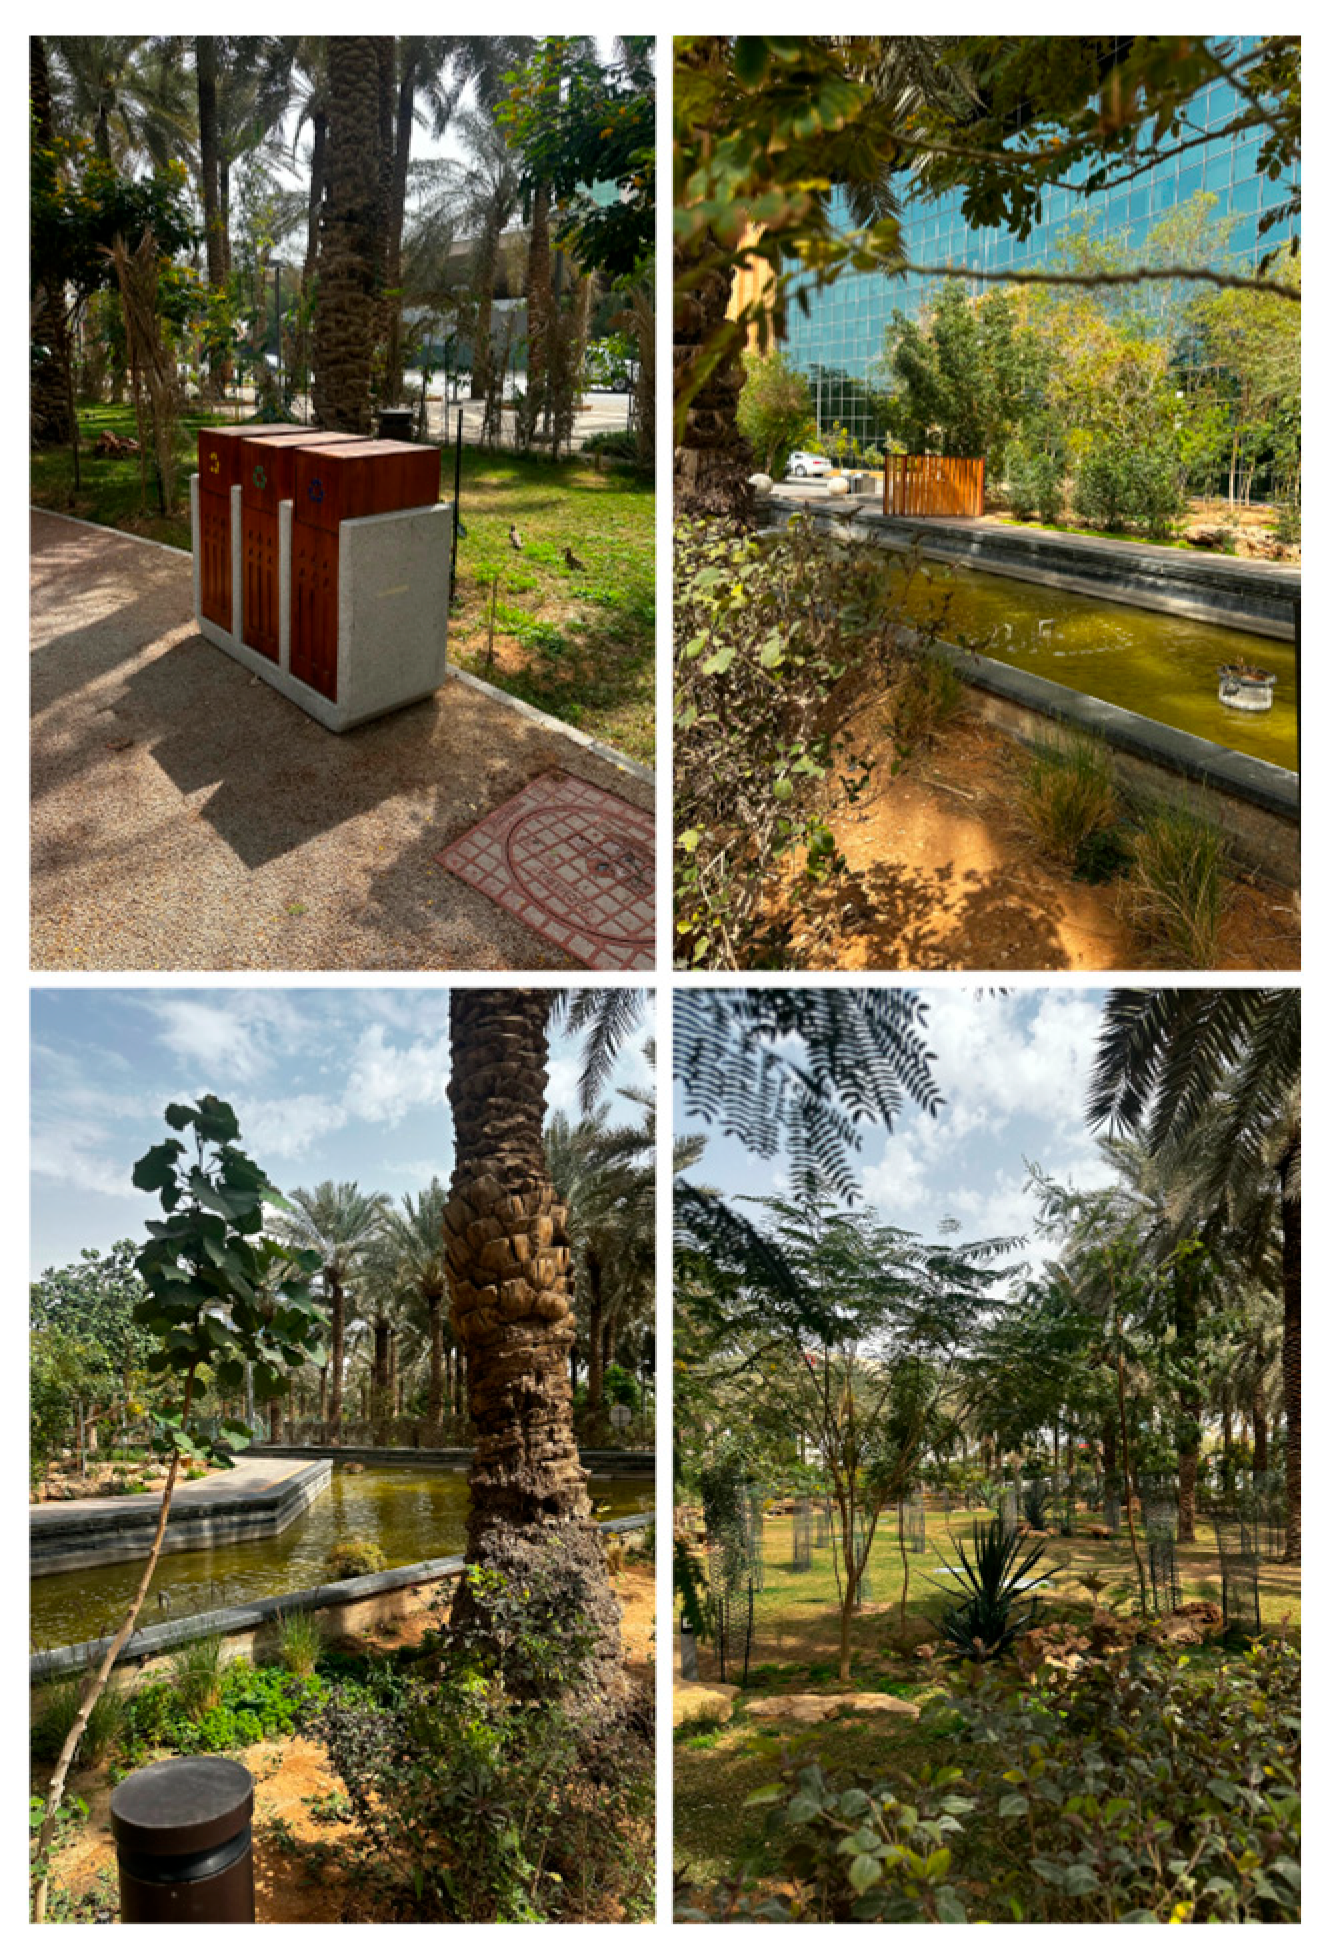
Al Olaya Park displayed in the collage in
Figure 12 below its strongest performance in Infrastructure & Facilities (71%) and maintained solid scores in Landscape (55%) and Water Features (59%), but struggled in Accessibility & Mobility (33%), Safety & Security (31%), and Amenities & Services (22%). These results suggest the park offers well-developed built infrastructure but lacks inclusive design, user amenities, and robust safety measures. Najd Oasis Park, on the other hand, showed a more balanced performance with strengths in Waste Management (100%), Safety & Security (70%), and Sustainability & Maintenance (63%). These results suggest a strong operational focus on cleanliness, safety, and long-term maintenance. However, lower scores in Infrastructure & Facilities (44%) and Accessibility & Mobility (34%) highlight design and planning gaps that could limit overall user experience, especially for people with disabilities or mobility challenges.
Figure 13’s collage below presents some of these data collectively.
In the collage of Wadi Hanifa,
Figure 14 emerged as the strongest overall performer. Its relatively high scores in Sustainability & Maintenance and Waste Management suggest effective operational management. Yet, moderate results for Amenities & Services (35%) indicate room for improvement in user communication and comfort.
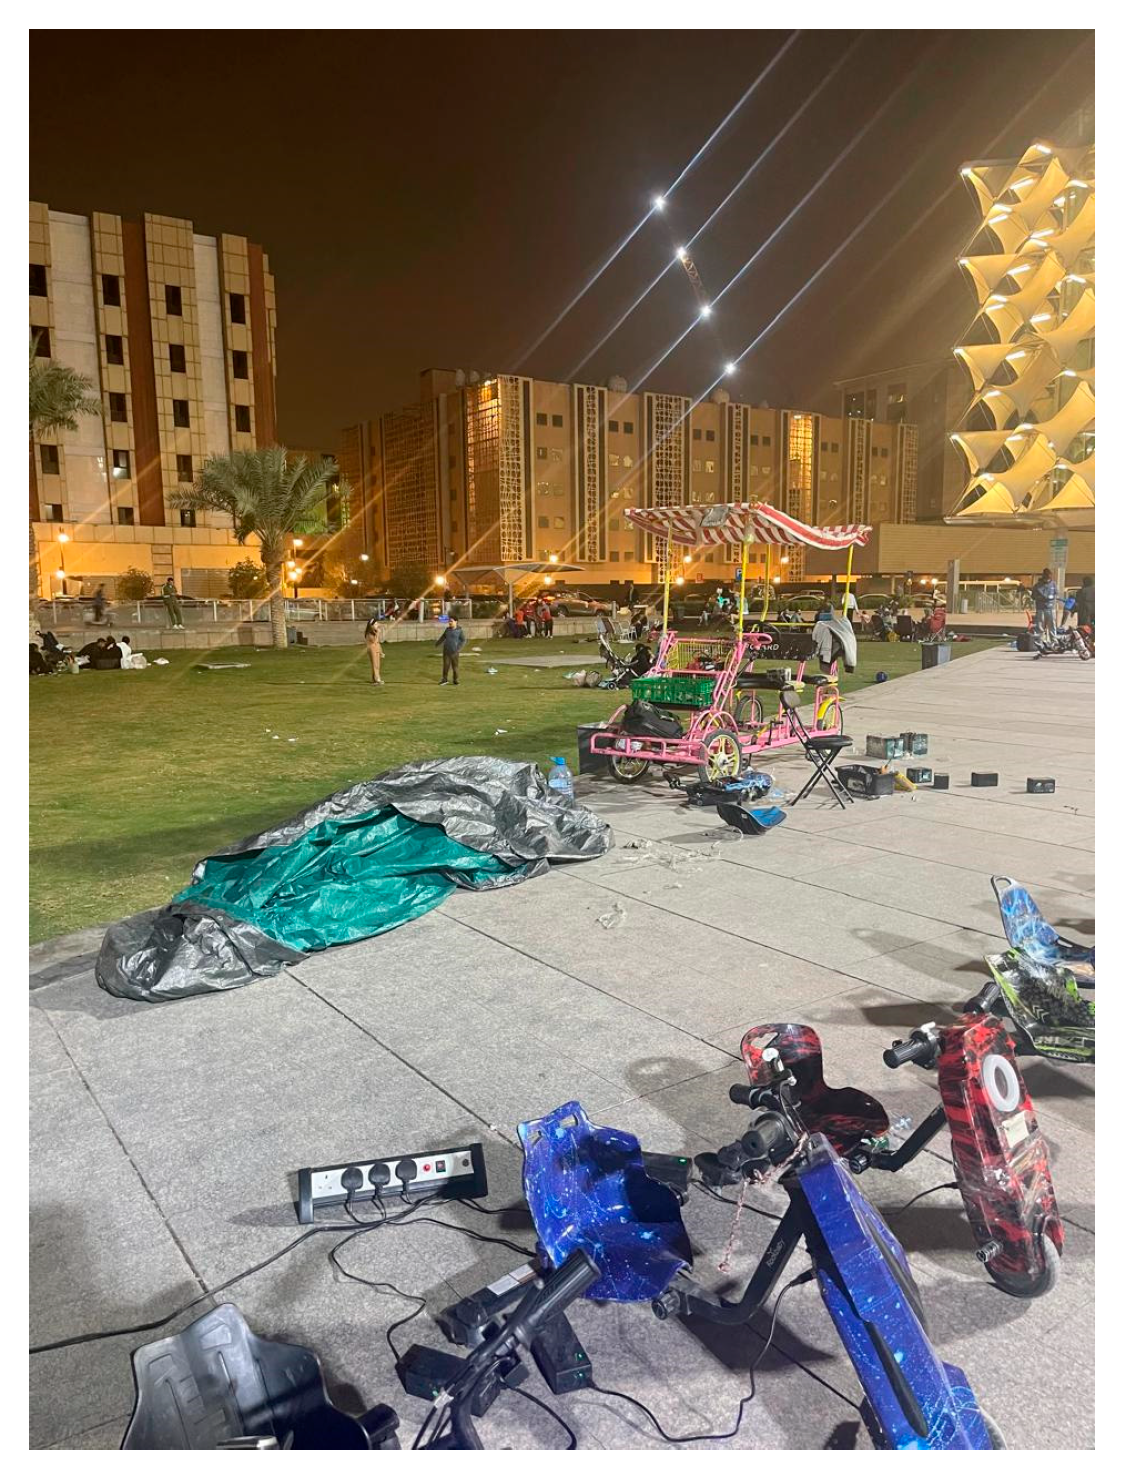
The lowest scoring of all parks, Nahda Park, shown in
Figure 15, consistently underperformed across all categories, with critically low scores in Accessibility & Mobility (4%), Water Features (0%), Signage & Information (0%), and generally weak results in Safety, Sustainability, and Amenities. These results are shown in the collage below, highlighting major deficiencies in both design and management, pointing to the urgent need for investment and improvement to ensure equitable access and quality experience for all users.
7. Type Optimum Parks
To contextualize Riyadh’s parks within global best practices, two internationally acclaimfed parks—Hyde Park and Regent’s Park in London—were used as benchmark references Type G Category, Large Parks. These parks were selected because they are extensively documented in international literature, have publicly available performance data, and represent established models of high design quality, inclusivity, and maintenance standards.
Their design, inclusiveness of users, maintenance standards, etcetera, had recognition in global and urban green spaces evaluation. By comparing these optimum models to Riyadh’s parks, this will help identify critical performance gaps, highlighting the best practice parks in comparison to them, and suggesting future improvements in planning and designing large-scale parks.
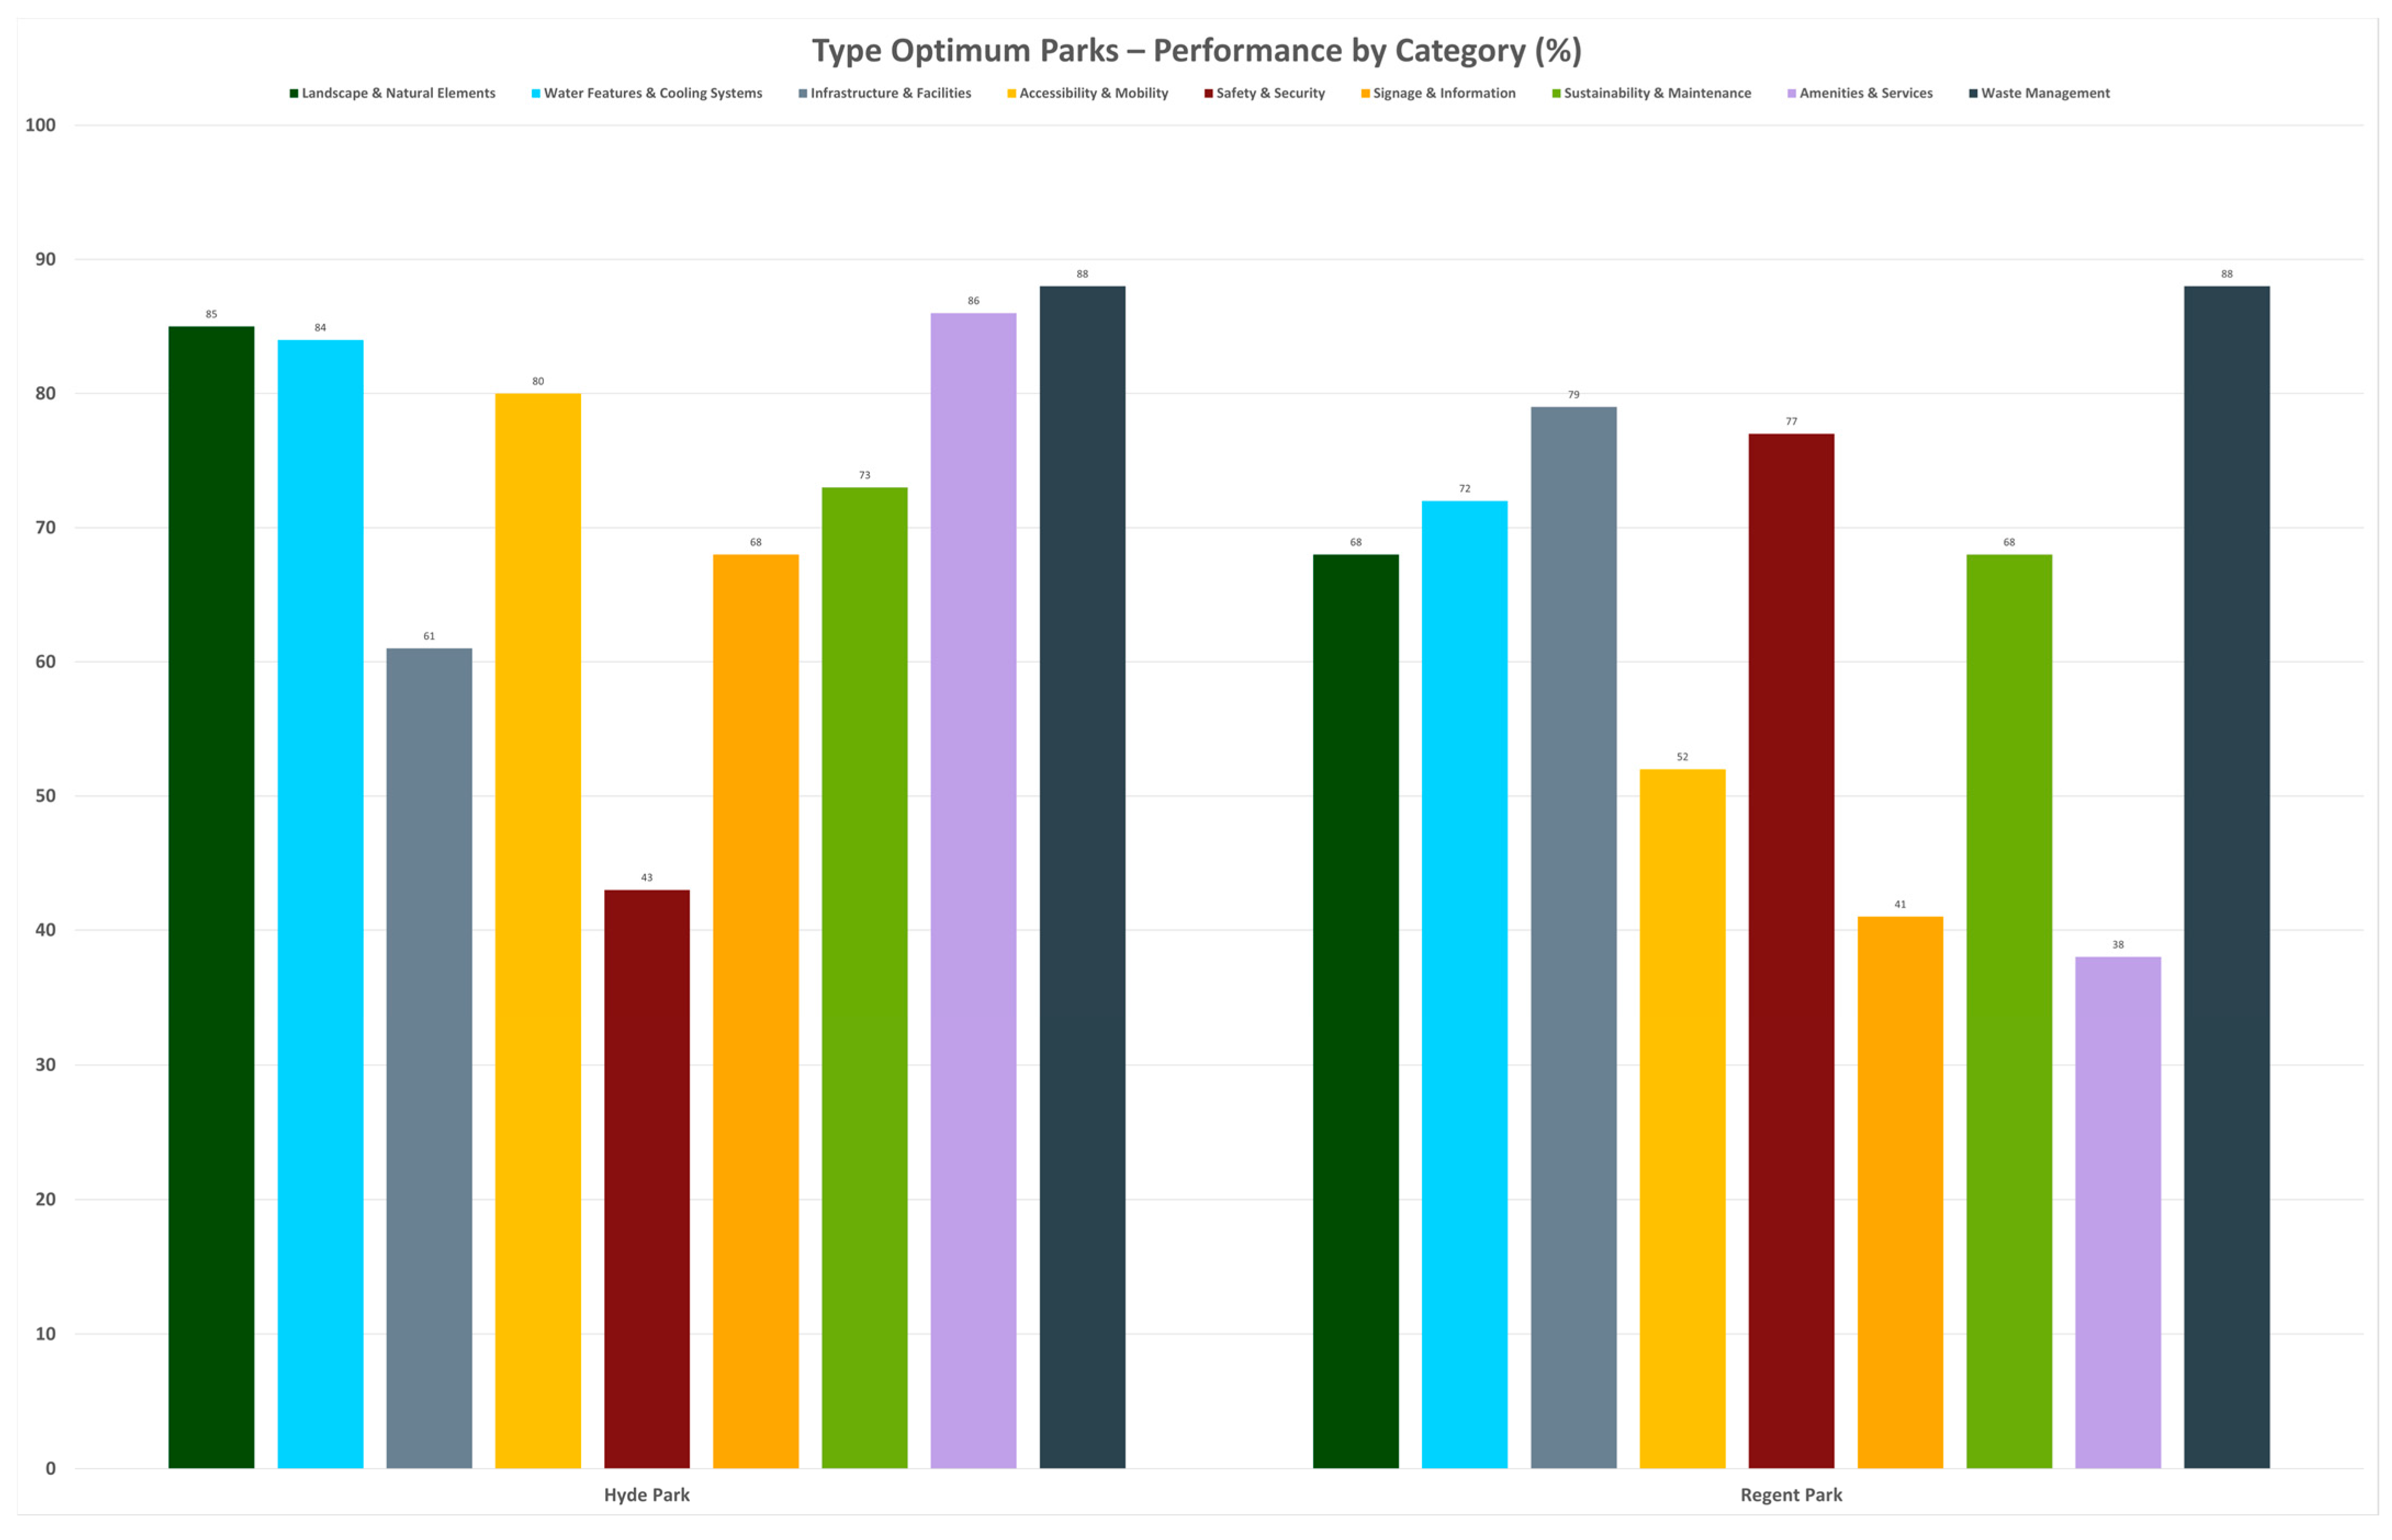
The results of the optimum marks shown in the graph below in
Table 5 and
Figure 16 show consistently high performances across most categories. Both Hyde and Regent’s parks scored well in Waste Management (88%), Water Features and Cooling Systems (84–72%), and Landscape and Natural Elements (85–68%), respectively. Nevertheless, Hyde Park excelled in Accessibility and Mobility, Amenities and Services, while Regent’s Park led in the Safety & Security and Infrastructure and Facilities categories. Despite both the parks’ strengths and weaknesses in some areas, both received moderate scores in Signage and Information, especially in Regent’s Park (41%), which indicates room for improvement in Wayfinding.
7.1. Type Optimum Parks Versus Neighborhood Parks (Type R)
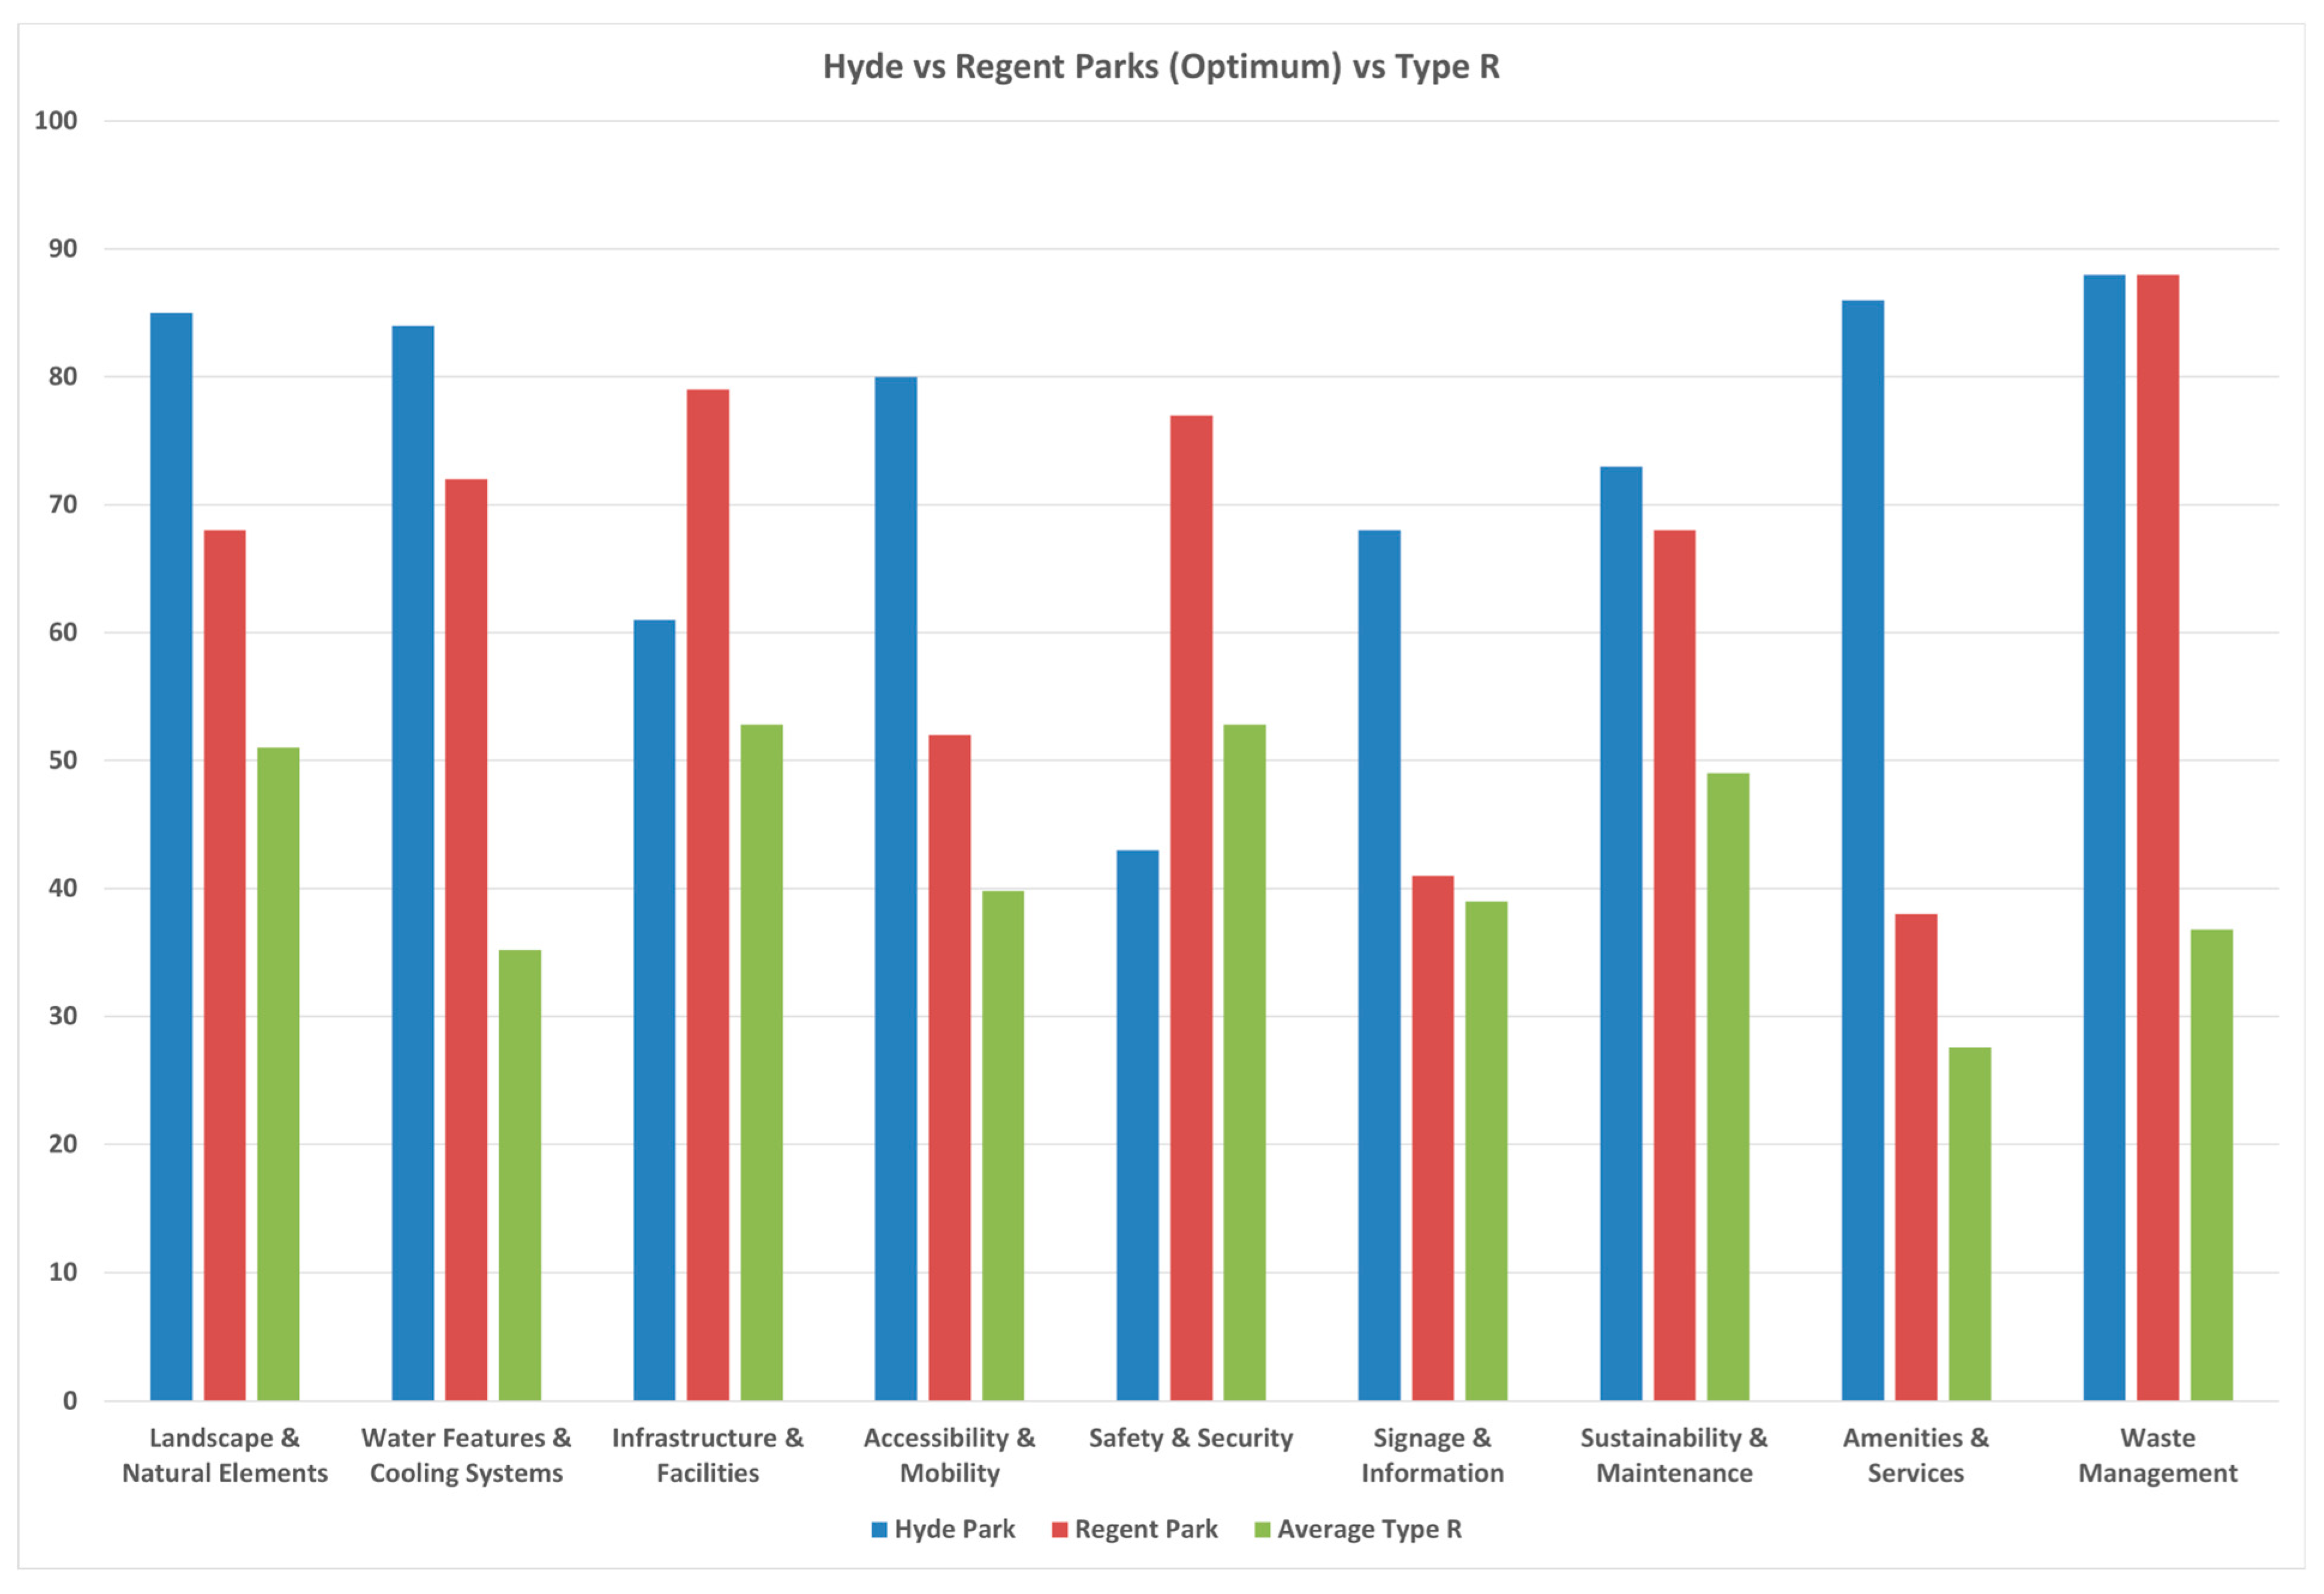
As the results were normalized and averaged, as shown in
Table 6 and
Figure 17, they reveal substantial differences and gaps across several key areas: Water Features and Cooling Systems and Waste Management had the highest performance gaps of 43% and 51%, respectively. Moreover, Amenities and Services show a downfall with a 34% gap to optimum parks. On the other hand, close results from Neighborhood Parks to Optimum Parks are shown in the Safety and Security and Signage and Information categories with small gaps of 7% and 16%, respectively. Finally, the consistent underperformance of most categories shows the need for design and maintenance updates to bridge the gap between Type R parks and international levels.
7.2. Type Optimum Parks Versus Local Parks (Type B)
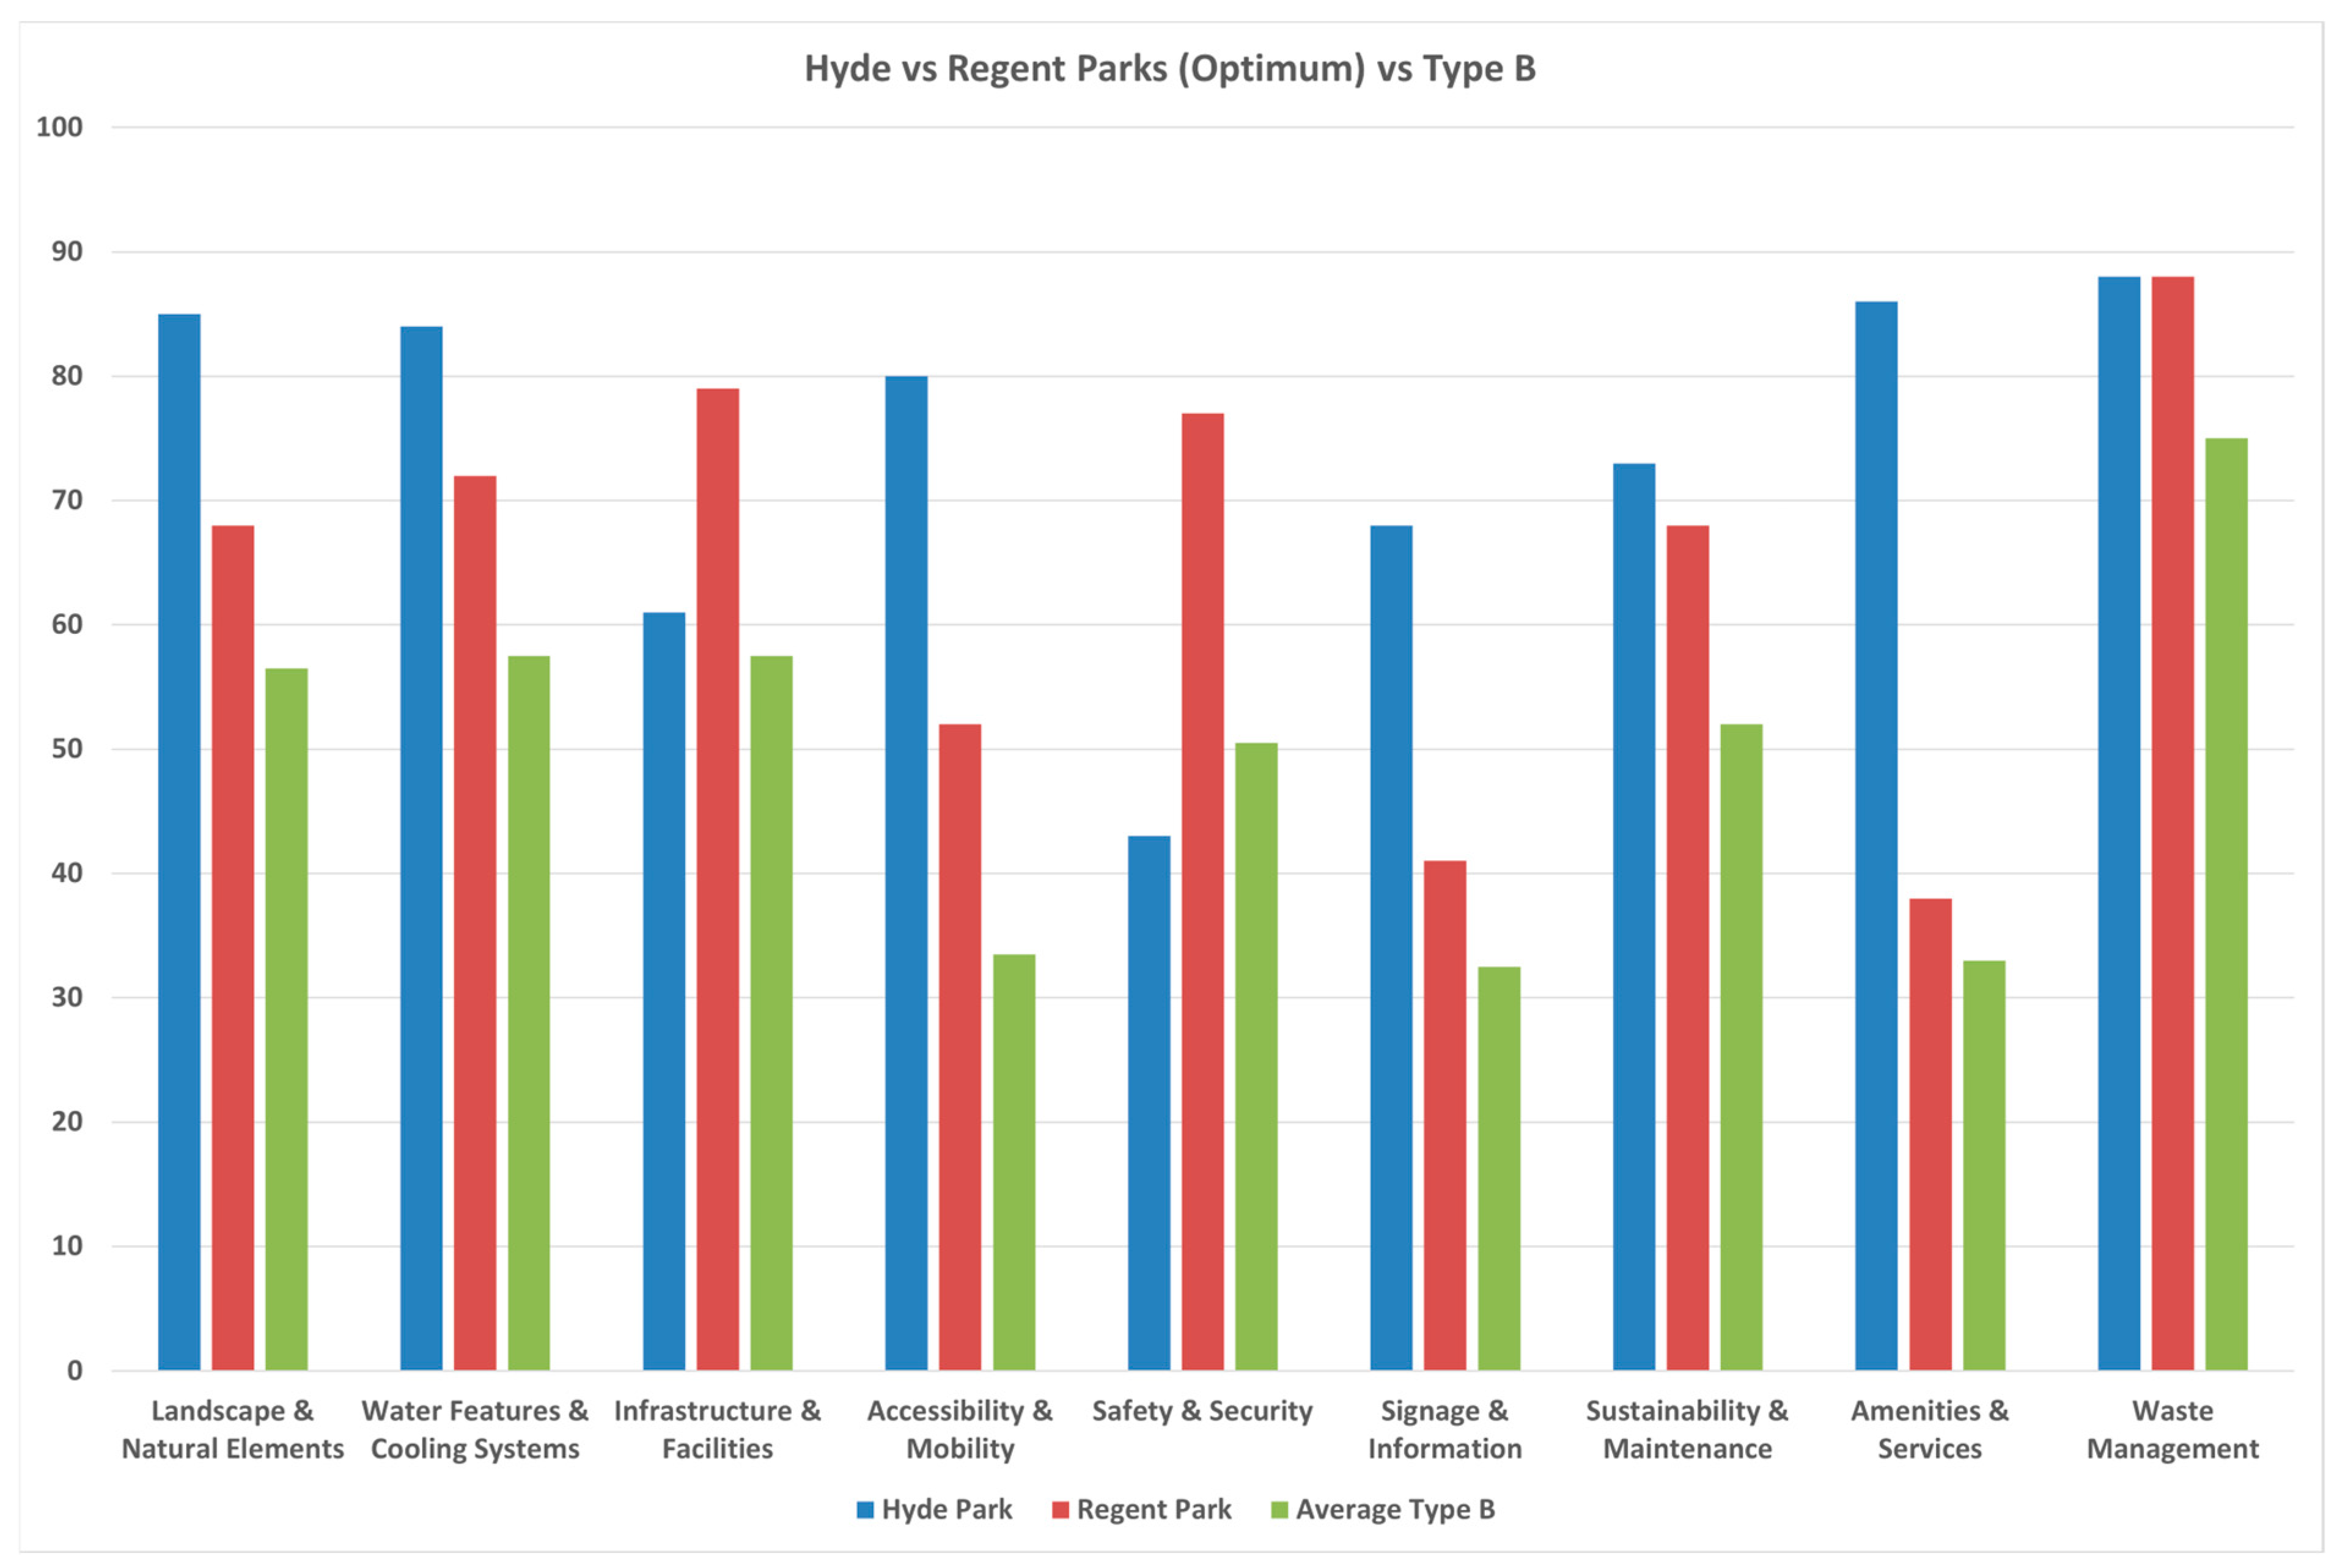
Normalized averages in
Table 7 and
Figure 18 show that Local parks demonstrate closer alignments with results compared to those of Type R, especially in Waste Management and Infrastructure and Facilities, with gaps of 13% to optimum levels, and Safety and Security with the lowest gap of 10% suggesting good competition to international results. However, Accessibility and Mobility and Amenities and Services categories have the highest gaps at 33% and 29%, respectively. All other categories have similar gaps, with 19% to 22% competing with the optimum levels. Overall, local parks have promising strength, and the low scores suggest targeted performance of accessibility, amenity, and experienced designs to meet international standards.
7.3. Type Optimum Parks Versus Large Parks (Type G)
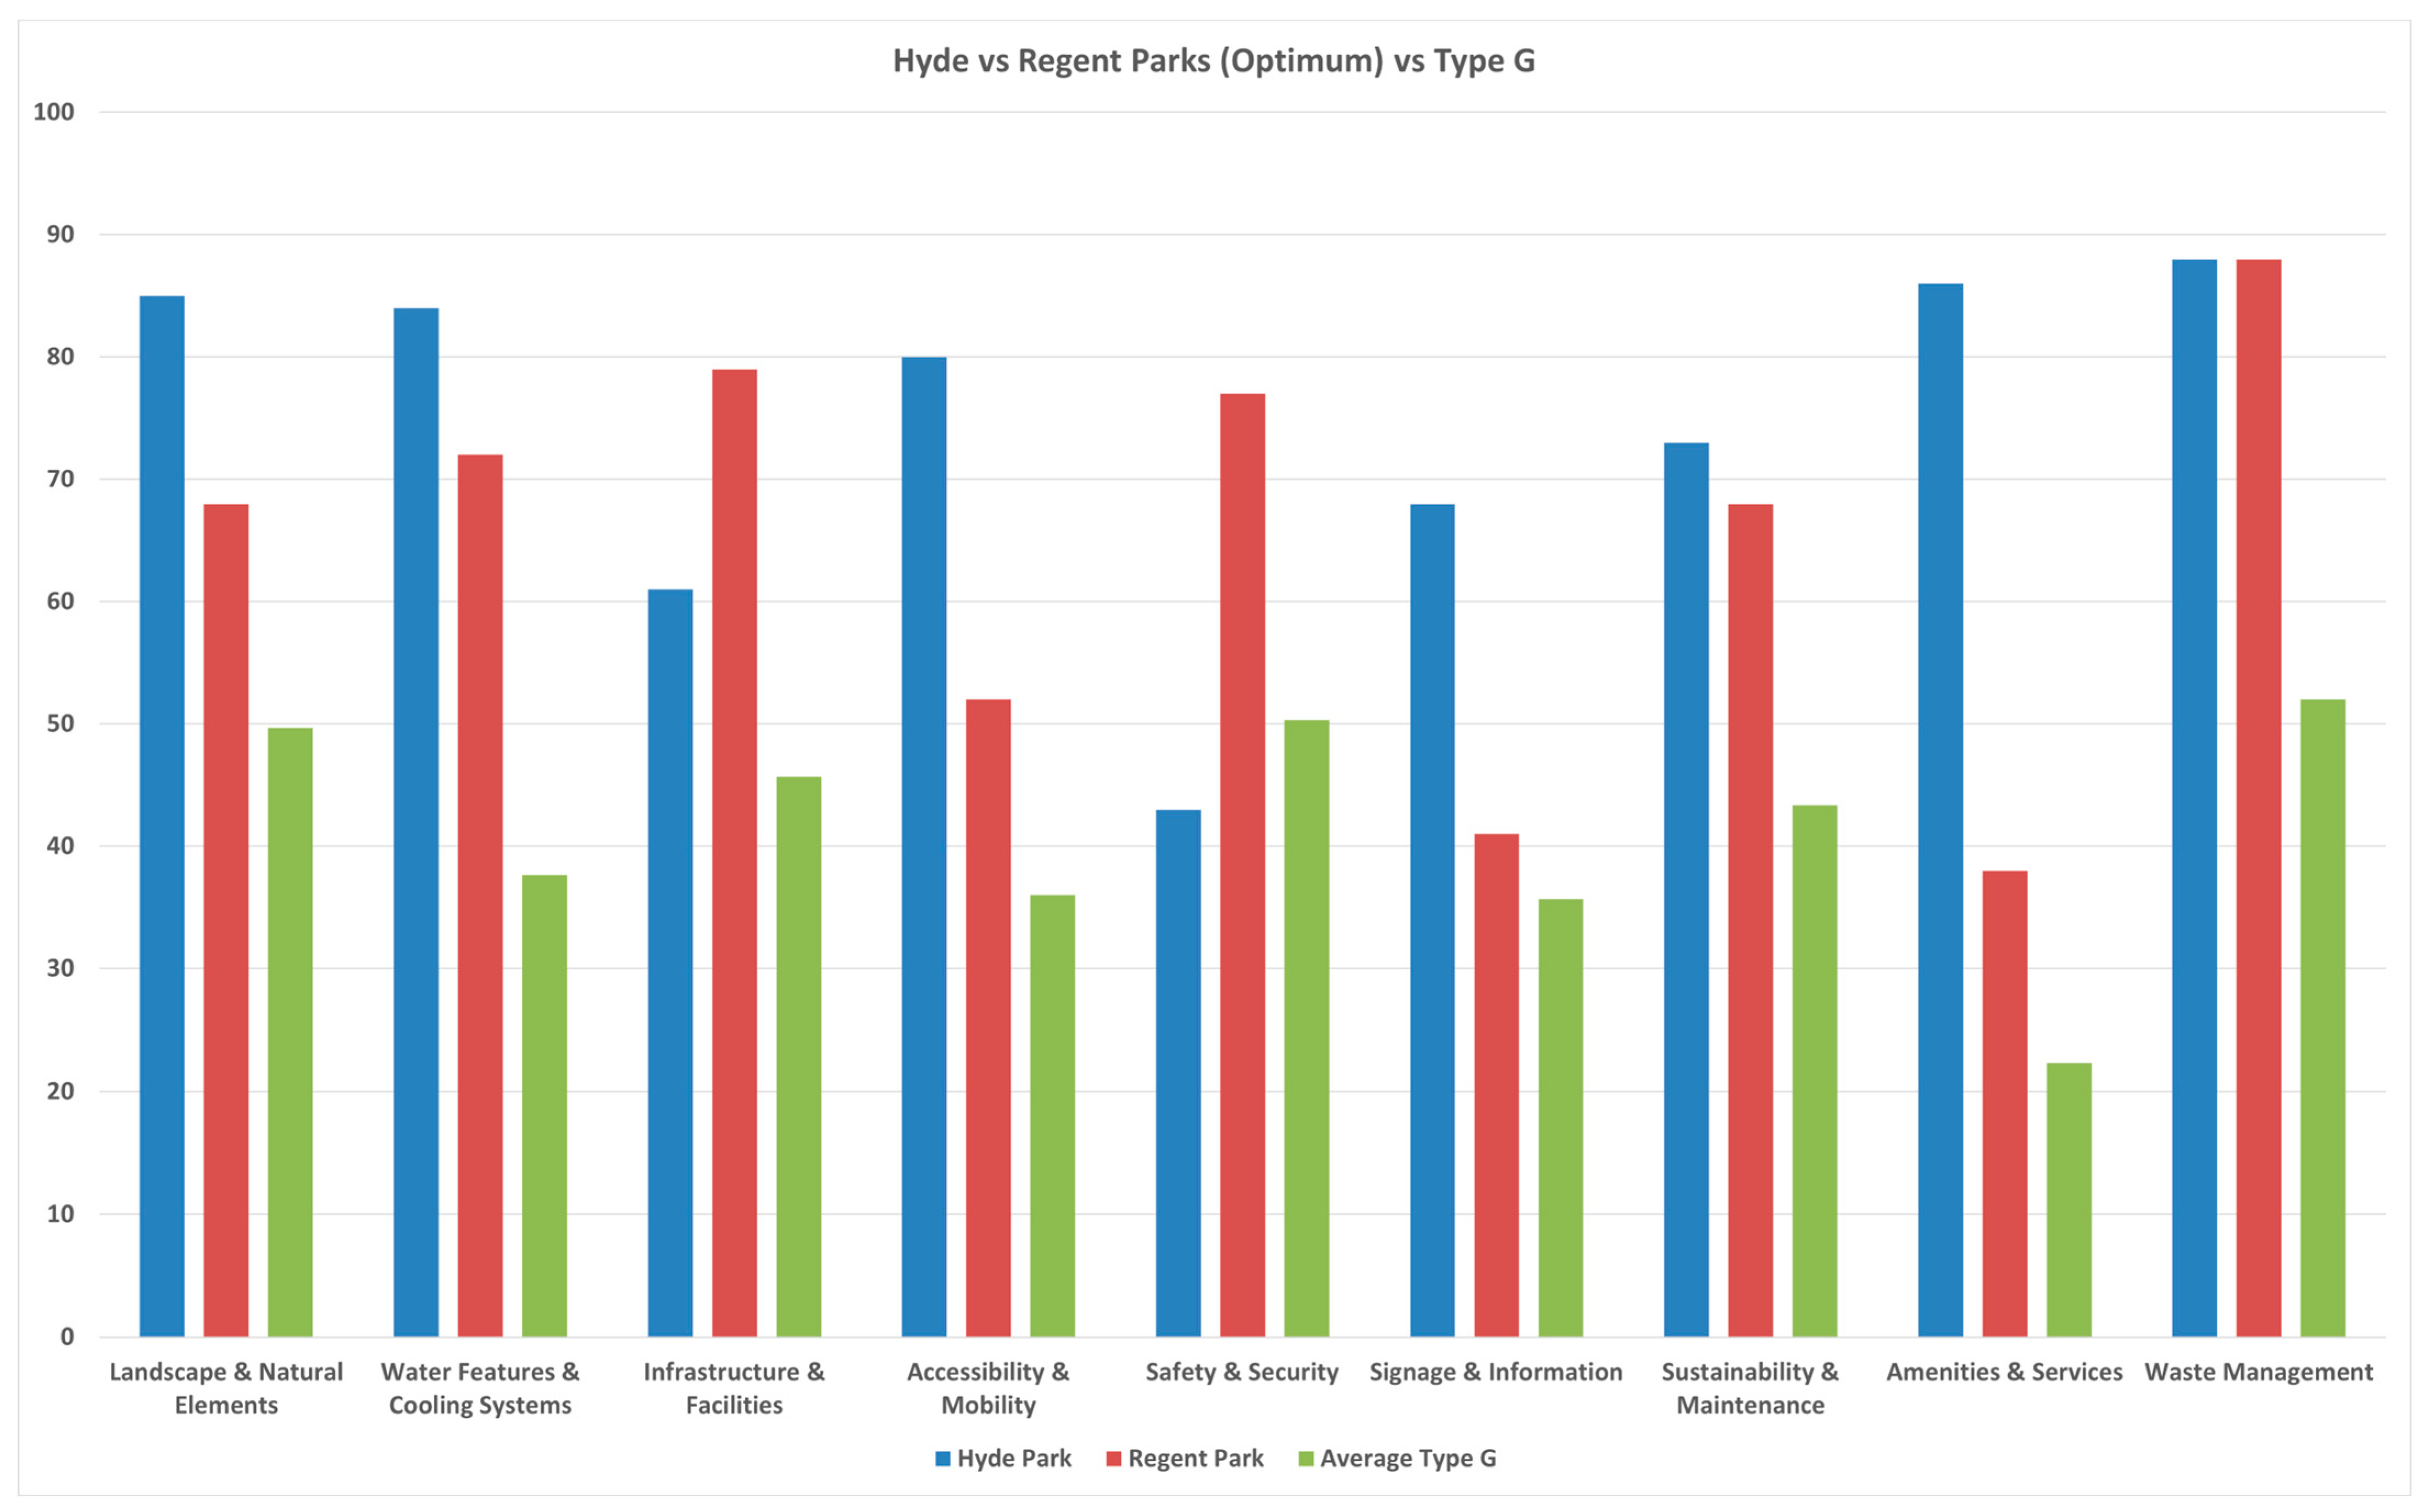
In comparison with Optimum Parks, Large Parks show moderate alignment with Safety and Security, with a gap of 10%, Signage and Information with a gap of 19%, showing promising completion to Optimum Parks’ standards, illustrated in
Table 8 and
Figure 19. Yet, both Amenities and Services and Water Features and Cooling systems categories have a substantial gap of 40% showing serious interventions for both categories. There is consistent underperformance in other categories: Waste Management, Accessibility and Mobility, Landscape and Natural Elements, and Sustainability and Maintenance, chronologically.
In conclusion, Type B had the closest overall alignment with Hyde and Regent’s Parks, especially in operational categories. Large Parks had mediocre results, with some severe gaps in the Water Features and Amenities categories. While Neighborhood Parks lagged the furthest behind, mainly in Accessibility and Waste Management. Such results highlight the urgency for improving most categories to meet international benchmarks.
8. Discussion
The comparative evaluation of Riyadh’s parks—across Neighborhood (Type R), Local (Type B), and Large (Type G) typologies—reveals substantial disparities in design quality, management, and user experience, reflecting broader challenges in Middle Eastern urban landscapes [
21,
22].
Part of the performance disparities may reflect the age of the parks, as newer sites (e.g., Al Joud, Riyadh Hills, Najd Oasis) consistently incorporated upgraded amenities and accessibility features, while older parks (e.g., King Fahd Library, Munisyah, Al Nahda) showed gaps likely linked to aging infrastructure.
Signage & Information emerged as the strongest category for neighborhood parks, with Al Joud Park (76%) and Riyadh Hills (73%) excelling in navigational clarity and wayfinding design [
23].
Amenities & Services were well-developed in select parks, such as King Fahd Library (75%) and Richard Bodeker Park (77%), reflecting socio-economic influences on public space quality [
24]. However, Waste Management was notably weak in Munisyah Park (8%), while Richard Bodeker Park showed a moderate score (50%), indicating uneven cleanliness and waste-handling standards across neighborhood parks [
25]. Landscape & Natural Elements varied widely (13–65%), emphasizing the need for biophilic design in arid climates [
26]. Mid-range but inconsistent scores in Water Features, Infrastructure, and Sustainability indicate irregular application of climate-responsive strategies [
26,
27]. Error bars highlight uneven maintenance standards, which may reflect differences in on-site management practices or resource allocation; however, this study did not collect governance data to confirm these causes [
28,
29]. Older or peripheral parks, like Munisyah Park, require targeted upgrades aligned with inclusive public space goals [
25].
Najd Oasis Park and Al Olaya Park showed contrasting strengths and weaknesses. Najd Oasis Park achieved exceptional Waste Management (100%), compared to Al Olaya Park’s 50% [
25]. Yet, Wadi Oasis underperformed in Infrastructure (44%) and Accessibility (34%), while Al Olaya excelled in Infrastructure (71%) but scored low in Safety (31%) and Accessibility (33%) [
21,
23]. Both parks displayed moderate performance in Landscape (55–58%) and Water Features (56–59%), reflecting climate-adaptive design priorities [
26,
27,
30] Weak scores in Accessibility (31–34%) and Signage highlight systemic shortcomings in inclusive design and navigation [
28]. Variability in Safety & Security and Sustainability underscores inconsistent management practices [
25,
31]. These findings emphasize the absence of a cohesive approach that balances amenities, accessibility, and maintenance [
25,
29].
Performance varied significantly, with Wadi Hanifa and Hittin Yard outperforming Nahda Park. Wadi Hanifa scored highest in Safety (78%) and Accessibility (62%), reflecting best-practice inclusive design [
23,
29]. Nahda Park’s extremely low scores (Safety 20%, Accessibility 4%) highlight spatial inequities and underinvestment [
21]. Water Features (69% in Wadi Hanifa) and Landscaping (54%) underscored the importance of bioclimatic strategies for thermal comfort [
26,
27,
30]. Hittin Yard’s strong Signage (73%) contrasted sharply with Nahda Park’s 0%, illustrating the impact of wayfinding on user experience [
28,
29] Waste Management was relatively stable (~50%), but Amenities & Services were universally poor, indicating underinvestment in user-centric facilities [
23,
31].
Across all typologies, the findings highlight the need to raise baseline performance through city-wide minimum standards (especially in waste management, safety, and accessibility) and to replicate best practices from high-performing parks. While factors such as governance structures or equity in resource allocation may influence these disparities, investigating such mechanisms lies beyond the scope of this study and should be addressed in future research.
To enable a clear and objective comparison all parks’ typologies and type optimum data were normalized and category-wise averages were calculated for both Riyadh’s parks and Optimum Parks. This study did not collect user-level or governance-related data; therefore, causal explanations related to urban equity or institutional frameworks remain outside the scope of this analysis.
9. Conclusions
This study presents a comprehensive, data-driven evaluation of urban green spaces in Riyadh, offering critical insights into their design quality, environmental performance, inclusivity, and management practices. Utilizing a robust framework of 155 criteria distributed across nine core categories—with weighted importance and quantitative scoring—the research systematically assessed 10 public parks of various typologies: Neighborhood (Type R), Local (Type B), and Large (Type G). The integration of benchmark parks and site observations added a comparative layer that grounded the analysis in both local and international contexts.
The results revealed significant spatial and typological disparities in park performance. High-performing parks such as Wadi Hanifa, Al Joud Park, and Richard Bodeker Park exhibited thoughtful integration of landscape features, effective safety and surveillance infrastructure, and relatively strong environmental stewardship. In contrast, parks like Munisyah and Nahda displayed systemic deficiencies in fundamental areas such as Accessibility & Mobility, Amenities & Services, and Signage & Information—highlighting gaps in user inclusivity, environmental comfort, and navigation. Notably, Waste Management showed the highest variability in scores, while Amenities & Services consistently underperformed across all typologies, suggesting a lack of investment in user-centered programming.
Typology-specific trends further clarified the urban disparities in green space provision. Neighborhood Parks demonstrated the widest range in performance, reflecting socio-economic and locational inequities within Riyadh’s districts. Local Parks offered more consistent but modest performance levels, with Waste Management and basic landscaping emerging as their relative strengths. Large Parks displayed a mix of exemplary and deficient practices, indicating that scale does not necessarily guarantee comprehensive quality. These variations underscore the need for a unified urban strategy that balances spatial equity, maintenance standards, and inclusive design principles.
The findings carry important implications for urban planning and policy in Riyadh. First, the results advocate for the establishment of standardized design and maintenance benchmarks that address the essential needs of all user groups—particularly in terms of safety, accessibility, shading, and comfort. Second, they highlight the necessity of implementing equitable resource allocation and governance models that ensure all city residents have access to high-quality public green spaces, regardless of location or socio-economic context. Third, the study supports the adoption of bioclimatic and sustainable design interventions, particularly critical in Riyadh’s arid climate, where microclimate regulation and thermal comfort are vital for usability.
Beyond the current evaluation, future work can expand upon this framework by integrating digital and immersive technologies. Virtual Reality (VR) and Augmented Reality (AR) simulations offer promising tools for visualizing park design scenarios and engaging users in participatory planning. Machine Learning (ML) models, when combined with real-time environmental and behavioral data, can further optimize spatial configurations and predict park performance under various usage conditions. Developing a VR-based park assessment platform, powered by AI detection of design features and user behaviors, could significantly enhance stakeholder engagement, design prototyping, and evidence-based policymaking.
In conclusion, this research provides a replicable and adaptable methodology for evaluating public parks, offering actionable insights to planners, designers, and decision-makers in Riyadh and similar cities. By prioritizing user inclusivity, environmental sustainability, and urban resilience, the findings contribute meaningfully to the broader discourse on creating equitable, livable cities aligned with the ambitions of Vision 2030.
A promising direction for future work involves the development and implementation of this framework within immersive environments such as Virtual Reality (VR) and Augmented Reality (AR). By translating the park design and evaluation model into VR or AR platforms, users—including planners, designers, and community members—can experience, navigate, and assess park environments in a highly interactive and realistic manner prior to construction.
Additionally, this immersive framework can be enhanced by integrating machine learning (ML) techniques, particularly for real-time detection and behavioral analysis. For example, ML algorithms can be employed to monitor user interactions, movement patterns, and spatial preferences within the simulated park environment. These data insights can help identify areas of improvement in design elements such as circulation, accessibility, shading, and amenity placement.
Such integration of VR/AR and ML can serve as a powerful decision-support tool in urban planning and landscape architecture, enabling data-driven refinement of public space design and promoting user-centered, inclusive environments. Future studies may focus on developing prototypes, testing usability with diverse stakeholders, and validating the accuracy of ML-based assessments against real-world behavioral data.
This study did not include any direct user consultation or feedback. The evaluation relied exclusively on structured field observations and researcher-based scoring of physical and environmental features. As a result, the findings reflect the assessed presence and quality of amenities and design elements, but not the preferences, satisfaction, or perceived value of the parks from the users’ perspective. Future research should integrate user-centered methods—such as surveys, interviews, focus groups, or participatory design assessments—to complement observational data and provide a more holistic understanding of public space performance.
