COVID-19’s Impact on Türkiye’s Lemon Exports: Constant Market Share Decomposition (2015–2024)
Abstract
1. Introduction
2. Materials and Methods
2.1. Determination of the Target Market
2.2. Period Selection and Theoretical Background
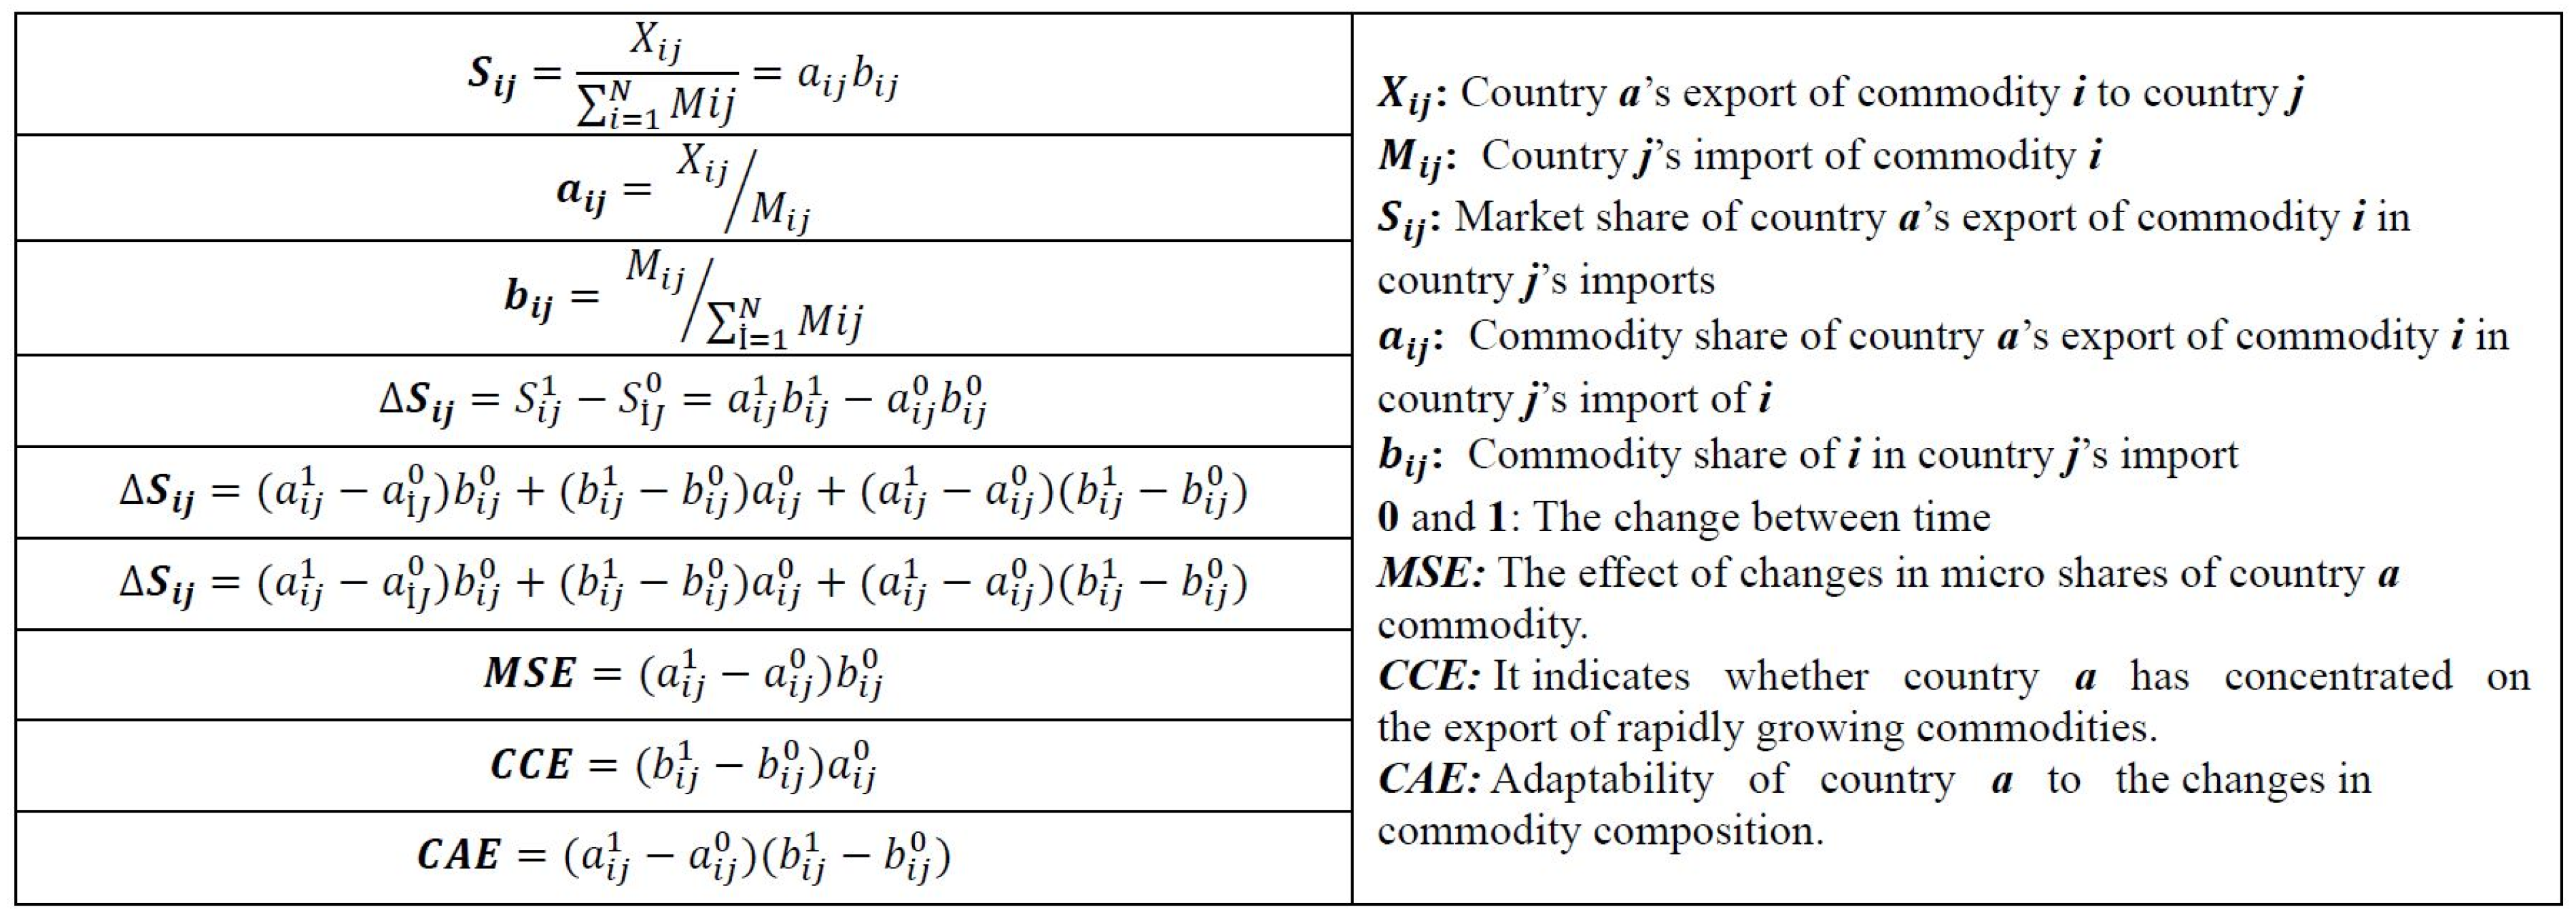
2.3. Constant Market Share (CMS) Method
2.4. Revealed Comparative Advantage (RCA) and Trade Specialization Index (TSI)
2.5. Data Sources and Language Support
3. Results
3.1. An Overview of Türkiye’s Target Market in Lemon Exports
3.2. Results of the Constant Market Share (CMS), RCA and TSI Analyses
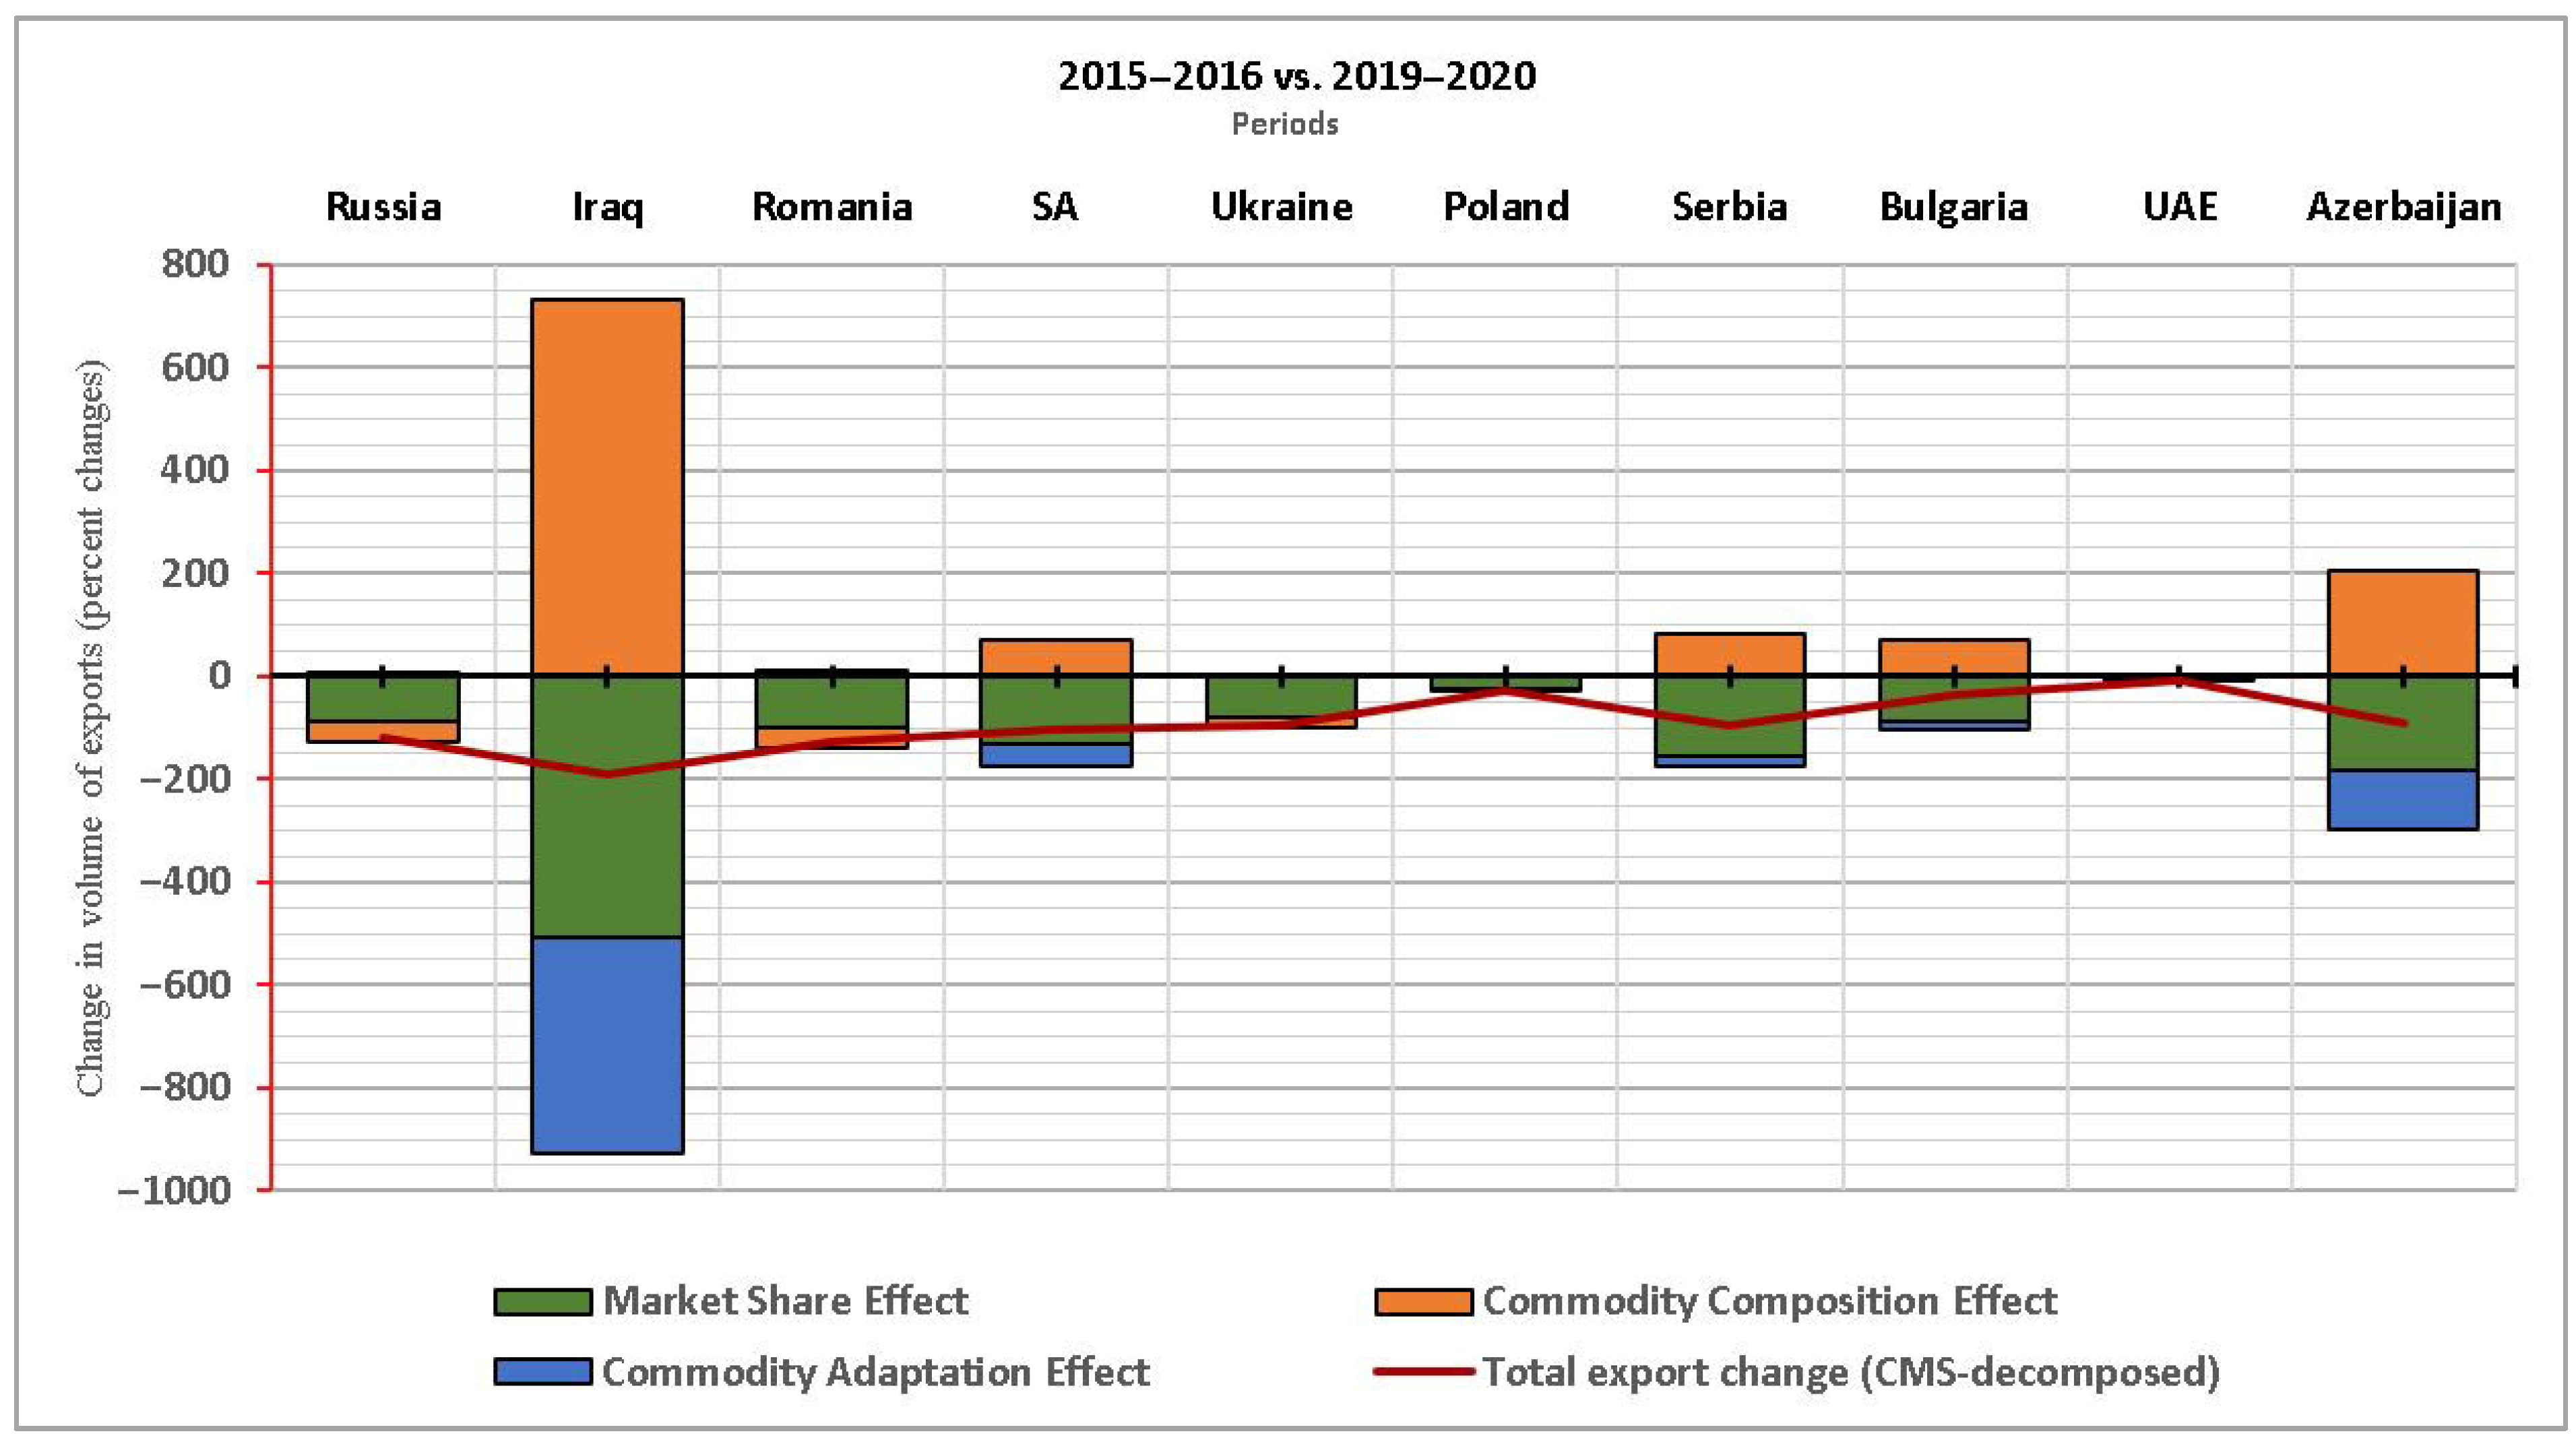
3.2.1. Analysis of Export Dynamics: Period I vs. Period II
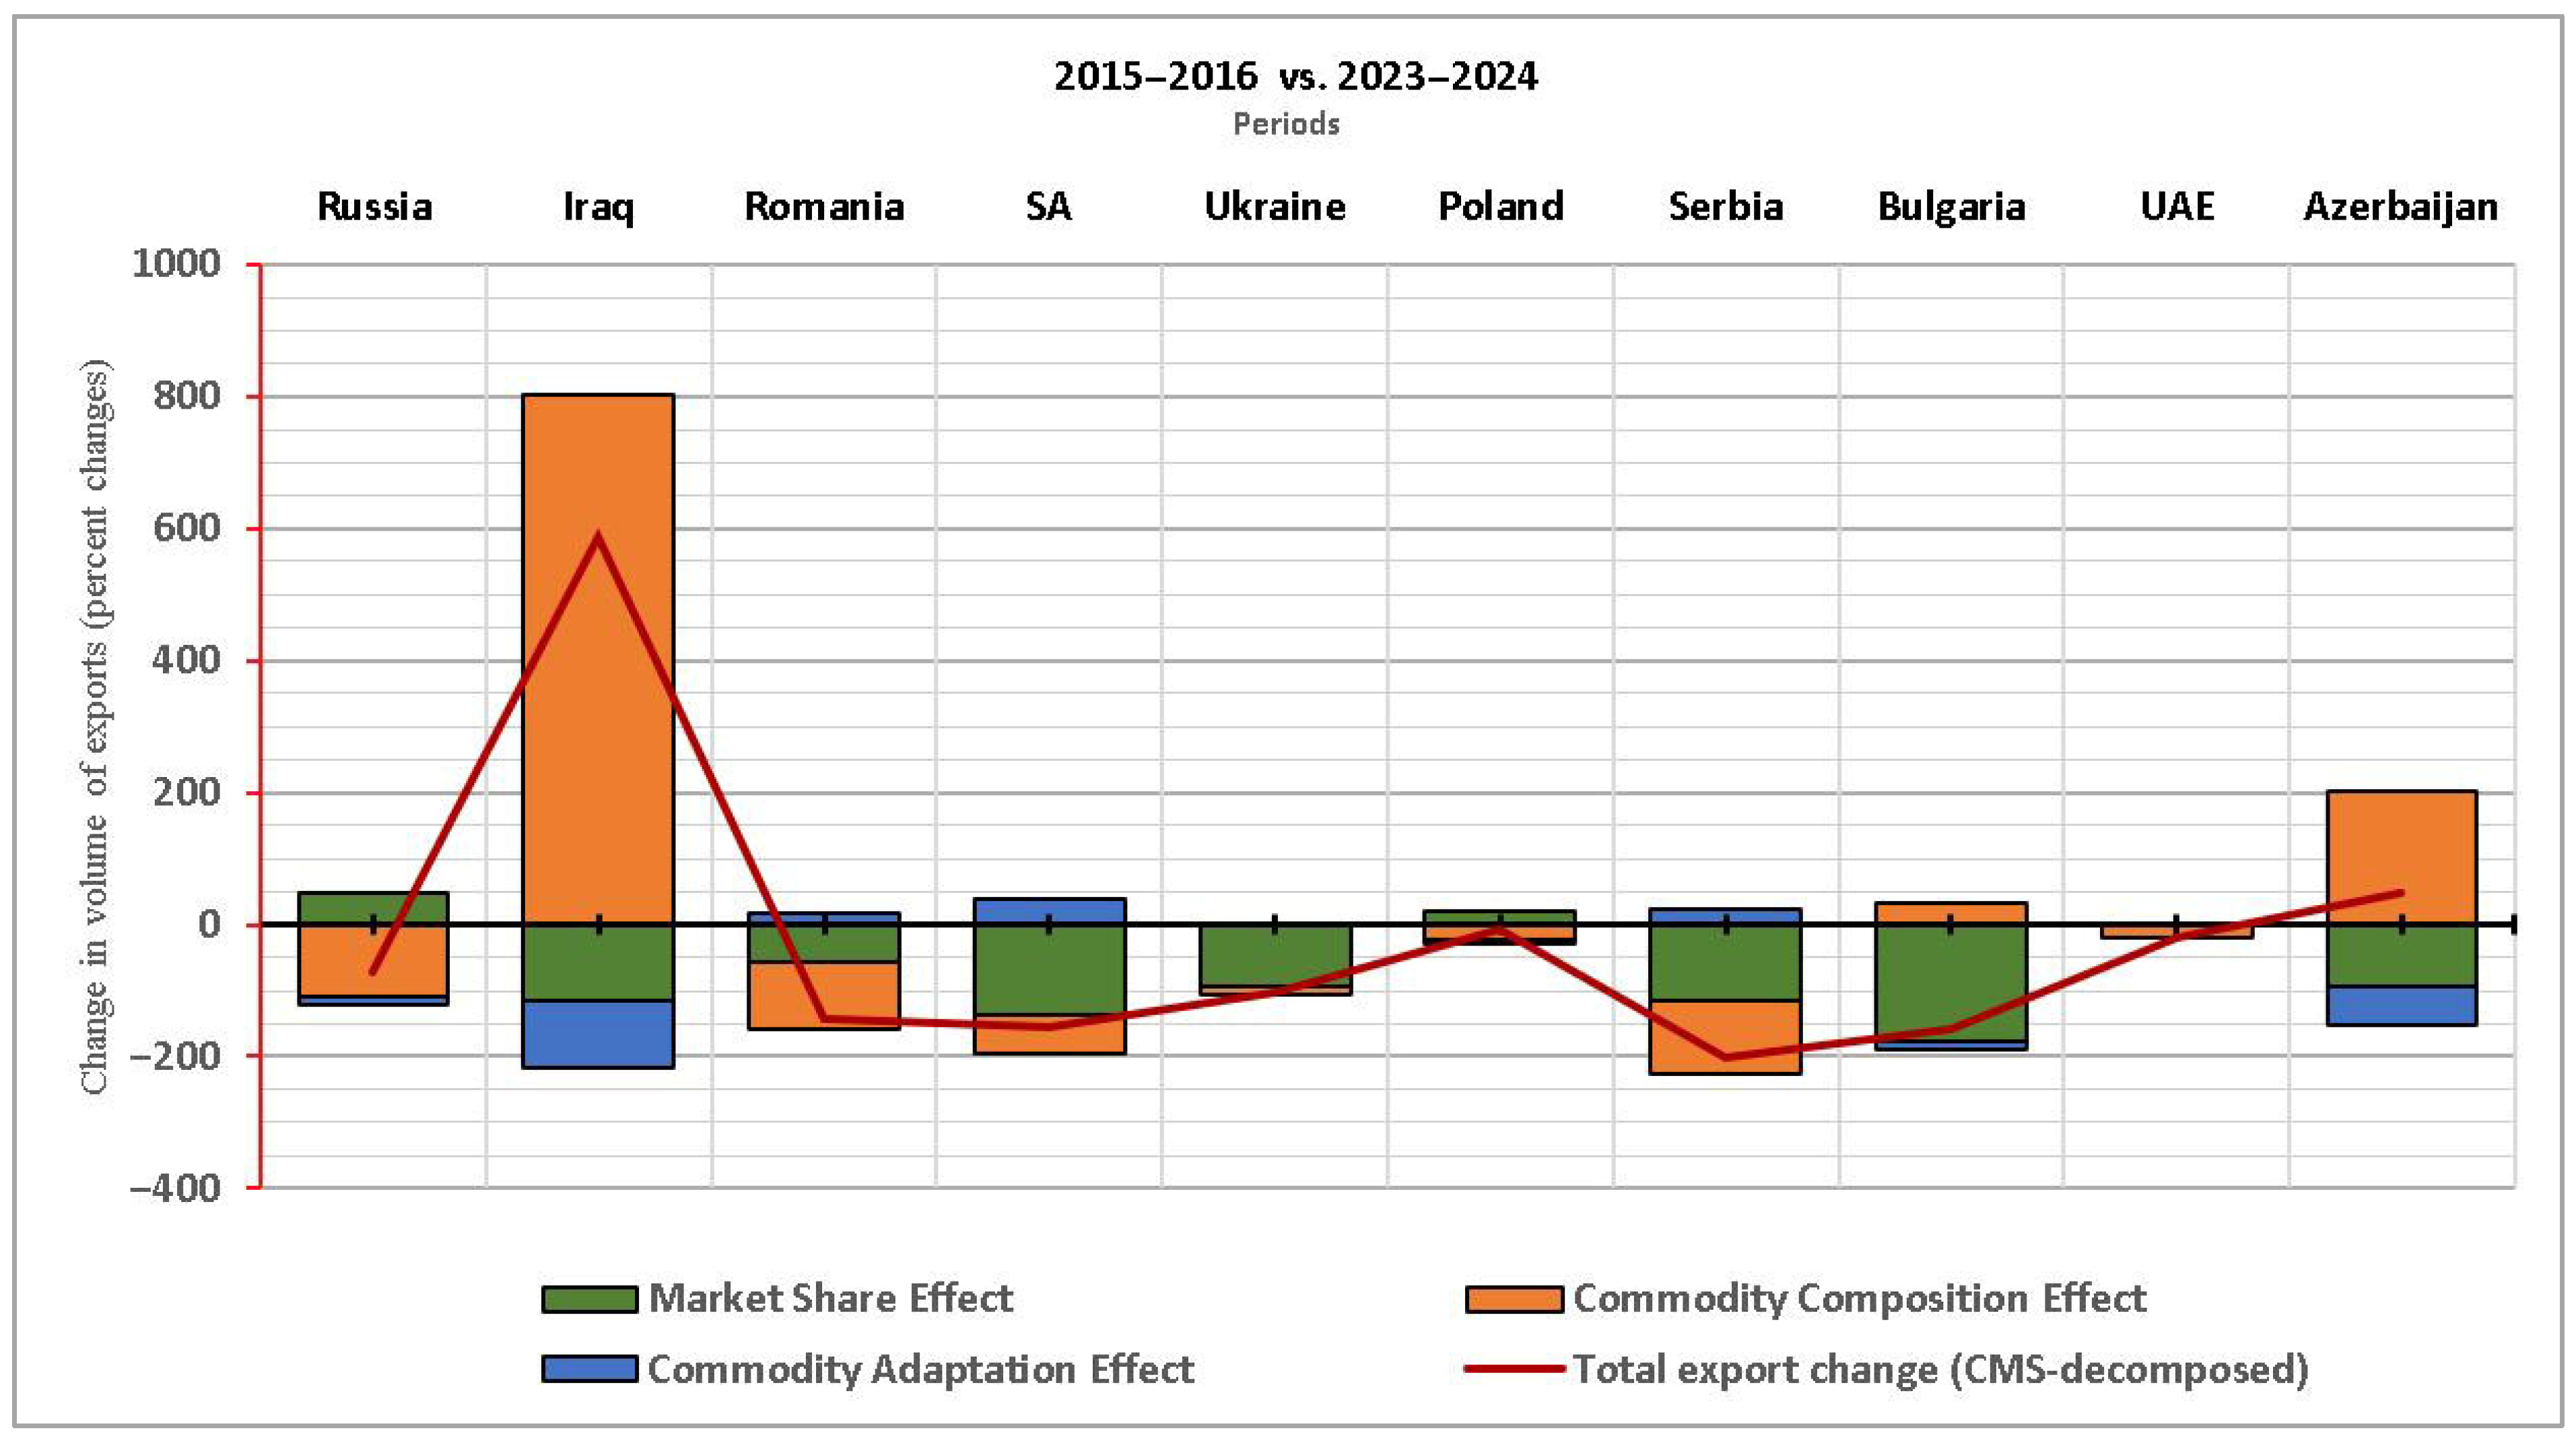
3.2.2. Analysis of Export Dynamics: Period I vs. Period III
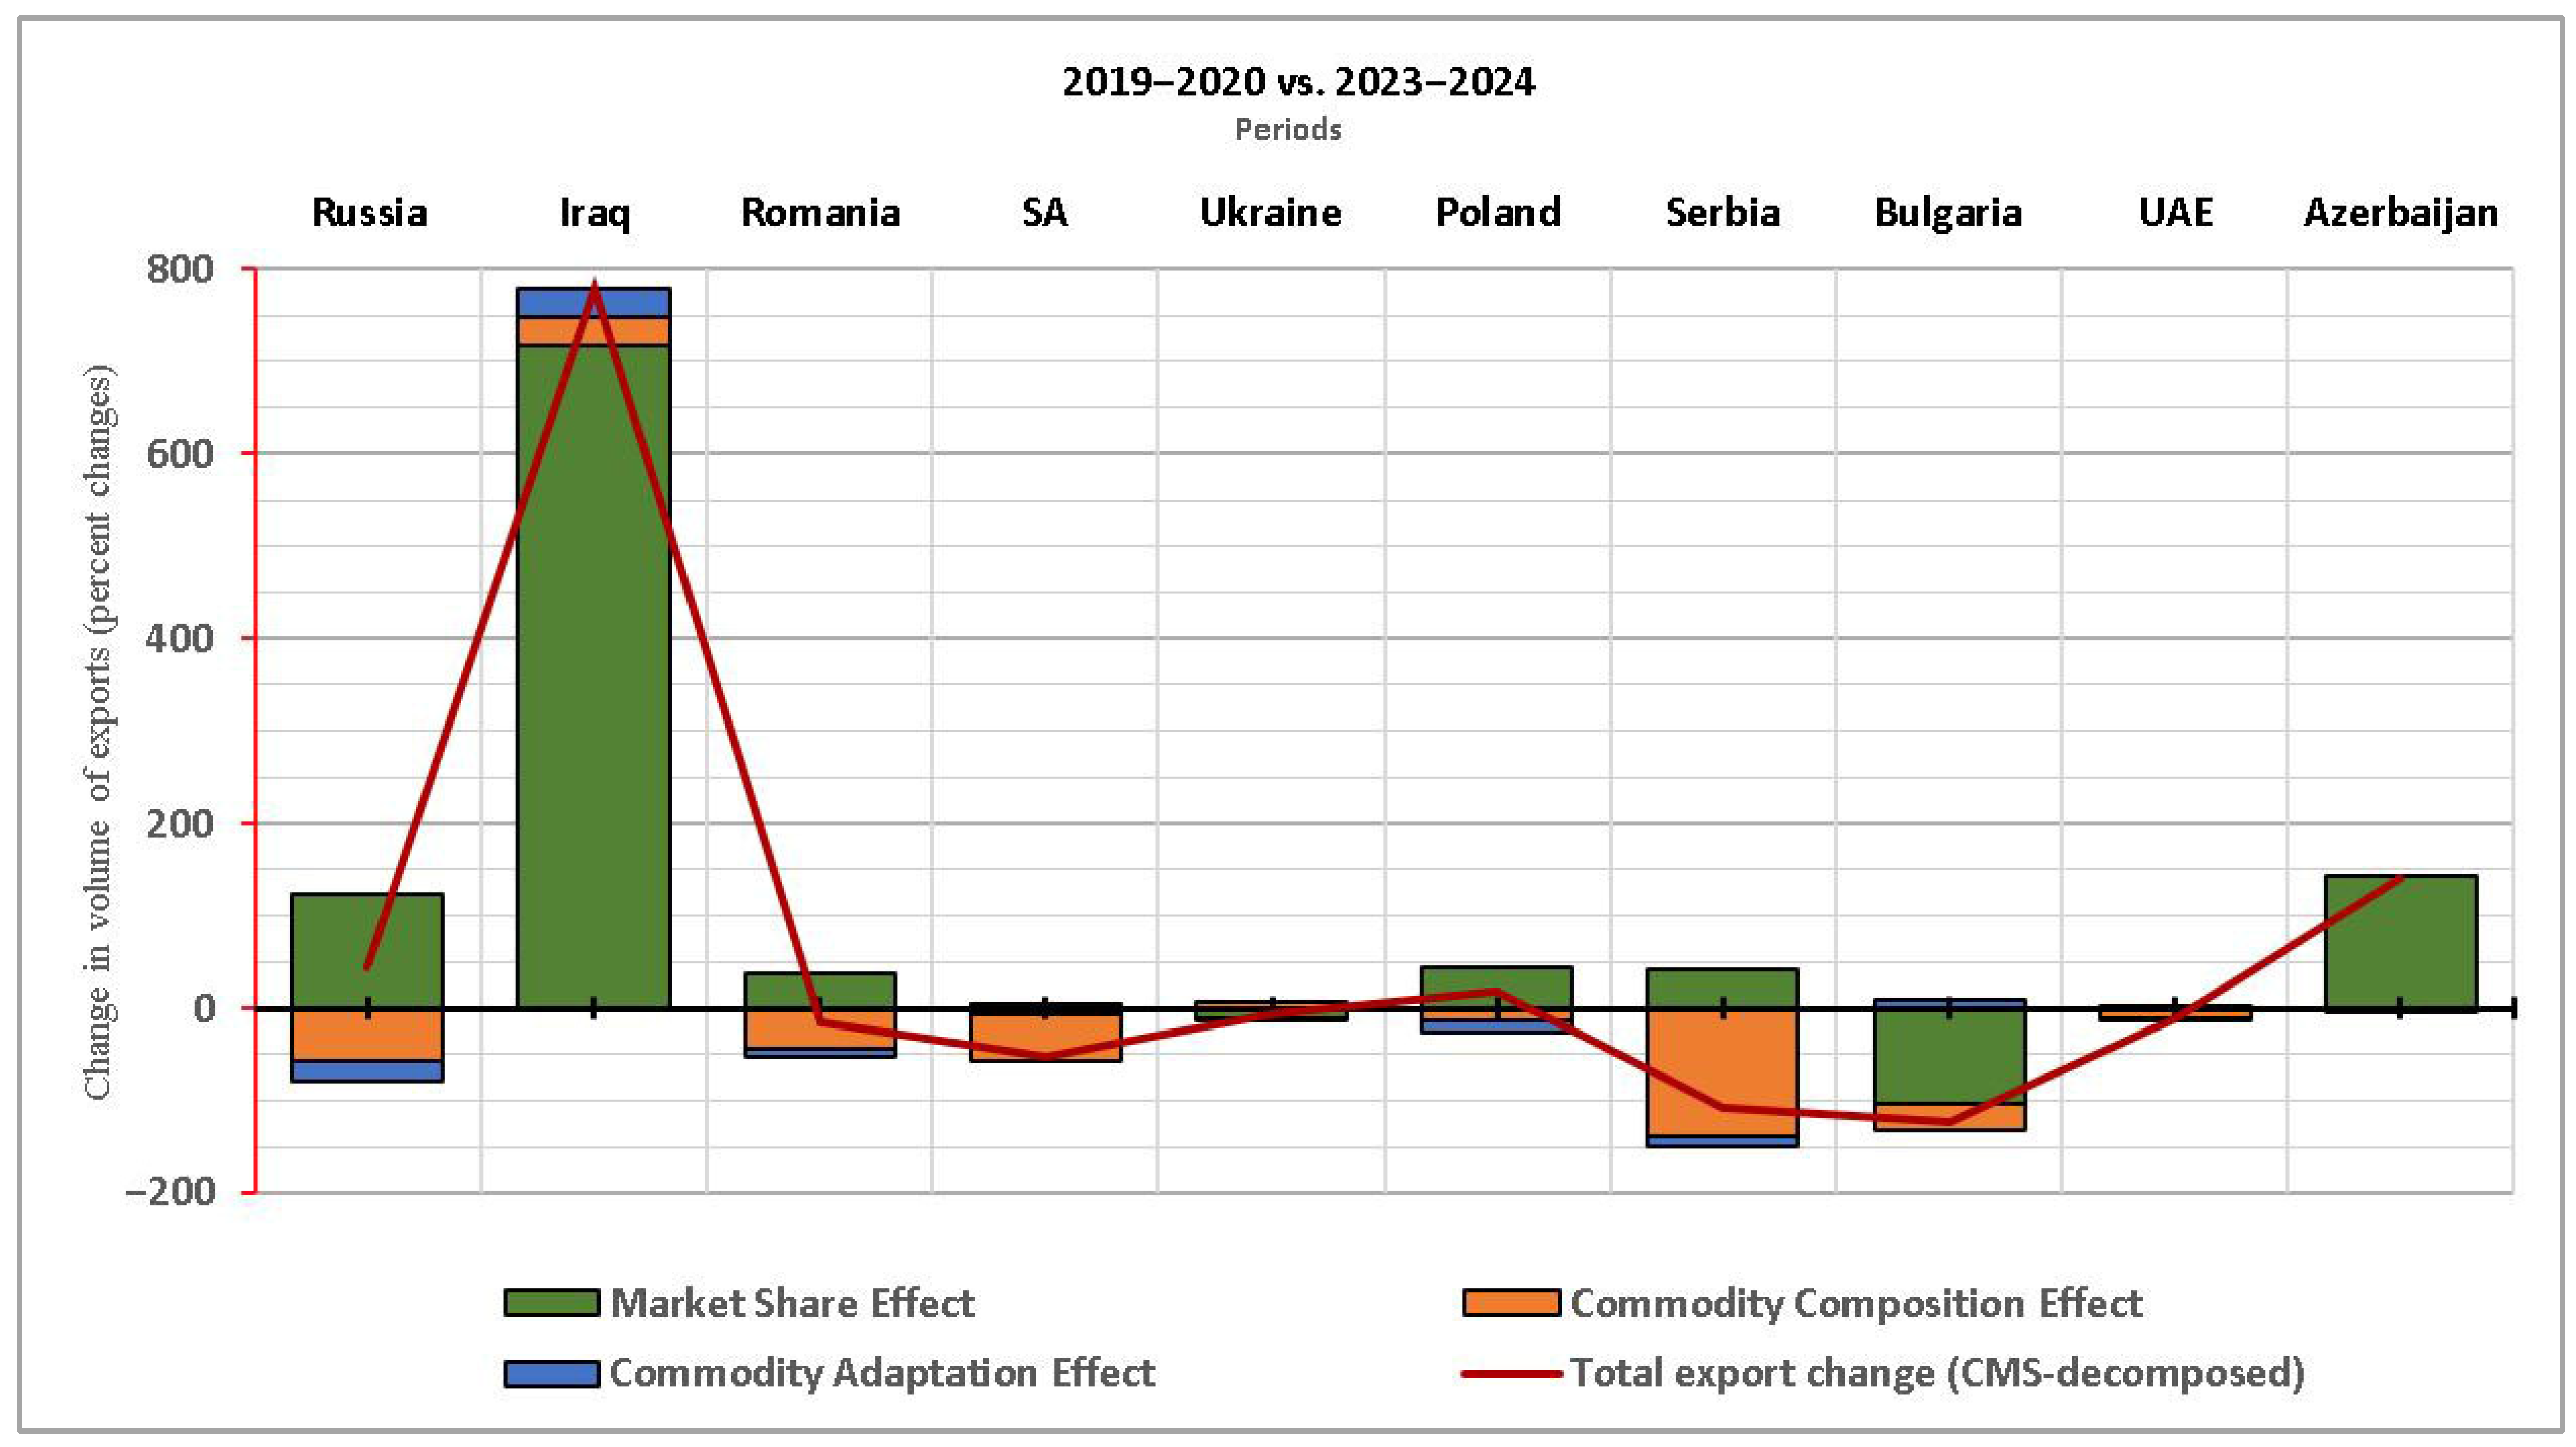
3.2.3. Analysis of Export Dynamics: Period II vs. Period III
4. Discussion
5. Conclusions
Funding
Institutional Review Board Statement
Informed Consent Statement
Data Availability Statement
Conflicts of Interest
References
- ITC—International Trade Centre. Trade Map: Global Exports of Lemons and Limes (HS Code: 080550). Available online: https://www.trademap.org/Index.aspx (accessed on 16 April 2025).
- TURKSTAT—Turkish Statistical Institute. Foreign Trade Statistics: Lemon Exports by Year and Country. Available online: https://data.tuik.gov.tr/ (accessed on 6 May 2025).
- FAOSTAT—Food and Agriculture Organization of the United Nations. FAOSTAT Statistical Database. Available online: https://www.fao.org/faostat/en/#home (accessed on 12 May 2025).
- UN Comtrade—United Nations. UN Comtrade Database. Available online: https://comtrade.un.org/ (accessed on 3 May 2025).
- Aday, S.; Aday, M.S. Impact of COVID-19 on the food supply chain. Food Qual. Saf. 2020, 4, 167–180. [Google Scholar] [CrossRef]
- Gozgor, G.; Khalfaoui, R.; Yarovaya, L. Global supply chain pressure and commodity markets: Evidence from multiple wavelet and quantile connectedness analyses. Financ. Res. Lett. 2023, 54, 103791. [Google Scholar] [CrossRef]
- Ridley, W.; Akhundjanov, S.B.; Devadoss, S. The COVID-19 pandemic and trade in agricultural products. World Econ. 2023, 54, 97–113. [Google Scholar] [CrossRef]
- Steinbach, S.; Grethe, H.; Nolte, S. The impact of COVID-19 trade measures on agricultural and food trade. Appl. Econ. Perspect. Policy 2022, 45, 911–927. [Google Scholar] [CrossRef]
- Angelidis, G.; Bratsas, C.; Makris, G.; Ioannidis, E.; Varsakelis, N.C.; Antoniou, I.E. Global value chains of COVID-19 materials: A weighted directed network analysis. Mathematics 2021, 9, 3202. [Google Scholar] [CrossRef]
- Erokhin, V.; Gao, T. Impacts of COVID-19 on Trade and Economic Aspects of Food Security: Evidence from 45 Developing Countries. Int. J. Environ. Res. Public Health 2020, 17, 5775. [Google Scholar] [CrossRef] [PubMed]
- Özözen, S. Türkiye’nin narenciye sektöründe karşilaştirmali rekabet gücü. Yön. Bil. Derg. 2023, 21, 944–967. [Google Scholar] [CrossRef]
- Kadanalı, E. Türkiye turunçgiller ihracatının rekabet gücünün analizi. Tar. Eko. Derg. 2019, 25, 15–25. [Google Scholar] [CrossRef]
- Ahmadi-Esfahani, F.Z. Wheat market shares in the presence of of Japanese import quotas. J. Policy Model. 1995, 17, 315–323. [Google Scholar] [CrossRef]
- Capobianco-Uriarte, M.T.; Aparicio, J.; De Pablo-Valenciano, J. Analysis of Spain’s competitiveness in the European tomato market: An application of the constant market share method. Span. J. Agric. Res. 2017, 15, e113. [Google Scholar] [CrossRef]
- Zdráhal, I.; Lategan, F.S.; Van Der Merwe, M. A constant market share analysis of the competitiveness of the Czech Republic’s agrifood exports (2002–2020) to the European Union. Agric. Econ.—Czech. 2023, 69, 498–509. [Google Scholar] [CrossRef]
- Klasra, M.A.; Fidan, H. Competitiveness of major exporting countries and Turkey in the world fishery market: A constant market share analysis. Aquac. Econ. Manag. 2007, 9, 317–330. [Google Scholar] [CrossRef]
- Soh, R.C.H.; Lim, G.T.; Chua, S.Y. Competitiveness of Malaysian fisheries exports: A constant market share analysis. Malays. J. Econ. Stud. 2021, 58, 175–198. [Google Scholar] [CrossRef]
- Nilsson, F.O.L.; Lindberg, E.; Surry, Y. Are the Mediterranean countries competitive in fresh fruit and vegetable exports? Acta Agric. Scand. Sect. C—Food Econ. 2007, 4, 203–216. [Google Scholar] [CrossRef]
- Chen, K.; Xu, L.; Duan, Y. Ex-Post competitiveness of China’s export in agri-food products: 1980-96. Agribusiness 2000, 16, 281–294. [Google Scholar] [CrossRef]
- Varalakshmi, K.; Devatkal, S. Competitiveness of Indian bovine meat exports: A constant market share analysis. Indian J. Anim. Sci. 2017, 87, 1026–1033. [Google Scholar] [CrossRef]
- Majdalawi, M.; Al-Habbab, M.; Al-Assaf, A.; Tabeah, M.; Araj, S.E.; Al-Antary, T.M. Improving supply chain of date palm by analyzing the competitiveness using a constant market share analysis. Fresenius Environ. Bull. 2020, 29, 10997–11005. [Google Scholar]
- Fu, H.; Huang, C.; Teng, Z.; Fang, Y. Market structure, international competitiveness, and price formation of Hainan’s fruit exports. Discret. Dyn. Nat. Soc. 2021, 2021, 6664780. [Google Scholar] [CrossRef]
- Cano-Espinosa, D.; Méndez-León, J.R. The competitive dynamics of mexican fresh grapes in the U.S. Market. World 2025, 6, 31. [Google Scholar] [CrossRef]
- Bulut, O.D.; Ağır, H.B.; Karaman, S.; Özden, C. Analysis of Türkiye’s export performance in the European hazelnut market: An application of the constant market share method. Appl. Fruit Sci. 2025, 67, 221. [Google Scholar] [CrossRef]
- OECD—Organisation for Economic Co-operation and Development. COVID-19 and Global Value: Policy Options to Build More Resilient Production Networks. 2020. Available online: https://www.oecd.org/en/publications/covid-19-and-global-value-chains-policy-options-to-build-more-resilient-production-networks_04934ef4-en.html (accessed on 16 April 2025).
- Glauber, J.; Laborde, D.; Martin, W.; Vos, R. Agricultural Trade Policy Responses During the First Wave of the COVID-19 Pandemic; International Food Policy Research Institute (IFPRI): Washington, DC, USA, 2020. [Google Scholar]
- FAO—Food and Agriculture Organization of the United Nations. The Impact of COVID-19 on Global Agricultural Trade: Evidence from 2020 and Policy Implications. Available online: https://www.fao.org/documents/card/en/c/cc1127en/ (accessed on 16 April 2025).
- WBG—World Bank Group. COVID-19 and Food Protectionism: The Impact of the Pandemic and Export Restrictions on World Food Markets. Available online: https://documents1.worldbank.org/curated/en/417171589912076742/pdf/Covid-19-and-Food-Protectionism-The-Impact-of-the-Pandemic-and-Export-Restrictions-on-World-Food-Markets.pdf (accessed on 25 April 2025).
- Mizik, T. Agri-Food trade competitiveness: A Review of the Literature. Sustainability 2021, 13, 11235. [Google Scholar] [CrossRef]
- Tyszynski, H. World trade in manufactured commodities, 1899–1950. Manch. Sch. Econ. Soc. Stud. 1951, 19, 272–304. [Google Scholar]
- Richardson, J.D. Constant market shares analysis of export growth. J. Int. Econ. 1971, 1, 227–239. [Google Scholar] [CrossRef]
- Liesner, H. The European common market and British industry. Econ. J. 1958, 68, 302–311. [Google Scholar] [CrossRef]
- Balassa, B. Trade liberalization and revealed comparative advantage. Manch. Sch. Econ. Soc. Stud. 1965, 33, 99–123. [Google Scholar] [CrossRef]
- Aiginger, K. Specialisation of European manufacturing. Aust. Econ. Q. 2000, 5, 81–92. [Google Scholar]
- Fertö, I.; Bojnec, S. Comparative Advantages in Agro-Food Trade of Hungary, Croatia and Slovenia with the European Union; IAMO Discussion Paper No. 106; IAMO: Halle, Germany, 2007. [Google Scholar]
- ITC—International Trade Centre. ITC’s Trade and Market Intelligence Section—Trade Performance HS User Guide. Available online: https://tradecompetitivenessmap.intracen.org/Documents/TradeCompMap-Trade%20PerformanceHS-UserGuide-EN.pdf (accessed on 16 April 2025).
- Mushanyuri, B.E.; Mzumara, M. An assessment of comparative advantage of Mauritius. Eur. J. Sustain. Dev. 2013, 2, 35–42. [Google Scholar] [CrossRef]
- Ullah, M.; Kazuo, I. Dynamics of comparative advantage and export potentials in Bangladesh. Ritsumeikan Econ. Rev. 2012, 61, 471–484. [Google Scholar]
- Ervani, E. Export and import performance of Indonesia’s agriculture sector. J. Econ. Policy 2013, 6, 54–63. [Google Scholar]
- OECD—Organisation for Economic Co-operation and Development. COVID-19 and the Global Food Systems. Available online: https://www.oecd.org/content/dam/oecd/en/publications/reports/2020/06/covid-19-and-global-food-systems_4e20dc60/aeb1434b-en.pdf (accessed on 19 April 2025).
- FAO—Food and Agriculture Organization of the United Nations. COVID-19 and the Risk to Food Supply Chains: How to Respond? Available online: https://www.fao.org/documents/card/en/c/ca8388en (accessed on 16 April 2025).
- FAO—Food and Agriculture Organization of the United Nations. Food Outlook—Biannual Report on Global Food Markets. Available online: https://www.fao.org/3/ca9509en/CA9509EN.pdf (accessed on 8 April 2025).
- Karaman, S.; Kutlar, I. Impact of COVID-19 on the fresh fruit and vegetable market’s equilibrium in Turkey. Fresenius Environ. Bull. 2021, 30, 9162–9171. [Google Scholar]
- IIAP—Interamerican Institute for Agriculture and Production. COVID-19: Impacts and Opportunities for Citrus. 2020. Available online: https://iiap.info/wp-content/uploads/2020/07/Covid-19-impacts-and-opportunities-for-citrus.pdf (accessed on 12 May 2025).
- USDA—United States Department of Agriculture, Foreign Agricultural Service. Annual Report (GAIN Report No. TU2023-0005). Available online: https://www.fas.usda.gov/data/turkey-citrus-semi-annual-3 (accessed on 15 May 2025).
- Subaşı, O.S.; Uysal, O. Producer Perceptions Regarding Policies Implemented forSustainable Lemon Production and Trade During the Covid-19 Pandemic: The Case of Mersin. Tarım Ekon. Araştırmaları Derg. 2024, 10, 215–228. [Google Scholar] [CrossRef]
- Republic of Türkiye Ministry of Agriculture and Forestry. Limon Ihracatına Geçici Kısıtlama Getirildi [Temporary Restriction Imposed on Lemon Exports]. 2020. Available online: https://www.tarimorman.gov.tr (accessed on 22 April 2025).
- Barichello, R. The COVID-19 pandemic: Anticipating its effects on Canada’s agricultural trade. Can. J. Agric. Econ./Rev. Can. d’Agroecon. 2020, 68, 219–224. [Google Scholar] [CrossRef]
- Wognum, P.M.; Bremmers, H.J.; Trienekens, J.H.; van der Vorst, J.G.A.J.; Bloemhof, J.M. Systems for sustainability and transparency of food supply chains—Current status and challenges. Adv. Eng. Inform. 2011, 25, 65–76. [Google Scholar] [CrossRef]
- Gereffi, G. Global value chains in a post-Washington Consensus world. Rev. Int. Political Econ. 2014, 21, 9–37. [Google Scholar] [CrossRef]
- UNCTAD—United Nations Conference on Trade and Development. Global Trade Update (/DITC/INF/2021/2). 19 May 2021. Available online: https://unctad.org/system/files/official-document/ditcinf2021d2_en.pdf (accessed on 16 April 2025).
- Monferdini, L.; Bottani, E. Examining the Response to COVID-19 in Logistics and Supply Chain Processes: Insights from a State-of-the-Art Literature Review and Case Study Analysis. Appl. Sci. 2024, 14, 5317. [Google Scholar] [CrossRef]
- Barman, A.; Das, R.; De, P.K. Logistics and supply chain management of food industry during COVID-19: Disruptions and a recovery plan. Environ. Syst. Decis. 2022, 42, 338–349. [Google Scholar] [CrossRef] [PubMed]
- Deconinck, K.; Avery, E.; Jackson, L.A. Food Supply Chains and Covid-19: Impacts and Policy Lessons. EuroChoices 2020, 19, 34–39. [Google Scholar] [CrossRef] [PubMed Central]
- FAO—Food and Agriculture Organization of the United Nations. The State of Agricultural Commodity Markets; FAO: Rome, Italy, 2022; Available online: https://openknowledge.fao.org/items/b62d008a-11a8-4630-a603-c98398a9ac16 (accessed on 22 April 2025).
- OECD—Organisation for Economic Co-operation and Development. Food Supply Chains and COVID-19: Impacts and Policy Lessons. OECD Policy Responses to Coronavirus (COVID-19). 2020. Available online: https://www.oecd.org/content/dam/oecd/en/publications/reports/2021/07/covid-19-and-food-systems_393169b7/69ed37bd-en.pdf?utm_source=chatgpt.com (accessed on 18 April 2025).
- Oliveira, M.d.F.; Reis, P. Portuguese Agrifood Sector Resilience: An Analysis Using Structural Breaks Applied to International Trade. Agriculture 2023, 13, 1699. [Google Scholar] [CrossRef]
- Ngobeni, L. Structural Change in the South African Agricultural Sector: Bai–Perron Modelling. Sci. Afr. 2023, 21, e01732. [Google Scholar] [CrossRef]
- Glauber, J.; Laborde, D.; Martin, W.; Vos, R. COVID-19: Trade restrictions are worst possible response to safeguard food security. IFPRI Blog Post, 27 March 2020. [Google Scholar]


| Period I | Period II | Period III | ||||||
|---|---|---|---|---|---|---|---|---|
| Countries | 2015 | 2016 | 2019 | 2020 | 2023 | 2024 | 2015–2024 | |
| Mean | Rate (%) | |||||||
| Russia | 73,204 | 76,542 | 65,064 | 76,832 | 76,694 | 69,039 | 76,158 | 25.22 |
| Iraq | 40,905 | 38,582 | 29,447 | 46,916 | 90,089 | 112,395 | 51,682 | 17.11 |
| Romania | 20,569 | 25,315 | 17,986 | 18,005 | 24,122 | 23,133 | 22,739 | 7.53 |
| SA | 29,498 | 34,119 | 20,131 | 8864 | 13,005 | 10,247 | 19,920 | 6.60 |
| Ukraine | 15,473 | 16,304 | 17,095 | 19,393 | 21,097 | 20,656 | 18,257 | 6.04 |
| Poland | 15,319 | 12,782 | 10,989 | 12,919 | 23,955 | 25,335 | 16,492 | 5.46 |
| Serbia | 9059 | 11,810 | 12,107 | 12,346 | 14,759 | 14,297 | 13,182 | 4.36 |
| Bulgaria | 10,137 | 12,712 | 13,143 | 12,891 | 12,076 | 13,012 | 12,994 | 4.30 |
| UAE | 9654 | 10,114 | 7091 | 7058 | 8273 | 4923 | 7987 | 2.64 |
| Azerbaijan | 2853 | 3029 | 3954 | 1925 | 7478 | 7155 | 4460 | 1.48 |
| Subtotal | 226,671 | 241,309 | 197,007 | 217,149 | 291,548 | 300,192 | 243,870 | 80.75 |
| Others | 67,104 | 63,339 | 46,820 | 54,701 | 67,037 | 61,075 | 58,145 | 19.25 |
| World | 293,775 | 304,648 | 243,827 | 271,850 | 358,585 | 361,267 | 302,015 | 100.00 |
| Period | Years | Explanation |
|---|---|---|
| Period I | 2015–2016 | Selected as the base period, representing pre-shock conditions and Türkiye’s traditional export structure before major global disruptions. |
| Period II | 2019–2020 | Marks a transitional phase characterized by the onset of the COVID-19 pandemic and shifts in global trade patterns affecting export dynamics. |
| Period III | 2023–2024 | Represents the post-shock adjustment period where Türkiye’s lemon exports have stabilized, indicating a potential new trade equilibrium. |
| Value (1000 $) | Rate in Target Market Import from World (%) | Rate in Türkiye’s Export to Target Market (%) | ||
|---|---|---|---|---|
| World Import | 4,543,055 | - | - | |
| Target Market Import from World | 843,083 | 100 | - | |
| Countries Türkiye Export to (Target Market) | Iraq | 112,395 | 13.33 | 37.44 |
| Russia | 69,039 | 8.19 | 23.00 | |
| Poland | 25,335 | 3.01 | 8.44 | |
| Romania | 23,133 | 2.74 | 7.71 | |
| Ukraine | 20,656 | 2.45 | 6.88 | |
| Serbia | 14,297 | 1.70 | 4.76 | |
| Bulgaria | 13,012 | 1.54 | 4.33 | |
| SA | 10,247 | 1.22 | 3.41 | |
| Azerbaijan | 7155 | 0.85 | 2.38 | |
| UAE | 4923 | 0.58 | 1.64 | |
| Türkiye’s export to Target Market | 300,192 | 35.61 | 100.00 | |
| Period I vs. Period II | Period I vs. Period III | Period II vs. Period III | ||||||||||
|---|---|---|---|---|---|---|---|---|---|---|---|---|
| MSE | CCE | CAE | Total | MSE | CCE | CAE | Total | MSE | CCE | CAE | Total | |
| Russia | −88.79 | −37.16 | 7.92 | −118.03 | 47.17 | −108.36 | −12.27 | −73.47 | 123.82 | −56.02 | −23.24 | 44.56 |
| Iraq | −507.35 | 733.99 | −419.00 | −192.36 | −114.31 | 803.48 | −103.35 | 585.82 | 717.63 | 29.82 | 30.73 | 778.18 |
| Romania | −99.21 | −40.25 | 12.57 | −126.89 | −56.45 | −103.56 | 18.41 | −141.61 | 37.33 | −43.54 | −8.52 | −14.72 |
| SA | −130.79 | 72.26 | −45.23 | −103.76 | −136.29 | −58.04 | 37.86 | −156.47 | −7.40 | −48.74 | 3.43 | −52.71 |
| Ukraine | −81.06 | −19.86 | 3.89 | −97.03 | −93.25 | −11.92 | 2.69 | −102.49 | −11.61 | 6.39 | −0.23 | −5.46 |
| Poland | −25.53 | −1.65 | 0.57 | −26.61 | 19.19 | −22.13 | −5.72 | −8.66 | 43.73 | −13.45 | −12.33 | 17.95 |
| Serbia | −152.98 | 81.28 | −22.29 | −93.98 | −116.48 | −108.79 | 22.71 | −202.56 | 41.82 | −137.96 | −12.43 | −108.58 |
| Bulgaria | −88.79 | 69.79 | −15.79 | −34.79 | −176.08 | 31.52 | −14.14 | −158.70 | −102.81 | −29.61 | 8.51 | −123.91 |
| UAE | −3.40 | −5.04 | 0.48 | −7.96 | −1.77 | −18.01 | 0.90 | −18.87 | 1.41 | −11.72 | −0.60 | −10.91 |
| Azerbaijan | −183.55 | 205.57 | −113.46 | −91.44 | −94.79 | 201.20 | −57.34 | 49.07 | 143.63 | −1.96 | −1.17 | 140.51 |
| Period I | Period II | Period III | |
|---|---|---|---|
| RCA | 10.938 | 7.333 | 8.180 |
| TSI | 0.984 | 0.987 | 0.986 |
Disclaimer/Publisher’s Note: The statements, opinions and data contained in all publications are solely those of the individual author(s) and contributor(s) and not of MDPI and/or the editor(s). MDPI and/or the editor(s) disclaim responsibility for any injury to people or property resulting from any ideas, methods, instructions or products referred to in the content. |
© 2025 by the author. Licensee MDPI, Basel, Switzerland. This article is an open access article distributed under the terms and conditions of the Creative Commons Attribution (CC BY) license (https://creativecommons.org/licenses/by/4.0/).
Share and Cite
Bulut, O.D. COVID-19’s Impact on Türkiye’s Lemon Exports: Constant Market Share Decomposition (2015–2024). Sustainability 2025, 17, 8700. https://doi.org/10.3390/su17198700
Bulut OD. COVID-19’s Impact on Türkiye’s Lemon Exports: Constant Market Share Decomposition (2015–2024). Sustainability. 2025; 17(19):8700. https://doi.org/10.3390/su17198700
Chicago/Turabian StyleBulut, Osman Doğan. 2025. "COVID-19’s Impact on Türkiye’s Lemon Exports: Constant Market Share Decomposition (2015–2024)" Sustainability 17, no. 19: 8700. https://doi.org/10.3390/su17198700
APA StyleBulut, O. D. (2025). COVID-19’s Impact on Türkiye’s Lemon Exports: Constant Market Share Decomposition (2015–2024). Sustainability, 17(19), 8700. https://doi.org/10.3390/su17198700


