Abstract
Urban resilience has gained significant further attention since the COVID-19 pandemic, resulting in various assessments comparing cities’ ability to respond to, and recover from, diverse shocks. This paper responds to the call for grounding urban resilience in context by examining a case study of the city regions on the island of Hainan Province, China, following the onset of the COVID-19 outbreak. After content analysis to trace the lineage of urban resilience in the Chinese context, an exploratory study, including analysis and mapping of statistical data, was conducted to examine the city’s economic and social performance from 2018 to 2021 and beyond. Our study suggests a largely positive trend in the bouncing back and forward of city regions shortly after the pandemic began, as well as a rural–urban gap and growing regional disparities that need to be addressed to enhance resilience for all. This study provides a contextualized understanding of Hainan as it navigates pandemic stresses and builds capacities during state-supported structural transformations in its development as a free trade port. Furthermore, this study suggests a valuable city region analytical lens and a geographical perspective for implementing the urban resilience concept and building urban resilience efforts in China and elsewhere.
1. Introduction
Globally, urban areas play a crucial role in the economic development of nations and regions [1]. Rapid urbanization and development have been met with increased vulnerability of urban areas to external challenges, such as economic, social, climate, and, more recently, health crises. While the UN 2030 Agenda for Sustainable Development prominently features sustainability [2], several of its Sustainable Development Goals (SDGs) also focus on promoting, building, and strengthening resilience. For example, under “Goal 1. End poverty in all its forms everywhere”, 1.5 aims to “[b]y 2030, build the resilience of the poor and those in vulnerable situations and reduce their exposure and vulnerability to climate-related extreme events and other economic, social and environmental shocks and disasters” [2]. Under “Goal 11. Make cities and human settlements inclusive, safe, resilient and sustainable”, 11.b aims to “[b]y 2020, substantially increase the number of cities and human settlements adopting and implementing integrated policies and plans towards inclusion, resource efficiency, mitigation and adaptation to climate change, resilience to disasters” [2]. And “Goal 13. Take urgent action to combat climate change and its impacts” begins with “13.1 [s]trengthen[ing] resilience and adaptive capacity to climate-related hazards and natural disasters in all countries” [2]. In the meantime, resilience, along with sustainability, has particularly become a central concept of urban strategies in recent decades for countries in the Global South [3].
Since the COVID-19 pandemic, another wave of assessments has emerged to rank cities’ response to, and recovery from, multiple shocks. Notably, the economic and social dimensions of resilience are often simplified and reduced to parts of composite indices to offer generalized comparisons across selected cities. A geographical perspective in empirical studies is still largely missing, creating a lack of grounded, critical, and comprehensive understanding of urban resilience. Such a perspective would encourage attention to variegated spatial contexts and centering spatial inequity and justice, while suggesting appropriate analytical lenses and scales for implementing urban resilience efforts [4]. In other words, geographers are well equipped to move urban resilience from a descriptive concept to meaningful practices [5].
To fill these gaps, this paper employs a case study of the city regions in China’s Hainan province. As China’s largest special economic zone since 1988 and the country’s only island province, Hainan has experienced rapid urbanization and economic growth since 1978. It has attracted scholarly interest due to its geography, eco-environmental vulnerability, and recent status as the country’s pilot zone for deepening reform [6,7]. Therefore, this unique case has potential to offer learning experiences for other frontline communities facing multiple challenges.
We aim to address two objectives in this paper. First, we trace the lineage and analyze the concept of urban resilience and related discourses in Chinese state and local policy and media. Second, we test the hypothesis generated from content analysis through exploring the economic and social performance of Hainan’s city regions in the first two years immediately following the onset of COVID-19 and beyond. We map and explore the changing values of key variables across city regions and over time, to gain insights into the urban resilience and spatial inequity of Hainan in the wake of the pandemic.
This article is organized into the following sections. We first review the literature on urban resilience both globally and within China, followed by a discussion of the methods and data used in the empirical case study. We then discuss the results from the content analysis and exploratory analysis and make concluding remarks.
2. About Urban Resilience
Urban resilience as a concept has evolved significantly since its inception, with distinct phases before, during, and after the 2000s. Before the 2000s, the study of urban resilience primarily revolved around disaster management and recovery [8]. In the early 2000s, the United Nations introduced the term “sustainable urban development,” highlighting the critical importance of environmental sustainability within urban planning and development. This shift was reflected in influential documents such as the “Millennium Development Goals” (2000) and “Agenda 21” (1992) [9,10].
The mid-2000s marked a pivotal moment in the understanding of urban resilience, also referred to as “cities of resilience” or “resilient cities,” departing from the resilience theory in psychology, engineering, and ecology and demonstrating a growing recognition of complexity, interdependence, and socio-economic factors and coupled social–ecological systems embedded in cities [11,12,13]. Scholars acknowledged that cities and regions are part of the intricate, path-dependent, socio-economic–environmental, and integrated ecological–social systems influenced by numerous interconnected elements [13,14]. Since the mid-2000s, albeit in a limited quantity, discussions on urban resilience have incorporated concepts of “equity” and “social justice” [11,12,13,15]. These principles played a prominent role in shaping the discourse, emphasizing the importance of ensuring that resilience efforts benefited all segments of the urban population with “different technologies, interests, and levels of power” [15]. Through multiple prisms from social psychology to planning and governance, a multidisciplinary collection of work called for accountability, inclusion/participation, and cultural and contextual sensitivity and reflexivity, underlining the significance of ensuring that vulnerable people do not bear a disproportionate burden from shocks and pressures [14,15,16,17]. Not only have inequity and injustice been shown to be factors that undermine urban resilience [9], but addressing these issues has been advocated as a significant step toward building resilient communities and cities, and should be placed “at the heart of resilience building” [12,18].
The following decade, the 2010s, saw continued globalization of urbanization, climate change, disasters, and an increasing focus on implementing strategic measures aimed at anticipating and mitigating potential future uncertainties, encompassing identifiable and unforeseen risks [19]. In addition to efforts from geographers and urban scholars to further clarify the concept of urban resilience, there was an increased emphasis on equity, social justice, community involvement, and public participation [20,21,22]. Urban resilience was perceived not only as a centralized solution but also as a process that required active engagement and involvement from local communities. Further, building resilience has been thought to foster long-term, transformative social change [23,24].
Simultaneously, the shift to a more comprehensive and proactive perspective that emphasizes the capacity to learn, adapt, and transform has concurred with the interests of various actors, including nonprofit organizations and global consulting firms. In 2013, the Rockefeller Foundation rolled out its “100 Resilient Cities” (100RC) network, later stating, “we are building a movement[—c]ities learning from [c]ities” [25]. Seeking a universal understanding of resilience, their report states that it is “the ability of a system, entity, community, or person to withstand shocks while still maintaining its essential functions.” Resilience also refers to “the ability to recover quickly and effectively from catastrophe and the capability to endure greater stress” [26]. In 2014, The Rockefeller Foundation and the global consulting firm Arup published the “City Resilience Framework,” which includes a modified, pro-poor definition of city resilience and 12 indicators. In this report, city resilience “describes the capacity of cities to function, so that the people living and working in cities—particularly the poor and vulnerable—survive and thrive no matter what stresses or shocks they encounter” [27]. In 2017, Oxfam also published a guideline on “Absorb, Adapt, Transform: Resilience Capacities,” which recognizes various experiences and ways of perceiving and describing resilience [28].
Urban resilience has continued to receive attention in recent years due to an increasingly rapid pace of urbanization and the recognition of cities as centers for economic growth, social development, and environmental sustainability. More cities and organizations have developed strategies to enhance urban resilience, focusing on areas such as disaster preparedness, infrastructure resilience, social cohesion, governance and planning, and sustainable development [29,30,31]. A shift to Global South cities is noticeable. For example, the United Nations Office for Disaster Risk Reduction (UNDRR) engaged in a decade-long Making Cities Resilient (MCR) Campaign from 2010 to 2020 and published “The Ten Essentials for Making Cities Resilient” and the MCR 2030 initiative with a strong emphasis on the cities in the Global South [29]. The UN-Habitat and United Nations Development Programme (UNDP) created “Integrated Urban Resilience in SID,” an initiative to “support resilience in Small Island Developing States and Coastal Cities” [30].
Overall, despite extensive studies aiming to define and evaluate urban resilience by describing the critical assets and features required for it, many consider the concept in contradictions or intrinsic tensions: lacking total clarity but possible to integrate multiple dimensions, demanding contextualized interpretations and practical tools such as measures, and requiring both immediate and long-term policy attention [20,22]. At the same time, the exponential increase in publications and practices related to urban resilience is not without criticism. Human geographers have critiqued urban resilience as a governance agenda rolled out by public, private, and nonprofit sector actors [32]. Climate geographers acknowledge the importance of cities being resilient in preparing for climate change, but caution against the use of urban resilience to ensure positive social change and long-term sustainability [33]. Urban geographers advocate for nuanced understandings of the “urban” in urban resilience studies as well as attentiveness to scalar dimensions [21], concurring with earlier calls for studying cross-scale interactions and expanding the scales of work on urban resilience in the 2000s (see [12], for example). Economic geographers and regional scientists, on the other hand, have offered insights on regional economic resilience and highlighted the complexities of regions, agents and actors, and various scales and scopes of state response. Critically, resilience is considered “highly relevant to understanding the process and patterns of uneven regional development” [34].
In China, although the terms “resilience” and “economic resilience” appeared earlier in public discourse, urban resilience is a relatively new concept. Two Chinese cities were selected to join the 100RC initiative in the mid 2010s. However, until recently, the concept had been primarily introduced by nongovernmental organizations to foster awareness, training, and planning practices toward disaster risk reduction and building climate-resilient cities (see, for example [35]). Nevertheless, the COVID-19 pandemic has enhanced the utility of urban resilience as a notion in health emergencies, propelling renewed interest in applying the concept and developing comprehensive assessment tools in countries such as China. Since the pandemic, an embryonic English-language scholarship on urban resilience from China has emerged after a few earlier sporadic articles about 韧性城市 (renxing chengshi, meaning resilient city) in the Chinese language, with several recent publications already creating urban resilience indices to map out and compare cities across the country (see [36], for example).
Notably, unprecedented events such as COVID-19 have redirected the literature to converge on the “reactive” dimension of resilience as the capacity to return to a previous condition following a shock or disturbance, or more specifically “the ability to resist, cope with, or bounce back to previous conditions” [37]. The integration of pandemic-related tactics, including healthcare capacity, remote work infrastructure, and public health measures, has been observed in developing resilience planning [38].
In this paper we see urban resilience in a broad sense as the city, metropolitan, or urban area and its surrounding region’s capacity to endure and rebound from various shocks, stresses, disturbances, and disruptions––a “reactive” capacity that involves maintaining essential functions while adapting to change and safeguarding the well-being and quality of life of its residents, as well as the “reflexive” ability to learn, evolve, and create a new balance [39]. It is undoubtedly both outcome- and process-oriented [40]. It is about “bouncing back and forward” [41], which can be summed up as a city’s ability to resist, recover, adapt, and transform in the face of various threats, such as pandemics, natural disasters, climate change, economic downturns, social conflicts, and infrastructure breakdowns [22].
This paper examines an extensive timeline to understand urban resilience in the state policy and media context, and then focuses on the years before and following the shock of COVID-19 as a context to map and explore two specific dimensions of urban resilience [22]. Importantly, our paper does not intend to create another all-encompassing yet abstract urban resilience index for ranking Chinese cities. Instead, we revert to the descriptive nature of urban resilience, and fill the gap with a geographically grounded exploratory case study to facilitate critical thinking and open up situated discussions on urban resilience and resilience capacity-building in China. Such an integrated, explorative study is not without limitations. However, it contributes to beginning a much-needed contextualized and reflexive approach to apply resilience in the urban context, or implement the urban resilience concept and efforts with an understanding of spatial inequity. The results in turn inform further empirical studies and policies that foster meaningful positive change, equity, and social justice, the latter two of which are still inadequately addressed in current work “on the ground” [37]. We are aware of the concerns over defining the “urban” and its boundaries. We employ data aggregated on the city-region level to shed light on extended, interconnected urbanized and surrounding areas, considering that a city-region scale recognizes economic, social, ecological, and other systems that transcend city-proper boundaries [42].
3. Empirical Study: Methods & Data
3.1. Methods
As mentioned, we first conducted a content analysis of policies and state media reports to trace the lineage and analyze the presence and meaning of urban resilience in the Chinese policy contexts at various levels. We then conducted an exploratory analysis including mappings of statistical data to gain a comprehensive understanding of the uneven performances of city regions in Hainan and explore the trends and disparities in urban resilience. Exploratory analysis helps summarize and characterize the primary features, characteristics, and patterns of the data. Maps present an easy-to-understand summary of the data, cross-validate hypotheses from content analysis, and support generating more in-depth qualitative or quantitative research inquiries.
We created Geographic Information Systems (GIS) maps to visually demonstrate the changes that have occurred from 2018 to 2021 in different city regions. Each map is based on the data collected from the statistical yearbook of Hainan, and GIS boundary maps are based on county/city. The data were compiled and converted to an Excel sheet and then imported to ArcGIS. To visualize spatial patterns, we classified the values of most indicators into groups by natural breaks and presented the classes on choropleth maps. The exceptions are gross domestic product (GDP) and disposable income. These two indicators were mapped based on quantile breaks. Both natural breaks and quantile breaks are the most common methods in classification and used in mapping to explore spatial inequality. Natural breaks capture natural groups and trends of unevenly distributed data. Quantile breaks divide observations equally across each class without skewing results in any direction, which makes them ideal for showing rankings of economic data. In addition to maps, we created charts to demonstrate long-term trends of data covering years before 2018 and years after 2021 and included these charts in Appendix A. The software used includes ArcGIS Pro (version 3.5.3) and Numbers (version 14.4).
3.2. Data and Limitations
While data for content analysis are policies and news reports, data for exploratory analysis and mapping are aggregated statistics from Hainan’s statistical yearbooks. Although secondary data such as economic statistics are not perfect and can be subject to multiple minor data errors and unit inconsistency, Chinese economic statistics from yearbooks are one of the most reliable secondary data sources available. Given the limited availability of other data sources, the scope of the study, and the inability to travel and collect first-hand data, Chinese yearbook data are a reasonable choice for studying trends over time and across space. Because yearbooks usually publish data from the year before and are usually released at the end of the following year (causing a two-year lapse), our analysis and mapping primarily focused on data from the end of 2018 to the end of 2021, to capture the period immediately before and after the onset of the pandemic, with long-term trends provided in Appendix A.
The goal of our analyses is not to create another resilience index. Therefore, we do not intend to provide an exhaustive overview of the various aspects of urban resilience. As will be discussed later, China’s urban resilience efforts have largely focused on economic and social dimensions. This paper focuses on testing the hypothesis that the city regions demonstrated abilities to bounce back, grow, and transform in the wake of COVID-19.
Indicators: The economic dimension of urban resilience is often considered a crucial aspect of a city or city region’s long-term health and its capacity to adapt and respond to potential economic shocks. In this paper, we consider economic resilience as the ability of an area’s economy to withstand and recover from disruptions while maintaining stable growth and ensuring the well-being of its population. In a pandemic, according to [43], cities with strong economic resilience “usually have the resources and institutional capacity to implement adaptive changes and diversify into new economic sectors,” and diversified urban economies can be an important factor in shaping resilience capacity. Different from studies based on creating economic resilience index, our exploratory mapping focuses on several most direct, illustrative key economic and tourism indicators to test the recovery of different city regions in Hainan.
The social dimension of urban resilience, on the other hand, is the capacity of a community to withstand and recover from social disruptions, challenges, and changes while preserving its core functions, cohesion, and well-being. This allows a community lens to look at the capacity of individuals, groups, and institutions within a community to adapt to, cope with, and recover from adversity [40]. Social resilience is characterized by social cohesion, community engagement, trust, and supportive social networks. Technically, it can be a function of the demographics of the community and the access of residents to resources [40]. However, measuring social resilience is a complex task that requires evaluating a multitude of dimensions and indicators. Several methods and frameworks have been developed to evaluate social resilience, with each focusing on a unique aspect. Common indicators include social connectedness, community engagement, social capital, trust, social networks, social support, and resilient institutions and governance. Capturing these indicators would require large-scale surveys, which are beyond the scope of this unfunded study. Meanwhile, a drawback is that, especially when used in an urban or geographical context, social indicators do not offer much further understanding of what needs to be done and by whom to enhance social resilience [44]. Further, our paper is not focused on social resilience alone, and instead on how the social dimension is coupled with the economic dimension to gain fuller insight into the bouncing back and forward of city regions. Therefore, we focus on several most direct, illustrative indicators, specifically, the number of urban and rural residents, the number of people receiving a minimum living allowance, and the number of healthcare institutions.
3.3. Study Areas: Cities and Counties in Hainan
Our paper focuses on Hainan, a tropical island province at the southernmost point of China, also called China’s Hawaii. Hainan Province is bordered to the north by the Qiongzhou Strait and Guangdong Province, to the west by Vietnam across the Beibu Gulf, and to the east and south in the South China Sea by the Philippines, Brunei, Indonesia, and Malaysia. As the nation’s largest province, Hainan has a total land area of 35,400 square kilometers, among which Hainan Island, our focus of study, is around 290 km long and 33,900 km2 in area. The coastline stretches for 1910 km, with 68 large and small harbors. The surrounding area, which covers 2330.55 square kilometers or 6.8% of the land area, has a depth of between minus five and minus 10 m [45]. The Leizhou Peninsula in Guangdong Province (in mainland China) and the northern part of Hainan Island are divided by the Qiongzhou Strait, which is 10 nautical miles wide. It serves as a shipping passage between the South China Sea and the Beibu Gulf and a “sea corridor” connecting Hainan Island to the mainland. Around 650 nautical miles separate Sanya Port in the south of the island from Manila Port in the Philippines, while 220 nautical miles separate Haikou City in the north of the island from Haiphong City in Vietnam. A most recent administrative map of cities and counties can be accessed in [46].
The province can be divided into the jurisdictions of (1) four prefecture-level cities—Haikou City, Sanya City, Sansha City, and Danzhou City and (2) 15 county-level administrative units (including five county-level cities, four counties, and six ethnic minority autonomous counties)—Wuzhishan City, Wenchang City, Qionghai City, Wanning City, Dongfang City, Ding’an County, Tunchang County, Chengmai County, Lingao County, Ledong Li Autonomous County, Qiongzhong Li and Miao Autonomous County, Baoting Li and Miao Autonomous County, Lingshui Li Autonomous County, Baisha Li Autonomous County, and Changjiang Li Autonomous County. Close to 20 percent of the population in Hainan are ethnic minorities, mostly residing in the central and southern parts of the island.
Specifically, our exploratory analysis and choropleth maps focus on the 18 cities and counties on Hainan Island, to capture resilience in extended urbanized areas or primary and secondary city regions (Table 1). It is important to note that the jurisdiction areas of Chinese cities/counties usually encompass both urban (cities proper or county seats and towns) and surrounding rural areas. In Hainan, it’s reasonable to consider each city/county as a unique city region of certain size. First, this is due to the geographical extensiveness of each city/county. Second, in each city/county, the surrounding rural areas usually have strong economic and social ties to the urban cores, and the urban cores of different cities/counties are relatively far apart and thus less likely form clusters. The two largest city regions, Haikou on the northern coast of the island and Sanya on the southern coast, are also far apart. Further, even the county in Hainan that is most “rural” by Chinese standards has an urban population (close to 60,000, most residing in the county seat) that would exceed the criteria for a Metropolitan Statistical Area in USA.

Table 1.
List of city regions on Hainan Island.
4. Analysis Results and Discussion: What Do We Know About Urban Resilience in Hainan?
This section discusses the policy context, content analysis, hypothesis, and research questions, followed by results from mappings of the economic and social dimensions of Hainan’s development to gain insights into its resilience, resilience capacity, and spatial patterns of changes in the wake of the COVID-19 pandemic. The goal is to provide a comprehensive overview of the province’s economic and social performance and cast light on observed reactions, adaptations, and changes.
4.1. COVID-19 and Hainan: Policy Context, Content Analysis, Hypothesis and Questions
The COVID-19 pandemic has significantly impacted cities around the world, including those in the Chinese province of Hainan, which has become known for its rapid economic growth and development. Before the pandemic, the island province had already received heightened scholarly and policy attention because of China’s comprehensive strategic plan for the region, following an announcement to make the province a new model for “deepening reform and opening-up on all fronts” by the central government in 2018 when celebrating the 30th anniversary of the province’s founding [48,49]. The central and provincial authorities formally rolled out this plan in 2020. It anticipates that Hainan, the largest Special Economic Zone in China by area, will be essential in furthering China’s role in the global economic system. The primary goal of this comprehensive strategic framework is to facilitate the transformation of Hainan into a premier free-trade port of substantial global impact, with the intended timeframe for achieving this transformation in the middle of the 21st century. According to the plan, by 2025, a free trade port system would be launched in Hainan, primarily focusing on the liberalization and facilitation of trading and investment. This system will continue to evolve and acquire a greater degree of development by 2035 [49].
Following the pandemic, state media has reported that Hainan demonstrated evidence of increased urban resilience, mainly from an economic standpoint [50]. Sporadic studies have pointed out the importance of local government support to the resilience of industries in Hainan (see [51] for example). From the central government’s guiding opinions in 2018 to several master plans rolled out in 2020 during the pandemic, state rhetoric indicates a strategic move toward diversifying Hainan’s economy beyond traditional tertiary sectors such as tourism and real estate. The government of Hainan has implemented policies to encourage investment in high-tech industries such as information technology, healthcare, and finance [52,53,54,55]. This shift in economic emphasis has reportedly contributed to a more balanced and resilient economy and created employment and growth opportunities in emerging sectors. For example, Hainan has embraced digitalization and innovation, suggesting a higher level of economic resilience post-pandemic [56]. While Hainan has been praised for its “strong resilience” along with economic potential and vitality, in state reports, the Hainan free trade port is also frequently listed as a critical step and exemplar in building the economic resilience capacity of the country [57].
Table 2 presents a timeline with key policies—from local and central state government platforms and based on state media sources—relevant to COVID-19 and urban resilience in Hainan, including its cities. As the table shows, during the “zero-COVID policy” (2020 to early 2023), priority was initially given to resuming the economy and preventing and controlling the pandemic. As early as February 2020, provincial and local governments put directives in place to support small- and medium-sized enterprises as well as the “orderly resumption of work and production” and to “revitalize post-pandemic tourism” in Hainan and various city regions. The 2020 master plan for the construction of the Hainan free trade port and related plans that year did not mention resilience. However, official narratives soon changed in 2021 to stress “economic resilience” or “resilience”. These keywords started to appear in Hainan’s spatial plan and state media reports after the phrase “resilient cities” was first mentioned in the country’s 14th five-year plan outline in March 2021. This ascendence of “resilience” in state rhetoric contributed to the later state promotion of building “resilient cities” in 2024. Further, the content analysis suggests that Hainan was already under the spotlight before the pandemic and increasingly has been so since then. A co-occurrence of the pandemic and ongoing state plans to develop Hainan as a pilot province for an “advanced, open economic system,” along with pre-existing vulnerabilities of the province, has contributed to making this province an interesting case to study.

Table 2.
A timeline with sample policies and plans relevant to COVID-19, resilience, and Hainan’s development (in reverse chronological order).
By contrast, there are fewer official reports and studies on the social dimension of Hainan’s urban resilience. Table 2 shows that the Hainan provincial government has created initiatives since early 2020 to strengthen social welfare and aid for vulnerable groups impacted by the pandemic, including simplifying and expediting procedures for unemployment aid, industry subsidies, and social safety nets, as well as recruiting community volunteers [58,59]. Under state and provincial government directives in 2020, programs also expanded coverage and eligibility for recipients [60].
In addition, studies have reported steadily increasing social resilience in the socioecological system and improved ecological resilience even before the pandemic [61,62]. Hainan’s efforts to recover from the effects of the pandemic have centered around promoting ecologically friendly and sustainable growth. The provincial government has implemented initiatives to preserve and restore natural ecosystems, enhance wooded areas, and support adopting renewable energy sources. These efforts contribute significantly to Hainan’s ecological resilience and demonstrate its alignment with global sustainability objectives, thereby promising a rapidly urbanized Hainan to be ecologically aware and robust [63].
Last, along with the vision for a “medical special zone” as part of the free trade port plan, the provincial government has welcomed investments in its healthcare system, including creating specialized medical institutions and recruiting healthcare personnel. These measures allegedly aim to improve people’s access to healthcare and strengthen the province’s ability to address future health emergencies effectively. However, scholarly work warns that long-term inequity in access to healthcare on Hainan Island persisted into the beginning of the pandemic, a concern given the island’s isolation from resources on the mainland [64].
In sum, policies and media reports tend to favor the proposition that Hainan as a province achieved a notable recovery shortly after the outbreak of the COVID-19 pandemic. Whether all city regions have experienced this requires further analysis. Our research posits that economic and social dimensions are integral components of urban resilience. We hypothesize that Hainan’s city regions have exhibited considerable bouncing-back and even bouncing-forward, both economically and socially, in the wake of the pandemic. Further, we ask whether there are spatial disparities across city regions, and how these geographies inform the understanding of Hainan’s urban resilience and ability to build resilience capacity. An analysis using GIS mapping and economic and social statistics follows to test the hypothesis and answer these questions.
4.2. Economic Dimension: Disposable Income, GDP, and Tourist Arrivals
To facilitate the interpretations of our findings in Section 4.2 and Section 4.3, line charts of all variables for all city regions showing long-term trends are created to complement the maps below, and can be found in Appendix A of this paper.
First, we look at disposable income, the amount of money households have available to spend or save after taxes and other necessary expenses. It represents individuals’ financial flexibility and freedom in making choices about their consumption and savings. In the context of economic resilience, higher disposable incomes provide households with a greater ability to withstand and navigate economic shocks and uncertainties; families with higher disposable incomes are better equipped to maintain their consumption patterns and continue contributing to the local economy in such situations. Their ability to sustain demand for goods and services can help mitigate the negative impacts of the crisis on local businesses and support overall economic growth.
Analyzing trends in disposable income across various cities or extended city regions may provide insight into the economic resilience of households, groups, or communities. Consistently high disposable income levels not only indicate greater resistance to economic disruptions, but also may suggest more higher-income households, solid financial foundation, or more diverse industries that provide stable employment opportunities and higher wages.
By comparing the yearly disposable income per capita from 2018 through 2021 (see Figure 1) and the long-term trend (see Figure A1), it’s evident that disposable income in coastal areas, including coastal cities such as Haikou, Sanya, Changjiang, Wenchang, Qionghai, Chengmai, and Danzhou, is typically higher than that in cities further inland. This disparity is likely attributable to tourism, real estate development, and higher wages in industries associated with the coastal environment. Natural attractions and tourist destinations in coastal areas also may stimulate economic activity and result in higher disposable incomes for residents. This also reflects a path-dependency in regional dynamics as Haikou has been the economic center of Hainan and Sanya has traditionally been the most popular tourist destination in the province. Changjiang is one of the earliest establisehd counties in Haian and has rich mineral resources. Both Wenchang and Chengmai are within the economic circle of Haikou. Qionghai is a city known for convention and exhibition industries and home to a state-supported pilot zone for medical tourism and high-end medical services [65].
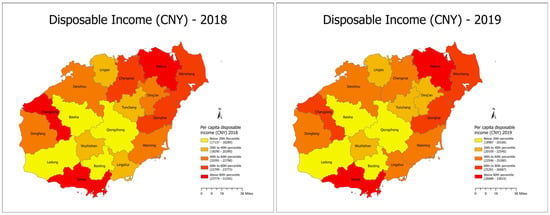
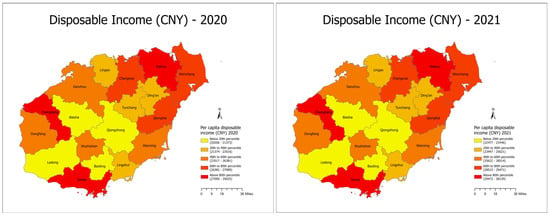
Figure 1.
Per capita disposable income of Hainan Island, 2018–2021, by city region. This figure shows the distribution of quantiles (Maps created by authors using ArcGIS Pro (version 3.5.3) to analyze data from the Statistical Yearbooks of Hainan).
The data further suggest that this disparity between coastal and inland city regions initially increased in 2018–2019 following the central government’s announcement to “deepen reforms” in Hainan in 2018, pushing the most affluent cities, particularly Haikou and Sanya, further to the top tier. This trend was interrupted by COVID-19, as the maps indicate moderate increases in disposable income across cities in 2020 and 2021, with the disparity moderately evening out (see Figure A1).
The observed overall increase in disposable income across Hainan province since before the pandemic until years after it appears to support that various areas in the province have demonstrated some levels of economic resilience during the pandemic. However, the spatial distribution of such increases in 2020 and 2021 (as opposed to 2019) seems to indicate a varying “cushioning” ability where some second-tier, county-level cities and even inland counties (Qiongzhong, Ledong, Baisha, Baoting, and Wuzhishan) bounced back, income-wise, faster than top-tier coastal cities in the immediate years after the onset of the pandemic (Figure 1 and Figure A1).
Having examined disposable income, we next turn to the gross domestic product (GDP), a commonly used indicator of a country’s or region’s economic performance. It represents the total value of goods and services produced within a particular time and geographical area. GDP is a useful indicator of economic resilience, reflecting an economy’s capacity to withstand external shocks and recover from recessions.
A high and stable GDP indicates that an economy has adequate capacity to generate income and create employment opportunities. It suggests a city region’s capacity to sustain its population’s well-being and provide basic goods and services. It often correlates with greater confidence in the local economy to withstand external disturbances, such as economic crises and recessions, and recover more quickly.
Changes in GDP over time can provide insight into a region’s economic resilience and how that evolves. Although relying solely on GDP to understand economic resilience is not recommended, GDP provides an intuitive understanding of how swift and whether the city is recovering to its prior trajectory or beyond [66]. A downturn in GDP during a crisis or recession may indicate an economy facing an immediate challenge and struggling to adapt in the short term. A rapid rebound in GDP after a recession indicates a more resilient economy.
Our analysis of Hainan’s GDP trends from 2018 to 2021 reveals intriguing insights into the province’s economic performance (see Figure 2 and Figure A2). Hainan’s GDP increased consistently during this time, with a significant spike in 2021. This finding suggests a degree of resilience in the face of challenges. Notably, several coastal city-regions, Haikou, Danzhou, and Sanya—all prefecture-level cities—have consistently ranked among the highest in terms of GDP over time. Although some smaller cities and counties record impressive speeds in recovery and growth in 2020, all the three prefecture-level cities, particularly Danzhou and Sanya, see more dramatic increases in GDP in 2021 [67], albeit followed by slowed growths in 2022 and spikes again in 2023, pushing the three city-regions further apart from the rest of the province in terms of GDP. Tourism, real estate development, diverse industries, open investment policies, and robust economic activities related to the coastal environment benefited these regions more than others.
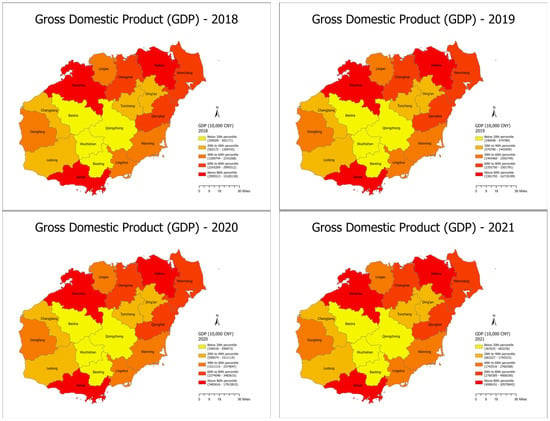
Figure 2.
Gross domestic product (GDP) of Hainan Island, 2018–2021, by city region. This figure shows the distribution of quantiles (Maps created by authors using ArcGIS Pro to analyze data from the Statistical Yearbooks of Hainan).
Considering the pandemic’s adverse impact on many regions, Hainan’s growth is remarkable because the province’s economy traditionally depended on agriculture and tourism. Despite lockdowns and travel restrictions in China during the first two years of the pandemic, Hainan has demonstrated a largely positive trajectory in its GDP—an indication of the province’s ability to withstand and recover from challenges. This however comes with expanding regional disparity and more unstable progressions among top-tier city-regions, suggesting possible transformations undergone by large city-regions to bounce back and forward.
However, GDP alone does not capture the complexity of economic resilience or related capacity. To better understand a region’s economic resilience, other factors, such as income distribution, economic diversity, employment stability, and social welfare, should be considered. These additional factors provide a broader perspective on the overall health and adaptability of the economy [68,69]. Further, GDP value does not account for the self-sustainability of specific rural populations and excludes unrecorded and informal economic activities.
In addition to disposable income and GDP, the role of tourism—a prominent industry in Hainan—bears examination. The number of tourists visiting a city or region can serve as a valuable indicator of economic rebound. Tourists contribute to the local economy by purchasing goods and services such as lodging, food, transportation, and entertainment. This expenditure generates revenue for local businesses, creates jobs, and contributes to the region’s overall economic growth. Moreover, consistent tourist arrivals indicate that a city or region has a favorable image and reputation as a desirable travel destination; this can attract future investments and tourists, resulting in long-term economic growth. A flourishing tourism industry can also increase the visibility and appeal of a city or region internationally, attracting businesses and diversifying the local economy [70].
On the other hand, relying on tourism as the sole economic driver can make a city or region vulnerable to external challenges. Pandemics, economic downturns in the tourism industry, and natural disasters can significantly impact the local economy. This vulnerability demonstrates the need for economic diversification and the growth of other sectors to ensure resilience in the face of unforeseen events.
Examining the trends in visitor arrivals provides insight into the resilience of Hainan’s tourism industry (Figure 3 and Figure A3). Figure 3 illustrates a slight decline from 2018 to 2019 and a more dramatic decline from 2019 to 2020, corresponding to the onset of the pandemic. The year 2021 saw the numbers bounce back significantly, but not to the 2018 or 2019 levels. In 2020 we also see a temporarily reduced disparity across city regions in arrivals, when the two most tourist-packed cities, Sanya and Haikou, experienced more losses in tourists than some smaller cities and counties. This is in contrast to studies that suggest both cities had the highest tourism economic resilience among all cities in Hainan in the first two decades until 2020 [71]. In 2021, however, coastal and large cities, except for Haikou, regained tourists quickly, while smaller cities and landlocked counties fell behind, some attracting even fewer tourists than in 2020. Overall, Figure 3 suggests considerable resilience in tourism and related sectors, but this recovery trend has been uneven across space. Inland and smaller cities and surrounding areas might have benefitted from immediately redirected influxes of tourists from large cities during the beginning of the pandemic, but these benefits may not last. This further suggests the importance of diversifying the economic base to mitigate the risks associated with an overreliance on tourism to withstand external shocks.
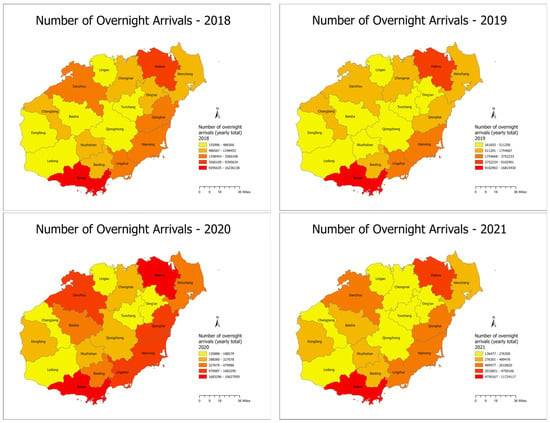
Figure 3.
The number of overnight arrivals on Haian Island by city region, 2018–2021. This figure shows the yearly total number of overnight tourist arrivals (person-times) and its distribution (Maps created by authors using ArcGIS Pro to analyze data from the Statistical Yearbooks of Hainan).
4.3. Toward the Social Dimension: Urban/Rural Divide, Minimum Living Allowance, and Health Care
Economic resilience involves the development of societies and economies and thus indispensably connects to social resilience, or “the resilience of community and people” [22]. Understanding and measuring social resilience can increase community participation and engagement, which promotes collaboration and enables community members to participate actively in their resilience-building processes. Involving the community in resilience measurement and decision-making fosters a sense of ownership and collective responsibility, strengthening social cohesion and boosting overall resilience. As noted earlier, most of existing analyses suggest utilizing survey data on perceptions. Due to data availability and the extent of our study area, this study examines several most illustrative city-level indicators that help assess the social bouncing back and shed light on the structures underlying social resilience in Chinese city regions.
First, as mentioned earlier, social resilience can be a function of demographics and resource access. In China, the urban or rural identity based on Hukou (family registration system) is one of the most important demographics. The distinction between Hainan’s urban and rural residents can significantly impact resource access. Typically, China’s urban areas have a more developed infrastructure and greater access to services and opportunities. They have a higher concentration of public facilities, social services, educational institutions, healthcare facilities, and recreational spaces. In contrast, rural areas face limited resources, inadequate infrastructure, and lower socioeconomic indicators. These differences can affect the social resilience of urban and rural communities.
Figure 4 and Figure A5 show that the rural population in Hainan province slightly increased from 2018 to 2019 and decreased from 2019 to 2021, with several cities seeing increases in 2020 likely due to returning rural migrants due to the pandemic. Note we use statistics counting population with residency of more than 6 months in rural or urban areas within city regions. Therefore, the increase from 2018 to 2019 is likely attributable to the cumulative expansion of the cultivation of areca nut trees in Hainan, an increase from 66,554 acres to 378,895 acres between 2010 and 2016, and an associated output value climb from 9.76 billion to 40.13 billion US dollars [72]. Pulled by the economic value of the areca nut, or the “golden fruit,” rural areas saw migrants return from urban areas to engage in the areca nut economy, potentially more so since 2018 due to preferential policies. By 2019, areca nut cultivation in Hainan province encompassed 1.78 million acres, serving as a significant economic revenue stream for the province’s 2.3 million agricultural practitioners [73]. It was estimated that the per capita revenue derived from cultivating areca nuts would constitute approximately 30.9% of farmers’ per capita disposable income during the latter part of 2020. The market price for areca nuts went up in 2020 despite the pandemic. Conversely, the loss of rural populations since the pandemic suggests that despite rising income from the “golden fruit,” rural areas have faced challenges accessing essential services and resources due to geographical isolation and limited infrastructure, indicating critical gaps to bridge in order to enhance social resilience.
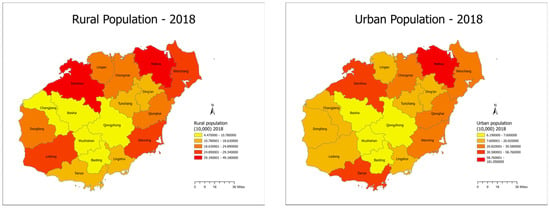
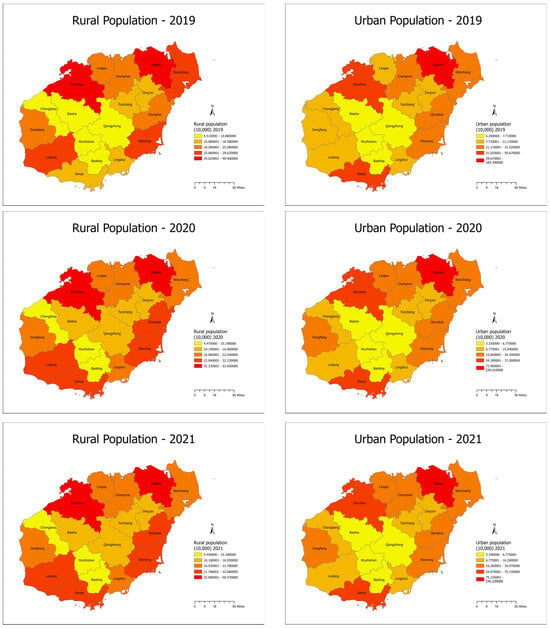
Figure 4.
Rural and urban populations on Hainan Island, by city region, 2018–2021 (at each year end). This figure shows the distribution of rural and urban residents on Hainan Island, 2018–2021 (Maps created by authors using ArcGIS Pro to analyze data from the Statistical Yearbooks of Hainan).
Second, we look at the minimum living allowance scheme (MLAS), also known as social assistance or welfare—financial aid given to individuals or families who cannot meet their basic needs. MLA targets vulnerable populations experiencing poverty, unemployment, or other socioeconomic disadvantages. In China, local government is responsible for providing MLA to people who cannot support themselves and have low or no income. Greater numbers of recipients in rural and urban areas may indicate increased poverty, inequality, or economic instability, suggesting that a sizeable portion of the population is experiencing financial vulnerabilities.
While MLA data in a particular area can be a proxy for understanding social vulnerability and short-term changes in that area, it can also reflect the government’s ability to provide and distribute a minimal living allowance as a cushion against challenging circumstances, such as a global epidemic, and thus can illuminate the mediating impact of institutions on social resilience. On the one hand, social assistance can mitigate the immediate effects of poverty, improve access to essentials such as food and shelter, and give those in need a sense of stability [74]. On the other hand, disproportionate reliance on social assistance can reveal underlying structural problems in a community. Systemic problems include limited employment opportunities, inadequate social services, or unequal resource distribution, and they call for actions of a more “transformative social policy” toward fairer and greener development [75].
Figure 5 and Figure A6 suggest an upward trend in the number of rural residents receiving MLA (most residing in rural areas within city regions) from 2018 through 2020, indicating a likely increase in program coverage and improvement of MLAS in marginalized rural areas within Hainan. This pattern aligns with a continuous national trend to expand MLAS coverage in rural China in recent decades. Nevertheless, a subsequent, unexpected decline followed in 2021 while the number of eligible rural residents remained roughly unchanged. By contrast, the number of MLA recipients as urban residents exhibited a dramatic decline from 2018 to 2019, likely due to a strong urban economy, followed by expected yearly increases in both 2020 and 2021, which can be attributable to a rise in pandemic-caused poverty in urban areas (Figure 5 and Figure A7). These patterns are relevant to understanding social vulnerability and resilience in a spatial context. First, these maps suggest a long-term inequity in social vulnerability and social resilience between rural and urban areas in Haian before the pandemic. Second, the nearly opposite short-term trends of rural MLA recipients and urban MLA recipients after the shock of the pandemic not only suggest the social vulnerability borne by urban residents but also likely indicate divergent responses due to rural-urban differentiation in the distribution and usage of resources such as MLAS during the pandemic. Rural and urban populations in Hainan may face different challenges and exhibit differing aspects of social vulnerability, such as in accessing resources. Overall, according to the maps, individuals (and likely family households and communities) in rural and urban areas show differing levels of social vulnerability and resilience. Whether the underlying causes are different responses from local governments in rural and urban areas (probably due to varied levels and distributions of resources and diversities of populations) or other factors remains a question one can explore with more field data. For example, in rural areas during the pandemic, local governments and communities mobilized many poor to work as paid volunteers in the prevention and control of COVID, which might have contributed to the temporary decline in the number of MLA recipients in rural Hainan. However, these jobs may not necessarily lessen social vulnerability or enhance social resilience on the individual, family, or community level because of the semi-voluntary nature, associated health risks, and long hours of the jobs.
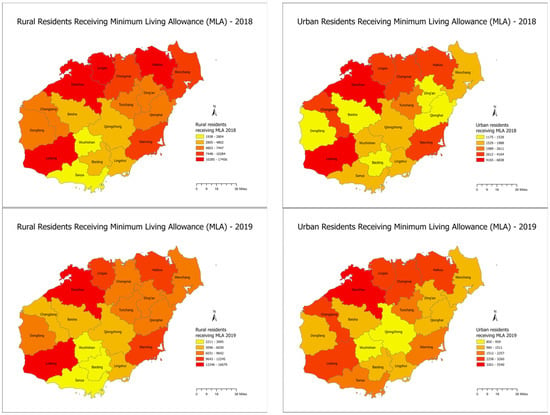

Figure 5.
Rural and urban residents receiving Minimum Living Allowance (MLA) on Hainan Island, by city region, 2018–2021. This figure shows the distribution of MLA recipients on Hainan Island, 2018–2021 (Maps created by authors using ArcGIS Pro to analyze data from the Statistical Yearbooks of Hainan).
Third, we look at healthcare institutions, including hospitals, clinics, medical centers, and other facilities that provide the population with essential medical services. The availability and accessibility of healthcare institutions are crucial for promoting and maintaining the health and well-being of individuals, which contributes to social resilience, particularly in a pandemic.
Accessible healthcare institutions or facilities reduce barriers to care, allowing individuals to seek medical attention promptly, thereby improving health outcomes and overall resilience. Healthcare institutions are essential in epidemics, natural disasters, and public health emergencies; their presence and ability to effectively manage such situations can increase the community’s resilience to health-related shocks and crises [76].
Figure 6 and Figure A8 show that the number of healthcare facilities in Hainan increased from 2018 to 2021, with the provincial capital city, Haikou, along with several smaller coastal cities around Sanya and Haikou, standing out. Coastal county-level cities and counties near the largest coastal population centers, such as Sanya and Haikou, gained facilities in the first two years of COVID-19, likely due to the number of positive cases and availability of land for building, both as results of their proximity to large cities. Nevertheless, since the beginning of 2020, the inequity among city regions in the number of healthcare facilities has increased, with the gaps growing wider between coastal city regions (which had the most facilities) and the inland part of the island as well as between Haikou and the rest of the island (Figure A8). In sum, the data indicate Hainan’s overall ability to respond relatively quickly to the pandemic. While more hospitals generally correspond to better resilience, the spatial disparities shown in data are concerning.
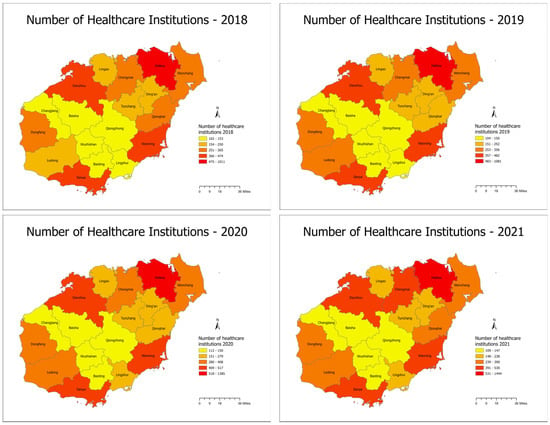
Figure 6.
Number of healthcare institutions on Hainan Island, by city region, 2018–2021. This figure shows the distribution of healthcare institutions on Hainan Island, 2018–2021 (Maps created by authors using ArcGIS Pro to analyze data from the Statistical Yearbooks of Hainan).
These findings affirm scholarly concerns about the distribution and accessibility of healthcare institutions and their key effects on social resilience. Disparities in the availability of healthcare institutions, especially in underserved or marginalized communities, can create barriers to access, resulting in poorer health outcomes and diminished social resilience. As discussed earlier, “what next” is often beyond marginalized communities. From a healthcare perspective, a first step to promote social resilience might be ensuring equitable distribution and accessibility of healthcare institutions across regions and populations [77]. This is particularly important in China because enhanced healthcare access from hospitals to mobile clinics increases perceived support for all including marginalized populations such as migrants living in cities and contributes to greater social resilience [78].
5. Conclusions
This paper embraces the descriptive nature of the concept of urban resilience to gain a geographically contextualized understanding of urban resilience in the Chinese context through content analysis and exploratory analysis. We explore the trends and disparities in economic and social recovery and change among the city regions in Hainan in the immediate aftermath of COVID-19. Our analyses of economic indicators such as disposable income, GDP, and tourist arrivals reveal general positive trends and growth in Hainan’s economy, indicating its ability to withstand shocks and recover from challenges in the first two years of the pandemic. This broad picture comes with some smaller city regions’ initial recovery being outperformed by several largest cities’ bouncing back and transformative growths. From an economic standpoint, Hainan’s emphasis on becoming a free trade zone since before the pandemic, attracting foreign investment, developing industries, and other structural changes and transformations under state support have likely contributed to the island’s economic resilience. Within the social realm, the data broadly reveal a positive trend since the pandemic, along with long-term rural–urban gaps and growing inequities and disparities among city regions of various administrative ranks and in coastal vs. inland locations in areas such as healthcare access. This suggests a possible mismatch between the key new industries supported by state plans including medical tourism and the goal of increasing resilience for all. These findings facilitate a more nuanced, placed-based understanding of resilience, and point out critical areas for attention. These include maintaining economic growth and diversification, reducing income disparities and poverty, improving healthcare access, and devising various place- and group-based vulnerability- and resilience-oriented policies to support at-risk populations in urban and rural areas. Overall, our research affirms that resilience is a highly contextualized and reflexive concept. It points out the importance of situating resilience studies in and supporting them with grounded, in-depth, and cross-scale studies with integrated quantitative and qualitative data. Conceptually and methodologically, this paper contributes to understanding urban resilience in China from a geographical perspective and offers a useful city region analytical lens to open up discussions and implement the concept of urban resilience and resilient efforts as China embraces the notion with numerous resilience index studies. On the empirical level, the data and findings of the study are helpful for academics and practitioners and for cities that may experience a multitude of shocks and/or stresses. Our study is certainly limited by the scope of data used and is not intended to replicate existing work or cover all aspects of social or economic resilience, which is also impossible due to space. More data and fieldwork are needed to empirically study the complexities involving agents and dynamics of resilience building including the role of state on multiple scales and informal social and economic networks critical to island societies [79], as well as how city regions continuously learn from crises and bounce forward.
Author Contributions
Conceptualization, G.C. and Q.C.; Data curation, G.C. and Q.C.; Formal analysis, G.C. and Q.C.; Investigation, G.C. and Q.C.; Methodology, G.C. and Q.C.; Resources, G.C. and Q.C.; Software, Q.C. and G.C.; Supervision, G.C.; Validation, G.C.; Visualization, G.C. and Q.C.; Writing—original draft, G.C. and Q.C.; Writing—review & editing, G.C.; Writing—revisions, G.C. All authors have read and agreed to the published version of the manuscript.
Funding
This research received no external funding.
Institutional Review Board Statement
Not applicable.
Informed Consent Statement
Not applicable.
Data Availability Statement
The data presented in this study were derived from the Hainan Statistical Yearbooks published by Hainan Provincial Bureau of Statistics, available at (https://stats.hainan.gov.cn/tjj/tjsu/ndsj/ (last accessed on 17 July 2025). The GIS data are based on ArcGIS.
Conflicts of Interest
The authors declare no conflicts of interest.
Appendix A. Values and Rates of Changes in Selected Indicators for All City Regions in Hainan
All data are based on Hainan Statistical Yearbooks. We cover a longer time span in these charts, except for a couple of charts where the data are not available for a longer time span.
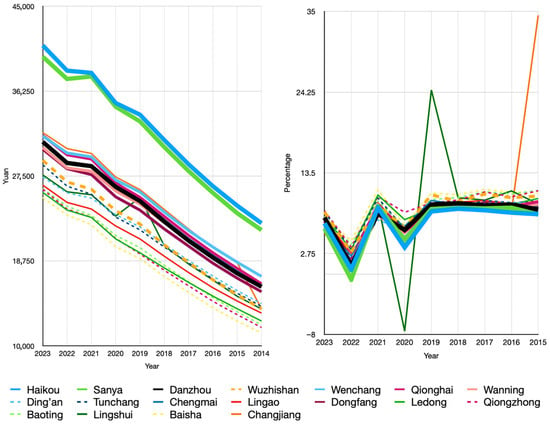
Figure A1.
Disposable Income (Left: Annual Per Capita Disposable Income in Yuan; Right: Annual Rate of Change in Percentage). Note: Widths of lines indicate city regions of different administrative ranks: Haikou, Sanya, and Danzhou are the three prefecture-level cities, followed by county-level cities and counties. Color blue indicates city regions in the Haikou economic circle; color green indicates city regions in the Sanya economic circle; other colors indicate not belonging to either. Dash lines indicate inland city regions; solid lines indicate coastal city regions.
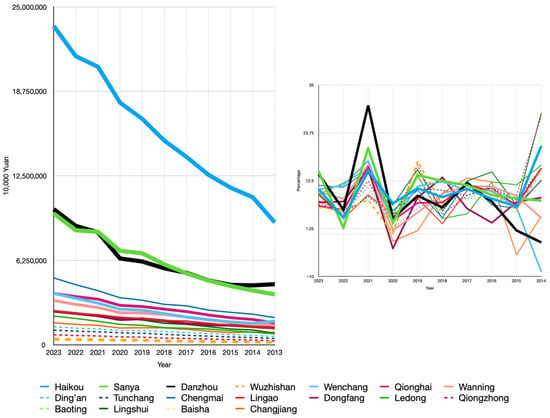
Figure A2.
GDP (Left: GDP in 10,000 Yuan; Right: Annual Rate of Change in Percentage). Note: Widths of lines indicate city regions of different administrative ranks: Haikou, Sanya, and Danzhou are the three prefecture-level cities, followed by county-level cities and counties. Color blue indicates city regions in the Haikou economic circle; color green indicates city regions in the Sanya economic circle; other colors indicate not belonging to either. Dash lines indicate inland city regions; solid lines indicate coastal city regions.

Figure A3.
Number of Overnight Tourist Arrivals (Left: Annual Number of Overnight Tourist Arrivals in Person-Times in Tourist Hotels; Right: Annual Rate of Change in Number of Overnight Tourist Arrivals in Percentage). Note: Widths of lines indicate city regions of different administrative ranks: Haikou, Sanya, and Danzhou are the three prefecture-level cities, followed by county-level cities and counties. Color blue indicates city regions in the Haikou economic circle; color green indicates city regions in the Sanya economic circle; other colors indicate not belonging to either. Dash lines indicate inland city regions; solid lines indicate coastal city regions.
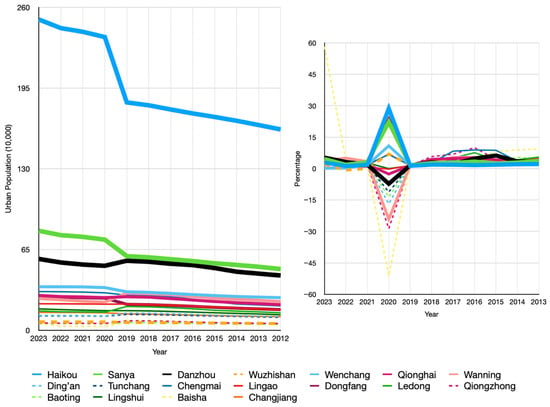
Figure A4.
Urban Population (Left: Urban Population at Year End in 10,000; Right: Annual Rate of Change in Urban Population in Percentage). Note: Widths of lines indicate city regions of different administrative ranks: Haikou, Sanya, and Danzhou are the three prefecture-level cities, followed by county-level cities and counties. Color blue indicates city regions in the Haikou economic circle; color green indicates city regions in the Sanya economic circle; other colors indicate not belonging to either. Dash lines indicate inland city regions; solid lines indicate coastal city regions.
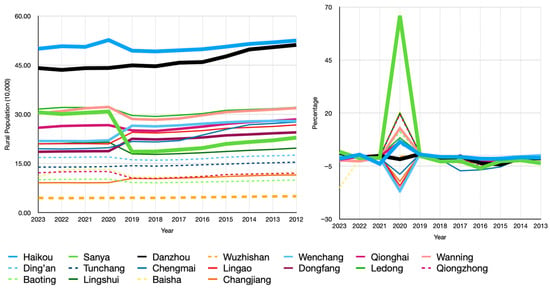
Figure A5.
Rural Population (Left: Rural Population at Year End in 10,000; Right: Annual Rate of Change in Rural Population in Percentage). Note: Widths of lines indicate city regions of different administrative ranks: Haikou, Sanya, and Danzhou are the three prefecture-level cities, followed by county-level cities and counties. Color blue indicates city regions in the Haikou economic circle; color green indicates city regions in the Sanya economic circle; other colors indicate not belonging to either. Dash lines indicate inland city regions; solid lines indicate coastal city regions.
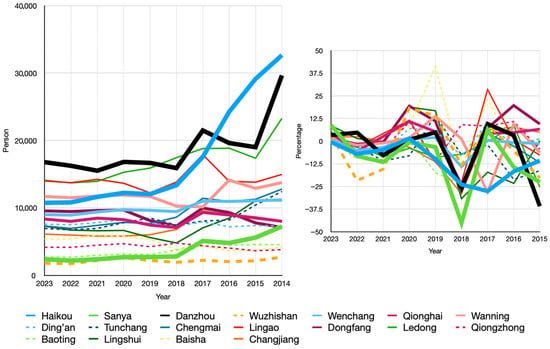
Figure A6.
Rural Minimum Living Allowance (MLA) (Left: Number of Rural Residents Receiving MLA; Right: Annual Rate of Change in Number of Rural Residents Receiving MLA in Percentage). Note: Widths of lines indicate city regions of different administrative ranks: Haikou, Sanya, and Danzhou are the three prefecture-level cities, followed by county-level cities and counties. Color blue indicates city regions in the Haikou economic circle; color green indicates city regions in the Sanya economic circle; other colors indicate not belonging to either. Dash lines indicate inland city regions; solid lines indicate coastal city regions.
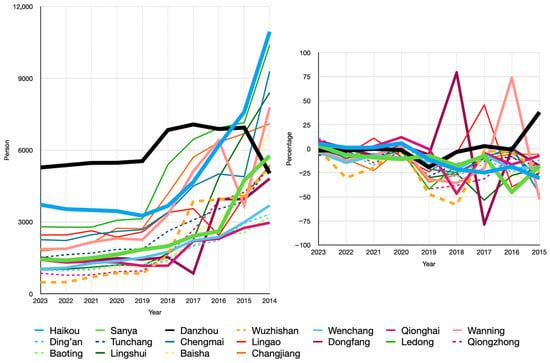
Figure A7.
Urban Minimum Living Allowance (MLA) (Left: Number of Urban Residents Receiving MLA; Right: Annual Rate of Change in Number of Urban Residents Receiving MLA in Percentage). Note: Widths of lines indicate city regions of different administrative ranks: Haikou, Sanya, and Danzhou are the three prefecture-level cities, followed by county-level cities and counties. Color blue indicates city regions in the Haikou economic circle; color green indicates city regions in the Sanya economic circle; other colors indicate not belonging to either. Dash lines indicate inland city regions; solid lines indicate coastal city regions.
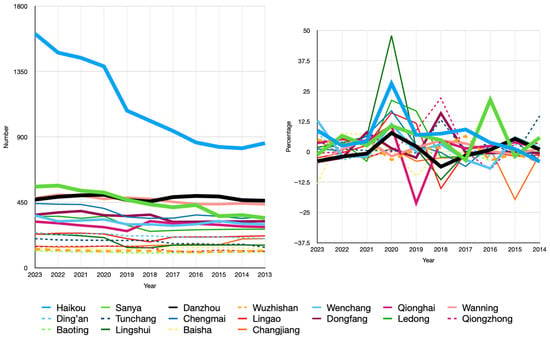
Figure A8.
Health Care Institutions (Left: Number of Health Care Institutions; Right: Annual Rate of Change in Number of Health Care Institutions in Percentage). Note: Widths of lines indicate city regions of different administrative ranks: Haikou, Sanya, and Danzhou are the three prefecture-level cities, followed by county-level cities and counties. Color blue indicates city regions in the Haikou economic circle; color green indicates city regions in the Sanya economic circle; other colors indicate not belonging to either. Dash lines indicate inland city regions; solid lines indicate coastal city regions.
References
- Sharifi, A.; Khavarian-Garmsir, A.R.; Allam, Z.; Asadzadeh, A. Progress and prospects in planning: A bibliometric review of literature in Urban Studies and Regional and Urban Planning. 1956–2022. Prog. Plan. 2023, 173, 100740. [Google Scholar] [CrossRef]
- Transforming Our World: The 2030 Agenda for Sustainable Development. Available online: https://sdgs.un.org/2030agenda (accessed on 16 July 2024).
- Kochskämper, E.; Glass, L.M.; Haupt, W.; Malekpour, S.; Grainger-Brown, J. Resilience and the Sustainable Development Goals: A scrutiny of urban strategies in the 100 Resilient Cities initiative. J. Environ. Plan. Manag. 2024, 68, 1691–1717. [Google Scholar] [CrossRef]
- Martin, R.; Sunley, P. On the notion of regional economic resilience: Conceptualization and explanation. J. Econ. Geogr. 2015, 15, 1–42. [Google Scholar] [CrossRef]
- Weichselgartner, J.; Kelman, I. Geographies of resilience: Challenges and opportunities of a descriptive concept. Prog. Hum. Geogr. 2014, 39, 249–267. [Google Scholar] [CrossRef]
- Huang, B.; Ouyang, Z.; Zhang, H.; Zhang, L.; Zheng, H. Assessment of eco-environmental vulnerability of Hainan Island, China. Ying Yong Sheng Tai Xue Bao Chin. J. Appl. Ecol. 2009, 20, 639–646. [Google Scholar] [PubMed]
- Xinhuanet. Available online: http://www.xinhuanet.com/english/2018-04/14/c_137109463.htm (accessed on 1 December 2024).
- Burby, R.J.; Deyle, R.E.; Godschalk, D.R.; Olshansky, R.B. Creating hazard resilient communities through land-use planning. Nat. Hazards Rev. 2000, 1, 99–106. [Google Scholar] [CrossRef]
- United Nations Sustainable Development. United Nations Conference on Environment & Development Rio de Janerio, Brazil, 3 to 14 June 1992 AGENDA 21. Available online: https://sustainabledevelopment.un.org/content/documents/Agenda21.pdf (accessed on 1 December 2024).
- United Nations. Resolution Adopted by the General Assembly [Without Reference to a Main Committee (A/55/L.2)] 55/2. United Nations Millennium Declaration. Available online: https://documents.un.org/doc/undoc/gen/n00/559/51/pdf/n0055951.pdf (accessed on 1 December 2024).
- Godschalk, D.R. Urban hazard mitigation: Creating resilient cities. Nat. Hazards Rev. 2003, 4, 136–143. [Google Scholar] [CrossRef]
- Ernstson, H.; van der Leeuw, S.E.; Redman, C.L.; Meffert, D.J.; Davis, G.; Alfsen, C.; Elmqvist, T. Urban Transitions: On Urban Resilience and Human-Dominated Ecosystems. AMBIO 2010, 39, 531–545. [Google Scholar] [CrossRef]
- Pickett, S.T.; Cadenasso, M.L.; Grove, J.M. Resilient cities: Meaning, models, and metaphor for integrating the ecological, socio-economic, and planning realms. Landsc. Urban Plan. 2004, 69, 369–384. [Google Scholar] [CrossRef]
- Leach, M. Re-Framing Resilience: Trans-Disciplinarity, Reflexivity and Progressive Sustainability–A Symposium Report 2008. Available online: https://opendocs.ids.ac.uk/articles/report/Re-framing_Resilience_Trans-disciplinarity_Reflexivity_and_Progressive_Sustainability_a_Symposium_Report/26449186?file=48097804 (accessed on 1 December 2024).
- Lebel, L.; Anderies, J.M.; Campbell, B.; Folke, C.; Hatfield-Dodds, S.; Hughes, T.P.; Wilson, J. Governance and the Capacity to Manage Resilience in Regional Social-Ecological Systems. Ecol. Soc. 2006, 11, 19. [Google Scholar] [CrossRef]
- Tanner, T.; Mitchell, T.; Polack, E.; Guenther, B. Urban governance for adaptation: Assessing climate change resilience in ten Asian cities. IDS Work. Pap. 2009, 2009, 1–47. [Google Scholar] [CrossRef]
- Ungar, M. Putting resilience theory into action: Five principles for intervention. In Resilience in action; Liebenberg, L., Ungar, M., Eds.; University of Toronto Press: Toronto, ON, Canada, 2008; pp. 17–38. [Google Scholar]
- Morrow, B.H. Community Resilience: A Social Justice Perspective. CARRI Research Report: Oak Ridge, TN, USA, 2008; Volume 4. [Google Scholar]
- Jha, A.K.; Miner, T.W.; Stanton-Geddes, Z. (Eds.) Building Urban Resilience: Principles, Tools, and Practice; World Bank Publications: Washington, DC, USA, 2013. [Google Scholar]
- Meerow, S.; Newell, J.P.; Stults, M. Defining urban resilience: A review. Landsc. Urban Plan. 2016, 147, 38–49. [Google Scholar] [CrossRef]
- Meerow, S.; Newell, J.P. Urban resilience for whom, what, when, where, and why? Urban. Geogr. 2019, 40, 309–329. [Google Scholar] [CrossRef]
- Ribeiro, P.; Gonçalves, L. Urban resilience: A conceptual framework. Sustain. Cities Soc. 2019, 50, 101625. [Google Scholar] [CrossRef]
- Beilin, R.; Wilkinson, C. Introduction: Governing for urban resilience. Urban. Stud. 2015, 52, 1205–1217. [Google Scholar] [CrossRef]
- Mehmood, A. Of resilient places: Planning for urban resilience. Eur. Plan. Stud. 2015, 24, 407–419. [Google Scholar] [CrossRef]
- Resilience Cities Network. Resilient Medellín: A Strategy for The Future. Available online: https://resilientcitiesnetwork.org/downloadable_resources/Network/Medellin-Resilience-Strategy-English.pdf (accessed on 23 September 2025).
- The Rockefeller Foundation. 100 Resilient Cities. Available online: https://www.rockefellerfoundation.org/wp-content/uploads/d631b84b1efe41685a_3gm6b18ip1.pdf (accessed on 29 December 2024).
- The Rockefeller Foundation and ARUP. City Resilience Framework: City Resilience Index. April 2014. Available online: https://preparecenter.org/sites/default/files/arup_rockefeller_resilient_cities_report.pdf (accessed on 30 December 2024).
- Oxfam. The Future is a Choice: Absorb, Adapt, Transform: Resilience Capacities. 25 January 2017. Available online: https://oxfamilibrary.openrepository.com/bitstream/handle/10546/620178/gd-resilience-capacities-absorb-adapt-transform-250117-en.pdf?sequence=4 (accessed on 30 December 2024).
- UNDRR. The Ten Essentials for Making Cities Resilient. Available online: https://mcr2030.undrr.org/ten-essentials-making-cities-resilient (accessed on 30 December 2024).
- UN-Habitat & UNDP. Integrated Urban Resilience in SIDS. Available online: https://urbanresiliencehub.org/integrated-urban-resilience-in-sids/ (accessed on 31 December 2024).
- Lowe, M.; Bell, S.; Briggs, J.; McMillan, E.; Morley, M.; Grenfell, M.; Sweeting, D.; Whitten, A.; Jordan, N. A research-based, practice-relevant urban resilience framework for local government. Local. Environ. 2024, 29, 886–901. [Google Scholar] [CrossRef]
- Leitner, H.; Sheppard, E.; Webber, S.; Colven, E. Globalizing urban resilience. Urban. Geogr. 2018, 39, 1276–1284. [Google Scholar] [CrossRef]
- Leichenko, R. Climate change and urban resilience. Curr. Opin. Environ. Sustain. 2011, 3, 164–168. [Google Scholar] [CrossRef]
- Simmie, J.; Martin, R. The economic resilience of regions: Towards an evolutionary approach. Camb. J. Reg. Econ. Soc. 2010, 3, 27–43. [Google Scholar] [CrossRef]
- ICLEI East Asia Secretariat. China Resilient Cities Report: Summary for Policymakers 2023. Available online: https://eastasia.iclei.org/publication/china-resilient-cities-report/ (accessed on 16 July 2024).
- Wang, H.; Liu, Z.; Zhou, Y. Assessing urban resilience in China from the perspective of socioeconomic and ecological sustainability. Environ. Impact Assess. Rev. 2023, 102, 107163. [Google Scholar] [CrossRef]
- Muñoz-Erickson, T.A.; Meerow, S.; Hobbins, R.; Cook, E.; Iwaniec, D.M.; Berbés-Blázquez, M.; Grimm, N.B.; Barnett, A.; Cordero, J.; Gim, C.; et al. Beyond bouncing back? Comparing and contesting urban resilience frames in US and Latin American contexts. Landsc. Urban Plan. 2021, 214, 104173. [Google Scholar] [CrossRef]
- Filip, R.; Gheorghita Puscaselu, R.; Anchidin-Norocel, L.; Dimian, M.; Savage, W.K. Global Challenges to Public Health Care Systems during the COVID-19 Pandemic: A Review of Pandemic Measures and Problems. J. Pers. Med. 2022, 12, 1295. [Google Scholar] [CrossRef] [PubMed] [PubMed Central]
- Serre, D.; Heinzlef, C. Assessing and mapping urban resilience to floods with respect to cascading effects through critical infrastructure networks. Int. J. Disaster Risk Reduct. 2018, 30 Pt B, 235–243. [Google Scholar] [CrossRef]
- Cutter, S.L.; Barnes, L.; Berry, M.; Burton, C.; Evans, E.; Tate, E.; Webb, J. A place-based model for understanding community resilience to natural disasters. Glob. Environ. Change. 2008, 18, 598–606. [Google Scholar] [CrossRef]
- Guest Editorial: Disaster resilience: A bounce back or bounce forward ability? Local. Environ. 2011, 16, 417–424. [CrossRef]
- Dixon, T.J.; Karuri-Sebina, G.; Ravetz, J.; Tewdwr-Jones, M. Re-imagining the future: City-region foresight and visioning in an era of fragmented governance. Reg. Stud. 2022, 57, 609–616. [Google Scholar] [CrossRef]
- UN-Habitat. World Cities Report 2022. Available online: https://unhabitat.org/sites/default/files/2022/06/wcr_2022.pdf (accessed on 4 January 2025).
- Copeland, S.; Comes, T.; Bach, S.; Nagenborg, M.; Schulte, Y.; Doorn, N. Measuring social resilience: Trade-offs, challenges and opportunities for indicator models in transforming societies. Int. J. Disaster Risk Reduct. 2020, 51, 101799. [Google Scholar] [CrossRef]
- The People’s Government of Hainan Province. Geographical Location. 2020. Available online: https://www.hainan.gov.cn/hainan/hngl/201809/02b6b908146c4ce89c0dbd1fad7720a6.shtml (accessed on 4 January 2025).
- Bai, L.; Wang, X.; Zhang, L.; Feng, J.; Liao, J.; Chen, B.; Wang, P.; Zhang, X. A systematic study of interactions between sustainable development goals (SDGs) in Hainan Island. Sci. Rep. 2024, 14, 26613. [Google Scholar] [CrossRef]
- Hainan Provincial Bureau of Statistics. Hainan Statistical Yearbook 2024. Available online: https://stats.hainan.gov.cn/tjj/tjsu/ndsj/ (accessed on 17 July 2025).
- The State Council of the PRC. Hainan to Take on Bigger Roles in Reform, Opening-Up. 14 April 2018. Available online: http://english.www.gov.cn/news/top_news/2018/04/14/content_281476111320950.htm (accessed on 28 July 2024).
- The State Council of the PRC. China Releases Master Plan for Hainan Free Trade Port. 1 June 2020. Available online: http://english.www.gov.cn/policies/latestreleases/202006/01/content_WS5ed50d2cc6d0b3f0e949939a.html (accessed on 28 July 2024).
- 21st Century Business Herald (21CBH). A Report on Economic Resilience in 22 Provinces. 23 April 2021. Available online: https://finance.sina.cn/2021-04-23/detail-ikmxzfmk8588333.d.html (accessed on 23 September 2025).
- Liu, S.; Xu, Y.; Liu, C. Resilience of Hospitality Industry Under the COVID Policies in Hainan, China. 2022 TTRA International Conference. Available online: https://hdl.handle.net/20.500.14394/49440 (accessed on 28 April 2025).
- Li, H. Hainan Free Trade Port: Not Only an Island for Tourism But Also an Island for Innovation. China Economic Weekly, January 2020. Available online: http://paper.people.com.cn/zgjjzk/html/2020-01/15/content_1972015.htm (accessed on 29 April 2025).
- The State Council of the PRC. Guiding Opinions of the Central Committee of the CPC and the State Council on Supporting Hainan for Comprehensively Deepening Reform and Opening-Up. 14 April 2018. Available online: https://www.gov.cn/zhengce/2018-04/14/content_5282456.htm (accessed on 29 April 2025).
- National Development and Reform Commission. Overall Plan for Smart Hainan (2020–2025). 14 August 2020. Available online: https://www.ndrc.gov.cn/xwdt/ztzl/hnqmshggkf/202008/t20200814_1236108.html (accessed on 29 April 2025).
- National Development and Reform Commission. The Outline of the 14th Five-Year Plan (2021-2025) for National Economic and Social Development and Vision 2035 of Hainan Province, China. April 2021. Available online: https://www.ndrc.gov.cn/fggz/fzzlgh/dffzgh/202104/P020210428646025031658.pdf (accessed on 29 April 2025).
- People’s Government of Haian Province. A Summary of the High-Quality Development of Hainan’s Economy in 2020. 30 December 2020. Available online: https://sdxw.iqilu.com/share/YS0yMS03MzkyNzA3.html (accessed on 29 April 2025).
- Liang, Z. Strong Resilience, Great Potential, Full Vitality: Hainan’s Economy in 2022. Hainan Daily, 22 December 2022. Available online: http://news.hndaily.cn/html/2022-12/22/content_58464_15633038.htm (accessed on 29 April 2025).
- Liu, C.; Liu, X. Nine Measures to Strengthen Social Welfare Protection for Vulnerable Groups During Pandemic Prevention and Control. Hainan Daily, 13 March 2020. Available online: http://news.hndaily.cn/h5/html5/2020-03/13/content_7_6.htm (accessed on 29 April 2025).
- Hainan Daily. Hainan Increases Coverage of Aid and Welfare Protection of Vulnerable Groups. 3 September 2022. Available online: https://m.thepaper.cn/newsDetail_forward_19744779 (accessed on 29 April 2025).
- People’s Government of Haian Province. Notice from Hainan Civil Affairs Department and Finance Department on Comprehensively Strengthening the Basic Living Security Work for the Vulnerable Groups. 30 July 2020. Available online: https://baike.baidu.com/item/%E6%B5%B7%E5%8D%97%E7%9C%81%E6%B0%91%E6%94%BF%E5%8E%85%E3%80%81%E6%B5%B7%E5%8D%97%E7%9C%81%E8%B4%A2%E6%94%BF%E5%8E%85%E5%85%B3%E4%BA%8E%E5%85%A8%E9%9D%A2%E5%8A%A0%E5%BC%BA%E5%9B%B0%E9%9A%BE%E7%BE%A4%E4%BC%97%E5%9F%BA%E6%9C%AC%E7%94%9F%E6%B4%BB%E4%BF%9D%E9%9A%9C%E5%B7%A5%E4%BD%9C%E7%9A%84%E9%80%9A%E7%9F%A5/60987468 (accessed on 29 April 2025).
- Qi, Z.; Kang, J.; You, C. The Evolution of Resilience and the Obstacles Facing the Tourism Socio-Ecological System (TSES) in Hainan Province. J. Resour. Ecol. 2024, 15, 66–76. [Google Scholar] [CrossRef]
- Huang, J.; Lu, H.; Du, M. Coordinated development of digital economy and ecological resilience in China: Spatial–temporal evolution and convergence. Environ. Dev. Sustain. 2025. [Google Scholar] [CrossRef]
- Chinese Academy of Environmental Planning (CAEP). Hainan’s 14th Five-Year Ecological Environment Protection Plan. July 2021. Available online: http://www.caep.org.cn/yclm/sewhbgh/sswsthjbhwb/202107/W020210730665470945969.pdf (accessed on 20 April 2025).
- Wang, X.; Seyler, B.C.; Han, W.; Pan, J. An integrated analysis of spatial access to the three-tier healthcare delivery system in China: A case study of Hainan Island. Int. J. Equity Health 2021, 20, 60. [Google Scholar] [CrossRef]
- Poon, C.H. The Hainan Free Trade Port (3): Development Directions of Key Cities. January 2022. Available online: https://research.hktdc.com/en/article/OTQ4OTI4NTQw (accessed on 1 September 2025).
- Sustainable Prosperity. Economic Resilience. Available online: https://sustainable-prosperity.eu/sustainable-prosperity/economic-resilience/#:~:text=Economic%20resilience%20refers%20to%20an,to%20fulfil%20its%20core%20functions (accessed on 1 September 2025).
- Fang, X.; Liu, W. Exploring Intra-Island Population Mobility and Economic Resilience: The Case of Hainan Island, China. Sustainability 2023, 15, 16772. [Google Scholar] [CrossRef]
- Fabri, J.P.; Pizzuto, A. Income distribution, social cohesion and economic resilience. In Small States and the Pillars of Economic Resilience; Briguglio, L., Cordina, G., Farrugia, N., Vigilance, C., Eds.; University of Malta: Msida, Malta, 2008; pp. 302–313. Available online: https://www.um.edu.mt/library/oar/bitstream/123456789/61616/1/Income_distribution_social_cohesion_and_economic_resilience.pdf (accessed on 30 April 2025).
- Coulson, N.E.; McCoy, S.J.; McDonough, I.K. Economic diversification and the resiliency hypothesis: Evidence from the impact of natural disasters on regional housing values. Reg. Sci. Urban Econ. 2020, 85, 103581. [Google Scholar] [CrossRef] [PubMed] [PubMed Central]
- Yu, X.; Zheng, Y. Hainan on Path to Attracting More Talents, Businesses. 15 March 2019. Available online: https://www.chinadaily.com.cn/a/201903/15/WS5c8b06d1a3106c65c34eec89.html (accessed on 30 April 2025).
- Zhang, P.; Yu, H.; Guo, W.; Shen, M.; Liu, T. Study of Tourism Economic Resilience Evaluation and Governance Model of Island Cities under Uncertain Environments: A Case Study of Hainan Island, China. J. Urban Plan. Development. 2025, 151. [Google Scholar] [CrossRef]
- Li, J.; Jia, X.; Liu, L.; Cao, X.; Xiong, Y.; Yang, Y.; Zhou, H.; Yi, M.; Li, M. Comparative biochemical and transcriptome analysis provides insights into the regulatory mechanism of striped leaf albinism in arecanut (Areca catechu L.). Ind. Crops Prod. 2020, 154, 112734. [Google Scholar] [CrossRef]
- Ministry of Agriculture and Rural Affairs of the People’s Republic of China. With the Development of the Entire Industry Chain, Hainan Betel Nut Has Become a “Golden Fruit. 21 October 2020. Available online: http://www.moa.gov.cn/xw/qg/202010/t20201020_6354694.htm (accessed on 30 April 2025).
- United Nations Research Institute for Social Development (UNRISD). Combating Poverty and Inequality: Structural Change, Social Policy, and Politics. 2010. Available online: https://resources.equityinitiative.org/handle/ei/129 (accessed on 30 April 2025).
- United Nations Research Institute for Social Development (UNRISD). Emerging Issues: The Social Drivers of Sustainable Development: Note by the Secretariat. 11–21 February 2014. Commission for Social Development Fifty-Second Session. Available online: https://cdn.unrisd.org/assets/legacy-files/301-info-files/B28ADCDF3BCB5C82C1257CD6002DA957/CSocD-Social%20Drivers.pdf (accessed on 30 April 2025).
- World Health Organization (WHO). Health Systems Resilience. Available online: https://www.who.int/teams/primary-health-care/health-systems-resilience#:~:text=Why%20is%20resilience%20important?,provision%20of%20support%20to%20countries (accessed on 30 April 2025).
- Coni, G.; Yost, T.B.; Mazzi, A.; Jiang, S. Improving Healthcare Resilience Through an Equity Focused Framework. In Proceedings of the 2022 AIA/ACSA Intersections Research Conference: Resilient Futures. Fall Conference Proceedings, Online, 6–7 October 2022. [Google Scholar] [CrossRef]
- Wang, C.; Shen, J. Towards a socially resilient city: Healthcare accessibility and rural migrants’ identity integration in urban China. Appl. Geogr. 2025, 176, 103542. [Google Scholar] [CrossRef]
- Trundle, A. Resilient cities in a Sea of Islands: Informality and climate change in the South Pacific. Cities 2020, 97, 102496. [Google Scholar] [CrossRef]
Disclaimer/Publisher’s Note: The statements, opinions and data contained in all publications are solely those of the individual author(s) and contributor(s) and not of MDPI and/or the editor(s). MDPI and/or the editor(s) disclaim responsibility for any injury to people or property resulting from any ideas, methods, instructions or products referred to in the content. |
© 2025 by the authors. Licensee MDPI, Basel, Switzerland. This article is an open access article distributed under the terms and conditions of the Creative Commons Attribution (CC BY) license (https://creativecommons.org/licenses/by/4.0/).