Article

Consumer Carbon Footprint of Fashion E-Commerce: A Comparative Analysis Between Omnichannel and Pure-Player Models in Spain

by
David Antonio Rosas
*,
Carlos Lli-Torrabadella
,
María Tamames-Sobrino
,
Irene Miguel-Corbacho
and
José Luis Olazagoitia
Campus Internacional de Diseño e Industrias Creativas, Universidad de Diseño, Innovación y Tecnología (UDIT), 28016 Madrid, Spain
*
Author to whom correspondence should be addressed.
Sustainability 2025, 17(19), 8690; https://doi.org/10.3390/su17198690
Submission received: 1 August 2025 / Revised: 18 September 2025 / Accepted: 19 September 2025 / Published: 26 September 2025

Abstract

The rapid expansion of fashion e-commerce has raised concerns over the environmental cost of last-mile deliveries, especially in pure-player models. This preliminary study examines the estimated carbon footprint of TENDAM’s omnichannel model—based on in-store pickup and returns—compared to pure-player home delivery, using a customer-level approach across 11 Spanish cities of varying sizes. A total of 3106 face-to-face surveys were conducted in TENDAM stores, capturing data on mobility behavior, transport modes, trip chaining, and service types. Emission factors were applied using a Python-based analytical model, and results were contrasted with Monte Carlo simulations from existing literature on pure players. Our findings indicate that the average per-service footprint of the omnichannel model is around 400 g C O 2 e q , significantly lower than the 1500–3000 g C O 2 e q range for pure players. Emissions were especially low in large cities and in street-level stores, largely due to the high rate of walking and multipurpose trips among customers. The study also includes geospatial analysis through interactive influence maps. These results suggest that dense store networks embedded in walkable urban areas can substantially reduce last-mile GHG emissions. While preliminary, the study highlights the potential for omnichannel retail to support urban decarbonization goals and sustainability when integrated with sustainable mobility patterns.

1. Introduction

Sustainability is understood as the ability to meet the needs of the present without compromising the ability of future generations to meet their own needs [1]. This principle is commonly structured around three interdependent dimensions—environmental, social, and economic—known as the “three pillars of sustainability,” whose interaction provides a holistic and balanced framework for addressing the challenges of sustainable development [2]. Within this framework, sustainability becomes a critical lens through which to analyze the rapid expansion of business-to-consumer (B2C) e-commerce. According to the World Economic Forum, B2C e-commerce has grown by 20–25% annually worldwide for more than a decade, and parcel volumes in Europe alone are projected to exceed 15 billion items by 2024 [3]. Forecasts from the World Economic Forum indicate that, without corrective measures, the van deliveries required to meet this demand will increase road transport greenhouse gas (GHG) emissions in the world’s 100 largest cities by 30% and add 11 min to the average daily commute time by 2030 [4].
The fashion industry contributes to GHG emissions from last-mile distribution by combining a high frequency of low-density parcels with high return rates [5,6,7]. Emissions are exacerbated when orders are placed urgently and with heterogeneous fleets [8] or when delivery errors occur [9]. Additionally, between 22% and 46% of clothing and footwear returns are not reused [10], generating between 2 and 16 times more GHGs than transportation, packaging, and handling [11].
Compared to traditional brick-and-mortar commerce, the textile sector presents various last-mile distribution alternatives [12]. Notable among these are pure player models, in which purchases are made online and both deliveries and returns are handled by logistics companies [13,14,15], sometimes aided by automated parcel locker systems [16]. In contrast, the omnichannel model is characterized by online purchases that offer consumers options such as click-and-collect or cross-channel returns—allowing products to be returned at physical stores. In this model, companies adopt hybrid strategies aimed at delivering a personalized customer experience and ensuring seamless integration across channels [17,18].
Nevertheless, the systematic literature review conducted by [9] presents contradictory findings regarding which retail model emits fewer greenhouse gases (GHGs). Their quantitative review compares emissions associated exclusively with the distribution phase, excluding stages such as production or end-of-life disposal. Under these restrictions, e-commerce (pure player) models generate lower GHG emissions than in-store purchases, but other factors may be considered.
Such discrepancies may be influenced by several contextual factors, including the structure of the supply chain [19], the country of analysis cf. [20,21], population density [22,23], physical store capillarity [10,11], cultural preferences for the intensive use of private vehicles [24], and psychological factors influencing consumer behavior [22,25].
However, particularly decisive factors include the rate of non-reused returns [10,19], inverse logistics [22], and packaging [26]. In the case of omnichannel retailing, if returns are managed effectively (e.g., through reuse or in-store redistribution), they could help mitigate the negative environmental impact. In contrast, in pure player models, returned items are often destroyed or recycled less efficiently [11].
In addition, activities such as showrooming (visiting a shop before making an online purchase) increase emissions, whereas webrooming (searching online) reduces them [9]. In this sense, [27] emphasizes the importance of delivering a positive online shopping experience within omnichannel models—an aspect that we also consider crucial for pure-play retailers.
In this study, we conduct a comparison between the two models across 11 Spanish cities, based on surveys carried out in TENDAM stores, the second-largest fashion group in the country. We focus on customers who pick up, return, or do both through the brand’s omnichannel model. This preliminary approach uses questionnaires to collect information, in line with the precedents set by [28,29]. We reference the average values from [11], which are based on Monte Carlo [30] simulation models for pure players. Finally, we incorporate influence maps created using intelligent algorithms that illustrate the multimodal impact of the various transport modes most used by TENDAM’s omnichannel users.
Spain offers an ideal testbed: (i) a dense network of medium-sized cities, (ii) a mature omnichannel fashion market, and (iii) an ongoing policy push for low-emission zones in urban centers. Yet no peer-reviewed study has quantified the customer-induced GHG footprint of omnichannel fashion purchases across different city sizes within the country.
Accordingly, this work aims to answer three research questions (RQs):
  • RQ1. What is the per-purchase carbon footprint of click-and-collect (TENDAM omnichannel) versus pure-player home delivery for fashion apparel in Spain?
  • RQ2. How does that footprint vary across large (>1 M inhabitants), medium (0.5–1 M), and small (<0.5 M) cities?
  • RQ3. How does store capillarity influence the results obtained?
By combining 3106 customer surveys from 11 Spanish cities with literature-based emission factors and a conservative e-commerce benchmark, the study provides the first data-driven assessment of the climate advantage—and limits—of store-based omnichannel logistics in the fashion sector.

Literature Review

The way companies interact with consumers has been transformed by e-commerce, redefining the shopping experience and leading to a shift in consumer behavior, with online sales now dominating the retail industry. This transformation is particularly significant in the context of the textile industry, where global value added is projected to amount to EUR 122.92 billion in 2024, with a compound annual growth rate of 1.76% (CAGR 2024–2029) and with a value added per capita of EUR 15.82 [31]. For this year, the number of companies in the textile market is projected to be 284.90k, with a compound annual growth rate of 2.14% (CAGR 2024–2029). The number of employees in the textile market will amount to 12.16 million in 2024, with a compound annual growth rate of 2.22% (CAGR 2024–2029) and an employment rate rising to 0.16% [31].
According to Risberg [32], e-commerce is the fastest-growing sales channel, while [33] conclude, in their literature review, that e-commerce logistics is still in its early stages and has significant growth potential. For MMR [34] the rapid growth of e-commerce platforms such as Amazon and Alibaba facilitates access to the global market, which drives a greater number of sales and market reach for textile products. It also indicates that a major constraint to the growth of the textile market lies in environmental concerns, which challenge sustainability efforts. In addition, strict regulations, which vary by region, add complexity and increase costs for textile companies [34].
Consumers’ demand for sustainability has led e-commerce platforms to prioritize ethical fashion, giving an advantage to brands committed to responsible practices and environmentally friendly operations, and generating a new shopping behavior as consumers increasingly seek out products that align with their values [34,35].
Regarding consumer behavior and sustainability attitudes in e-commerce, a relevant number of articles explore how consumers’ environmental awareness, eco-friendly purchasing behaviors, and psychological factors differ between players who use the Pure Player and those who use omnichannel. The findings suggest that digitalization influences consumer attitudes, and sustainability concerns may impact channel choice, as younger consumers exhibit stronger preferences for seamless experiences that align with their environmental values [25,35,36,37,38].
Despite growing research on sustainable impact and consumer behavior, a notable gap remains in integrating these dimensions specifically for textile e-commerce players with diverse channel strategies [35,39,40,41]. This gap limits the ability to formulate targeted interventions to reduce environmental impacts and promote informed consumer choices [21,42]. The lack of comparative studies that simultaneously contemplate operational, logistical, and behavioral variables limits the ability to establish cross-cutting evaluation criteria between pure players and omnichannel actors, limiting the capacity to make informed decisions from a comprehensive perspective.
It can be said that a silent war exists between the Omnichannel and pure players to win the narrative of who is more sustainable, which is more strategic than overt. Existing studies reveal conflicting evidence on the environmental impact [21] of e-commerce versus traditional retail, which affects omnichannel strategies as they encompass both extremes. Some authors indicate lower emissions for online purchases under certain conditions [9,42] while others highlight an increase in carbon emissions [19]
Some of them suggest e-commerce tends to generate a lower carbon footprint per unit of product, presenting significant variations depending on multiple factors. It encompasses the efficiency of the logistics chain, the delivery methods employed (e.g., home deliveries versus pick-up points), and consumer return patterns, which can contribute to increased environmental impact. However, other authors show that traditional models/Omnichannel can be more energy efficient, especially when considering last-mile deliveries and packaging, with returns that significantly increase environmental burdens, offsetting some of the apparent advantages of e-commerce [9,19,21,43,44,45,46]. These factors underscore the need for a comprehensive assessment of the product lifecycle and the logistics flows involved in each distribution model. Some of them have carried out Life Cycle Assessments (LCAs) and quantified the carbon footprint across all retail formats [24,44].
We complement the point by stating that the capillarity of stores in cities is a great saver of environmental impact, since part of the carbon footprint has already been consumed by a daily activity, so it only generates a footprint in the remaining distance, and allows them to arrive by means of transport with a lower impact. We did not find evidence that this fact is considered in other studies.
Moving to sustainability-based marketing [47], in Spain only 21% of consumers do not believe that their actions have an impact on the environment, compared to an increasing sensitivity (45%) Also, one in five textile buyers in Spain believe that claims such as “sustainable, organic, eco, recycled, etc.” are just strategies to attract buyers and sell at a higher price. Fifty percent of them are unsure if they are even true. However, the fact that a brand communicates its sustainability actions is relevant information for 52%. In addition, 44% believe that they should offer it in a transparent and clear way, while 3 out of 10 could penalize a brand that is not sustainable. Continuing with the KANTAR study [48], there is a high level of unawareness of the regulations that exist in the textile industry, where 44% feel they have a high lack of knowledge about them, and 38% demand more information about the actions in sustainability, carbon footprint, and the environment of brands. This is an important limitation, as it prevents users from making an informed decision.
Consumer awareness of sustainability demands transparency, persuading companies to utilize information and technologies to enhance visibility and accountability. However, achieving full transparency remains a significant challenge, as companies face the complexities of data integration and the need for comprehensive technology solutions [48]
Various approaches are applied to Environmental Impact Assessment Methodologies, such as life cycle assessment (LCA), transport and logistics modeling, as well as carbon accounting frameworks. Methodological divergences reflect challenges in harmonizing system boundaries, assumptions about consumer behavior, and regional logistical differences. The studies propose frameworks to systematically assess the carbon footprint of e-commerce, guiding business policies and practices [9,21].
Another important point is the standardization/homogeneity of environmental impact data. If there are no comparable values between different suppliers and/or institutions, the credibility and trust of the interested parties are lost. Variations in measurement approaches can undermine the credibility of environmental reporting and reduce public confidence in sustainability claims [40].
In view of the different outcomes reported in the literature regarding which retail model emits less carbon dioxide, our hypothesis (H1) is that the omnichannel retail model is more sustainable than the pure-player e-commerce model in our context, as it results in lower greenhouse gas emissions per unit sold.

2. Materials and Methods

2.1. Study Design and Setting

The research company “ANÁLISIS E INVESTIGACIÓN” conducted an observational cross-sectional survey (Appendix A). Data were collected between 9 December 2024 and 12 January 2025 in 11 TENDAM stores that together cover Spain’s three official urban-population strata (large, medium, and small). Stores were chosen purposively to maximize geographical spread and mirror TENDAM’s “capillary” network.
The dataset included a total of 3016 fully complete interviews and was analyzed, without further manipulation, using a Python-based [49]. Google Colab notebook [50]. The notebook, also provided in Appendix A, contains step-by-step comments documenting the analysis.
Regarding this survey, Table 1 shows the cities, population [51], number of interviews, and percentage of validated surveys.
Moreover, the frequency of questionnaire responses by city size and store location shows that 60% of stores are street-level in both large and small cities, compared to 80% in medium-sized cities (Figure 1).
In addition, Figure 2 shows a map with the location of street-level and shopping mall stores, as well as the number of interviews conducted at each.

2.2. Sample and Data Collection

Customers exiting the store were approached by trained interviewers using a tablet-based questionnaire (Qualtrics). Quotas for weekdays/weekends and mornings/afternoons ensured temporal representativeness. Of 3145 contacts, 3106 completed interviews (98.8%) were retained after depuration (logic checks, duplicate removal).
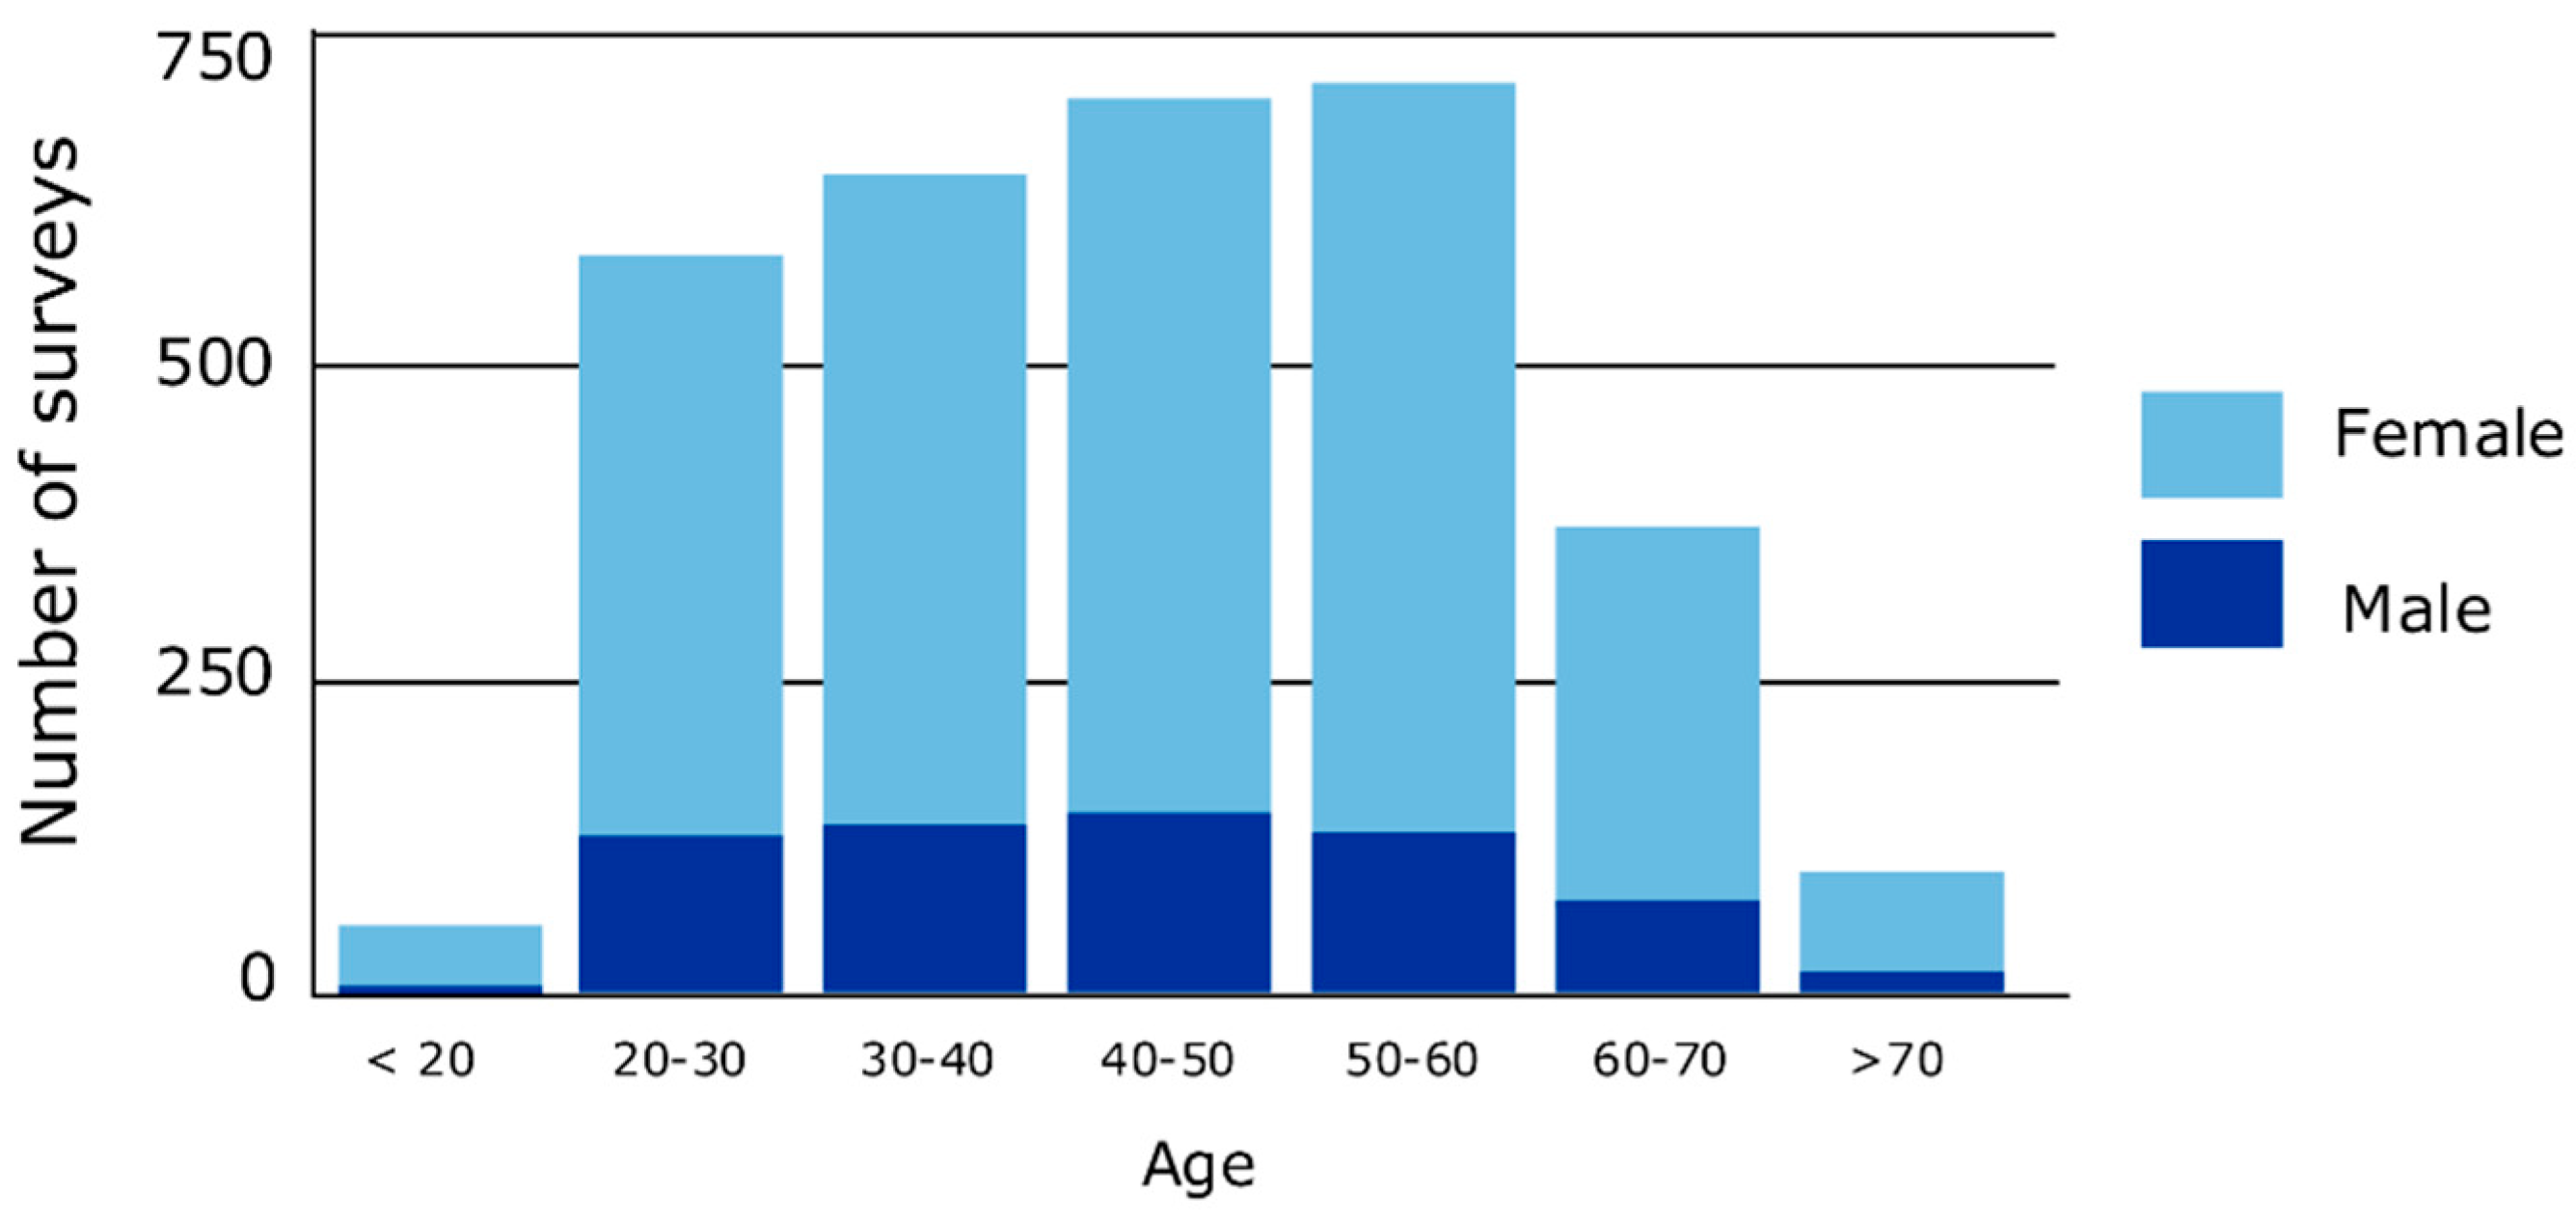
Figure 3 shows the absolute distribution by gender and age group of the participants. Both genders are well represented and display a normal distribution in terms of age in years (mean = 44.31, SD = 14.17). However, the female gender (82%) is more frequent than the male (18%), with interviews being randomly conducted.
The survey covered multiple dimensions essential for evaluating the environmental impact of omnichannel fashion logistics, grouped as follows in Table 2. No personally identifying information was stored.

2.3. Greenhouse Gas Emissions Calculation

In this study, we performed the emissions calculations using the cited Python-based Google Colab notebook provided in Appendix A. We considered three possible scenarios within the omnichannel model, where customers either collect items in-store, make returns, or do both in a single trip.
To inform these preliminary calculations, we used the estimates from [11] as a benchmark for pure players. These authors conducted 10 5 Monte Carlo simulations across different scenarios using a dataset of 630K apparel items, assuming one product per parcel per trip. Although this assumption is conservative—and unfavorable to the omnichannel model, which typically involves the purchase of multiple products—we maintain it for the sake of comparability.
In contrast, the input data for omnichannel customers were derived from the surveys conducted by the research company “ANÁLISIS E INVESTIGACIÓN,” whose dataset is accessible directly from the notebook referenced in Appendix A.
Accordingly, to estimate the GHG emissions of an omnichannel delivery, we begin by calculating the distance traveled by each customer from their point of origin to the store where the service is received, following Equation (1):
d i = t i · V i ¯
where d i   is the distance traveled (km); t i is the time taken to reach the store (hours); and V i ¯ is the average speed for each city and selected mode of transport (km/h), based on Table 3, which compiles data for cars obtained from the Spanish Directorate-General for Circulation (DGC) [52].
Consequently, the GHG emissions for each customer’s transport activity, E i (g C O 2 e q ), are calculated by multiplying the distance traveled d i (Km) by K i (g a factor that depends on the mode of transport used (see Table 3)), and dividing the result by N i , the number of activities performed during the trip (with a maximum value of two), as shown in Equation (2):
E i = d i · K i N i ;   N i ϵ 1,2
We assume that the emission factor K is zero for individuals who walk to the store, resulting in a zero-carbon footprint.
For private cars and taxis, the emission factor K is based on the values shown in Table 4, derived from the Spanish vehicle fleet data provided by the Institute for Energy Diversification and Saving (IDAE) [53].
The emission factor K for other modes of transport included in the survey is summarized in Table 5, with values confirmed by the Community of Madrid (for the metro) [54] and IDAE [53] for the remaining modes.
Regarding the N factor (shared activities during the trip), ref. [11] divide each customer’s car-related emissions by four in their comparison with pure players. They justify this by estimating that each car journey includes four activities. However, the surveys referenced in this study reveal that, depending on the type of service, between 48% and 65% of customers make trips exclusively for this purpose, while in the remaining cases, a single additional activity clearly predominates—up to a maximum of 45%. Only fewer than 10% of respondents report performing up to four shared tasks. In this context, we adopt a conservative approach in calculating individual transport-related emissions for omnichannel users.
Regarding packaging, ref. [11] assume that pure players do not use additional cardboard boxes or protective wrapping beyond PET bags weighing between 5 and 10 g (depending on garment size), with emissions per gram following a normal distribution and a 5% standard deviation. This simplification is applied to pure players in this study. As for omnichannel users, we know they may bring their own reusable containers (e.g., handbags, baskets, etc.). When needed, they purchase reusable paper bags valued for their design and branded logos, which encourages reuse for other purposes. In this sense, GHG emissions can be considered amortized in a preliminary calculation, compared to plastic bags that must be torn and discarded to access the garments, as typically occurs with pure players.
With respect to returns and exchanges in the omnichannel model, garments not discarded due to defects are manually repositioned for resale in stores. Thus, the transport footprint is significantly lower—by several orders of magnitude—especially when we apply conservative estimates in contrast to the pure-player model. Discarded garments in the omnichannel channel are repurposed for other uses, unlike the 22–46% that are destroyed outright in pure-player systems, as reported by [11].
Furthermore, omnichannel customers may collect orders, return items, or do both in the same visit. Considering these three scenarios individually, the comparative GHG emissions for each service in pure-player models must include corrective factors, which can be extracted from [11] and cross-validated with other research [9,29].
In general terms, the minimum emission per garment in the simulation by [11] is 319 g C O 2 e q , while the maximum reaches 8542 g C O 2 e q . However, the simulation models various scenarios and assumes normal distributions, from which the extreme interquartile values are illustrated; therefore, an average should not be used without qualification.
To establish a reference average for collections, we considered the findings of [9], who reports that the EU average for standard deliveries ranges from 820 to 1100 g C O 2 e q per parcel, rising to 2300 g C O 2 e q for express or urgent deliveries. Wiese et al. [29] estimated 770 g C O 2 e q per order, with higher values when returns are involved. Based on this, we adopt an average range of 770–1500 g C O 2 e q for pure-player deliveries in our calculations.
Additionally, there is a scenario in which customers only return items. In such cases, reverse logistics may add 500–1000 g C O 2 e q ., and if products are destroyed instead of reused, the emissions can rise dramatically—exceeding 3000 g C O 2 e q for a T-shirt and 17,000 g C O 2 e q for a jacket [11]. Buldeo Rai et al. [9] also suggest a range of 500–1200 g C O 2 e q , especially when consumer returns are partially destroyed. Accordingly, we use a preliminary average of 1000–2000 g C O 2 e q for pure-player returns in our study.
The most emission-intensive case occurs when both returns and collections happen simultaneously. Based on [11], combining delivery, return, and partial destruction rates (22–44%), the mean GHG emissions would range from 1800 to 2200 g C O 2 e q (with reuse) and from 2500 to over 3000 g C O 2 e q (with partial destruction). Thus, we adopt an intermediate value between 1800 and 3000 g C O 2 e q per service in this scenario for pure players. Table 6 summarizes these scenarios.

2.4. Mapping Store Influence Areas with Intelligent Algorithms

In Appendix A, we included custom-developed code that enables visualization of the omnichannel store network’s capillarity using interactive maps for different modes of transportation. We emphasized the most common mobility types among omnichannel users: walking, driving, and metro.
The algorithms are developed in Python 3.12.11 and utilize the Folium library 0.20.0 [55], which supports geospatial data and mapping. The process begins by placing markers on the map indicating store locations, with icons distinguishing between street-level stores and those located in shopping centers. Each marker includes toggleable labels with additional information.
Once the store is geolocated, the algorithm retrieves the average travel time reported by users to reach that store. It then calculates the average distance traveled for the selected transport mode and city, based on those times.
Next, using the city’s street network and avoiding inaccessible areas, the algorithm operates in reverse: it iteratively identifies all points reachable from the store within the computed average distance. These routes are marked with color-coded points for each store, visually representing their area of influence.
The algorithm for visualizing store capillarity via metro travel differs from the previous methods. It factors in the portion of the journey that users walk from the metro station to the store—similar to the pedestrian algorithm—and subtracts that time from the maximum available transit time. Due to computational limitations, we approximate the reachable train area with a circle, centered on each metro-accessed store, using the remaining time. Metro stations within these circles are marked as accessible; others are considered unreachable.
We will present illustrative images generated by these algorithms in subsequent sections of this article.

2.5. Statistical Analysis

All analyses were conducted using the Python-based Google Colab notebook (0.0.1a2), which is shared in Appendix A.

2.6. Ethical Considerations

The survey was designed and implemented by the research company “ANÁLISIS E INVESTIGACIÓN”. No personally identifying data were collected; participation was random, voluntary, and respondents could withdraw at any time. According to Spanish legislation (Law 14/2007, Art. 1.a), anonymous consumer surveys are exempt from formal ethics committee review [56]. A brief information sheet was provided, and oral consent was obtained from all participants.

3. Results

From a total of 3106 valid questionnaires, 2726 customers reported collecting products in-store, 304 were returning items, and the remaining 76 were doing both simultaneously. Following [57], we evaluated inconsistent answers, uncommon responses, and repetitive patterns (Table 7).
Only one anomalous case was identified in the return group due to inconsistent responses, which had no impact on the rest of the quality checks and was therefore retained in the dataset. Consequently, we can consider that participants answered the questionnaire thoughtfully.
Moreover, omnichannel customers reported using a range of transportation modes: walking, car, metro, taxi and similar services, bus, motorcycle, and electric scooter or bicycle. We generated a heatmap in Figure 4 showing the distribution of transport modes (rows, from left to right) by city size (top columns) and distinguishing store location (street-level vs. shopping mall) at the bottom. Cell values are expressed as percentages, and the corresponding color scale is provided on the right.
Car and walking were the most frequently used modes overall. However, car usage was particularly dominant in medium-sized cities (76.7%) and small cities (82.4%), specifically for stores located in shopping malls.
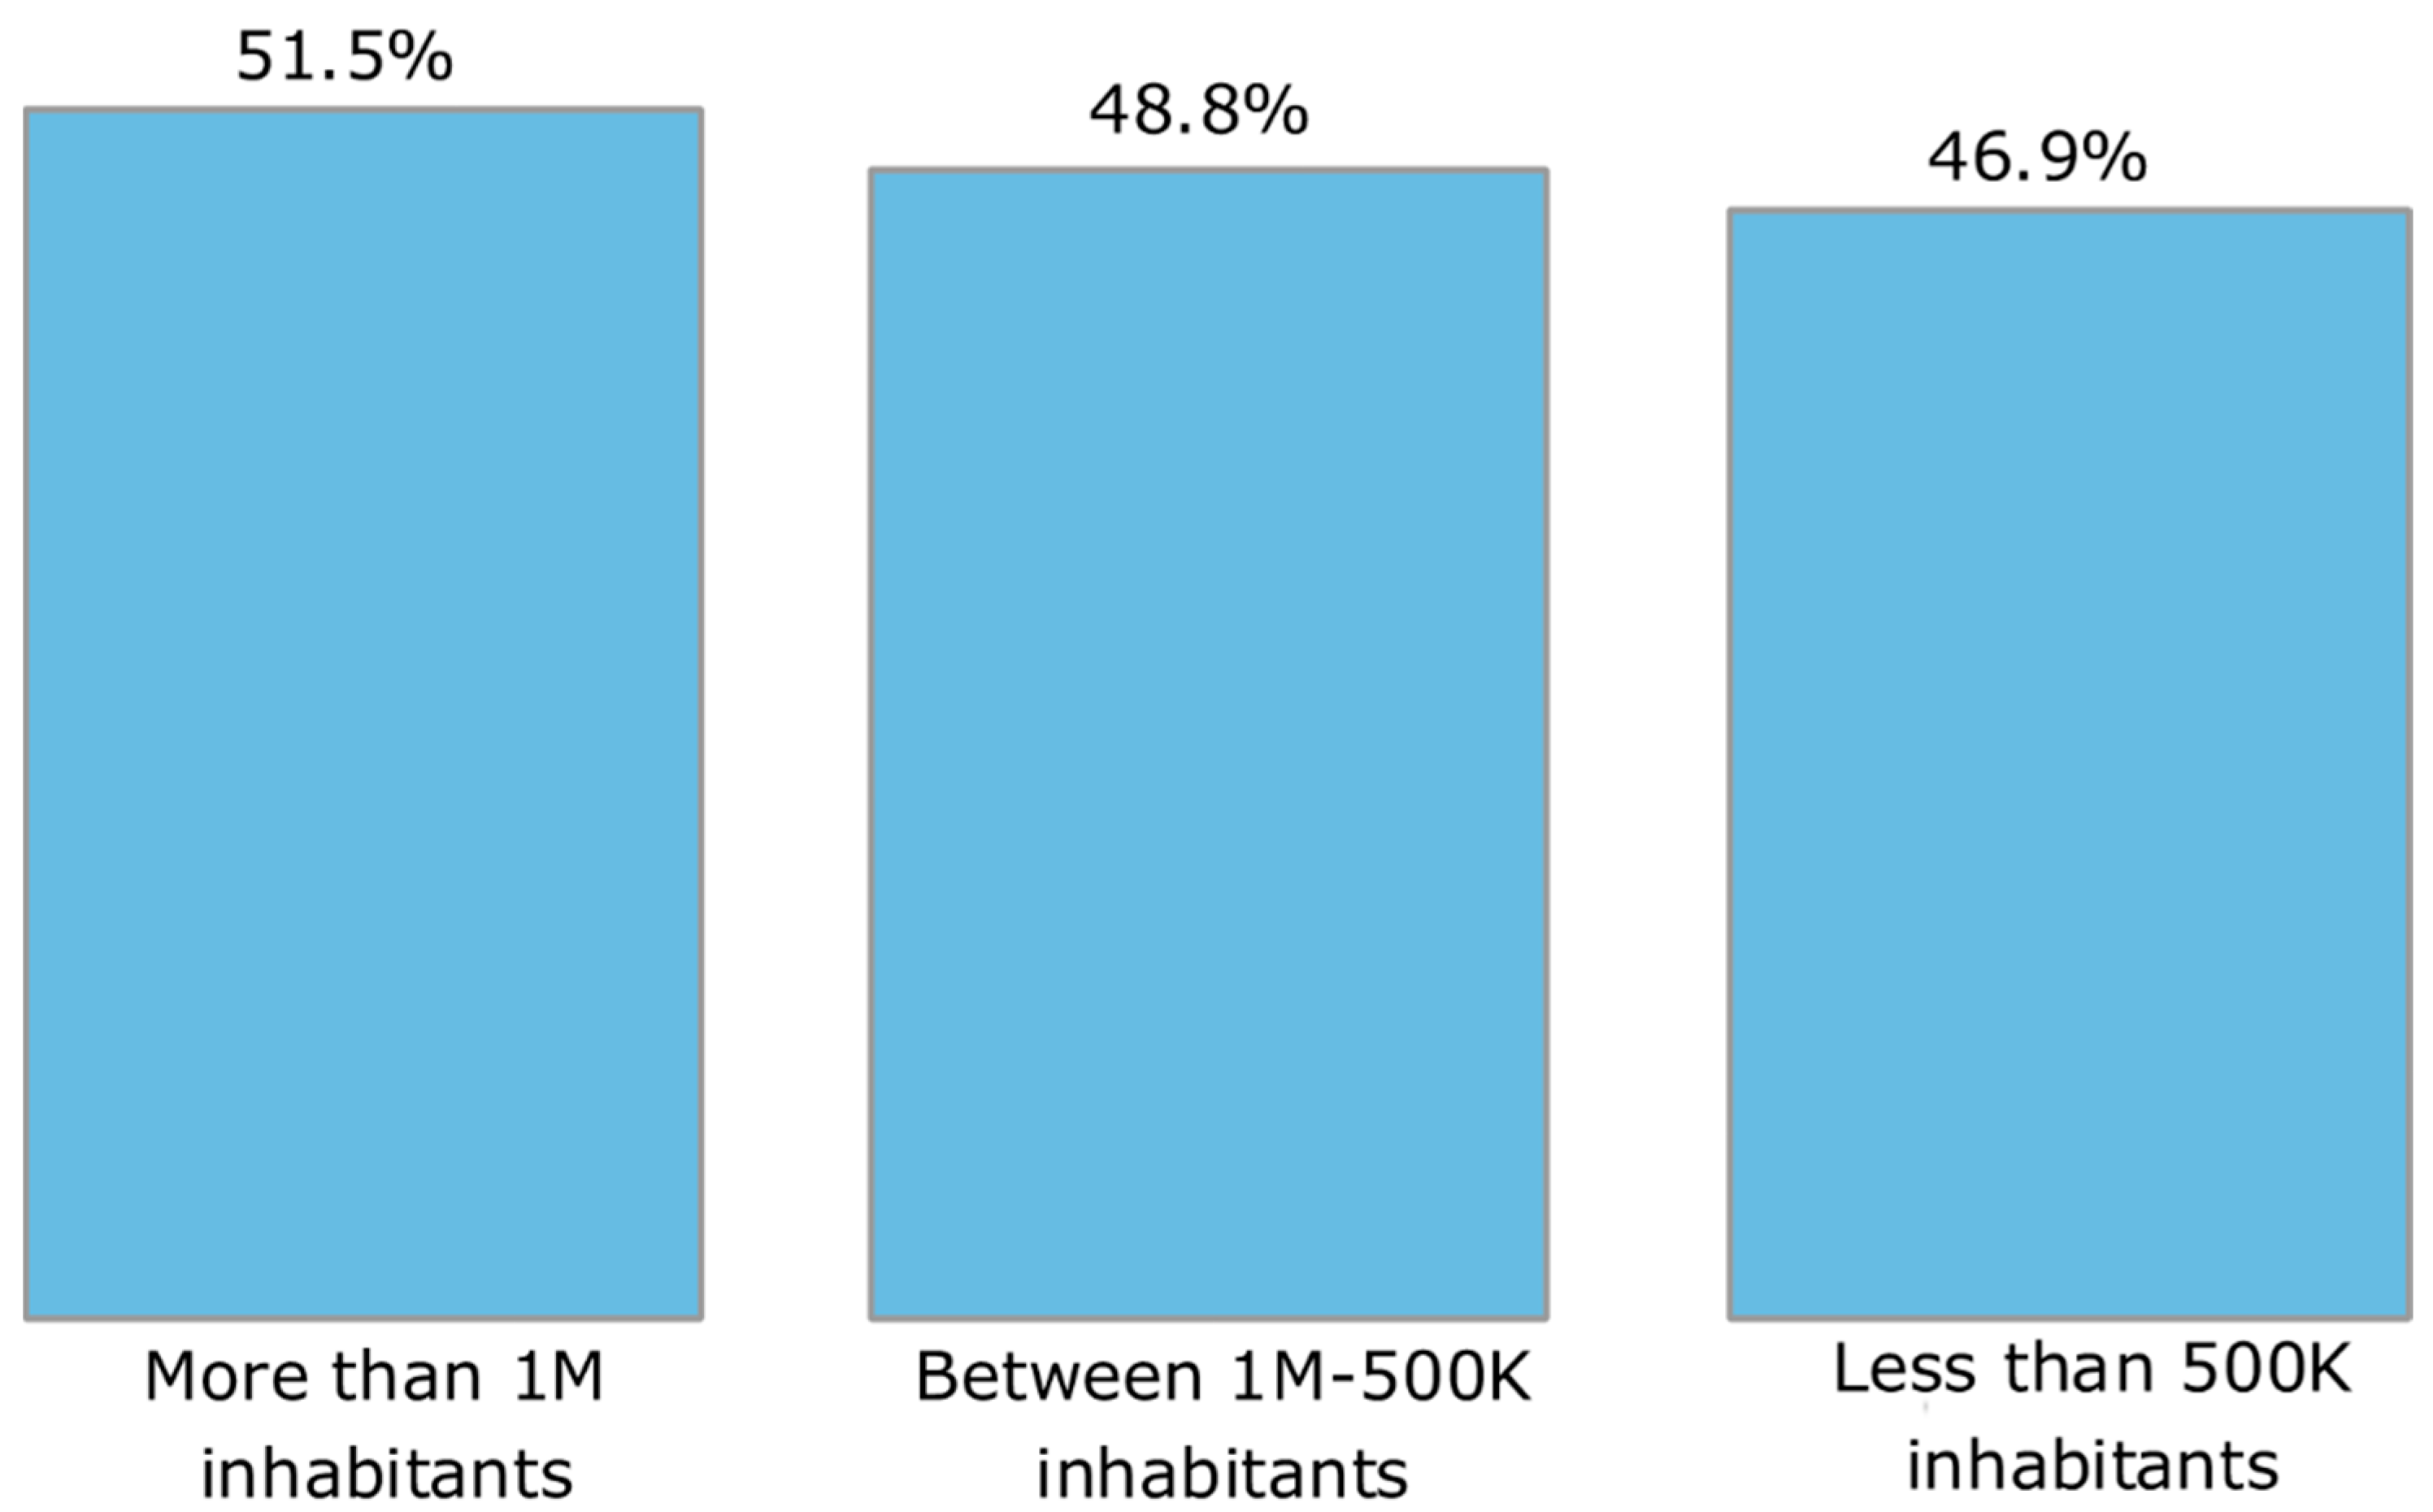
Since we assume that walking trips do not generate GHG emissions—and walking stands out as a frequent option—Figure 5 displays the percentage of customers who choose this mode when using the omnichannel service, segmented by city size. Walking accounts for 51.5% of trips in large cities, 48.8% in medium-sized cities, and 46.9% in small cities. These differences between groups are not statistically significant when comparing the extreme values ( χ 2 = 3.81; p = 0.1491).
Another variable of interest is the proportion of omnichannel users who combine their trip with other activities—whether for collection, return, or both services.
In Figure 6, supported by statistical contrasts (Table 8), we confirm statistically significant differences in the percentage of people who do or do not combine their trip with other errands between the groups performing collections and those doing both services simultaneously, but not among those making returns only. Specifically, there is a 22.6% higher share of customers who do not combine their trip when collecting orders, compared to 29.0% who also do not do so when both services are performed together. By contrast, customers returning items only show a nearly balanced distribution, with a non-significant difference of 3.2% in favor of multi-purpose trips.
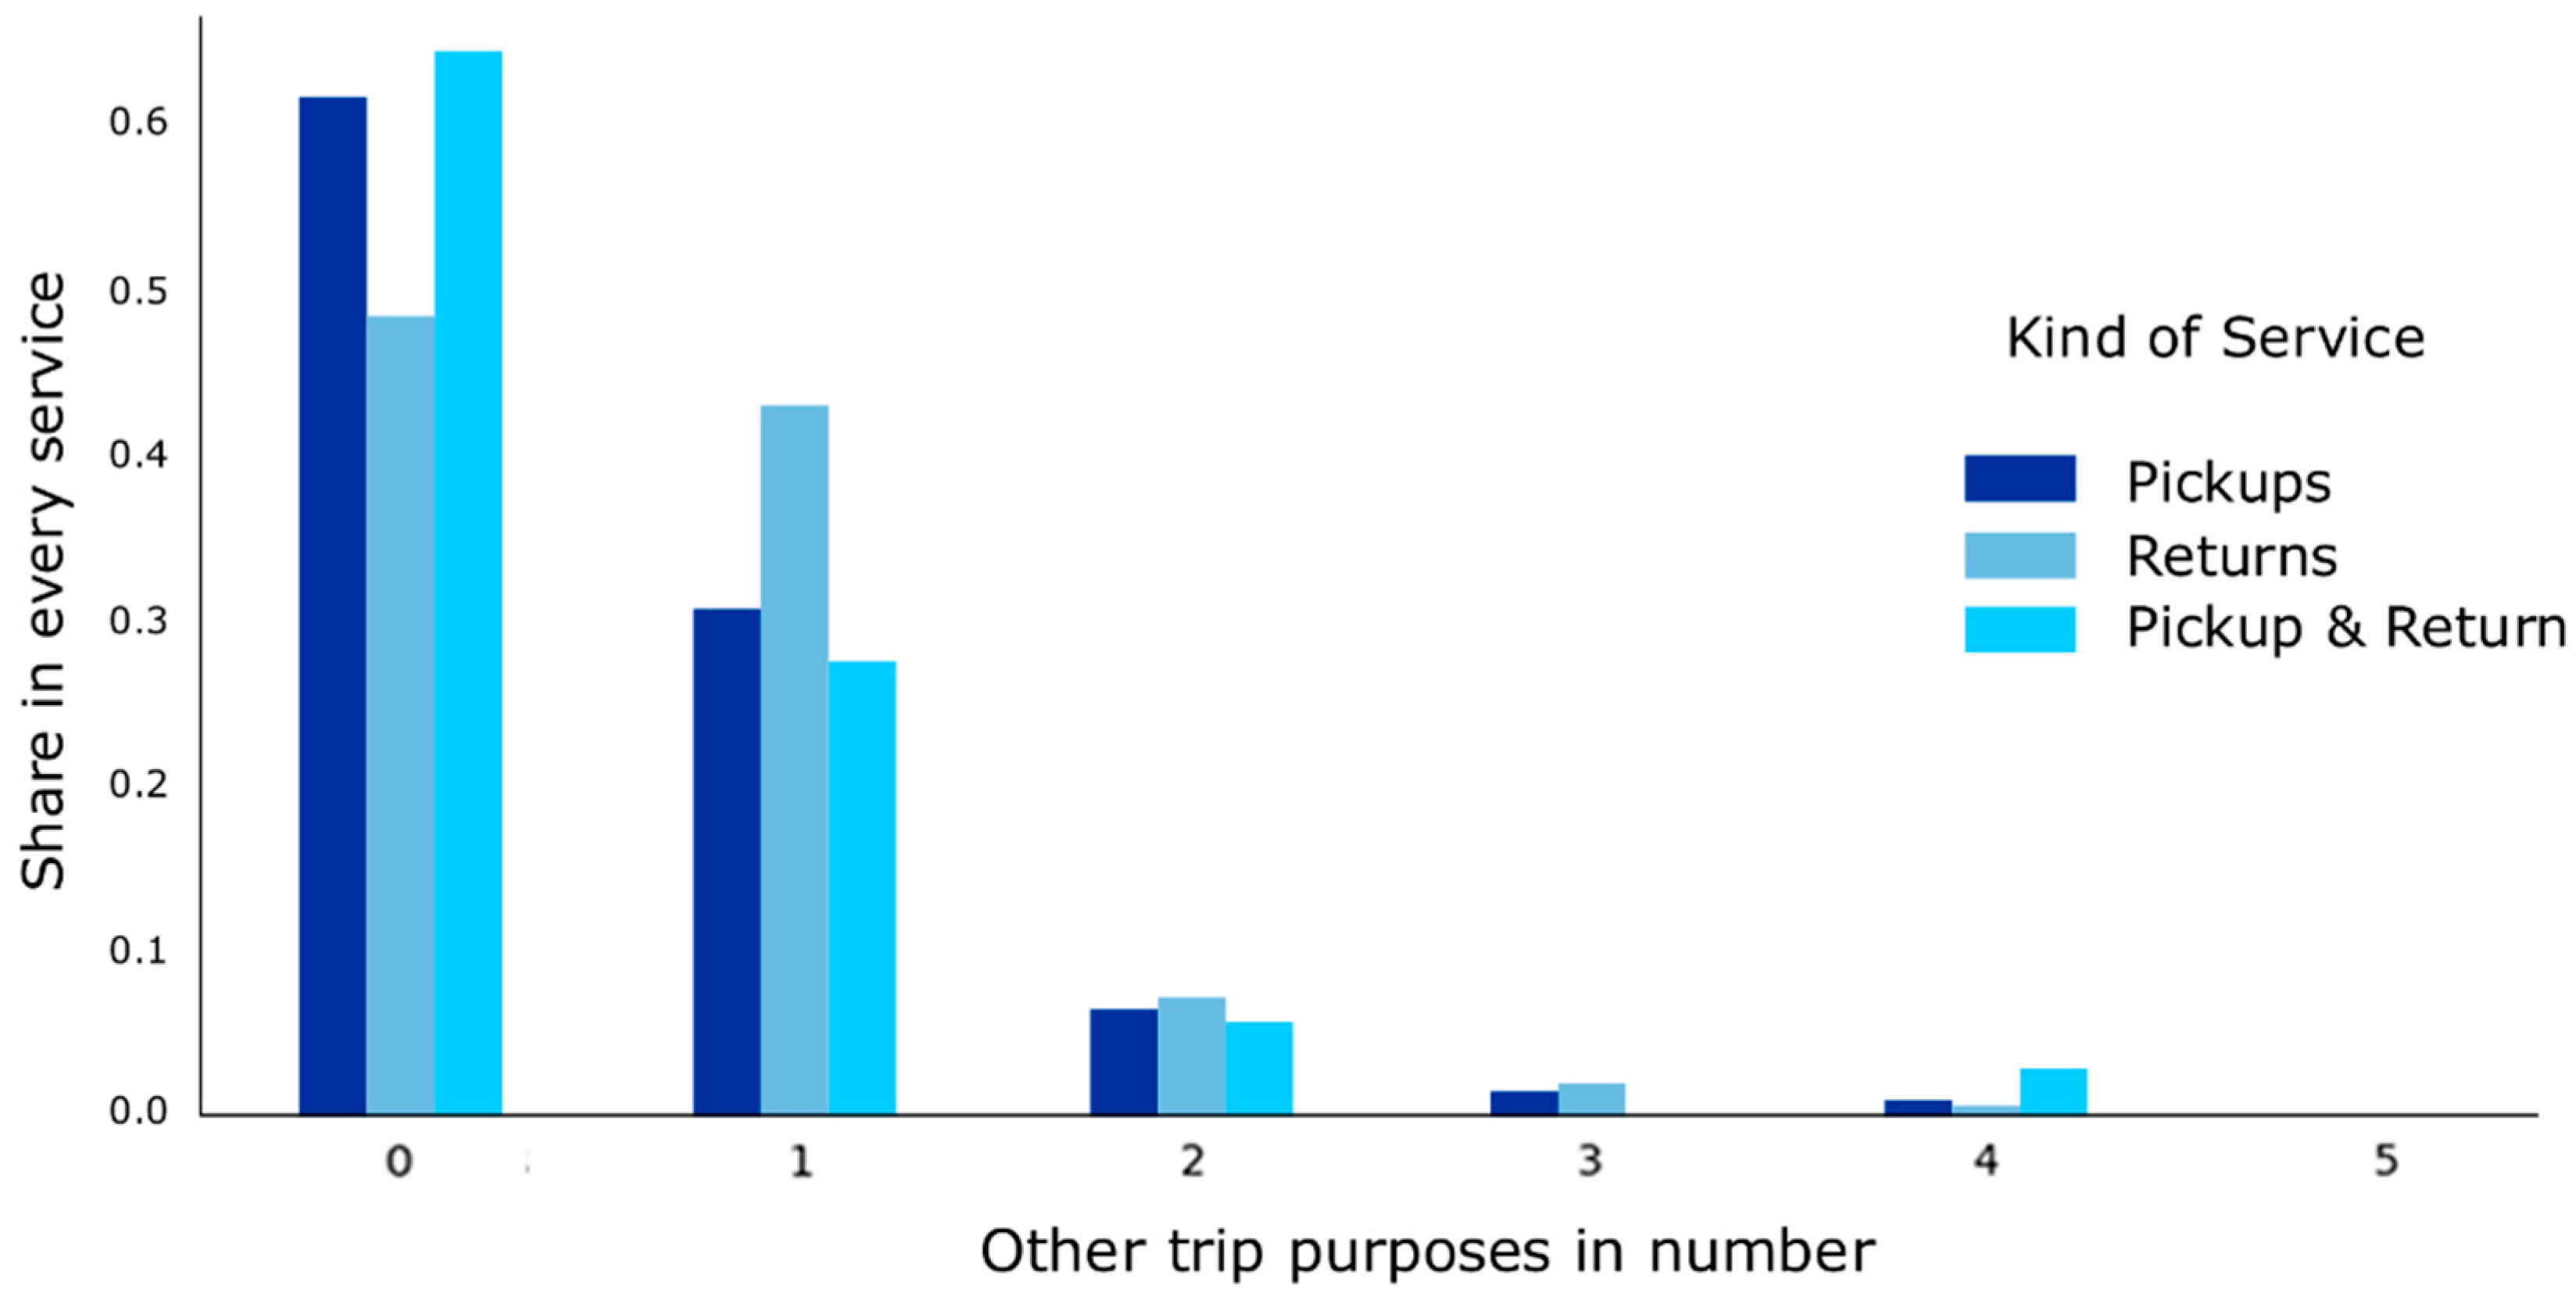
In Figure 7, where results are expressed in decimal form (fractions of one), we observe an inverse distribution as the number of additional activities increases. Although this trend is similar across all service types, there are slight differences in the returns category for values zero and one, indicating that customers making returns are more likely to combine their trip with other activities ( χ 2 = 21.0390, p < 0.0001).
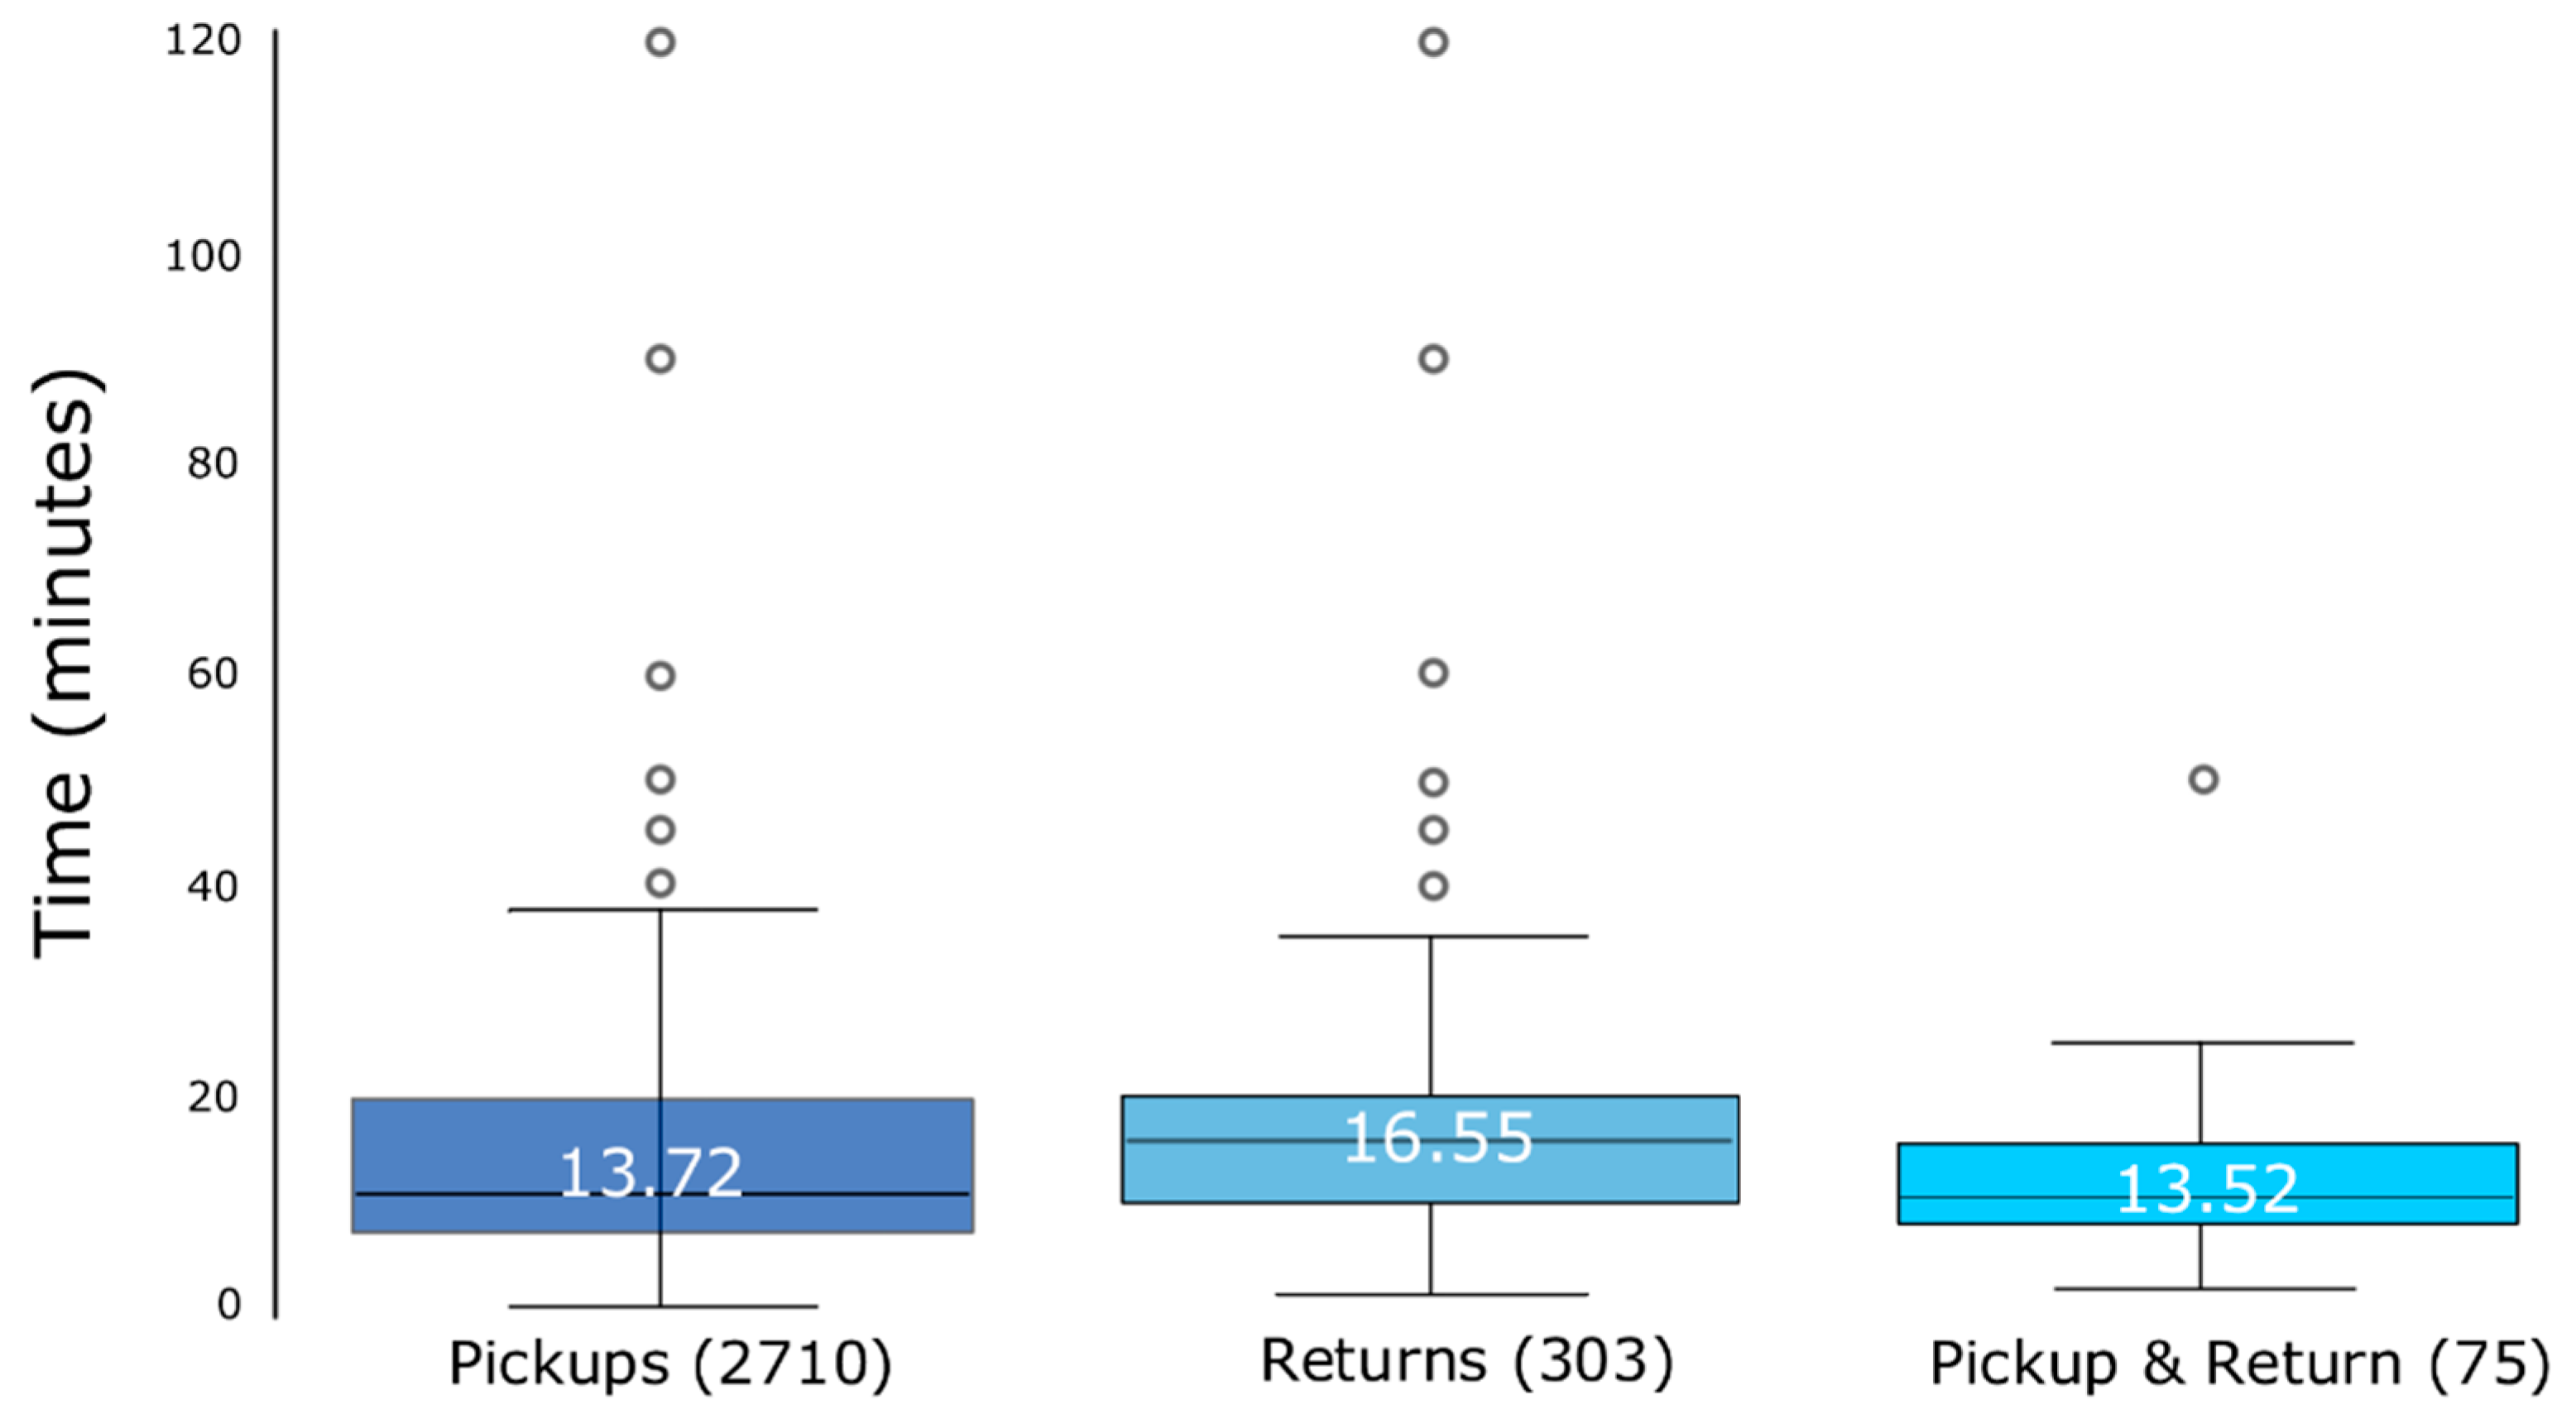
In Figure 8, we compare self-reported travel times (in minutes) among omnichannel customers. The box-and-whisker plots illustrate the time spent for pickups (mean = 13.72, n = 2710), returns (mean = 16.55, n = 303), and both services combined (mean = 13.72, n = 27). In Figure 8, customers making returns spend significantly more time traveling than those only collecting items (Z = −7.3613, p < 0.001), and also more time than those performing both services in a single trip (Z = 2.4980, p = 0.0125). However, the difference between customers who perform only pickups and those who perform pickups and returns simultaneously is not statistically significant (Z = −0.7866, p = 0.4315).
In general terms, the average estimated carbon footprint per omnichannel customer at TENDAM is 400 g C O 2 e q per service, compared to a range of 1500 to 3000 g C O 2 e q for pure players.
Additionally, Figure 9 illustrates the estimated carbon footprint difference between TENDAM’s omnichannel model and pure players, segmented by service type (collection, return, and both).
In addition, in Table 9, we summarize the ranges of emissions calculated for the Omnichannel model compared to those estimated for the pure players, for the services of pickups, returns, and both at once, measured in g C O 2 e q .
Furthermore, average estimated emissions per package in street-level omnichannel stores reach ~ 145 g C O 2 e q , compared to ~ 500 g C O 2 e q in shopping mall locations.
When considering city sizes instead, the average estimated emissions reach ~ 190 g C O 2 e q in large cities (more than 1 million inhabitants), ~ 300 g C O 2 e q in medium-sized cities (1M–500K inhabitants), and g C O 2 e q in cities with fewer than 500K inhabitants.
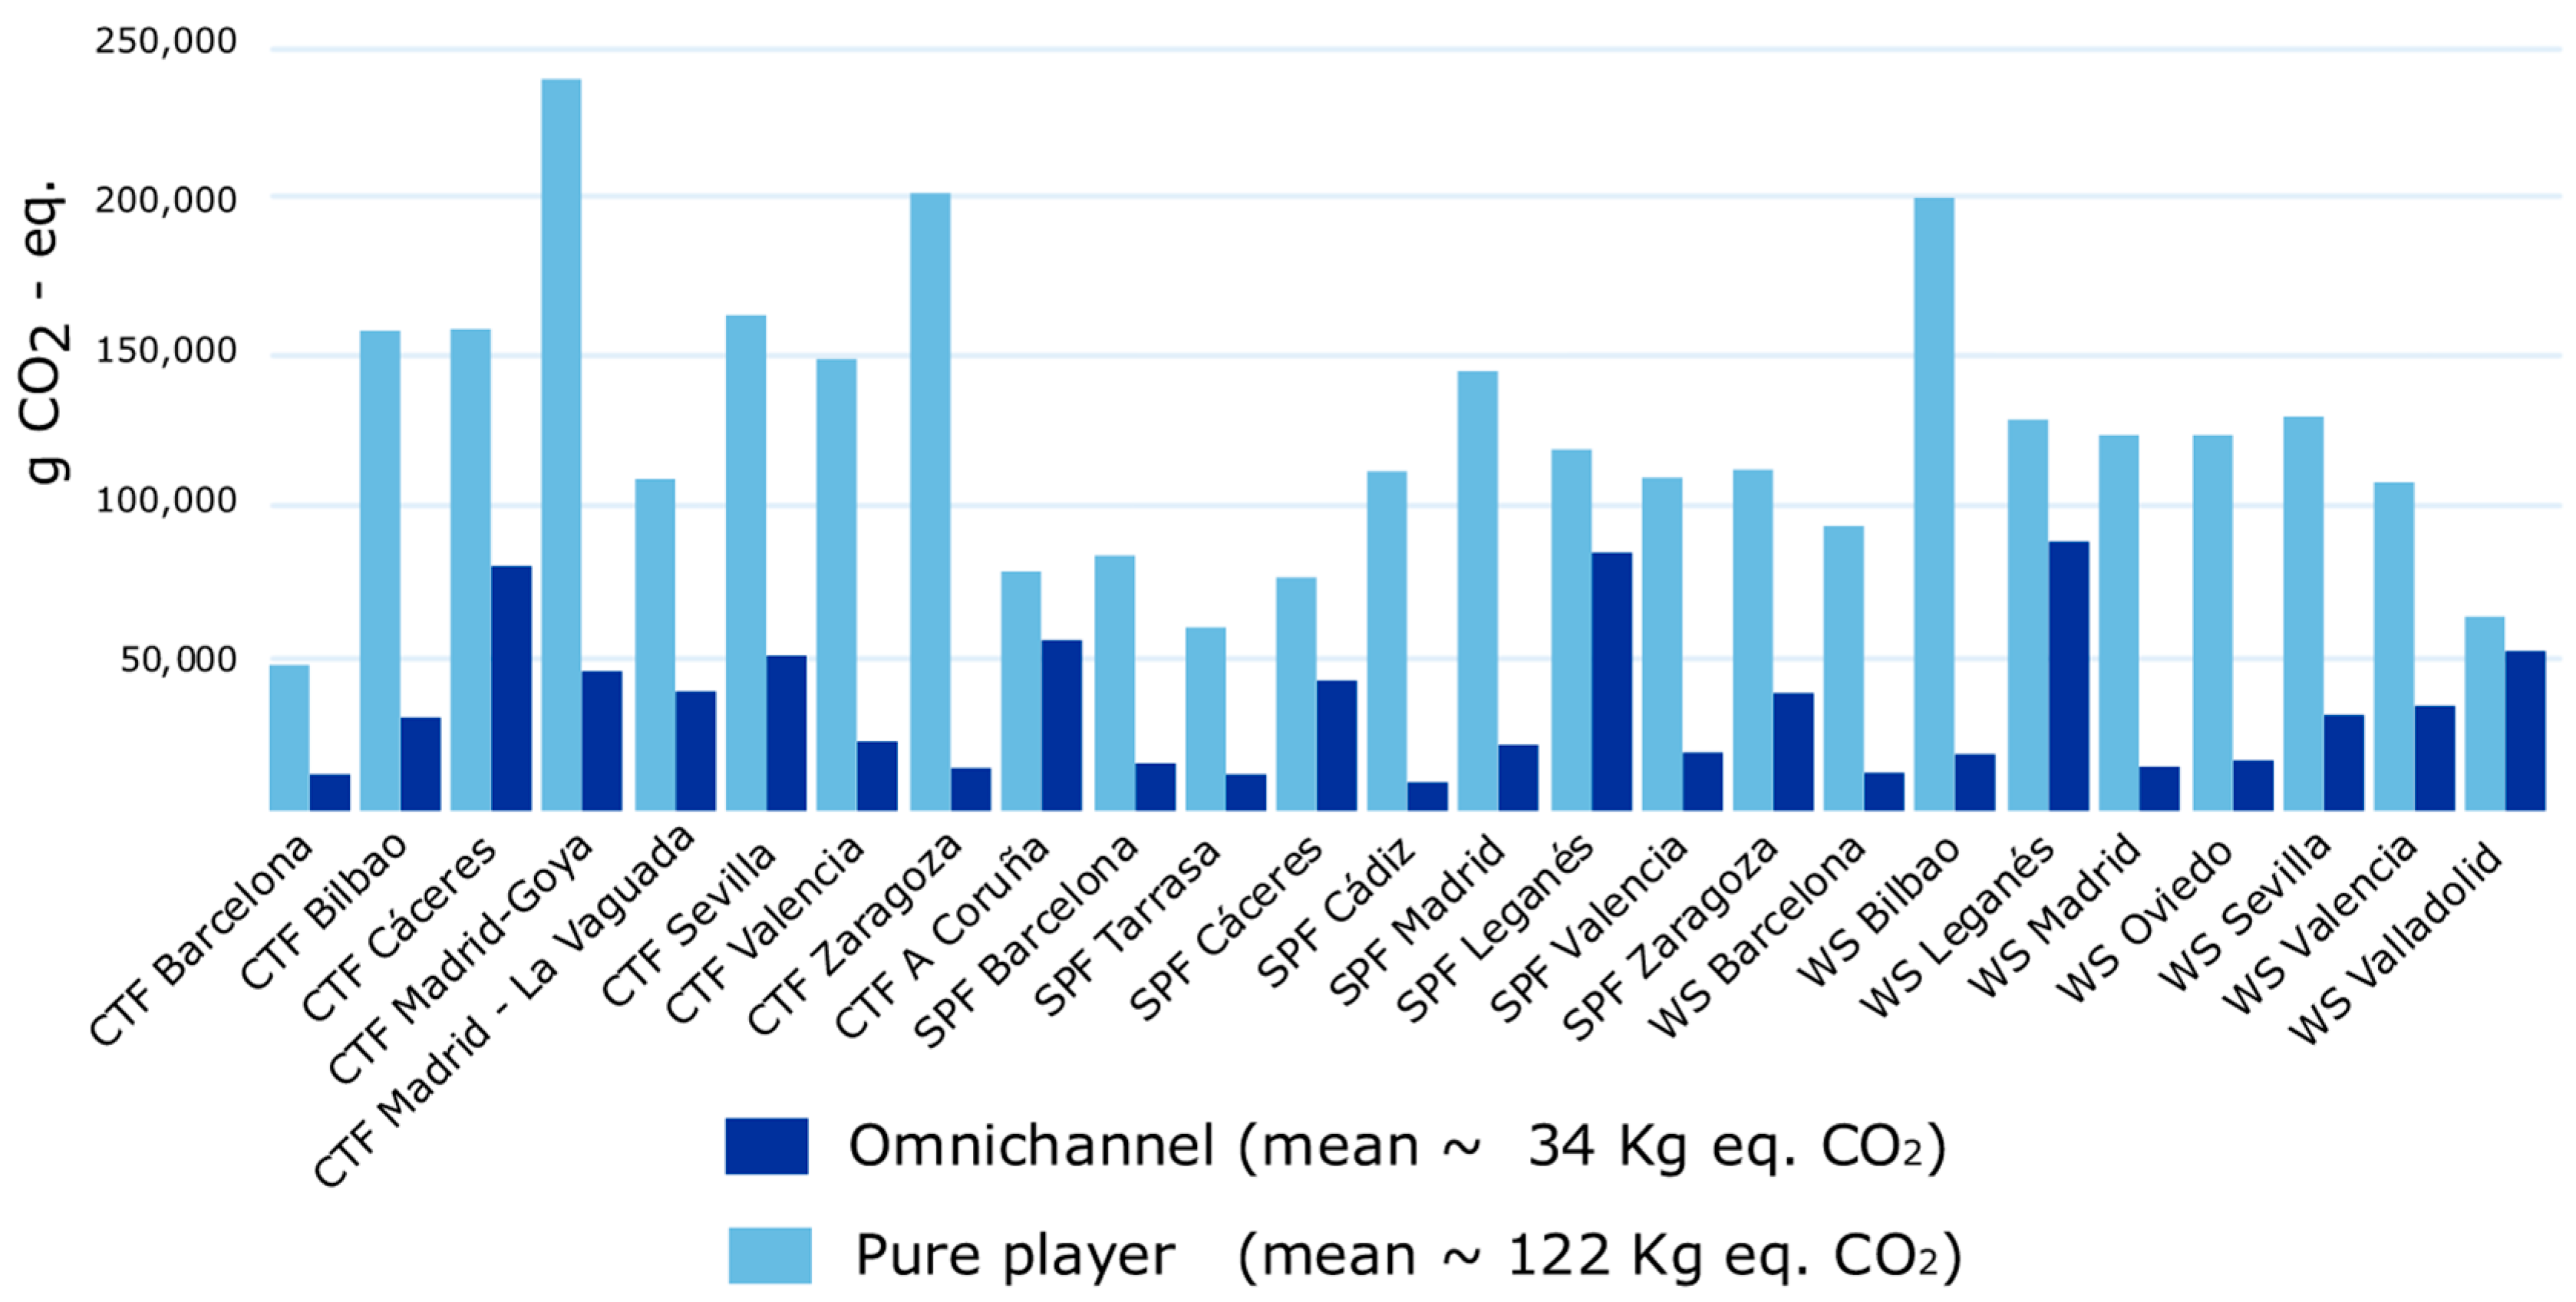
Likewise, in Figure 10, we present a comparative analysis of GHG emissions for omnichannel stores compared to their equivalent in the pure player model. The average estimated emissions for omnichannel stores are ~ 34 Kg C O 2 e q , while the expected value for pure players reaches ~ 122 Kg C O 2 e q .
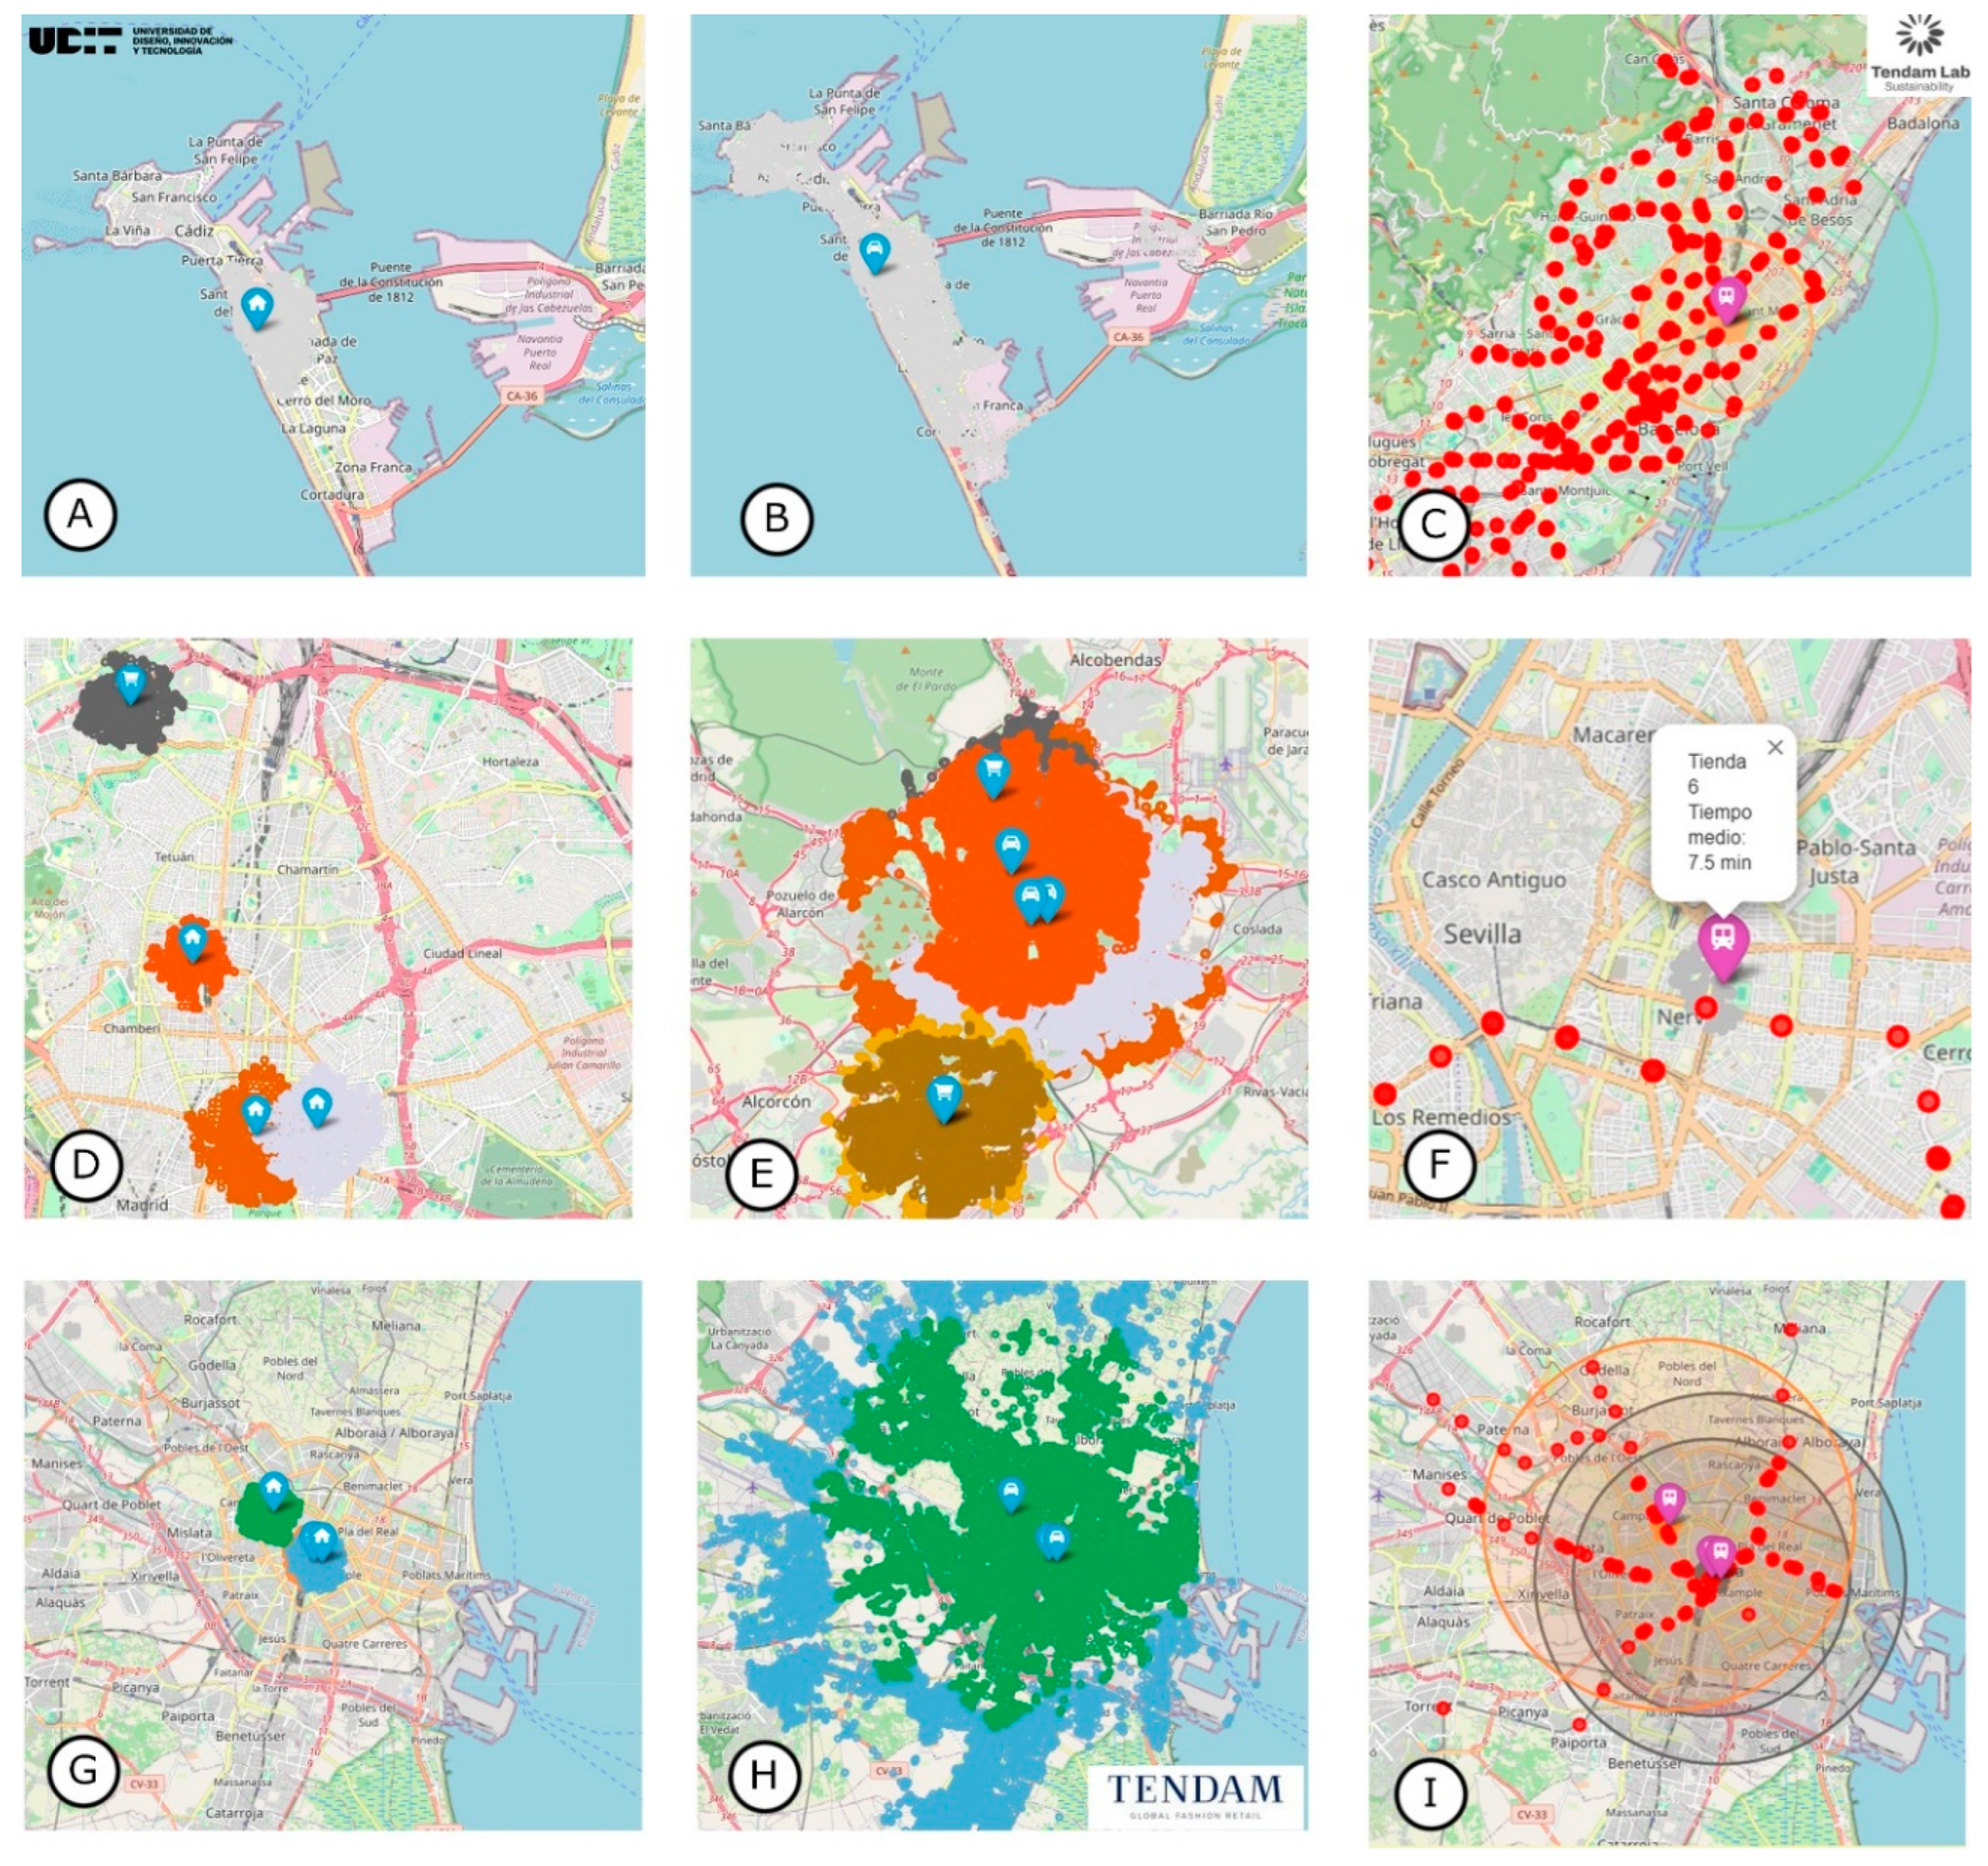
Finally, in Figure 11, we present significant examples of influence maps for walking (first column), car (central column), and metro (left column), generated using intelligent algorithms.
To support the interpretation of our findings, the influence maps will be further examined in the discussion to explain how spatial accessibility, store location, and transport modes shape the carbon footprint of omnichannel retail. These visualizations serve as a bridge between mobility patterns and environmental performance, helping to identify the specific urban conditions under which the omnichannel model becomes most advantageous. Specifically, store capillarity is directly related to RQ3.

4. Discussion

This preliminary study provides estimated customer-level CHG emissions in last-mile deliveries based on surveys in Spanish TENDAM’s omnichannel model, compared with those of pure players.
In line with our research hypothesis (H1)—that the omnichannel retail model is more sustainable than the pure-player e-commerce model in our context, as it results in lower greenhouse gas emissions per unit sold—we find that the store-based click-and-collect channel can reduce last-mile GHG emissions across city sizes, store locations (both malls and high streets), and store formats, when compared with a home-delivery benchmark (cf. [11,19]). However, the magnitude of this benefit varies depending on the specific scenario within the TENDAM omnichannel model.
In response to RQ1 (What is the per-purchase carbon footprint of click-and-collect in TENDAM omnichannel versus pure-player home delivery for fashion apparel in Spain?), we estimate approximately ~ 400 g C O 2 e q per service, assuming one apparel item per package. For pure players, we used a reference value ranging from ~ 1500 to ~ 3000 g C O 2 e q , which would represent an average saving between 73% and 87% per service in the last mile.
These differences in GHG emissions between the compared models begin to be explained by the tendency of omnichannel customers to combine their trip with other purposes (Figure 6). However, we observe a statistically significant difference in this variable for customers who only return items, compared to those who either collect products or perform both services in the same trip.
In our calculations for TENDAM’s omnichannel model, we consider only one or no additional purpose during the journey, regardless of the mode of transport used. In contrast, the authors of [9] assume that each car trip includes four different purposes. As a result, they distribute the emissions accordingly, leading to a reduction in the comparative models aligned with the pure players. However, there is a strong preference among omnichannel customers for walking (Figure 4 and Figure 5), which generates no GHG emissions. Although walking trips are divided by two in Equation (2), this does not decrease emissions in the omnichannel model; however, it does favor emission reductions in other areas, resulting in a latent absorption that has yet to be defined, depending on the alternative transport mode being replaced.
In Figure 7, we observe a decreasing trend in the number of other activities performed by omnichannel customers, with a maximum of five, across all service types. In contrast, references for pure players estimate that four activities are usually combined in a single trip, which makes our estimate more conservative than the assumptions used by [9], whose work remains a key benchmark in our comparison.
In the same way, Figure 9 shows that the GHG emissions associated with pure players are three times higher than those of the omnichannel model for collection and return services, and up to four times higher when both are carried out in the same trip.
In response to RQ2 (How does that footprint vary across large (>1 M inhabitants), medium (0.5–1 M), and small (<0.5 M) cities?), we estimate that the average GHG emissions per service in TENDAM’s omnichannel stores located in large cities ( ~ 190 g C O 2 e q ) are approximately one-third lower than those in medium-sized ( ~ 300 g C O 2 e q ) and small cities ( ~ 310 g C O 2 e q ).
We now move on to discuss, in response to RQ3, how store capillarity influences the results obtained. First of all, we observe that there are differences depending on whether the store is street-level or located in a shopping center, and on the size of the city. Specifically, omnichannel stores located at street level generate ~ 145 g C O 2 e q per order, compared to ~ 500 g C O 2 e q for those located in shopping centers (Figure 9).
A per-store comparison reveals very significant differences between average emissions per store in scenarios where pure players are involved, compared to the omnichannel model, with up to ~ 3.60 times higher emissions (Figure 10). Likewise, we observe that in some stores, the difference is particularly pronounced in favor of the omnichannel model, especially where walking is the dominant mode of access and stores are located at street level.
We also include influence maps in Appendix A for different means of transport. Due to space constraints, we describe below some selected screenshots extracted from those maps (Figure 11).
Screenshots A and B in Figure 11 correspond to the city of Cádiz, where the gray areas represent inaccessible zones such as the sea, the port, or the free trade area, extending across bridges to reach outer neighborhoods accessible by car. However, in image A, which represents walking routes, the most probable area is limited to the city center, whereas the car-accessible zone (B) spans all neighborhoods, including those outside the city center.
Screenshots D and E in Figure 11 refer to Madrid, depicting pedestrian access within the capital and car access throughout the wider Madrid region. The maps show overlapping zones between stores and demonstrate how their combined coverage results in an influence area that is evenly distributed throughout the territory.
Screenshots G, H, and I correspond to Valencia, where the pedestrian zones are more localized, the car-accessible area is more restricted and overlapping, and the metro influence area is almost entirely covered when combining the zones of all stores.
Seville is also included as a metro-access example (Figure 11F), since there are two stores in the city but only the Nervión location is used by omnichannel customers. This may be because it is the closest to a metro entrance and follows a shorter walking route than the other store.
In contrast, in Barcelona (Figure 11C), the metro influence area covers only the northern half of the network and is used for just two specific stores, excluding the others.
The interactive maps also help us grasp, at a glance, the spatial relationships between stores. They help explain the favorable results obtained by the TENDAM omnichannel model in the last mile, compared to the pure players. Among the reasons that make this model so advantageous in terms of carbon footprint are urban features such as population density, access distribution, parking availability and costs, store integration into the urban grid, and consumers’ cultural habits.
In our maps, the combination of collective intelligence and artificial intelligence can delineate the boundaries between zones where TENDAM’s omnichannel model clearly outperforms a low-emission delivery fleet that does not overpackage and does not send returned items back to distant countries to be destroyed.
However, every work has strengths and limitations. The main strengths of this preliminary study include the large and geographically balanced sample size (n = 3106), the collection of real customer mobility data, and the use of open-source code, which enables full reproducibility of the results.
Nevertheless, at this initial stage of development, our work has a preliminary scope, as it focuses on accurately measuring last-mile emissions in the omnichannel model. It also relies on survey methods, whose limitations have been discussed recently by [58]. That said, surveys remain a valid method employed by other researchers in equivalent contexts [47], especially when protecting customer privacy is essential.
Moreover, this analysis is limited to a single retailer in Spain, so caution should be exercised when attempting to generalize the findings to low-density rural areas.
For future research, we propose conducting a full life-cycle assessment that incorporates packaging and end-of-life supply chain reporting. This work may also be included in cross-country comparative studies.

5. Conclusions

This preliminary study shows that the omnichannel click-and-collect and return model can offer significant environmental advantages over pure-player home delivery in the context of last-mile logistics. Based on more than 3100 surveys across 11 Spanish cities, the average carbon footprint per service in the omnichannel model is approximately 400 g CO2-eq, compared with 1500–3000 g CO2-eq in pure-player scenarios, which represents potential savings of between 73% and 87%.
The results also highlight how urban context shapes outcomes: emissions are markedly lower in large cities, averaging 190 g, compared with 300–310 g in medium and small cities. Likewise, store type proves decisive, as street-level stores record an average of 145 g per order, whereas shopping mall outlets reach around 500 g. These findings confirm that population density, accessibility, and integration into walkable urban areas play a crucial role in reducing last-mile impacts.
Consumer behavior further explains these differences. A high proportion of omnichannel customers combine their trips with other activities, and more than half of those in large cities reach stores on foot. Both patterns substantially reduce transport-related emissions compared to dedicated home deliveries. In addition, operational practices such as the reintegration of returned garments into store inventories, rather than their destruction, contrast with pure-player models where up to 22–46% of returns are discarded, thereby strengthening the environmental advantage of omnichannel retail.
Despite its preliminary scope and reliance on survey data, this research provides novel academic value by linking consumer mobility patterns to carbon emissions in the fashion retail sector. It contributes to the literature with transparent, data-driven evidence, pointing to future lines of inquiry, such as full life-cycle assessments, cross-country comparisons, and the integration of packaging and reverse logistics into sustainability analysis.

Author Contributions

Conceptualization, J.L.O. and C.L.-T.; methodology, D.A.R.; software, D.A.R.; validation, D.A.R., C.L.-T., and M.T.-S.; formal analysis, D.A.R.; investigation, C.L.-T. and M.T.-S.; resources, J.L.O.; data curation, D.A.R.; writing—original draft preparation, D.A.R., C.L.-T., M.T.-S., and I.M.-C.; writing—review and editing, D.A.R., C.L.-T., M.T.-S., and I.M.-C.; visualization, D.A.R.; supervision, J.L.O.; project administration, C.L.-T.; funding acquisition, J.L.O. All authors have read and agreed to the published version of the manuscript.

Funding

This research received funding from the Universidad de Diseño, Innovación y Tecnología (UDIT). Funding code INC-UDIT-2026-JCR01.

Institutional Review Board Statement

Ethical review and approval were waived for this study because anonymous consumer surveys are not required under Law 14/2007 (Art. 1.a).

Informed Consent Statement

Informed consent was obtained from all subjects involved in the study.

Data Availability Statement

Aggregated data are contained within the article. Anonymized micro-data are available in Appendix A.

Acknowledgments

We thank the PlaCeTEx project team at TENDAM for facilitating data collection.

Conflicts of Interest

The authors declare no conflicts of interest.

Abbreviations

The following abbreviations are used in this manuscript:
C O 2 e q Carbon Dioxide Equivalent
DGCDirección General de Circulación
d i Distance traveled by customer i (km)
E i Greenhouse   gas   emissions   generated   by   customer   I   during   transport   ( g   C O 2 e q )
GHG Greenhouse Gas
IDAE Instituto para la Diversificación y el Ahorro de la Energía
K i Emission factor associated with the transport mode of customer i (g)
LCA Life Cycle Assessment
N i Number   of   activities   carried   out   during   the   trip   by   customer   i ,   with   N i , ∈{1,2}
RQ Research Question
t i Time taken to reach the store by customer i (hours)
V i ¯ Average speed for customer i according to city and transport mode (km/h)

Appendix A

Dataset, Python-based Google Colab notebooks for calculations, and interactive maps are available at https://n9.cl/qq5g7s (accessed on 18 September 2025).

References

  1. World Commission on Environment and Development (WCED). Our Common Future; Oxford University Press: Oxford, UK, 1987. [Google Scholar]
  2. Purvis, B.; Mao, Y.; Robinson, D. Three pillars of sustainability: In search of conceptual origins. Sustain. Sci. 2019, 14, 681–695. [Google Scholar] [CrossRef]
  3. World Economic Forum. The Future of the Last-Mile Ecosystem. Available online: https://www.weforum.org/publications/ (accessed on 20 July 2025).
  4. World Economic Forum. Urban Deliveries Expected to Add 11 Minutes to Daily Commute and Increase Carbon Emissions by 30% Until 2030 Without Effective Intervention. Available online: https://www.weforum.org/ (accessed on 20 July 2025).
  5. Liyi, Z.; Chun, L. A Comparative Study of Environment Impact in Distribution via E-Commerce and Traditional Business Model. In Proceedings of the 5th International Conference on New Trends in Information Science and Service Science, Macao, China, 24–26 October 2011; pp. 194–199. [Google Scholar]
  6. Cullinane, S.; Cullinane, K. The Logistics of Online Clothing Returns in Sweden and How to Reduce its Environmental Impact. J. Serv. Sci. Manag. 2021, 14, 72–95. [Google Scholar] [CrossRef]
  7. Sarkar, M. Last-Mile Carbon Emission under E-Commerce: Environmental Perspective. Open J. Soc. Sci. 2023, 11, 277–292. [Google Scholar] [CrossRef]
  8. Dubisz, D.; Golinska-Dawson, P.; Zawodny, P. Measuring CO2 Emissions in E-Commerce Deliveries: From Empirical Studies to a New Calculation Approach. Sustainability 2022, 14, 16085. [Google Scholar] [CrossRef]
  9. Buldeo Rai, H.; Touami, S.; Dablanc, L. Not All E-commerce Emits Equally: Systematic Quantitative Review of Online and Store Purchases’ Carbon Footprint. Environ. Sci. Technol. 2023, 57, 708–718. [Google Scholar] [CrossRef] [PubMed]
  10. Makov, T.; Roichman, R.; Sprecher, B.; Blass, V.; Meshulam, T. The Hidden Environmental Costs of Consumer Product Returns. Unpublished work. 2023. [Google Scholar]
  11. Roichman, R.; Sprecher, B.; Blass, V.; Meshulam, T.; Makov, T. The convenience economy: Product flows and GHG emissions of returned apparel in the EU. Resour. Conserv. Recycl. 2024, 210, 107811. [Google Scholar] [CrossRef]
  12. Brown, J.R.; Guiffrida, A.L. Carbon emissions comparison of last mile delivery versus customer pickup. Int. J. Logist. Res. Appl. 2014, 17, 503–521. [Google Scholar] [CrossRef]
  13. Edwards, J.B.; McKinnon, A.C.; Cullinane, S.L. Comparative analysis of the carbon footprints of conventional and online retailing: A “last mile” perspective. Int. J. Phys. Distrib. Logist. Manag. 2010, 40, 103–123. [Google Scholar] [CrossRef]
  14. Nabot, A.; Omar, F. Comparative Study of the Impacts of Conventional and Online Retailing on the Environment: A Last Mile Perspective. Int. J. Comput. Appl. 2016, 138, 6–12. [Google Scholar] [CrossRef]
  15. Feichtinger, S.; Gronalt, M. The Environmental Impact of Transport Activities for Online and In-Store Shopping: A Systematic Literature Review to Identify Relevant Factors for Quantitative Assessments. Sustainability 2021, 13, 2981. [Google Scholar] [CrossRef]
  16. Gutenschwager, K.; Rabe, M.; Chicaiza-Vaca, J. Comparing Direct Deliveries and Automated Parcel Locker Systems with Respect to Overall CO2 Emissions for the Last Mile. Algorithms 2023, 17, 4. [Google Scholar] [CrossRef]
  17. Raza, S.A.; Govindaluri, S.M. Omni-channel retailing in supply chains: A systematic literature review. Benchmarking Int. J. 2021, 28, 2605–2635. [Google Scholar] [CrossRef]
  18. Luo, L.; Sheng, Y.; Song, Y. A Historical Review on Omni Channel Retailing Consumer Research. Oper. Supply Chain Manag. Int. J. 2023, 16, 435–449. [Google Scholar] [CrossRef]
  19. Velazquez, R.; Chankov, S.M. Environmental impact of last mile deliveries and returns in fashion E-commerce: A cross-case analysis of six retailers. In Proceedings of the 2019 IEEE International Conference on Industrial Engineering and Engineering Management (IEEM), Macao, China, 15–18 December 2019; pp. 1099–1103. [Google Scholar] [CrossRef]
  20. Schnieder, M.; Hinde, C.; West, A. Land Efficient Mobility and Emissions: Click and Collect vs. Grocery Deliveries in Switzerland. Sustainability 2023, 15, 8814. [Google Scholar] [CrossRef]
  21. Beziat, A.; François, C. Impacts of Behavioral, Organizational, and Spatial Factors on the Carbon Footprint of Traditional Retail and E-commerce in the Paris Region. Environ. Sci. Technol. 2024, 58, 7325–7334. [Google Scholar] [CrossRef]
  22. Vhatkar, M.S.; Raut, R.D.; Gokhale, R.; Cheikhrouhou, N.; Akarte, M. A glimpse of the future sustainable digital omnichannel retailing emerges—A systematic literature review. J. Clean. Prod. 2024, 442, 141111. [Google Scholar] [CrossRef]
  23. Lerner, J.; Calloway, C.; Ason, D. Carbon reduction and understanding through simulation of transportation (CRUST) for e-commerce. J. Clean. Prod. 2024, 454, 142198. [Google Scholar] [CrossRef]
  24. Prasertwit, T.; Kanchanasuntorn, K.; Vongmanee, V. Development of a Green E-Commerce Model and Analysis of Carbon Footprints Adoption. Hong Kong J. Soc. Sci. 2023, 62, 273–282. [Google Scholar] [CrossRef]
  25. Sharma, A.P.; Starčević, S.; Saha, R. Determinants of customer buying behaviour in omnichannel retailing: A systematic literature review and future research directions. J. Serv. Theory Pract. 2024, 34, 822–863. [Google Scholar] [CrossRef]
  26. Escursell, S.; Llorach-Massana, P.; Roncero, M.B. Sustainability in e-commerce packaging: A review. J. Clean. Prod. 2021, 280, 124314. [Google Scholar] [CrossRef]
  27. Mansurali, A.; Stephen, G.; Kasilingam, D.; Inbaraj Jublee, D. Omnichannel marketing: A systematic review and research agenda. Int. Rev. Retail Distrib. Consum. Res. 2024, 34, 616–645. [Google Scholar] [CrossRef]
  28. Wiese, A. Sustainability in Retailing: Environmental Effects of Transport Processes, Shopping Trips and Related Consumer Behaviour. Ph.D. Thesis, University of Göttingen, Göttingen, Germany, 2013. [Google Scholar]
  29. Wiese, A.; Toporowski, W.; Zielke, S. Transport-related CO2 effects of online and brick-and-mortar shopping: A comparison and sensitivity analysis of clothing retailing. Transp. Res. Part D Transp. Environ. 2012, 17, 473–477. [Google Scholar] [CrossRef]
  30. Metropolis, N.; Ulam, S. The Monte Carlo Method. J. Am. Stat. Assoc. 1949, 44, 335–341. [Google Scholar] [CrossRef]
  31. Statista. Textiles—Worldwide. 2024. Available online: https://www.statista.com/outlook/io/manufacturing/material-products/textiles/worldwide (accessed on 16 September 2025).
  32. Risberg, A. A systematic literature review on e-commerce logistics: Towards an e-commerce and omni-channel decision framework. Int. Rev. Retail Distrib. Consum. Res. 2023, 33, 67–91. [Google Scholar] [CrossRef]
  33. Kalkha, H.; Bahnasse, A.; Ouajji, H. The rising trends of smart e-commerce. IEEE Access 2023, 11, 33839–33857. [Google Scholar] [CrossRef]
  34. Maximize Market Research (MMR). Textile Market: Global Industry Analysis and Forecast (2025–2032). Available online: https://www.maximizemarketresearch.com/market-report/textile-market/200298/ (accessed on 16 September 2025).
  35. Budimir, A.; Knežević, B. What influences young adult females when choosing an online apparel retailer: An exploratory analysis. In Proceedings of the ENTRENOVA–Enterprise Research Innovation Conference, Dubrovnik, Croatia, 14–16 September 2023. [Google Scholar] [CrossRef]
  36. Patwary, S.U. Consumer clothing behavior and associated environmental impact. Unpublished work. 2019. [Google Scholar] [CrossRef]
  37. Safeer, A.; Hussain, I.; Abrar, M.; Shabbir, R. Omnichannel retailing in light of psychological factors: A mediated model. Psychol. Res. Behav. Manag. 2023, 16, 5069–5088. [Google Scholar] [CrossRef]
  38. Huang, J.; Thoo, A.C.; Lo, Y.T. Systematic review of consumer behavior research in the context of green apparel. Int. J. Acad. Res. Bus. Soc. Sci. 2024, 14, 20575. [Google Scholar] [CrossRef]
  39. Bianchi, C.; Birtwistle, G. Consumers’ attitudes to sustainable fashion: A consumer behaviour perspective. J. Fash. Mark. Manag. 2010, 14, 256–271. [Google Scholar]
  40. Abdelmeguid, A.; Afy-Shararah, M.; Salonitis, K. Towards circular fashion: Management strategies promoting circular behaviour along the value chain. Sustain. Prod. Consum. 2024, 48, 143–156. [Google Scholar] [CrossRef]
  41. Siebert, F.; Costa Gonçalves, J. Socio-environmental impacts of the textile chain: Consumer knowledge. Int. J. Adv. Res. 2023, 13, 73–89. [Google Scholar] [CrossRef]
  42. Klein, P.; Popp, B. A comparison of the environmental sustainability of brick-and-mortar retailing and online retailing: Contrasting academic research and consumer perceptions. Bus. Soc. Rev. 2023, 128, 635–660. [Google Scholar] [CrossRef]
  43. Kamaruddin, S.S.; Ahmad, F.K.; Wahab, A.A.; Aji, Z.M.; Nordin, N. E-commerce carbon footprint contribution: A preliminary investigation framework. In Proceedings of the 9th International conference, ICOCI 2023, Kuala Lumpur, Malaysia, 13–15 September 2023. [Google Scholar] [CrossRef]
  44. Li, Z.; Zhou, Y.; Guan, D.; Yang, Z. The carbon footprint of fast fashion consumption and mitigation strategies—A case study of jeans. Sci. Total Environ. 2024, 924, 171508. [Google Scholar] [CrossRef] [PubMed]
  45. Fares, N.; Lloret, J.; Kumar, V.; Frederico, G.F. Factors affecting omnichannel buying online and return in store: Evidence from fast-fashion retail. J. Enterp. Inf. Manag. 2023, 36, 952–978. [Google Scholar] [CrossRef]
  46. Maier, E.; Bornschein, R.; Manss, R.; Hesse, D. Financial consequences of adding bricks to clicks. Int. J. Res. Mark. 2023, 40, 609–628. [Google Scholar] [CrossRef]
  47. Kantar. El Sector de la Moda y la Actitud del Consumidor Frente al Medio Ambiente. Ediciones Sibila: 2024. Available online: https://edicionessibila.com/wp-content/uploads/2024/11/28-nov-24-KANTAR_Estudio-sostenibilidad-Moda-Espana-2024-PRESENTADO.pdf (accessed on 16 September 2025).
  48. Hauschild, C.; Coll, A. The influence of technologies in increasing transparency in textile supply chains. Logistics 2023, 7, 55. [Google Scholar] [CrossRef]
  49. Van Rossum, G.; Drake, F.L. Python 3 Reference Manual; CreateSpace: Scotts Valley, CA, USA, 2009; Available online: https://dl.acm.org/doi/10.5555/1593511 (accessed on 17 September 2025).
  50. Google. Google Colaboratory. 2025. Available online: https://colab.research.google.com/ (accessed on 16 July 2025).
  51. Instituto Nacional de Estadística. Annual Population Census. Gobierno de España-Ministerio de Economía, Comercio y Empresa: 2024. Available online: https://www.ine.es/dyngs/INEbase/operacion.htm?c=Estadistica_C&cid=1254736176992&idp=1254735572981 (accessed on 18 September 2025).
  52. DGC Serie Histórica de Mapas de Movilidad. Gobierno de España–Ministerio de Transportes y Movilidad Sostenible: 2023. Available online: https://www.transportes.gob.es/carreteras/nuestra-red/movilidad/mapas-trafico/serie-historica-mapas (accessed on 17 September 2025).
  53. IDAE Base de datos de Consumo y Emisiones de CO2. Gobierno de España–Ministerio para la Transición Ecológica y el Reto Demográfico: 2025. Available online: https://coches.idae.es/consumo-de-carburante-y-emisiones#:~:text=Por%20cada%20litro%20de%20gasolina,64%20kg%20de%20CO2 (accessed on 17 September 2025).
  54. Metro de Madrid. Reducimos la huella de carbono. Community of Madrid: 2020. Available online: https://www.metromadrid.es/es/nota-de-prensa/2020-08-25/reducimos-un-26-la-huella-de-carbono-en-metro-de-madrid-y-revalidamos-nuestra-certificacion (accessed on 17 September 2025).
  55. Story, R. Folium, Version 0.20.0. 2024. Available online: https://python-visualization.github.io/folium/ (accessed on 17 September 2025).
  56. Spain. Law 14/2007, of July 3, on Biomedical Research. Available online: https://www.boe.es/buscar/doc.php?id=BOE-A-2007-12945 (accessed on 17 September 2025).
  57. Fowler, F.J. Survey Research Methods; SAGE Publications: Thousand Oaks, CA, USA, 2014. [Google Scholar]
  58. Rosas, D.A.; Padilla-Zea, N.; Burgos, D. Validated questionnaires in flow theory: A systematic review. Electronics 2023, 12, 2769. [Google Scholar] [CrossRef]
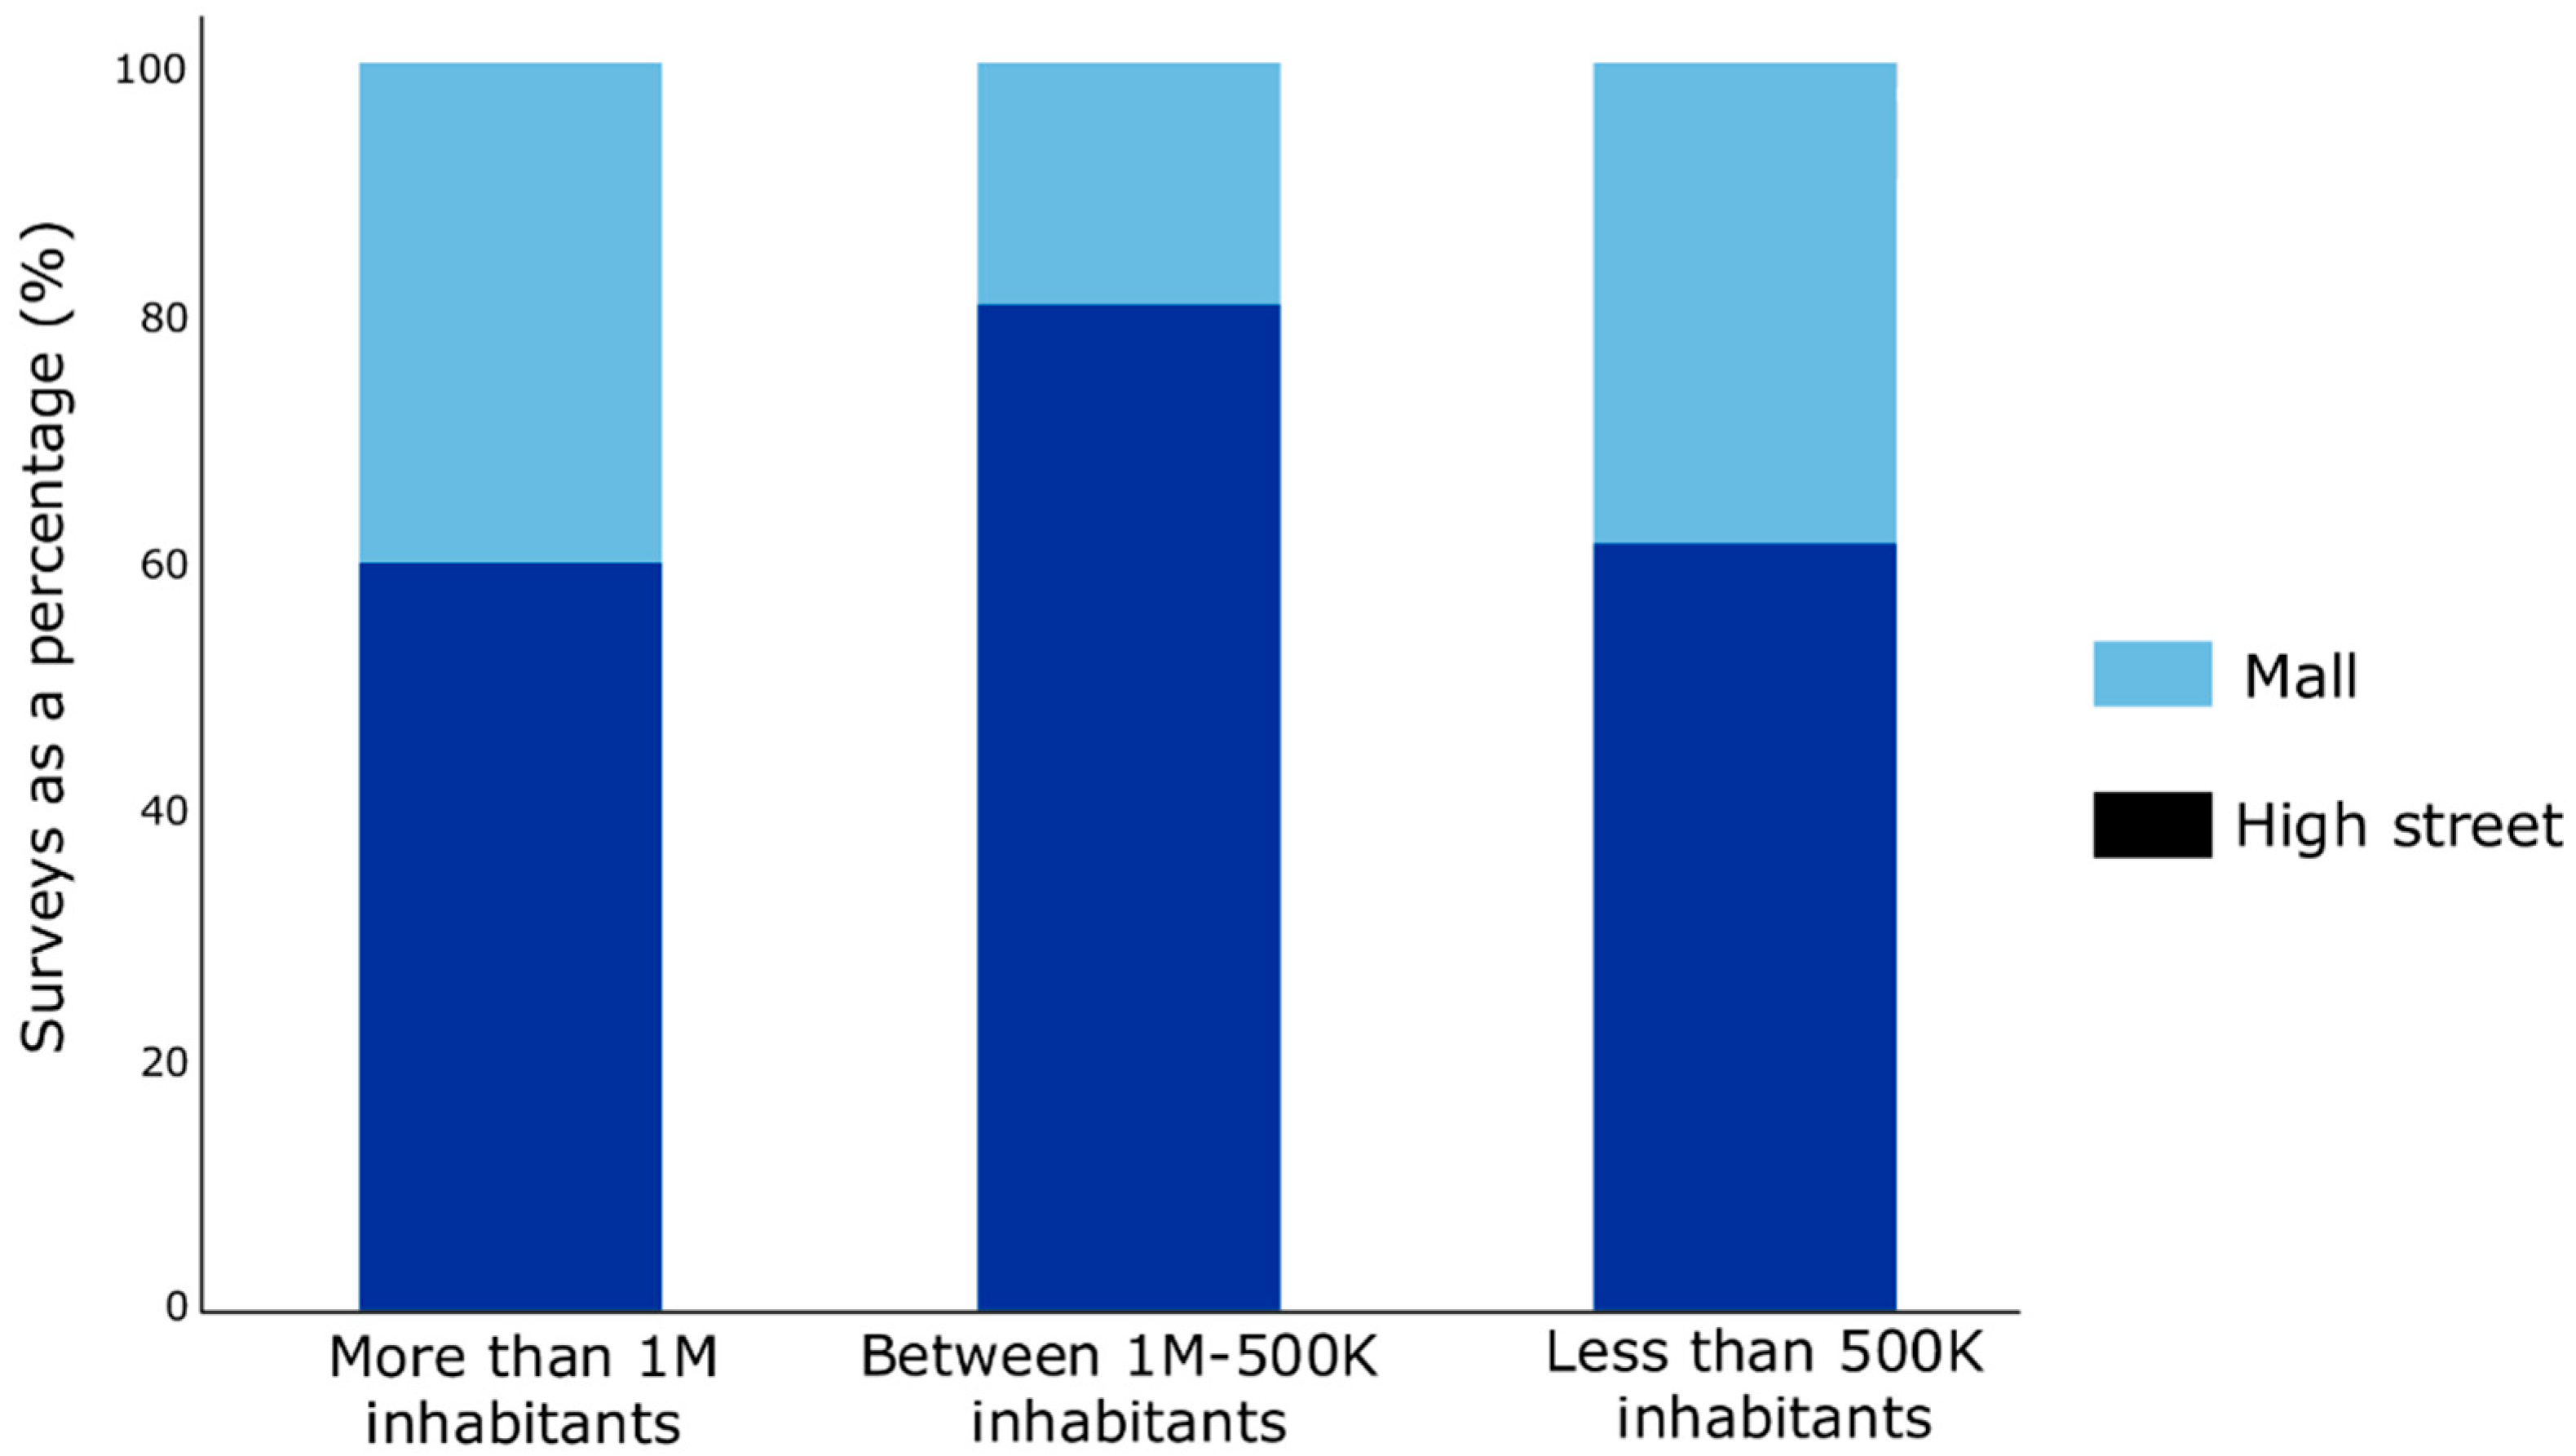
Figure 1. Percentage frequency of responses in street-level stores and shopping malls, for large, medium, and small cities. Own elaboration.
Sustainability 17 08690 g001
Figure 2. Map showing store locations, distinguishing between street-level and shopping mall outlets (left). Number of interviews per store (CTF: Cortefiel, SPF: Springfield, WS: Women’secret), city, and store name (if multiple stores exist in the same city). Authors’ own elaboration, with maps generated in the annexes.
Sustainability 17 08690 g002
Figure 3. Participants’ distribution by gender and age categories. Own elaboration.
Sustainability 17 08690 g003
Figure 4. Heatmap showing the means of transportation used by participants, distinguishing between large, medium, and small cities, and within them, between street-level and shopping mall stores. The color scale represents the percentage of participants using each mode of transport. Authors’ own elaboration.
Sustainability 17 08690 g004
Figure 5. Bar chart showing the distribution of participants who walk to the store, distinguishing between large, medium, and small cities. Values represent the percentage of participants in each city size category. Authors’ own elaboration.
Sustainability 17 08690 g005
Figure 6. Use of trips for purposes other than TENDAM’s omnichannel service, distinguishing between single-purpose and multi-purpose trips across pickups, returns, and combined pickup and return. Percentages indicate the share of participants in each category. Authors’ own elaboration.
Sustainability 17 08690 g006
Figure 7. Proportion of participants by service type (pickups, returns, and combined pickup and return) and by the number of additional activities conducted during their trip to the store. Authors’ own elaboration.
Sustainability 17 08690 g007
Figure 8. Self-reported travel time (in minutes) by service type (pickups, returns, and combined pickup and return). Authors’ own elaboration.
Sustainability 17 08690 g008
Figure 9. Carbon footprint difference between the omnichannel and pure player models, by service type (pickups, returns, and combined pickup and return). Authors’ own elaboration.
Sustainability 17 08690 g009
Figure 10. Comparison of the carbon footprint between omnichannel and pure player models across individual stores. Each store is identified on the x-axis with its corresponding city, and the shopping mall name is specified when more than one store is located in the same city (CTF: Cortefiel, SPF: Springfield, WS: Women’secret). Authors’ own elaboration.
Sustainability 17 08690 g010
Figure 11. Details of accessibility maps by transport mode: walking (left column), car (central column), and metro (right column). Each panel (AI) corresponds to a different city, illustrating the catchment areas around the stores for each transport mode. Authors’ own elaboration with maps generated in the annexes. The colored areas in the maps indicate the zones with the highest probability of customer origin for walking and car transport modes to the stores. In the metro maps, the red points represent metro stations, while the circles delimit the stations that can be reached from each store, after accounting for the walking time from the nearest stations to the shops.
Sustainability 17 08690 g011
Table 1. Summary of interviews conducted in each city. Population reported by [51]. Authors’ own elaboration.
ThresholdCityPopulation
[51]
SurveysTotal%
Large
>1,000,000 inh.
Madrid3,416,771869116337.4
Barcelona1,702,547294
Medium
500,000–1,000,000 inh.
Valencia825,94837397531.4
Sevilla687,488279
Zaragoza686,986323
Small
<500,000 inh.
Bilbao348,08936896831.2
Valladolid300,61865
Oviedo224,883119
A Coruña111,18067
Cádiz111,180111
Cáceres96,215238
3106
Table 2. Variables considered from the surveys. Own elaboration.
DomainVariable
GeographyCity
Madrid, Barcelona, Valencia, Sevilla, Zaragoza, Bilbao, Valladolid, Oviedo, A Coruña, Cádiz, Cáceres
Store
Cortefiel, Women’secret, Springfield
MobilityMode of transport
walking, car, taxi, train, e-bike/e-scooter, subway, motorbike, bus
Car type
diesel, gasoline, electric, hybrid, other
Travel time
minutes
BehaviorChannel
click and collect, return, booth
Trip ChainingOther activities to do
Number of other activities
DemographyAge, gender
Table 3. Average car speeds in the city center’s included in the study. Own elaboration with online data available from DGC maps.
CityAverage Speed (City Center)
Madrid24 km/h
Barcelona21 km/h
Valencia25 km/h
Sevilla20 km/h
Zaragoza19 km/h
Bilbao28 km/h
Valladolid23 km/h
A Coruña20 km/h
Oviedo21 km/h
Cádiz18 km/h
Cáceres17 km/h
Table 4. GHG emissions for the Spanish car fleet by fuel type. Own elaboration with IDAE online data.
Fuel TypeConsumption per 100 kmK (g CO2-eq/km)
Diesel6–7 L261
Gasoline7–8 L230
Electric15–20 kWh75
Plug-in Hybrid3–4 L + 15–20 kWh100
Gas8–10 L166
Table 5. Reference values of K for other modes of transport. Own elaboration with data provided by IDAE and the Madrid City Council.
Mode of TransportK (g CO2-eq/km)
Metro27.99
Bus49
Electric scooter25
Motorcycle53
Electric motorcycle17
Electric bicycle3
Train14
Table 6. Summary of emissions considered for each service type in pure players (g C O 2 e q ). Own elaboration.
ServiceMinimumMaximumAverage
Collection77015001137
Return100020001500
Collection and return180030002400
Table 7. Results of questionnaire response consistency analysis. Own elaboration.
TestCollection
(n = 2726)
Return
(n = 304)
Collection and Return
(n = 76)
Inconsistent responses010
Uncommon responses272630476
Repetitive patterns000
Table 8. Statistical comparison of multi-purpose vs. single-purpose trips across groups. Own elaboration.
ParameterPickups vs. ReturnsPickups vs. BothReturns vs. Both
Chi-squared18.550.1945.695
P-value0.00001640.650.017
Effect size0.070.0080.122
Statistical power0.990.070.665
Table 9. Emission ranges for the omnichannel and pure player models by service type (g C O 2 e q ) . Own elaboration.
ServiceOmnichannelPure Players
Pickups170–280770–1000
Returns280–6001000–2000
Pickup and Return446–5131800–3000
Disclaimer/Publisher’s Note: The statements, opinions and data contained in all publications are solely those of the individual author(s) and contributor(s) and not of MDPI and/or the editor(s). MDPI and/or the editor(s) disclaim responsibility for any injury to people or property resulting from any ideas, methods, instructions or products referred to in the content.