Article

Areal Assessment in the Design of a Try-Out Grid-Tied Solar PV-Green Hydrogen-Battery Storage Microgrid System for Industrial Application in South Africa

1
Department of Industrial Engineering, Stellenbosch University, Cape Town 7600, South Africa
2
Fraunhofer Institute of Machine Tools and Forming Technology, IWU, 09126 Chemnitz, Germany
*
Author to whom correspondence should be addressed.
Sustainability 2025, 17(19), 8649; https://doi.org/10.3390/su17198649
Submission received: 8 August 2025 / Revised: 13 September 2025 / Accepted: 19 September 2025 / Published: 26 September 2025

Abstract

The carbon emission reduction mission requires a multifaceted approach, in which green hydrogen is expected to play a key role. The accelerated adoption of green hydrogen technologies is vital to this journey towards carbon neutrality by 2050. However, the energy transition involving green hydrogen requires a data-driven approach to ensure that the benefits are realised. The introduction of testing sites for green hydrogen technologies will be crucial in enabling the performance testing of various components within the green hydrogen value chain. This study involves an areal assessment of a selected test site for the installation of a grid-tied solar PV-green hydrogen-battery storage microgrid system at a factory facility in South Africa. The evaluation includes a site energy audit to determine the consumption profile and an analysis of the location’s weather pattern to assess its impact on the envisaged microgrid. Lastly, a design of the microgrid is conceptualised. A 39 kW photovoltaic system powers the microgrid, which comprises a 22 kWh battery storage system, 10 kW of electrolyser capacity, an 8 kW fuel cell, and an 800 L hydrogen storage capacity between 30 and 40 bars.

1. Introduction

The Industrial Revolution stimulated technological and economic growth, as well as better standards of living, but also led to a significant rise in carbon emissions due to increased fossil fuel use. This marked the beginning of human-driven climate change, and ever since, there has been an undisputed link between levels of carbon emissions and the Industrial Revolution. To date, carbon emissions remain the greatest threat to achieving sustainable development in the Fourth Industrial Revolution [1]. However, the fourth industrial revolution has the potential to support sustainable development by using advanced technologies to reduce carbon emissions through cleaner production, smart energy systems, and low-carbon solutions [2]. Reducing carbon emissions requires a multifaceted approach. Green hydrogen will play a significant role in the journey to decarbonization and carbon neutrality, due to its versatility and zero-emission combustion [3]. Carbon emission reduction has a positive impact on the United Nations (UN) Sustainable Development Goal 13, which focuses on taking urgent action to combat climate change and its impacts. This project also aligns with Goals 7 and 9, which focus on ensuring access to affordable, reliable, sustainable, and modern energy for all, and building industry, innovation, and infrastructure, respectively [4]. Green hydrogen is hydrogen produced through renewable energy sources, such as solar, wind, and hydroelectric power. Alternative green hydrogen production processes include electrolysis of water, biological methods such as bio-photolysis and dark fermentation, thermochemical water splitting, photocatalytic water splitting, and biomass gasification [3]. The electrolysis process using renewable electricity is the most mature and widely discussed route for producing green hydrogen [5]. This article discusses the areal assessment through site evaluation of the design of a try-out grid-tied green hydrogen microgrid in Cape Town, South Africa. This microgrid is to be used for different research themes in the green hydrogen value chain. The value chain starts from components including manufacturing, microgrids assembly and installation, hydrogen production, storage, transportation, distribution, and utilisation [6].

2. Overview of Green Hydrogen Initiatives in Africa

Africa has great potential for green hydrogen generation, primarily due to its abundant renewable energy resources, particularly solar and wind. Additionally, Africa has abundant land with growing investment opportunities. Green hydrogen generation in Africa has been supported by various initiatives; for example, in South Africa, a green hydrogen initiative named HySA was launched in 2008 to spearhead the expansion of the hydrogen technology value chain. A number of initiatives have also been reported in Egypt, Algeria, Morrocco, Uganda, and Nigeria [1]. In Southern Africa, green hydrogen production is predominantly pushed by South Africa and Namibia, and other countries seem to have no country initiatives to support the green hydrogen economy [7]. The green hydrogen evolution is expected to bring economic opportunities in Africa; for example, the Hyphen project in Namibia is expected to bring 13 billion USD worth of investment to the country [8]. However, the green hydrogen revolution in Africa remains a fantasy under the existing geopolitical situation [9]. Despite all countries in Southern Africa having renewable energy policies, there is still a need to develop specific hydrogen energy policies in all countries [10]. International cooperation plays a crucial role in the advancement of green hydrogen, as it enables the sharing of knowledge, technologies, and resources necessary for the development of the green hydrogen economy. Africa can leverage the international partnerships, as there are several green hydrogen projects and partnerships globally [9]. Collaborative efforts can address technological uncertainties, enhance research initiatives, and facilitate the establishment of effective policies and solutions for a sustainable hydrogen value chain [11]. The cooperation assists in dealing with operation bottlenecks for growth that African countries face in developing green hydrogen economies. For example, South Africa faces several challenges in like competing demands for clean water. The anticipated increase in global demand for green hydrogen will escalate the need for water and additional resources that may hinder competitiveness. Therefore, cooperation, strategic planning and resource management are vital to ensure that the growth of the green hydrogen sector aligns with other sustainability goals [12]. Germany and South Africa signed a cooperation agreement that focuses on developing the hydrogen markets, facilitating imports, and technology transfer [13]. This article presents evidence of such cooperation between South Africa and Germany in the design of a try-out grid-tied green hydrogen microgrid. The microgrid will serve as a research lab for the various thematic areas in the green hydrogen economy. Different stakeholders can use results from the microgrid to ensure data-driven decision-making.

3. Green Hydrogen Microgrids Using Solar Photovoltaic Systems

An electrical microgrid consists of a small-generation unit, the energy storage systems, and electrical loads [14]. Microgrids can be isolated or tied to the utility grid. Standalone microgrids offer autonomous power, making them ideal for remote settlements, while grid-connected microgrids should smoothly integrate with the main utility grid [15]. This means that grid-tied systems face a lot of complicated interconnection regulations. In the case of this article’s design, the city of Cape Town provides guidelines to safe and legal small-scale embedded generation. The city encourages the installation of private small-scale embedded generation systems, particularly rooftop solar photovoltaic systems. There are basically three typical configurations for photovoltaic systems, which are the grid-tied system, the grid-tied hybrid photovoltaic system, and the standby photovoltaic system interconnected with the grid. The grid-tied system can be built with or without an export to the grid. A bi-directional meter is required to export electricity into the grid, and a reverse power blocking is required for a grid-tied system without export. The grid-tied hybrid system has a storage system built in and can operate during load shedding. Installations must be performed by accredited companies and licenced professionals [16]. This, however, does not mean that the isolated microgrids do not have any challenges. There are global challenges like technological hurdles, and high installation and operational costs. Although recent trends suggest a decline in capital expenditures for hydrogen production, this highlights the importance of addressing factors such as energy storage and water treatment for the practical implementation of these systems. Overall, significant advancements are required for wider economic viability [17].
The microgrid concept presents a rare opportunity to demonstrate a proof of concept [18]. This implies that the behaviour and operation of the microgrid can be tested on a small scale before implementing large projects. A green hydrogen microgrid is composed of a renewable source of electricity, hydrogen generation, storage, utilisation, and external loads. The storage systems improve the grid resilience and stability when renewable sources become intermittent and unavailable. A solar photovoltaic system-powered green hydrogen microgrid is driven by a solar photovoltaic system that supplies power to the electrolysers. The electrolysers are responsible for the electrolysis of water, in which water is split into hydrogen and oxygen. The hydrogen is stored in storage tanks from which it will be used for the regeneration of electricity through a fuel cell that then supplies electricity to the load. Lithium-ion battery storage can also be used as secondary storage [18]. The grid acts as a backup to the microgrid. It is essential to optimise the design of the microgrid to suit the design requirements. The optimisation requires an understanding of the electrical load profile, weather data, economic data, and operational constraints [19,20]. Some of the constraints include capacity limits, operational limitations of the hydrogen storage system, and integrity of the energy supply system [21]. Carbon emission constraints can also be added to the optimisation [22]. In summary, the optimisation process involves a techno-economic assessment of the operation of the microgrid during its lifetime [23]. Optimisation of the design ensures that the hydrogen storage operates within its maximum capacity, adheres to safety and efficiency standards, and meets energy demands without exceeding available resources.

4. Site Evaluation for the Green Hydrogen Microgrid

The green hydrogen microgrid will be installed at a factory facility in Cape Town, South Africa. The factory is a jobbing fabrication facility, specialising in custom, batch manufacturing of automotive accessory aluminium components, predominantly using the tungsten-inert-gas welding process. The site evaluation for the green hydrogen microgrid involves energy auditing, assessment of weather data, and investigation of the available roof space for solar photovoltaic system installation. This information is input into the design of the microgrid and the technical details specification of the components of the microgrid. A similar approach was followed by Monem Hazem et al. [20] and Tatar et al. [22]. There is a need to balance renewable energy systems for hybrid systems [14]. This case is based on one source of renewable supply, which is the solar photovoltaic system. Therefore, only the location irradiation data shall be considered. Before this evaluation, the site had been in operation for seven (7) months. The site evaluation considered the available electrical readings at the time of the study.

4.1. Site Energy Consumption Assessment

An energy audit was conducted at the site to assess the actual energy consumption of the factory. The data generated from the energy audit helps the effective design and implementation of the green hydrogen microgrid. The energy audit also provided the associated costs, the monthly consumption, average daily consumption, peak load estimation, and load profile. The facility was supplied with a three-phase power supply through a 150 A circuit breaker. The energy audit consisted of energy billing analysis spanning seven months, since the facility had been operating in that current state for that period. These data provided a good starting point and were augmented with an equipment audit. In case of severe changes to the load profile in future, the microgrid would still be grid-tied to provide sufficient backup.

4.1.1. Electricity Price

Table 1 presents the monthly energy bills for the site since the inception of the factory’s operations. The price of electricity increased from R1.8217/kWh to R1.9948/kWh from the fourth month, exclusive of VAT charged at 15% and service charges. The service charges also went up from R63.89/day to R69.96/day during the same period. The overall price, inclusive of VAT and charges, is approximately R3.00/kWh.

4.1.2. Monthly Energy Consumption

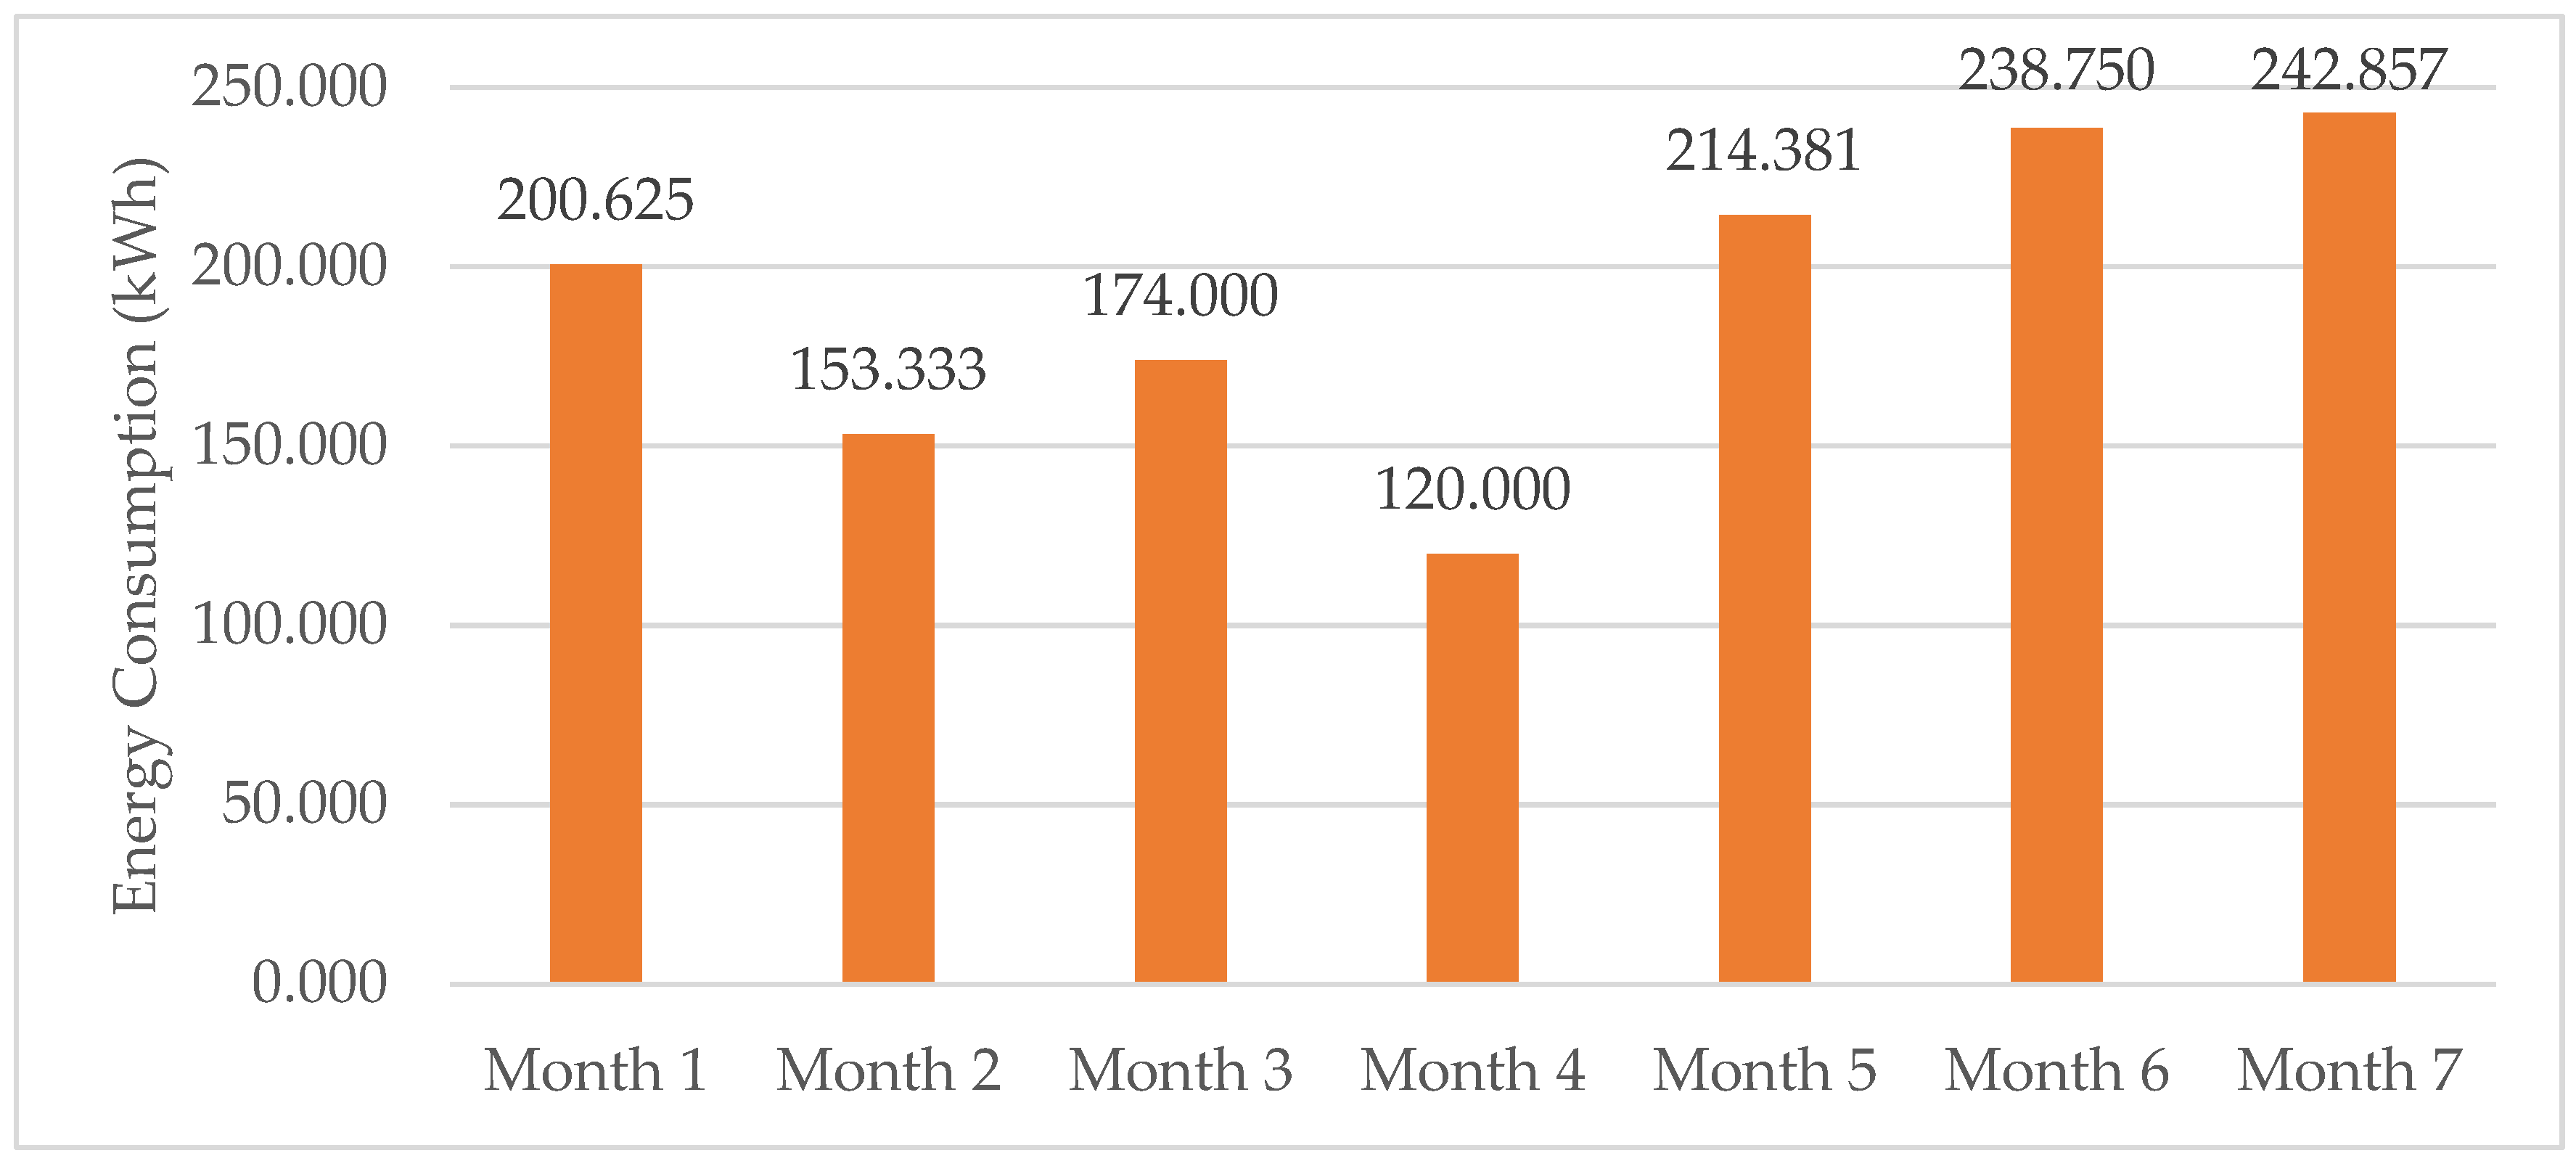
Figure 1 shows the monthly energy consumption of the building. The data presented do not account for the effect of load curtailment in Cape Town during the period. An additional allowance for consumption was considered based on the backup generator running hours. The activity in the factory increased gradually from Month 1 to Month 7 as more equipment was added.

4.1.3. Average Daily Energy Consumption

The average daily energy demand of the site is as shown in Figure 2. The figures in the graph have been adjusted to account for actual production days in a month and applying a zero-consumption assumption when the factory is closed during weekends and public holidays. The average daily load consumption is approximately 192.3 kWh/day. In the absence of data logging, this method would assist in understanding the energy consumption of the facility.

4.1.4. Load Estimation Using Monthly Energy Consumption

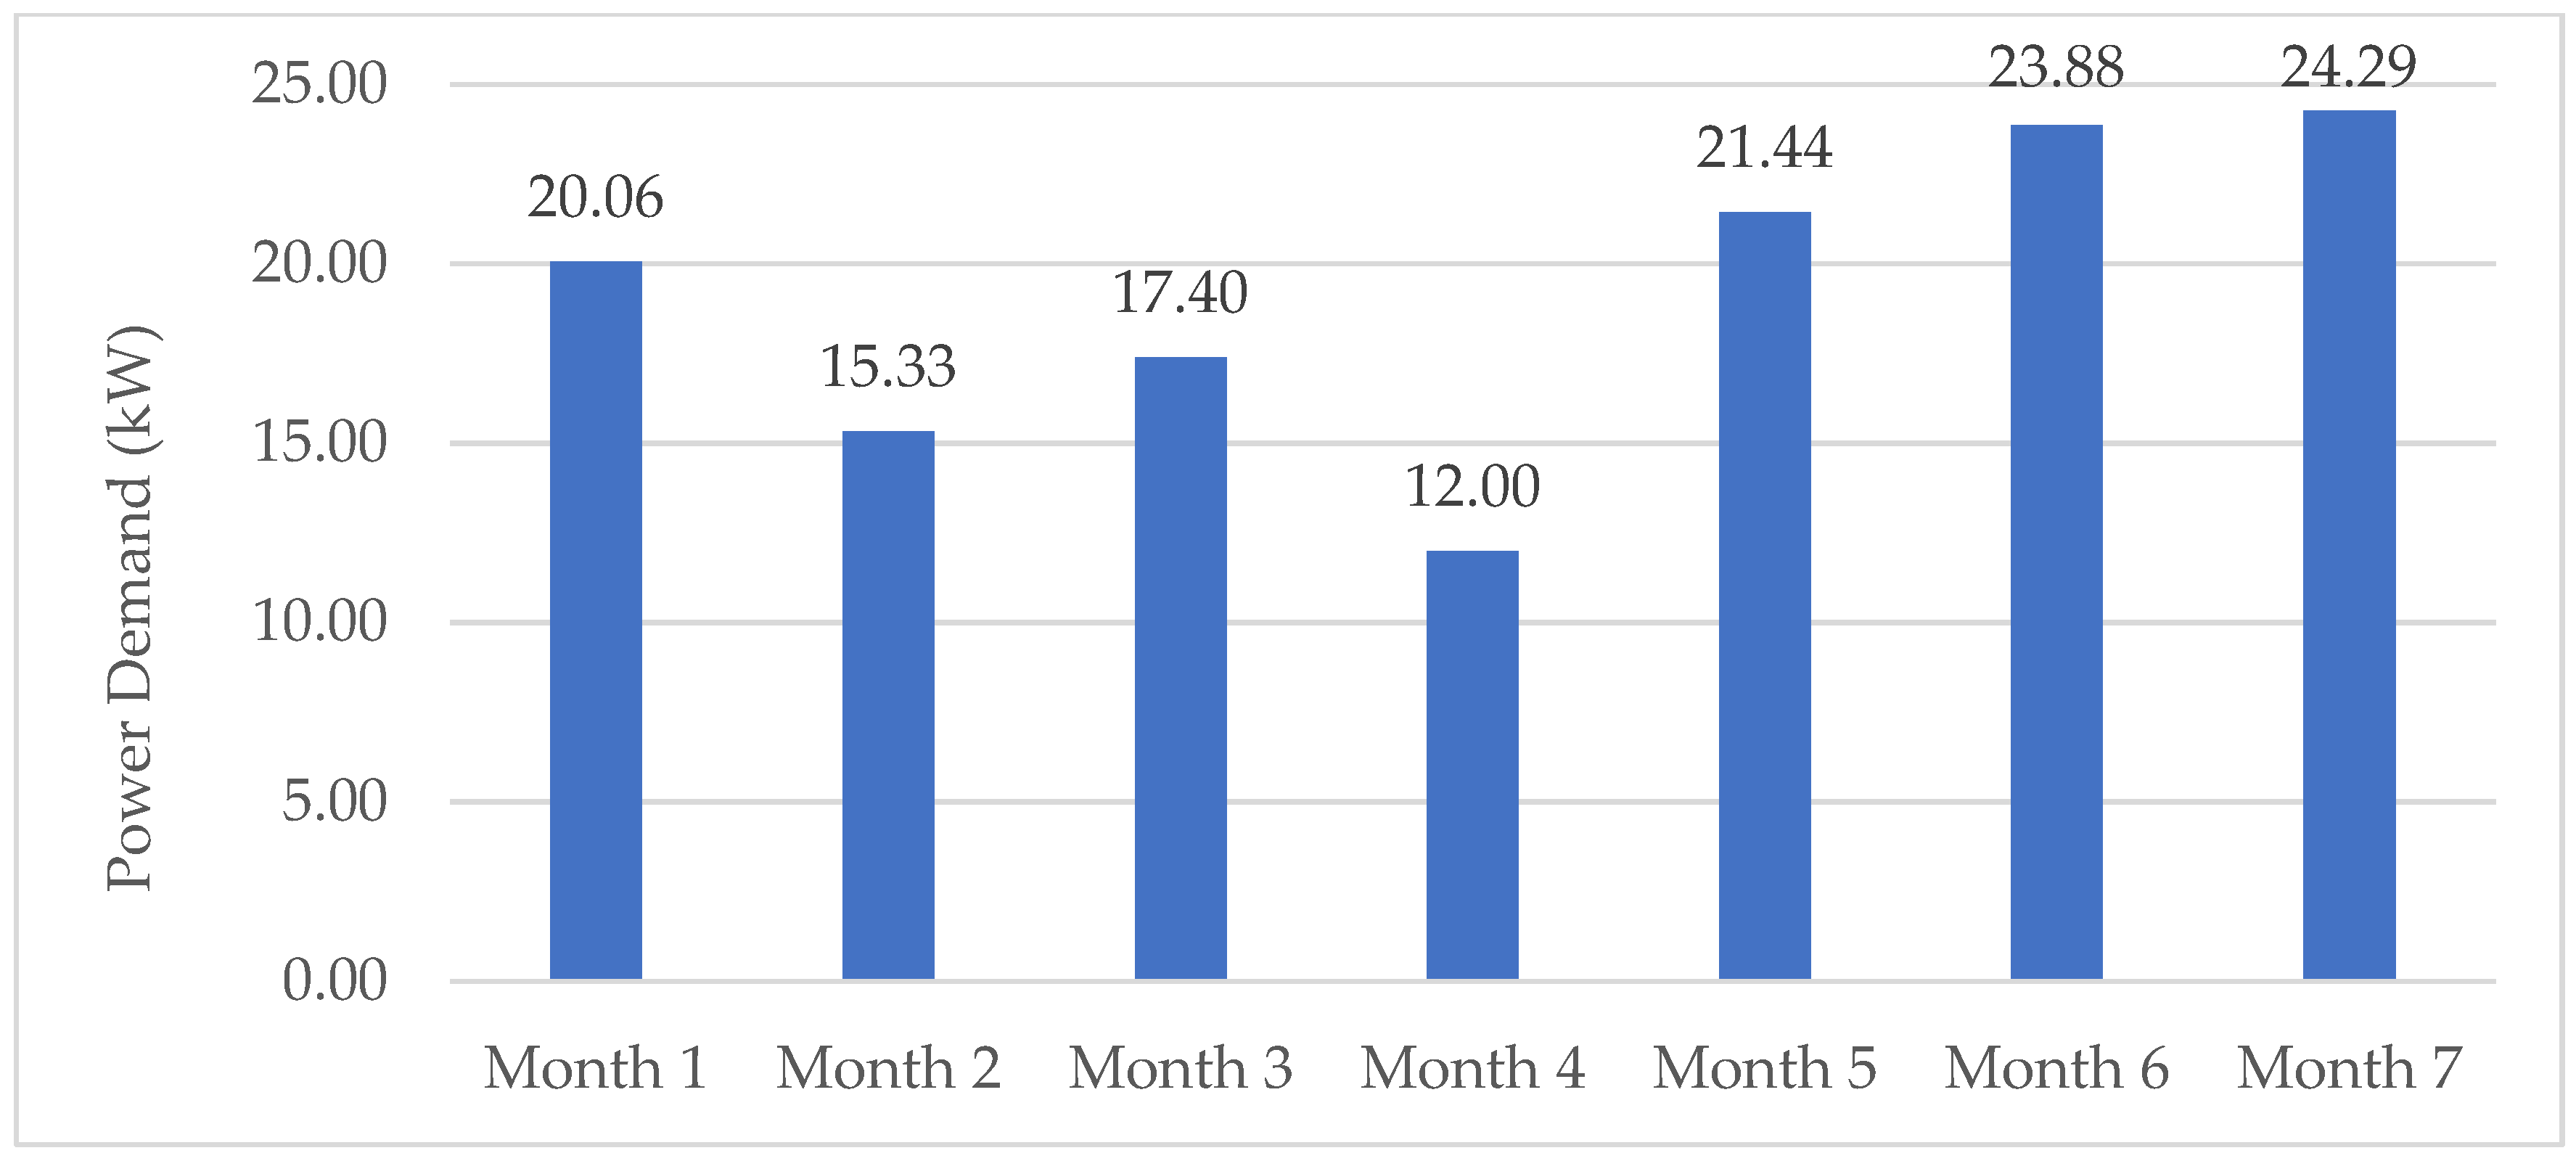
Figure 3 shows the estimated daily load of the site. This graph has been adjusted to account for actual production days by applying a zero-consumption assumption when the factory is closed, as well as a 10 h daily operation for the factory.

4.1.5. Site Load Profile-Monitoring

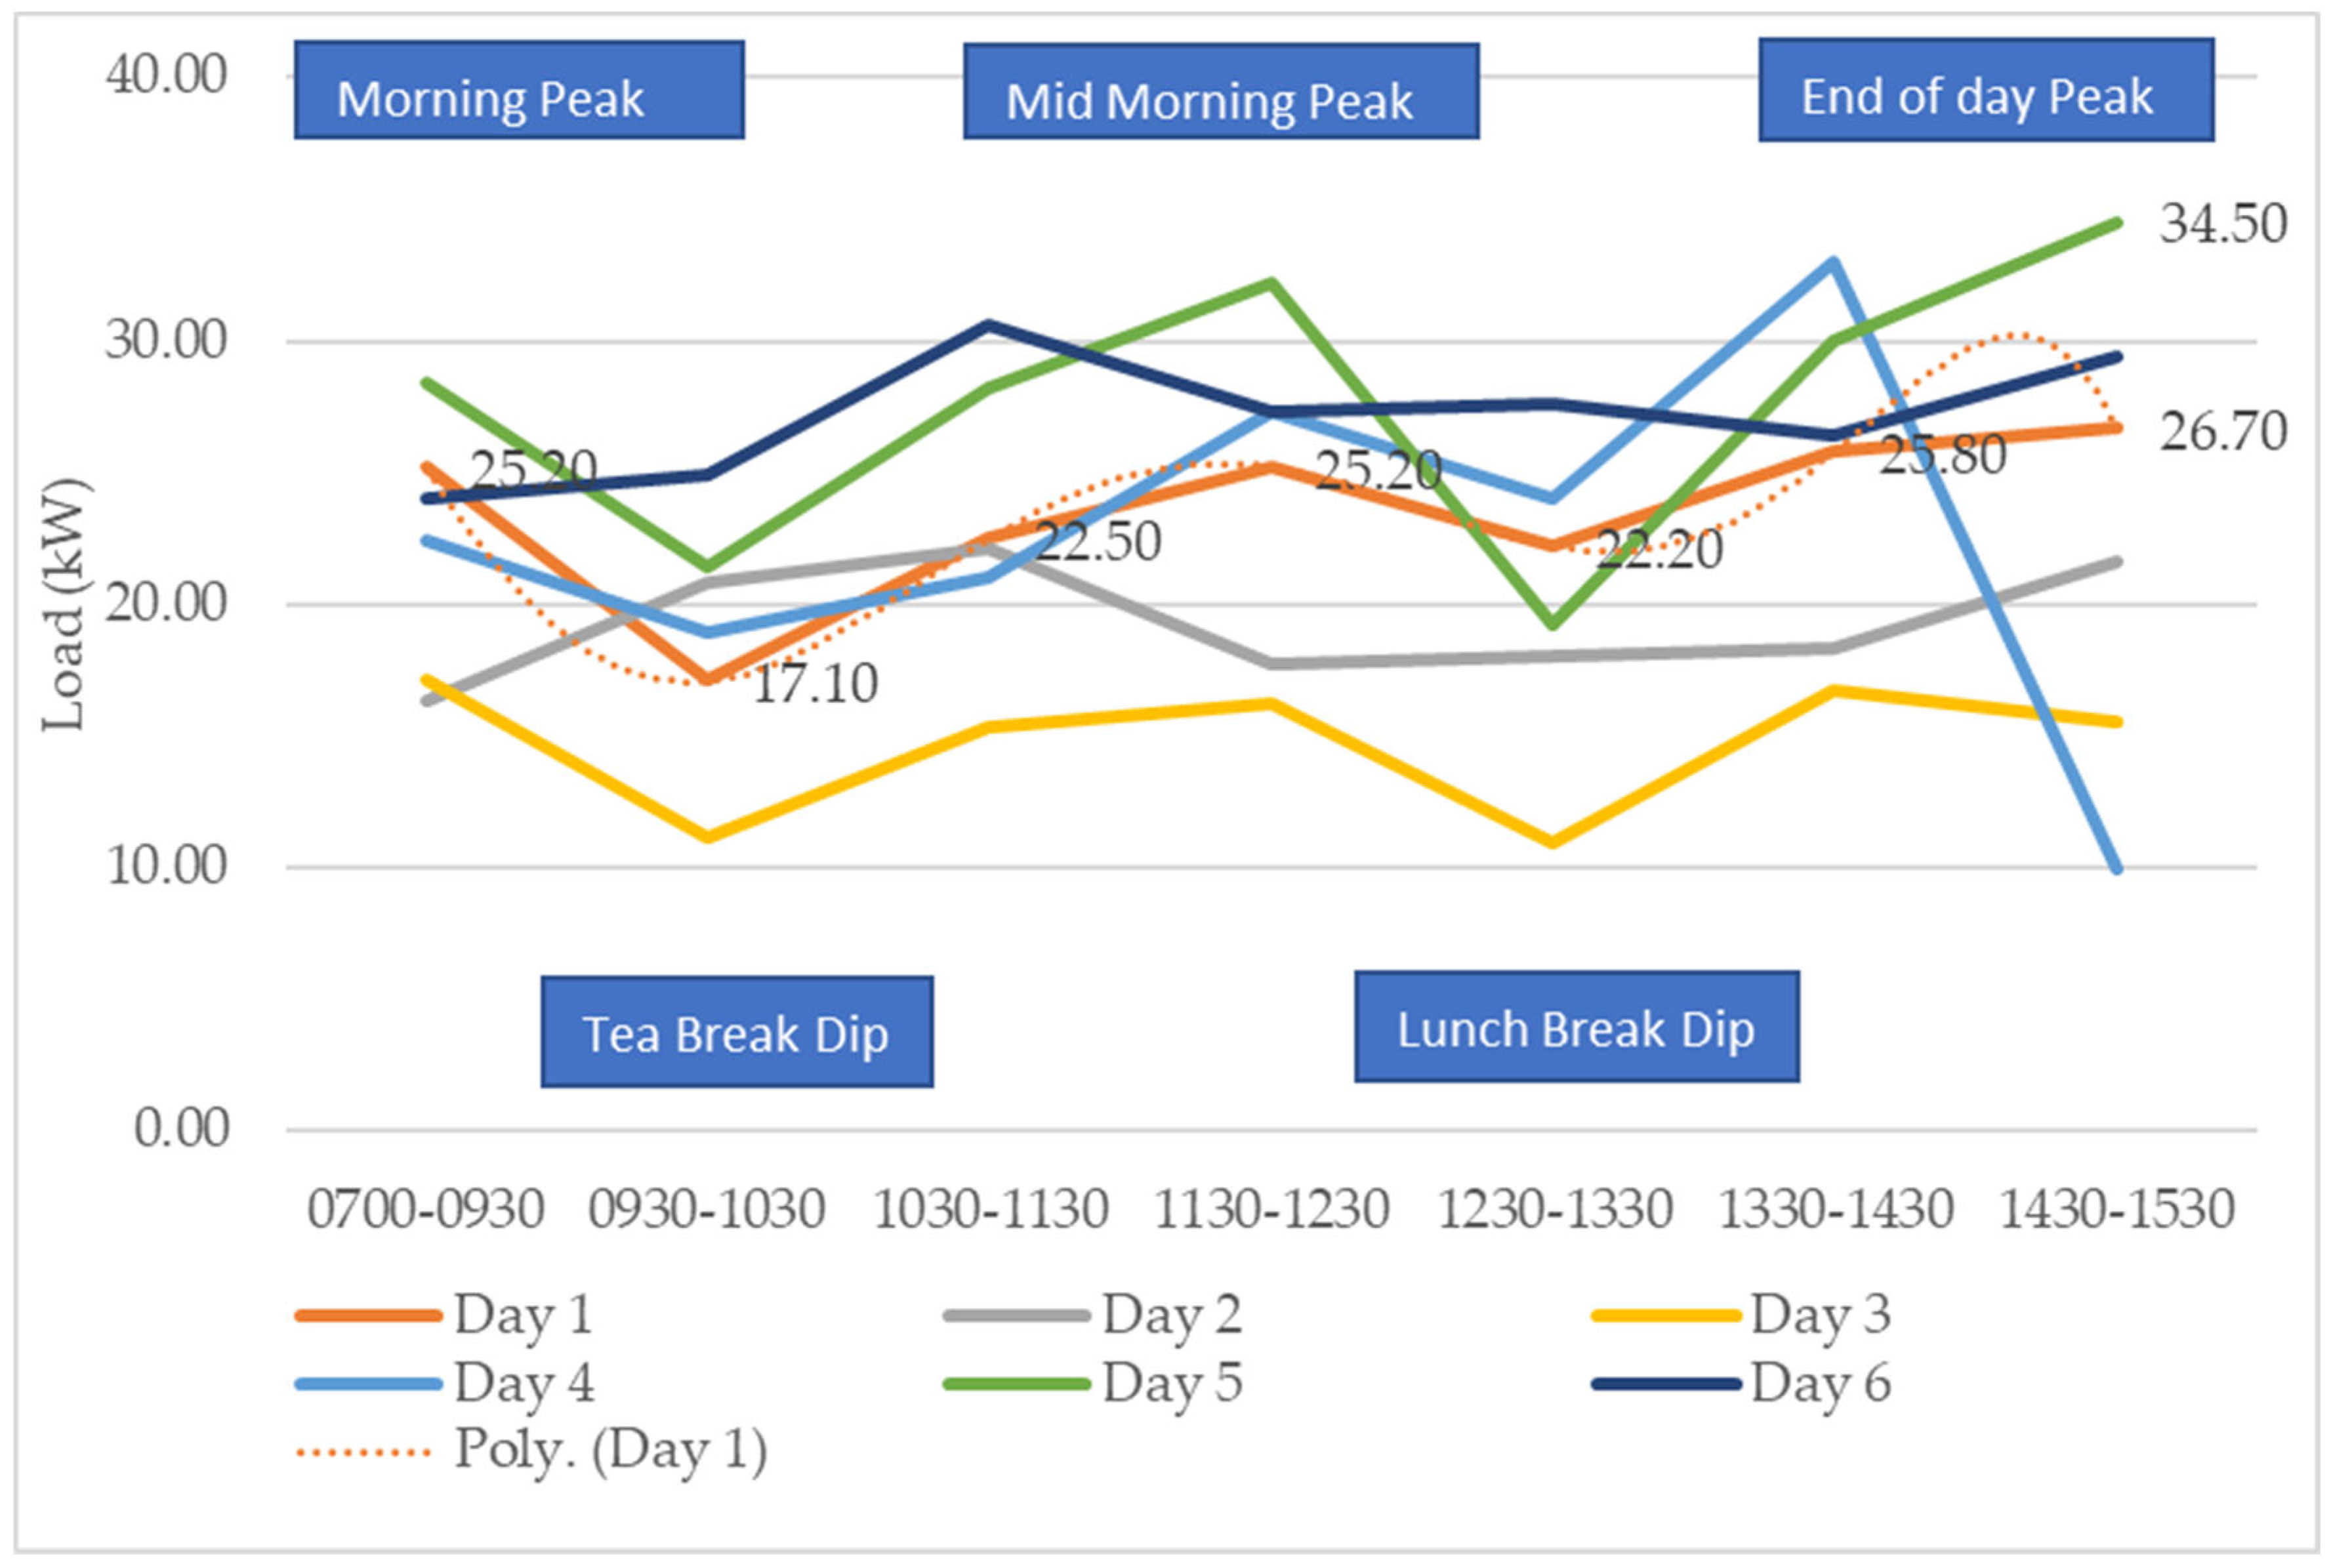
A load profile monitoring process was also conducted, involving regular monitoring of consumption at 30 min and 1 h intervals. The process was conducted in November 2022. The sample results from the process are shown for six days in Figure 4. The consumption and load profile pattern shows that there is a morning peak, a tea break dip, a mid-morning peak, a lunch break dip and an end-of-day peak. A maximum peak load of 34.5 kW was recorded during this period, while an average load of 22.47 kW was recorded.

4.1.6. Site Idle Load Consumption

It was also crucial to understand the idle load consumption of the building. This was performed to ascertain the backup battery power required to support the idle load overnight in the absence of sunlight when the factory is closed. The idle load also indicates excess power that can be exported to the grid over the weekend when the factory is closed. Table 2 indicates that the estimated idle load for the facility was 1 kW.

4.1.7. Walk-Through Energy Audit-Equipment List

A walk-through energy audit was also conducted. The aim was to provide a detailed list of equipment connected to the grid, along with the power rating of each appliance. In this report, only the equipment being used was considered. Table 3 shows the significant equipment in the factory. The total rating of the equipment exceeds 90 kW, although the recorded peak load was only around 34.5 kW.

4.1.8. Back-Up Generator

The facility has a generator in place. The generator capacity is 50 kW. Table 4 presents the values recorded from the generator user interface. Only an average load of 8.10 kW was recorded over the hours the generator has been running.

4.2. Site Roof Space Assessment for Solar Photovoltaic Installation

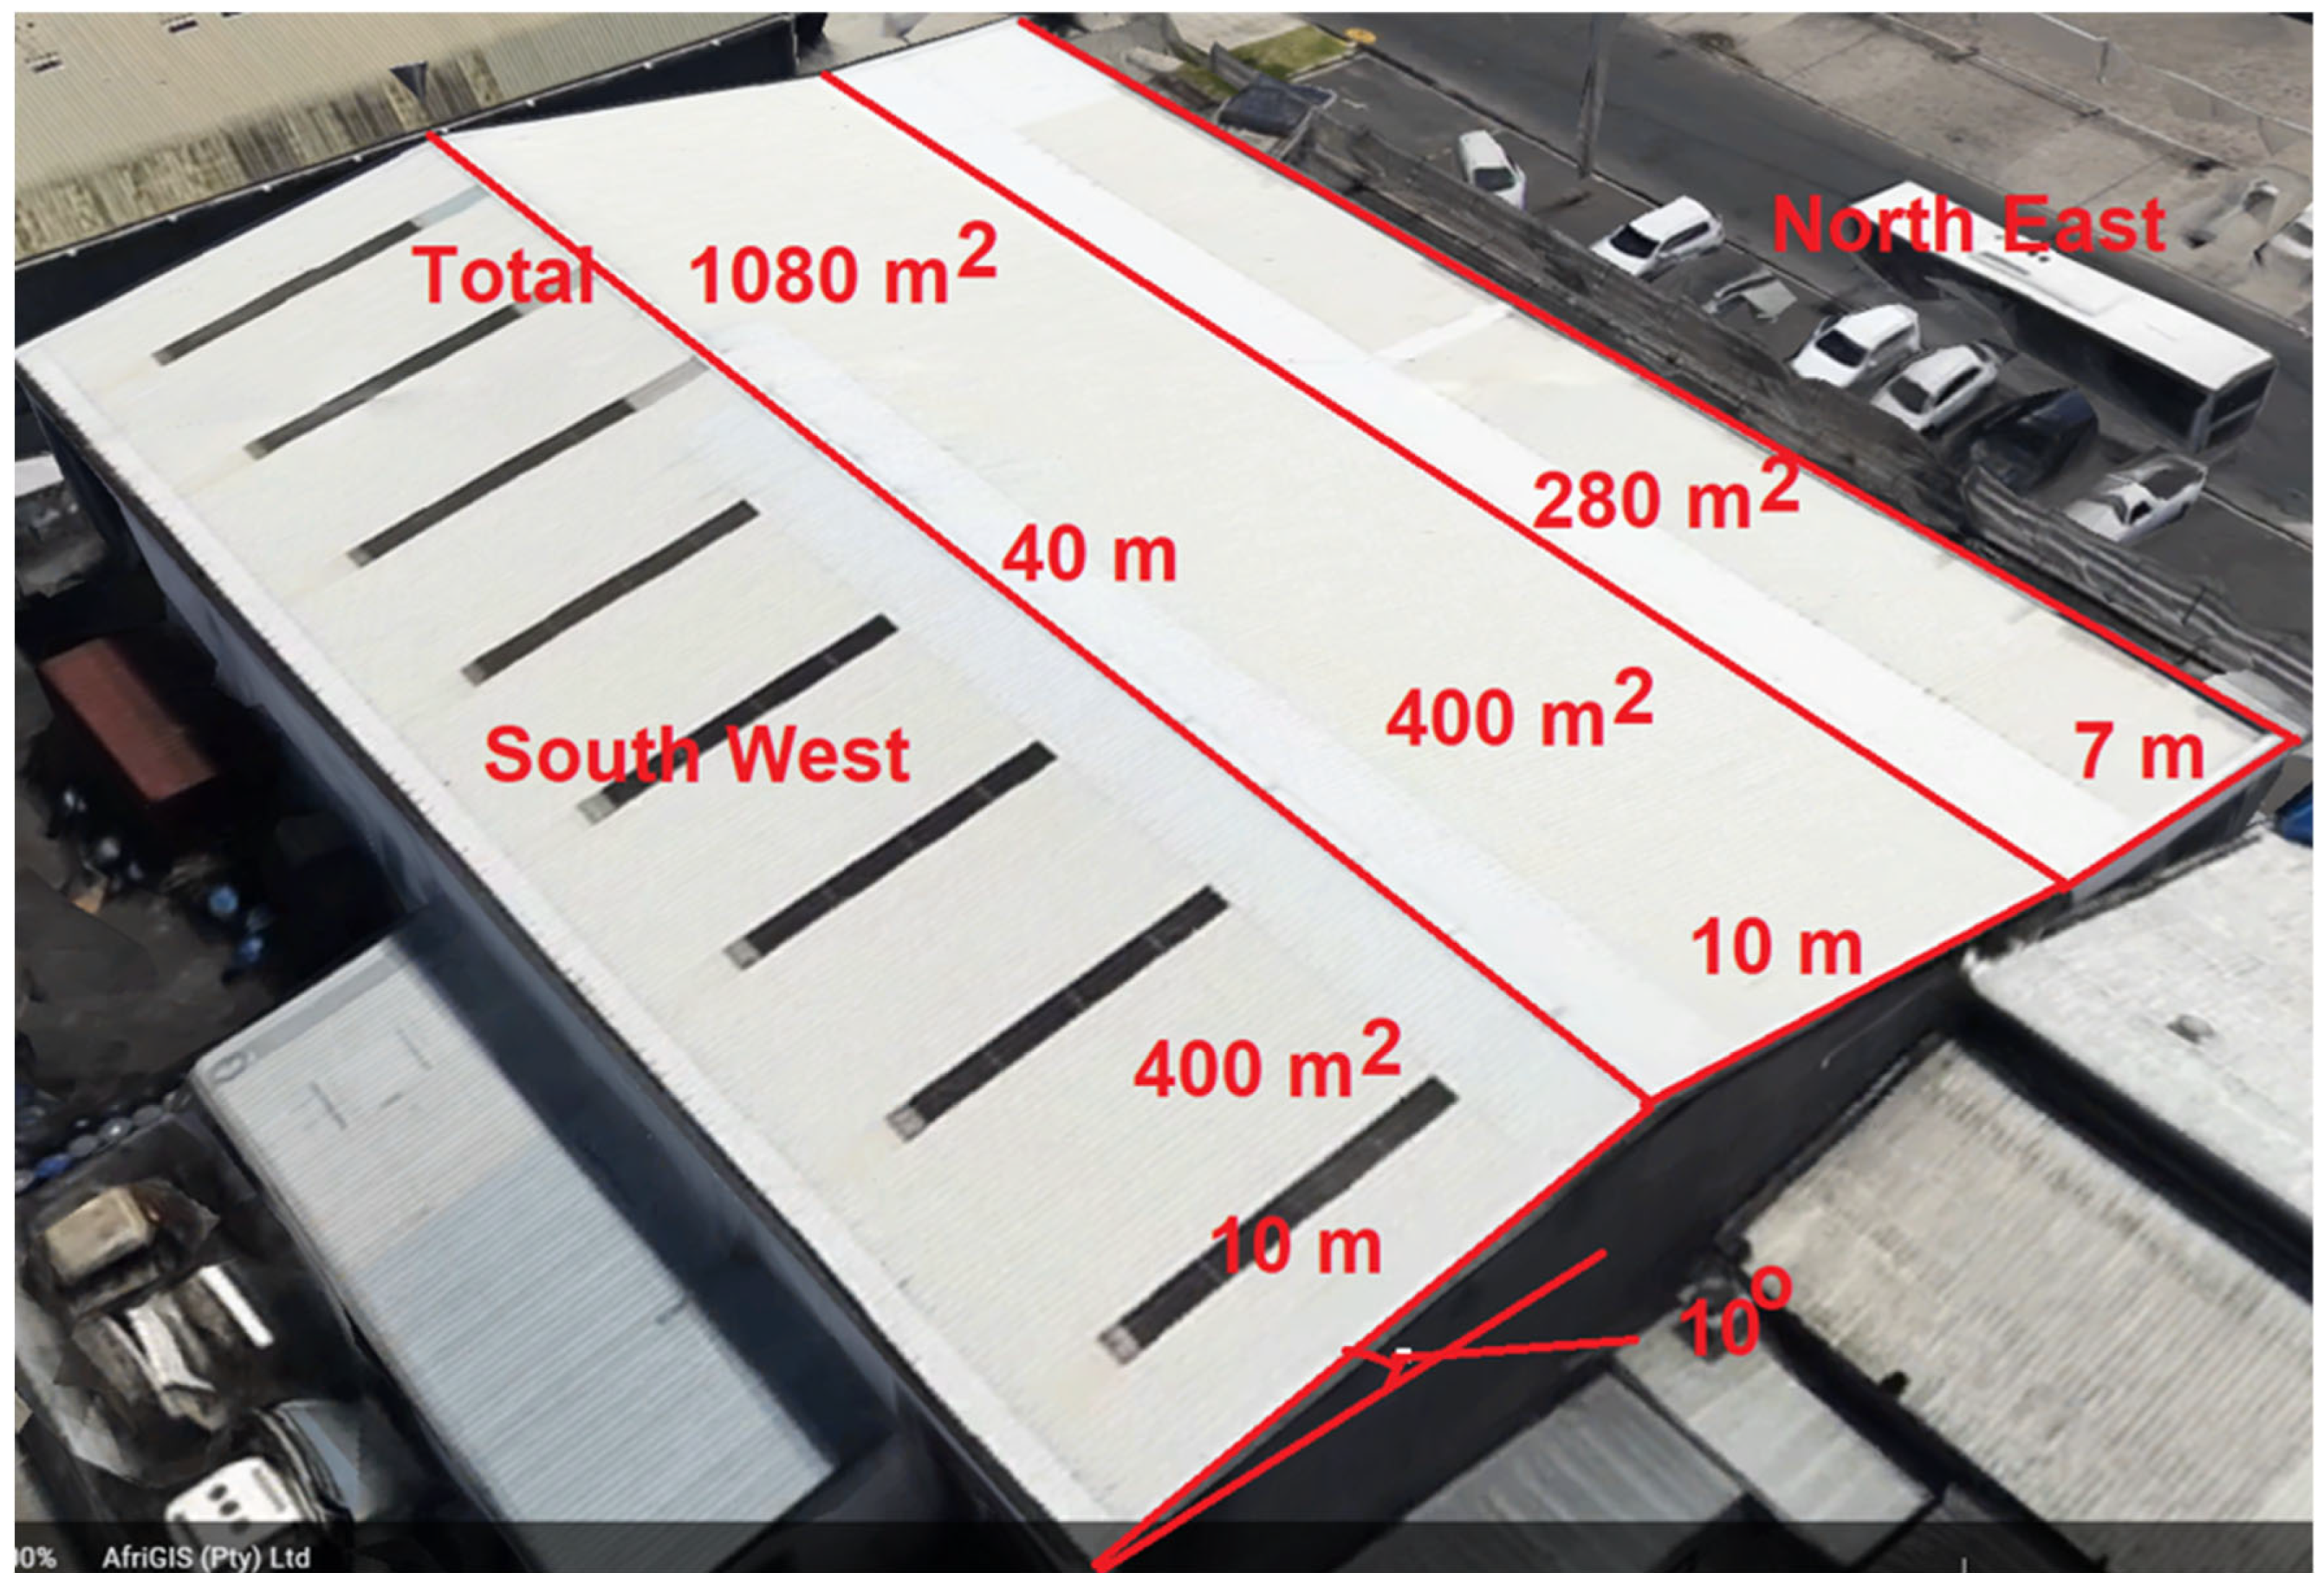
The microgrid shall be installed in Cape Town, South Africa (Latitude −34.022271173316696, Longitude 18.51471623086408). Figure 5 shows a Google Earth image of the site location. It shows the estimated roof dimensions available for solar photovoltaic installation. The site has an estimated total roof area of 1080 m2, and the angle of inclination of the roof is 10°. In the southern hemisphere, the solar panels should be facing north and inclined at the angle of latitude for maximum efficiency. In this case, the roof facing the north-east orientation is not a major disadvantage in the southern hemisphere, as confirmed by insolation data [24]. The rooftop solar photovoltaic system would therefore be mounted on the roof section facing the north-eastern direction with an estimated area of 680 m2.

4.3. Cape Town Weather Data and Site Solar Photovoltaic Potential

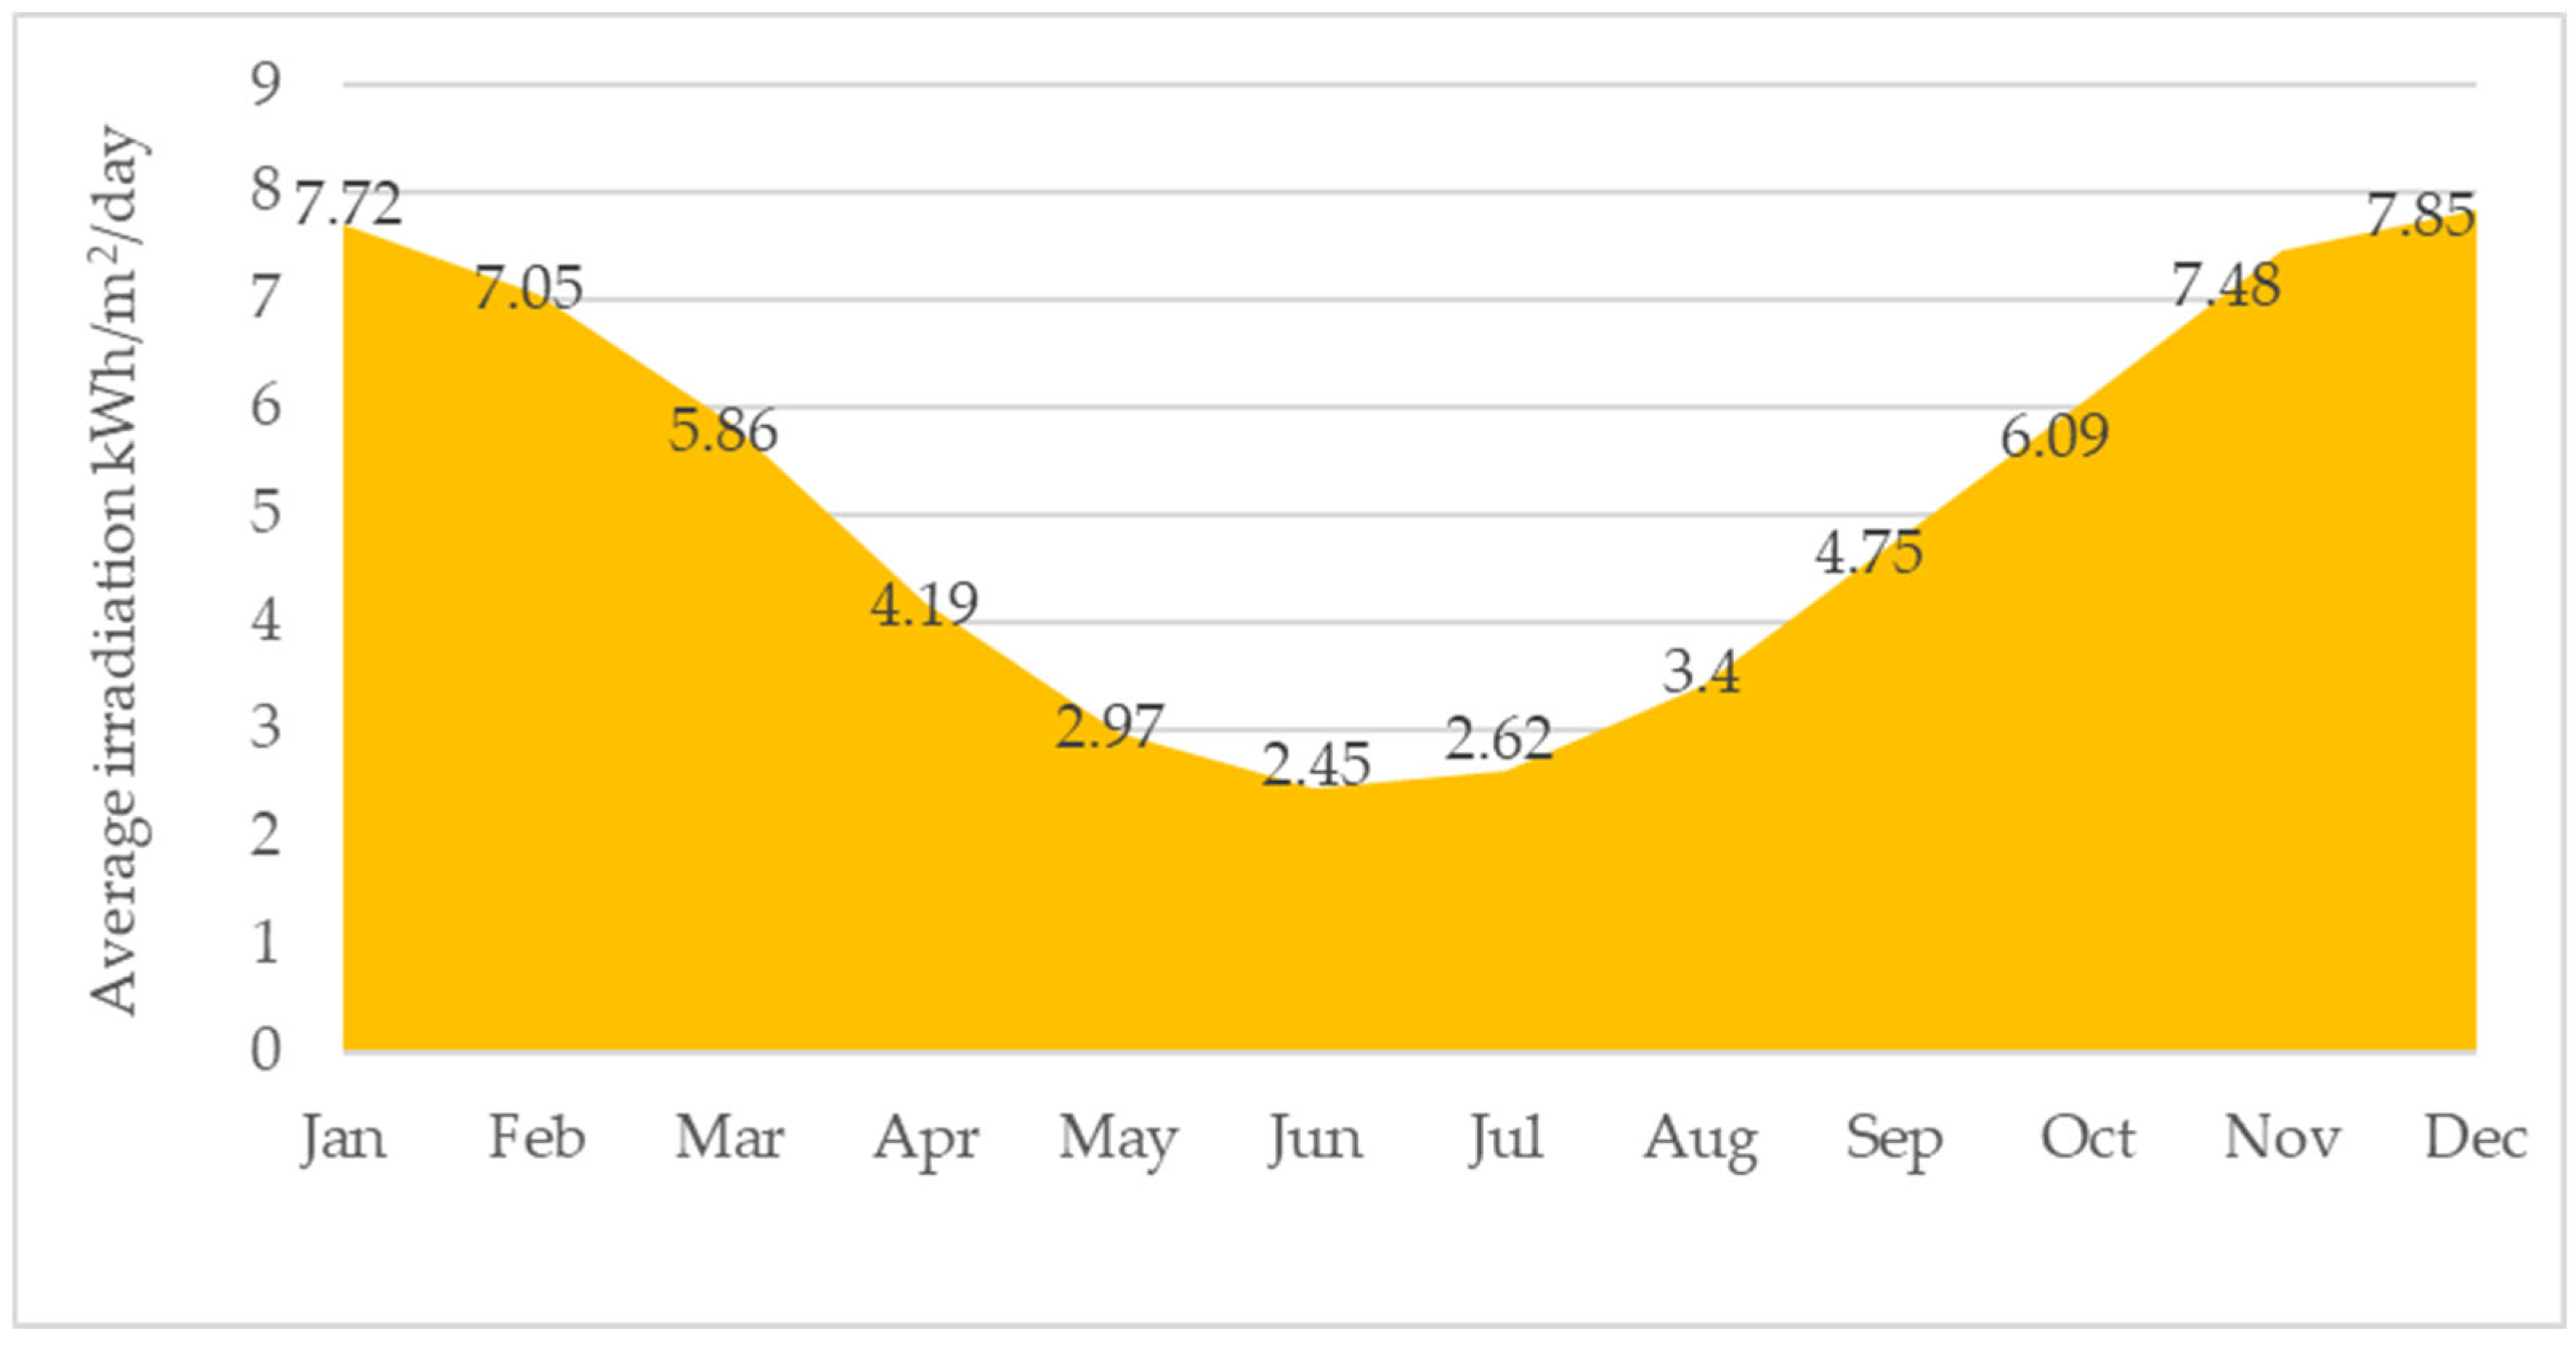
The solar photovoltaic system is dependent on the local weather conditions. Figure 6 shows the annual variation in average daily solar irradiation in Cape Town, according to WeatherSpark [25]. These weather data are critical for predicting the performance of the solar photovoltaic system that powers the green hydrogen microgrid.
The monthly average solar irradiation (kWh/m2/day) shows a clear seasonal pattern. The solar energy potential is highest in December and January, while it drops significantly during the mid-year months, reaching its lowest point in June. Such seasonal variability is crucial for designing green hydrogen systems, as it affects the consistency and reliability of solar-powered hydrogen production throughout the year. The design of the solar photovoltaic system was based on 5.8 peak sun hours.
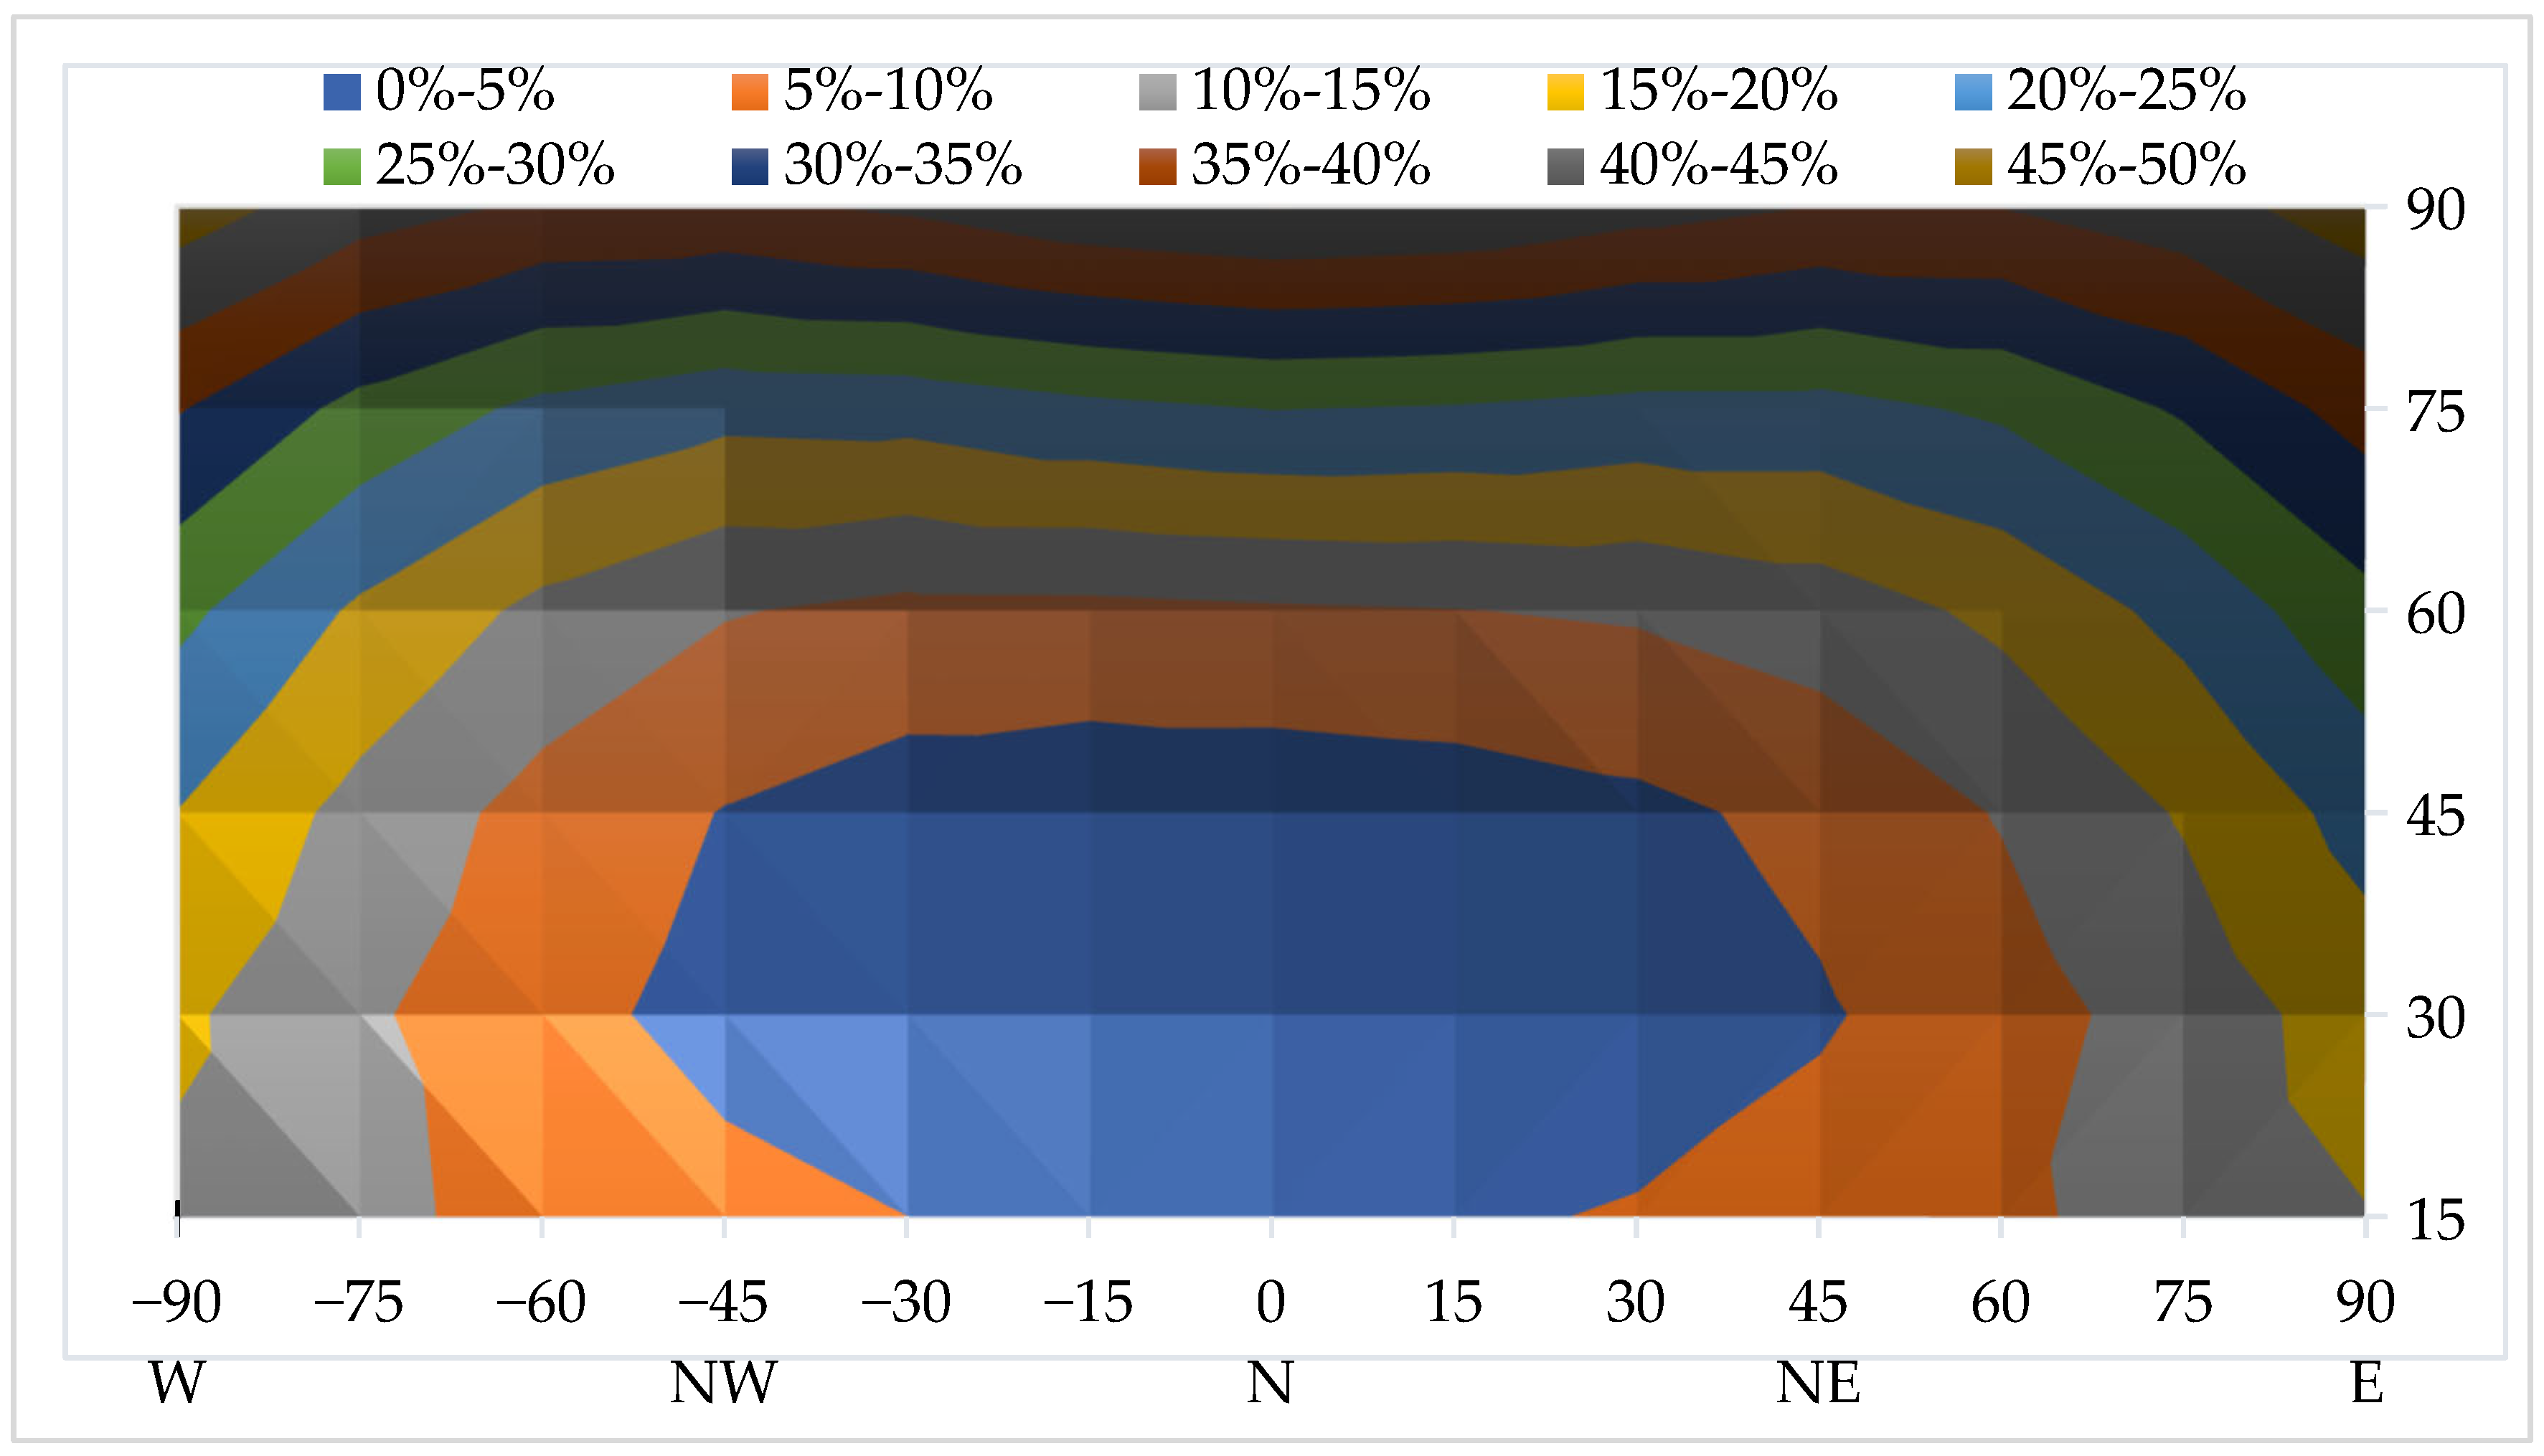
Apart from normal seasonal variations, the orientation of solar photovoltaic panels also plays a crucial role in generating solar energy for powering the microgrid. The contour plot in Figure 7 shows the generation losses based on their orientation and tilt angles. To maximise the solar energy yield for applications like green hydrogen production, solar panels should ideally face the true north, with an average tilt angle of 30°. The solar photovoltaic system is to be mounted on the roof shown in Figure 5. A roof inclination of 10°, facing the north-easterly direction, indicates minimal generation losses of 5–10%.

5. Conceptualisation of the Grid-Tied Solar PV-Green Hydrogen-Battery Storage Microgrid System

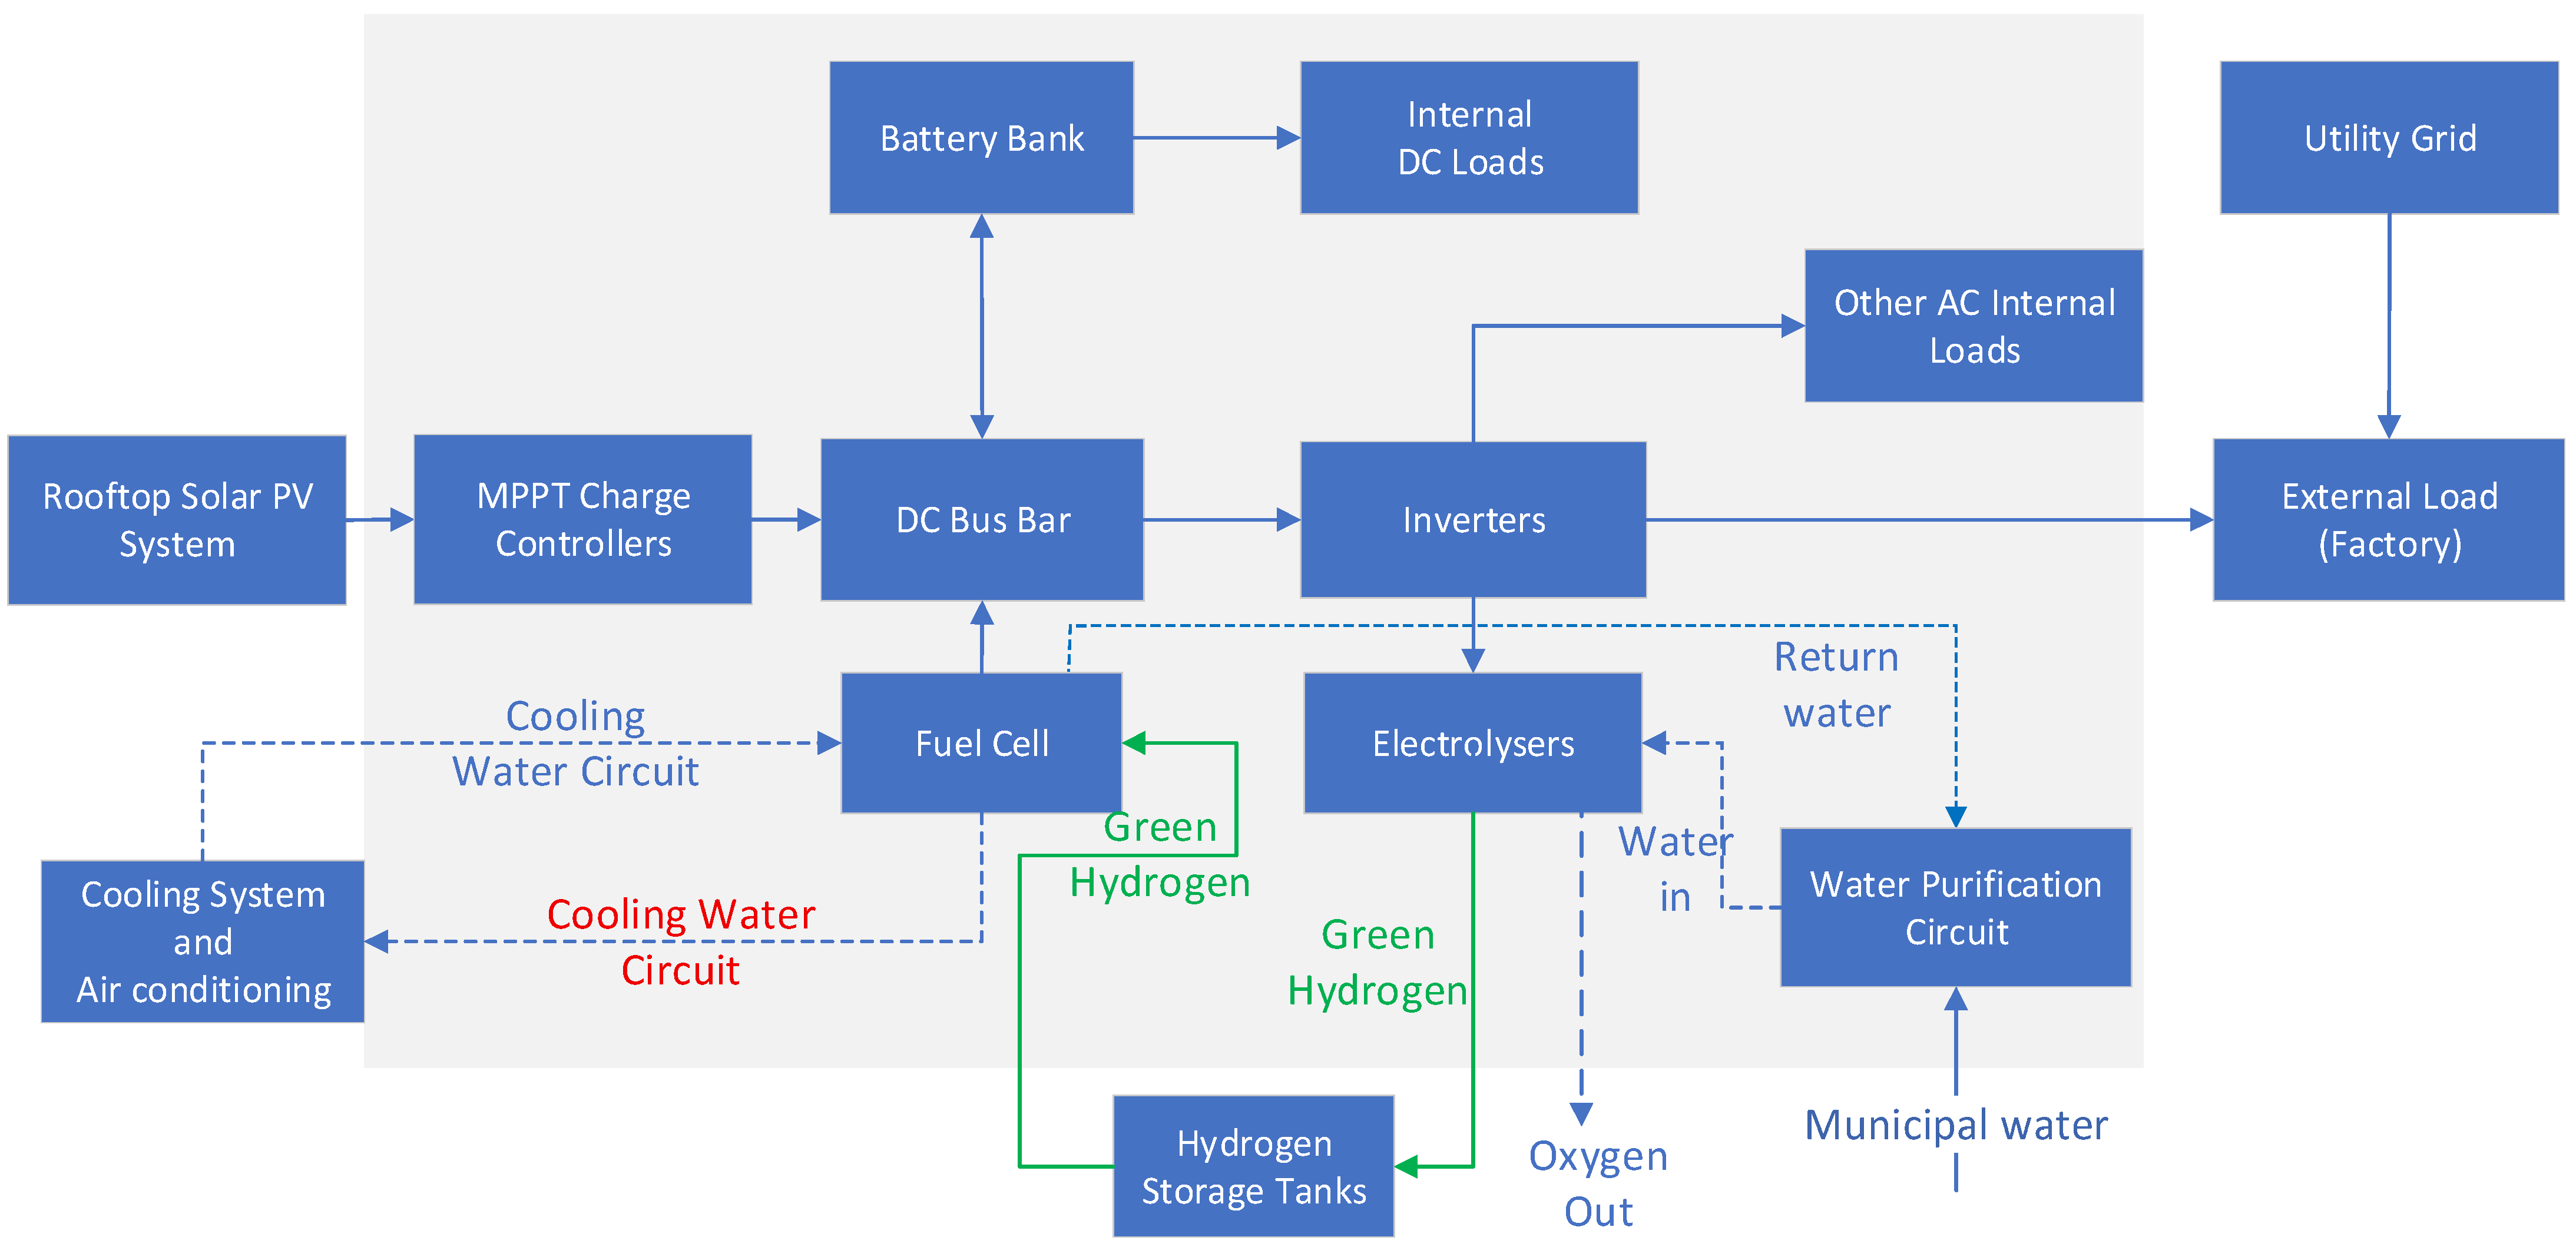
Figure 8 shows a block diagram of the conceptualised grid-tied solar PV-green hydrogen-battery storage microgrid system. The solar photovoltaic system supplies the direct current, which is regulated by the maximum power point tracking and distributed through a direct current bus bar. This energy is used to power internal direct current loads, charge a battery bank, or feed into inverters for internal alternating current loads, as well as the external load and the electrolysers. The electrolysers generate green hydrogen from purified municipal water. The produced hydrogen is stored in hydrogen tanks and later used by a fuel cell to regenerate electricity, especially during low solar availability. A dedicated cooling water circuit, supported by a cooling and air-conditioning system, ensures thermal stability for both the electrolysers and the fuel cell. This closed-loop system provides a reliable energy supply, reduces dependency on the grid, and promotes sustainability by utilising solar energy and hydrogen as clean energy sources. The water used is recirculated or purified, and oxygen byproducts can be vented or captured for utilisation. Some of the components of the microgrid are delicate and were to be housed in a shipping container. The next stage involves the sizing of elements based on the energy profile of the factory. Since this is a trial microgrid, designed to understand how green hydrogen can be integrated into existing infrastructure, the sizing was based on minimising disruptions to the factory. Hence, the microgrid would be structured to allow different prioritisation matrices between the subsystems of the microgrid.

5.1. Solar Photovoltaic System Sizing

To determine the required size of a solar photovoltaic array, the average daily energy consumption must be divided by the product of the average peak sun hours and the overall system efficiency. This sizing approach ensures that the system generates sufficient energy to meet daily demand, taking into account typical environmental conditions and system losses [26]. The formula is given by Equation (1).
A r r a y   S i z e   ( k W )   =   A v e r a g e   D a i l y   L o a d   D e m a n d   ( k W h / d a y ) P e a k   S u n   H o u r s   ( h / d a y ) × S y s t e m   E f f i c i e n c y .
Assuming a system efficiency of 85%, the size of the solar photovoltaic system generator required to support the load is 39 kW. Factoring in a 5% orientation loss yields 41 kW. The conversion efficiency of solar photovoltaic panels is reported to average 15% and the maximum solar irradiance is 1000 W/m2 [27]. This means that the required area for installing a 41 kW system is approximately 273 m2. The available roof space has enough capacity to accommodate the size of the solar photovoltaic system.
A r r a y   S i z e   k W =   192.3 5.8 × 0.85 = 39   k W

5.2. Inverter Sizing

The inverter was sized to match the factory’s peak load of 34.5 kW and the solar array’s maximum output. A typical practice is to size the inverter at 1.1 to 1.2 times the peak load, allowing for short-term surges and minimising the risk of overloading [28]. This ensures efficient energy conversion while maintaining reliability during periods of high demand. This implies that a peak load of 34.5 kW requires an inverter rated at 38–41 kW.

5.3. Charge Controller Sizing

A Maximum Power Point Tracking (MPPT) charge controller is required to optimise power transfer from the solar photovoltaic array to the battery bank. Proper sizing requires ensuring that the controller can handle both the maximum voltage and the maximum charging current. The MPPT current rating is calculated by dividing the total peak array power by the system voltage, as shown by Equation (2).
M P P T   C u r r e n t   R a t i n g   ( A )   =   A r r a y   S i z e   ( W ) S y s t e m   V o l t a g e   ( V )
A system voltage of 48 V was selected for the microgrid, and a 25% safety margin was considered. The required MPPT current rating was determined to be 1068 A. This value is beyond the capacity of a single MPPT charge controller. Therefore, the system would typically use multiple MPPT charge controllers in parallel.
M P P T   C u r r e n t   R a t i n g   A =   41,000 48 × 1.25 = 1068   A

5.4. Battery Sizing

A battery is required for a smooth operation in solar photovoltaic systems. Appropriate sizing focuses on buffering short-term fluctuations in solar generation caused by cloud cover or shading. The recommended formula for calculating the battery capacity for a system with one day of autonomy is given by Equation (3) [29].
B a t t e r y   C a p a c i t y   ( k W h )   =   A v e r a g e   D a i l y   L o a d   D e m a n d   ( k W h / d a y ) D e p t h   o f   D i s c h a r g e × S y s t e m   E f f i c i e n c y
The formula yields a battery capacity of 267.1 kWh, which is very large for a grid-tied system. In this case, the system is grid-tied, enabling it to maintain stability during prolonged power outages. Sizing was then based on sustaining the average load of 22.4 kW for an hour during a solar photovoltaic system dip, resulting in a proposed 22.4 kWh battery capacity. This size of battery was deemed adequate to support the idle load of 1 kW during the night as well. A battery was also required for comparison purposes with the green hydrogen system’s fuel cell.
B a t t e r y   C a p a c i t y   ( k W h )   =   192.3   ( k W h / d a y ) 0.8 × 0.9 = 267.1   k W h .

5.5. Fuel Cell Sizing

Based on recorded generator data, the average power load supplied during the period under study was approximately 8.1 kW, despite using a 50 kW diesel generator. This resulted in an average capacity utilisation of 16.2%, which is highly inefficient in terms of fuel consumption, maintenance, and operational costs. Replacing the oversized generator with an 8 kW hydrogen fuel cell would closely match the actual load demand, significantly improving energy efficiency while eliminating emissions, noise, and wet-stacking issues associated with underutilising diesel generators. The fuel cell is earmarked for testing the green hydrogen technology and will not be the dominant energy supplier to the factory; as such, the sizing of other components does not rely on the continuous availability of hydrogen. The hydrogen fuel cell can be operated intermittently based on the required try-out experiments for the various subsystem components of the microgrid and research requirements.

5.6. Electrolyser Sizing

The electrolyser was sized based on the amount of hydrogen required to run the 8 kW fuel cell. During the trial and commission phase, it is expected to operate the fuel cell for 2 to 5 h per day during peak sun hours. Thereafter, the electrolyser will be used to cover the idle load of 1 kW during the night for approximately 16 h before sunrise. Therefore, the fuel cell is required to provide 16 to 40 kWh of energy. Taking the conservative efficiency of fuel cells as 50% implies that the hydrogen energy needed would be between 32 and 80 kWh [30]. The energy density of hydrogen is 33.33 kWh/kg [31]. This means that 0.96 to 2.4 kg of hydrogen is needed to meet the energy requirements. Research has indicated that it takes an average of 55 kWh to produce 1 kg of hydrogen [11]. Producing 0.96 to 2.4 kg of hydrogen during the 5.8 peak sun hours requires an electrolyser capacity of 9.1 to 22.8 kW. To manage the capital cost of the microgrid, a 10 kW electrolyser was recommended.

5.7. Hydrogen Storage Sizing

The hydrogen storage requirement was calculated for a range of 0.96 to 2.4 kg, to cover various scenarios for night load and trial tests during the day, as previously discussed. Commercial electrolysers are capable of delivering pressure between 30 and 40 bars without a compressor [32]. At these pressure values and ambient temperatures, hydrogen has a density between approximately 2.42 and 3.23 kg/m3, respectively [33]. Using these values, the required tank volume ranges from approximately 743 to 992 L for 2.4 kg of hydrogen. Standard 50 L water capacity pressure vessels were recommended for hydrogen storage. Sixteen storage cylinders will be used for a total storage capacity of 800 L, at the electrolyser pressure.

5.8. Other Auxiliary Components of the Microgrid

In a green hydrogen microgrid, auxiliary units play a crucial role in maintaining system efficiency, safety, and reliability. The water purification unit ensures that the municipal water supplied to the electrolyser meets the required purity standards, removing minerals, salts, and contaminants that could damage the electrolyser membranes or reduce its efficiency [32]. This guarantees consistent hydrogen production and prolongs equipment lifespan. To produce 0.96–2.4 kg of hydrogen per day, the electrolyser will require approximately 8.6 to 21.6 L of purified water daily. The water purification system should be able to meet this water demand. Similarly, the cooling and air-conditioning unit regulates the operating temperature of critical components, such as the electrolyser, fuel cell, and inverters, preventing overheating and ensuring optimal performance under varying load conditions. The cooling load from the electrolyser and fuel cell can be estimated based on their individual efficiencies. A total of 9 kW would be based on an efficiency of 50%, as suggested by Handwerker, Wellnitz and Marzbani [30]. The cooling water circuit also facilitates heat exchange, thereby maintaining stable thermal conditions across the system. Together, these auxiliary units support the continuous and efficient functioning of the microgrid, minimising downtime and maximising hydrogen and power output. Additionally, integrating a digital twin into the microgrid can bring flexibility and resilience to the operation of the microgrid.

5.9. Microgrid Components Layout

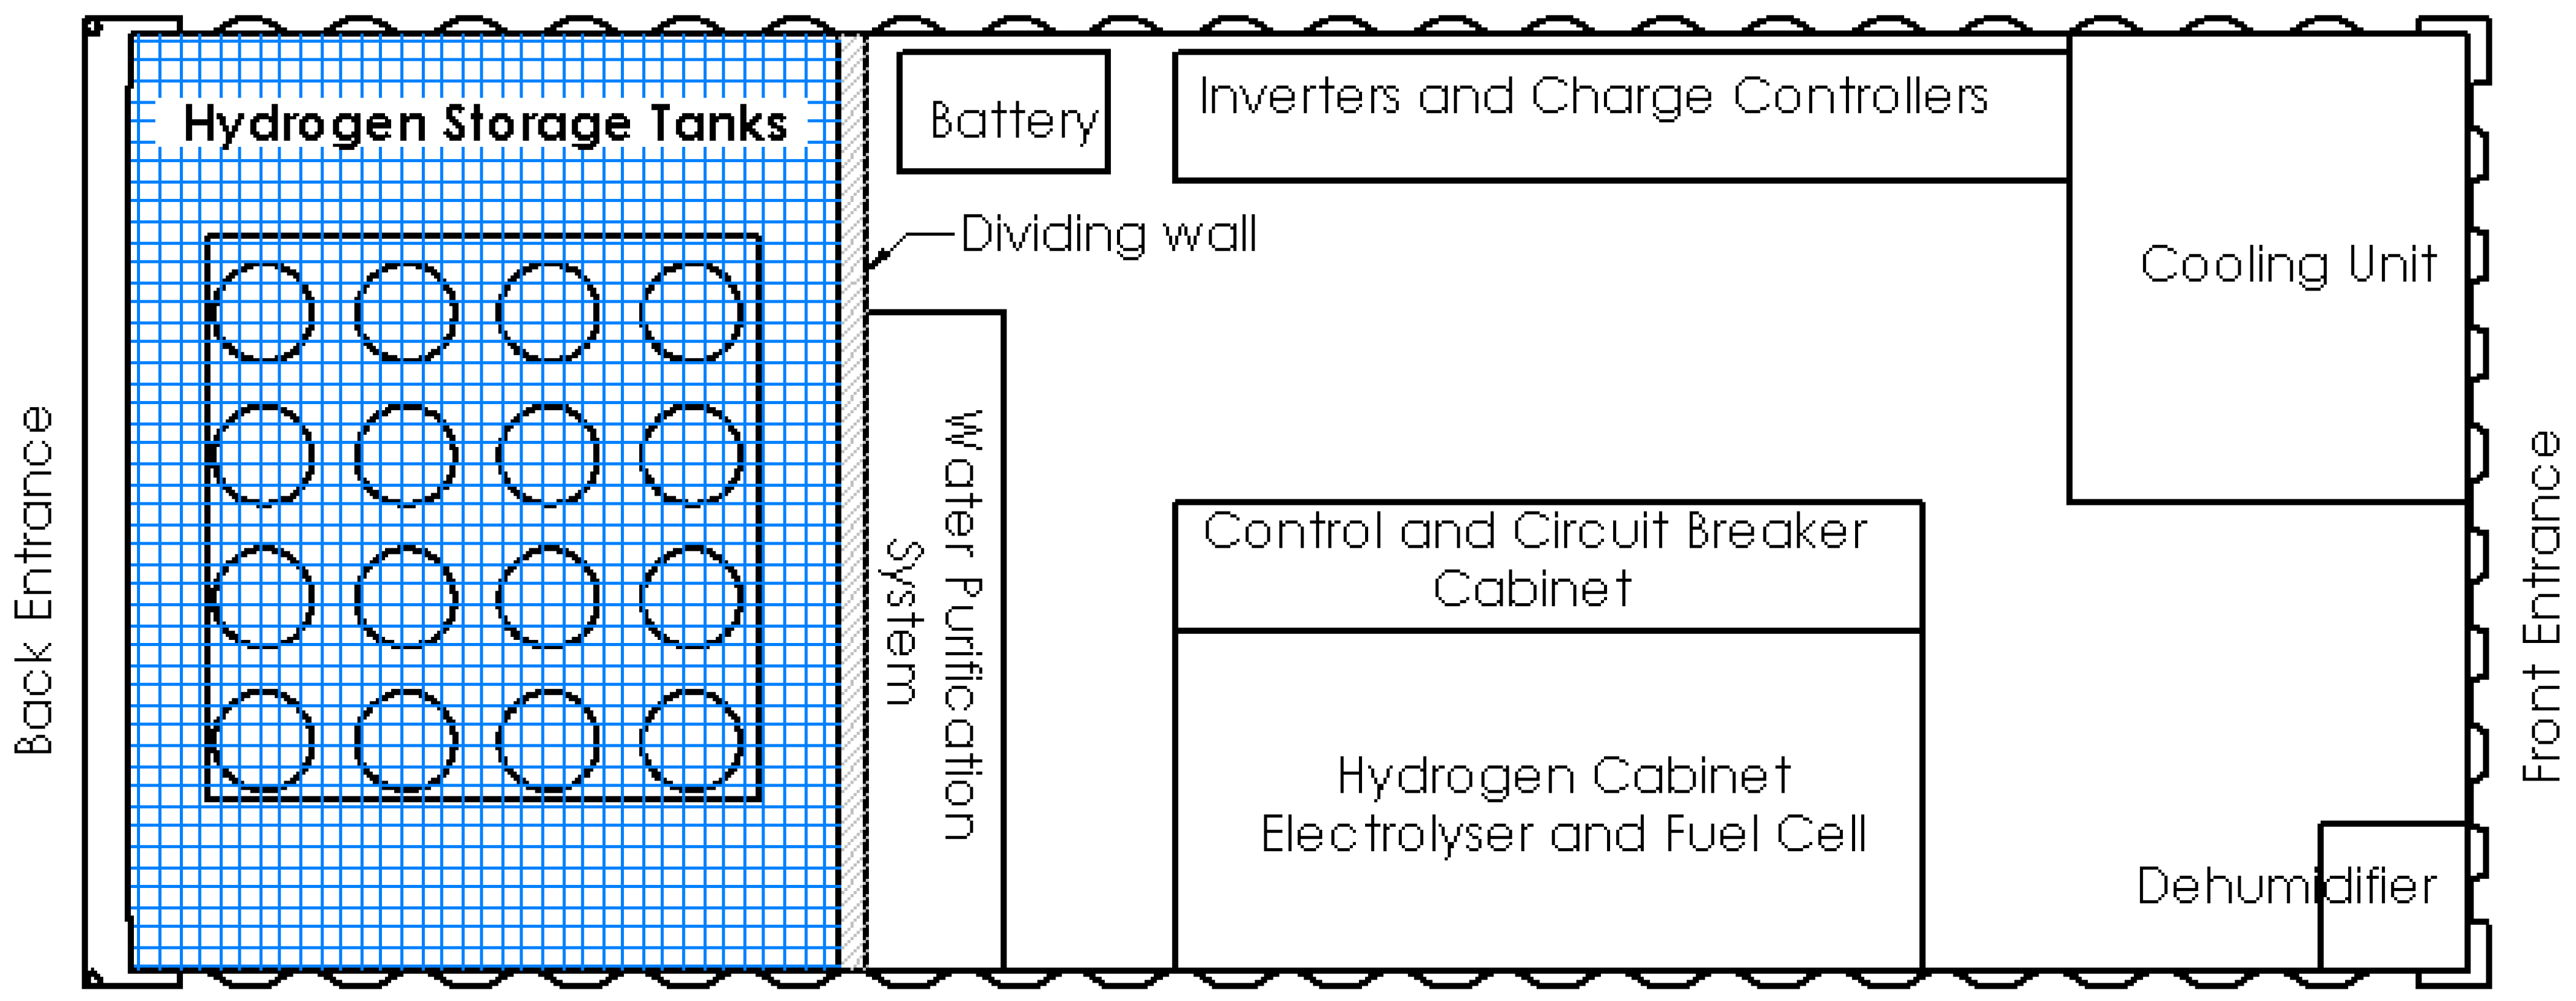
To ensure modularity, safety, and ease of deployment, the electrolyser, fuel cell, hydrogen storage, and auxiliary systems are to be housed within a standard 20 foot ISO container, measuring approximately 6.06 m × 2.35 m. The containerised design provides a compact and transportable solution, enabling plug-and-play integration into diverse energy environments. Internally, the layout is optimised to accommodate the 10 kW electrolyser, 8 kW fuel cell, and 800 L capacity hydrogen storage tanks, while also allocating space for auxiliary units such as water purification, cooling, ventilation, and control systems as shown in Figure 9. This configuration not only facilitates efficient spatial arrangements and safety zoning by separating high-pressure storage from electrical equipment but also ensures that high-pressure storage is kept separate from electrical equipment. It also simplifies maintenance and enhances system scalability. Furthermore, the container can be digitally twinned to monitor structural, thermal, and operational conditions, thereby improving reliability and supporting predictive maintenance.

6. Conclusions and Outlooks

Areal assessment was conducted for the design of a try-out grid-tied green hydrogen microgrid for a case study in Cape Town, South Africa. A detailed energy audit was carried out during the assessment. It revealed that the average daily energy demand of the facility was 192.3 kWh, with a peak load of 34.5 kW. A green hydrogen microgrid was conceptualised by integrating a 39 kW rooftop solar photovoltaic system, a 22 kWh lithium-ion battery storage system, a 10 kW electrolyser, an 8 kW fuel cell, and an 800 L scalable hydrogen storage system. The system enables decentralised green hydrogen production and stationary reconversion to electricity. The pilot design not only provides a pathway for replacing diesel generators, thereby reducing carbon emissions, but also creates new opportunities for local manufacturing, assembly, and maintenance of hydrogen technologies in South Africa. The green hydrogen microgrid provides a replicable blueprint for expanding microgrids across Africa, with modular upscaling to containerised units of different electrolyser and fuel cell capacities. Future work will focus on optimising techno-economic performance and integrating mobility applications. Ultimately, the microgrid sets the stage for hydrogen to become a cornerstone of decentralised, climate-neutral energy systems in developing and newly industrialising countries. The green hydrogen microgrid concept aligns directly with the United Nations’ Sustainable Development Goals (SDGs), notably including SDG 7 on Affordable and Clean Energy, as the project enables the substitution of fossil fuels with green hydrogen derived from renewable resources, improving energy security. The other impacted SDG is 9 on Industry, Innovation, and Infrastructure, as the project becomes a flagship that stimulates industrial growth by creating opportunities in the value chain. Lastly, the project contributes to SDG 13 on Climate Action by reducing greenhouse gas emissions and supporting a transition to low-carbon industrial practices. Continued engagement with public–private partnerships and regulatory frameworks will be essential for scaling this pilot project into a regionally significant green hydrogen economy.

Author Contributions

Conceptualization, B.S. and G.P.C.; methodology, B.S.; validation, B.S., G.P.C. and S.S.; formal analysis, B.S.; investigation, B.S. and G.P.C.; resources, S.S. and U.B.; data curation, S.M.; writing—original draft preparation, B.S.; writing—review and editing, B.S.; visualisation, B.S.; supervision, S.M. and U.B.; project administration, B.S., S.S. and U.B.; funding acquisition, S.S. and U.B. All authors have read and agreed to the published version of the manuscript.

Funding

This research received no external funding, but the microgrid construction was funded by NOW-GMBH-DE, grant number 16EXI5556A, and the APC was funded by Stellenbosch University.

Institutional Review Board Statement

Not applicable.

Data Availability Statement

Not applicable.
Data Availability Statement
The original contributions presented in this study are included in the article. Further inquiries can be directed to the corresponding author.

Acknowledgments

The authors acknowledge the Fraunhofer Institute of Machine Tools and Forming Technology, IWU, and specifically the Referenz-Fabrik division, as well as Stellenbosch University, for their support. The views expressed and conclusions drawn are those of the authors and are not to be attributed to the institutions.

Conflicts of Interest

The authors declare no conflict of interest.

References

  1. AbouSeada, N.; Hatem, T.M. Climate Action: Prospects of Green Hydrogen in Africa. Energy Rep. 2022, 8, 3873–3890. [Google Scholar] [CrossRef]
  2. Furstenau, L.B.; Sott, M.K.; Kipper, L.M.; MacHado, E.L.; Lopez-Robles, J.R.; Dohan, M.S.; Cobo, M.J.; Zahid, A.; Abbasi, Q.H.; Imran, M.A. Link between Sustainability and Industry 4.0: Trends, Challenges and New Perspectives. IEEE Access 2020, 8, 140079–140096. [Google Scholar] [CrossRef]
  3. Evro, S.; Oni, B.A.; Tomomewo, O.S. Carbon Neutrality and Hydrogen Energy Systems. Int. J. Hydrogen Energy 2024, 78, 1449–1467. [Google Scholar] [CrossRef]
  4. United Nations Transforming Our World: The 2030 Agenda for Sustainable Development. Available online: https://sdgs.un.org/2030agenda (accessed on 19 July 2025).
  5. Ajeeb, W.; Costa Neto, R.; Baptista, P. Life Cycle Assessment of Green Hydrogen Production through Electrolysis: A Literature Review. Sustain. Energy Technol. Assess. 2024, 69, 103923. [Google Scholar] [CrossRef]
  6. Dyantyi-Gwanya, N.; Giwa, S.O.; Ncanywa, T.; Taziwa, R.T. Exploring Economic Expansion of Green Hydrogen Production in South Africa. Sustainability 2025, 17, 901. [Google Scholar] [CrossRef]
  7. Hamukoshi, S.S.; Mama, N.; Shimanda, P.P.; Shafudah, N.H. An Overview of the Socio-Economic Impacts of the Green Hydrogen Value Chain in Southern Africa. J. Energy South. Afr. 2022, 33, 12–21. [Google Scholar] [CrossRef]
  8. Klagge, B.; Walker, B.; Kalvelage, L.; Greiner, C. Governance of Future-Making: Green Hydrogen in Namibia and South Africa. Geoforum 2025, 161, 104244. [Google Scholar] [CrossRef]
  9. Dagnachew, A.G.; Yalew, S.G.; Tesfamichael, M.; Okereke, C.; Abraham, E. A Green Hydrogen Revolution in Africa Remains Elusive under Current Geopolitical Realities. Clim. Policy 2025, 25, 291–302. [Google Scholar] [CrossRef]
  10. Imasiku, K.; Farirai, F.; Olwoch, J.; Agbo, S.N. A Policy Review of Green Hydrogen Economy in Southern Africa. Sustainability 2021, 13, 13240. [Google Scholar] [CrossRef]
  11. Stamm, A.; Altenburg, T.; Strohmaier, R.; Oyan, E.; Thoms, K. Green Hydrogen: Implications for International Cooperation. With Special Reference to South Africa; German Institute of Development and Sustainability: Bonn, Germany, 2023. [Google Scholar] [CrossRef]
  12. Olifant, G.E.; Ngubevana, L.; Mathetsa, S. Navigating the Current Landscape of Green Hydrogen, Its Potential, and Challenges: A South African Perspective. Prog. Energy 2025, 7, 033002. [Google Scholar] [CrossRef]
  13. Germany Federal Ministry for Economic Affairs and Climate Action Germany and South Africa Sign Cooperation Agreement on Green Hydrogen. Available online: https://www.bundeswirtschaftsministerium.de/Redaktion/EN/Pressemitteilungen/2023/06/20230627-germany-south-africa-cooperation-green-hydrogen.html (accessed on 13 September 2025).
  14. Abdelsalam, R.A.; Abdallah, Y.S.; Shabar, N.M.; Afifi, O.A.; Fouda, M.H.; El-Deib, A.A. Energy Management and Techno-Economic Optimization of an Isolated Hybrid AC/DC Microgrid with Green Hydrogen Storage System. In Proceedings of the IEEE Conference on Power Electronics and Renewable Energy, CPERE 2023, Luxor, Egypt, 19–21 February 2023; pp. 1–7. [Google Scholar] [CrossRef]
  15. El Zoghby, H.M.; Safwat, A.; Afia, R.S.A.; Bendary, A.F.; Elmesalawy, M.M. Optimal Sizing and Operation Strategies for Isolated Microgrid Integrating Green Hydrogen. In Proceedings of the 2024 5th International Conference on Clean and Green Energy Engineering, CGEE 2024, Izmir, Turkey, 24–26 August 2024; pp. 54–58. [Google Scholar] [CrossRef]
  16. City of Cape Town. Rooftop Solar PV- Guidelines for Safe and Legal Installations in Cape Town; City of Cape Town: Cape Town, South Africa, 2022; pp. 1–8. [Google Scholar]
  17. Barbosa, L.T.; Vasconcelos, S.D.; Rosas, P.A.C.; Castro, J.F.C.; Barbosa, D.C.P. Assessment of Green Hydrogen as Energy Supply Alternative for Isolated Power Systems and Microgrids. Energies 2024, 17, 4774. [Google Scholar] [CrossRef]
  18. Valverde, L.; Rosa, F.; Bordons, C. Design, Planning and Management of a Hydrogen-Based Microgrid. IEEE Trans. Ind. Inform. 2013, 9, 1398–1404. [Google Scholar] [CrossRef]
  19. Alturki, A.A. Optimal Design for a Hybrid Microgrid-Hydrogen Storage Facility in Saudi Arabia. Energy Sustain. Soc. 2022, 12, 1–17. [Google Scholar] [CrossRef]
  20. El Monem Hazem, A.; El Zoghby, H.M.; Bendary, A.F.; Afia, R.S.A. Techno-Economic Study of a 100% Renewable Energy-Based Isolated Microgrid Involving Green Hydrogen Production. Sustain. Energy Technol. Assess. 2025, 76, 104303. [Google Scholar] [CrossRef]
  21. Khavari, F.; Hajipour, E.; Liu, J. Day-Ahead Energy Management in Green Microgrids: Impact of Long-Term Scheduling of Hydrogen Storage Systems. Sustain. Energy Technol. Assess. 2024, 72, 104072. [Google Scholar] [CrossRef]
  22. Tatar, S.M.; Akulker, H.; Sildir, H.; Aydin, E. Optimal Design and Operation of Integrated Microgrids under Intermittent Renewable Energy Sources Coupled with Green Hydrogen and Demand Scenarios. Int. J. Hydrogen Energy 2022, 47, 27848–27865. [Google Scholar] [CrossRef]
  23. Hasan, T.; Emami, K.; Shah, R.; Hassan, N.M.S.; Anderson, J.; Thomas, D.; Louis, A. A Study on Green Hydrogen-Based Isolated Microgrid. Energy Rep. 2022, 8, 259–267. [Google Scholar] [CrossRef]
  24. AEE Intec. Thermal Use of Solar Energy-SOLTRAIN Training Course for Experts & Professionals; AEE, Institute for Sustainable Technologies: Gleisdorf, Austria, 2014. [Google Scholar]
  25. WeatherSpark Cape Town Weather Data. Available online: https://weatherspark.com/y/82961/Average-Weather-in-Cape-Town-Western-Cape-South-Africa-Year-Round (accessed on 20 November 2022).
  26. Kafando, J.G.; Yamegueu, D.; Houdji, E.T. Review on Sizing and Management of Stand-Alone PV/WIND Systems with Storage. Heliyon 2024, 10, e38080. [Google Scholar] [CrossRef]
  27. David Tan, A.K.S. Handbook for Solar Photovoltaic Systems; Energy Market Authority, Singapore Publication: Singapore, 2011. [Google Scholar]
  28. Masters, G.M. Renewable and Efficient Electric Power Systems; Stanford University: Stanford, CA, USA, 2004. [Google Scholar] [CrossRef]
  29. Khatib, T.; Ibrahim, I.A.; Mohamed, A. A Review on Sizing Methodologies of Photovoltaic Array and Storage Battery in a Standalone Photovoltaic System. Energy Convers. Manag. 2016, 120, 430–448. [Google Scholar] [CrossRef]
  30. Handwerker, M.; Wellnitz, J.; Marzbani, H. Comparison of Hydrogen Powertrains with the Battery Powered Electric Vehicle and Investigation of Small-Scale Local Hydrogen Production Using Renewable Energy. Hydrogen 2021, 2, 76–100. [Google Scholar] [CrossRef]
  31. Sanni, O.; Dyosiba, X.; Ren, J. A Brief Overview of Hydrogen Production and Storage. South Afr. J. Chem. Eng. 2025, 53, 60–72. [Google Scholar] [CrossRef]
  32. Hancke, R.; Bujlo, P.; Holm, T.; Ulleberg, Ø. High-Pressure PEM Water Electrolyser Performance up to 180 Bar Differential Pressure. J. Power Sources 2024, 601, 234271. [Google Scholar] [CrossRef]
  33. Colozza, A.J. Hydrogen Storage for Aircraft; NASA: Washington, DC, USA, 2002; ISBN 3016210134. [Google Scholar]
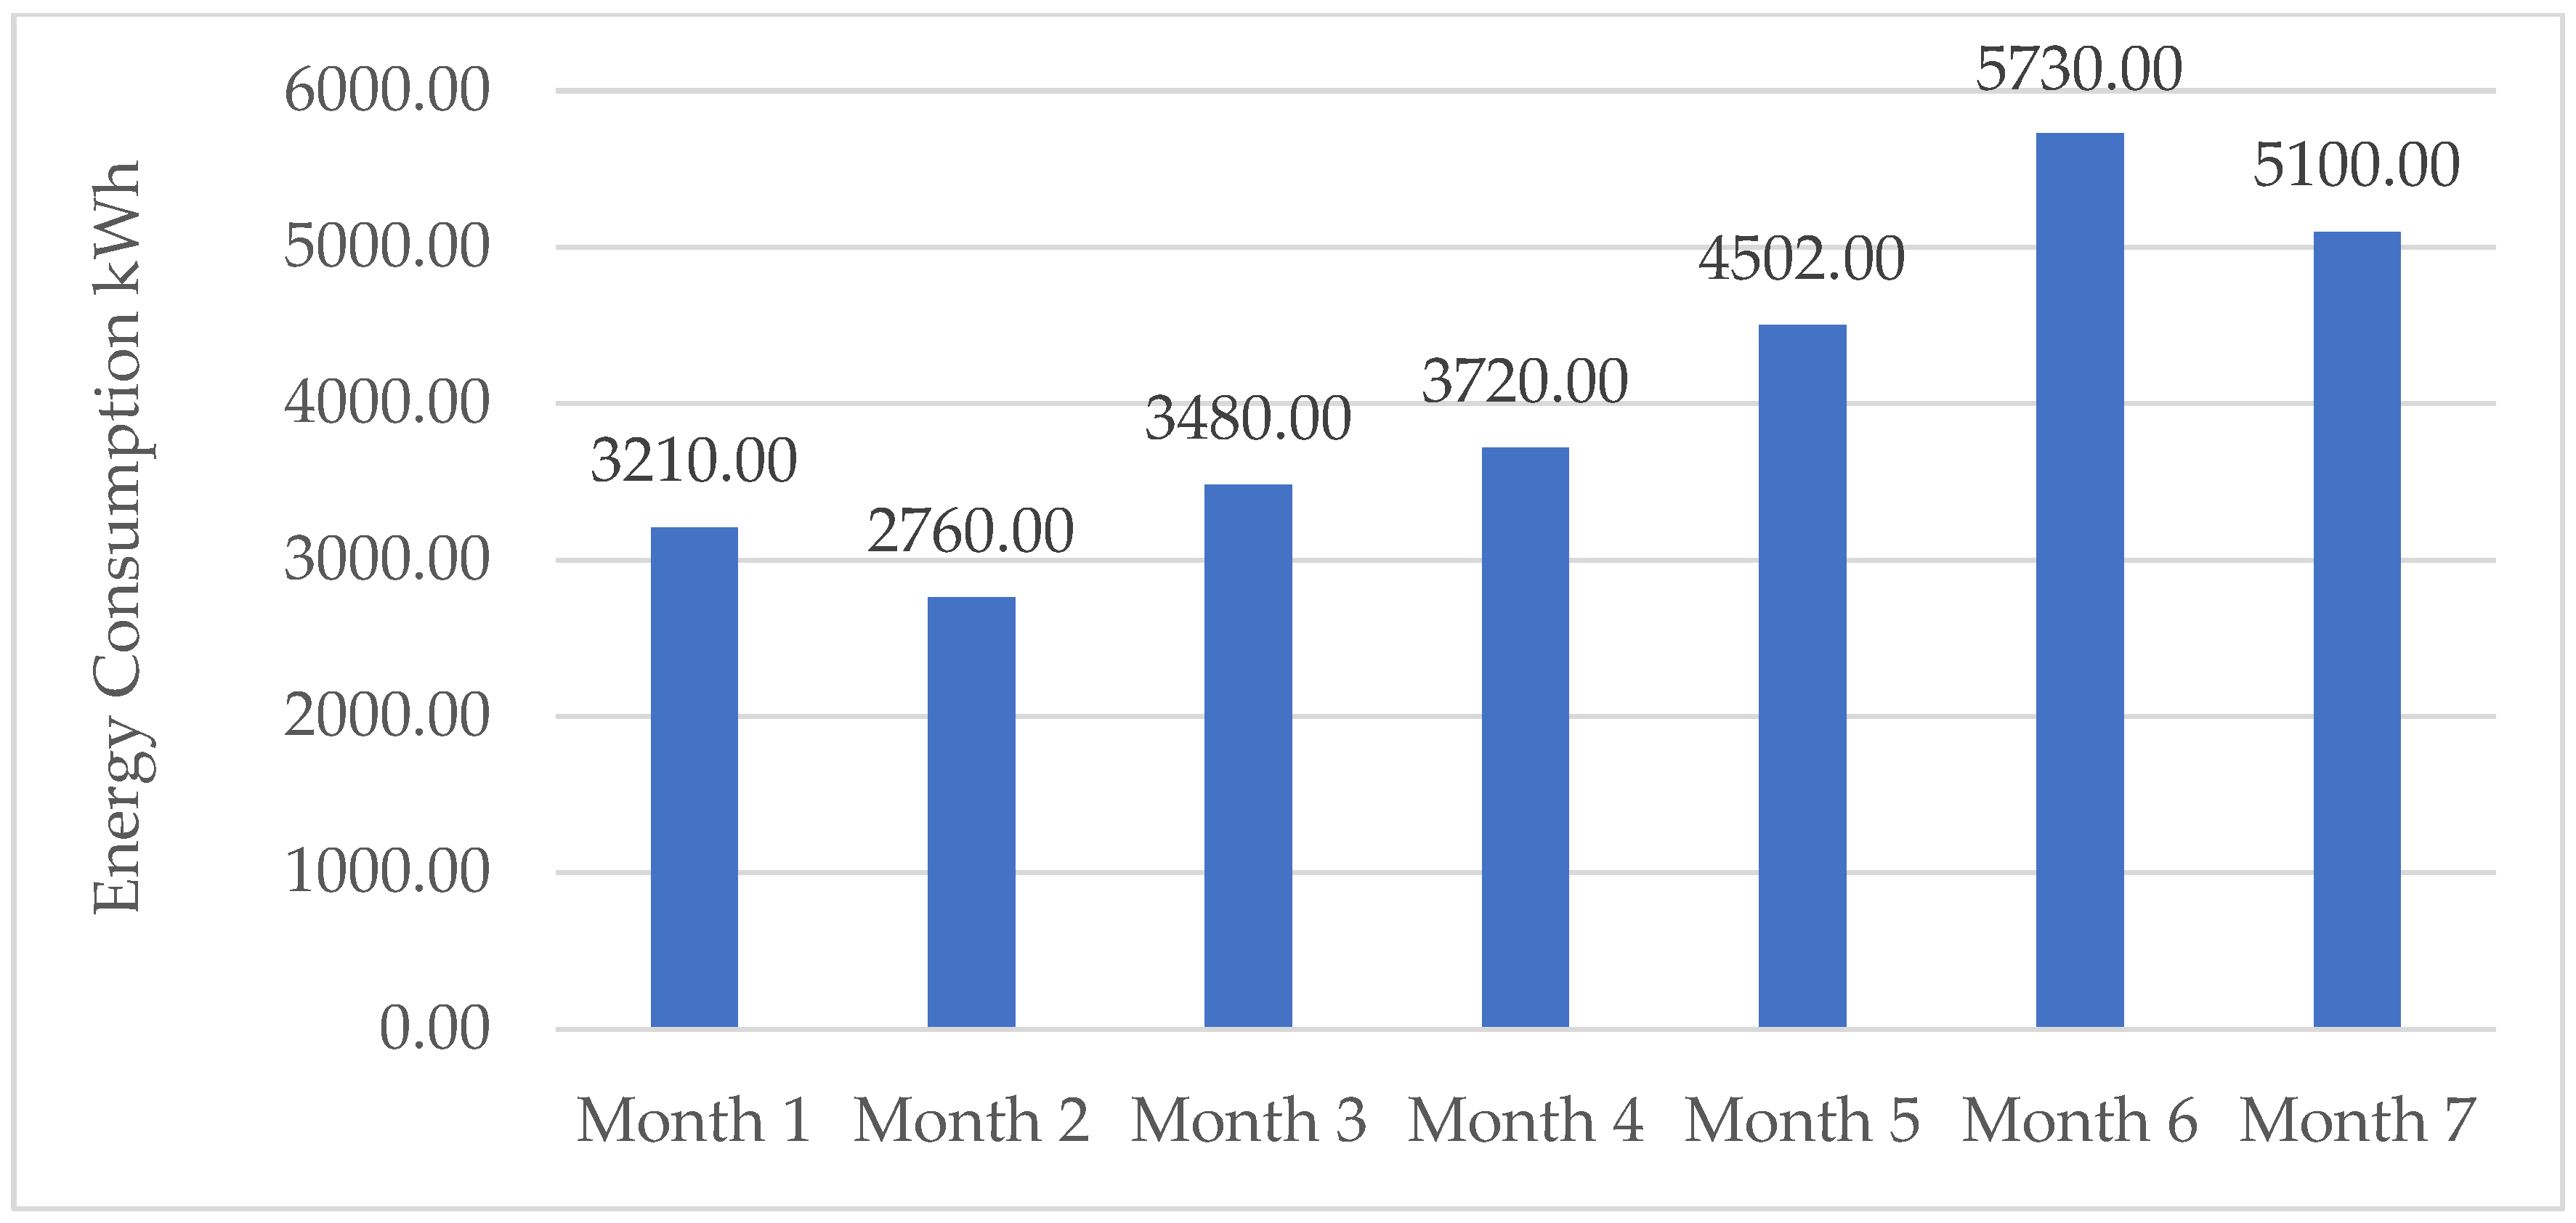
Figure 1. Monthly Energy Consumption.
Sustainability 17 08649 g001
Figure 2. Average daily consumption/month.
Sustainability 17 08649 g002
Figure 3. Adjusted power demand (kW).
Sustainability 17 08649 g003
Figure 4. Load profile.
Sustainability 17 08649 g004
Figure 5. Site roof area and orientation (Source: Google Earth and drawings).
Sustainability 17 08649 g005
Figure 6. Solar irradiation data in Cape Town [25].
Sustainability 17 08649 g006
Figure 7. Radiation losses due to orientation in Cape Town [24].
Sustainability 17 08649 g007
Figure 8. Block diagram of a typical grid-tied solar PV-green hydrogen-battery storage microgrid system.
Sustainability 17 08649 g008
Figure 9. Containerised design of green hydrogen microgrid.
Sustainability 17 08649 g009
Table 1. Monthly energy bill.
PeriodConsumption (kWh)Rand Cost/kWhTotal
Energy Cost
Service Charge/Day Total
Service Charge
Sub TotalVATTotal Bill
Month 13210.00R 1.8217R 5847.66R 63.89R 1469.47 R 7317.1315%R 8414.70
Month 22760.00R 1.8217R 5027.89R 63.89R 2108.37 R 7136.2615%R 8206.70
Month 33480.00R 1.8217R 6339.52R 63.89R 1788.92 R 8128.4415%R 9347.70
Month 43720.00Price Change R 6922.13Price Change R 2023.08 R 8945.2115%R 10,286.99
Month 54502.00R 1.9948R 8980.59R 69.96R 2028.84 R 11,009.4315%R 12,660.84
Month 65730.00R 1.9948R 11,430.20R 69.96R 2378.64 R 13,808.8415%R 15,880.17
Month 75100.00R 1.9948R 10,173.48R 69.960R 2028.84 R 12,202.3215%R 14,032.67
Table 2. Idle load consumption.
BeforeAfterConsumption (kWh)HoursLoad (kW)
Weekend 1398,087.40398,140.2052.8620.851
Weekend 2399,092.10399,145.8053.7620.866
Average Idle Load Approx 1 kW
Table 3. Equipment audit in the production side of the building.
LocationEquipmentQntyPower Rating (kW)Total (kW)
ShopfloorWelding Machine78.4058.8
ShopfloorPump70.221.54
ShopfloorCompressor27.5015.0
TrainingWelding Machine28.4016.8
TrainingPump20.220.44
Table 4. Generator Size.
ParameterReading
Generator Size50.00 kW
Total Energy (kWh)1582.00 kWh
Run Hrs195.28 Hrs
Average Power Load to the Generator8.10 kW
Disclaimer/Publisher’s Note: The statements, opinions and data contained in all publications are solely those of the individual author(s) and contributor(s) and not of MDPI and/or the editor(s). MDPI and/or the editor(s) disclaim responsibility for any injury to people or property resulting from any ideas, methods, instructions or products referred to in the content.