Article

Dynamic Evolution and Driving Mechanisms of Cultivated Land Non-Agriculturalization in Sichuan Province

1
The Engineering Laboratory of Land and Resources Utilization in Hilly Areas, China West Normal University, Nanchong 637009, China
2
School of Geographical Sciences, China West Normal University, Nanchong 637009, China
3
School of Business, China West Normal University, Nanchong 637009, China
4
School of Geomatics and Geoinformation, Guilin University of Technology, Guilin 541004, China
*
Authors to whom correspondence should be addressed.
Sustainability 2025, 17(19), 8643; https://doi.org/10.3390/su17198643
Submission received: 26 July 2025 / Revised: 26 August 2025 / Accepted: 23 September 2025 / Published: 25 September 2025

Abstract

Given that the increasing non-agricultural conversion of cultivated land (NACCL) endangers food security, studying the spatial and temporal variation characteristics and driving mechanisms of NACCL in Sichuan Province can offer a scientific foundation for developing local farmland preservation measures and controlling further conversion. Guided by the theoretical framework of land use transition, this study utilizes land use datasets spanning multiple periods between 2000 and 2023. Comprehensively considering population scale factors, natural geographical factors, and socioeconomic factors, the county-level annual NACCL rate is calculated. Following this, the dynamic evolution and underlying driving forces of NACCL across 183 counties in Sichuan Province are examined through temporal and spatial dimensions, utilizing analytical tools including Nonparametric Kernel Density Estimation (KDE) and the Geographical Detector model with Optimal Parameters (OPGD). The study finds that: (1) Overall, NACCL in Sichuan Province exhibits phased temporal fluctuations characterized by “expansion—contraction—re-expansion—strict control,” with cultivated land mainly being converted into urban land, and the differences among counties gradually narrowing. (2) In Sichuan Province, the spatial configuration of NACCL is characterized by the expansion of high-value agglomerations alongside the dispersed and stable distribution of low-value areas. (3) Analysis through the OPGD model indicates that urban construction land dominates the NACCL process in Sichuan Province, and the driving dimension evolves from single to synergistic. The findings of this study offer a systematic examination of the spatiotemporal evolution and underlying drivers of NACCL in Sichuan Province. This analysis provides a scientific basis for formulating region-specific farmland protection policies and supports the optimization of territorial spatial planning systems. The results hold significant practical relevance for promoting the sustainable use of cultivated land resources.

1. Introduction

Cultivated land resources are of paramount significance to human existence and the realization of sustainable development goals. These resources play a critical role in guaranteeing food security at the national level, preserving ecological equilibrium, and ensuring societal stability [1,2]. According to data published by the Food and Agriculture Organization of the United Nations (FAO) in 2023, the global loss of high-quality farmland over the past twenty years has surpassed 100 million hectares. This phenomenon stems primarily from drivers such as climate change, soil degradation, and urban expansion, which collectively undermine global food security. In September 2020, the Chinese government released the “Notice on Resolutely Curbing NACCL”, which explicitly required the strict prohibition of various forms of unauthorized NACCL activities. In 2024, the government placed renewed emphasis when formulating policies, putting forward the proposal to rigorously enforce the farmland protection system as a means to safeguard the country’s food security. As the encroachment on cultivated land resources becomes increasingly severe [3,4,5], this trend not only jeopardizes the integrity of the “red line for cultivated land” but could also initiate cascading effects such as the decline of ecosystem functionality [6] and diminished ecological service values within agricultural regions [7]. This is fundamental to ensuring the stability of the national food supply and the long-term preservation of farmland resources [8]. Strengthening the protection and rational utilization of cultivated land has become extremely urgent.
At its core, NACCL describes the process through which farmland is converted for non-agricultural purposes. Specifically, it describes the transition of agricultural land for purposes such as urban residential development, commercial activities, and other non-farming applications [9]. The annual NACCL rate quantifies the pace and extent of farmland conversion to non-agricultural uses within a given period, capturing the yearly dynamics of agricultural land loss. The spatial and temporal patterns of such conversions, along with their underlying driving mechanisms, have consistently been a major focus of academic research both nationally and globally. In studies of spatiotemporal evolution, researchers frequently apply analytical techniques including centroid shift analysis [10], standard deviational ellipse [11], and spatial autocorrelation [12]. By using parcel-level data on agricultural land undergoing development for built-up areas, researchers examine the spatiotemporal distribution patterns [13], diffusion paths [14], spatial heterogeneity phenomena [15], and convergence trends [16] of NACCL. Research shows that, overall, the spatial agglomeration of NACCL exhibits an increasing trend, mostly centered on central regions and extending towards the periphery. In some areas, the spatial hierarchical characteristics of NACCL are obvious, with high-grade areas concentrated in the developed central regions. These investigations examine evolutionary traits across multiple scales, spanning from the national down to regional and local administrative tiers. Particular emphasis has been placed on China’s core grain-producing zones, which are responsible for the majority of the country’s crop output. These include the Northeast China Plain, the North China Plain, and the Yangtze River Middle-Lower Plain [17,18,19]. In these regions, NACCL shows significant characteristics of large scale, high rate, and highly concentrated spatial distribution. The conversion hotspots are mainly distributed around core urban agglomerations and major transportation arteries. In terms of driving factors, scholars have employed various quantitative methods such as game models, geographical detectors [20], Granger causality tests [21], and Geographically Weighted Regression (GWR) [22]. Starting with natural and social factors, they attempt to identify the main reasons for NACCL [23]. Socio-economic factors are widely recognized as the most core and active driving forces of NACCL, and their influence permeates the entire process of NACCL. The increasing demand for land due to population growth, spatial expansion needs during industrialization and urbanization, and the reassessment of land value accompanying regional economic advancement collectively drive—both directly and indirectly—the conversion of farmland to non-agricultural purposes. Scholars widely acknowledge that non-agricultural conversion of cultivated land (NACCL) arises from the combined effects of natural, socioeconomic, and policy drivers, where natural conditions and policy interventions serve fundamental and regulatory roles, respectively [24].
Previous studies have applied a range of both quantitative and qualitative techniques to assess the characteristics, composition, and geographic patterns of NACCL. However, definitions of NACCL vary among scholars. One group defines it broadly as the shift in cropland to non-agricultural uses, yet this overlooks the fact that some converted lands—such as those turned into forest or garden land—retain agricultural and environmental roles. Another group adopts a narrower view, considering only the conversion to built-up areas as constituting NACCL, thereby neglecting transitions to other non-forming categories like unutilized land and water bodies. At the research scale level, large-scale research units like provincial and municipal domains struggle to precisely portray their internal differences. In comparison, the county level serves as a critical bridge connecting urban and rural regions, functioning as the primary spatial unit where NACCL predominantly occurs. As the basic level of administrative management and policy execution in China, county governments directly take on key land management tasks, such as compiling national spatial planning, allocating land use quotas, and approving land requisition. Their decisions and actions exert a direct and substantial driving influence on the NACCL process. Moreover, county-level units typically show relatively high consistency in natural and geographical conditions and are governed by a relatively unified regional development policy framework. This enables better control over the impact of some background variables, making it easier to clearly identify and quantify the specific driving intensity and action mechanisms of socio-economic factors on NACCL. Sichuan Province occupies a critical position within the upper Yangtze River Economic Belt, where it serves as an ecological security zone. It also functions as a strategic hinterland in southwestern China, a pivotal region under the national western development initiative, and a core area of the Chengdu-Chongqing Economic Circle. Given these roles, its cultivated land resources are of major strategic value in enhancing national food security. Sichuan is in a period of accelerated urbanization. Moreover, there exists substantial pressure driving the transformation of farmland into land designated for construction purposes. Compared with eastern developed regions such as Jiangsu, Zhejiang, and Shanghai, the NACCL in Sichuan shows a more ongoing characteristic. Current studies on NACCL in Sichuan primarily center on macroscopic trend analysis, with limited investigation into its fine-scaled spatiotemporal dynamics at the county level. Notably, a systematic investigation into whether its evolutionary patterns are representative and whether distinct variations exist across counties has yet to be carried out. In analyzing the driving factors of NACCL, existing research often relies on static parameter classification methods, making it difficult to capture the non-equilibrium characteristics of the county-level NACCL process in Sichuan Province, thus leading to significant uncertainty in the analysis. Based on this, from a geographical perspective and in combination with land use transition theory, this paper takes 183 counties in Sichuan Province as research objects. Using land use data with a 30 m resolution from six periods (2000, 2005, 2010, 2015, 2020, and 2023), it carefully classifies land use types to deeply reveal the evolutionary characteristics of NACCL. This study seeks to support the Sichuan Provincial People’s Government in developing precise cultivated land protection measures and enhancing the governance of national spatial planning. Additionally, it offers useful references for promoting high-quality regional development, implementing the national food security strategy, building China’s strategic development hinterland, and achieving a win-win between economic development and resource utilization.

2. Theoretical and Research Framework

The land use transition theory demonstrates strong applicability across several critical domains, including the interpretation of agricultural systems, the maintenance of food security, and the advancement of sustainable ecological development in urban areas. This study focuses on Sichuan Province and takes counties as specific research units. It constructs a theoretical and research framework diagram (Figure 1), aiming to deeply explore the development trends and causes of the NACCL in Sichuan Province at the county level. Meanwhile, it enriches empirical cases of the land use transition theory, verifies and expands its applicability and explanatory power in specific regions and specific land use change scenarios, providing solid support for improving the theoretical system and formulating more targeted land use policies.
The theory of land use transition originated with Grainger, a researcher at the University of Leeds in the United Kingdom, through his studies on land use changes in countries where forestry represents the dominant land cover [25]. It typically describes the evolution of land use patterns, structural composition, and functional attributes across a specified time period. This change includes not only macro-pattern changes in land use but also changes in land use intensity, efficiency, and other aspects on the micro-scale [26]. The land use transition theory focuses on trend-related turning points in land use forms that occur with socio-economic development. It has a unique dual characteristic, namely, the explicit change in spatial form and the implicit transformation in functional form are mutually coordinated. This characteristic precisely coincides with the dual manifestations of NACCL: NACCL is manifested not only through the physical displacement of agricultural areas by non-farming uses, but also through the functional transition of land from production-oriented roles to those such as residential and industrial purposes. In the specific region of Sichuan Province, the process of its NACCL is deeply constrained by the geomorphic pattern and regional spatial policies. From a geomorphological perspective, cultivated land in basin plains exhibits a contiguous distribution, resulting in relatively low morphological conversion costs associated with non-agricultural use. In contrast, in the mountainous and plateau areas, cultivated land is scattered, making morphological transformation difficult. There is often a situation where the function has been implicitly non-agriculturalized while the morphological form remains unchanged. At the policy level, metropolitan development initiatives prioritize the conversion of farmland in the Chengdu Plain to non-agricultural uses, accompanied by a functional shift from agricultural production to industrial and residential purposes. In contrast, in northwest Sichuan, constrained by ecological protection policies, the morphological transformation of NACCL is strictly restricted, and the agricultural function is maintained.
Based on the theories and regional realities, the theoretical and research framework diagram constructed in this study is divided into three parts: First, the land use transition theory emphasizes that we should not only focus on surface changes but also attach importance to functional changes. This key insight establishes a theoretical basis for extracting annual NACCL rates at the county level, thereby enabling a more systematic and precise assessment of its intensity. Second, land use transition is manifested by changes in “explicit morphology” and “implicit morphology”. Based on this, in the time dimension, methods such as KDE are initially used to analyze its overall characteristics. Subsequently, the conversion characteristics of each county are analyzed to reveal the evolution laws of NACCL at different time stages. In the spatial context, we first employ an analytical approach to assess if NACCL in Sichuan Province exhibits spatial agglomeration features. Then, its agglomeration areas are determined to understand the spatial distribution pattern of NACCL. Third, the land use transition theory indicates that land use exhibits significant spatial heterogeneity and is influenced by the synergistic effects of multiple factors. This provides theoretical support and a logical basis for using the OPGD model under the “Human-Land-Economy” multi-dimensional framework. Specifically, this framework helps analyze the driving mechanism of NACCL. During this process, Human” serves as the core behavioral agent, with population agglomeration reflected through indicators such as population density and agricultural population size, as well as demand upgrading indicated by rural residents’ per capita disposable income, becoming key variables driving the transformation. “Land” serves as the fundamental carrier, and the resource endowment and spatial pattern composed of its average elevation, annual average precipitation, and soil organic carbon content, among other characteristics, form the physical boundary of transformation. “Economy” functions as the transformation momentum, achieving systemic energy reallocation through industrial restructuring and factor allocation optimization characterized by indicators such as urbanization level, road network density, and various tax revenues. The coupled interactions among these dimensions collectively facilitate the NACCL.

3. Materials and Methods

3.1. Study Area

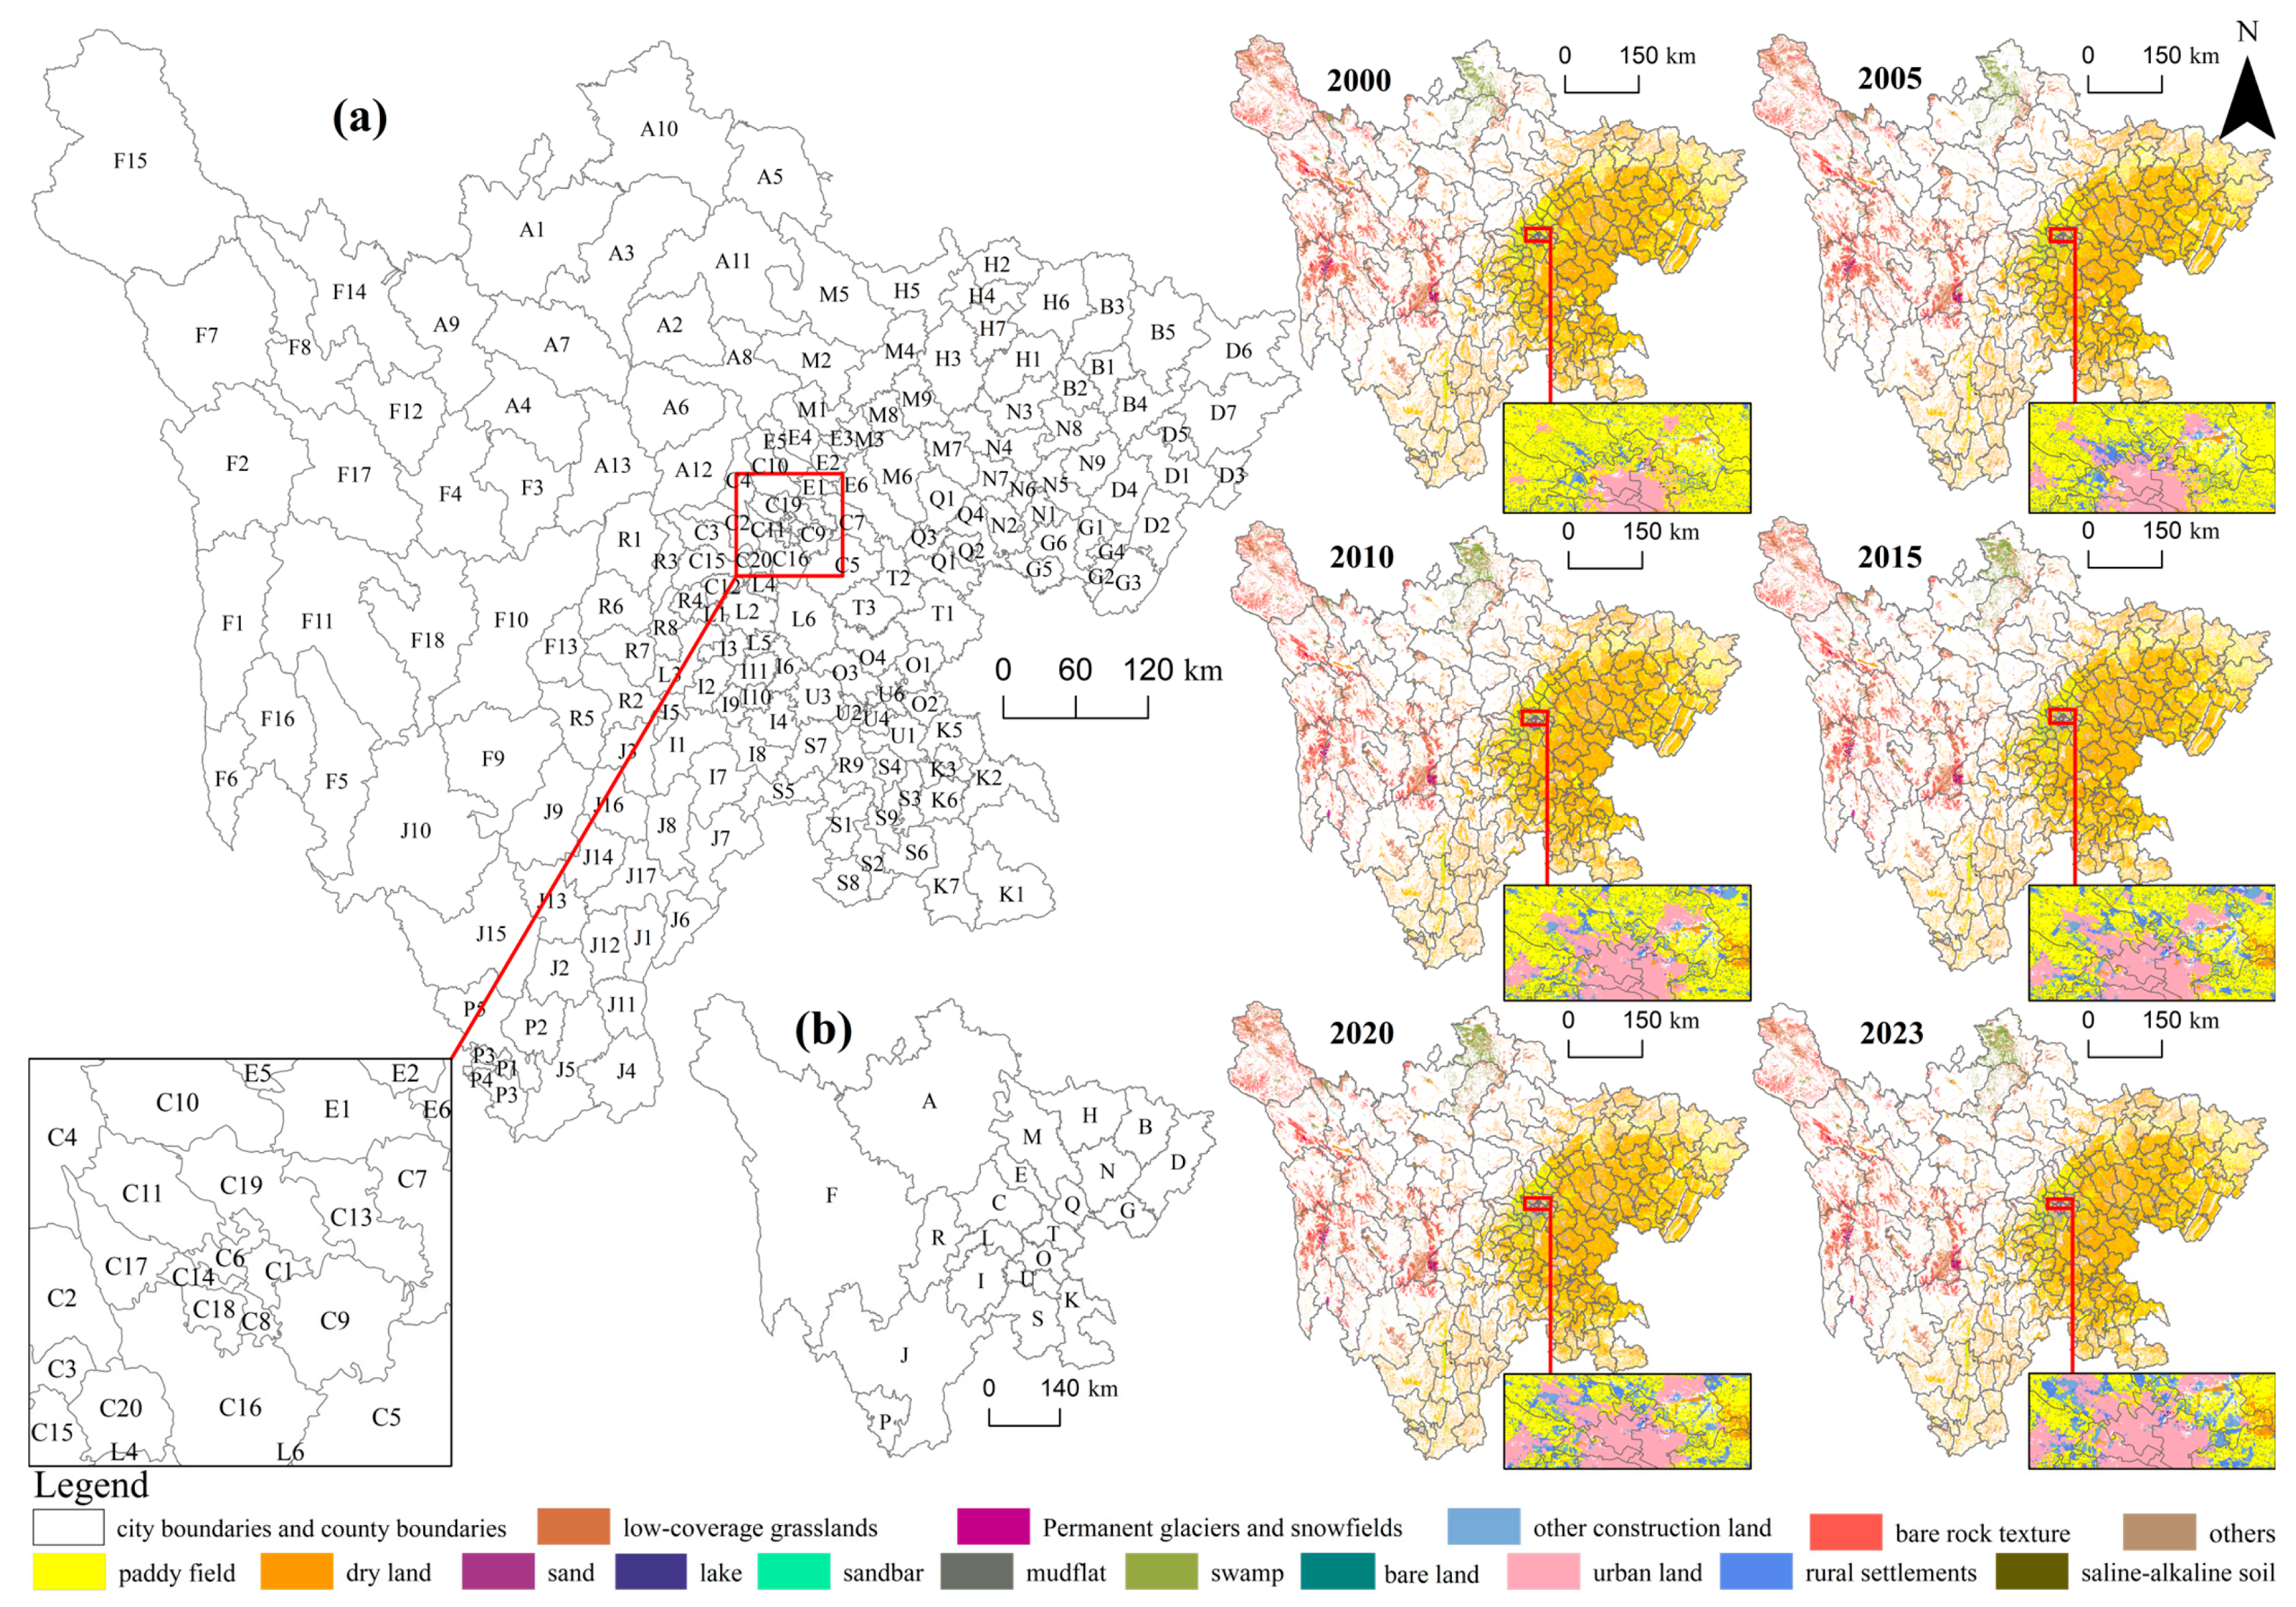
Sichuan Province, situated in Southwest China’s inland area, occupies the upper reaches of the Yangtze River. Geographically, it spans from 26°03′ to 34°19′ north latitude and 97°21′ to 108°12′ east longitude, with a total area of 486,000 square kilometers. It exercises administrative authority over 21 cities and 183 counties. Sichuan Province boasts a highly developed agricultural industry and is renowned as the “Land of Abundance”. In 2023, the agricultural population in Sichuan Province was 33,899,000. Additionally, rural residents’ average disposable income per individual stood at 19,978 yuan. The total highway length reached 418,000 km. Sichuan Province exhibits a geographical pattern with elevated terrain in the west and relatively lower ground in the east, coupled with an extremely complex topographical structure. The highest elevation is 7508.9 m and the lowest is 188 m. There are over 10 soil types showing distinct vertical distribution patterns, and purple soil stands out as a soil type with extensive distribution across Sichuan. The predominant climate type is the subtropical humid monsoon climate, with the southwestern mountainous region belonging to the southwest monsoon climate type and the northwestern alpine plateau region belonging to the alpine climate type. Most of the cultivated land is primarily concentrated in the eastern basin areas and low-mountain and hilly terrains. In contrast, forest land and grassland are mainly found across the mountainous areas that surround the basin and the western alpine high-elevation plateaus (Figure 2).

3.2. Data Sources and Processing

Taking the 183 counties within Sichuan Province as the research entities, we acquired the Digital Elevation Model (DEM) data with a 30 m spatial resolution from the Geospatial Data Cloud platform (https://www.gscloud.cn/, accessed on 31 December 2024). The land use data, with a 30 m spatial resolution, for six periods (2000, 2005, 2010, 2015, 2020, and 2023) were obtained from the Data Center for Resources and Environmental Sciences, Chinese Academy of Sciences (http://www.resdc.cn/, accessed on 31 December 2024). The socio-economic data were obtained from the China County Statistical Yearbook and the Sichuan Statistical Yearbook (2001–2024). Agriculture is a comprehensive sector that involves the cultivation of crops and the rearing of livestock through human intervention, based on an understanding of the biological processes and physiological characteristics of plants and animals to produce various commodities. It includes five industrial forms: crop farming, forestry, animal husbandry, fishery, and sideline industries. In this study, cultivated land, forest land, high-and medium-coverage grasslands among grasslands, as well as rivers and canals, reservoir ponds among water areas are considered agricultural land. Low-coverage grasslands among grasslands, permanent glaciers and snowfields, lakes, tidal flats and mudflats among water areas, urban, industrial and mining, and residential land, unused land, and marine areas are non-agricultural land. When there is a transformation in land use, shifting from agricultural land to non-agricultural land, this process is regarded as the NACCL (Table 1).

3.3. Methodology

County-level Annual NACCL Rate. Based on the NACCL’s definition, when we superimpose the non-agricultural land at the end of the given time frame onto the cultivated land at the start of that same period, the NACCL raster data for this particular time span can be derived. Based on this, we initially determine the area of agricultural land that has been converted to non-agricultural use during each time interval, which represents the non-agriculturalization area for that specific period. Then, we divide this non-agriculturalization area by the total cultivated land area in the same period. After that, we divide the resulting ratio by the number of years in the corresponding period. Through these steps, we can finally obtain the county-level annual NACCL rate in Sichuan Province. The expression is as follows:
R = C t , a b B t , j / t p
Δ C t , a b = ( C t 1 , a C t , a )
where R is county NACCL; t denotes a certain time period; in time period t, B t , j represents the cumulative area of arable land within county j; t p is the number of years in time period t; c t denotes the area of non-agriculturalization in time period t (km2); a is some kind of cultivated land category and a∈{11,12}; b is some kind of non-agricultural land category and b∈{33,44,45,46,51,52,53,61,62,63,64,65,66,67,99}; during time period t, the variable C t , a is used to signify the expanse of agricultural land belonging to class a; C t 1 , a represents the land extent occupied by agricultural class a during the time interval t − 1.
Nonparametric Kernel Density Estimation (KDE). KDE serves as a highly efficient approach for measuring fluctuations in local density and detecting spatial areas with high concentrations, commonly known as spatial hotspots [27]. Its essence lies in deriving a relatively reasonable density function from kernel density estimation values, primarily gauging the impact of a kernel on its adjacent regions [28]. By applying KDE to the county-level annual NACCL rate data from different periods, we can capture the dynamic evolutionary trend of NACCL in Sichuan Province over time. Suppose that the density function of the random variable X is as follows:
f ( y ) = 1 d h j = 1 d   K ( x j x ¯ h )
K ( x ) = 1 2 π e ( x 2 2 )
where d = 183; x ¯ is the meaning of the county-level annual NACCL rate; x j is the average county-level annual NACCL rate in county j; h is the bandwidth. The distributional dynamics were analyzed using Gaussian kernel density.
Moran’s I. Moran was the pioneer in introducing a technique for gauging the degree of spatial clustering to examine the spatial arrangement of two or more entities [29]. The global Moran’s I index serves to quantify the spatial concentration degree of NACCL within a given study region, and the local Moran’s I can show the extent of spatial association among different regions. The calculation formulas are as follows:
Moran s   I = d i = 1 d   j = 1 d   w i j ( x i x ¯ ) ( x j x ¯ ) i = 1 d   j = 1 d   w i j i = 1 d   ( x i x ¯ ) 2
I i = ( x i x ¯ ) j = 1 d   W i j ( x j x ¯ ) S 2
where d = 183; x i and x j are, respectively, the average annual NACCL rate in county-level units i and j; x ¯ represents the average NACCL rate of n county-level units; w i j is the binary adjacency spatial weight matrix, when county i is adjacent to county j the w i j weight is 1, and when county i and county j are not adjacent to each other the w i j weight is 0. Moran’s I falls within the interval of [−1, 1]. A positive value of Moran’s I suggests a clustered spatial pattern within the distribution. In this case, the NACCL rate is larger, and the spatial correlation becomes more prominent. Conversely, a negative Moran’s I value signifies a dispersed pattern in spatial distribution. Here, the NACCL rate is smaller, and the spatial disparity is more significant. If Moran’s I equals 0, the spatial pattern is random. S denotes the standard deviation, while Ii refers to the local Moran’s I index for an individual county.
Optimal Parameters-based Geographical Detector (OPGD) Model. Spatial heterogeneity constitutes a fundamental characteristic of geographical systems. As a statistical method, the geographical detector is designed to identify and leverage this spatial heterogeneity [30]. It is extensively employed to analyze the driving factors behind spatially heterogeneous phenomena [31,32]. The OPGD model generates a collection of candidate parameterization schemes—including methods such as natural breaks, equal intervals, quantiles, and geometric intervals—along with the corresponding interval counts for every continuous explanatory variable. For each parameterization scheme, the model employs the factor detector to compute its associated q-value. The set of parameters that yields the highest value is identified as the optimal discretization scheme, thereby improving the reliability of spatial analytical outcomes [33]. The factor detector constitutes the core module of the OPGD model. It quantifies the explanatory power of driving factors for NACCL in Sichuan Province by calculating q-statistics, which measure the relative importance of each explanatory variable. The interaction detector employs these q-statistics to assess the strength of interactive effects between paired spatial variables, identifying five interaction types: nonlinear attenuation, univariate attenuation, bivariate enhancement, independence, and nonlinear enhancement [34]. The q-statistic measures the percentage of variation in the NACCL rate that can be attributed to each driving factor or interaction, calculated across the entire study area as:
q v = 1 j = 1 M ( N v , j 1 ) σ v , j 2 ( N v 1 ) σ v 2
In this formula, N v and σ v 2 denote, respectively, the total county-level annual NACCL rates and their aggregate variance across Sichuan Province. Meanwhile, N v , j and σ v , j 2 refer to the sample size and variance within each stratum j, where j ranges from 1 to 183. A higher q-value indicates stronger explanatory power of the variable in question.

4. Results

4.1. Time-Varying Characteristics of NACCL in Sichuan Province

To analyze the spatiotemporal dynamics of NACCL across Sichuan Province, the annual NACCL rate for each county-level unit was computed for distinct research periods using Equations (1) and (2). Using these calculated results as the data foundation, a further analysis of the spatiotemporal evolution patterns is conducted.
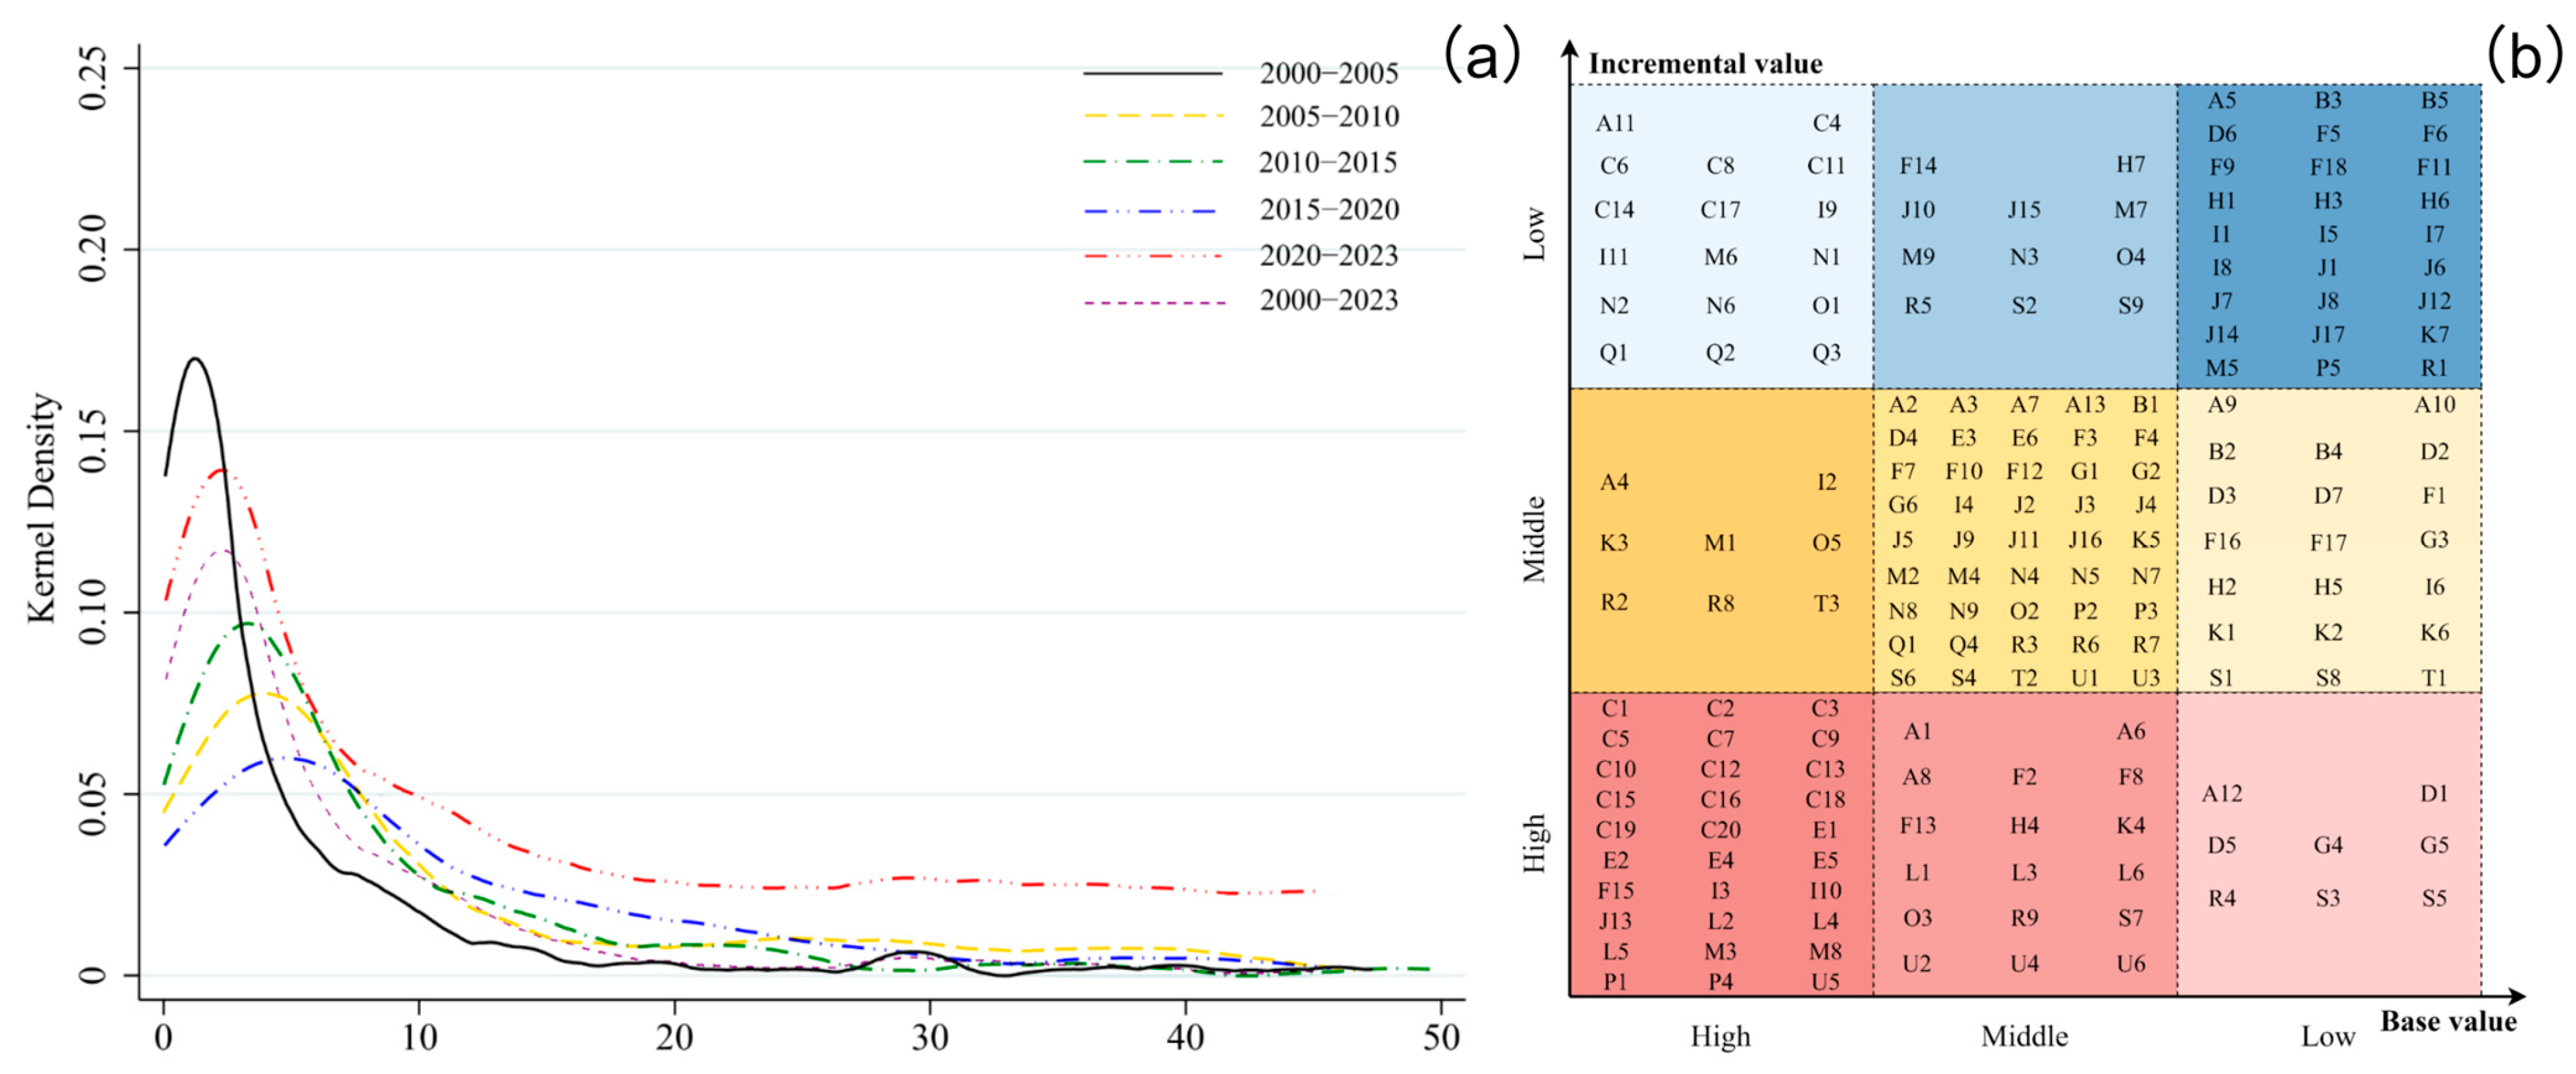
Based on Formulas (3) and (4), kernel density curves are plotted to depict the dynamic evolution process of NACCL in Sichuan Province from 2000 to 2023, as illustrated in Figure 3a. In terms of the offset position of the peak center of these curves, except for the slight left shift in the curves and main peak positions in the 2010–2015 and 2020–2023 periods compared with the preceding periods, the curves and main peak positions in the remaining periods generally exhibit a right-shift tendency. This indicates that the NACCL level in Sichuan Province increased rapidly during the initial period, followed by a gradual deceleration in subsequent years. Regarding changes in the peak shape, the overall peak value decreases, and the peak shape transforms from sharp and narrow to flat and wide. NACCL shows weakening polarization and increasing multi-polarization trends. In terms of the distribution’s extensibility, the “right-tail” gradually widens, which implies that the non-equilibrium of NACCL in Sichuan Province has weakened, the absolute gap between the highest and lowest levels of NACCL is narrowing, and regional differences are also gradually decreasing.
During the research period spanning from 2000 to 2023, a 3 × 3 matrix graph was constructed. The horizontal axis corresponds to the base-period values, which refer to the initial measurements of cultivated land non-agriculturalization indicators at the beginning of the study. These values were classified into three tiers: the highest tercile, the central 40%, and the lowest tercile. The vertical axis represents the added values, indicating the increases in these indicators over the study period, and adopts the same three-tier classification. Thus, based on the calculation results, the 183 counties across the province were placed into the corresponding matrix quadrants, enabling the visual presentation of the change characteristics of NACCL at the county level. From Figure 3b, the bottom-left quadrant (high base-period value-high incremental value) contains 30 counties, namely: 14 counties under the jurisdiction of Chengdu city, such as C18; 4 counties under the jurisdiction of Deyang City, such as E1; 3 counties under the jurisdiction of Meishan City, such as L4; 2 counties each from I10 under Leshan City, M3 under Mianyang City, and P1 under Panzhihua City; and 1 county each from U5 of Zigong City, J13 of Liangshan City, and F15 of Ganzi city. The top-right quadrant (low base-period value-low incremental value) encompasses 27 counties. Specifically, it includes 7 counties in Liangshan city, like J8; 5 counties in Ganzi city, like F9; 4 counties in Leshan city, like I5; 3 counties in Guangyuan City, like H6; 2 counties in Bazhong city, like B3. The other 6 counties are D6 (in Dazhou City), M5 (in Mianyang City), P5 (in Panzhihua City), A5 (in Aba city), R1 (in Yaan City), and K7 (in Luzhou City) (County codes are detailed in Appendix A).
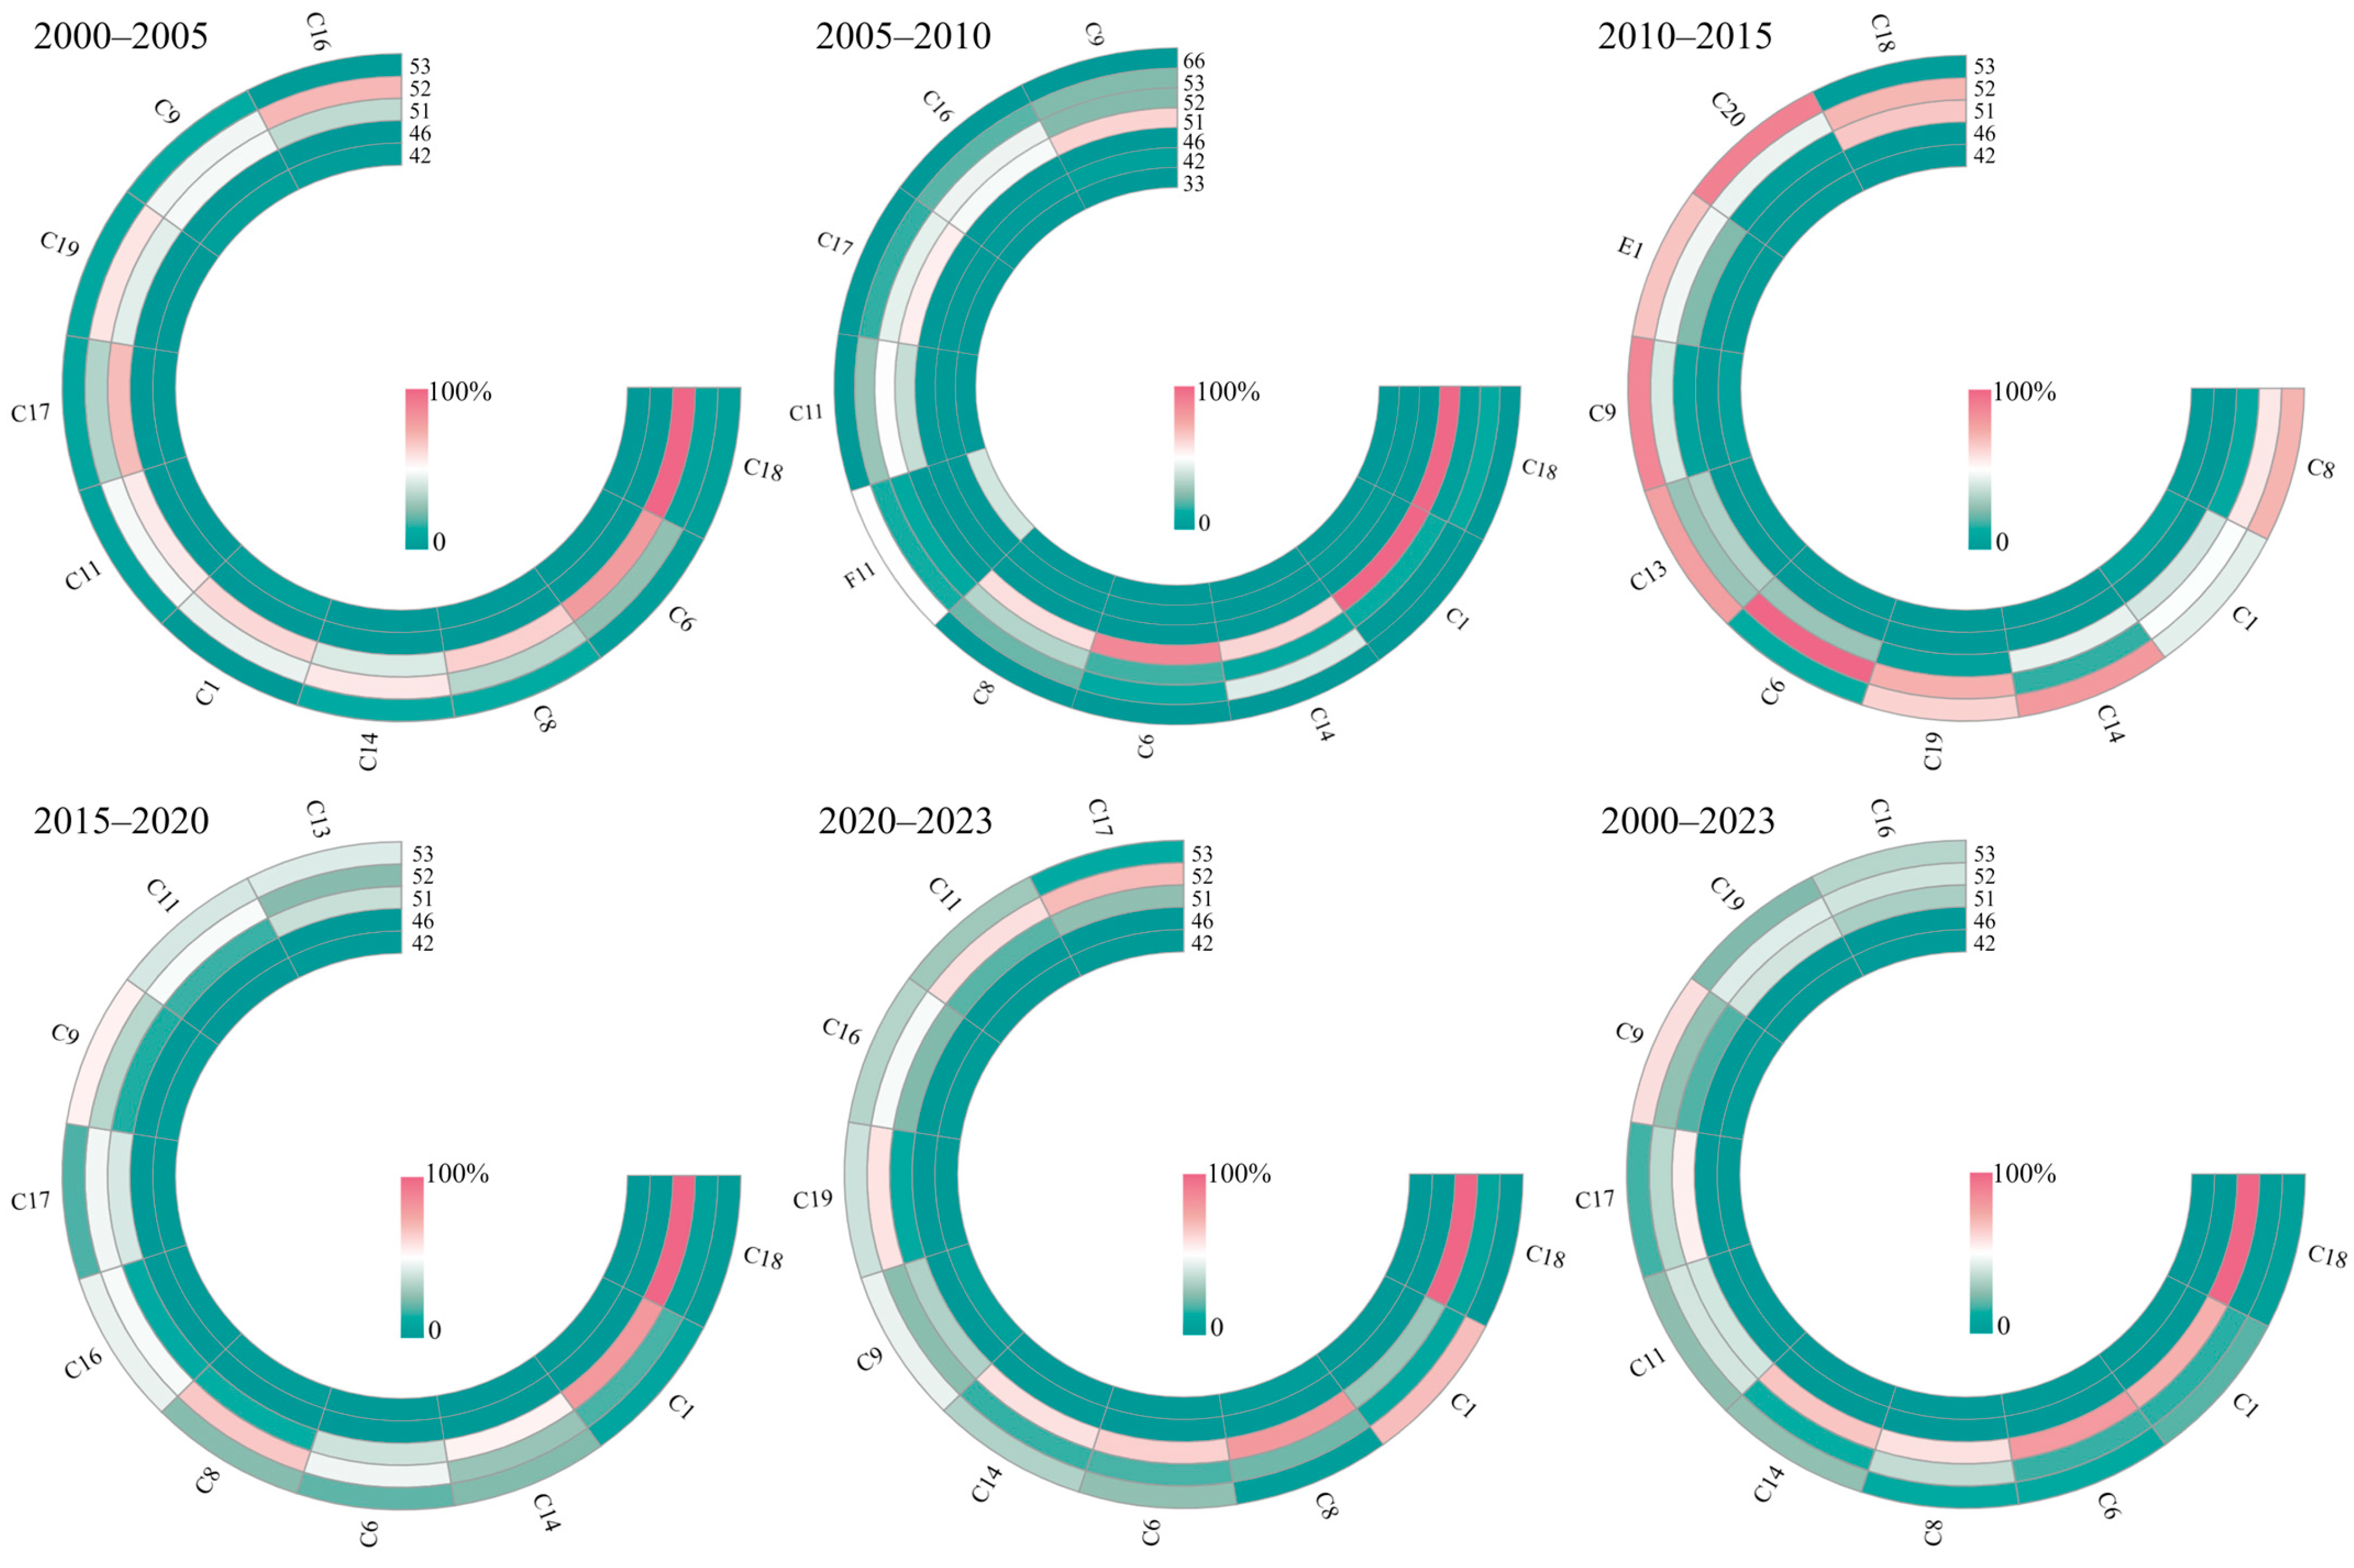
As shown in Figure 4, the NACCL in Sichuan Province exhibits a diversified pattern dominated by urban land and supplemented by other land types. Specifically, most NACCL involves conversion to urban land, while some cultivated land is transformed into low-coverage grassland, lakes, and unused land.
As presented in Table 2, the top 10 counties with the highest county-level annual NACCL rates from 2000 to 2005 are, in order, C18 (11.81%), C6 (8.48%), C8 (7.96%), C14 (4.94%), C1 (3.22%), C11 (2.23%), C17 (1.94%), C19 (1.72%), C9 (1.34%), and C16 (1.16%) (Appendix A). Notably, the structure of converted land types varied significantly across districts: in C18, urban land conversion constituted 90.91% of the total converted area, while in C6, it accounted for 72.53%. By contrast, C14, C19, C9, and C16 were primarily characterized by rural residential land conversion, with proportions of 51.78%, 52.26%, 42.62%, and 64.04%, respectively. C1 and C11 exhibited a balanced conversion between urban land and rural residential land. Furthermore, land type differentiation in C17 and C19 included other construction land (6.5–10%) and minor conversions of lakes and beaches, highlighting the diversified pathways of the NACCL process.
Between 2005 and 2010, the conversion pattern dominated by urban land use persisted, but the differentiation characteristics became more evident. Among the top ten counties in terms of the proportion of the annual NACCL rate, F11 replaced C19, while the other nine counties only saw ranking changes. Urban land conversion remained predominant in C18 (86.63%), C6 (75.89%), and C8 (51.70%); C14 and C1 also transitioned to an urban land-dominated conversion pattern. Meanwhile, regions C9 and C16 were characterized by a dual predominance of conversion into built-up areas. Notably, F11 stood out as the only district where sparse vegetation cover and exposed bedrock constituted the major sources of converted land. This distinct pattern highlights a unique NACCL pathway in ecologically fragile zones, differing markedly from other regions.
Between 2010 and 2015, urban construction land dominance weakened while other construction land’s share rose significantly. Compared to the previous two periods, C18 fell from first to sixth place, and C8 emerged as the new core area. Surrounding regions—including C13, E1, and C20—ranked among the top 10 for the first time, reflecting the spatial expansion of non-agricultural conversion. Other construction lands emerged as the primary source of converted area. Only region C18 continued to exhibit the co-dominance of conversion to built-up areas. In region C6, conversion of rural settlements represented nearly three-quarters of all converted land. In contrast, C19 showed a more even distribution of conversion, involving both rural built-up areas and other developed land types. Furthermore, the share of ecological land derived from lakes and coastal zones experienced a modest rise, reflecting increased environmental constraints within land use transitions.
Between 2015 and 2020, the NACCL exhibited relative stability in conversion patterns, with traditional counties retaining their dominant transformation roles. This stability underscores the phased continuity of regional NACCL dynamics. Specifically, in suburban districts such as C16, C17, and C11, rural residential land conversion accounted for over 44% of total changes, while other construction land reached 51.25% and 40.13% in C9 and C13, respectively. These patterns highlight intensified cultivated land loss due to central urban population outflow and industrial park expansion.
Between 2020 and 2023, the land conversion pattern shifted toward a unipolar concentration trend, with peripheral counties dropping out of the high-conversion rankings and land use transition accelerating into a mature phase. Meanwhile, the dominance of urban construction land further consolidated in core districts such as C18 and C8, while peripheral regions like C9 demonstrated simultaneous land use functional restructuring and intensified ecological protection constraints.

4.2. Spatial Evolution Characteristics of NACCL in Sichuan Province

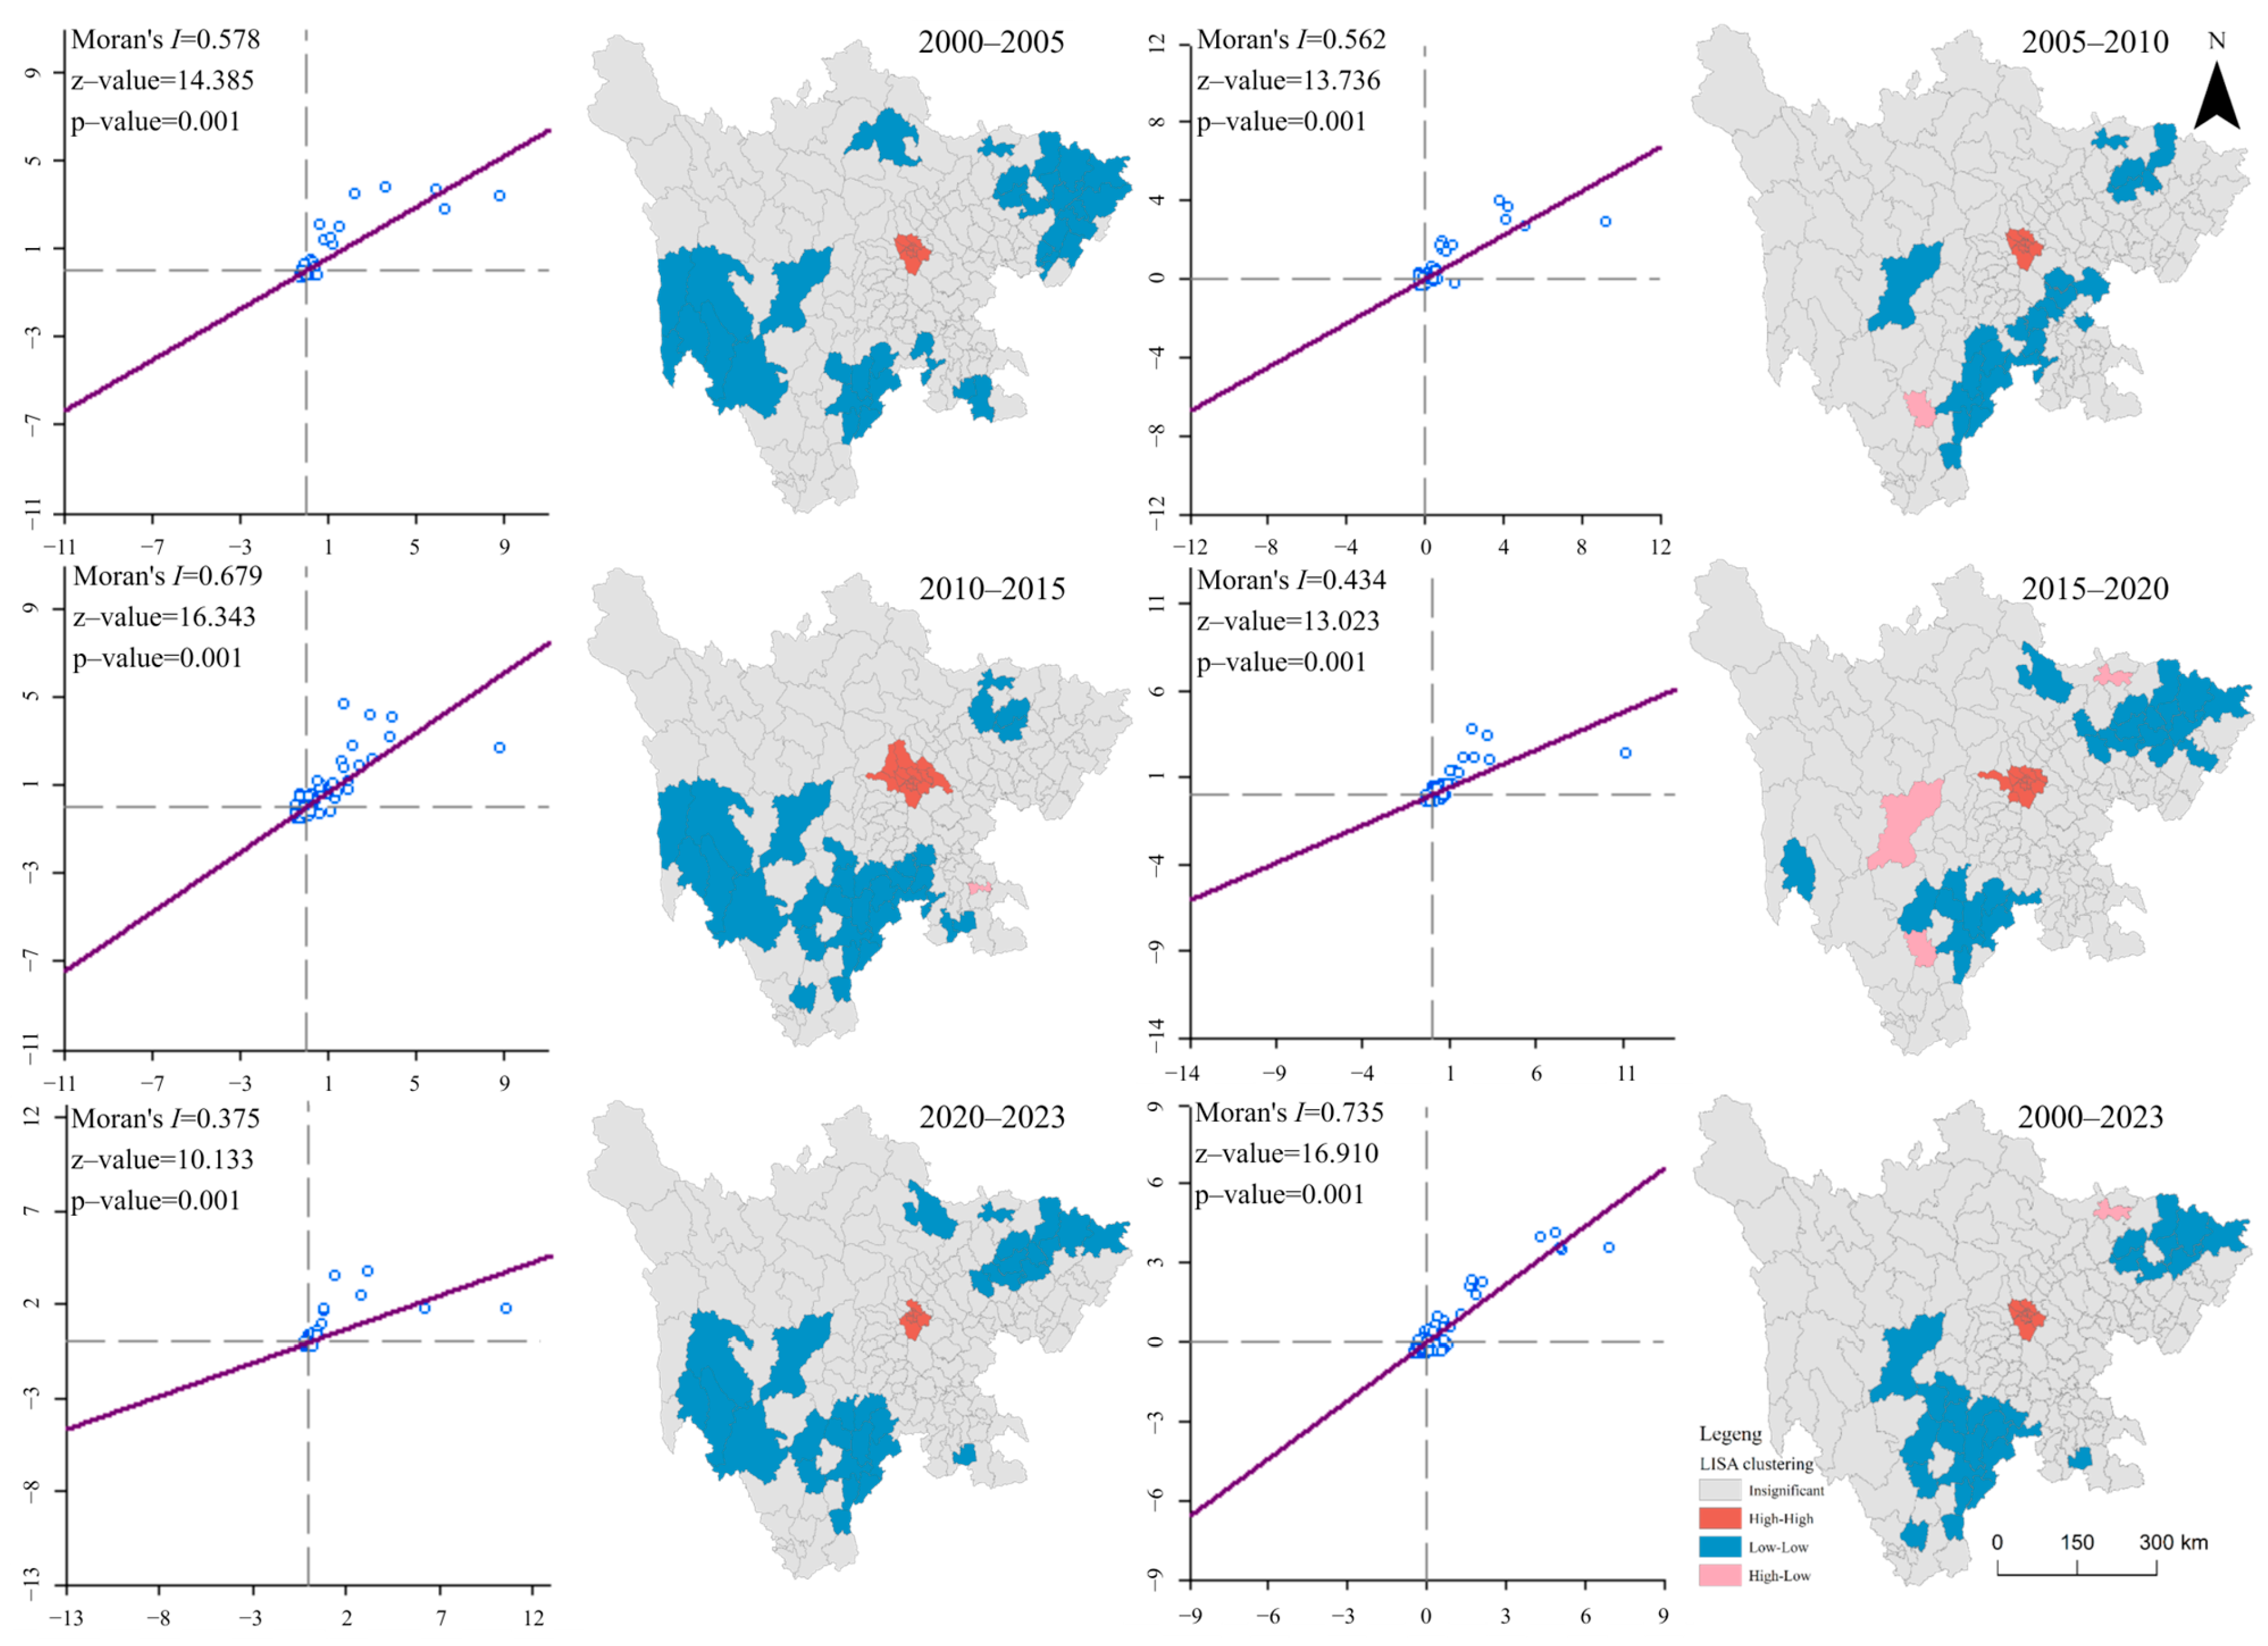
To investigate the spatial clustering patterns of NACCL across Sichuan Province in greater detail, this study employs both Global and Local Moran’s I indices. These metrics, calculated following Equations (5) and (6), are used to evaluate the spatial autocorrelation of NACCL. The results are presented in Figure 5. Throughout the analysis period, Global Moran’s I values for NACCL were consistently positive and statistically significant. The majority of scatter points clustered within quadrants I and III, suggesting that the NACCL process in Sichuan Province exhibited strong positive spatial autocorrelation. Moreover, counties characterized by a “High-High” clustering pattern have persistently formed a spatial core enclosed by the regions C9, C16, C17, C11, and C19. The “Low-Low” agglomeration counties are in B5, J16, S6, S7, and their surrounding areas. This demonstrates that the NACCL in Sichuan Province has strong spatial spillover effects. Regions with high NACCL levels can drive the NACCL process in surrounding counties through spatial interactions, forming a spatial agglomeration pattern. Conversely, counties with low NACCL levels are often constrained by insufficient endogenous development momentum and find it difficult to improve their NACCL levels through independent development.
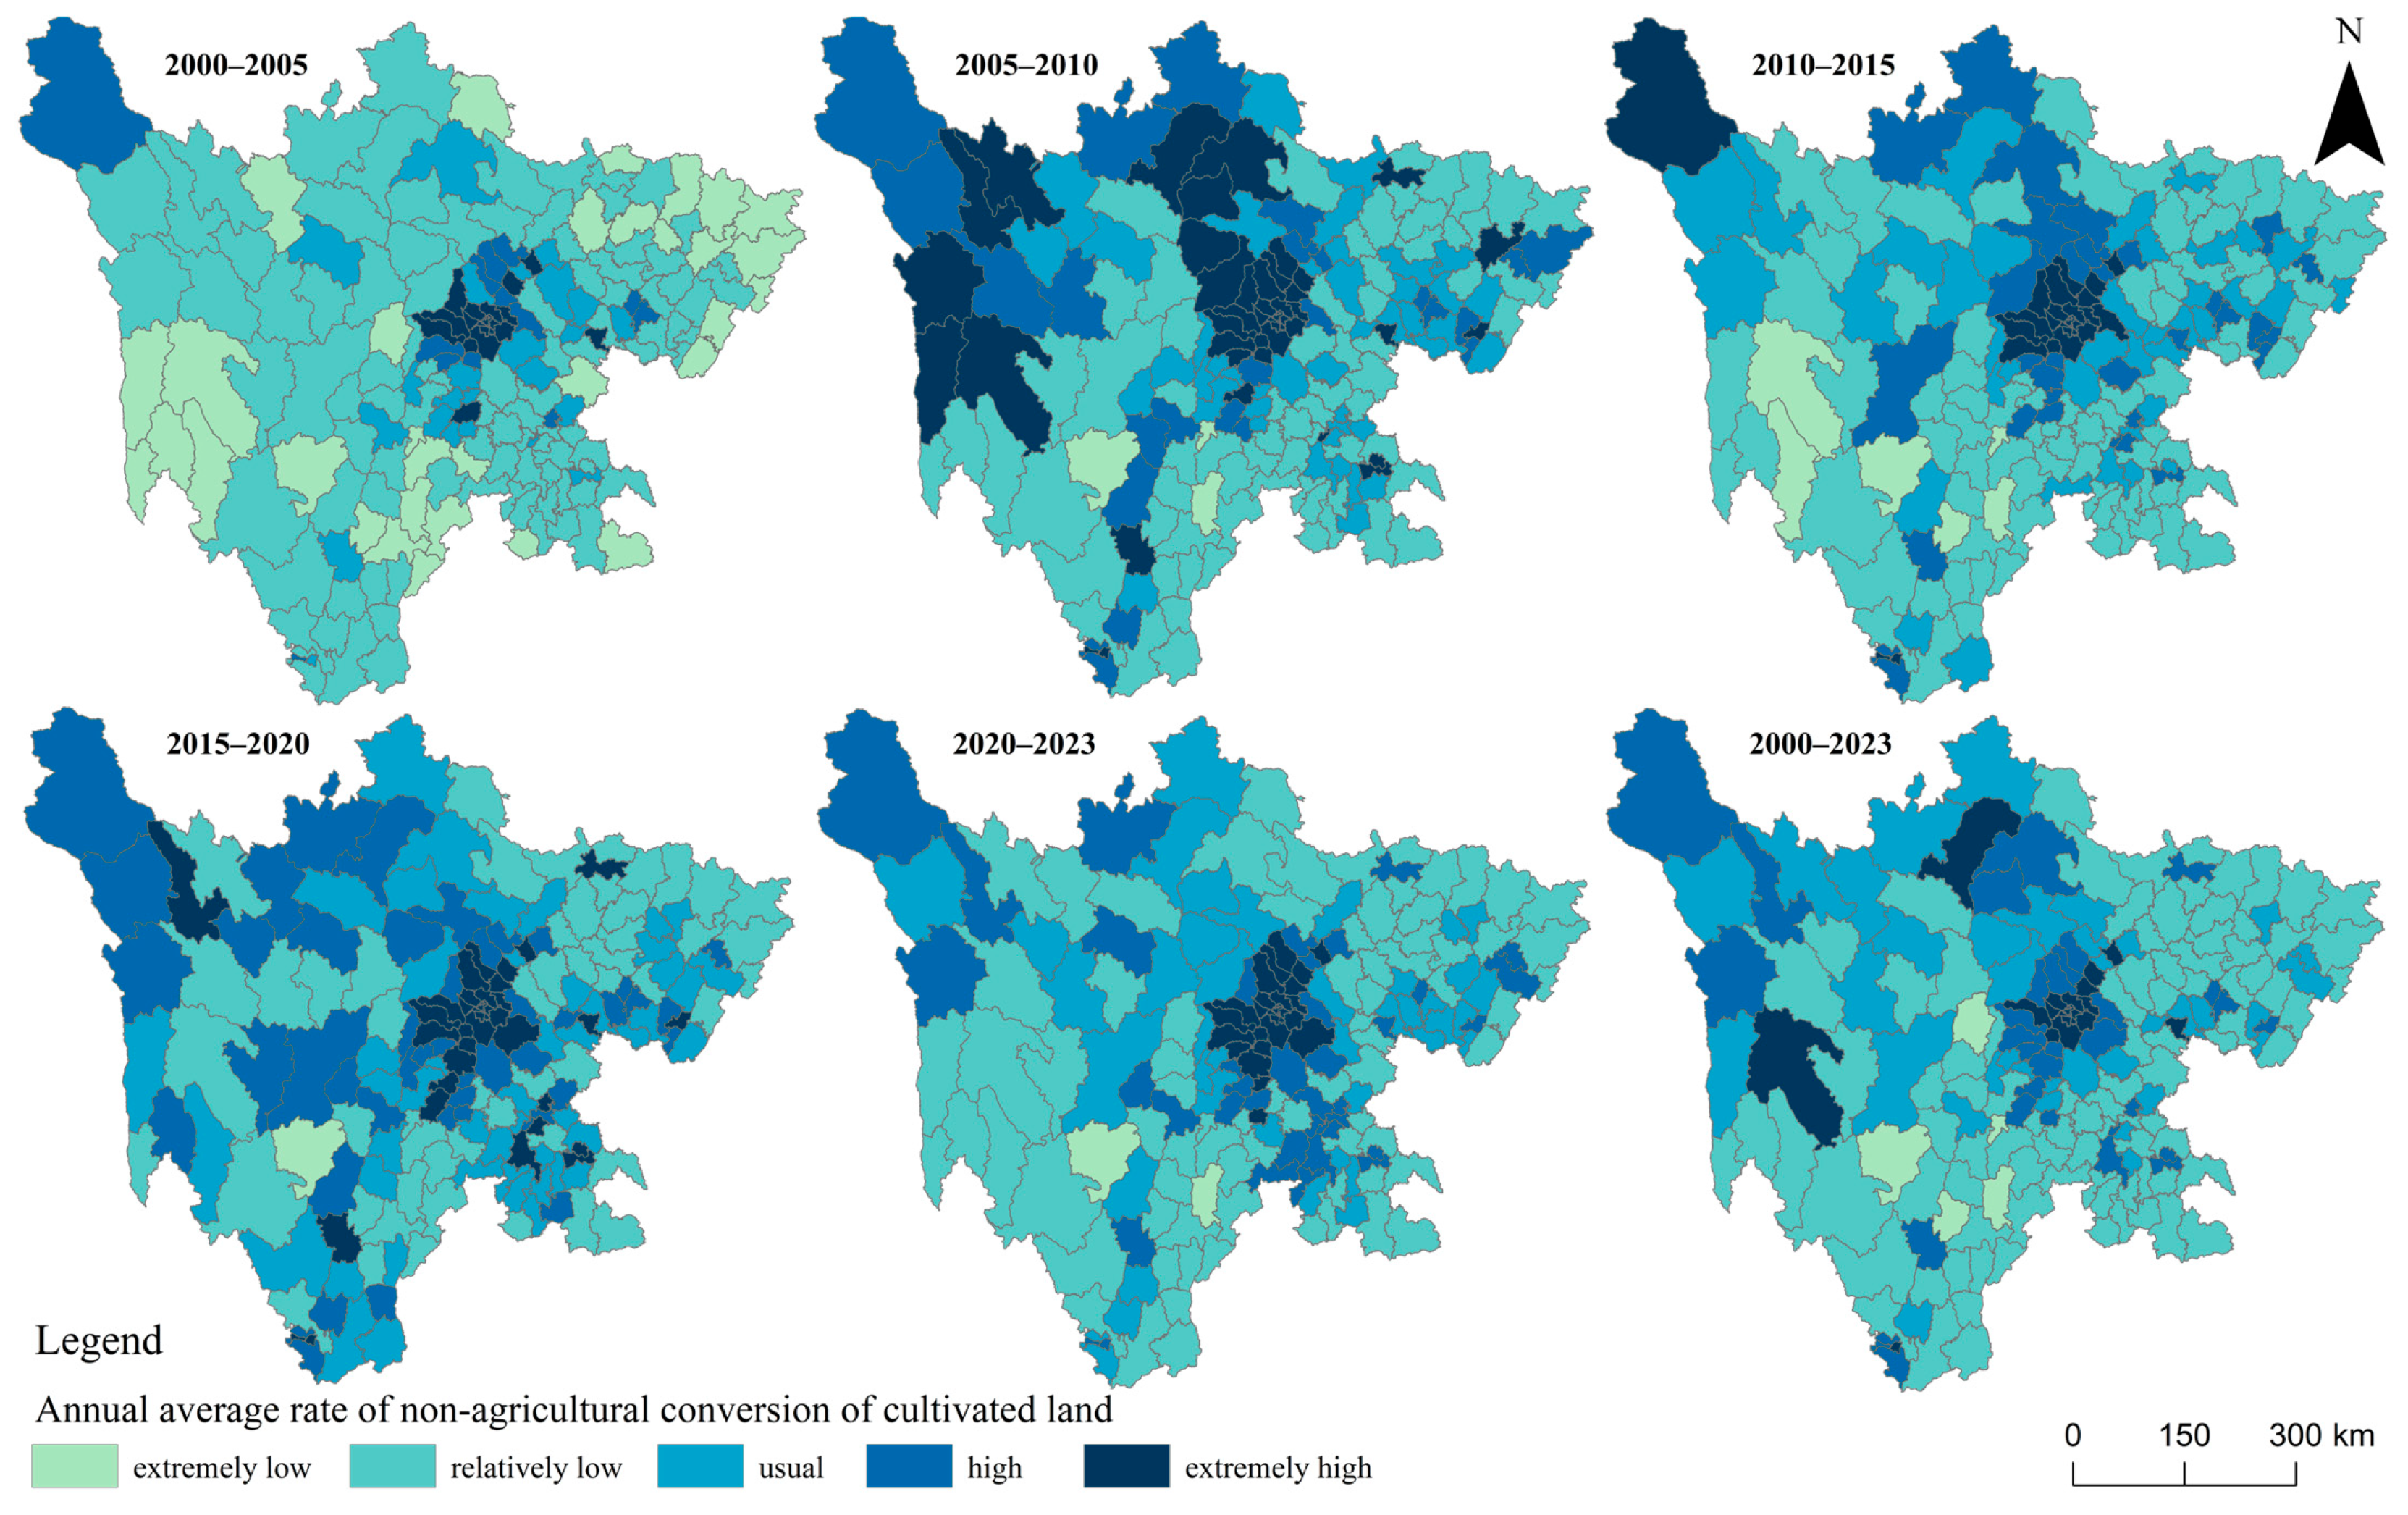
At the spatial scale, the evolution of NACCL in Sichuan Province was examined through county-level annual NACCL rate maps (2000–2023) (Figure 6). The analysis revealed a radial expansion of NACCL rates from urban cores to peripheral regions, accompanied by pronounced temporal and inter-county disparities. Specifically, high-value clusters underwent outward expansion, while low-value areas exhibited a stable yet fragmented spatial distribution.
During the study period, the region centered on the “C18-C6-C8-C14-C1” cluster and including near-suburban counties such as C11, C17, and C16, consistently formed the epicenter of extremely high NACCL rates in Sichuan Province. As Chengdu enacted its multi-directional urban spatial strategy, the metropolitan core area progressively extended its influence. Capitalizing on its status as the provincial capital and national policy incentives, this region consistently ranked among the top NACCL rates across Sichuan’s 183 counties, driven by accelerated urbanization and robust economic growth, thereby shaping the provincial NACCL spatial pattern. Beyond the persistently high-value epicenter, secondary high-value clusters emerged intermittently across periods, with their spatial distributions shifting dynamically over time.
Between 2000 and 2005, a core spatial cluster emerged around I11, M3, Q2, and E2, with notable spatial diffusion observed in adjacent counties such as I3, M1, and Q3. From 2005 to 2010, the counties with extremely high NACCL rates surged from 19 to 44, forming a multi-nodal agglomeration encompassing A3, B4, E1, F11, G4, J13, K4, and P1 while peripheral counties like A11, D5, and F2 simultaneously experienced elevated NACCL levels. A temporary decline occurred between 2010 and 2015, with F15 being the sole addition to the extremely high-value category. During 2015–2020, the number of such counties recovered to 37, as new cores emerged in F8, I2, L4, O5, S1, and U4, accompanied by rising NACCL rates across most regions. From 2020 to 2023, the intensity of NACCL diminished, with I10 being the only newly designated extremely high-value area.
Meanwhile, except during the base period—when numerous counties exhibited extremely low NACCL rates, subsequent study periods revealed that such counties were predominantly clustered in F9, J8, I5, F5, and J14. These regions, situated mainly on plateaus or in mountainous areas, are marked by rugged terrain and scattered, poor-quality arable land, which inherently constrains large-scale development. Moreover, their fragile economic conditions, lagging industrialization and urbanization, and minimal demand for non-agricultural land use further diminish conversion pressures. Strict ecological conservation policies also act as a critical barrier to arable land requisition, compounding these effects. Consequently, these combined factors sustain consistently low NACCL rates across these counties.

4.3. Analysis of NACCL Driving Mechanisms in Sichuan Province

4.3.1. Selection of Driving Factors

Humans and the natural environment are two key elements that are interdependent and mutually constraining in the human-ecological system. Changes in land use types serve as a clear manifestation of the dynamics within human-environment systems. Meanwhile, NACCL is also the outcome of the interaction between humans and the land. Human, land, and economy are the core elements of agricultural development, and there are intricate interactions among them. This very interaction precisely drives the transformation of agricultural land use types [35].
Humans, as direct land users, form the most crucial micro-decision-making entities in cultivated land utilization [36,37]. The natural environmental elements of land not only impose substantial constraints on agricultural production but also serve as core factors in optimizing the layout and structure of agricultural production. Climatic conditions offer essential support for agricultural production [38]. Soil functions as a vital substrate for crop growth [39], while topographical characteristics significantly influence the promotion of agricultural mechanization, the spatial arrangement of crop cultivation, and optimizing cropping systems and farm management. Moreover, regional economic development exerts a crucial influence on the occurrence and intensity of NACCL. Economic driving forces have emerged as one of the key factors prompting farmers to transition to non-agricultural activities [40]. Economically advanced regions often experience accelerated urbanization and industrial growth. The “siphon effect” of large cities substantially diminishes farmers’ willingness to engage in agriculture, further intensifying the passive NACCL [41].
To conclude, drawing upon the research outcomes documented in references [42,43], and considering the accessibility of research data as well as the enrichment of the “Human-Land-Economy” framework’s connotation, this study opts for 18 non-agricultural transformation factors to establish an indicator system (Table 3). The objective is to pinpoint the principal driving forces behind NACCL in Sichuan Province.

4.3.2. Factor Detection Analysis

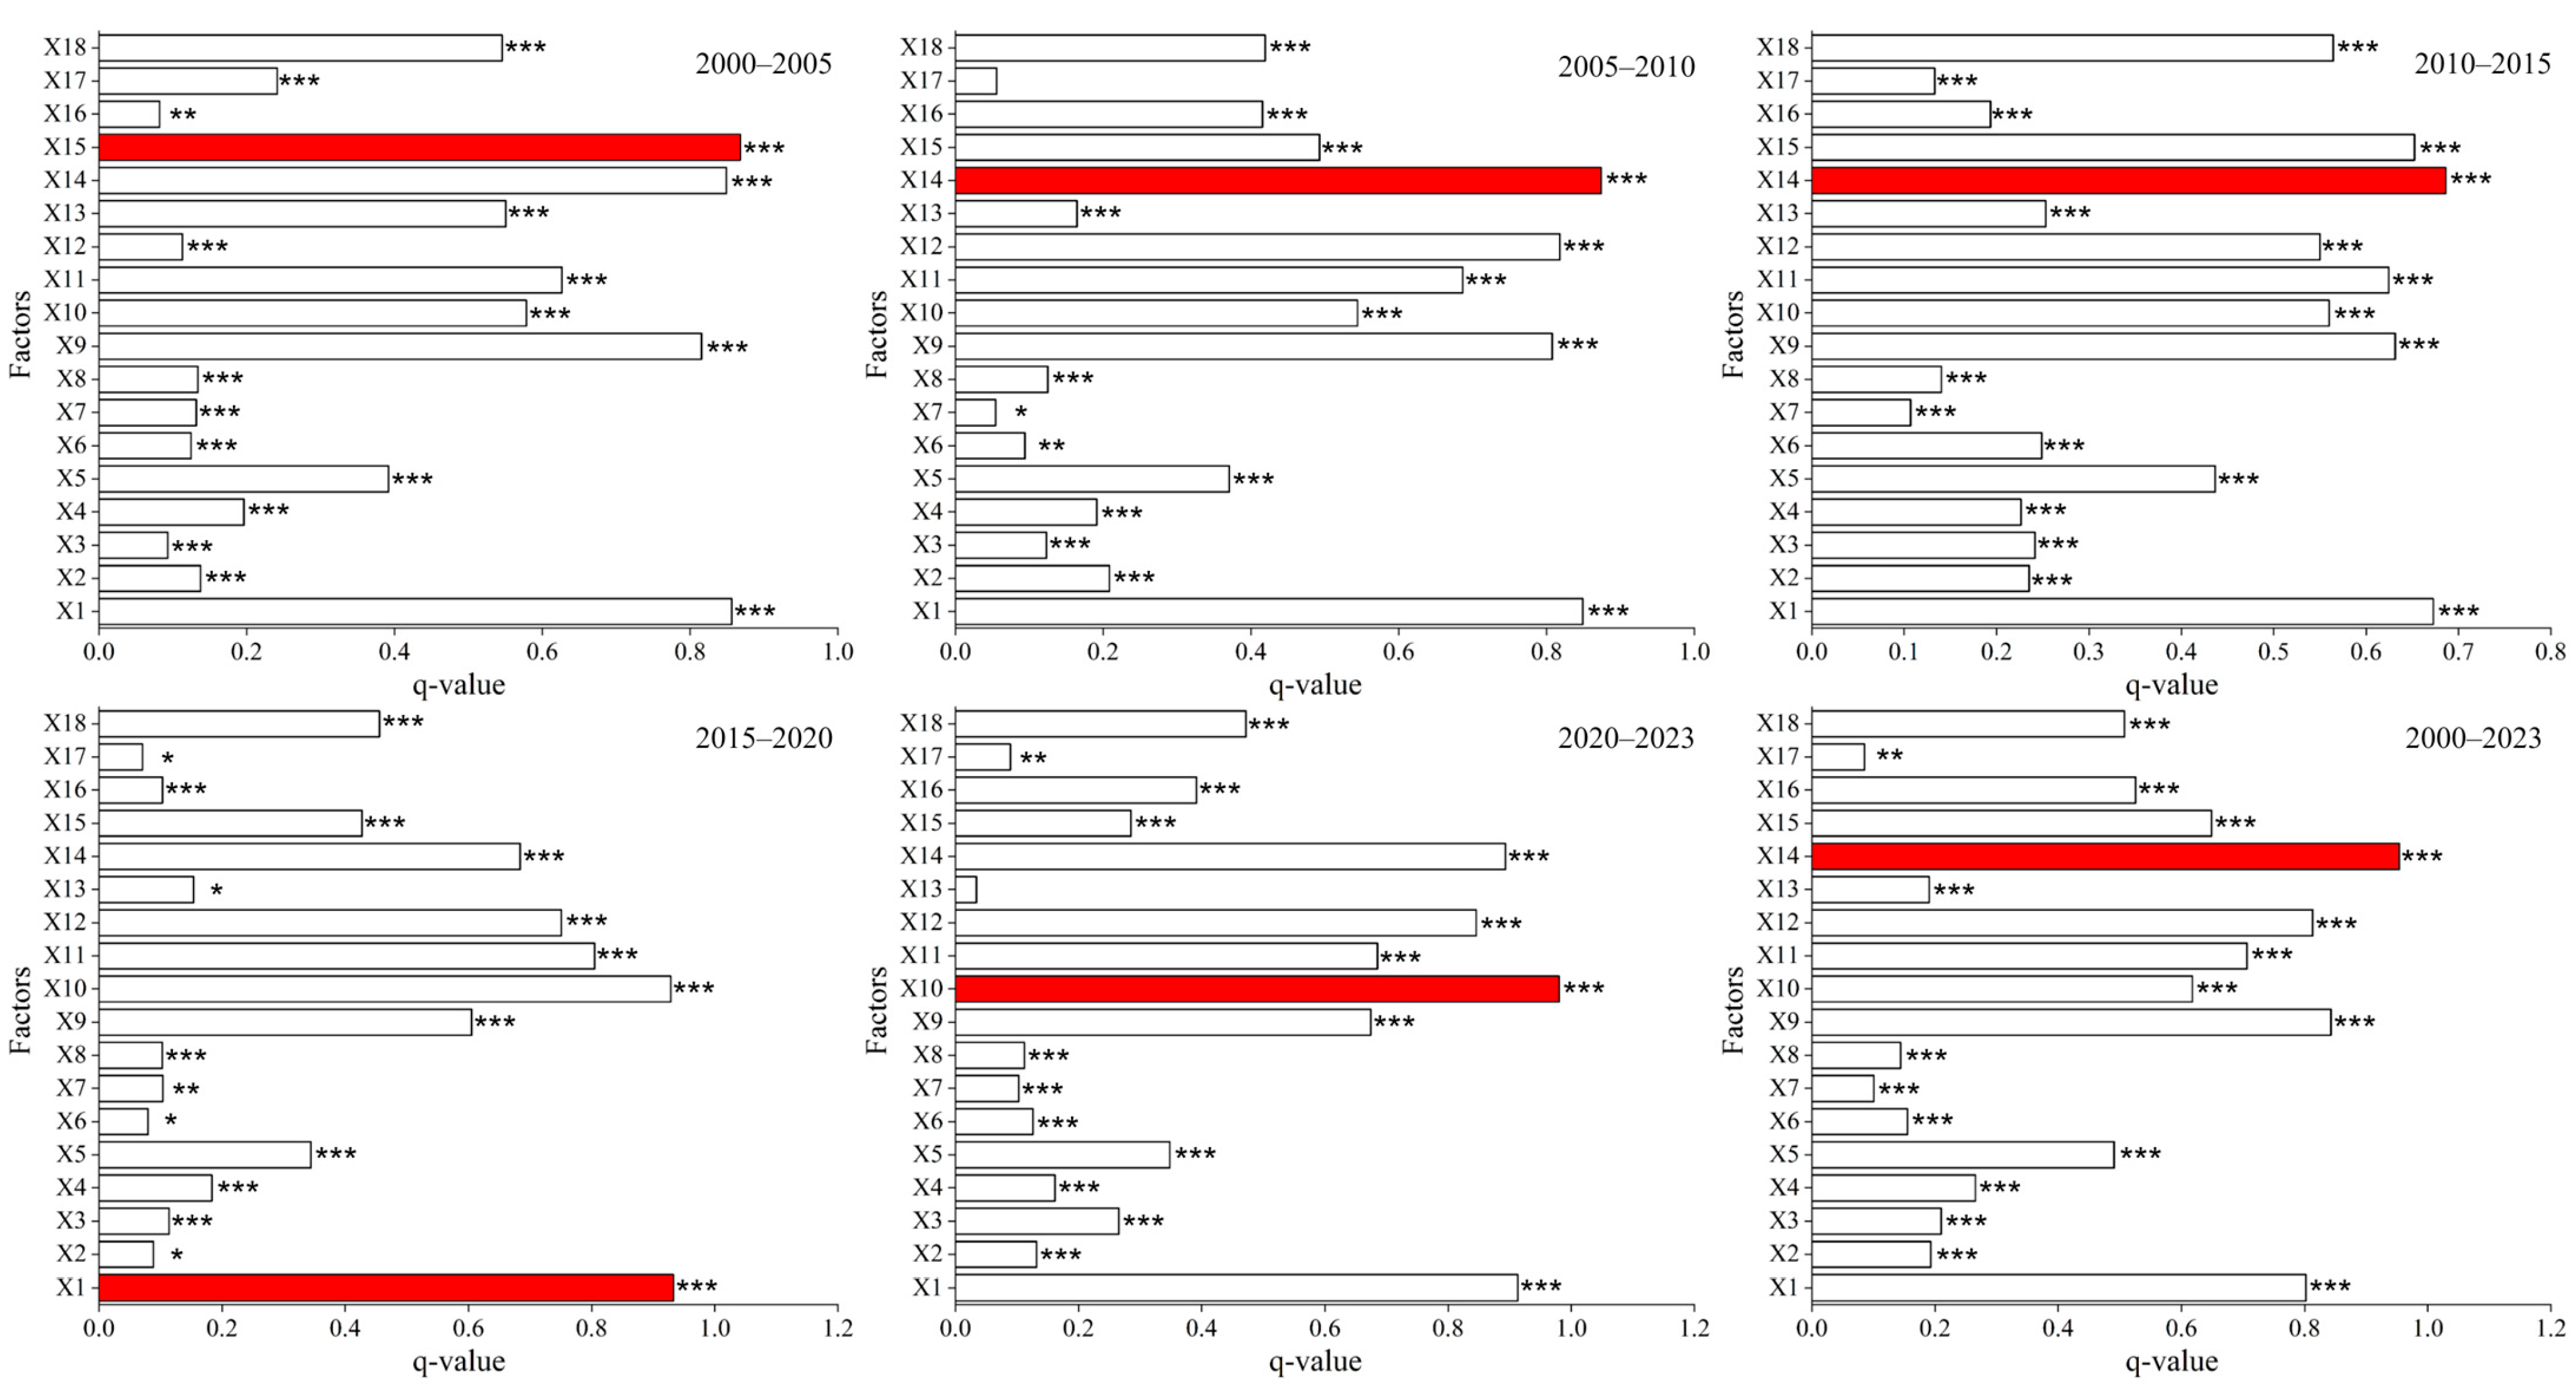
Factor detection was applied via the OPGD model following Equation (6), to quantify the influence of individual drivers on the annual NACCL rate at the county level across Sichuan Province (Figure 7). The county-level annual NACCL rates are selected as the dependent variables for six time periods: 2000–2005, 2005–2010, 2010–2015, 2015–2020, 2020–2023, and 2000–2023. Meanwhile, 18 driving factor indicators are set as independent variables. The data is imported into the “GD” package to perform the analysis with the OPGD. Based on previous research and data attributes, the classification intervals for independent variables were determined to range from 3 to 8 classes. After comparing five discretization methods, the optimal q-value is determined.
In the factor detection analysis stage, except for factor X17 in 2005–2010 and factor X13 in 2020–2023, the remaining factors passed significance tests with varying degrees of significance. The findings demonstrate that among various factors, the share of urban construction land holds the highest level of explanatory capacity. It is crucial for explaining the spatial heterogeneity of NACCL. Specifically, during 2000–2005, real estate development investment shows the strongest explanatory power (q = 0.8679). In the two research periods 2005–2010 and 2010–2015, the explanatory power of the proportion of urban construction land stands out as the most significant (q = 0.8737; q = 0.6861). During 2015–2020, the explanatory power of population density reaches its peak (q = 0.9330). And during 2020–2023, the level of urbanization demonstrates the strongest explanatory power (q = 0.9804).
Analysis from 2000 to 2023 identifies the five factors of greatest explanatory influence as follows: urban construction land proportion (q = 0.9537), soil pH (q = 0.8427), road network density (q = 0.8131), population density (q = 0.8023), and per capita GDP (q = 0.7066). Some “human” and “land” factors consistently exhibit a certain explanatory power for the NACCL in Sichuan Province, and their explanatory strengths show dynamic changes. This suggests that the spatiotemporal pattern of non-agricultural conversion of cultivated land in Sichuan arises from the complex interplay of human, land, and economic factors. Among them, the “economy” factor plays a more dominant role.

4.3.3. Interaction Detection Analysis

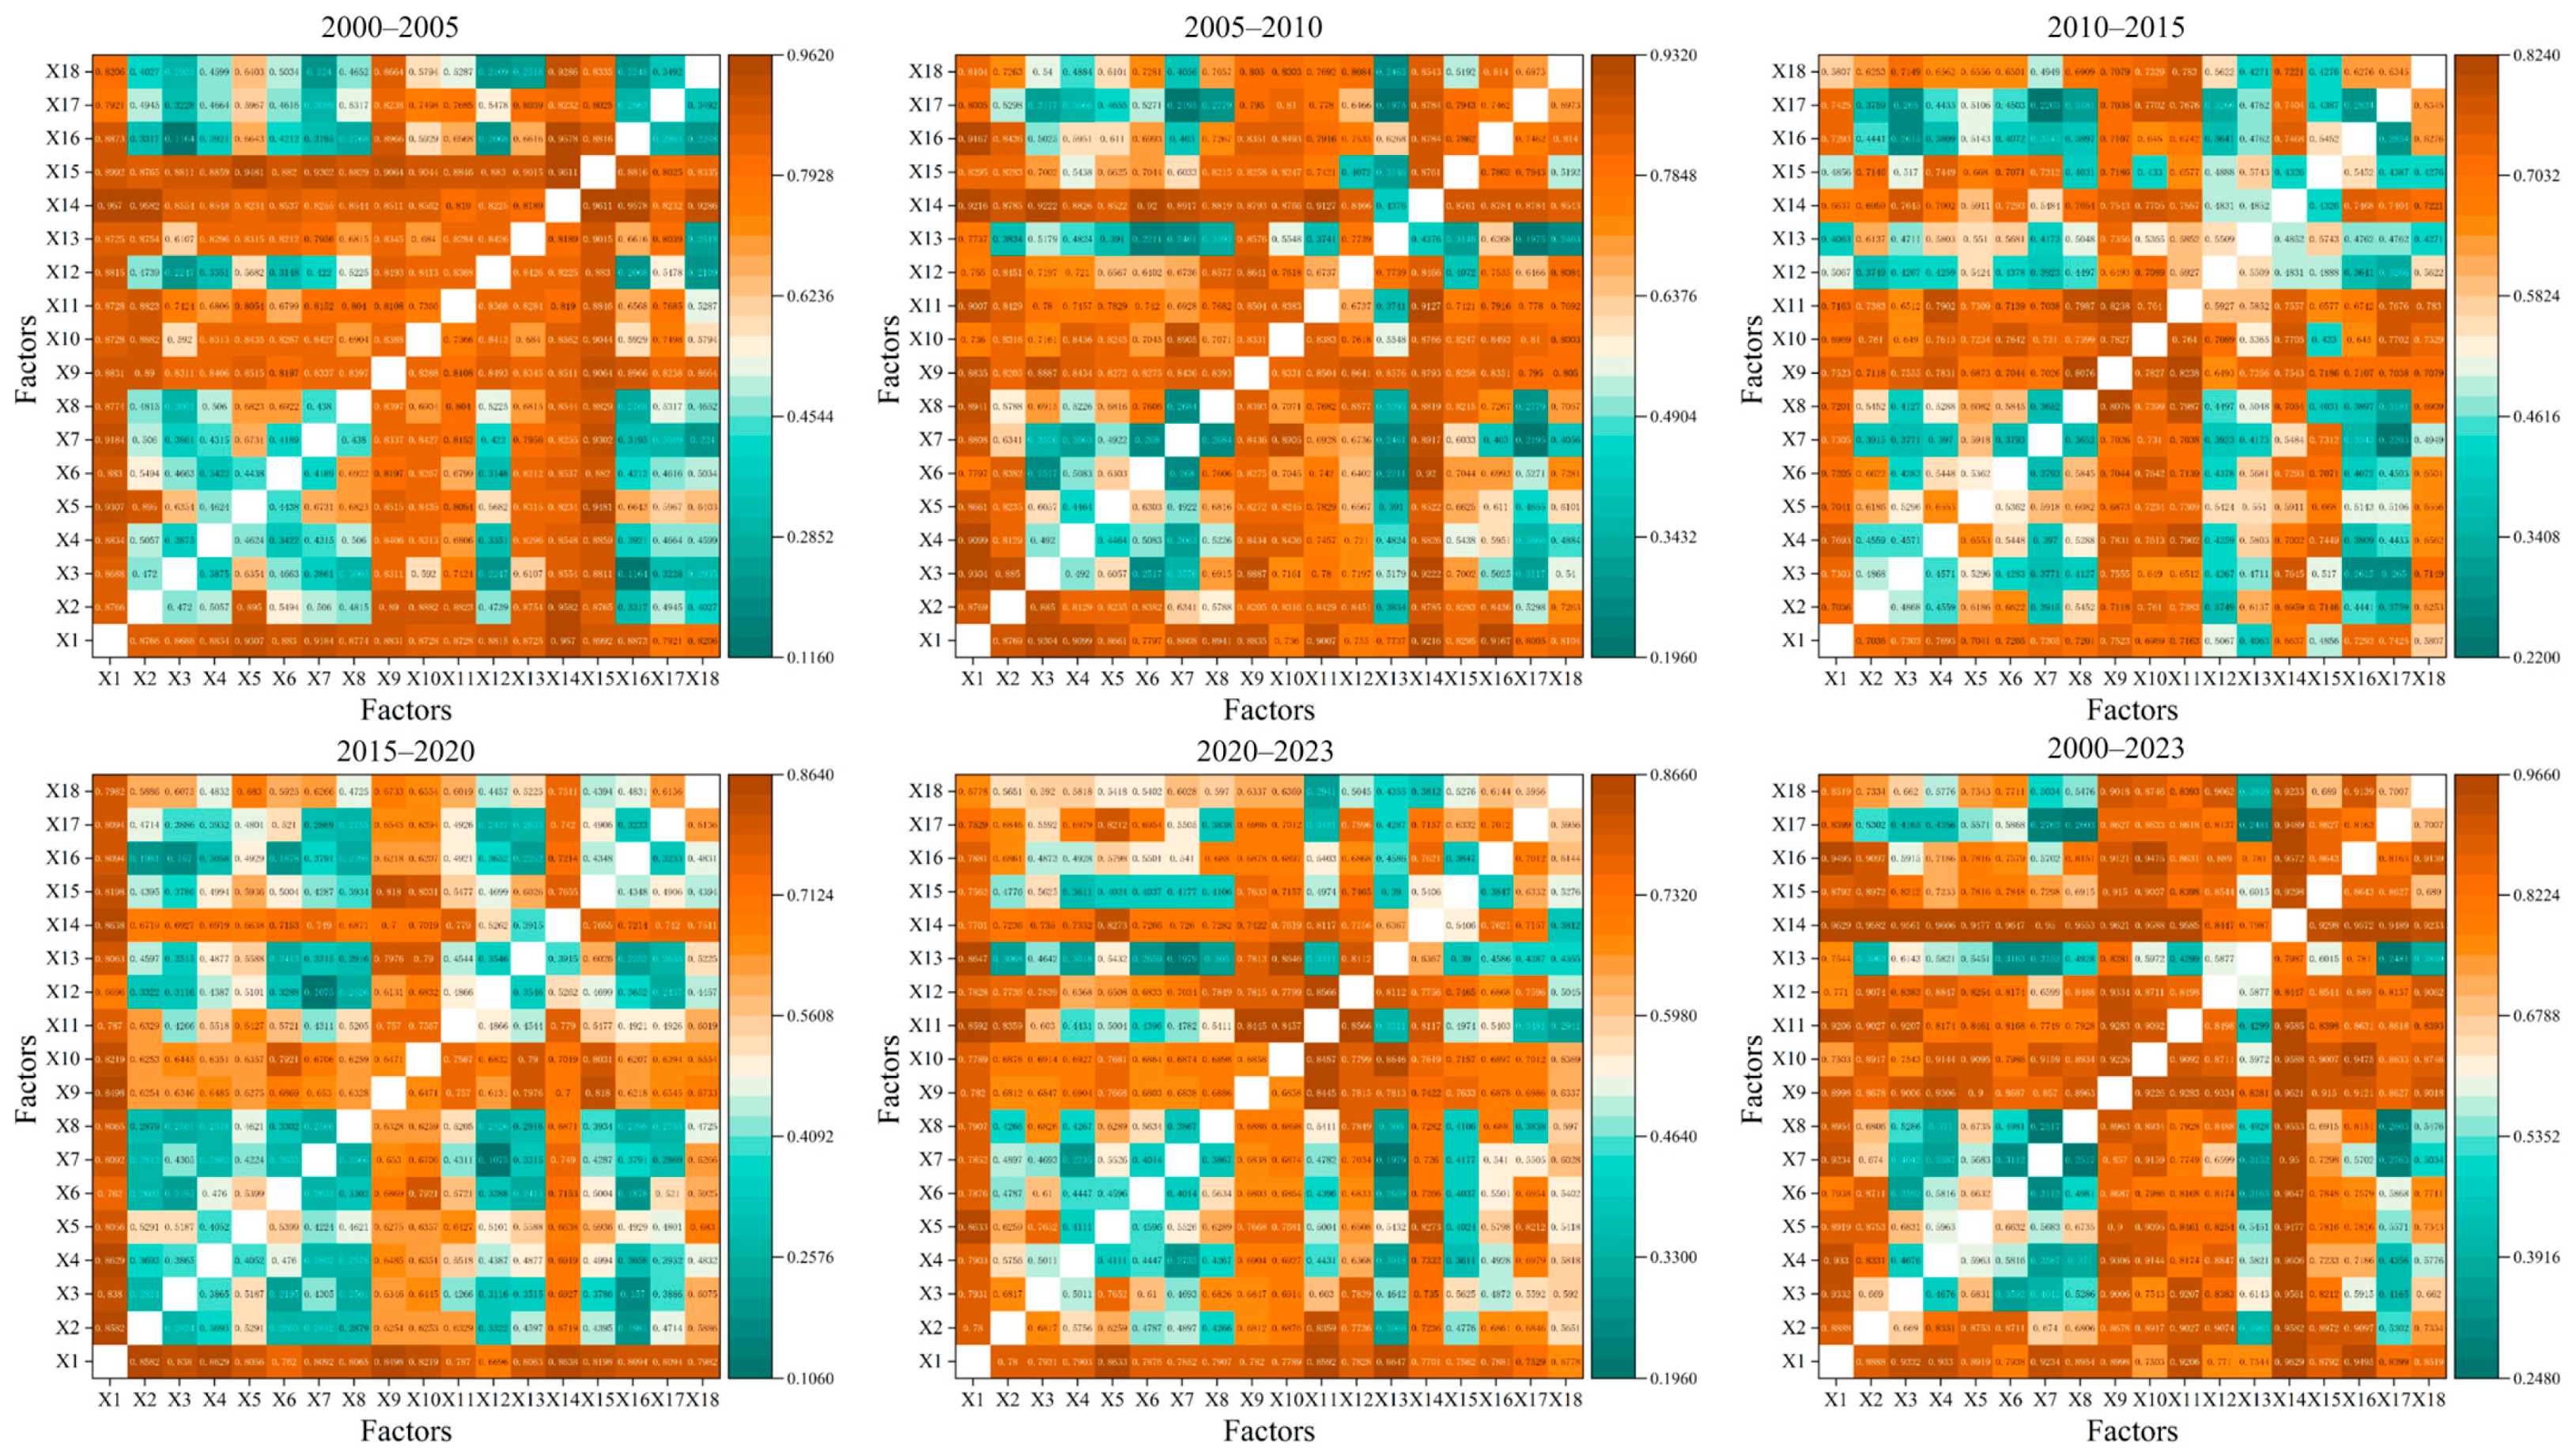
Figure 8 displays the results of the interaction detector. The results demonstrate that for each interaction, the combined effect of two factors is either an enhanced effect or a nonlinearly enhanced effect. This indicates that the NACCL in Sichuan Province is the outcome of the synergistic effect of multiple factors, and the interaction among multiple factors can further increase the explanatory power regarding the NACCL.
As illustrated in Figure 8, the combined effect of urban construction land area and real estate investment (X14∩X15) exerted the strongest influence on NACCL from 2000 to 2005, yielding a q-value of 0.9611. On the one hand, urban expansion provided more land resources and market opportunities for real estate development, motivating real estate enterprises to increase their investment. On the other hand, the growth of real estate development investment further promoted the process of urban expansion and NACCL.
During 2005–2010, the interaction of rural population density and household income (X1∩X3) emerged as the primary driver of NACCL, demonstrating the strongest effect with a q-value of 0.9304. During the relaxation of the urban-rural dichotomy, suburban counties experienced both population spillover from central urban areas and a rural labor shift to non-farm sectors. The confluence of these demographic flows intensified the pressure for land development in peri-urban areas. In densely populated regions, increased income levels facilitated the expansion of residential land and stimulated growth in non-agricultural economic sectors. This caused the explanatory power of the interaction term to significantly exceed that of single factors, making it the core spatial pathway for NACCL.
During 2010–2015, the combined effect of soil pH and per capita GDP (X9∩X11) demonstrated the strongest association with NACCL, registering a q-value of 0.8238. During this phase, the enforcement of the arable land compensation policy was strengthened, compelling urban expansion to target areas characterized by lower-quality soils. Counties with high per capita GDP had sufficient financial resources to implement soil improvement projects, forming a special development model in which economic carrying capacity broke through natural constraints. Meanwhile, marginal counties with low per capita GDP lacked the ability to improve soil, and soil obstacles directly inhibited the process of NACCL.
During 2015–2020, the combined influence of population density and urban built-up area (X1∩X14) yielded a notably high q-value of 0.8638. This suggests that as land development transitioned into a stage of stock optimization, the saturation of developable land in densely populated regions compelled the repurposing of remaining arable parcels inside already developed zones. At the same time, low-density counties were constrained by ecological red lines, limiting both their population aggregation potential and development space. This precisely characterizes the spatial gradient of the “Human-Land-Economy” contradiction.
During 2020–2023, the combined effect of population density and road mileage (X1∩X13) yielded a q-value of 0.8647, representing the most influential predictor of NACCL during this period. The growth of population density in Sichuan Province generated demand for urban and supporting facility land. The expansion of road mileage improved regional accessibility, accelerating population aggregation and optimizing industrial layout. During this phase, accelerated regional development strategies and infrastructure investment enhanced their synergistic effect, facilitating the rapid transition of agricultural land to transportation infrastructure and built-up areas.
Throughout the whole research timeframe spanning from 2000 to 2023, the interplay between the yearly average precipitation and the share of urban construction land (X6∩X14) demonstrated the most substantial explanatory capacity for NACCL, as evidenced by a q-value of 0.9647. Annual average precipitation indirectly regulated land use value by affecting the agricultural suitability of cultivated land. Concurrently, the expansion of urban built-up area served as a clear indicator of accelerated urbanization. Together, they promoted the rapid conversion of inefficient or climate-restricted cultivated land into high-value construction land, ultimately making the interaction the core explanatory variable for long-term NACCL.

5. Discussion and Conclusions

5.1. Discussion

This paper explores the evolution of NACCL in Sichuan Province, focusing on inter-county differences in NACCL levels. Aiming to provide a comprehensive analysis, it examines the diverse spatiotemporal patterns and underlying mechanisms of NACCL across districts and counties.
Through in-depth investigation and analysis, we discovered that the NACCL process in Sichuan Province initially rises rapidly and then experiences a gradual slowdown in the growth rate. The development process also exhibits a diffusion effect. This pattern shares similarities with, yet remains distinct from, results observed in the central Yangtze region. When compared to the middle-reach areas of the Yangtze River, both Sichuan Province and these areas underwent a rapid rise phase in the early stage of NACCL. This was primarily due to the rapid progress in local economic conditions and the quicker speed of urban expansion. However, regarding the slowdown in the growth rate during the later stage, Sichuan Province was impacted by the combined influence of the strengthened enforcement of the “Regulations on the Protection of Basic Farmland” and ecological restoration policies [44]. This led to a marked improvement in the effectiveness of land use control. Consequently, the extent of land approved for construction purposes was properly controlled, which led to a progressive decline in the NACCL level [45,46]. In contrast, the area in the central part of the Yangtze River basin is probably more significantly affected by industrial transformation and regional development plans. For instance, some cities in these areas have started to emphasize industrial upgrading and transformation. Consequently, the demand for construction land has transitioned from mere quantitative expansion to quality enhancement, thereby slowing down the growth rate of NACCL. Meanwhile, influenced by aspects like the economic maturity level, urbanization degree, and policy control strictness, the NACCL process in certain regions still shows an accelerating tendency [47].
The study further reveals that the NACCL in Sichuan Province demonstrates distinct regional differentiation patterns. The NACCL phenomenon shows a tendency to spread from local core counties to surrounding areas, which also corroborates the findings of previous studies [48,49,50]. The results indicate that NACCL does not occur in isolation in a specific area. Instead, it spreads from central counties to surrounding regions as urbanization progresses. This is consistent with the spatial patterns of land—use change described in the land use transition theory. That is, a land use change pattern will gradually propagate and diffuse within a certain region, influencing the land use patterns in adjacent areas. C18, C6, C8, C14, and C1 have consistently been the most core counties for NACCL, and the phenomenon is gradually spreading to surrounding areas such as L2 and L6, B4 in the northeast, and J13 in the south. This is because the establishment of the national territorial spatial planning system and the implementation of the policy for delineating “three zones and three lines” have reduced the elasticity of land supply in the core areas, compelling production factors to shift to secondary urban agglomerations in southern and northeastern Sichuan. For one thing, the districts and counties in Chengdu, serving as core regions, were the first to achieve capital accumulation. By means of spatial spillover effects, they prompted surrounding areas, including M1, L6, and E1, to undertake industrial relocation. For another thing, the reconfiguration of the transportation network facilitated the cross-regional mobility of production factors by improving transportation accessibility and reducing transportation costs. The synergistic progress of urban expansion and industrial upgrading has markedly exacerbated the reallocation of cultivated land resources in Sichuan Province towards non-agricultural sectors. It should be emphasized that an accurate quantitative evaluation of the interactions between core regions and their adjacent areas, particularly regarding the magnitude of direct impacts and the spatial decay boundaries, still depends on high-precision, multi-temporal land use change datasets. The causal inference and scale-effect analysis grounded in fine-grained spatiotemporal data will serve as a crucial focus for subsequent research endeavors.
The research findings also elucidate the driving mechanisms underlying the NACCL in Sichuan Province. The findings show that variables linked to the economic development stage, as represented by the share of land used for urban construction, have strong explanatory capabilities regarding NACCL. Furthermore, the interactive effect of two factors exerts a significantly stronger influence on NACCL than single factors do, which aligns with the conclusions drawn in previous studies [51,52,53]. When viewed from an international standpoint, Sichuan Province shares some commonalities with other countries in terms of the conversion of farmland for non-agricultural purposes, which is propelled by infrastructure development amid the processes of city expansion and industrial growth. Taking a step back to look at global cases, during the American Westward Movement, extensive railway construction, urban sprawl, and agricultural development resulted in a substantial amount of cultivated land being transformed into non-agricultural land, including construction sites and pastures. In Germany, to cater to the demands of industrial production and urban development during the construction of industrial zones, a vast expanse of cultivated land was repurposed for the construction of factories, residential areas, and transportation infrastructure. Following World War II, Japan witnessed a rapid surge in urban and industrial construction. As a result, the urban population saw a rapid increase, and the need for land rose sharply, which resulted in the large—scale conversion of farmland. In recent years, Sichuan Province has experienced a swift advancement in urbanization. The concurrent progress of urban expansion and industrial upgrading has markedly intensified the reallocation of cultivated land resources to non-agricultural sectors, a scenario akin to those in the countries. In all these instances, economic development and the urbanization process have imposed immense demand pressure on cultivated land resources. Looking ahead, future research can delve deeper into the differences in comparative benefits between agriculture and non-agriculture. It can uncover how these differences specifically drive the NACCL process at the micro level and assess their impact on the speed and spatial pattern of non-agricultural conversion across different regions.
The NACCL exerts direct or indirect effects on food security. For example, it results in a reduction in the land used for growing grains and a weakening of its production potential, along with the permanent deterioration of cultivated land quality. Hence, on the premise of safeguarding food security, it is imperative to implement regionally differentiated cultivated land protection policies and well-tailored urban spatial planning. Districts and counties across Sichuan Province should take the following measures. Firstly, they ought to scientifically plan the space for urban development and tighten control over land use to prevent disorderly expansion and indiscriminate occupation of cultivated land. Secondly, they should promote the clustered development of industries. By constructing industrial parks and other approaches, they can cluster enterprises, thereby minimizing the occupation of cultivated land by industrial land. Thirdly, they need to actively explore diversified fiscal revenue channels to reduce reliance on land transfer fees. Moreover, the government should play a crucial role. It ought to formulate customized improvement plans for typical districts and counties, taking into account the key influencing factors. Additionally, it should further enhance the publicity and enforcement of cultivated land protection policies. This will enhance public understanding of the importance of safeguarding farmland and motivate their active involvement, thereby creating a positive social atmosphere in which everyone plays a part in protecting farmland.
In conclusion, the research exposes the development path of the stepwise changes in NACCL magnitude in Sichuan Province during the period from 2000 to 2023 by employing multi-temporal spatial analysis and the OPGD model. It shows a distribution pattern in which high-value clustering areas continue to expand while low-value dispersed areas remain dynamically stable. It also reveals the driving mechanism marked by the multiple superimpositions of population, economic, and social differences behind it, and highlights the “gradient analysis, stage transition” non-agricultural path presented by Sichuan Province as the “Land of Abundance”. To further deepen understanding and enhance predictive ability, future research can adopt a research path that integrates qualitative analysis with quantitative models. By combining social statistical data such as farmers’ decision-making behavior surveys and local governments’ land finance dependence, it can enhance the capacity to explain how the driving mechanism of NACCL operates, considering the behavior motivations of micro-entities. In terms of methods, it can apply a multi-model coupling scenario simulation approach, setting land use scenarios under diverse development policy directions to conduct multi-scale and multi-scenario predictions of the risk areas and scales of spatial spread of NACCL. Moreover, subsequent studies may broaden the research area to investigate the interplay and the approach for regional cooperative governance regarding land use change between Sichuan Province and its adjacent provinces. It should enhance the comprehensive assessment of how well current policies are being carried out and explore ways to realize the harmonious objectives of safeguarding farmland, promoting economic growth, and ensuring ecological safety. This will offer a scientific foundation for land resource governance and sustainable progress in the western area.

5.2. Conclusions

Investigating the dynamic evolution of the NACCL, analyzing its temporal trends, and uncovering the internal driving forces behind these changes are critically significant for ensuring the stability of grain production and safeguarding national food security. Moreover, this study offers vital scientific backing for formulating regional NACCL management approaches. From a staged development perspective, this research comprehensively analyzes the NACCL situation and its changing patterns at the county scale in Sichuan Province from 2000 to 2023 and determines the key factors influencing the NACCL process. The key findings are presented below:
(1)
Over time, the rate of NACCL in Sichuan Province tends to decline. Overall, it shows a phased fluctuation pattern of “expansion—contraction—re-expansion—strict control”. The demand for urban space in the counties of Sichuan Province is significant, and as regional differences gradually narrow, an equilibrium that harmonizes economic progress and farmland preservation has been attained.
(2)
At the spatial level, the NACCL in Sichuan Province shows a notable diffusion impact, with clear spatial variation features. C18, C6, C8, C14, and C1 are the core counties for NACCL, and it is gradually spreading to the surrounding L2, L6, B4 in the northeast, and J13 in the south.
(3)
The spatial distribution of NACCL in Sichuan Province arises from the interplay of multiple factors. The economic development level consistently exhibits strong explanatory power. Among these influencing elements, the five most significant ones, ranked by their ability to explain the phenomenon, are the share of urban built—up land, soil acidity—alkalinity level, road network density, the number of people per unit area, and gross domestic product per capita. The ability to explain the combined influence of factor pairs is more significant, indicating that the NACCL process in Sichuan Province exhibits clear characteristics of synergistic driving forces.

Author Contributions

Conceptualization, Y.X., Q.L. and Y.W.; methodology, Y.X. and K.Z.; software, Y.X.; validation, N.Z.; resources, K.Z. and N.Z.; data curation, Y.X. and N.Z.; writing—original draft preparation, Y.X.; writing—review and editing, Y.X., J.L. and Y.W.; visualization, Y.X. and L.W.; supervision, Q.L. and J.L.; project administration, Q.L. and L.W.; funding acquisition, Y.W. All authors have read and agreed to the published version of the manuscript.

Funding

This study was funded by National Social Science Fund of China (No.19XJY008); Science and Technology Project Funds of Sichuan Provincial Department of Natural Resources (No. ZDKJ-2025-003).

Institutional Review Board Statement

Not applicable.

Informed Consent Statement

Not applicable.

Data Availability Statement

The data that support the findings of this study are available from the corresponding author upon reasonable request.

Conflicts of Interest

The authors declare no conflicts of interest.

Appendix A

Table A1. Names and Codes of Cities and Counties.
City NameCity CodeCounty NameCounty CodeCity NameCity CodeCounty NameCounty CodeCity NameCity CodeCounty NameCounty Code
AbaAabaA1GanziFlitangF11MeishanLrenshouL6
heishuiA2 luhuoF12MianyangManzhouM1
hongyuanA3 ludingF13 beichuanM2
jinchuanA4 sedaF14 fuchengM3
jiuzaigouA5 shiquF15 jiangyouM4
lixianA6 xiangchengF16 pingwuM5
maerkangA7 xinlongF17 santaiM6
maoxianA8 yajiangF18 yantingM7
rangtangA9GuanganGguanganG1 youxianM8
ruoergaiA10 huayinG2 zitongM9
songpanA11 linshuiG3NanchongNgaopingN1
wenchuanA12 qianfengG4 jialingN2
xiaojinA13 wushengG5 langzhongN3
BazhongBbazhouB1 yuechiG6 nanbuN4
enyangB2GuangyuanHcangxiH1 penganN5
nanjiangB3 chaotianH2 shunqingN6
pingchangB4 jiangeH3 xichongN7
tongjiangB5 lizhouH4 yilongN8
ChengduCchenghuaC1 qingchuanH5 yinshanN9
chongzhouC2 wangcangH6NeijiangOdongxinO1
dayiC3 zhaohuaH7 longchanO2
dujiangyanC4LeshanIebianI1 weiyuanO3
jianyangC5 emeishanI2 zizhongO4
jinniuC6 jiajiangI3 shizhongquO5
jintangC7 qianweiI4PanzhihuaPdongquP1
jinjiangC8 jinkouheI5 miyiP2
longquanyiC9 jinyanI6 renheP3
pengzhouC10 mabianI7 xiquP4
piduC11 muchuanI8 yanbianP5
pujiangC12 shawanI9SuiningQanjuQ1
qingbaijiangC13 wutongqiaoI10 chuanshanQ2
qingyangC14 shizhongquI11 dayingQ3
qionglaiC15LiangshanJbutuoJ1 pengxiQ4
shuangliuC16 dechangJ2 shehongQ5
wenjiangC17 ganluoJ3YaanRbaoxingR1
wuhouC18 huidongJ4 hanyuanR2
xinduC19 huiliJ5 lushanR3
xinjinC20 jinyangJ6 mingshanR4
DazhouDdachuanD1 leiboJ7 shimianR5
dazhuD2 meiguJ8 tianquanR6
kaijiangD3 mianningJ9 yingjingR7
quxianD4 muliJ10 YuchengR8
tongchuanD5 ningnanJ11YibinScuipingS1
wanyuanD6 pugeJ12 gaoxianS2
xuanhanD7 xichangJ13 gongxianS3
DeyangEguanghanE1 xideJ14 jianganS4
jinyangE2 yanyuanJ15 nanxiS5
luojiangE3 yuexiJ16 pingshanS6
DeyangEmianzhuE4LiangshanJzhaojueJ17YibinSxingwenS7
shifangE5LuzhouKgulinK1 xuzhouS8
zhongjiangE6 hejiangK2 junlianS9
GanziFbatangF1 jiangyangK3 changningS10
baiyuF2 longmatanK4ZiyangTanyueT1
danbaF3 luxianK5 lezhiT2
daofuF4 naxiK6 yanjiangT3
daochengF5 xuyongK7ZigongUfushunU1
derongF6MeishanLdanlingL1 gongjinU2
degeF7 dongpoL2 rongxianU3
ganziF8 hongyaL3 yantanU4
jiulongF9 pengshanL4 ziliujinU5
kangdingF10 qingshenL5 daanU6

References

  1. Li, Q.; Huang, Y.; Sun, J.; Chen, S.; Zou, J. Balancing Urban Expansion and Food Security: A Spatiotemporal Assessment of Cropland Loss and Productivity Compensation in the Yangtze River Delta, China. Land 2025, 14, 1476. [Google Scholar] [CrossRef]
  2. Song, H.; Li, X.; Zhang, F.; Gu, P.; Chen, Y.; Wu, H.; Xin, L.; Lu, Y.; Liu, Y.; Wang, X. Understanding the spatial distribution patterns and dominant determinants of farmland abandonment in China. Habitat Int. 2025, 156, 103298. [Google Scholar] [CrossRef]
  3. Gao, P.; Gao, Y.; Ou, Y.; Mcjeon, H.; Iyer, G.; Ye, S.; Yang, X.; Song, C. Author Correction: Heterogeneous pressure on croplands from land-based strategies to meet the 1.5 °C target. Nat. Clim. Change 2025, 15, 682. [Google Scholar] [CrossRef]
  4. Wang, Y.; Song, D.; Liu, C.; Li, S.; Yuan, M.; Gong, J.; Yang, J. Spatial Correlation of Non-Agriculturalization and Non-Grain Utilization Transformation of Cultivated Land in China and Its Implications. Land 2025, 14, 1031. [Google Scholar] [CrossRef]
  5. Xu, D.; Chen, M.; Li, R. How high-standard farmland construction can affect farmers’ grain cultivation behavior: Evidence from rural China. Habitat Int. 2025, 160, 103384. [Google Scholar] [CrossRef]
  6. Wang, X.; Song, X.; Wang, Y.; Xu, H.; Ma, Z. Understanding the distribution patterns and underlying mechanisms of non-grain use of cultivated land in rural China. J. Rural Stud. 2024, 106, 103223. [Google Scholar] [CrossRef]
  7. Wenjie, Y.; Dan, L.; Qianwen, G. Estimation Loss of Agroecosystem Service Value in Farmland Conversion and Its Provincial Difference in 2001-2016. Econ. Geogr. 2019, 39, 201–209. [Google Scholar]
  8. Zhang, Y.; Wang, J.; Fan, S. Healthy and Sustainable Diets in China and Their Global Implications. Agric. Econ. 2025, 56, 349–359. [Google Scholar] [CrossRef]
  9. Li, X.; Ma, L. Characteristics and influencing factors of farm land conversion to non-agricultural uses in Northeast Guangdong Province based on optimal parameter geographic detector. Bull. Soil Water Conserv. 2024, 44, 100–112. [Google Scholar]
  10. Li, D.; Qu, J.; Wang, S. Analysis of spatial pattern and gravity center curve of cultivated land conversion in Heilongiang province. Sci. Surv. Mapp. 2021, 46, 171–177. [Google Scholar]
  11. Xie, X. Spatio-temporal evolution and migration path of cropland de-farming in Guilin city. South-Cent. Agric. Sci. Technol. 2024, 45, 104–109. [Google Scholar]
  12. Xia, Z.; Lan, A.; Fan, Z.; Zhu, N. Spatial patterns and shift paths of non-agricultural cultivated land in Guizhou province. Chin. J. Agric. Resour. Reg. Plan. 2023, 44, 159–170. [Google Scholar]
  13. Liu, H.; Wang, H.; Jin, Z.; Pan, C. Spatial and temporal evolution characteristics and driving mechanism of cultivated land conversion in Lower Liaohe River Plain. Chin. J. Eco-Agric. 2024, 32, 1420–1431. [Google Scholar]
  14. Wu, H.; Tia, X.; Zhang, L. Spatio-temporal dynamics characteristic and diffusion trend of cultivated land conversion in Anhui province in recent 40 years. Chin. J. Agric. Resour. Reg. Plan. 2023, 44, 110–118. [Google Scholar]
  15. Zhang, J.; Liu, Y.; Ermei, Z.; Tan, Q. Dynamics and driving mechanisms of cultivated land at county level in China. Acta Geogr. Sin. 2023, 78, 2105–2127. [Google Scholar]
  16. Liu, L.; Song, M.; Qu, B. Regional Difference and Regional Convergence of Cultivated Land Conversion in China. Resour. Sci. 2009, 31, 116–122. [Google Scholar]
  17. Chen, L.; Zhao, H.; Song, G.; Liu, Y. Optimization of cultivated land pattern for achieving cultivated land system security: A case study in Heilongjiang Province, China. Land Use Policy 2021, 108, 105589. [Google Scholar] [CrossRef]
  18. Sun, X.; Wang, J.; Zhu, X.; Dong, Y.; Lin, X. Transformation of cultivated land utilization and its driving factors based on human-earth system perspective: Taking Qiqihar city, Heilongjiang province, as an example. J. Nat. Resour. 2025, 40, 350–366. [Google Scholar] [CrossRef]
  19. Wu, D.; Wu, Z.; Li, S.; Lang, Y.; Ma, P.; Li, Z.; Lin, T. Spatiotemporal Evolution and Influencing Factors of Non-grain Cultivated Land in Northern Mountainous Areas of Guangdong Province. Econ. Geogr. 2023, 43, 144–153. [Google Scholar]
  20. Fan, S.; Liu, Z.; Zhu, M.; Zhang, M. Time series change and influencing factors of land use in Guangzhou city based on geodetector. Southwest China J. Agric. Sci. 2022, 35, 2276–2289. [Google Scholar]
  21. Peng, H.; Guo, L.; Zhang, J.; Zhong, S.; Yu, H.; Han, Y. Research progress and implication of the relationship between regional economic growth and resource-environmental pressure. Resour. Sci. 2020, 42, 593–606. [Google Scholar] [CrossRef]
  22. Wang, Q.; Song, G.; Sui, H. Spatial-temporal Pattern Evolution of Cultivated Land Conversion and Its Driving Factors: A Twofold Perspectives of Impact Analysis and Configuration Analysis. China Land Sci. 2023, 37, 113–124. [Google Scholar]
  23. Liu, C.; Deng, C.; Li, Z.; Sun, H.; Chen, S.; Zhao, H. Study on the evolution and influencing factors of the spatial pattern of rural land non-agriculturalization in typical suburban county—Taking Xiang Tan county, Hu Nan province as an example. Chin. J. Agric. Resour. Reg. Plan. 2021, 42, 253–264. [Google Scholar]
  24. Zhang, G.; Li, X.; Zhang, L.; Wei, X. Dynamics and causes of cropland Non-Agriculturalization in typical regions of China: An explanation Based on interpretable Machine learning. Ecol. Indic. 2024, 166, 112348. [Google Scholar] [CrossRef]
  25. Feng, D.; Long, H. Transition of farmland use system towards urban-rural integration: From localization to de-localization. Resour. Sci. 2025, 47, 42–53. [Google Scholar]
  26. Long, H.; Chen, K.; Zheng, Y.; Zhang, Y. The theoretical cognition and research paradigm of land system science. Resour. Sci. 2025, 47, 3–13. [Google Scholar]
  27. Wang, S.; Wang, Y.; Fang, Z.; Lu, H.; Liu, L. Grain eco-efficiency in China: Horizontal measurement, spatio-temporal pattern evolution and influencing factors. J. Agric. Resour. Environ. 2024, 41, 706–716. [Google Scholar]
  28. Zhao, Q.; Zhu, X. Measurement of the level of high-quality development of provincial trade, regional differences and spatial and temporal evolution. Stat. Decis. 2024, 40, 140–144. [Google Scholar]
  29. Chen, Z.; Wang, X.; Guo, J. Analysis of spatial and temporal variations and driving factors of ecological environment quality in Huangshi city. Bull. Surv. Mapp. 2025, 4, 145–151. [Google Scholar]
  30. Wang, J.; Xu, C. Geodetector: Principle and prospective. Acta Geogr. Sin. 2017, 72, 116–134. [Google Scholar]
  31. Xiao, C.; Hao, L. Spatiotemporal response of China’s photovoltaic power generation to the change of feed-in tariff policies. Progress in Geography. Prog. Geogr. 2025, 44, 1146–1163. [Google Scholar]
  32. Zhang, R.; Chen, Y.; Zhang, X.; Fang, X.; Ma, Q.; Ren, L. Spatial-Temporal Pattern and Driving Factors of Flash Flood Disasters in Jiangxi Province Analyzed by Optimal Parameters-Based Geographical Detector. Geogr. Geo-Inf. Sci. 2021, 37, 72–80. [Google Scholar]
  33. Song, Y.; Wang, J.; Ge, Y.; Xu, C. An optimal parameters-based geographical detector model enhances geographic characteristics of explanatory variables for spatial heterogeneity analysis: Cases with different types of spatial data. GIScience Remote Sens. 2020, 57, 593–610. [Google Scholar] [CrossRef]
  34. Yang, X.; Xue, H.; Dong, G.; Liu, D.; Li, Z. Vegetation changes and driving factors in the Qilian Mountains during 1982–2022. Chin. J. Ecol. 2024, 43, 1576–1586. [Google Scholar]
  35. Li, X.; Ma, X.; Hu, M. The mutual feedback mechanism of human-land-industry factors of the rural regional system. Geogr. Res. 2022, 41, 1981–1994. [Google Scholar]
  36. Liu, Y.; Xiao, C.; Ma, X.; Li, X. Impact pathways of rural population reduction on arable land transition. Prog. Geogr. 2024, 43, 1088–1101. [Google Scholar]
  37. Zhou, G.; Ma, Z.; Zhang, P. The Relationship Between Population Shrinkage, Ageing, and New-Type Urbanization in Counties: The Case of Jilin Province, China. Land 2025, 14, 1474. [Google Scholar] [CrossRef]
  38. Stetter, C.; Cronauer, C. Climate and soil conditions shape farmers’ climate change adaptation preferences. Agric. Econ. 2025, 56, 165–187. [Google Scholar] [CrossRef]
  39. Huang, Y.; Zhong, C.; Wang, Y.; Hua, W. The Spatiotemporal Evolution, Driving Mechanisms, and Future Climate Scenario-Based Projection of Soil Erosion in the Southwest China. Land 2025, 14, 1341. [Google Scholar] [CrossRef]
  40. Qian, W.; Li, D.; Shi, X. Competitive or crowding-out? Estimating spillover effects from large-scale farms on smallholders in China. Agric. Econ. 2025, 56, 27–44. [Google Scholar] [CrossRef]
  41. Wang, S.; Jin, X.; Han, B.; Liu, J.; Song, J.; Zhou, Y. Understanding the process and mechanism of agricultural land transition in China: Based on the interactive conversion of cropland and natural ecological land. J. Environ. Manag. 2025, 376, 124585. [Google Scholar] [CrossRef] [PubMed]
  42. Chen, K.; Long, H. Land consolidation and rural development transformation: Mutual feedback mechanism and regional regulation. China Land Sci. 2020, 34, 1–9. [Google Scholar]
  43. Cheng, M.; Liu, Y.; Jiang, N. Study on the spatial pattern and mechanism of rural population-land-industry coordinating development in Huang-Huai-Hai Area. Acta Geogr. Sin 2019, 74, 1576–1589. [Google Scholar]
  44. Chang, Y.; Liu, J.; Zhang, Q.; Yu, H.; Bian, Z.; Chen, F. Spatial pattern differentiation of cultivated land non-grain conversion in major grain-producing areas. J. Agric. Resour. Environ. 2022, 39, 817–826. [Google Scholar]
  45. Jiang, M.; Wu, Z.; Fu, J. Spatiotemporal differentiation and driving forces of cultivated land dominant transition in Fenhe Rive rBasin from 1980 to 2020. Res. Soil Water Conserv. 2025, 32, 257–265. [Google Scholar]
  46. Zhang, L.; Zhou, Y.; Dong, J.; Li, X.; Liu, S.; Xu, L. Spatiotemporal differentiation of non-agricultural and non-grain farmland in China and its management strategies. Arid Zone Res. 2025, 42, 372–383. [Google Scholar]
  47. Ma, C.; Yang, J.; Wang, X.; Yuan, X.; Ren, Z. The Use of Time Series Remote Sensing Data to Analyze the Characteristics of Non-agriculture Farmland and Their Driving Factors in Shangnan. Remote Sens. Technol. Ang Appl. 2025, 40, 47–59. [Google Scholar]
  48. Liu, F.; Wu, X.; Guo, Z. Spatio-temporal evolution characteristics and dynamic trends of cultivated land conversion in county: A case study of Anhui Province. J. Northeast Agric. Univ. 2024, 55, 50–61. [Google Scholar]
  49. Liu, H.; Hu, Y.; Guo, Z. Intensity of change and stability of cultivated land around large cities. Bull. Soil Water Conserv. 2024, 44, 200–209. [Google Scholar]
  50. Liu, M.; Xia, X.; Chen, Q.; Pan, Y. Investigation on the current status of ”non-agricultural” and ”non-grain” utilization of cultivated land resources in Hehuang Valley. Res. Agric. Mod. 2025, 46, 215–225. [Google Scholar]
  51. Yang, Y.; Peng, S.; LÜ, M.; Chen, X.; Guo, X. Spatial and temporal changes and driving mechanism of cultivated land conversion in central Yunnan urban agglomeration from 1990 to 2020. J. Soil Water Conserv. 2024, 38, 239–251. [Google Scholar]
  52. Zhang, C.; Chen, D.; Jin, Y.; Yang, G.; Zhang, H. Identification of Driving Forces of Land Use Change Based on Transition of Economic-Social Development Stage: Evidence from Middle Reaches of Yangtze River. Resour. Environ. Yangtze Basin 2023, 32, 2528–2541. [Google Scholar]
  53. Zhao, W.; Chen, Y.; Li, Y.; Wang, Q.; Shao, J. Long-term dynamic evolution and transformation of rural sloping farmland in the Three Gorges Reservoir area. Acta Ecol. Sin. 2024, 44, 6907–6922. [Google Scholar]
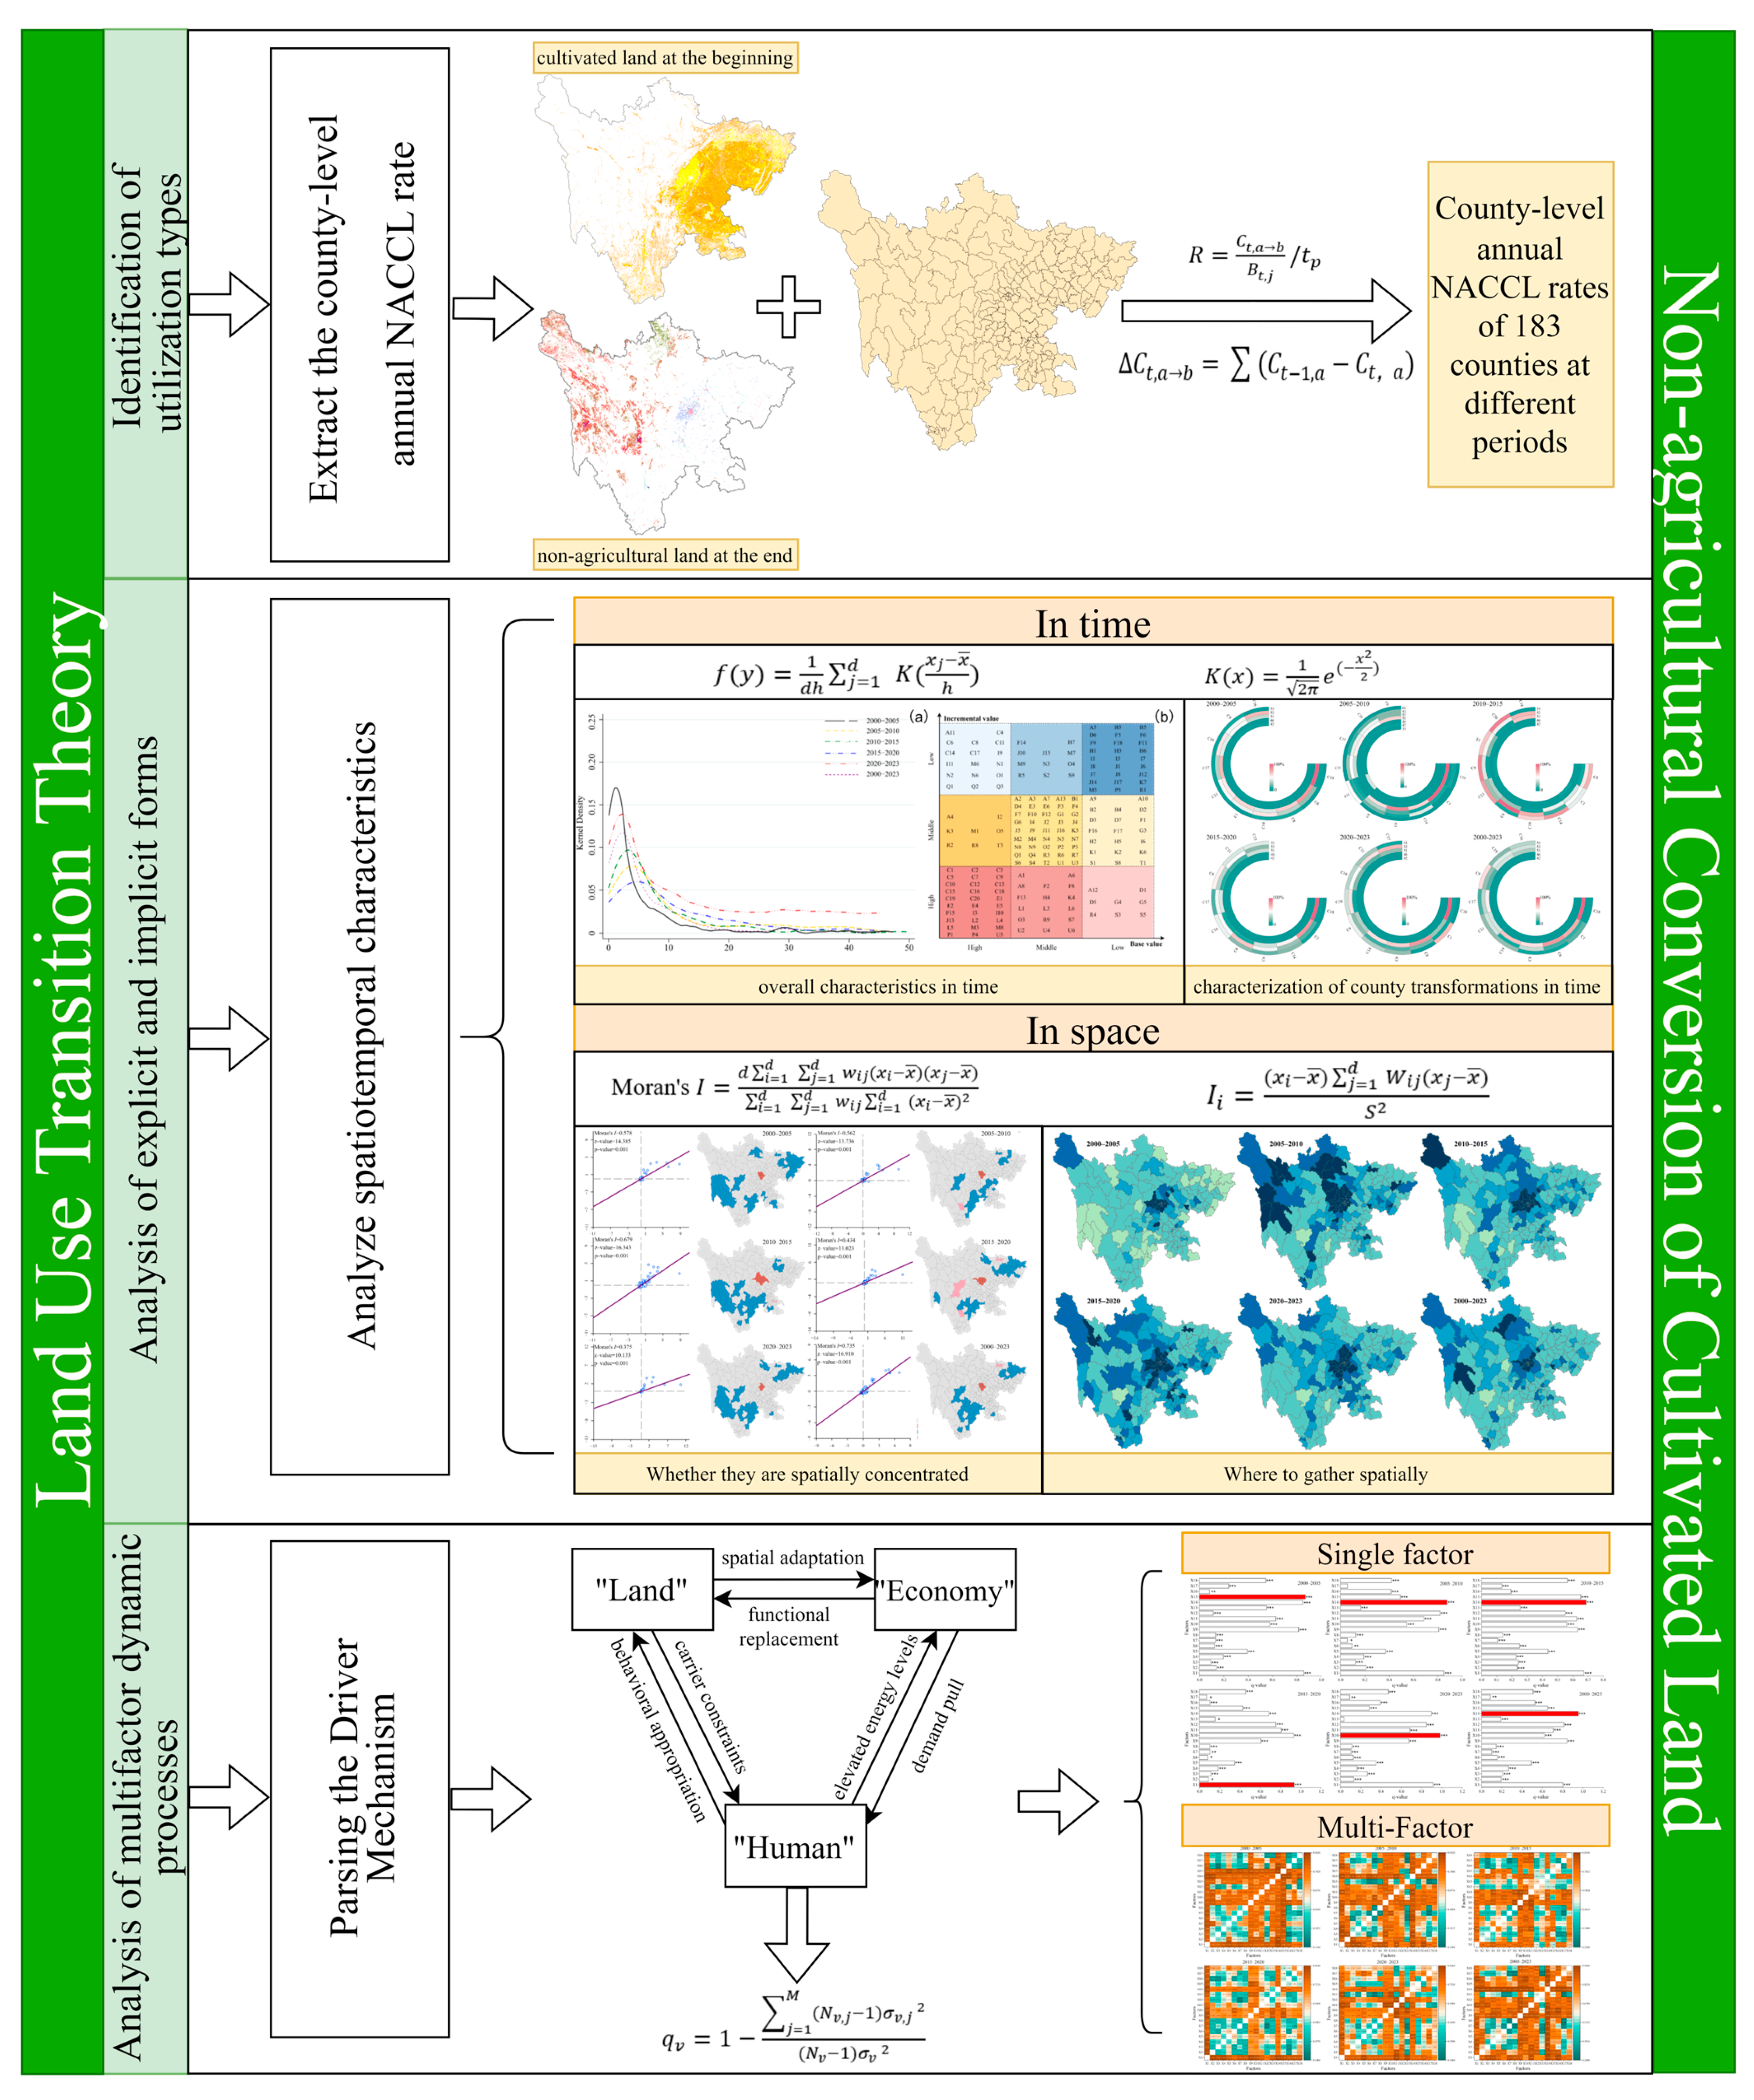
Figure 1. Theoretical and Research Framework.
Sustainability 17 08643 g001
Figure 2. Overview map of cultivated land and non-agricultural land types in counties in Sichuan Province, 2000–2023. (a) County boundaries; (b) City boundaries. Note: In (a), A1, A2, A3, etc., are county codes; In (b), A, B, C, etc., are city area codes. For details, please refer to Appendix A.
Sustainability 17 08643 g002
Figure 3. (a) NACCL Kernel Density Curve for Sichuan Province, 2000–2023; (b) Characteristics of County NACCL Changes in Sichuan Province, 2000–2023. Note: In (b), A1, A2, A3, etc., are county codes. For details, please refer to Appendix A.
Sustainability 17 08643 g003
Figure 4. Percentage of NACCL Transfer Type, Sichuan Province, 2000–2023. Note: Given the considerable number of research units, the figure displays only the top 10 counties ranked by the share of area converted from agricultural use within the county. In this Figure, 33 (low-coverage grassland), 42 (lake), 46 (beach), 51 (urban land), 52 (rural residential area), 53 (other construction land), and 66 (bare rocky land) are land type codes. Comprehensive details are provided in Table 1. In the figure, C1 (Changhua), C6 (Jinniu), C8 (Jinjiang), C9 (Longquanyi), C11 (Pidu), C13 (Qingbaijiang), C14 (Qingyang), C16 (Shuangliu), C17 (Wenjiang), C18 (Wuhou), C19 (Xindu), C20 (Xinjin), E1 (Guanghan), and F11 (Litang) are county codes. Refer to Appendix A for details.
Sustainability 17 08643 g004
Figure 5. Scatterplot of global Moran index and LISA clustering of cropland non-farming in Sichuan Province, 2000–2023.
Sustainability 17 08643 g005
Figure 6. Spatial distribution of county-level annual NACCL rate in Sichuan Province, 2000–2023.
Sustainability 17 08643 g006
Figure 7. Sichuan province 2000–2023 NACCL factor detector results. Note: the symbols *, **, and *** are used to denote significance levels corresponding to 10%, 5%, and 1% in sequence. A higher q-value indicates a more significant influence on the spatial heterogeneity of NACCL. X1—X18, respectively, represent the indicator factors Population density (X1), Agricultural population (X2), Rural disposable income per capita (X3), Elevation (X4), Slope (X5), Annual average precipitation (X6), Annual average temperature (X7), Soil organic carbon content (X8), Soil pH (X9), Urbanization level (X10), Per capita GDP (X11), Road density (X12), road mileage (X13), proportion of urban construction land (X14), real estate development investment (X15), Taxes (X16), savings deposits of urban and rural residents (X17), and all loans of financial institutions at the end of the year (X18). Refer to Table 3 for detailed explanations.
Sustainability 17 08643 g007
Figure 8. Sichuan province 2000–2023 NACCL factor detector results. Note: A higher q-value indicates a stronger combined influence of both factors on the spatial heterogeneity of NACCL. The factors X1–X18 denote Population density (X1), Agricultural population (X2), Rural disposable income per capita (X3), Elevation (X4), Slope (X5), Annual average precipitation (X6), Annual average temperature (X7), Soil organic carbon content (X8), Soil pH (X9), Urbanization level (X10), Per capita GDP (X11), Road density (X12), road mileage (X13), proportion of urban construction land (X14), real estate development investment (X15), Taxes (X16), savings deposits of urban and rural residents (X17), and all loans of financial institutions at the end of the year (X18). Detailed explanations are provided in Table 3.
Sustainability 17 08643 g008
Table 1. Land use classification system.
Tier 1 Type (Land Code)Tier 2 Type (Land Code)
Agricultural
land use categories
Cultivated land (1)Paddy field (11), Dry land (12)
Forest land (2)Closed forest land (21), Shrub land (22), Open forest land (23), Other forest land (24)
Grasslands (3)High-cover grasslands (31), Medium-cover grasslands (32)
Water area (4)Rivers and canals (41), Reservoir ponds (43)
Non-agricultural
land use categories
Grasslands (3)Low-cover grasslands (33)
Water area (4)Lakes (42), Permanent glaciers and snowfields (44), Mudflats (45), Sandbars (46)
Urban, Industrial, and Mining (5)Urban land (51), Rural settlements (52), Other construction land (53)
Unused land (6)Sand (61), Gobi (62), Saline-alkaline soil (63), Swamp (64), Bare land (65), Bare rock texture (66), Others (67)
Table 2. Top 10 counties in Sichuan Province in terms of county-level annual NACCL rate, 2000–2023.
Research PeriodTop 10 Counties for County-Level Annual NACCL Rate
2000–2005C18 (11.81%), C6 (8.48%), C8 (7.96%), C14 (4.94%), C1 (3.22%),
C11 (2.23%), C17 (1.94%), C19 (1.72%), C9 (1.34%), C16 (1.16%)
2005–2010C18 (15.38%), C1 (8.83%), C14 (7.38%), C6 (7.13%), C8 (6.62%),
F11 (3.01%), C11 (2.78%), C17 (2.24%), C16 (1.92%), C9 (1.92%)
2010–2015C8 (5.58%), C1 (2.65%), C14 (2.59%), C19 (2.14%), C6 (2.07%),
C13 (1.74%), C9 (1.56%), E1 (1.44%), C20 (1.43%), C18 (1.36%)
2015–2020C18 (14.28%), C1 (4.62%), C14 (4.41%), C6 (3.49%), C8 (3.33%),
C16 (2.71%), C17 (2.29%), C9 (2.01%), C11 (1.86%), C13 (1.85%)
2020–2023C18 (23.39%), C1 (14.05%), C8 (7.30%), C6 (6.67%), C14 (3.52%),
C9 (2.32%), C19 (2.26%), C16 (2.24%), C11 (2.15%), C17 (1.68%)
2000–2023C18 (4.26%), C1 (3.25%), C6 (3.19%), C8 (3.09%), C14 (2.74%),
C11 (1.48%), C17 (1.37%), C9 (1.27%), C19 (1.24%), C16 (1.23%)
Note: In Table 2, C1 (Changhua), C6 (Jinniu), C8 (Jinjiang), C9 (Longquanyi), C11 (Pidu), C13 (Qingbaijiang), C14 (Qingyang), C16 (Shuangliu), C17 (Wenjiang), C18 (Wuhou), C19 (Xindu), C20 (Xinjin), E1 (Guanghan), and F11 (Litang) are county codes. Refer to Appendix A for details. The values in parentheses in the table indicate the county-level annual NACCL rate.
Table 3. NACCL Driver Indicator System.
Target LayerDimensionFactorsDescriptionUnit
“Human”DemographicPopulation density(X1)Reflect the impact of regional population on cultivated land cultivation.tens of thousands/km2
Agricultural population(X2)This value represents the total number of residents and agricultural workers in the region.person
Per capita disposable income of rural residents(X3)The economic capacity of rural residents significantly affects their decisions to plant crops on cultivated land.yuan
“Land”TopographyElevation(X4)This demonstrates the possible limiting or guiding influences that regional topographic characteristics exert on the spatial arrangement and utilization modes of cultivated land.m
Slope(X5)Reflect the restrictive effect of regional surface inclination on the suitability and development and utilization costs of cultivated land.°
ClimateAnnual average precipitation(X6)Comprehensive impact of regional precipitation conditions on agricultural production stability.mm
Annual average temperature (X7)Represent the role of regional temperature conditions on the stability of cultivated land agricultural output.°
SoilSoil organic carbon content(X8)This metric indicates how regional soil fertility affects both the nutrient availability in cultivated land and the long-term sustainability of agricultural production.g/kg
Soil pH(X9)Impact of regional soil acidity and alkalinity conditions on the suitability of crop growth in cultivated land.-
“Economy”Level of economic developmentUrbanization level(X10)As a manifestation of regional urbanization, it serves as a key driver behind the loss of cultivated land and the transformation of its quality.-
Per capita GDP(X11)It serves as a proxy for regional economic development, thereby shaping the potential for capital allocation in agriculture.yuan/person
Road density(X12)Characterizing the level of regional transportation convenience has a direct impact on the efficiency of mechanized farming operations on arable land.km/km2
road mileage(X13)This reveals the magnitude of regional transportation infrastructure, which exerts a considerable influence on aspects such as the extent of arable land being occupied.km
proportion of urban construction land(X14)Characterizing the demand for urbanization land in a region is directly related to the degree of encroachment on arable land resources.%
real estate development investment(X15)Representing the intensity of demand for land resources in the regional real estate market.billion yuan
Taxes(X16)Reflecting the regional fiscal revenue situation, it has an indirect regulatory effect on investment in farmland protection funds, etc.ten thousand yuan
savings deposits of urban and rural residents(X17)Representing the wealth accumulation level of residents in the region, it has a potential impact on agricultural investment capacity, etc.ten thousand yuan
all loans of financial institutions at the end of the year(X18)Reflecting the strength of regional financial support and having a significant impact on the availability of agricultural loans.ten thousand yuan
Disclaimer/Publisher’s Note: The statements, opinions and data contained in all publications are solely those of the individual author(s) and contributor(s) and not of MDPI and/or the editor(s). MDPI and/or the editor(s) disclaim responsibility for any injury to people or property resulting from any ideas, methods, instructions or products referred to in the content.