Article

Resilience Assessment and Sustainability Enhancement of Gas and CO2 Utilization via Carbon–Hydrogen–Oxygen Symbiosis Networks

by
Meshal Aldawsari
1 and
Mahmoud M. El-Halwagi
1,2,*
1
Department of Chemical Engineering, Texas A&M University, College Station, TX 77843-3122, USA
2
Gas and Fuels Research Center, Texas A&M Engineering Experiment Station, College Station, TX 77843-3122, USA
*
Author to whom correspondence should be addressed.
Sustainability 2025, 17(19), 8622; https://doi.org/10.3390/su17198622
Submission received: 16 August 2025 / Revised: 22 September 2025 / Accepted: 23 September 2025 / Published: 25 September 2025

Abstract

Decarbonizing the industrial sector is essential to achieving net-zero targets and ensuring a sustainable future. Carbon–Hydrogen–Oxygen Symbiosis Networks (CHOSYN) are a set of interconnected hydrocarbon-processing plants that optimize the synergistic use of mass and energy resources in pursuit of both environmental objectives and profitability enhancement. However, this interconnectedness also introduces fragility, arising from technical and administrative dependencies among the participating facilities. In this work, a systematic framework is introduced to incorporate resilience assessment and sustainability enhancement within CHOSYNs. A CHOSYN representation is developed for a proposed industrial cluster, where processes are linked through interceptor units, which facilitate the exchange and conversion of carbon-, hydrogen-, and oxygen-based streams to meet demands. A multi-objective optimization framework is formulated with four competing goals: minimizing cost, minimizing net CO2 emissions, maximizing internal CO2 utilization, and minimizing the number of interceptors’ processing steps. The augmented ε -constraint method is used to generate a Pareto front that captures the trade-offs among these objectives. To complement the synthesis, a resilience assessment framework is applied to evaluate network performance under disruption by incorporating inter-plant dependencies and modeling disruption propagation. The results show that even under worst-case scenarios, integration through CHOSYN can achieve significant gains in CO2 utilization and reductions in raw material procurement requirements. Resilience analysis adds an important dimension by quantifying the economic impacts of disruptions to both highly connected and sparsely connected yet critical nodes, revealing vulnerabilities not evident from topology alone.

1. Introduction

Mitigating climate change is among the foremost global challenges of the twenty-first century [1]. Many nations have pledged to limit the rise in average global temperature and to achieve net-zero emissions of CO2 and other greenhouse gases (GHGs) [2]. The industrial sector is a major contributor, responsible for an estimated 25–35% of global GHG emissions [3], with the chemical industry alone emitting approximately 2 billion tons of CO2 annually and accounting for about 5% of the total emissions [4]. Reducing these emissions is critical for achieving the objectives outlined in the United Nations Sustainable Development Goals (SDGs), particularly SDG 13 (Climate Action), SDG 9 (Industry, Innovation, and Infrastructure), and SDG 7 (Affordable and Clean Energy) [5]. Meeting these goals will require transformative decarbonization strategies that combine low and zero-carbon production technologies, large-scale adoption of alternative feedstocks, electrification of high-temperature processes, and process intensification to improve material and energy efficiency [6]. These must be supported by carbon capture, utilization, and storage, together with complementary technological advances and sustainable-development frameworks such as circular economy measures that extend product lifetimes and close material loops, improvements in energy storage and power battery systems, conservation of natural resources, and valorization of various waste streams [7,8,9]. Furthermore, broader conceptual frameworks have guided the redesign of industrial systems to align with sustainability objectives. Examples include, industrial ecology (IE) which provides a foundational perspective by modeling industrial networks on ecological principles [10]. Industrial symbiosis (IS) applies this perspective through the coordinated exchange of materials, energy, water, and by-products among otherwise separate entities to reduce waste, enhance resource efficiency, and improve both economic and environmental performance [11]. Eco-industrial parks (EIP) are real-world implementations of IS, with outcomes ranging from successful integration to limited impact, often constrained by social factors [12]. Alongside the aforementioned strategies, process systems engineering (PSE) is a field that has provided systematic methodologies for the synthesis, integration, and operation of industrial processes, offering a rigorous framework to address these challenges and inform both policy and design decisions [13]. Building on the principles of IE, research in PSE has introduced frameworks for designing integrated EIPs, offering insight into their potential contributions to sustainable development. The carbon–hydrogen–oxygen symbiosis network (CHOSYN), introduced by Nouraldin and El-Halwagi in [14], is one such framework that employs a multi-scale synthesis approach to share, transform, separate, and utilize hydrocarbon streams through a consistent framework that extends from atoms, to molecules, to processing facilities, to eco-industrial parks. Symbiotic exchanges are structured around carbon, hydrogen, and oxygen, elements that are both abundant and central to the hydrocarbon process industry. CHOSYN extends traditional industrial symbiosis models by introducing an interception network comprising processing units capable of chemically converting, separating, and mixing streams to meet specific demands. A variety of modeling approaches have been developed to support the design and synthesis of CHOSYN systems. El-Halwagi [15] introduced a shortcut method for multiscale atomic targeting, providing a foundational tool for rapid network synthesis. Topolski et al. [16] advanced this methodology through the anchor–tenant framework, enabling integration of both existing and new plants, and later extended the model to incorporate simultaneous mass and energy integration [17]. Al-Fadhli et al. [18] formulated a multiperiod CHOSYN design model that accounts for seasonal variability and incorporates capacity planning over a planning horizon. Goh et al. [19] extended this framework by integrating a storage and dispatch system into the multiperiod CHOSYN to manage raw material variability and improve profitability. Mukherjee and El-Halwagi [20] introduced a stochastic reliability-based approach to account for uncertainty in stream flowrates and qualities by integrating response surface modeling and gradient-based reliability analysis under sustainability constraints. Juárez-García et al. [21] proposed two disjunctive programming formulations for CHOSYN design: a sequential method that decouples atomic targeting from the synthesis optimization, and an integrated model that determines both targeting and synthesis simultaneously. Panu et al. [22] incorporated bi-objective optimization to minimize economic cost and CO2 footprint within a CHOSYN framework. Farouk et al. [23] developed a multi-criteria optimization approach that integrates safety and sustainability indicators into the economic evaluation of CHOSYN configurations. Juárez-García et al. [24] introduced a simulation-integrated design framework that incorporates detailed process data, such as composition, pressure, and temperature into CHOSYN synthesis, allowing for simultaneous plant selection and network configuration. Juárez-García et al. [25] evaluated the controllability of conventional and intensified CHOSYN configurations using the singular value decomposition technique, demonstrating that intensified scenarios can maintain controllability while improving sustainability indicators. Lei et al. [26] developed a modular design and optimization approach that incorporates feed constraints and process performance to generate optimal CHOSYN configurations with more detailed process configurations.
Despite the urgent need to transform infrastructure to eliminate emissions and conserve resources, progress can be undermined by disruptions within an industry or its supply chain [27]. These disruptions can propagate through interconnected systems, triggering responses that generate additional environmental impacts and erode hard-won gains [28]. Resilience is therefore essential to ensure that mitigation efforts are preserved under dynamic and uncertain conditions. Industrial symbiosis networks (ISN), which advance sustainable development across environmental, economic, and social dimensions, contribute directly to SDG 9 (Industry, Innovation and Infrastructure), SDG 12 (Responsible Consumption and Production), and SDG 13 (Climate Action). Yet the concept itself is predicated on high levels of integration and interdependence among participants, making such networks inherently susceptible to cascading disruptions regardless of size or scope. This underscores the need to integrate resilience considerations from the outset of network design. This aspect, however, has received limited attention compared to other studies of industrial symbiosis network development [12]. While definitions of resilience vary across disciplines [29], most converge on the view that a resilient system must sufficiently possess absorptive, adaptive, and restorative capacities, with some frameworks additionally recognizing an anticipatory capacity [30]. This capacity involves awareness of potential disruptions and the ability to foresee challenges not only during operation but also in the conceptual design phase, thereby enabling better preparation and more robust system performance. Early studies investigated the resilience of ISNs through network theory, representing industrial facilities as nodes and the streams of products, energy, and waste between them as edges. This approach enabled researchers to quantify structural characteristics and assess resilience using topology-based metrics such as degree, centrality, and connectivity. A node’s importance is commonly evaluated by its degree (number of connected edges), closeness centrality (average distance to all other nodes), and betweenness centrality (frequency with which a node lies on the shortest paths between other nodes), among other measures [31]. Disruptions are typically simulated as the removal of a node, either randomly or in a targeted manner based on these metrics, after which the same indicators are recalculated on the resulting subgraphs to evaluate the impact. Such analyses drew on foundational discoveries of small-world networks [32], which are highly clustered network that maintain short path lengths between nodes, and scale-free networks [33], which are dominated by hub nodes with high connectivity. These classifications provided a basis for identifying a priori inherent structural vulnerabilities. Building on these concepts, subsequent studies simulated node failures to evaluate different networks’ robustness. Zhu and Ruth [34] modeled two real-world ISNs (in Styria, Austria, and Kwinana, Australia), simulated disruptions through sequential node removals based on centrality and random removal. Zeng et al. [35] introduced a topology-based cascading failure model. Treating the Jinjie EIP in China as an undirected and unweighted network, they defined a critical load threshold for each node and modeled how an initial failure can propagate through successive knock-on effects. Chopra and Khanna [36] employed network metrics and removal simulations to highlight critical nodes. Their analysis revealed the coal-fired Asnæs power station as the central hub whose loss would most disrupt the network. Li and Shi [37] constructed a material exchange network for the Yixing Economic and Technological Development Zone ISN and simulated its response to node removals, both random and targeted, to assess vulnerabilities, and highlighted how outages in certain key industries could trigger cascading effects, especially when multiple infrastructure and material networks are interlinked. Xiao et al. [38] developed a complex network model of an eco-industrial system in Qinghai, China, to analyze stability under partial knockouts, and reported that removing just the nodes and links that are most central to the EIP, accelerates failure propagation throughout the network. Fraccascia et al. [39] proposed a resilience index based on network- and firm-level diversity and waste ubiquity, applied to the Jinan (China) and Kalundborg (Denmark) ISNs. They found that resilience improves with more waste exchanges, multiple producers and users per waste, and targeted risk assessment for highly diverse firms. Li and Xiao [40] analyzed the Ningdong coal-chemical ISN, confirming it exhibits both scale-free and small-world properties. Using global efficiency, a topology-based indicator of overall network connectivity, they found that removing the top 10% of the most-connected nodes reduced network efficiency by about 60%. Liu et al. [41] applied social network analysis to the Nanjing Jiangbei petrochemical park, finding it weakly connected, with low clustering and limited cross-linkages. Recycling firms formed the network core, leaving many primary manufacturers peripheral and vulnerable to disruptions. Valenzuela-Venegas et al. [42] proposed a multi-layer resilience metric for ISNs, combining a network connectivity index (structural redundancy) with a flow adaptability factor (capacity to adjust exchanges). Using these proposed metrics, Valenzuela-Venegas et al. [43] incorporated the topology-based indicators into a multi-objective optimization framework to synthesize resilient and sustainable eco-industrial parks. Thun and Chew [44] built on the multi-layer resilience framework and extended it to compare active and passive redundancy strategies under disruption scenarios, and evaluated how redundancy type and activation timing influence an ISN’s capacity to sustain performance.
While prior studies have advanced the synthesis of CHOSYN, most efforts have focused on economic and environmental objectives. Given the critical need to safeguard against failures, it is important to incorporate resilience in the analysis. Furthermore, it is necessary to integrate and reconcile the various objectives driving the symbiosis activities. This paper introduces a systematic framework for assessing resilience as a key criterion for screening the evolving networks. Research on the behavior of ISN under disruption has largely remained focused on topology-based metrics, often assuming undirected and unweighted networks. The resilience of CHOSYN has rarely been examined through network-based approaches, despite its distinct features compared with other EIPs that warrant attention; only one study [44] has applied such an approach to CHOSYN, whereas most efforts have concentrated on other EIPs. Furthermore, when disruptions are modeled, they are typically represented by removing random nodes or nodes ranked according to topological metrics, with cascading failure models likewise defining load in terms of such indicators. Although topology provides valuable insight, less connected nodes can sometimes disrupt the network as severely as highly connected ones. Earlier works also lack an explicit description of how disruptions propagate, relying instead on node removal and subsequent evaluation of topological indicators. In this study, propagation is modeled through a breadth-first search method with a single-pass assumption. Leveraging existing search algorithms enables tailoring of the propagation model to reflect the decision-maker’s perspectives on dependency and risk tolerance. Because directionality matters in the CHOSYN context, representing the system as a directed graph and adopting a performance-based metric shifts the emphasis from structure to functional output, allowing resilience to be assessed in terms of operational performance that reflects the overall health of the system. Moreover, dependency values among nodes, when used, are often assumed to be uniform, even though dependencies are rarely uniform in practice and their quantification is inherently challenging. To address this gap, a dependency metric is introduced to capture disruptive effects. This work introduces an integrated multi-objective framework that establishes trade-offs while generating optimal configurations, coupling the multiscale synthesis of CHOSYN with a network theory-based approach for resilience assessment. The proposed approach is detailed in Section 2, followed by a case study in Section 3 and the results and discussion in Section 4.

2. Proposed Approach

2.1. Problem Statement

Consider a set of industrial plants P co-located within one industrial park and owned by a single owner or consortium. These plants operate autonomously, generating plant-level revenue, and their integration under one ownership structure enables better coordinated planning for resource utilization and sustainability. In addition to primary products, each plant produces internal sources I of byproducts and waste streams that contain chemical species S . The molar flowrate of species s S in internal source i I originating from plant p P is a known parameter W s , i , p . The demand of plant p for species s is a known parameter G s , i , p . To satisfy unmet demand, the owner or consortium may procure external sources E . A subset of species D S are allowed to be discharged; any excess of these may be discharged subject to environmental limits. The CHOSYN may include processing units, termed interceptors, that physically and/or chemically transform internal and external sources to satisfy specific demands. Chemical conversions are carried out through a set of candidate reactions J , embedded within these interceptors. This work addresses two tasks. First, a CHOSYN is synthesized via multi-objective optimization to generate a Pareto set of non-dominated configurations that reflect different design priorities. Second, the resilience of selected design(s) to node-level disruptions is evaluated by (i) quantifying inter-node reliance with a flow-based dependency on streams and (ii) simulating how a disruption propagates along directed paths to obtain downstream functionality and the resulting change in the networks’ performance.

2.2. Mathematical Formulation of the Synthesis

The mathematical model for CHOSYN synthesis is presented in this section.
Constraints. The atomic targeting approach adopted in this work follows the methodology developed by El-Halwagi [15] and is adapted to the present context. Each plant within the industrial cluster generates internal sources that can be utilized by others and has specific atomic demands required for its operation. To evaluate the network-wide balance, the internal flows and demands of carbon, hydrogen, and oxygen are used to calculate the net atomic flowrates, denoted by Δ A C N e t , Δ A H N e t ,   Δ A O N e t . These values indicate either a surplus, which corresponds to a minimum discharge target, or a deficiency, which identifies the minimum requirement to be met through external sourcing. The net atomic flowrates are calculated using Equations (1) to (3), where α s ,   β s , and γ s are the atomic coefficients of carbon, hydrogen and oxygen, respectively. In each equation, the first term represents the atomic contribution from internal sources, while the second term represents the atomic demands of the plants.
Δ A C N e t = s α s W s , p s α s G s , p  
Δ A H N e t = s β s W s , p s β s G s , p
Δ A O N e t = s γ s W s , p s γ s G s , p  
To determine the minimum discharge and external purchases of sources required to balance the atomic surpluses and deficiencies, an overall balance for each atom is done for the entire network, as shown in Equations (4)–(6). The molar flowrate of externally purchased species is denoted by F s , and the molar flowrate of discharged species is denoted by D s . Equations (7) and (8) impose upper bounds on the flowrate of purchased and discharged chemical species, respectively.
Δ A C N e t + s e α s F s s d α s D s = 0
Δ A H N e t + s e β s F s s d β s D s = 0  
Δ A O N e t + s e γ s F s s d γ s D s = 0  
s e   F s δ s
s d   D s τ s
To satisfy the specific demands of plants, the chemical sources available internally and acquired externally must be converted through appropriate candidate reactions (i.e., interceptors). An overall CHOSYN species balance is formulated. Equation (9) presents the species balance across the network. The plant demands, denoted by G s , p , are then expressed in terms of candidate reaction flowrates in Equation (10), which is subsequently substituted into the overall CHOSYN balance to yield Equation (11). Here, v s , j represents the stoichiometric coefficient of species s in reaction j , and a j denotes the flowrate of reaction j . The selection of reaction j is formulated using big-M formulation, where b j is a binary variable indicating whether reaction j is active, as shown in Equations (12) and (13). Note that, to ensure feasibility, the number of candidate reactions must be equal to or greater than the number of chemical species involved in the C-H-O interception network.
p W s , p s G s , p + s e F s s d D s = 0
s G s , p = j ν s , j a j
p W s , p + s e F s s d D s = j ν s , j a j  
j a j M b j
j a j M b j
Since some chemical species like CO2 and CH4 commonly arise in industrial processes such as byproducts, waste gases, or unconverted streams that are often flared or released into the atmosphere but can also serve as valuable internal resources when effectively recovered, the utilization of a specified target species is incorporated into the formulation and can later be selected as an objective to be maximized. A generalized mass balance for the selected species is first written, as shown in Equation (14), followed by a constraint on the maximum attainable recovery from internal sources based on separation technologies, as given by Equation (15). The recovery fraction, f s , reflects the separation efficiency of different technologies for a target species s and can be obtained through pre-synthesis analysis [22].
p F p U T s = p W s , p D s
F p U T s W s , p f s
Objective Functions. The objective functions of this model are chosen to explore trade-offs between multiple and possibly conflicting goals. The first objective function, f1, represents the canonical objective of minimizing the total cost associated with external sources (i.e., purchased raw materials) and chemical species discharged from the network, as shown in Equation (16). In addition, it includes the cost associated with the selected interceptors (i.e., that represent the chosen reactions) implemented within the interception network.
f 1 = m i n i m i z e s e C s F s + s d C s D s + j C j a j
The second objective function, f2, seeks to minimize a specific species (e.g., greenhouse gases) emissions footprint associated with the procurement of external raw materials and the operation of interceptors within the synthesized interception network, as shown in Equation (17). The first term parameter, E s G H G , reflects upstream emission data obtained through life-cycle assessment (LCA), generally corresponding to stage 1 boundaries, which include extraction, processing, and transportation of raw materials. Meanwhile, the second term parameter, E j G H G , captures direct process emissions associated with the interceptors.
f 2 = minimize s e E s G H G F s + j E j G H G a j
The third objective function, f3, seeks to maximize the utilization of internally sourced species of interest within the network, as shown in Equation (18). The fourth and last objective function, f4, introduces a process simplification dimension [45], by directly minimizing the number of processing steps, U j , associated with the interceptors. Processing steps are generally defined as major functional units, encompassing all equipment and auxiliaries required for the operation of each unit [46]. For instance, a distillation column together with its reboiler, condenser, and pumps is treated as one major functional unit. These definitions are not rigid and can be drawn or approximated from established process synthesis literature.
f 3 = maximize p F p U T s
f 4 = minimize j   U j b j
Equations (1) through (19) together with the associated economic, process, and emission data can be solved simultaneously using multi-objective programming (MOMP) methods such as the weighting method or the ε -constraint method. In multi-objective optimization, no single solution can simultaneously optimize all objectives. Instead, the notion of optimality is replaced with Pareto optimality, where the goal is to identify efficient (non-dominated) solutions. These are solutions for which no other feasible alternative can improve one objective without worsening at least one other objective [47]. The solution to the multi-objective optimization problem is a set of Pareto-optimal solutions forming the Pareto front, accompanied by a payoff table constructed from individual single-objective optimizations. This table helps identify the utopia point (best achievable value for each objective) and the nadir point (worst value among Pareto-optimal solutions), thus offering a broader understanding of the solution space. Each point on the Pareto front corresponds to a complete CHOSYN implementation that satisfies all constraints and represents a feasible network configuration.

2.3. Resilience Assessment

2.3.1. Perspective

Modeling disruptions and risk assessments, in general, depend entirely on the perspective of the decision-maker. In network synthesis, for example, one may adopt a single-site perspective, maximizing or minimizing a measure of goodness for an individual plant, or an entire-site perspective, treating the complete symbiosis network as a unified consortium under common control and shared benefits. As noted earlier, this study adopts the perspective of a single owner of the network, and the analysis is therefore tailored to that viewpoint.

2.3.2. Flow Dependency

A single Pareto solution defines a complete network configuration, including the industrial plants, interception units, stream connections and directions, component flowrates, and the type and quantity of externally procured raw materials and discharged chemical species. The obtained industrial symbiosis network is represented as a directed graph G = N , E , where each node in N denotes an industrial plant, an interceptor unit or a material supply source, and each directed edge in E denotes a material flow. To assess the impact of disruptions, a performance-based indicator based on flowrate is chosen over topological indicators. Therefore, a dependency value on each edge that quantifies the fraction of a node’s output driven by that specific incoming flow is required. In this work, flow dependency is used and computed in Equation (20), where F u v is the flow from node u to node v , ψ is a unitless criticality factor that is determined in an independent analysis, and d m i n and d m a x enforce a lower and upper bound on flow dependency. This clamping ensures that each dependency value remains within a physically meaningful range.
ξ u v = max d m i n , min d m a x , ψ F u v i F i v

2.3.3. Propagation Mechanism

The industrial symbiosis is a directed graph. Each directed edge ( u v ) carries a flow, F, and flow dependency ξ u v 0,1 obtained from applying Equation (20). Edge survival is defined as the complement of ξ u v and can be denoted as σ u v . When multiple parallel edges exist from u to v (i.e., distinct commodities that are all required), the model adopts a series interpretation at the pair level and aggregates them multiplicatively as shown in Equation (21).
u v = e E ( 1 ξ e ) = e E σ e
The algorithm proceeds in two phases. Phase 1 initiates a breadth-first traversal from the disrupted node d . Each directed edge ( u v ) encountered is processed at most once. Both the disrupted node and all target nodes (i.e., nodes that generate revenue) are excluded from updates in this phase. For every encountered non-target successor v , the downstream functionality f v is multiplicatively reduced by the upstream functionality and the pair survival (Equation (21)) as shown in Equation (21). Node functionality f represents the fraction of nominal output that remains available after a disruption propagates through the network and is initialized as 1 for all nodes.
f v f v f u u v
This single-pass step captures first-order, path-wise losses along the directed influence frontier of d while avoiding recursive amplification on cycles. In Phase 2, after all non-target nodes have been updated, each target node t is evaluated in a single step by combining all incoming edges from predecessors multiplicatively, consistent with the in-series assumption as shown in Equation (23). This follows the same propagation rule defined in Equations (21) and (22), but it is applied once for each target node after phase 1 concludes.
f t = u p r e d ( t ) ( f u u t )
After all node functionalities have been determined, every edge in the network is updated to reflect the degraded operating state. For each edge u v , the post-disruption flow is obtained by multiplying the intact-network flow by the functionality of the source node. Once the rescaling is complete, network performance is evaluated by focusing only on the inflows to target nodes. For each target node, the degraded inflows are converted to revenue using a price map for each commodity. Summing up these revenues across all targets yields the total post-disruption network revenue.

2.3.4. Resilience Quantification

Many resilience quantification methods have been proposed in the literature [30,48,49]. Here, the approach of Gong et al. [50] is adopted, expressed in Equation (24) and illustrated as a bathtub curve in Figure 1, which represents network performance before, during, and after a disruption. In this formulation, the denominator reflects the cumulative baseline performance without disruption, while the numerator captures the cumulative performance under disruption. Their difference corresponds to the total performance lost (shaded area in Figure 1), and their ratio quantifies the resilience. The lowest point on the curve corresponds to the minimum network performance, determined from the disruption modeling. The time-delay phase accounts for human or operational lags before recovery actions are initiated.
R = t 0 t n F t d t t 0 t n F t 0 d t

3. Case Study

The framework is applied to an industrial cluster comprising nine industrial plants, each of which is briefly described along with relevant data on internal sources, as well as the required chemical species. This is followed by a description of the candidate interceptors, accompanied by associated economic, environmental, and process-related data.

Proposed Industrial Cluster

The industrial cluster comprises a power plant, a steel mill, gas to liquid (GTL), methanol to olefins (MTO), propylene glycol (PG), dimethyl ether (DME), biodiesel (BD), vinyl acetate monomer (VAM), and urea plants. Basic descriptions of these plants are in Table 1. Internal sources and plant-specific demands are summarized in Table 2 and Table 3, respectively. Relevant economic, environmental, and process-related data for the candidate interceptor reactions are summarized in Table 4. In Table 5, the prices of the sold commodities are given as estimates to support the modeling of the industrial symbiosis network and are not intended to reflect precise market data.

4. Results and Discussion

A CHOSYN was synthesized by solving the multi-objective mixed-integer linear programming (MILP) formulation defined in Equations (1) through (19). The augmented ε-constraint method [47,65,66], implemented via PyAugmecon [67] with Gurobi [68] as the underlying solver, was used to generate only an efficient non-dominated solution set. The model comprised 13 binary variables, 46 continuous variables, and 85 constraints, and the solution process involved solving 709 models to obtain 193 unique Pareto-optimal solutions within 22.33 s. As PyAugmecon does not provide complete variable assignments for each Pareto-optimal point, selected solutions were resolved independently using Pyomo [69,70] and Gurobi to extract detailed stream-level and process configuration data. Cost values are annualized by assuming 333 days of operation per year, and emissions are reported after conversion based on molecular weights.
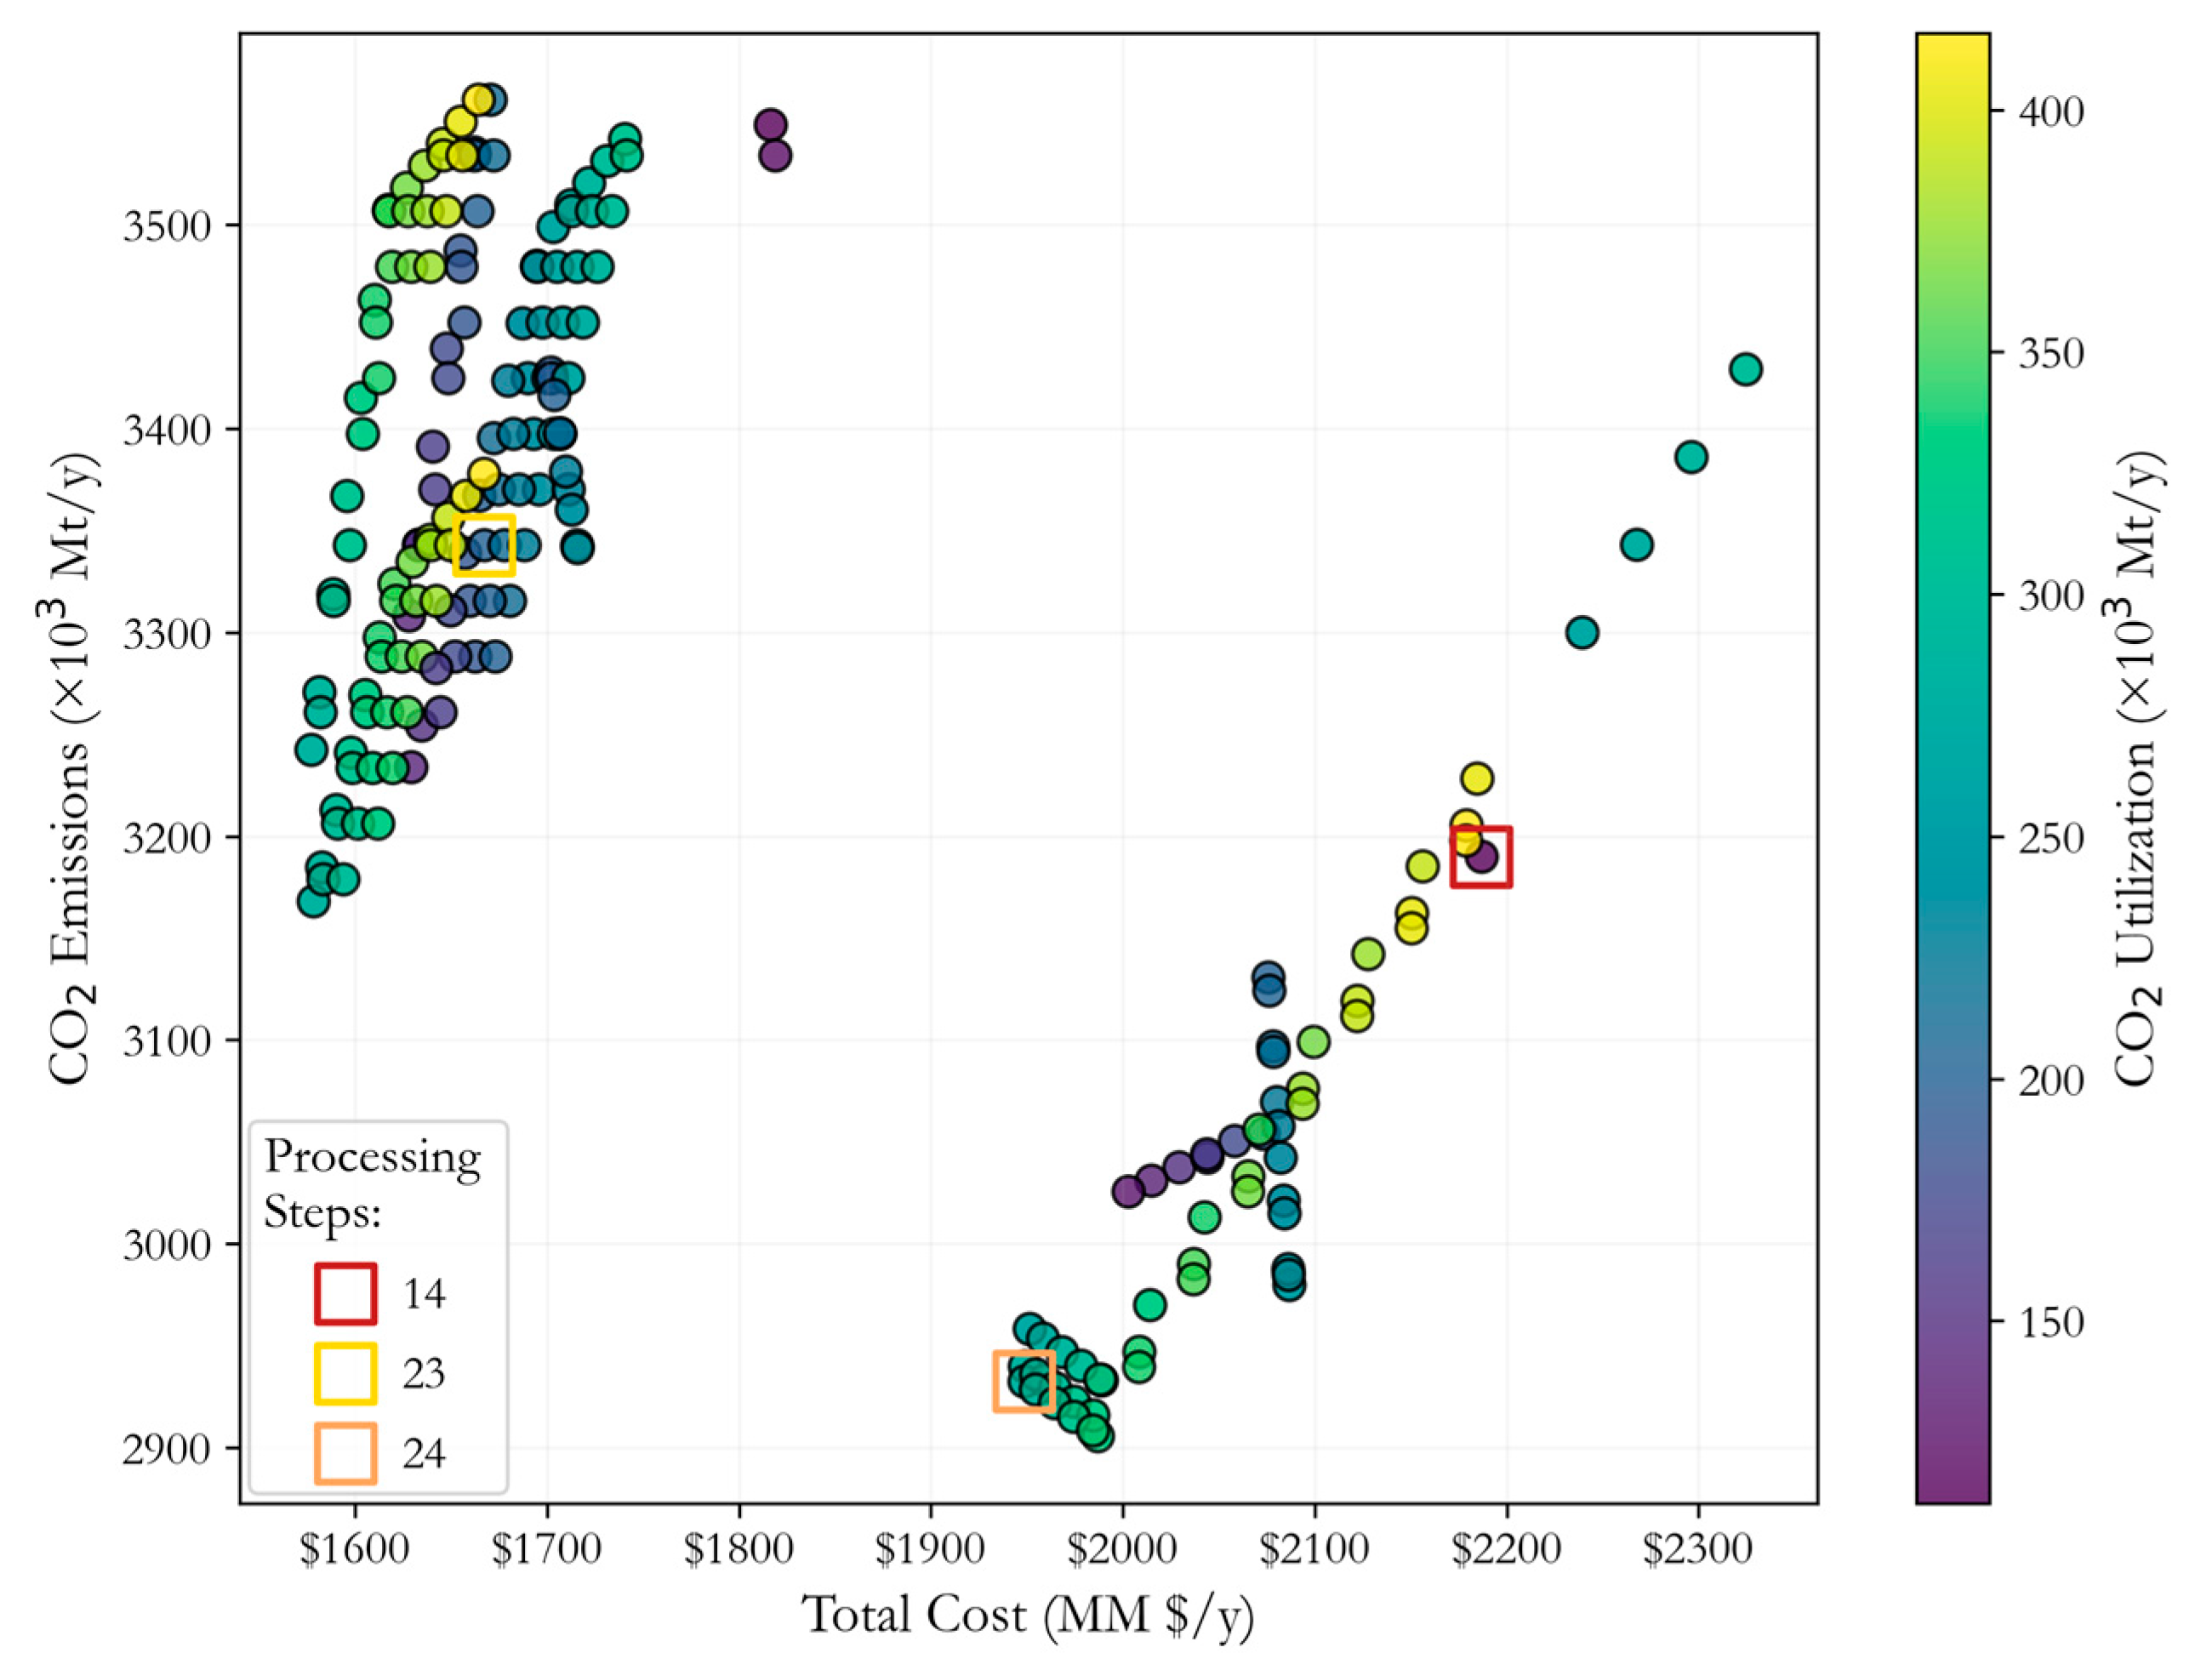
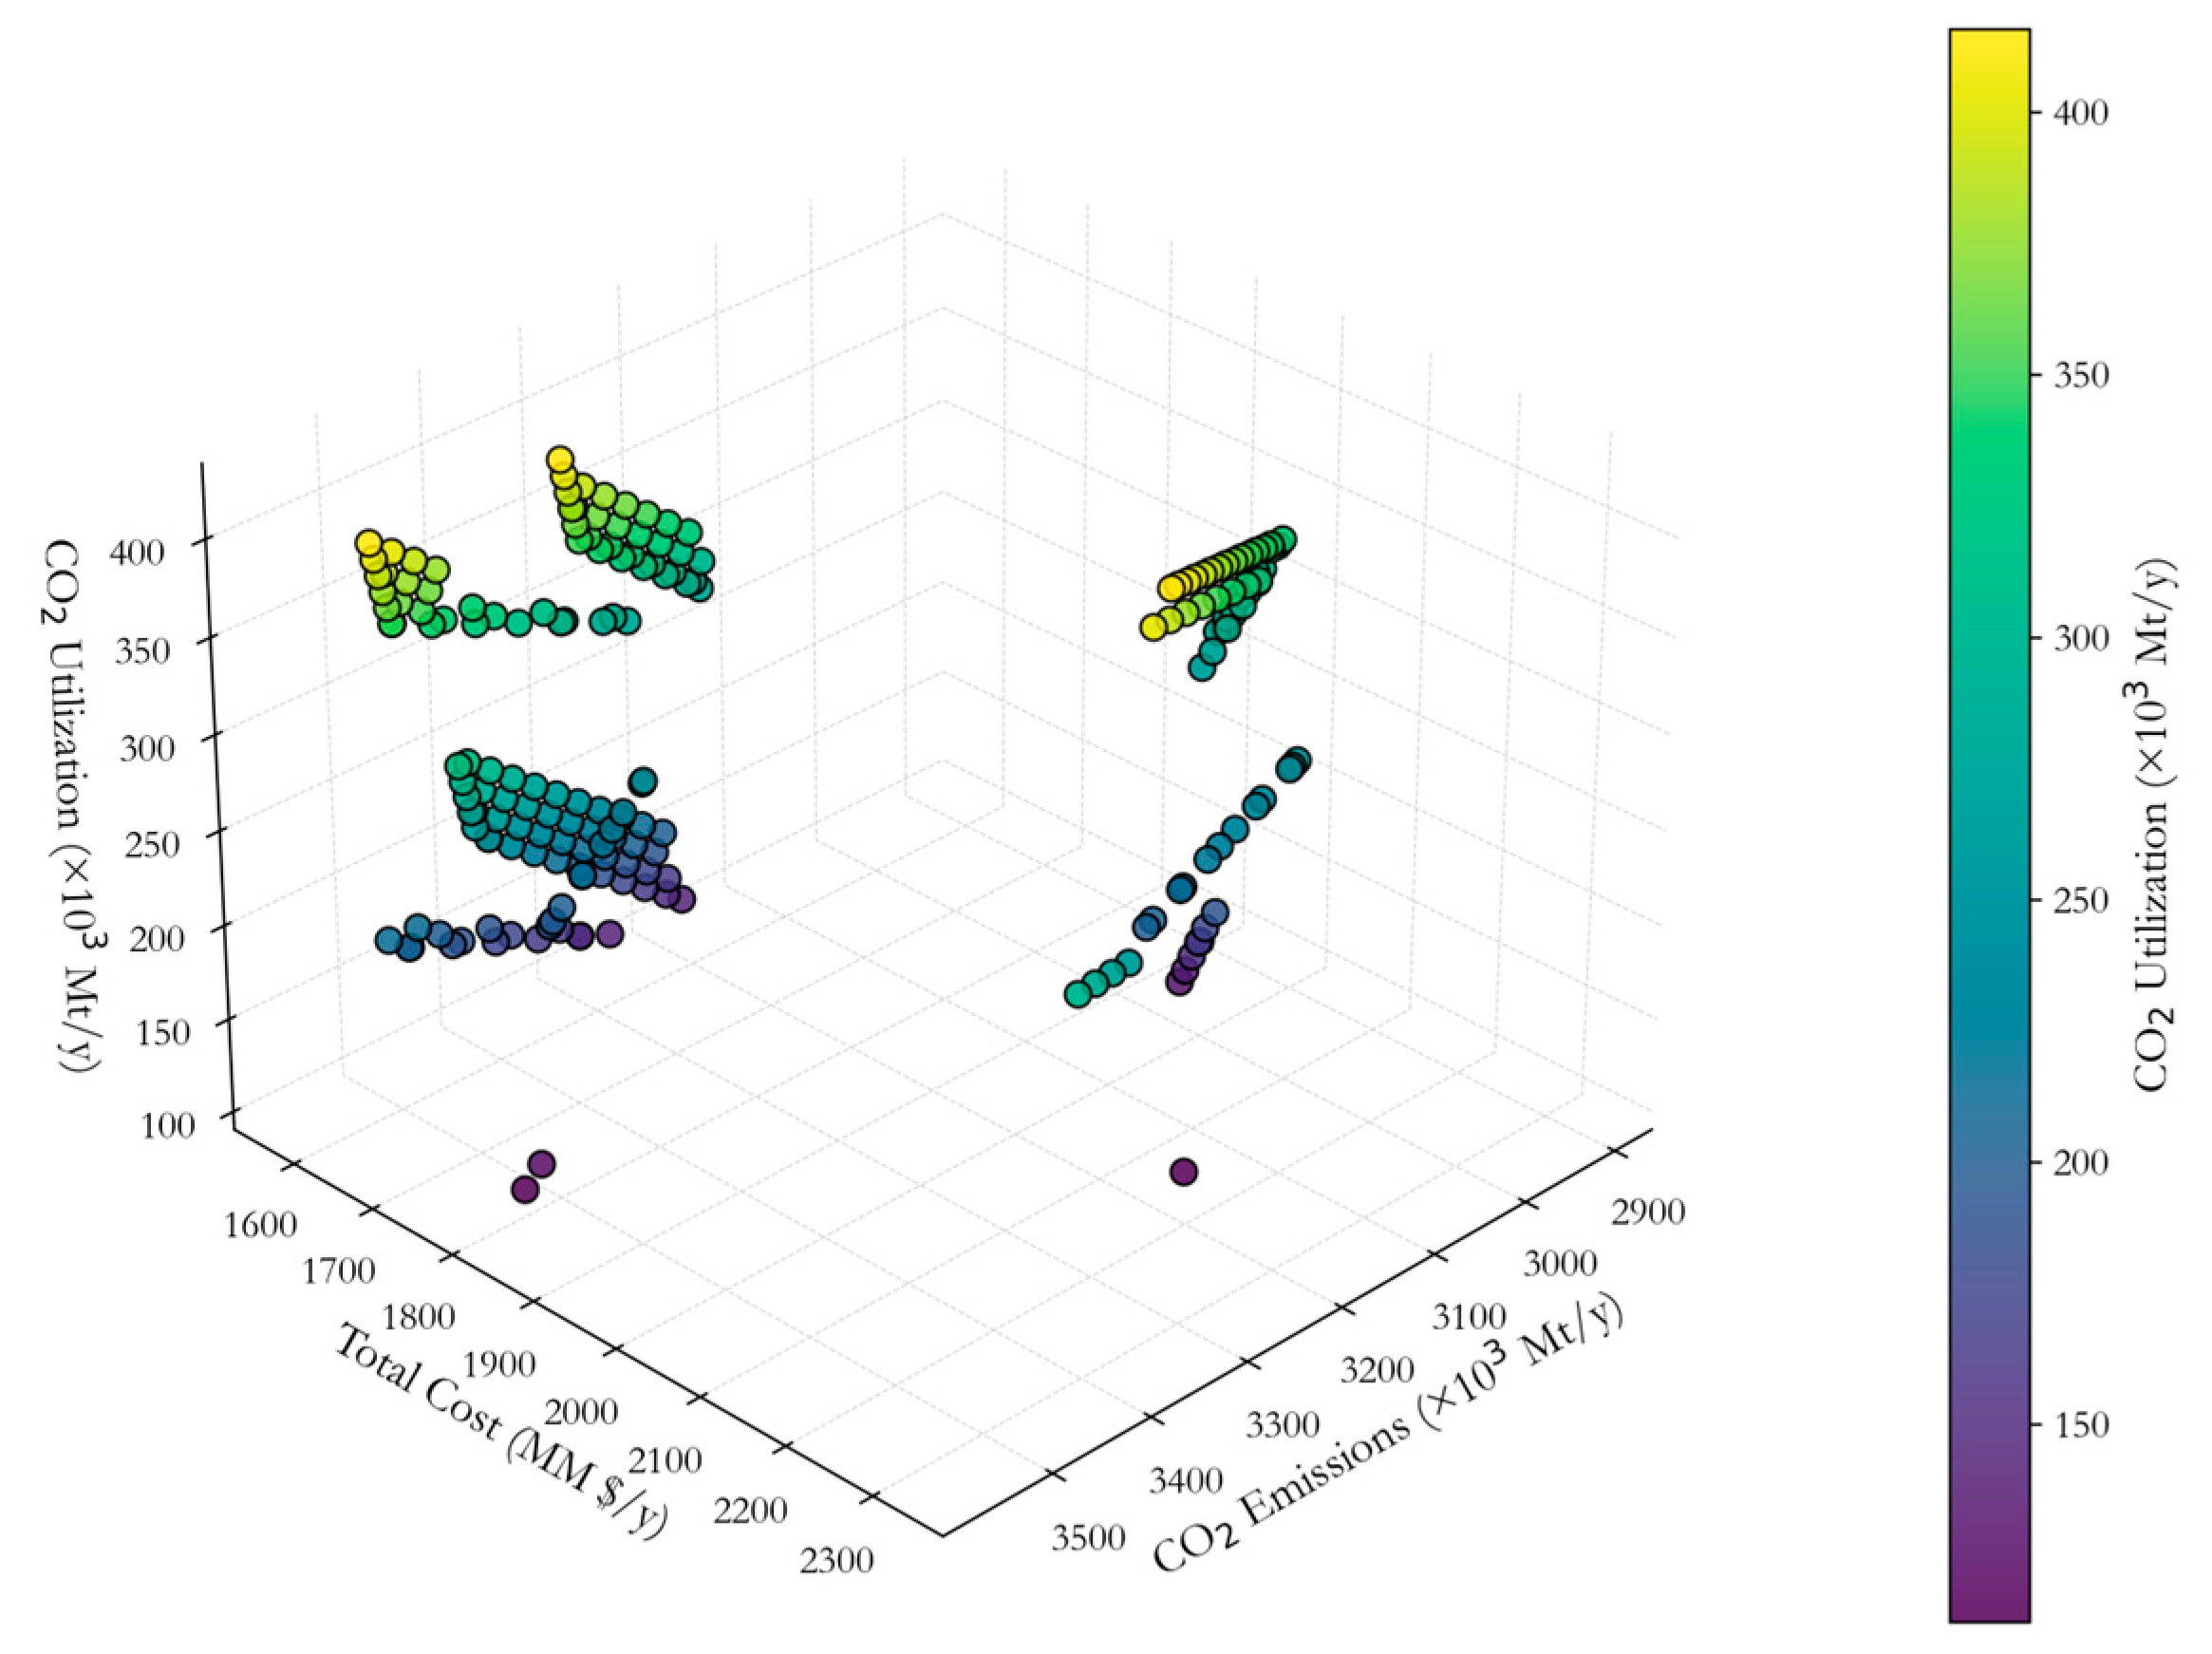
The pareto front (Figure 2 and Figure 3) captures the trade-offs between cost, CO2-eq emissions, and internal CO2 utilization. Because there are four objective functions, the Pareto front does not include the dimension of processing steps and only selected cases of processing steps are highlighted. One immediate observation is that fewer processing steps do not necessarily correspond to lower cost. For instance, the cost-minimizing solution has 23 steps with total interceptor costs of $1072 MM, whereas the step-minimizing solution has only 14 steps but costs $1368 MM. On closer examination, the step-minimizing configuration relies more heavily on direct market purchases rather than deploying interceptors. In addition, for methanol synthesis it selects the CO2 hydrogenation to methanol route instead of the conventional route. Although the CO2 pathway is less in terms of steps, it is more expensive on a per-unit cost basis, which makes the overall configuration less economical. This finding aligns with previous conclusions [45] that, although process simplification often reduces cost, certain steps can carry high economic weight, offsetting the expected savings. The front also reveals two distinct cluster separated by a noticeable gap which appears to mark a transition toward solutions with lower emission and higher utilization but at higher cost. It should be noted that CO2 utilization metric here reflects only CO2 internally sourced from the industrial plant. Consequently, no direct relationship between CO2 utilization and CO2-eq emissions should be expected in this context. Emissions calculations include contribution from upstream raw material procurement and potential CO2 released from interceptor units. The payoff table (Table 6) shows the utopia and approximate nadir points for each objective function along the diagonal providing a clear view of best- and worst-case tradeoffs. Before integration, 583,264 tons of CO2 per year were unutilized. If discharged, an amount between $50MM and $75MM may be incurred. Across all four cases presented in the payoff table and throughout the Pareto set, CO2 utilization ranges from 19% to 71%, representing the least and most favorable outcomes for that objective. Thus, the cost of discharge can be reduced to less than $15 MM. This indicates that any interception network in the optimal set provides significant benefits even in solutions with relatively low to modest utilization.
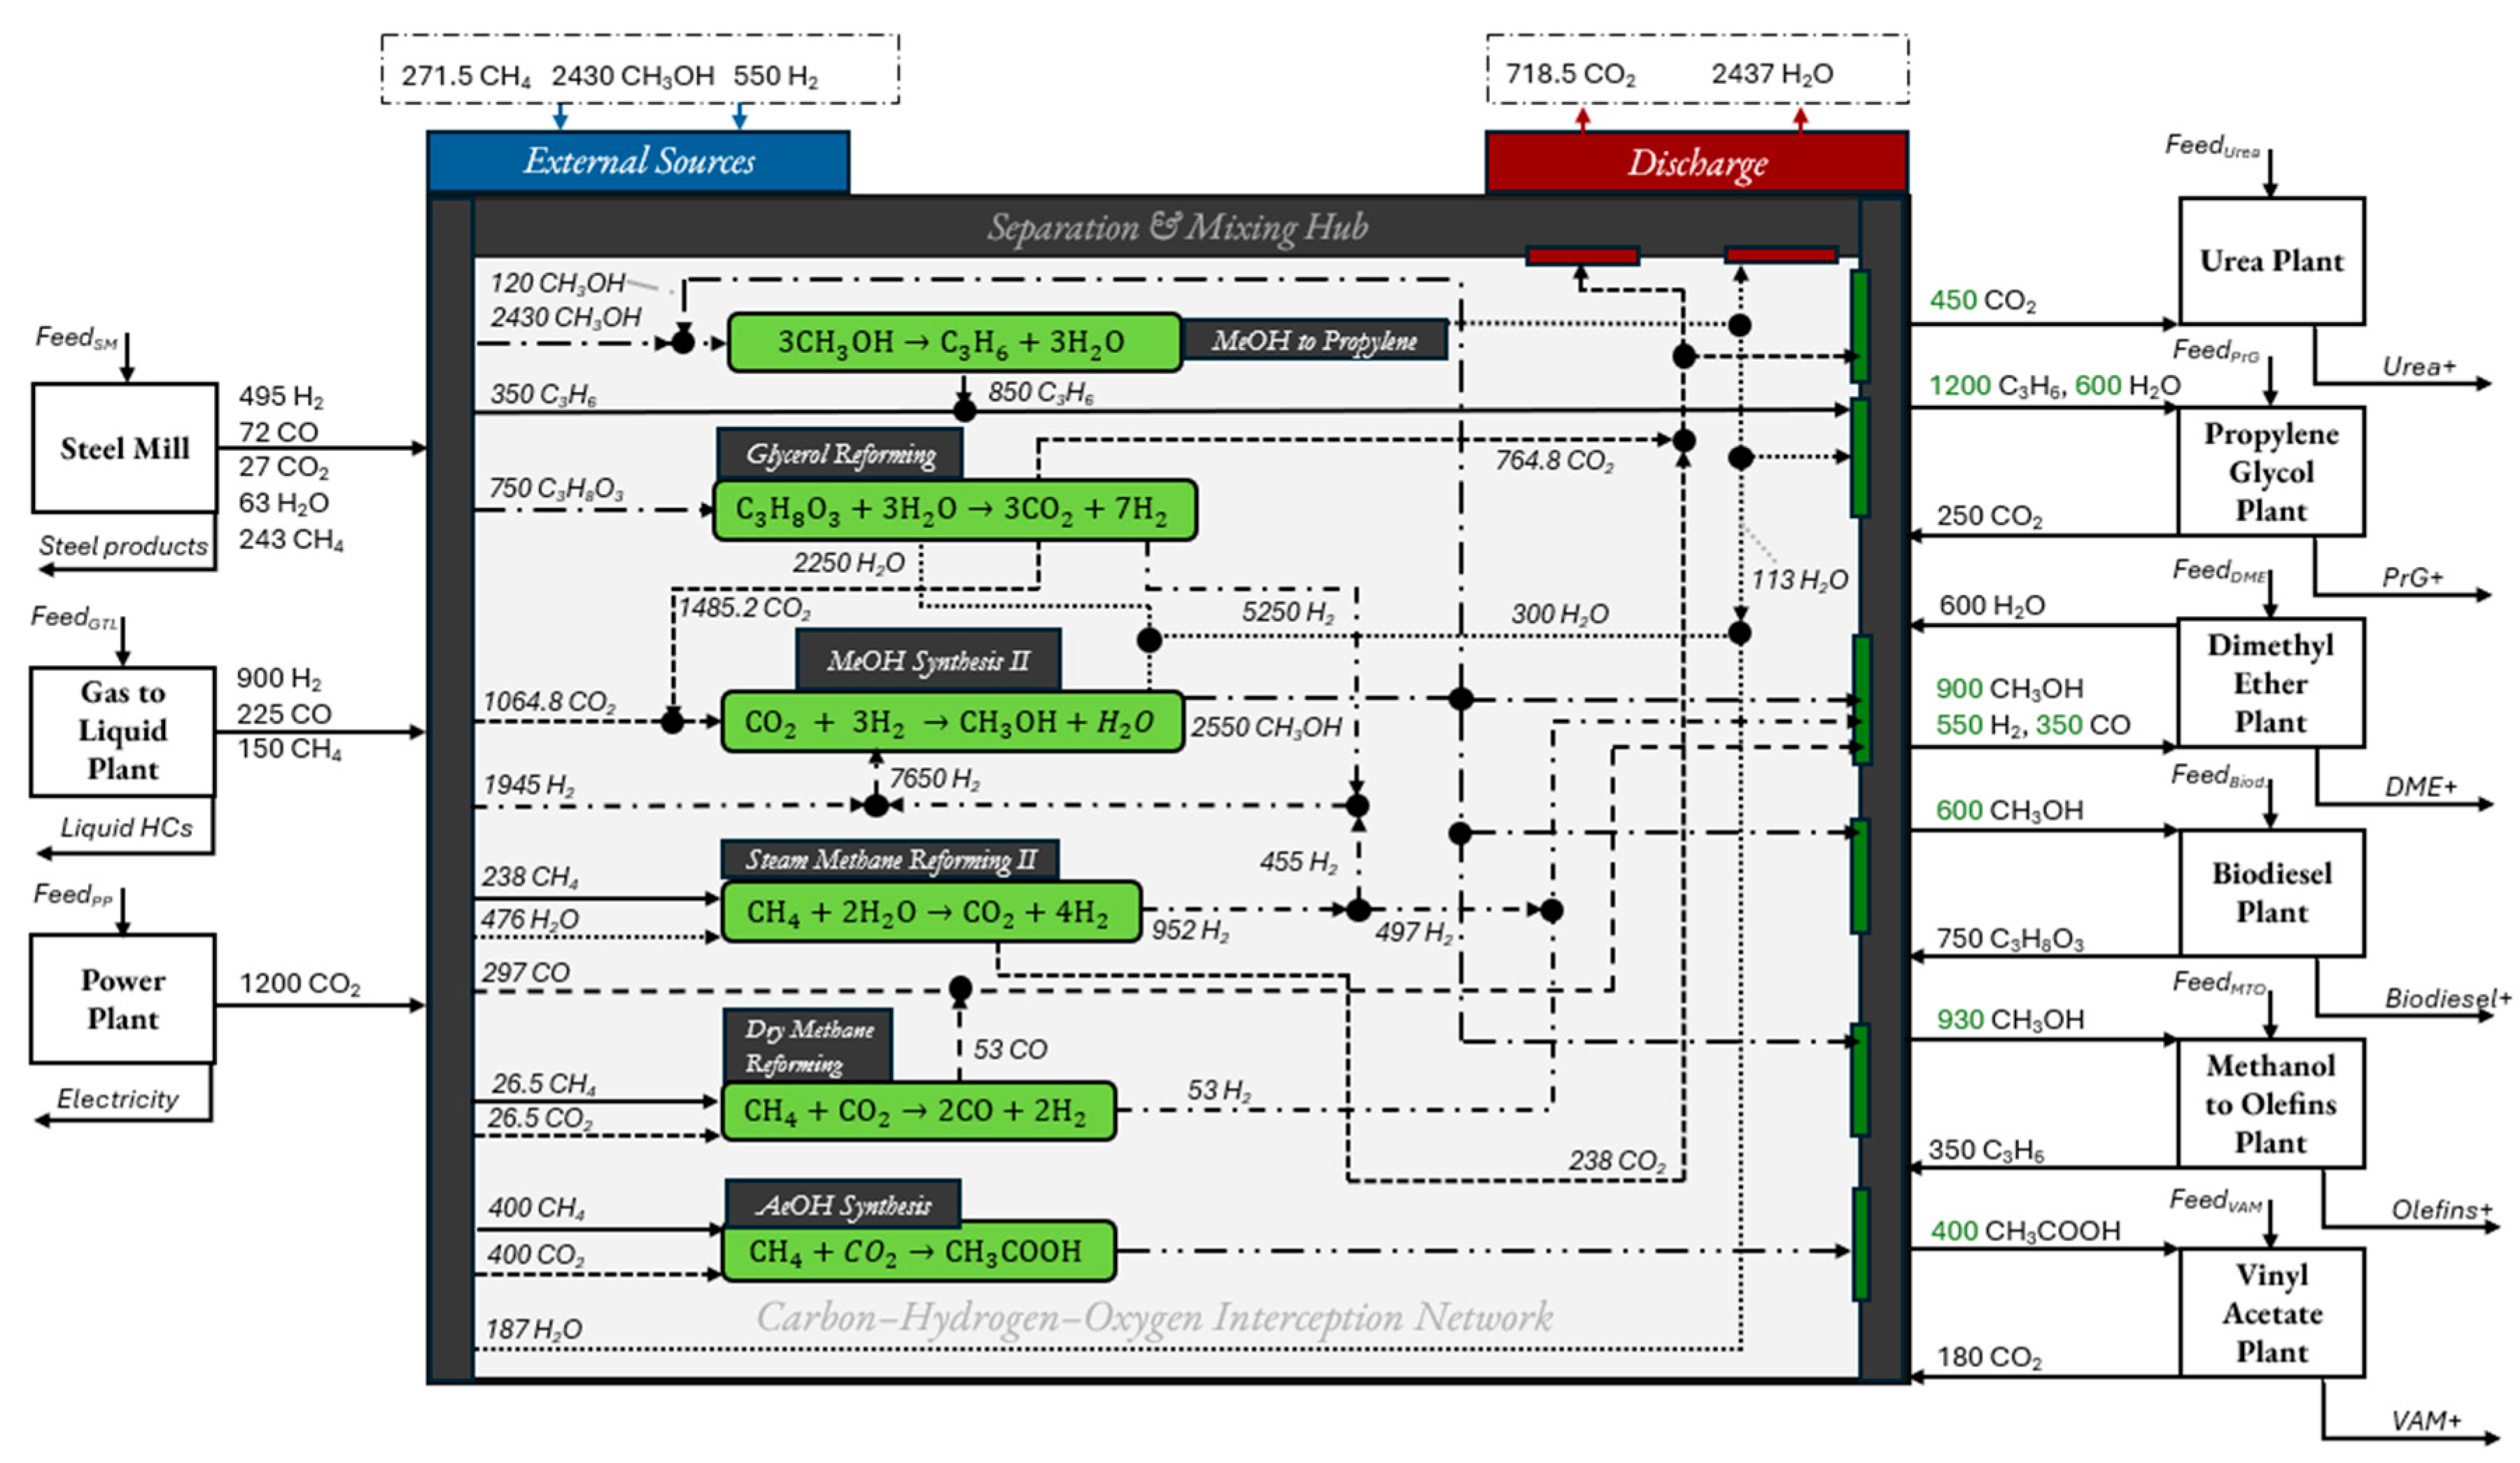
A solution point from the Pareto-optimal set can be selected to construct the corresponding network configuration by solving the model independently. Figure 4 shows the configuration with the lowest combined cost of raw material procurement and interceptor selection. In the unintegrated baseline, annual external purchases totaled $1323 MM with discharge costs of $74 MM. The CHOSYN reduced these to $493 MM (−63%) and $15 MM (−80%), respectively. Notably, interceptor selection and network configuration for maximizing CO2 utilization are similar to those for minimizing the total network cost, differing only in the selection and quantities of purchased raw materials, discharges, and flows to each interceptor unit, as well as the amount of CO2-eq emitted as shown in the payoff table. Another network configuration is illustrated in Figure 5, which represents the solution with the lowest emissions and slightly higher CO2 utilization. It is evident and expected that the solver prioritizes interceptors that consume more CO2 in their reactions. For instance, the solver selects carbon dioxide hydrogenation to methanol over the synthesis gas pathway, as well as dry methane reforming to help the utilization of CO2 produced from steam reforming. It is important to note as well that the configuration design assumes that the purchased material will be fed to interceptors and not fed directly to meet a sink requirement.
Although the benefits of integration are evident, quantifying the associated costs of interdependence remains challenging. Standalone plants or the consortium as a whole must account for this factor in their evaluations, which underscores the need for resilience analysis to analyze how performance of the network is affected in the case of disruption.
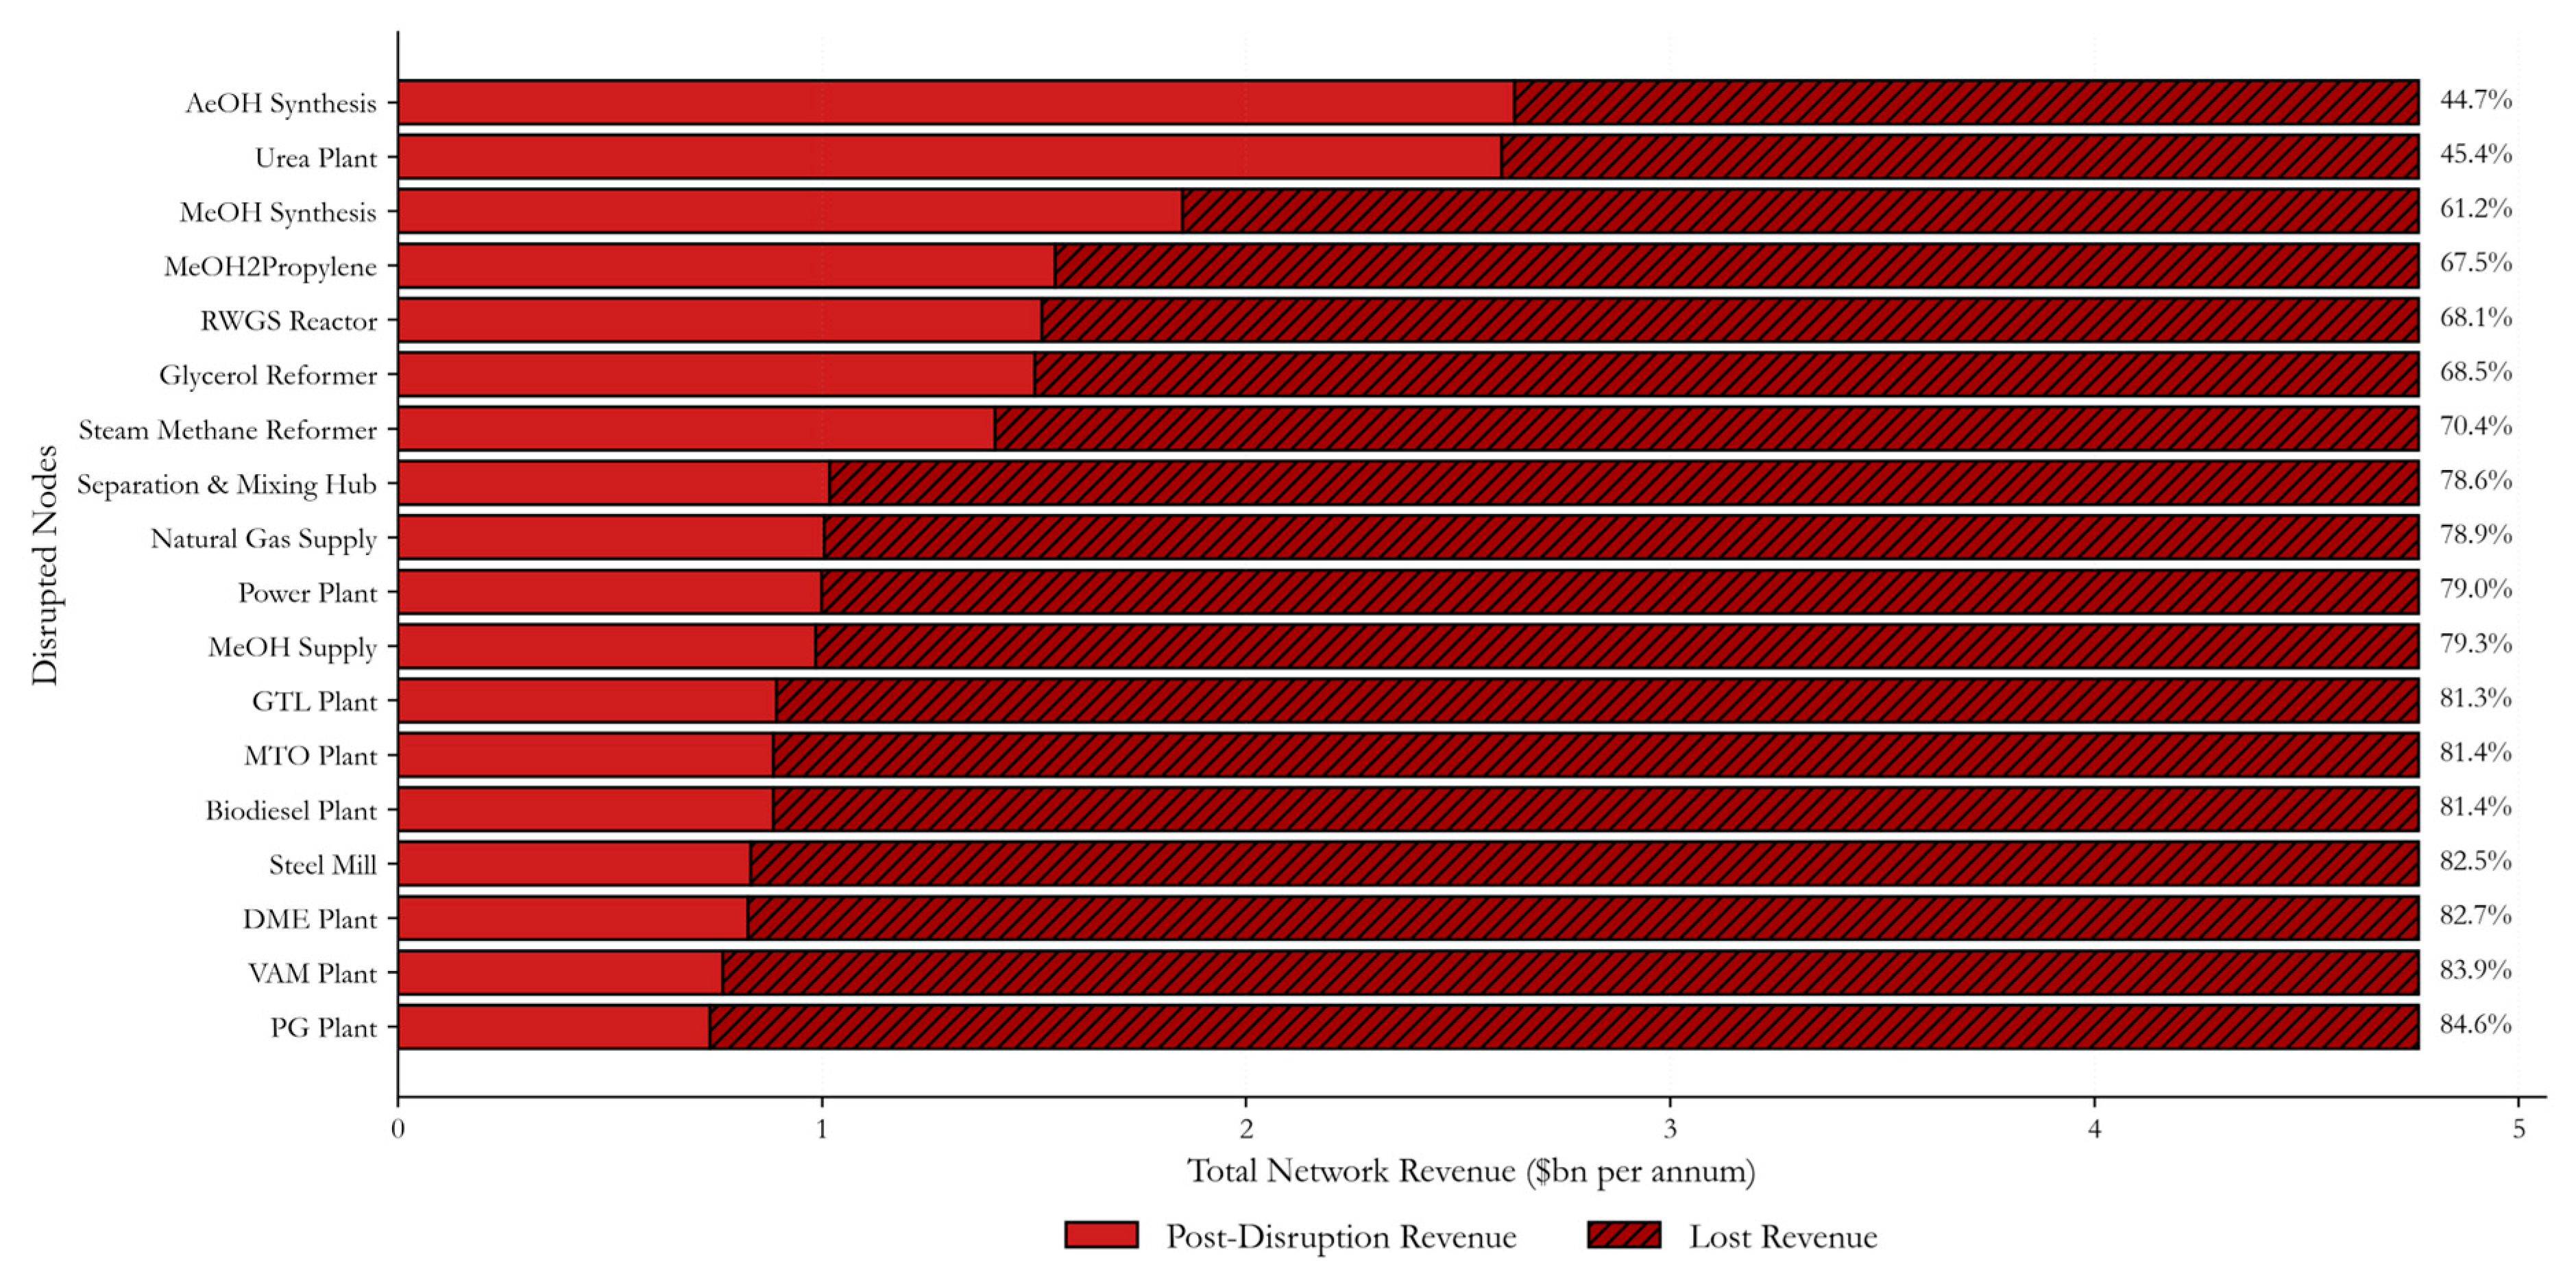
From the single-owner perspective, interceptor units are considered part of the overall operation and do not directly generate revenue; therefore, only the output of revenue-producing industrial plants (i.e., target nodes) are used to quantify the financial impact of disruptions. Building on this assumption, the resilience assessment framework described in Section 2.3 was applied to the selected CHOSYN configuration in Figure 4. In this implementation, the CHOSYN was represented in NetworkX as a directed multigraph (MultiDiGraph), which supports parallel edges and self-loops [71]. Each edge was assigned attributes specifying the transported commodity type, its flowrate, and the calculated flow dependency (Section 2.3.2). The criticality factor for interceptors was assumed to be 1 reflecting their essential role in the interception network, while the criticality factor for industrial plants was set to 0.6, since they are large-scale and typically incorporate redundancies and buffering capacities that prevent total collapse The lower and upper bounds of the dependency values, d m i n and d m a x , are set to 0.05 and 0.7, respectively. This ensures that no edge represents a completely trivial connection or a full dependency without contingency. Although interception units are essential, they do not generate revenue directly from the single-owner perspective; thus, only the outputs of revenue-producing industrial plants (i.e., target nodes) are used to quantify the financial impact of disruptions. Figure 6 presents the results of the single-node disruption analysis, in which each node was individually shut down and the resulting effects propagated to downstream dependents in proportion to the specified dependency. For external feedstock supplies and interceptor units (e.g., methanol or natural gas sources), disruptions were modeled as a complete loss of outbound flows. For industrial-plant nodes, the same propagation rule was applied, but their own direct sales revenue was additionally reduced by 25% to represent a realistic partial outage. The results indicate that large industrial plants cause the most substantial network-wide revenue losses, driven by their high-value product portfolios and their role as anchor nodes in the network topology. Because network performance is measured in total sales revenue, the magnitude of the loss is also influenced by commodity prices. Disruptions to non-revenue-generating upstream suppliers, such as methanol and natural gas sources, still produce significant downstream revenue reductions by constraining multiple dependent plants, underscoring the vulnerability of the network to external feed logistics and supply chain constraints, and highlighting the importance of diversified sourcing strategies. These results also demonstrate that nodes with high topological connectivity (i.e., rich nodes) do not necessarily have the greatest direct impact. In some cases, the greater risk lies with one of their upstream suppliers. Even the least impactful nodes, such as the AeOH (acetic acid) synthesis unit and the urea plant, still cause notable revenue losses due to their direct linkage, and the similar impact is attributable to the high revenue volume associated with urea sales.
Figure 7 presents the modeled revenue–time profiles for three recovery scenarios following a disruption together with their corresponding resilience values. Resilience is calculated as the ratio of the area under each post-disruption curve to that of the baseline performance over a 720 h (one-month) period as described in Section 2.3.4. The baseline revenue is assumed to be constant at $595.5 k/h. A 6-day lag before recovery is included, representing the time required to assess the disruption, plan interventions, mobilize resources, and to account for any other human, organizational and operational factors. The minimum (end point) of the disruption propagation is set at approximately $170 k/h, corresponding to the average post-disruption revenue obtained from the previous analysis (Figure 6). Recovery then proceeds at different rates: fast (3 days), moderate (6 days), and delayed (12 days), resulting in resilience values of 85.2%, 81.5%, and 74.2%, respectively. The corresponding total revenues over the 720 h period are $365 MM, $349 MM, and $319 MM, indicating revenue losses of approximately $64 MM, $80 MM, and $111 MM compared to the baseline case. Both the post-disruption declines, and the recovery phases are modeled using sigmoidal profiles to represent the gradual rather than instantaneous nature of these transitions. This choice is made for representational convenience. Alternative curve shapes (e.g., linear, exponential) are not expected to substantially affect the calculated resilience in this case, as the primary determinant is the duration of the decline and recovery phases. From an operational perspective, the difference between these scenarios highlights the strategic value of resilience-aware networks with well-developed contingency plans. Shorter recovery times, enabled by proactive planning and efficient resource mobilization, can mitigate substantial revenue losses and emphasize the economic incentive for incorporating disaster-resilient strategies from the conceptual design phase through the operational lifetime of the network. Such analyses can also justify the potential upfront costs associated with implementing resilient designs. Moreover, this approach enables the evaluation of alternative network configurations that are equivalent in optimality from a resilience perspective, thereby introducing an additional dimension for decision-making that merits careful consideration. It is important to reiterate that the present analysis has been conducted from the perspective of a single owner, but the framework can be readily extended to multiple owners by limiting the objectives to the targeted owner and including criteria to incentivize the other owners to participate in the symbiosis network. From a synthesis perspective, this shift moves the focus from site-wide integration, where multiple internal sources are available, to the narrower interests of a single participant, as multiple ownership inherently introduces conflicting goals. This alters the assignment of interceptors and associated flowrates, with neighboring plants potentially diverting resources to external markets or recycling them for internal use rather than contributing them as shared sources. From a resilience perspective, risk tolerance, dependency analysis, and criticality factor assignment would likewise change, as a single participant would prioritize the reliability of its most immediate connections rather than the robustness of the overall network.

5. Conclusions

This work presented a framework for the synthesis and resilience assessment of a carbon–hydrogen–oxygen symbiosis network (CHOSYN) that integrates multi-objective optimization with network-based disruption modeling. The optimization approach generated Pareto-optimal configurations that reveal the trade-offs among cost, CO2-eq emissions, internal CO2 utilization, and processing steps. The framework was applied to a case study from the perspective of a single-owner consortium aiming to transform a set of proposed industrial plants into an industrial symbiosis network. This single-owner perspective underscores the importance of explicitly defining the decision-maker’s viewpoint in both the synthesis process and the subsequent resilience assessment. The synthesis results demonstrated that integration through CHOSYN can significantly reduce external procurement and discharge costs, even in configurations optimized for objectives other than cost minimization. Analysis of the Pareto front and payoff table showed that fewer processing steps do not necessarily correspond to lower costs. Additionally, configurations targeting CO2 utilization and emissions reduction favored interceptors that maximize CO2 consumption at a higher cost, illustrating the interplay between environmental and economic priorities. The resilience assessment, based on a flow dependency metric and performance-based indicators, identified large industrial plants and key upstream suppliers as the most critical nodes in terms of network-wide revenue impact. Disruption propagation modeling revealed that topological connectivity alone is not a sufficient indicator of criticality, and vulnerabilities could originate from nodes with fewer connections. Recovery–time profile analysis showed that shortening recovery durations from 12 days to 3 days can reduce revenue losses by more than $45 million over a one-month disruption period. These findings highlight the economic and operational value of resilience-aware designs, proactive contingency planning, and efficient resource mobilization. Overall, the framework enables simultaneous consideration of economic, environmental, and resilience objectives during the conceptual design of industrial symbiosis networks. It also allows for the comparison of network configurations with equivalent optimality from a resilience standpoint, introducing an additional decision-making dimension.
Future work can enrich both synthesis and resilience parts. On the synthesis side, adding a fuller economic layer, including GHG taxation, pipeline and utility network capital and operating costs, would enable profit-based rather than revenue-only evaluation and expose clearer tradeoffs for decision-makers. On the resilience side, dependency parameterization can be strengthened via data, expert judgment, and uncertainty analysis to calibrate the criticality factor ψ and the bounds ( d m i n ,   d m a x ) . Complementary sensitivity analysis of these parameters would further illustrate their influence on resilience outcomes. For example, a value of 0.6 was assumed for large-scale plants and 1 for interceptors to reflect dependence on flow. Testing lower values for interceptors to account for redundancy would influence downstream outcomes. The current cascade uses a single-pass breadth-first propagation to avoid cyclic amplification. As a result, it does not capture most of the possible dynamics, and subsequent research should therefore consider extensions that allow for cyclic effects, partial disruptions, and multiple simultaneous disruptions. The model only adopts an in-series rule for simultaneous inputs, so each edge is essential, and redundancy streams are not represented. Scenario design can expand from single-node shocks to correlated multi-node outages and explicit restoration sequences to capture ramp down and ramp up and repair times. Lastly, the performance metric can be generalized beyond revenue to profit, emissions, demand satisfaction, or to multi-objective combinations.

Author Contributions

Conceptualization, M.A. and M.M.E.-H.; methodology, M.A. and M.M.E.-H.; software, M.A.; validation, M.A.; formal analysis, M.A.; investigation, M.A. and M.M.E.-H.; resources, M.A. and M.M.E.-H.; data curation, M.A.; writing—original draft preparation, M.A.; writing—review and editing, M.A. and M.M.E.-H.; visualization, M.A.; supervision, M.M.E.-H.; project administration, M.M.E.-H.; funding acquisition, N/A. All authors have read and agreed to the published version of the manuscript.

Funding

This research received no external funding.

Conflicts of Interest

The authors declare no conflicts of interest.

Nomenclature

CHOSYNCarbon–hydrogen–oxygen symbiosis network
GHGGreenhouse gases
SDGSustainable development goals
IEIndustrial ecology
ISIndustrial symbiosis
ISNIndustrial Symbiosis network
EIPEco-industrial parks
PSEProcess systems engineering
GTLGas-to-liquid
MTOMethanol-to-olefins
PGPropylene glycol
DMEDimethyl ether
BDBiodiesel
VAMVinyl acetate monomer
MeOHMethanol
AeOHAcetic acid
RWGSReverse water-gas shit reaction
MILPMixed integer linear programming
P Set of all plants
I Set of all internal sources
S Set of all chemical species
E Set of all external sources
D Set of all dischargeable sources
J Set of all interceptors
Δ A C N e t Net atomic flow of carbon
Δ A H N e t Net atomic flow of hydrogen
Δ A O N e t Net atomic flow of oxygen
α s Coefficient of carbon atom in species s
β s Coefficient of hydrogen atom in species s
γ s Coefficient of oxygen atom in species s
W s , p Molar flowrate of species s supplied by plant p as an internal source
G s , p Molar flowrate of species s demanded by plant p
F s Molar flowrate of purchased raw material s
D s Molar flowrate of discharged species s
δ s Upper bound on demand
τ s Upper bound on discharge
ν s , j Stoichiometric coefficient of species s in reaction j
a j Flowrate assigned to interceptor j
b j Binary variable denoting the selection of interceptor j
F p U T s Flowrate of species s targeted for utilization in plant p
f s Separation efficiency for species s
C s Cost of purchasing and discharging species s
C j Cost of interceptor j
E s G H G Upstream emissions from procurement of species s
E j G H G Direct process emissions from interceptor j
U j Processing steps in interceptor j
ξ u v Flow dependency of node v on node u
d m i n Lower bound on flow dependency
d m a x Upper bound on flow dependency
ψ Criticality factor
F u v Flowrate from node u to node v
σ Edge survival
f Node functionality
R Resilience score

References

  1. Thiel, G.P.; Stark, A.K. To Decarbonize Industry, We Must Decarbonize Heat. Joule 2021, 5, 531–550. [Google Scholar] [CrossRef]
  2. Rogelj, J.; Popp, A.; Calvin, K.V.; Luderer, G.; Emmerling, J.; Gernaat, D.; Fujimori, S.; Strefler, J.; Hasegawa, T.; Marangoni, G.; et al. Scenarios towards Limiting Global Mean Temperature Increase below 1.5 °C. Nat. Clim. Change 2018, 8, 325–332. [Google Scholar] [CrossRef]
  3. Zanon-Zotin, M.; Baptista, L.B.; Rochedo, P.R.R.; Szklo, A.; Schaeffer, R. Industrial Sector Pathways to a Well-below 2 °C World: A Global Integrated Assessment Perspective. Appl. Energy 2025, 381, 125173. [Google Scholar] [CrossRef]
  4. Gabrielli, P.; Rosa, L.; Gazzani, M.; Meys, R.; Bardow, A.; Mazzotti, M.; Sansavini, G. Net-Zero Emissions Chemical Industry in a World of Limited Resources. One Earth 2023, 6, 682–704. [Google Scholar] [CrossRef]
  5. United Nations. Transforming Our World: The 2030 Agenda for Sustainable Development; United Nations: New York, NY, USA, 2015. [Google Scholar]
  6. Daehn, K.; Basuhi, R.; Gregory, J.; Berlinger, M.; Somjit, V.; Olivetti, E.A. Innovations to Decarbonize Materials Industries. Nat. Rev. Mater. 2022, 7, 275–294. [Google Scholar] [CrossRef]
  7. Siemon, L.; Dickel, K.; Mennenga, M. Collaborative Energy Transformation Measures for Industrial Decarbonization: A System of Systems Engineering Challenge. In Proceedings of the 2025 20th Annual System of Systems Engineering Conference (SoSE), Tirana, Albania, 8–11 June 2025; pp. 1–6. [Google Scholar]
  8. Pauliuk, S.; Heeren, N.; Berrill, P.; Fishman, T.; Nistad, A.; Tu, Q.; Wolfram, P.; Hertwich, E.G. Global Scenarios of Resource and Emission Savings from Material Efficiency in Residential Buildings and Cars. Nat. Commun. 2021, 12, 5097. [Google Scholar] [CrossRef] [PubMed]
  9. Lin, J.; Liu, X.; Li, S.; Zhang, C.; Yang, S. A Review on Recent Progress, Challenges and Perspective of Battery Thermal Management System. Int. J. Heat Mass Transf. 2021, 167, 120834. [Google Scholar] [CrossRef]
  10. den Hond, F. Industrial Ecology. In International Encyclopedia of the Social & Behavioral Sciences; Smelser, N.J., Baltes, P.B., Eds.; Pergamon: Oxford, UK, 2001; pp. 7320–7326. ISBN 978-0-08-043076-8. [Google Scholar]
  11. Chertow, M.R. INDUSTRIAL SYMBIOSIS: Literature and Taxonomy. Annu. Rev. Energy Environ. 2000, 25, 313–337. [Google Scholar] [CrossRef]
  12. Perrucci, D.V.; Aktaş, C.B.; Sorentino, J.; Akanbi, H.; Curabba, J. A Review of International Eco-Industrial Parks for Implementation Success in the United States. City Environ. Interact. 2022, 16, 100086. [Google Scholar] [CrossRef]
  13. Andiappan, V.; Wan, Y.K.; Ng, D.K.S. Process Systems Engineering for Decarbonisation Strategies and Systems. Process Integr. Optim. Sustain. 2021, 5, 173–174. [Google Scholar] [CrossRef]
  14. Noureldin, M.M.B.; El-Halwagi, M.M. Synthesis of C-H-O Symbiosis Networks. AIChE J. 2015, 61, 1242–1262. [Google Scholar] [CrossRef]
  15. El-Halwagi, M.M. A Shortcut Approach to the Multi-Scale Atomic Targeting and Design of C–H–O Symbiosis Networks. Process Integr. Optim. Sustain. 2017, 1, 3–13. [Google Scholar] [CrossRef]
  16. Topolski, K.; Noureldin, M.M.B.; Eljack, F.T.; El-Halwagi, M.M. An Anchor-Tenant Approach to the Synthesis of Carbon-Hydrogen-Oxygen Symbiosis Networks. Comput. Chem. Eng. 2018, 116, 80–90. [Google Scholar] [CrossRef]
  17. Topolski, K.; Lira-Barragán, L.F.; Panu, M.; Ponce-Ortega, J.M.; El-Halwagi, M.M. Integrating Mass and Energy through the Anchor-Tenant Approach for the Synthesis of Carbon-Hydrogen-Oxygen Symbiosis Networks. Ind. Eng. Chem. Res. 2019, 58, 16761–16776. [Google Scholar] [CrossRef]
  18. Al-Fadhli, F.M.; Mukherjee, R.; Wang, W.; El-Halwagi, M.M. Design of Multiperiod C–H–O Symbiosis Networks. ACS Sustain. Chem. Eng. 2018, 6, 9130–9136. [Google Scholar] [CrossRef]
  19. Goh, Q.H.; Farouk, A.A.; Lee, J.-Y.; Chew, I.M.L. Synthesis of a Multiperiod C–H–O Symbiosis Network for the Potential Valorization of Glycerol to PHA Production. Ind. Eng. Chem. Res. 2022, 61, 16368–16382. [Google Scholar] [CrossRef]
  20. Mukherjee, R.; El-Halwagi, M.M. Reliability of C-H-O Symbiosis Networks under Source Streams Uncertainty. Smart Sustain. Manuf. Syst. 2018, 2, 132–153. [Google Scholar] [CrossRef]
  21. Juárez-García, M.; Ponce-Ortega, J.M.; El-Halwagi, M.M. A Disjunctive Programming Approach for Optimizing Carbon, Hydrogen, and Oxygen Symbiosis Networks. Process Integr. Optim. Sustain. 2019, 3, 199–212. [Google Scholar] [CrossRef]
  22. Panu, M.; Topolski, K.; Abrash, S.; El-Halwagi, M.M. CO2 Footprint Reduction via the Optimal Design of Carbon-Hydrogen-Oxygen SYmbiosis Networks (CHOSYNs). Chem. Eng. Sci. 2019, 203, 1–11. [Google Scholar] [CrossRef]
  23. Farouk, A.A.; El-Halwagi, M.M.; Foo, D.C.Y.; Chew, I.M.L. Development of a C–H–O Symbiosis Network during Conceptual Design via Economic, Sustainability, and Safety Metrics. ACS Sustain. Chem. Eng. 2021, 9, 3735–3749. [Google Scholar] [CrossRef]
  24. Juárez-García, M.; El-Halwagi, M.M.; Ponce-Ortega, J.M. Systematic Approach for Synthesizing Carbon–Hydrogen–Oxygen Networks Involving Detailed Process Simulations. Ind. Eng. Chem. Res. 2021, 60, 16378–16393. [Google Scholar] [CrossRef]
  25. Juárez-García, M.; Segovia-Hernández, J.G.; Ponce-Ortega, J.M.; Contreras-Zarazúa, G. Controllability Evaluation of the Separation Zones of a Carbon-Hydrogen-Oxygen Symbiosis Network through the SVD Technique: Conventional and Intensified Options. Chem. Eng. Process- Process Intensif. 2024, 197, 109695. [Google Scholar] [CrossRef]
  26. Lei, Z.; Yang, Y.; Hui, W.; Liu, G. Modular Design Approach of Chemical Processes Based on Carbon-Hydrogen-Oxygen Symbiosis Networks. Energy 2025, 331, 137022. [Google Scholar] [CrossRef]
  27. El-Halwagi, M.M.; Sengupta, D.; Pistikopoulos, E.N.; Sammons, J.; Eljack, F.; Kazi, M.-K. Disaster-Resilient Design of Manufacturing Facilities Through Process Integration: Principal Strategies, Perspectives, and Research Challenges. Front. Sustain. 2020, 1, 595961. [Google Scholar] [CrossRef]
  28. Gross, S.; Stelzenmüller, C. Europe’s Messy Russian Gas Divorce; The Brookings Institution: Washington, DC, USA, 2024. [Google Scholar]
  29. Hosseini, S.; Barker, K.; Ramirez-Marquez, J.E. A Review of Definitions and Measures of System Resilience. Reliab. Eng. Syst. Saf. 2016, 145, 47–61. [Google Scholar] [CrossRef]
  30. Ayyub, B.M. Systems Resilience for Multihazard Environments: Definition, Metrics, and Valuation for Decision Making. Risk Anal. 2014, 34, 340–355. [Google Scholar] [CrossRef]
  31. Newman, M.E.J. The Structure and Function of Complex Networks. SIAM Rev. 2003, 45, 167–256. [Google Scholar] [CrossRef]
  32. Watts, D.J.; Strogatz, S.H. Collective Dynamics of ‘Small-World’ Networks. Nature 1998, 393, 440–442. [Google Scholar] [CrossRef]
  33. Barabási, A.-L.; Albert, R. Emergence of Scaling in Random Networks. Science 1999, 286, 509–512. [Google Scholar] [CrossRef] [PubMed]
  34. Zhu, J.; Ruth, M. Exploring the Resilience of Industrial Ecosystems. J. Environ. Manag. 2013, 122, 65–75. [Google Scholar] [CrossRef]
  35. Zeng, Y.; Xiao, R.; Li, X. A Resilience Approach to Symbiosis Networks of Ecoindustrial Parks Based on Cascading Failure Model. Math. Probl. Eng. 2013, 2013, 1–11. [Google Scholar] [CrossRef]
  36. Chopra, S.S.; Khanna, V. Understanding Resilience in Industrial Symbiosis Networks: Insights from Network Analysis. J. Environ. Manag. 2014, 141, 86–94. [Google Scholar] [CrossRef]
  37. Li, Y.; Shi, L. The Resilience of Interdependent Industrial Symbiosis Networks: A Case of Yixing Economic and Technological Development Zone. J. Ind. Ecol. 2015, 19, 264–273. [Google Scholar] [CrossRef]
  38. Xiao, Z.; Cao, B.; Sun, J.; Zhou, G. Culture of the Stability in an Eco-Industrial System Centered on Complex Network Theory. J. Clean. Prod. 2016, 113, 730–742. [Google Scholar] [CrossRef]
  39. Fraccascia, L.; Giannoccaro, I.; Albino, V. Rethinking Resilience in Industrial Symbiosis: Conceptualization and Measurements. Ecol. Econ. 2017, 137, 148–162. [Google Scholar] [CrossRef]
  40. Li, X.; Xiao, R. Analyzing Network Topological Characteristics of Eco-Industrial Parks from the Perspective of Resilience: A Case Study. Ecol. Indic. 2017, 74, 403–413. [Google Scholar] [CrossRef]
  41. Liu, K.; Wang, X.; Yan, Y. Network Analysis of Industrial Symbiosis in Chemical Industrial Parks: A Case Study of Nanjing Jiangbei New Materials High-Tech Park. Sustainability 2022, 14, 1381. [Google Scholar] [CrossRef]
  42. Valenzuela-Venegas, G.; Henríquez-Henríquez, F.; Boix, M.; Montastruc, L.; Arenas-Araya, F.; Miranda-Pérez, J.; Díaz-Alvarado, F.A. A Resilience Indicator for Eco-Industrial Parks. J. Clean. Prod. 2018, 174, 807–820. [Google Scholar] [CrossRef]
  43. Valenzuela-Venegas, G.; Vera-Hofmann, G.; Díaz-Alvarado, F.A. Design of Sustainable and Resilient Eco-Industrial Parks: Planning the Flows Integration Network through Multi-Objective Optimization. J. Clean. Prod. 2020, 243, 118610. [Google Scholar] [CrossRef]
  44. Thun, S.Q.; Chew, I.M.L. Resilience Evaluation of Active and Passive Redundancy Using Carbon-Hydrogen-Oxygen Symbiosis Network—An Integrated and Post-Design Analysis. J. Clean. Prod. 2024, 476, 143736. [Google Scholar] [CrossRef]
  45. Gopalakrishnan, M.; Ponce-Ortega, J.M.; El-Halwagi, M.M. A Systems Approach for Process Simplification through Process Integration. Chem. Eng. Technol. 2012, 35, 1262–1272. [Google Scholar] [CrossRef]
  46. Zhang, C.; El-Halwagi, M.M. Chemical Engineering Progress; American Institute of Chemical Engineers: New York, NY, USA, 2017; pp. 28–32. [Google Scholar]
  47. Mavrotas, G. Effective Implementation of the ε-Constraint Method in Multi-Objective Mathematical Programming Problems. Appl. Math. Comput. 2009, 213, 455–465. [Google Scholar] [CrossRef]
  48. Hosseini, S.; Ivanov, D.; Dolgui, A. Review of Quantitative Methods for Supply Chain Resilience Analysis. Transp. Res. PART E-Logist. Transp. Rev. 2019, 125, 285–307. [Google Scholar] [CrossRef]
  49. Chrisandina, N.J.; Vedant, S.; Iakovou, E.; Pistikopoulos, E.N.; El-Halwagi, M.M. Metrics and Methods for Resilience-Aware Design of Process Systems: Advances and Challenges. Curr. Opin. Chem. Eng. 2024, 43, 100984. [Google Scholar] [CrossRef]
  50. Gong, J.; You, F. Resilient Design and Operations of Process Systems: Nonlinear Adaptive Robust Optimization Model and Algorithm for Resilience Analysis and Enhancement. Comput. Chem. Eng. 2018, 116, 231–252. [Google Scholar] [CrossRef]
  51. Farouk, A.A.; Chew, I.M.L. Development of a Simultaneous Mass-Water Carbon-Hydrogen-Oxygen Symbiosis Network. Sustain. Prod. Consum. 2021, 28, 419–435. [Google Scholar] [CrossRef]
  52. De Klerk, A. Fischer-Tropsch Synthesis. In Fischer-Tropsch Refining; John Wiley & Sons, Ltd.: Hoboken, NJ, USA, 2011; pp. 73–103. ISBN 978-3-527-63560-3. [Google Scholar]
  53. Stöcker, M. Methanol-to-Hydrocarbons: Catalytic Materials and Their Behavior1. Microporous Mesoporous Mater. 1999, 29, 3–48. [Google Scholar] [CrossRef]
  54. Medrano-García, J.D.; Ruiz-Femenia, R.; Caballero, J.A. Revisiting Classic Acetic Acid Synthesis: Optimal Hydrogen Consumption and Carbon Dioxide Utilization. In Computer Aided Chemical Engineering, Proceedings of the 29 European Symposium on Computer Aided Process Engineering, Eindhoven, The Netherlands, 16–19 June 2019; Kiss, A.A., Zondervan, E., Lakerveld, R., Özkan, L., Eds.; Elsevier: Amsterdam, The Netherlands, 2019; Volume 46, pp. 145–150. [Google Scholar]
  55. Cuevas-Castillo, G.A.; Michailos, S.; Akram, M.; Hughes, K.; Ingham, D.; Pourkashanian, M. Techno Economic and Life Cycle Assessment of Olefin Production through CO2 Hydrogenation within the Power-to-X Concept. J. Clean. Prod. 2024, 469, 143143. [Google Scholar] [CrossRef]
  56. Medrano-García, J.D.; Calvo-Serrano, R.; Tian, H.; Guillén-Gosálbez, G. Win–Win More Sustainable Routes for Acetic Acid Synthesis. ACS Sustain. Chem. Eng. 2025, 13, 1522–1531. [Google Scholar] [CrossRef]
  57. Almaraz, O.; Riley, J.; Palanki, S. Technoeconomic Analysis of Microwave-Assisted Dry Reforming Integrated with Chemical Looping for Production of Methanol. Ind. Eng. Chem. Res. 2025, 64, 12074–12086. [Google Scholar] [CrossRef]
  58. Rosner, F.; Papadias, D.; Brooks, K.; Yoro, K.; Ahluwalia, R.; Autrey, T.; Breunig, H. Green Steel: Design and Cost Analysis of Hydrogen-Based Direct Iron Reduction. Energy Environ. Sci. 2023, 16, 4121–4134. [Google Scholar] [CrossRef]
  59. Awani, K.; Khallaghi, N.; Kumar, V.; Nabavi, S.A. Techno-Economic Assessment of an Integrated GTL Facility for Urea Production. J. CO2 Util. 2025, 99, 103157. [Google Scholar] [CrossRef]
  60. Chen, Y.-H.; Hsieh, W.; Chang, H.; Ho, C.-D. Design and Economic Analysis of Industrial-Scale Methanol-to-Olefins Plants. J. Taiwan Inst. Chem. Eng. 2022, 130, 103893. [Google Scholar] [CrossRef]
  61. Devkota, S.; Karmacharya, P.; Maharjan, S.; Khatiwada, D.; Uprety, B. Decarbonizing Urea: Techno-Economic and Environmental Analysis of a Model Hydroelectricity and Carbon Capture Based Green Urea Production. Appl. Energy 2024, 372, 123789. [Google Scholar] [CrossRef]
  62. Jiménez, R.X.; Young, A.F.; Fernandes, H.L.S. Propylene Glycol from Glycerol: Process Evaluation and Break-Even Price Determination. Renew. Energy 2020, 158, 181–191. [Google Scholar] [CrossRef]
  63. Apostolakou, A.A.; Kookos, I.K.; Marazioti, C.; Angelopoulos, K.C. Techno-Economic Analysis of a Biodiesel Production Process from Vegetable Oils. Fuel Process. Technol. 2009, 90, 1023–1031. [Google Scholar] [CrossRef]
  64. Kofler, R.; Campion, N.; Hillestad, M.; Meesenburg, W.; Clausen, L.R. Techno-Economic Analysis of Dimethyl Ether Production from Different Biomass Resources and Off-Grid Renewable Electricity. Energy Fuels 2024, 38, 8777–8803. [Google Scholar] [CrossRef]
  65. Mavrotas, G.; Florios, K. An Improved Version of the Augmented ε-Constraint Method (AUGMECON2) for Finding the Exact Pareto Set in Multi-Objective Integer Programming Problems. Appl. Math. Comput. 2013, 219, 9652–9669. [Google Scholar] [CrossRef]
  66. Nikas, A.; Fountoulakis, A.; Forouli, A.; Doukas, H. A Robust Augmented ε-Constraint Method (AUGMECON-R) for Finding Exact Solutions of Multi-Objective Linear Programming Problems. Oper. Res. Int. J. 2022, 22, 1291–1332. [Google Scholar] [CrossRef]
  67. Bles, W.; Paterakis, N.; van Oers, Y.; Torres, D. Pyaugmecon: 1.0.8; Zenodo: Geneva, Switzerland, 2024. [Google Scholar] [CrossRef]
  68. Gurobi Optimization, LLC. Gurobi Optimizer Reference Manual; Gurobi Optimization, LLC: Houston, TX, USA, 2025. [Google Scholar]
  69. Bynum, M.L.; Hackebeil, G.A.; Hart, W.E.; Laird, C.D.; Nicholson, B.L.; Siirola, J.D.; Watson, J.-P.; Woodruff, D.L. Pyomo—Optimization Modeling in Python; Springer Optimization and Its Applications; Springer International Publishing: Cham, Switzerland, 2021; Volume 67, ISBN 978-3-030-68927-8. [Google Scholar]
  70. Hart, W.E.; Watson, J.-P.; Woodruff, D.L. Pyomo: Modeling and Solving Mathematical Programs in Python. Math. Prog. Comp. 2011, 3, 219–260. [Google Scholar] [CrossRef]
  71. Hagberg, A.A.; Schult, D.A.; Swart, P.J. Exploring Network Structure, Dynamics, and Function Using NetworkX. In Proceedings of the 7th Python in Science Conference, Pasadena, CA, USA, 19–24 August 2008; Varoquaux, G., Vaught, T., Millman, J., Eds.; SciPy Organizers: Pasadena, CA, USA, 2008; pp. 11–15. [Google Scholar]
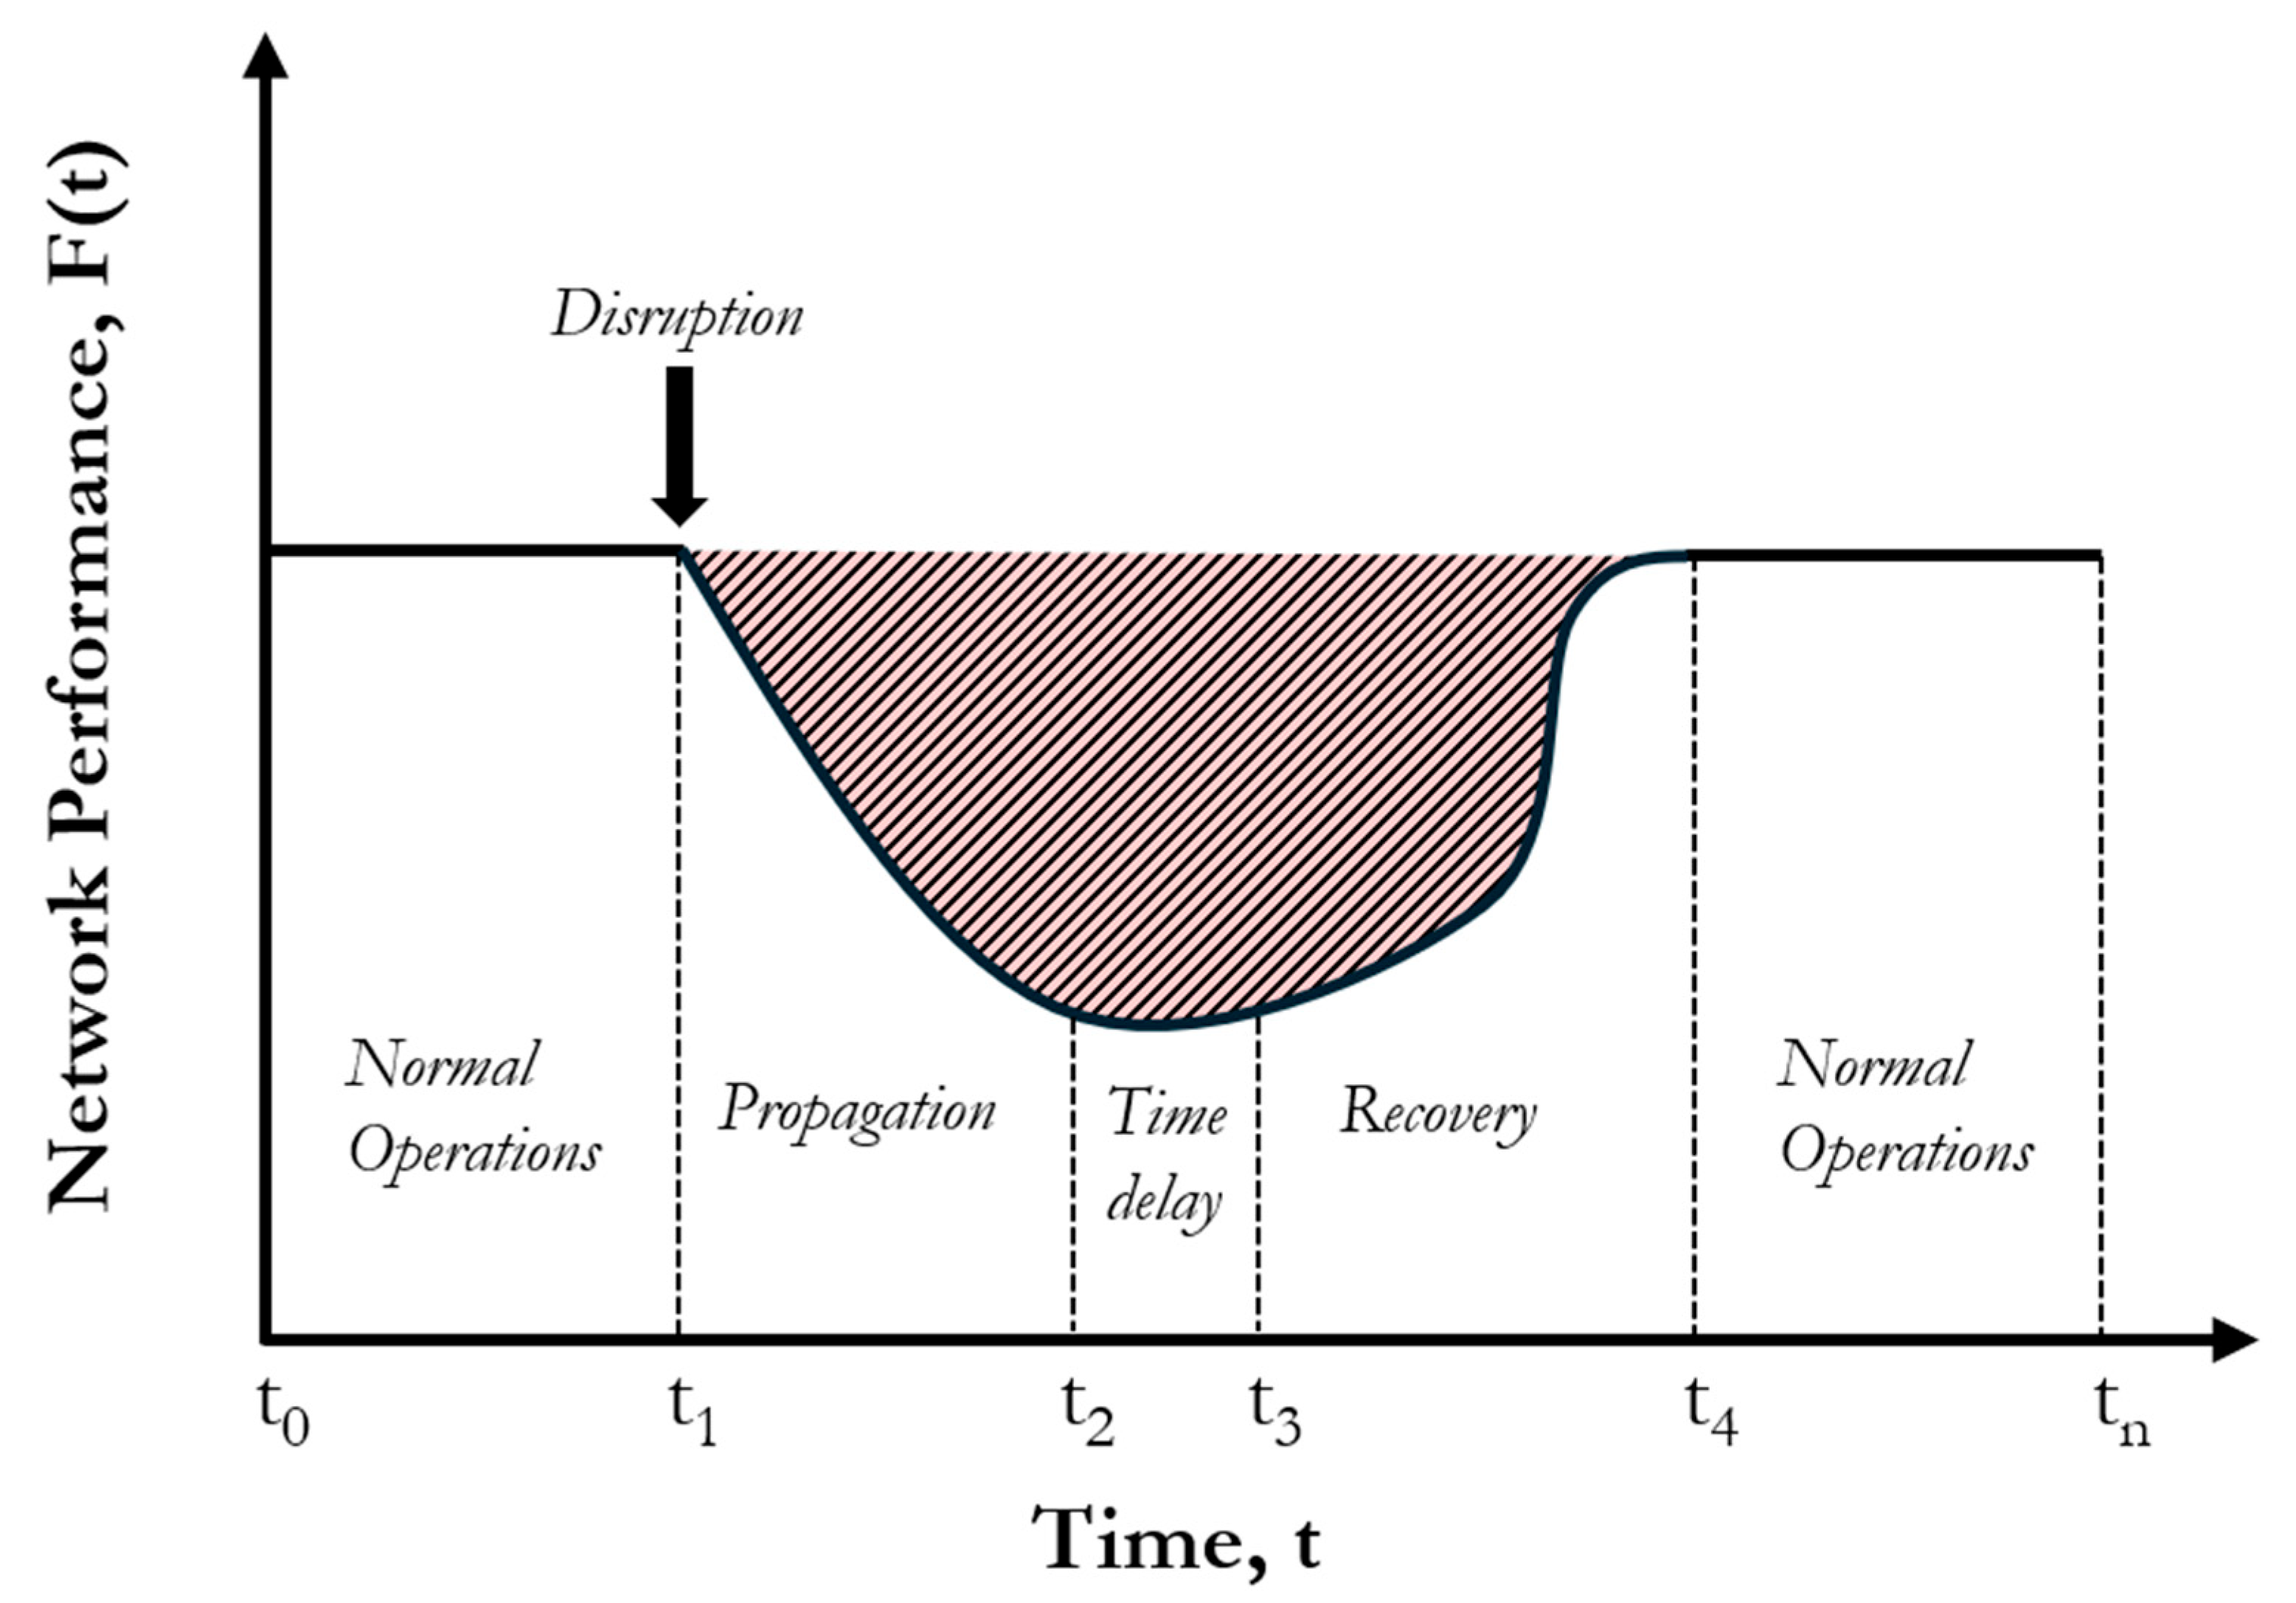
Figure 1. System performance stages over time following a disruptive event, with the shaded area representing the total performance loss.
Sustainability 17 08622 g001
Figure 2. Pareto front illustrating trade-offs among total cost (MM $/y), CO2-eq emissions ( 10 3 Mt/y), and CO2 utilization ( 10 3 Mt/y). Outlined markers indicate the number of processing steps for selected configurations, highlighting the trade-offs between processing steps and performance across the objectives.
Sustainability 17 08622 g002
Figure 3. Three-dimensional Pareto front illustrating trade-offs among total cost (MM $/y), CO2-eq emissions ( 10 3 Mt/y), and CO2 utilization ( 10 3 Mt/y). The clustering of solutions reflects groups of similar configurations, where variations in flow allocation and purchasing decisions lead to different performance trade-offs across the objectives.
Sustainability 17 08622 g003
Figure 4. CHOSYN configuration with minimum overall cost ($1577 MM), illustrating external sources, conversion processes, discharges, and product plants, with all material flows reported in kmol/h.
Sustainability 17 08622 g004
Figure 5. CHOSYN configuration with minimum overall CO2-eq emissions (2,905,573 tonnes per year), illustrating external sources, conversion processes, discharges, and product plants, with all material flows reported in kmol/h.
Sustainability 17 08622 g005
Figure 6. Impact of disruptions on network revenue, showing post-disruption revenue (solid bars) and lost revenue (hatched bars) for each disrupted node in billions of dollars. The total revenue before disruptions (4.764 $bn/y) is shown as the bar length, and the percentage of lost revenue is indicated at the right of each bar.
Sustainability 17 08622 g006
Figure 7. Resilience curves showing network performance (revenue over a period of one month) during disruption, delay, and recovery phases. The black line indicates the initial network performance and its drop during disruption, while the colored trajectories show resilience values (R) with their corresponding recovery durations.
Sustainability 17 08622 g007
Table 1. Industrial plants details [14,16,51,52,53].
PlantsRaw MaterialProductGoverning Chemical Reaction
PowerNatural gasElectricity C H 4 + O 2 C O 2 + H 2 O + e n e r g y
Steel MillIron ore/CoalSteel products F e 2 O 3 + 3 C O 2 F e + 3 C O 2
GTLNatural gasSyngas C H 4 + H 2 O C O + 3 H 2
The Fischer-Tropsch synthesis reactions
MTOMethanolOlefins 2 C H 3 O H C H 3 O C H 3 + H 2 O C 2 C 5 + H 2 O
C 2 C 5 + H 2 O H i g h e r   o l e f i n s , P a r a f f i n s ,
PGPropylenePropylene glycol C 3 H 6 + 1 2 O 2 C 3 H 6 O + H 2 O C 3 H 8 O 2
DMESyn gas/MethanolDimethyl ether 2 C H 3 O H C H 3 O C H 3 + H 2 O
BDPalm oil and methanolBiodiesel   T r i g l y c e r i d e + C H 3 O H 3   F a t t y   A c i d   M e t h y l   E s t e r s   B i o d i e s e l + C 3 H 8 O 3
VAMEthylene/acetic acidVAM C 2 H 4 + C H 3 C O O H + 1 2 O 2 C H 3 C O O C H = C H 2 + H 2 O
UreaAmmoniaUrea 2 N H 3 + C O 2 N H 2 2 C O + H 2 O
Table 2. Molar flowrate of the industrial plants’ internal sources.
Power PlantSteel MillGTLMTOPGDMEBDVAM
Flow (kmol/h)12009001395470250600750180
Component Composition (mol%)
H2 5565
CO 816
CO21003 180
H2O 7 600
CH4 2711
C2H4 9120
C3H6 350250
C3H8O3 750
Table 3. Molar flowrate of the industrial plants’ demand.
Demand InMTOUreaBDVAMPGDME
Flow (kmol/h)
H2 550
CO 350
CO2 450
H2O 600
C2H4 400
C3H6 1200
CH3OH930 600 900
CH3COOH 400
Table 4. Candidate interceptors’ reactions with economic, process, and emission data [22,51,54,55,56,57].
jDescriptionStoichiometric FormulaCost aSteps aEmissions a
1Methanol Synthesis I C O + 2 H 2 C H 3 O H 0.92 60.224
2Methanol Synthesis II C O 2 + 3 H 2 C H 3 O H + H 2 O 1.50 50.224
3Methanol Synthesis III b 0.75 C H 4 + 0.25 C O 2 + 0.5 H 2 O C H 3 O H 1.00 50.400
4Acetic Acid Synthesis I C H 3 O H + C O C H 3 C O O H 0.39 62.556
5Acetic Acid Synthesis II C H 4 + C O 2 C H 3 C O O H 0.39 22.045
6Acetic Acid Synthesis III 2 C O 2 + 4 H 2 C H 3 C O O H + 2 H 2 O 0.60 52.045
7Steam Methane Reforming I C H 4 + H 2 O C O + 3 H 2 0.95 40.425
8Steam Methane Reforming II C H 4 + 2 H 2 O C O 2 + 4 H 2 0.95 40.425
9Dry Reforming of Methane C H 4 + C O 2 2 C O + 2 H 2 1.33 40.300
10Forward Water-Gas Shift Reaction b C O + H 2 O C O 2 + H 2 0.20 20.400
11Reverse Water-Gas Shift Reaction b C O 2 + H 2 C O + H 2 O 0.20 20.400
12Glycerol Reforming C 3 H 8 O 3 + 3 H 2 O 3 C O 2 + 7 H 2 3.25 51.307
13Methanol to Propylene 3 C H 3 O H C 3 H 6 + 3 H 2 O 1.44 44.660
a Cost is in $/kg of product, steps are dimensionless, and emissions are in kmol of CO2-eq/kmol of product. b Assumed value.
Table 5. Industrial plants’ commodity prices [58,59,60,61,62,63,64].
CommodityPrice
Electricity a$0.3 per kWh
Finished steel products$600 per ton
Liquid hydrocarbons$750 per ton
Olefins$800 per ton
Urea$300 per ton
Propylene glycol$900 per ton
Biodiesel$1200 per ton
Vinyl acetate monomer a$1200 per ton
Dimethyl ether$900 per ton
a Assumed value.
Table 6. Payoff table.
Cost aCO2-eq Emissions aCO2 Utilization aProcessing Steps
Min Cost$15773,242,285281,95223
Min CO2-eq Emissions$19872,905,573330,35224
Max CO2 Utilization$16643,561,255415,82923
Min Processing Steps$21873,189,890112,38914
a Cost is in $MM per year. Emissions and utilization are in metric tons per year.
Disclaimer/Publisher’s Note: The statements, opinions and data contained in all publications are solely those of the individual author(s) and contributor(s) and not of MDPI and/or the editor(s). MDPI and/or the editor(s) disclaim responsibility for any injury to people or property resulting from any ideas, methods, instructions or products referred to in the content.