1. Introduction
With the increase in population growth, energy consumption has resulted in significant carbon emissions, leading to climate change, whereas many areas face a scarcity of water. This situation has placed the water–energy–carbon nexus at the heart of sustainability policies, accelerating the adoption of cleaner, renewable sources [
1,
2,
3,
4]. Several authors emphasize that integrated management of RE resources is essential for urban resilience [
5], and coupling wastewater treatment technologies with on-site renewables yields tangible mitigation and cost-saving opportunities [
6,
7,
8,
9,
10,
11]. Water-purification stations can be suitable solutions to enhance the flexibility of renewable energy (RE) networks while reducing the ecological footprint.
Wastewater treatment plants (WWTPs) integrated with renewable energy (RE) exemplify the water–energy–carbon nexus, as WWTPs alone are responsible for approximately 2–4% of the global electricity consumption [
12]. In China, Ching et al. [
10] examined 31 wastewater treatment plants (WWTPs) integrated with photovoltaic (PV) systems and found that they achieved a 10–40% reduction in CO
2 emissions, along with enhanced economic performance. In Australia, Syed et al. [
13] demonstrated that integrating water-purification stations can lower grid capacity requirements by 2% and LCOE by 11%. Yet, high solar penetration often produces midday surpluses that are exported at low value or curtailed—the so-called “energy-waste side-effect” of PV [
14,
15]. Small wind turbines or storage can help balance supply and demand [
16,
17,
18].
Hybrid configurations are increasingly proven. In Morocco, Bellar et al. [
19] reported environmental and economic gains after adding PV to a WWTP, while Mokhi et al. [
20] assessed and optimized the existing photovoltaic systems at Ibn Tofail University using HOMER Pro, in light of Morocco’s new renewable energy law, to determine the economic and environmental benefits of system expansion and energy surplus sales. In North-East Italy, Campana et al. [
21] investigated the feasibility of modeling a high share of renewable energy systems, resulting in a greener and more energy-efficient WWTP. Campana et al.’s [
21] study aims to find a compromise between the renewable energy share and the Net Present Cost (NPC) of the system, whereas it uses PV, wind, and multiple energy storage technologies. In a Chinese campus micro-grid combining PV, wind, biomass, and batteries, Zhao et al. [
22] reported that the optimal design achieved a lower cost of energy (COE) and net present cost (NPC), amounting to USD 0.0671 and USD 153 million, respectively. Tanko et al. [
23], AlKassem et al. [
24] and Pérez, Mojumder et al. [
25,
26] highlight the effectiveness of hybrid renewable energy systems in providing reliable, cost-efficient, and sustainable electricity.
Since 2017, Ibn Tofail University has been integrating photovoltaic (PV) systems into its educational buildings, aiming to cut grid dependence by 40%. Today, the university combines solar power with an on-site wastewater treatment plant (WWTP) that irrigates its green spaces, making it a unique and practical test-bed for sustainable solutions. Meanwhile, the International Energy Agency warns that electricity demand in the water sector could double by 2040, highlighting the urgent need for renewable energy integration and more flexible operations [
27]. However, recent experiences in Spain show that curtailing unused solar energy can reduce project profitability by up to 7.7% and increase electricity costs by 2.5%, putting the economic sustainability of solar investments at risk in high-penetration areas [
28], while regulatory and financial barriers slow the uptake of smart-building technologies in emerging economies [
29].
In light of these challenges and opportunities, this study aims to pursue three complementary goals.
G1. Quantify the ability of the PV array integrated into UIT’s smart building to satisfy the electricity demand of its coupled water-purification station.
RQ 1. What share of the station’s hourly and annual load can the existing rooftop PV system cover?
G2. Evaluate how supplementing the rooftop PV system with an on-site wind resource influences load-matching performance and interaction with the grid, using reproducible indicators of self-consumption, self-sufficiency, self-production, and grid reliability.
RQ 2. To what extent does adding a small wind turbine alter these load-matching metrics and the resulting grid reliability compared with the PV-only baseline?
G3. Assess the techno-economic and environmental feasibility of harnessing PV surplus and deploying a hybrid PV/wind configuration under the climatic, electrical, and regulatory conditions of the MENA region.
RQ 3. Under which tariff, load-growth, and wind-resource scenarios does the hybrid system outperform the stand-alone PV system in terms of LCOE, net present cost, and CO2 mitigation?
The remainder of the paper is organized as follows.
Section 2 reviews the relevant literature;
Section 3 details the methodology and data;
Section 4 describes the case study;
Section 5 presents the results, followed by discussion in
Section 6; and
Section 7 draws conclusions and outlines future research avenues.
2. Literature Review
Modern office buildings, hospitals, and housing complexes now use smart sensors and automation to flexibly manage energy use. The U.S. Department of Energy classifies such buildings as Grid-Interactive Efficient Buildings (GEBs), designed to store energy, incorporate renewables, and shift consumption to lower-cost periods [
30]. Recent studies confirm the effectiveness of demand-side strategies in mitigating grid stress. For instance, Moses Babu et al. [
31] showed that coordinating demand response with solar PV and battery storage in a microgrid setting can reduce peak loads by around 10%, while also lowering energy costs by up to 38%. Similarly, Van Tilburg et al. [
32] demonstrated a 14.48% reduction in the peak-to-average load ratio using a decentralized control approach across residential households. Broader studies estimate that distributed energy resources (DERs), when effectively coordinated, can reduce peak demand by up to 17% at grid scale—underscoring the scalability of these strategies across sectors and system sizes [
33].
Optimized battery control in smart buildings can increase solar self-consumption by up to 19% and building self-sufficiency by up to 12%, and shave overall building peak demand by up to 30% [
34]. Recent studies exploring thermal flexibility strategies in warm climates highlight their effectiveness in managing peak load. For example, radiant roof cooling combined with indoor temperature reset strategies achieved a 19.8% peak load shift, while pre-cooling strategies reduced peak power by over 24% in hot climates like Dubai. Meanwhile, predictive control of heat pumps enabled load shifting of 2–33%, depending on demand response settings and comfort constraints [
35,
36,
37]. These strategies complement exporting surplus to nearby high-intensity loads such as WWTPs.
Recent case studies demonstrate the value of integrating renewables with water infrastructure: In Morocco, a PV/Wind configuration at a WWTP covered 72% of its energy needs, saving roughly EUR 0.53/m
3—about EUR 106.8/day for a 200 m
3/day facility [
19]. In China, PV integration at multiple WWTPs achieved 10–40% reductions in CO
2 emissions, with system performance strongly dependent on solar resource and demand-generation ratios [
4]. In Portugal, solar-powered desalination has proven both cost-effective and sustainable [
38,
39,
40,
41]. In Porto Santo, integrating PV reduced the levelized cost of energy to EUR 0.137/kWh, lower than the EUR 0.1504/kWh grid-only scenario. In the Porto Santo Island in the Madeira Archipelago and the Algarve in the southern mainland, decentralized solar-driven desalination cut water production costs by 33% compared to grid-powered setups. Additionally, using hybrid RES configurations in the island of S. Vicente, in Cape Verde, lowered the levelized cost of water by over 27% and CO
2 emissions by 67% [
38,
39,
40,
41].
Recent techno-economic assessments underline the value of hybrid PV–wind systems for water infrastructure. In Egypt, hybrid PV and wind systems achieve near-100% renewable energy coverage for desalination operations, with projected electricity costs around USD 0.091/kWh and a payback period of just over one year [
42]. In Saudi Arabia, Alkassem et al. [
24] investigated the impact of the PV–Wind hybrid system. In this study, even though the wind has a higher capacity factor, it has a longer payback period compared to the PV system.
As solar PV penetration increases, curtailment rises due to oversupply and operational limits, with thermal generator constraints notably impacting curtailment at mid-level PV shares (25–40%). At very high penetration levels (>50%), economic curtailment can reach up to 40% during peak production hours, with frequent low-price events, despite storage helping balance supply and demand [
43,
44]. Flexible loads such as EV charging, heat pumps, and water pumping play a crucial role in improving the efficiency and sustainability of photovoltaic (PV) systems by absorbing excess generation and reducing curtailment. Utility-controlled EV charging (UCC) allows surplus solar electricity—especially during midday peaks—to be redirected toward vehicle batteries, effectively minimizing energy waste and enhancing solar self-consumption [
45,
46]. Similarly, heat pumps, when scheduled to operate during PV production hours, serve as thermal storage and contribute to higher energy utilization efficiency, reducing the mismatch between generation and demand [
47]. Moreover, smart water pumping strategies that align pumping operations with solar generation windows have been shown to cut PV energy waste significantly, with some systems reporting up to 44% reduction in energy costs due to optimized usage [
48]. Together, these coordinated load management strategies provide a practical path toward increasing PV integration without the immediate need for costly storage expansion. Wind–solar complementarity can increase grid penetration by up to 20% while reducing storage and balancing needs compared to stand-alone systems. Although benefits may plateau at very high penetration, complementarity improves system reliability and supports more efficient transitions to renewable energy [
49].
Few studies combine PV surplus from smart buildings with external critical loads such as WWTPs, and evidence from North Africa remains scarce, although wind regimes are moderate and regulatory frameworks are evolving. The present work addresses both gaps by testing, for the first time in Morocco, a small-scale PV/wind hybrid that channels smart-building surplus to a WWTP under realistic sensitivity scenarios.
3. Materials and Methods
Using Homer Pro and the monitoring system to assess the feasibility of using building surplus to supply a wastewater treatment plant, focusing on network responsibility, will be discussed in this article using the four main metrics used in [
24,
50,
51].
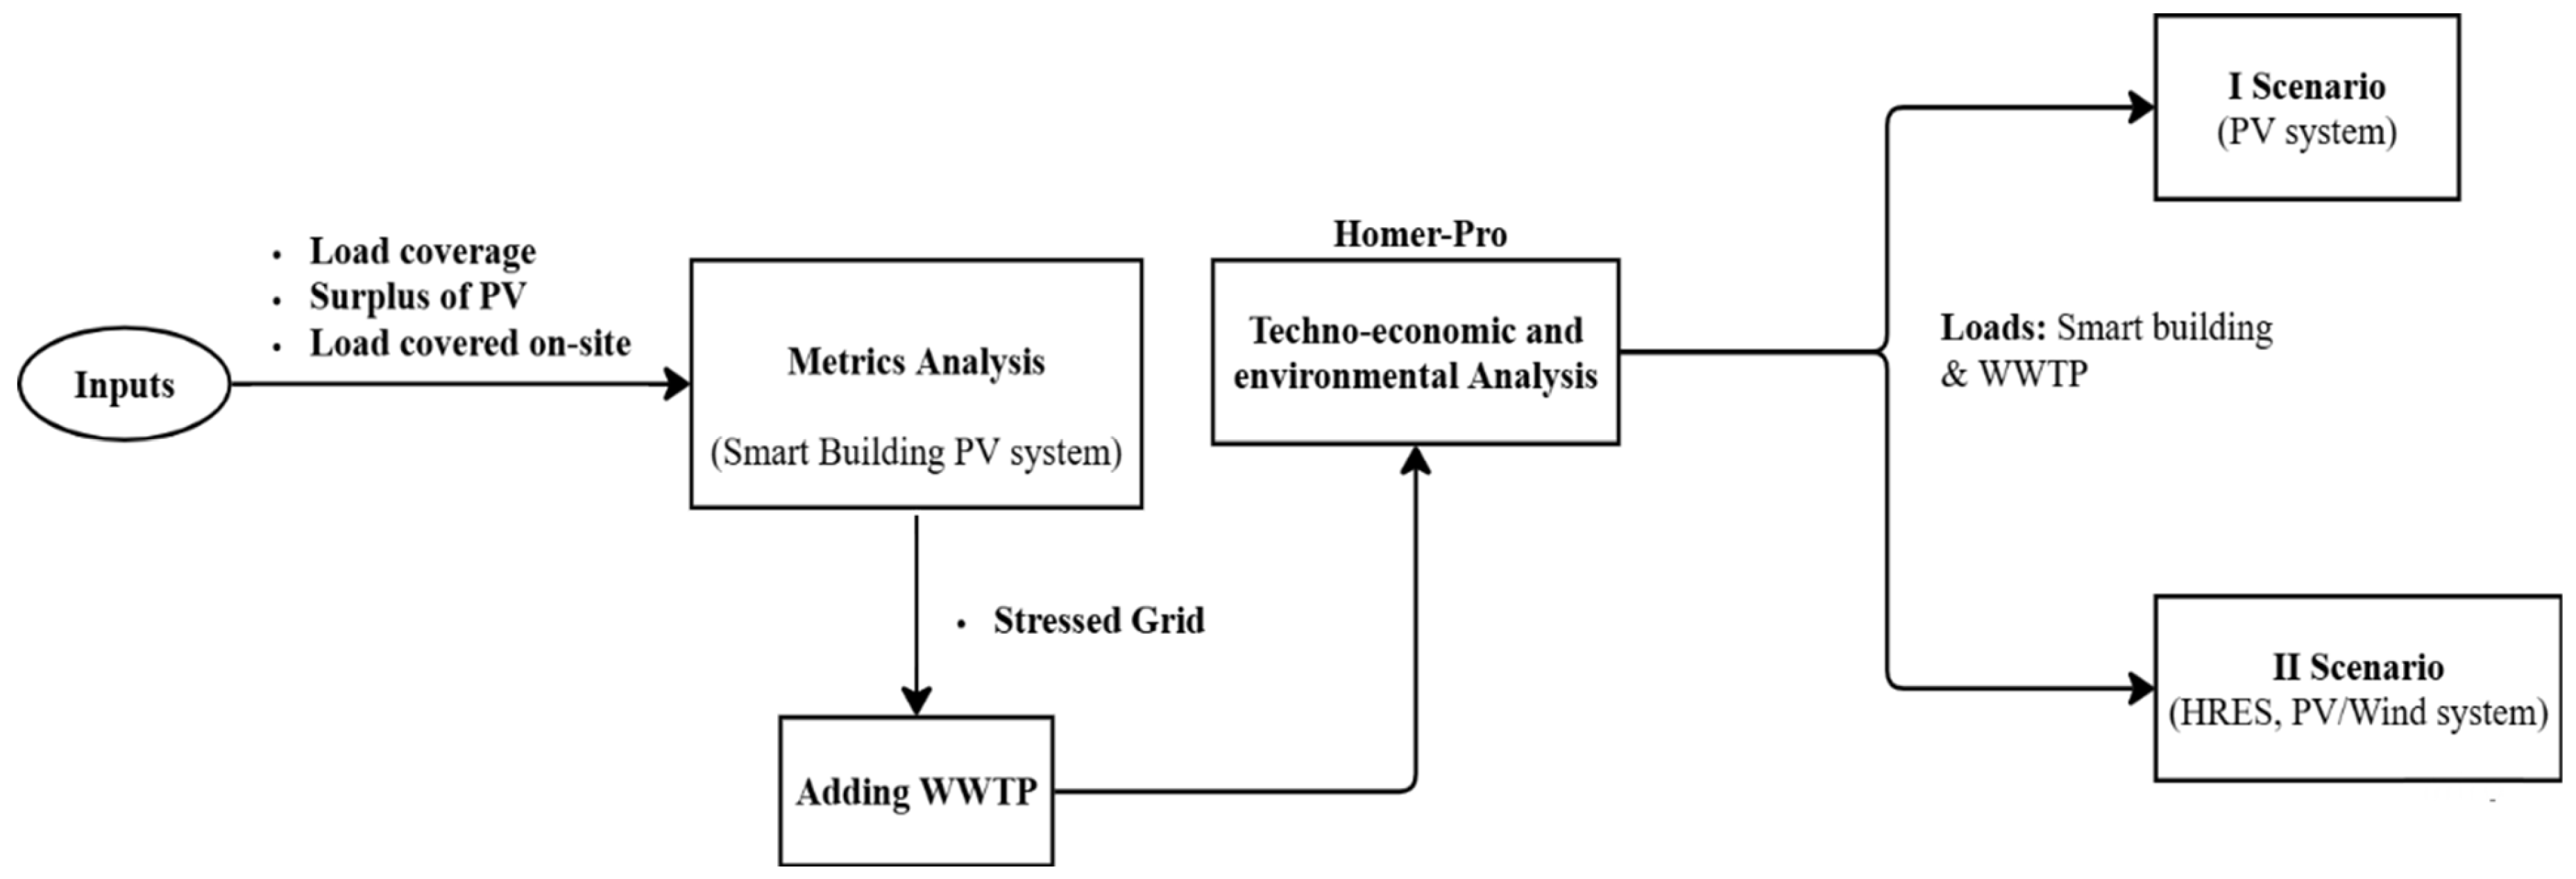
Figure 1 represents the structure used to assess the HRES. The methodology is split into two major steps: the metrics assessment and the software evaluation. The reason behind using the Homer-Pro software 3.14.2 is related to its ability to design, model, and simulate HRES. It is broadly used in different sectors, specifically the educational sector. Furthermore, Homer-Pro has three key functions—simulation, optimization, and sensitivity analysis—leading to detailed techno-economic and environmental assessments. Once the feasibility of connecting the WWTP to the buildings has been investigated, two scenarios will be evaluated.
The first scenario represents the use of the surplus from the two PV systems to power the WWTP, and the second scenario involves a 30 kW wind turbine added to the renewable energy system. Electrical, economic, and environmental factors are analyzed for each scenario and are compared in the results section.
3.1. Metrics
The mismatch problem of renewable energy grid-connected systems is described using four load matching indicators, including traditional and novel metrics: self-consumption and self-sufficiency, self-production, and grid reliability, respectively.
Self-consumption and self-sufficiency are primarily concerned with on-site utilization and independence from the grid [
52]. They refer to percentages that indicate the amount of the on-site consumption or total energy needs met by the renewable system [
53,
54]. The amount of electricity produced by a renewable energy system, such as a solar system, that is used locally is known as self-consumption [
55]. Technically speaking, it is the proportion of energy generated by the integrated photovoltaic system that is used locally, indicating the efficiency of the system’s on-site use [
51,
52]. Equation 1 represents the self-consumption. When an energy system is self-sufficient, it can produce enough renewable energy locally to satisfy the consumer’s energy needs without the help of outside resources like the grid. It illustrates how well the system can meet the energy requirements of buildings while reducing dependency on outside networks and traditional energy sources [
53,
54]. Equation 2 represents the self-sufficiency.
Grid-reliability (GL) and self-production (SP) take into account how the renewable energy system interacts overall with both on-site consumption and the grid. The SP indicator considered merging on-site utilization and feedback to the grid into a single indicator, enabling decisions on PV system sizing and control strategies. The network reliability rate is intended to describe the variation in the amount of energy transferred across the network connection point, regardless of the direction of flow [
54]. In these equations in
Table 1, A represents the load coverage from the grid, B the surplus of the PV system, and C the load covered on-site.
3.2. Homer-Pro
After analyzing the grid reliability and the technical feasibility of using the building’s surplus to the water-purification station, using Homer-Pro, an economic and environmental study is conducted to compare two distinct scenarios, showing the cost-effectiveness and environmental sustainability of using a hybrid PV/Wind system to power the WWTP. Using Homer-Pro necessitates the use of various inputs, represented by the load requirements, the information about energy resources, system components, economic parameters, and environmental factors, as illustrated in
Figure 2. Simulating these data results in the representation of an optimal system configuration, technical feasibility, economic analysis, and environmental impact.
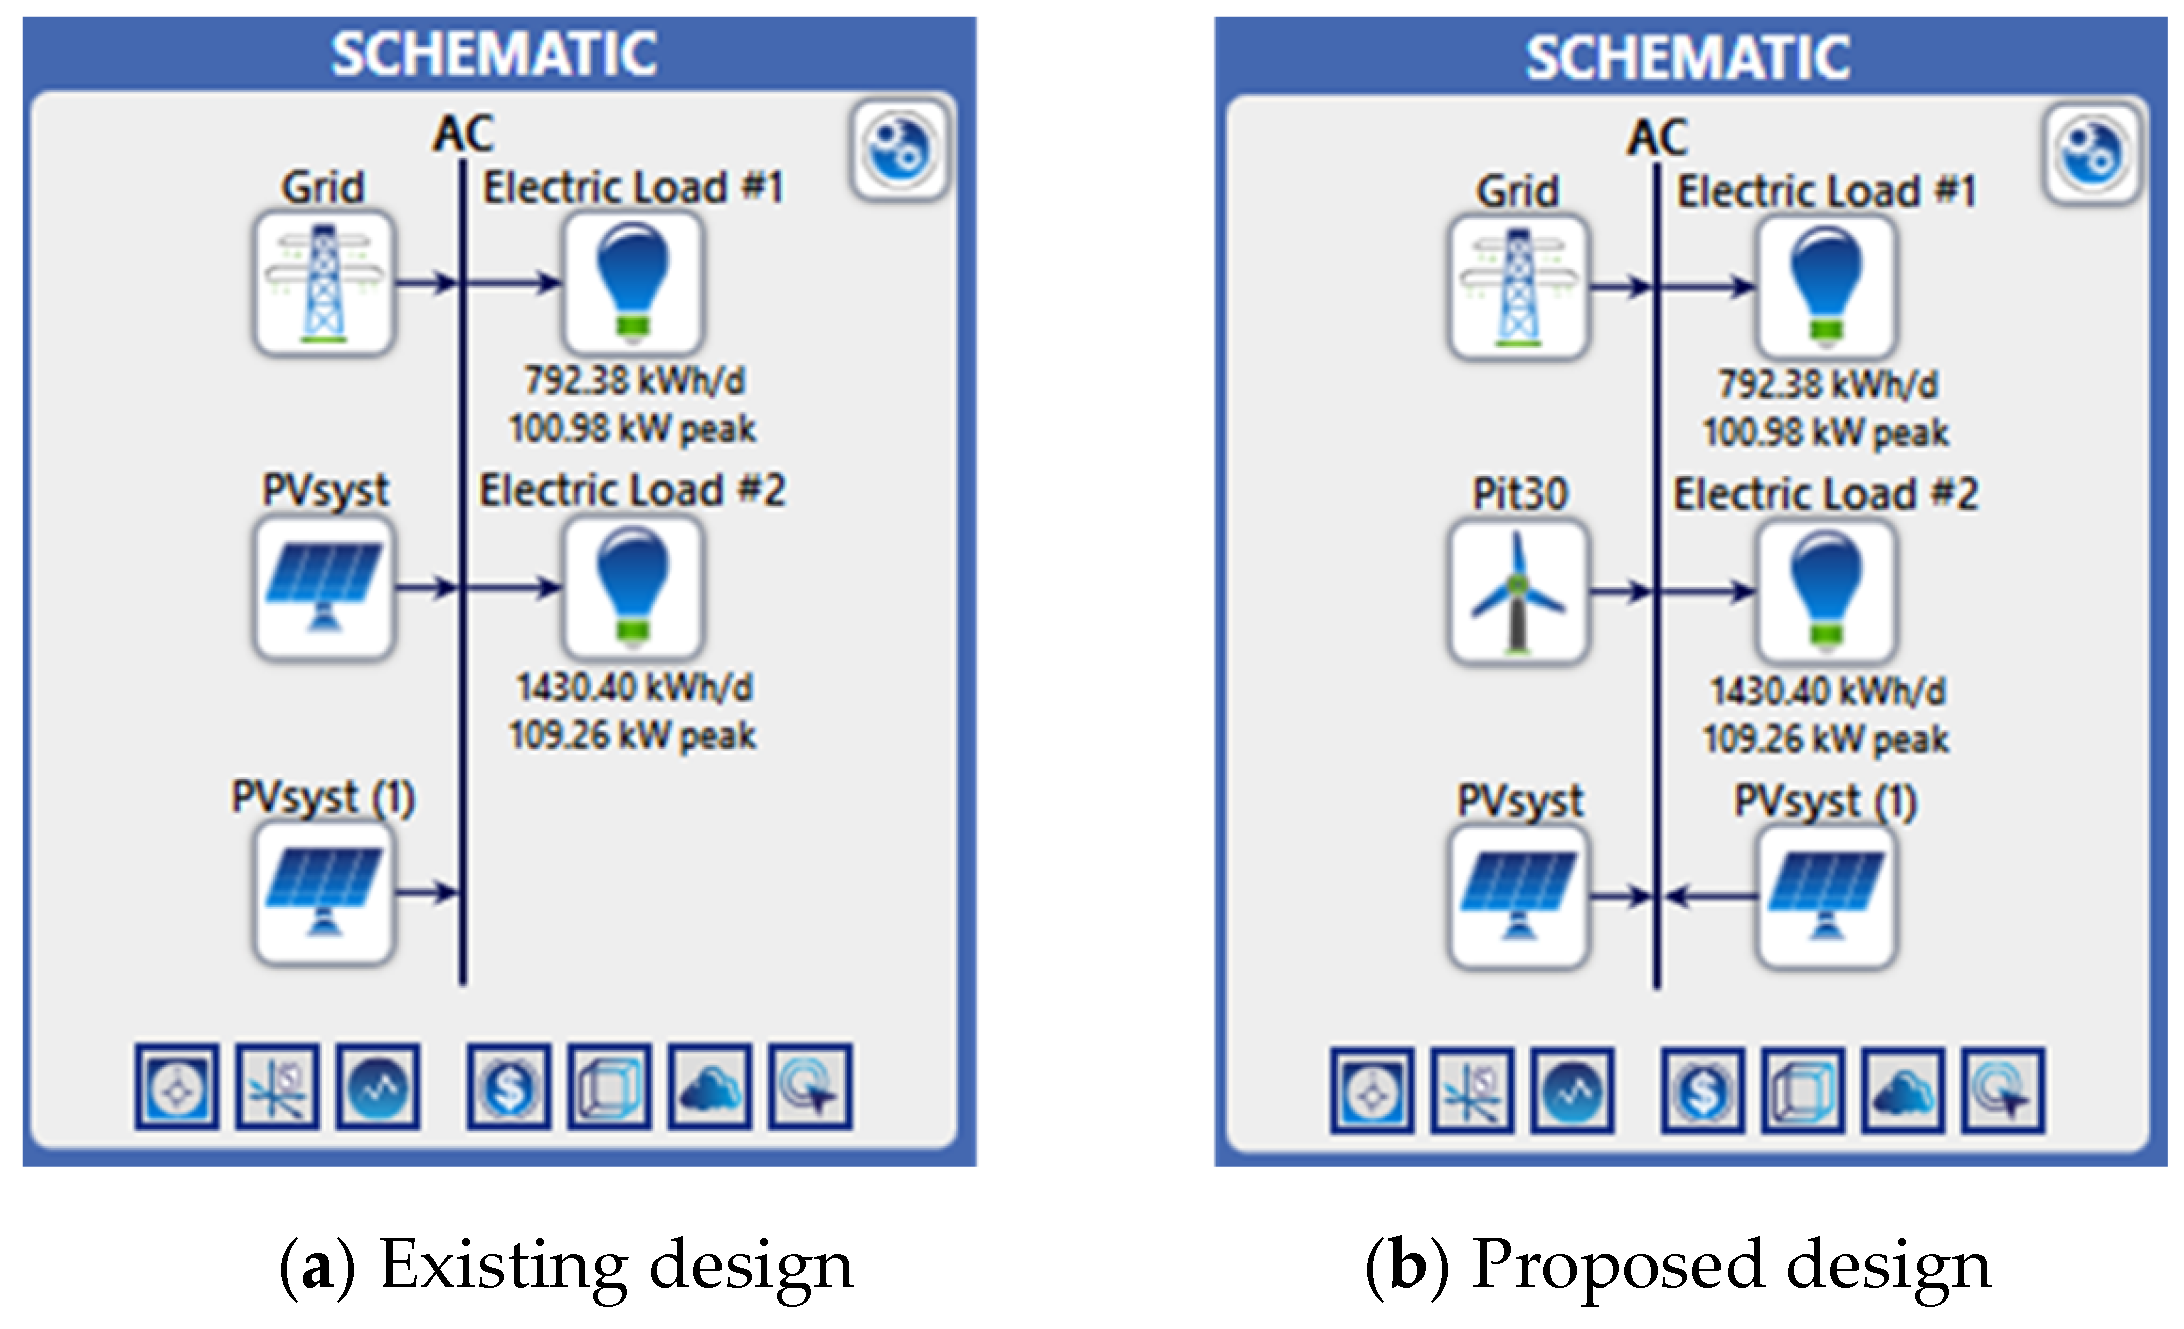
The first scenario, in
Figure 3a, describes the current design of the two PV systems and the two separate loads. In the smart library (792.38 kWh per day), a PV system is integrated, consisting of the facade with a total capacity of 27.3 kW
p and the pergola PV system with a total capacity of 42 kW
p. The surplus from the PV system is transferred to the second load, which is a wastewater treatment plant (1430 kWh/day) close to the building via a shared station. In the second scenario, the proposed design shown in
Figure 3b, a 30-kW wind system, has been added to the existing system to supply the WWTP.
4. Case Study
The case study is a library at Ibn Tofail University in Kenitra. Kenitra is mainly affected by the Atlantic circulation. Based on the PVGIS database, the minimum of average monthly temperature is 13.1 °C, and the maximum of average monthly temperature is 24.8 °C for the year 2020. The averages of monthly optimal irradiation are between 122.89 kWh/m2 and 220.89 kWh/m2.
Kenitra, and more specifically Ibn Tofail University, offers an ideal setting for this research due to its unique combination of technical infrastructure and environmental conditions. The university is equipped with PV systems installed since 2017 and operates an on-site wastewater treatment facility, which enables real-time monitoring and experimentation. Additionally, the region benefits from strong solar irradiance and moderate wind potential, making it well-suited for evaluating Hybrid Renewable Energy Systems (HRES) in both smart building applications and water treatment processes, particularly within the context of MENA climate conditions. These features make it a practical and representative case study for scalable, energy-water integrated solutions. Three options are envisaged for integration into the building to improve energy efficiency. Building efficiency is assumed to be the first step, followed by renewable energies and smart technologies.
The first degree of energy efficiency in this building is concerned with the building’s envelope and equipment. In the library, the walls are built of Agglo (Parpaing) and brick, while the windows are VEC curtain wall and semi-vec aluminum. The glass frames in the library are made of aluminum, which has various advantages. In line with Moroccan regulations, the building is fitted with double and triple glazing. The appliances used in the library, taking into account the LEDs used and desktop computers, have energy ratings ranging from class A, A+, or A++, thus representing a better energy performance.
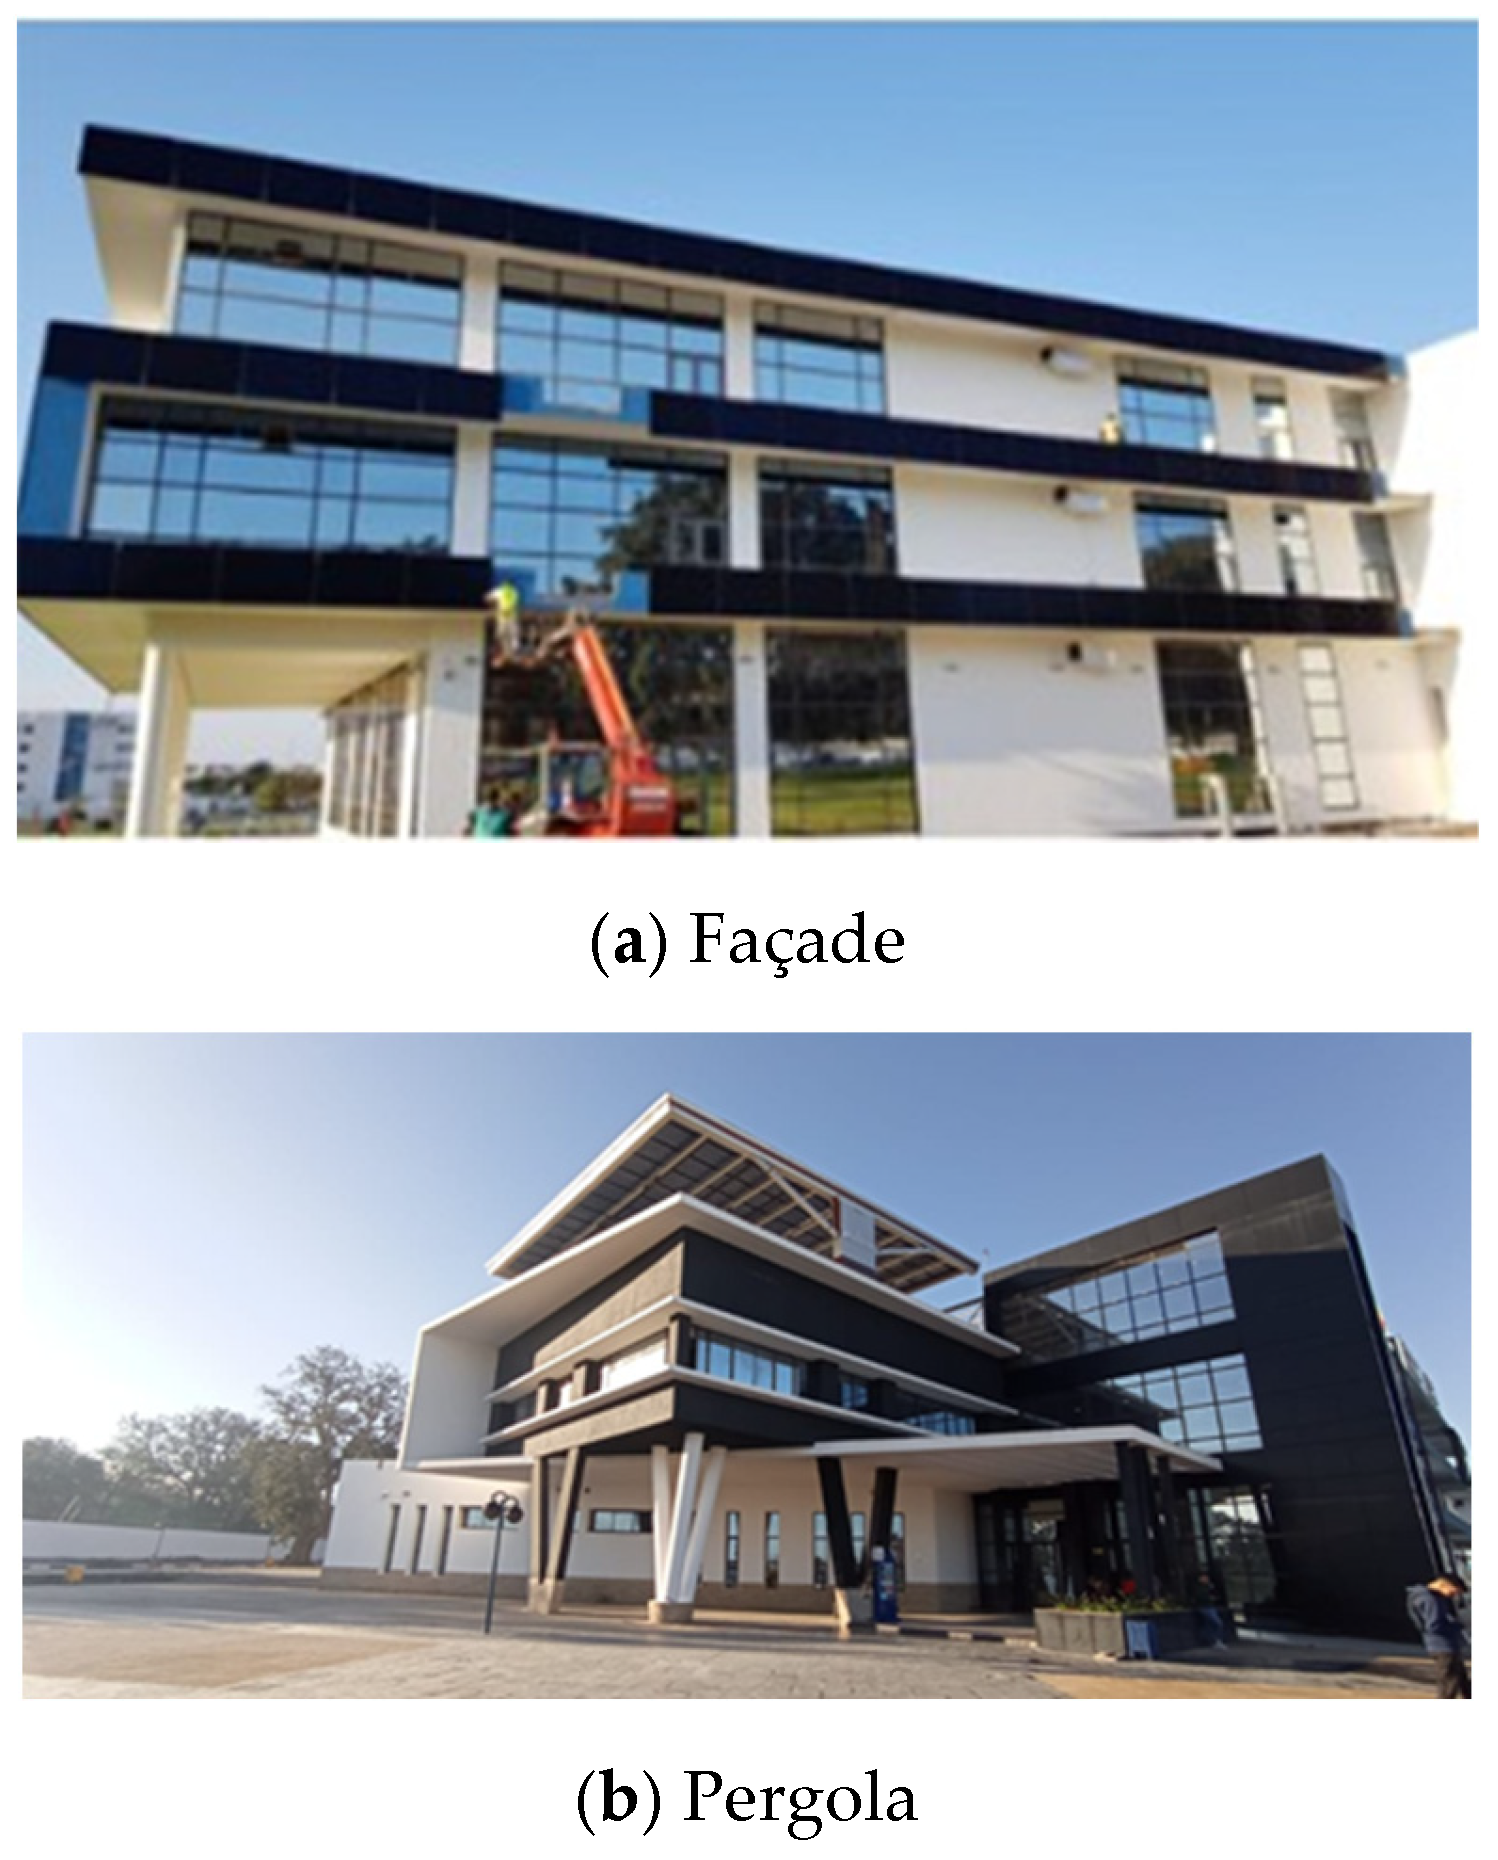
For the second level of energy savings, photovoltaic systems add even more energy savings to the building. In Ibn Tofail library, a combination of two integrated photovoltaic systems is illustrated in
Figure 4. The CO
2 emissions and the performance of the systems were detailed in a previous study [
56,
57]. P(kW
p) values in
Table 2 represent the calculated peak power based on the datasheet’s PVs’ peak power.
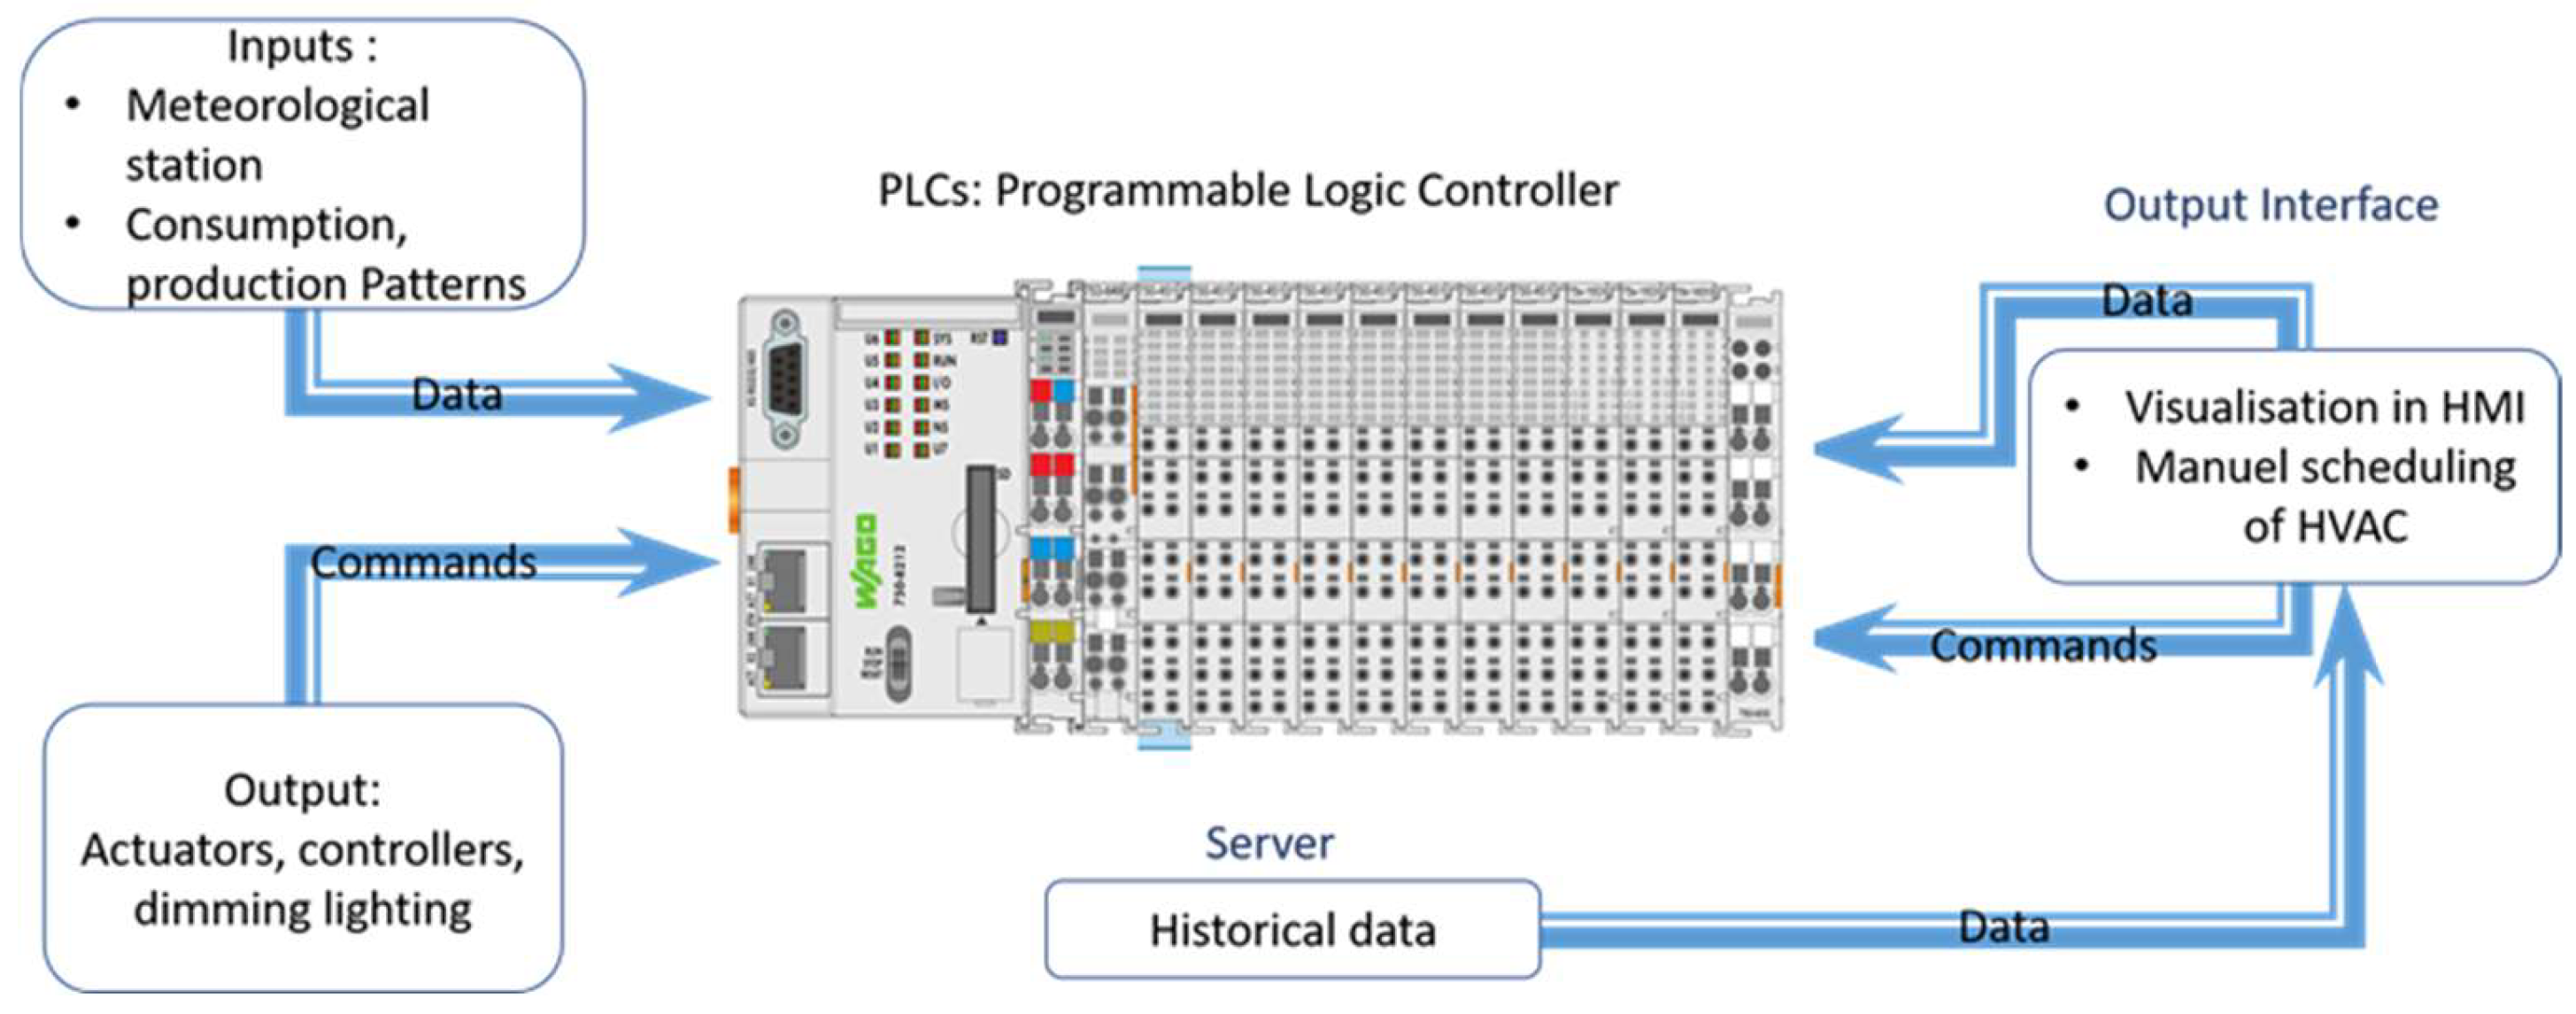
The library has an integrated BMS (building management system). The BMS system includes PLCs (programmable logic controller), illustrated in
Figure 5, which serve as a central control unit. The PLCs manage multiple technical domains. Among its domains, measuring station, HVAC, and DALI. Through SCADA and its human–machine interface, this BMS assists with monitoring consumption and PV production as well as their display.
4.1. Building Load Profiles
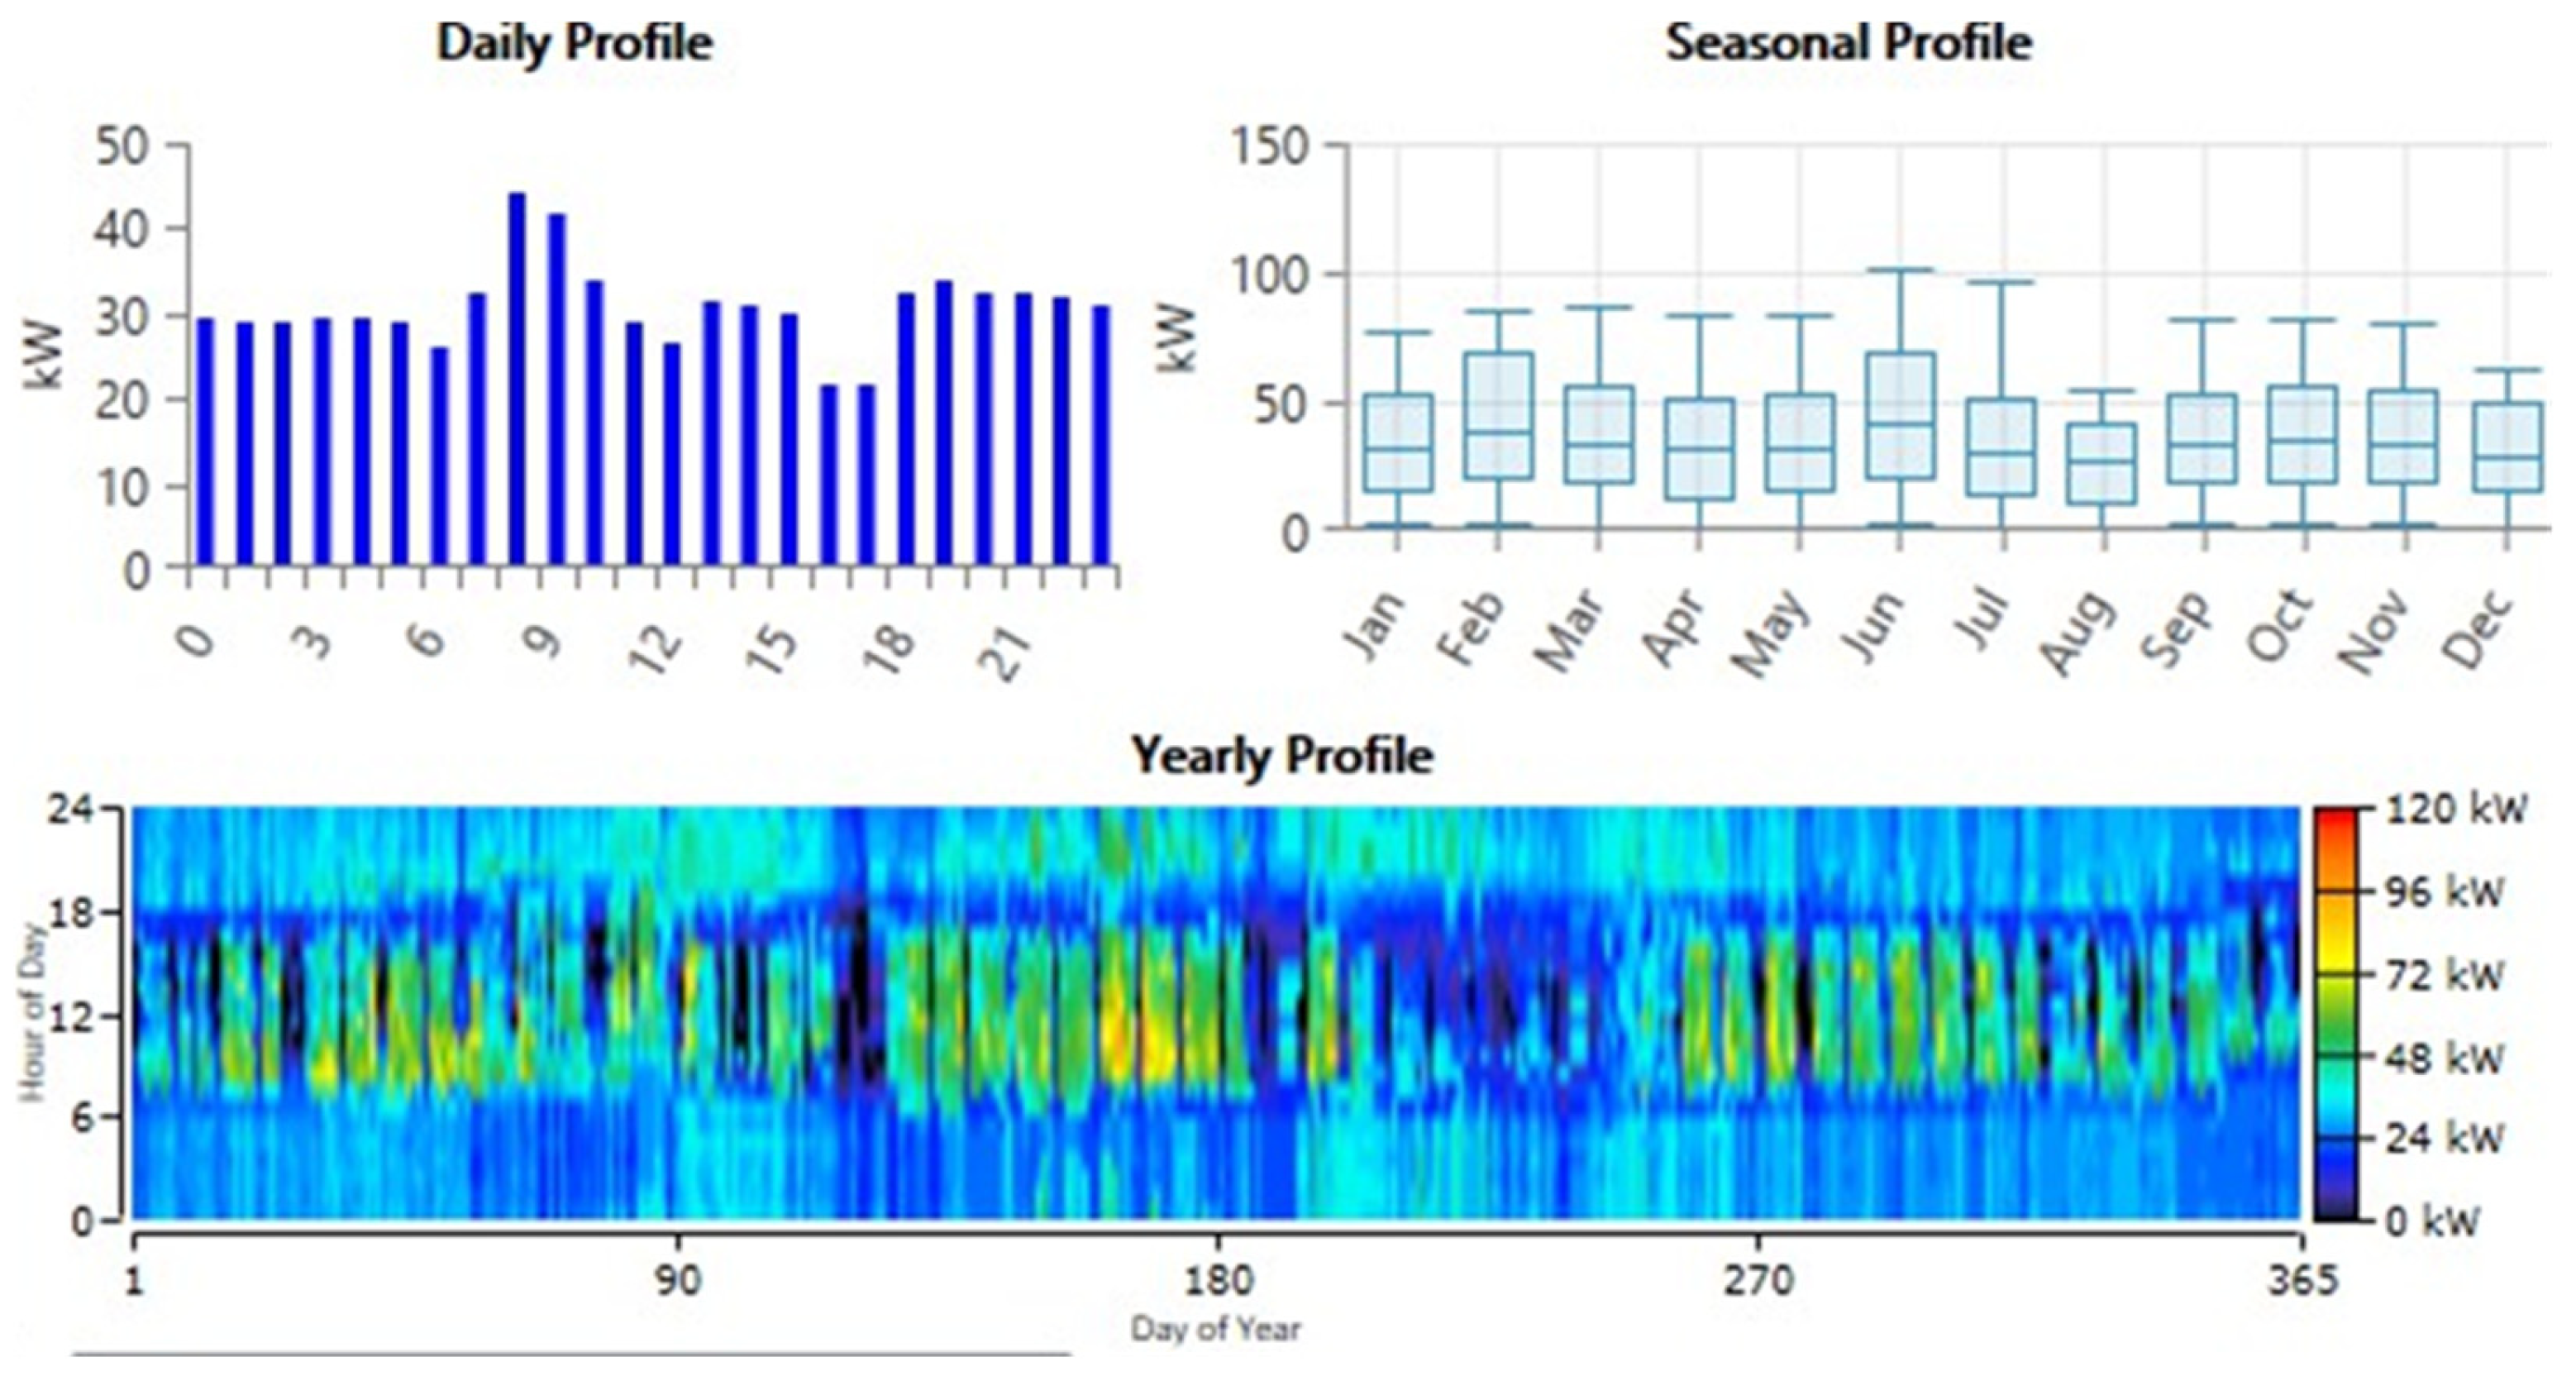
Using the smart building monitoring system and Homer-Pro,
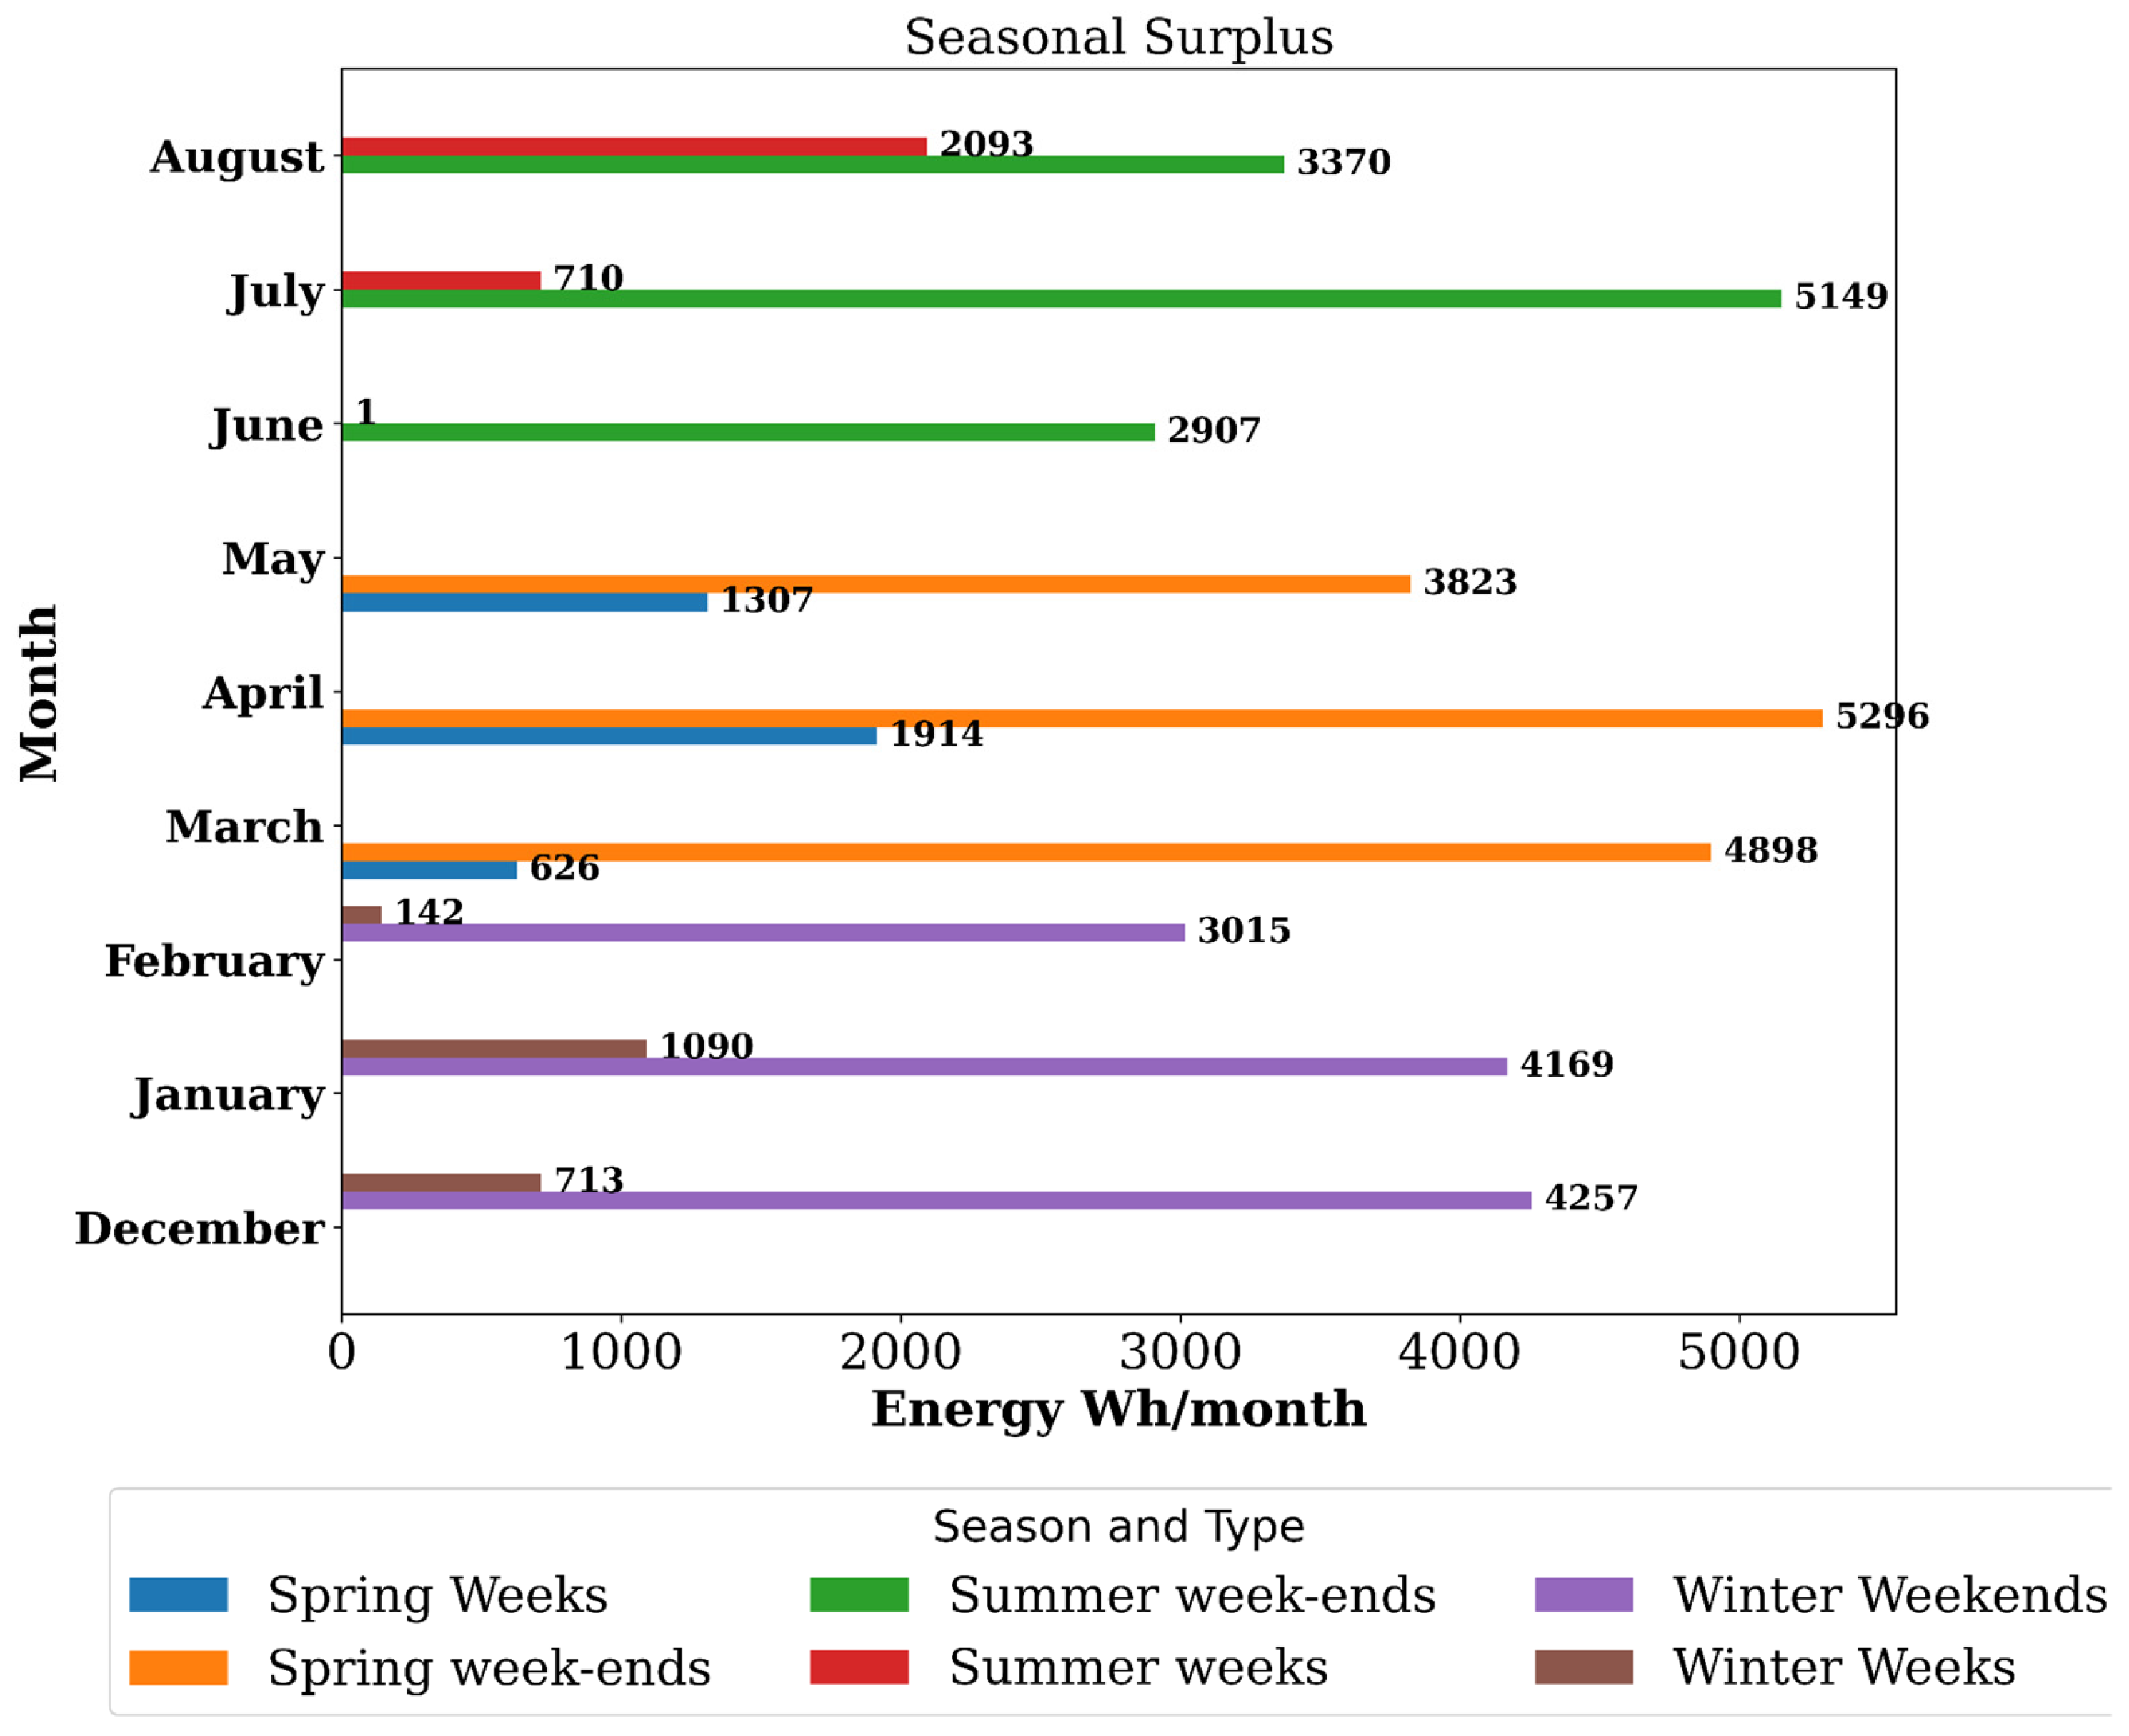
Figure 6 illustrates the load profile represented. The data used and collected were between March 2022 and February 2023. Despite carefully designing the photovoltaic systems to meet the library’s energy requirements, there is still an excess of energy, as shown in
Figure 7.
This surplus is because of the library’s inconsistent functioning at specific intervals and the fact that it does not run throughout the day. To make the most of this surplus in this study, transferring it to a water-purification station in the vicinity was a better suggestion.
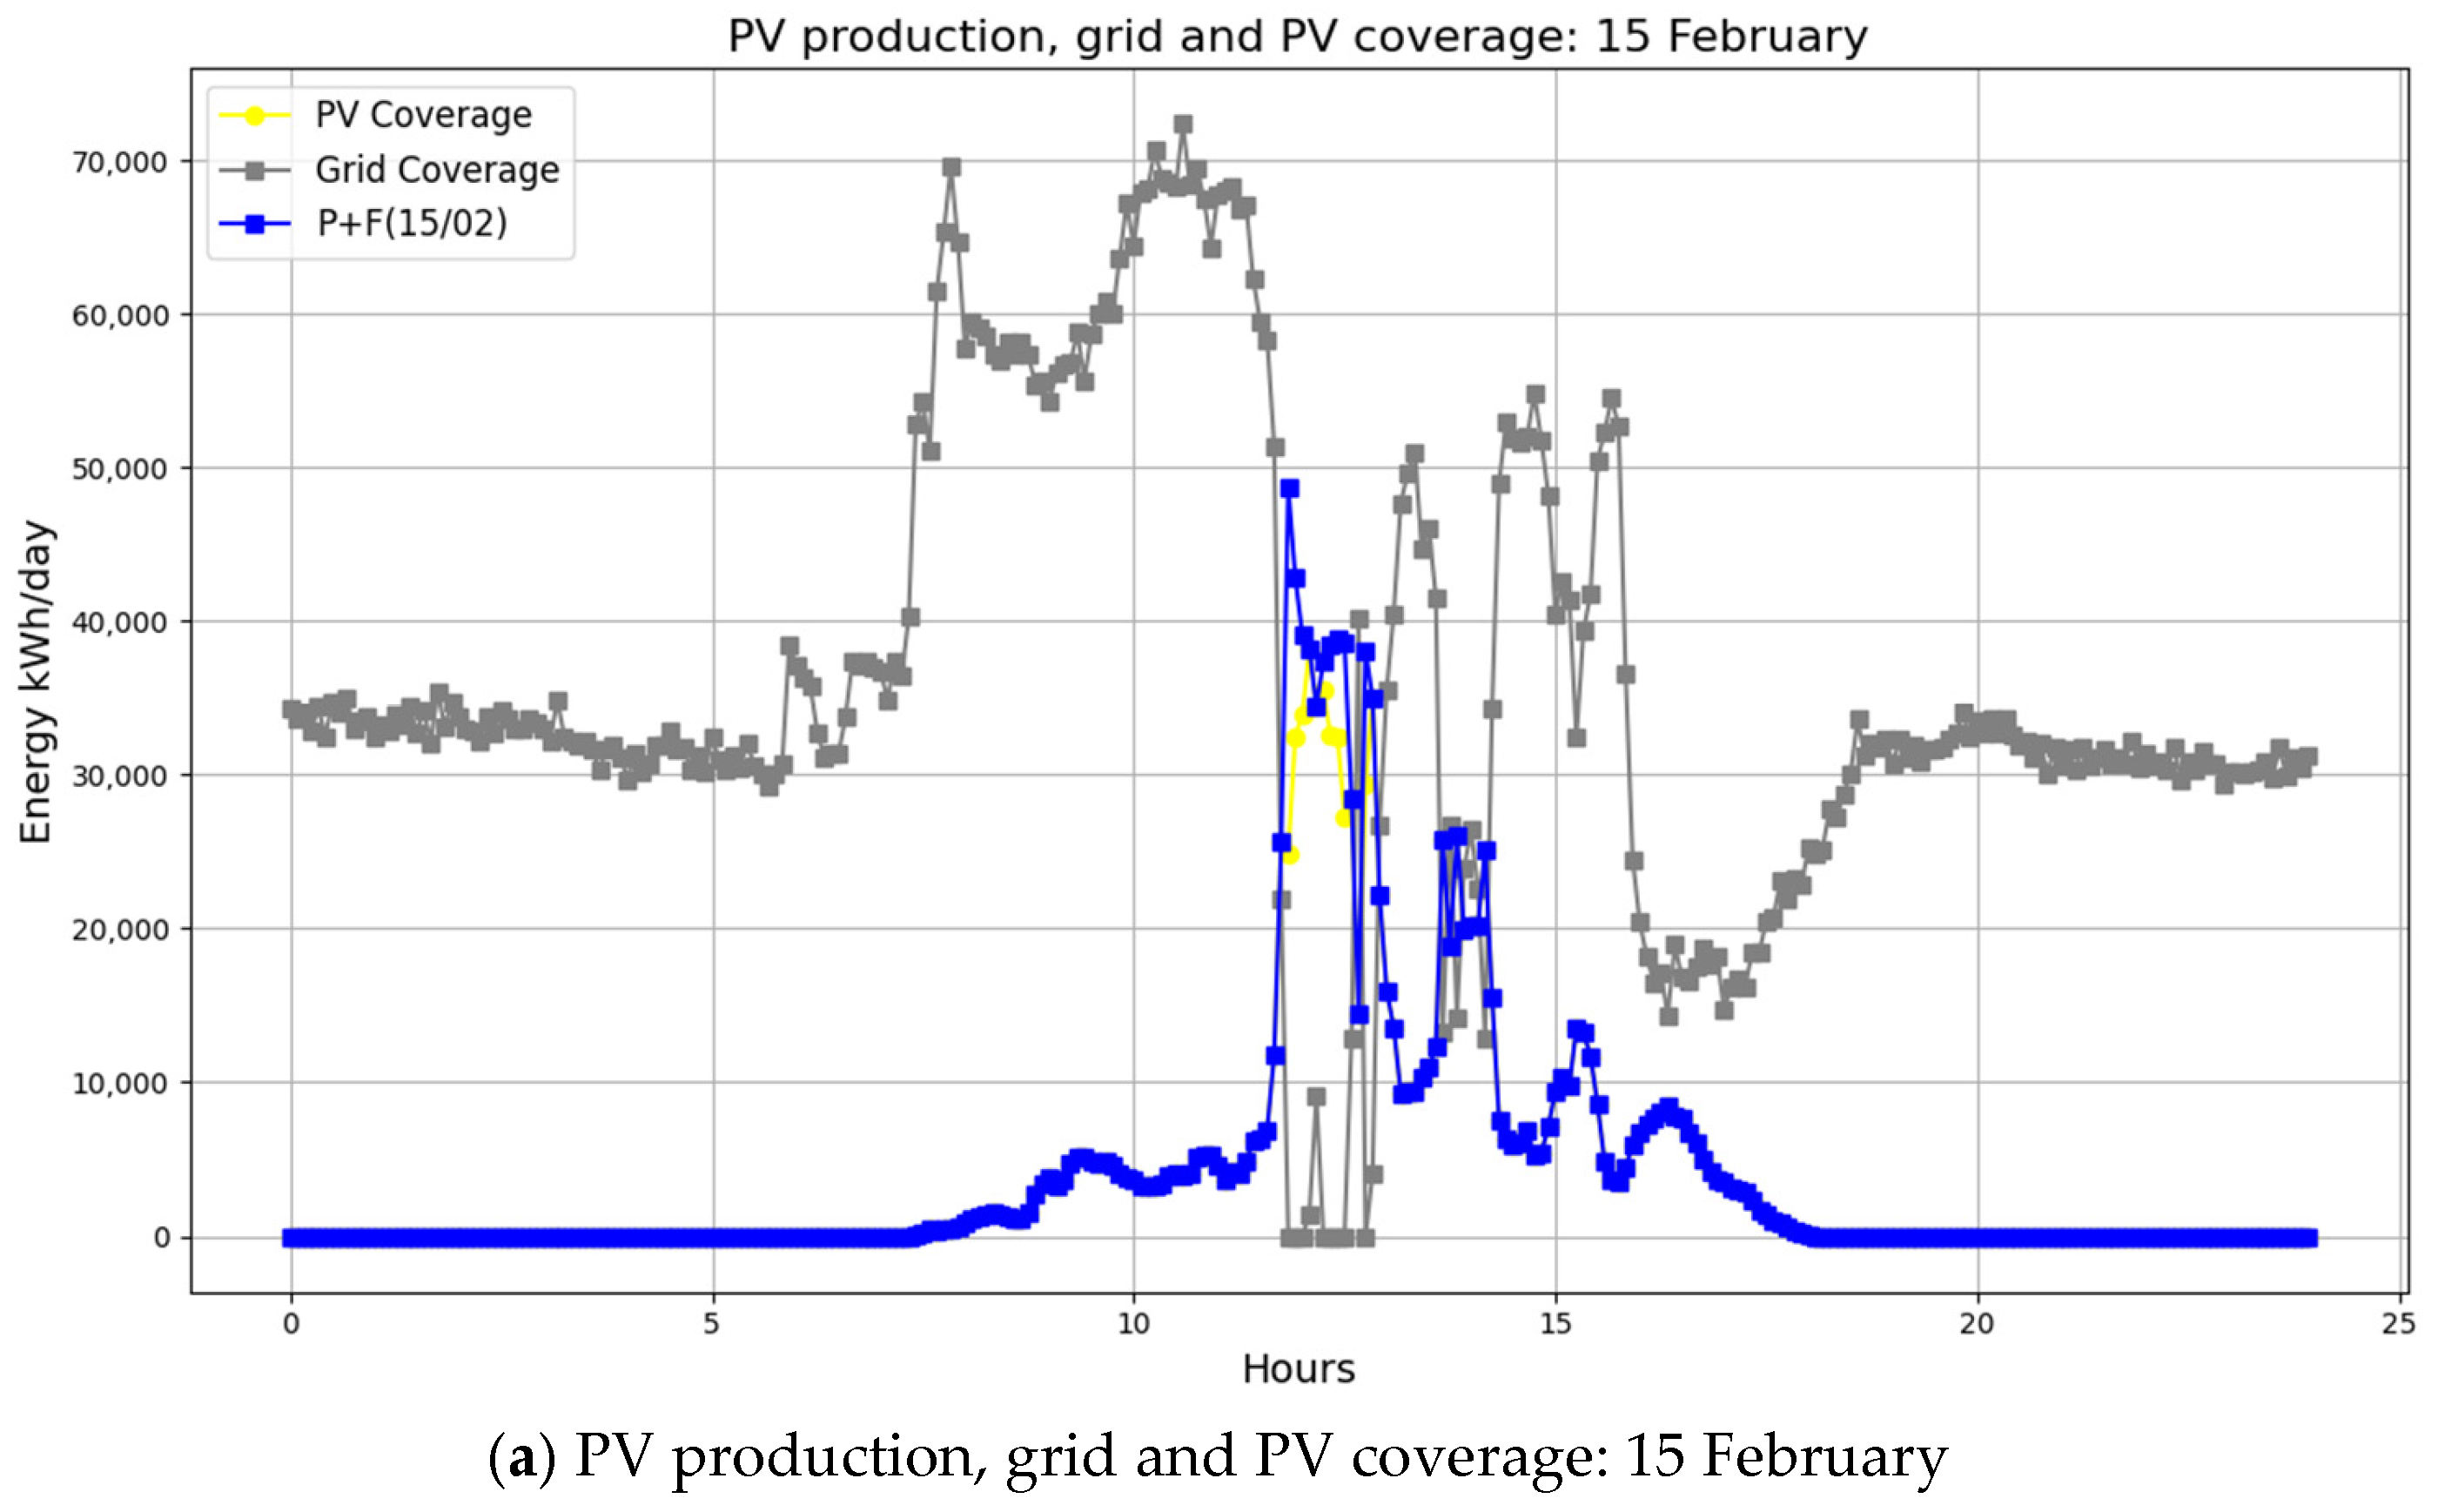
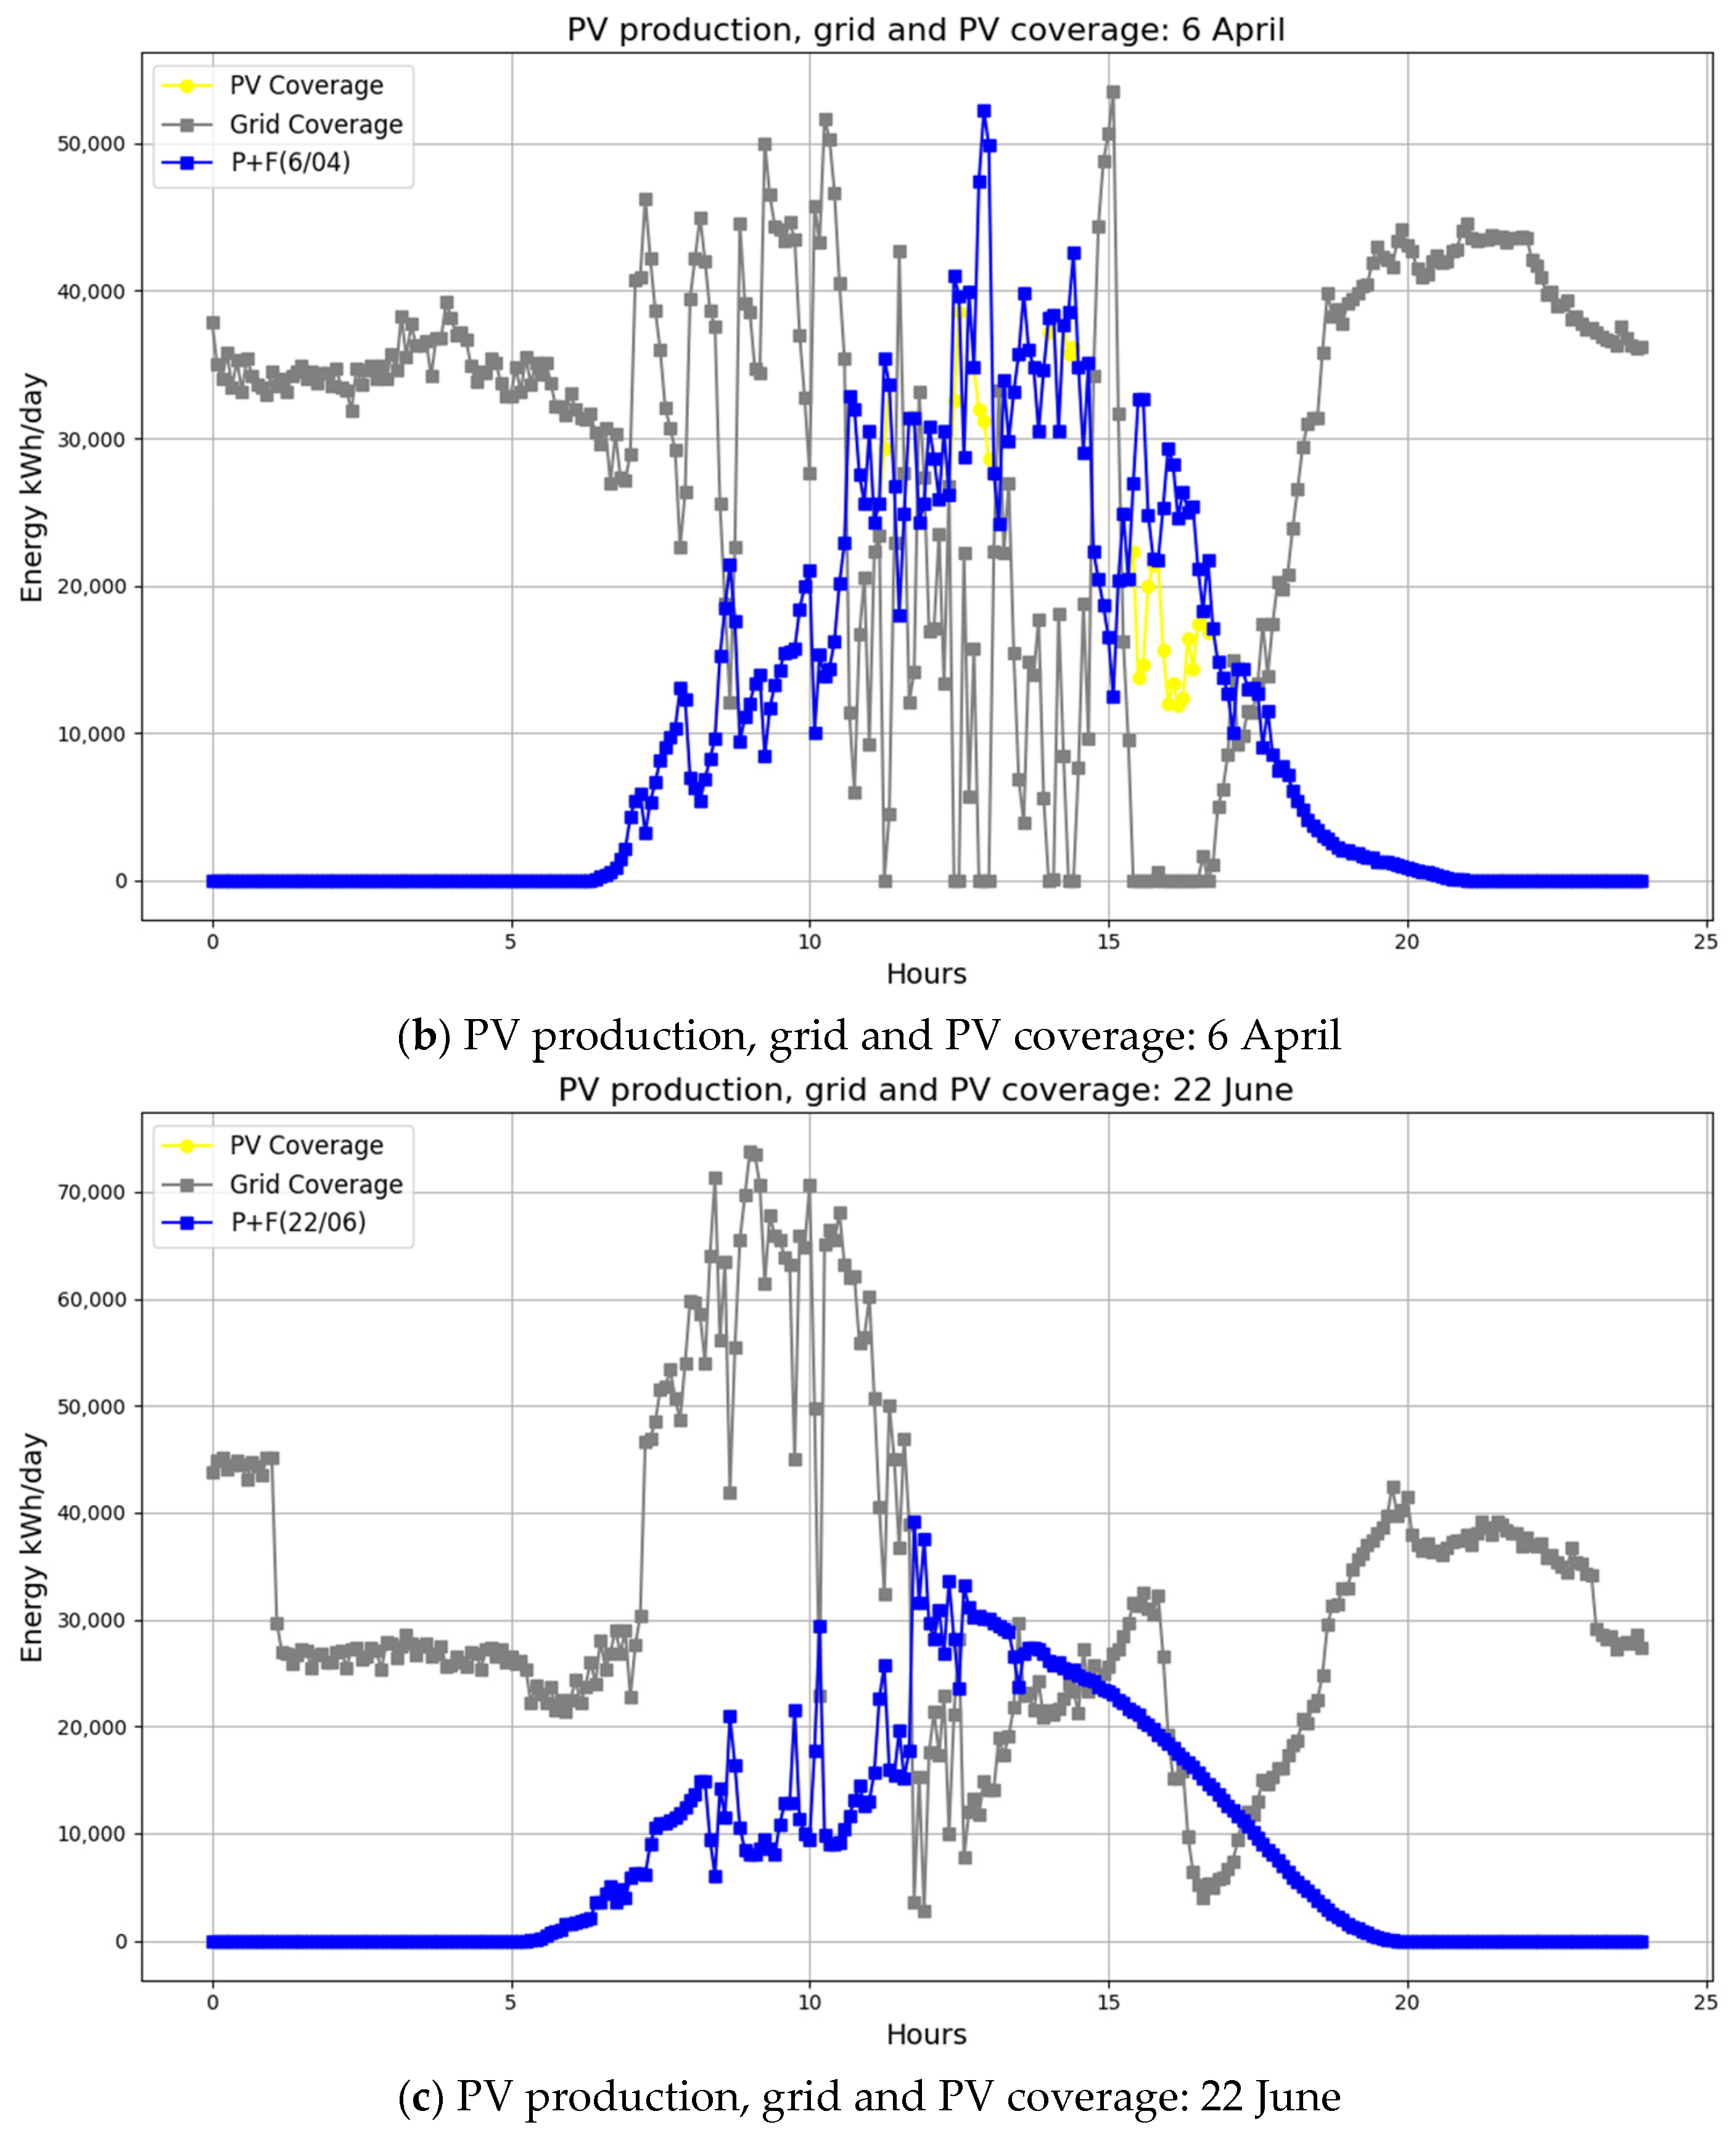
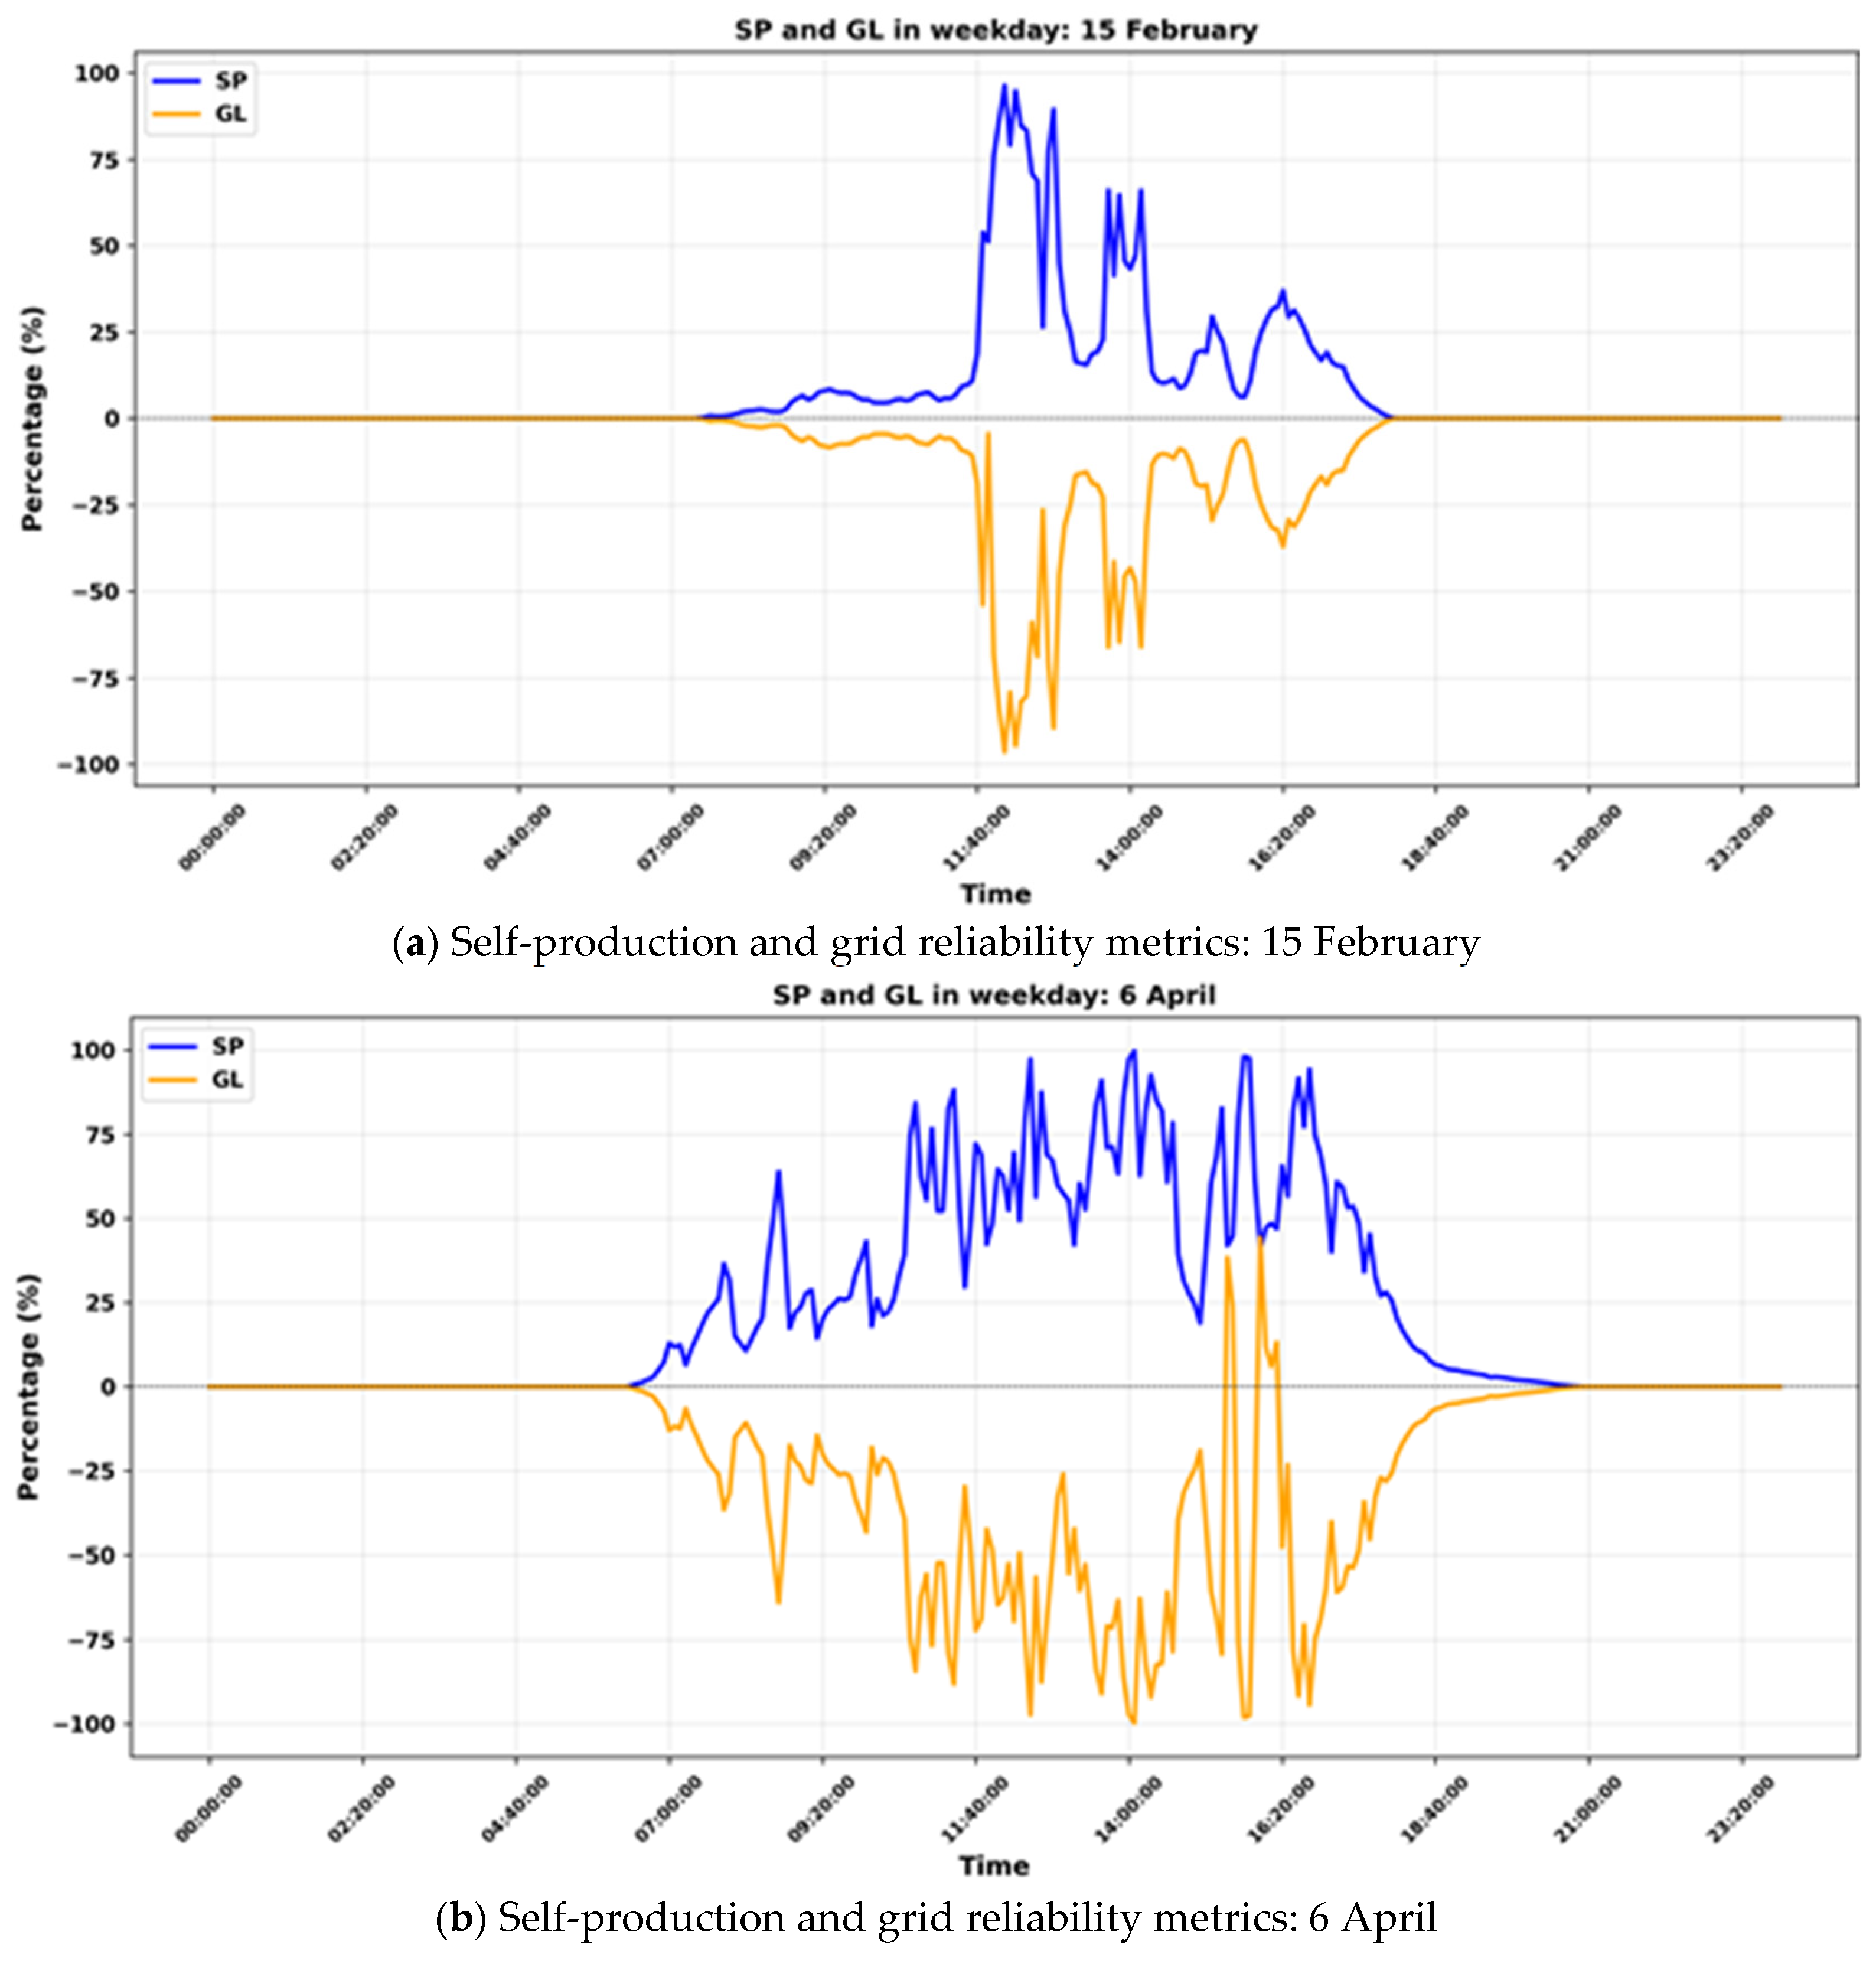
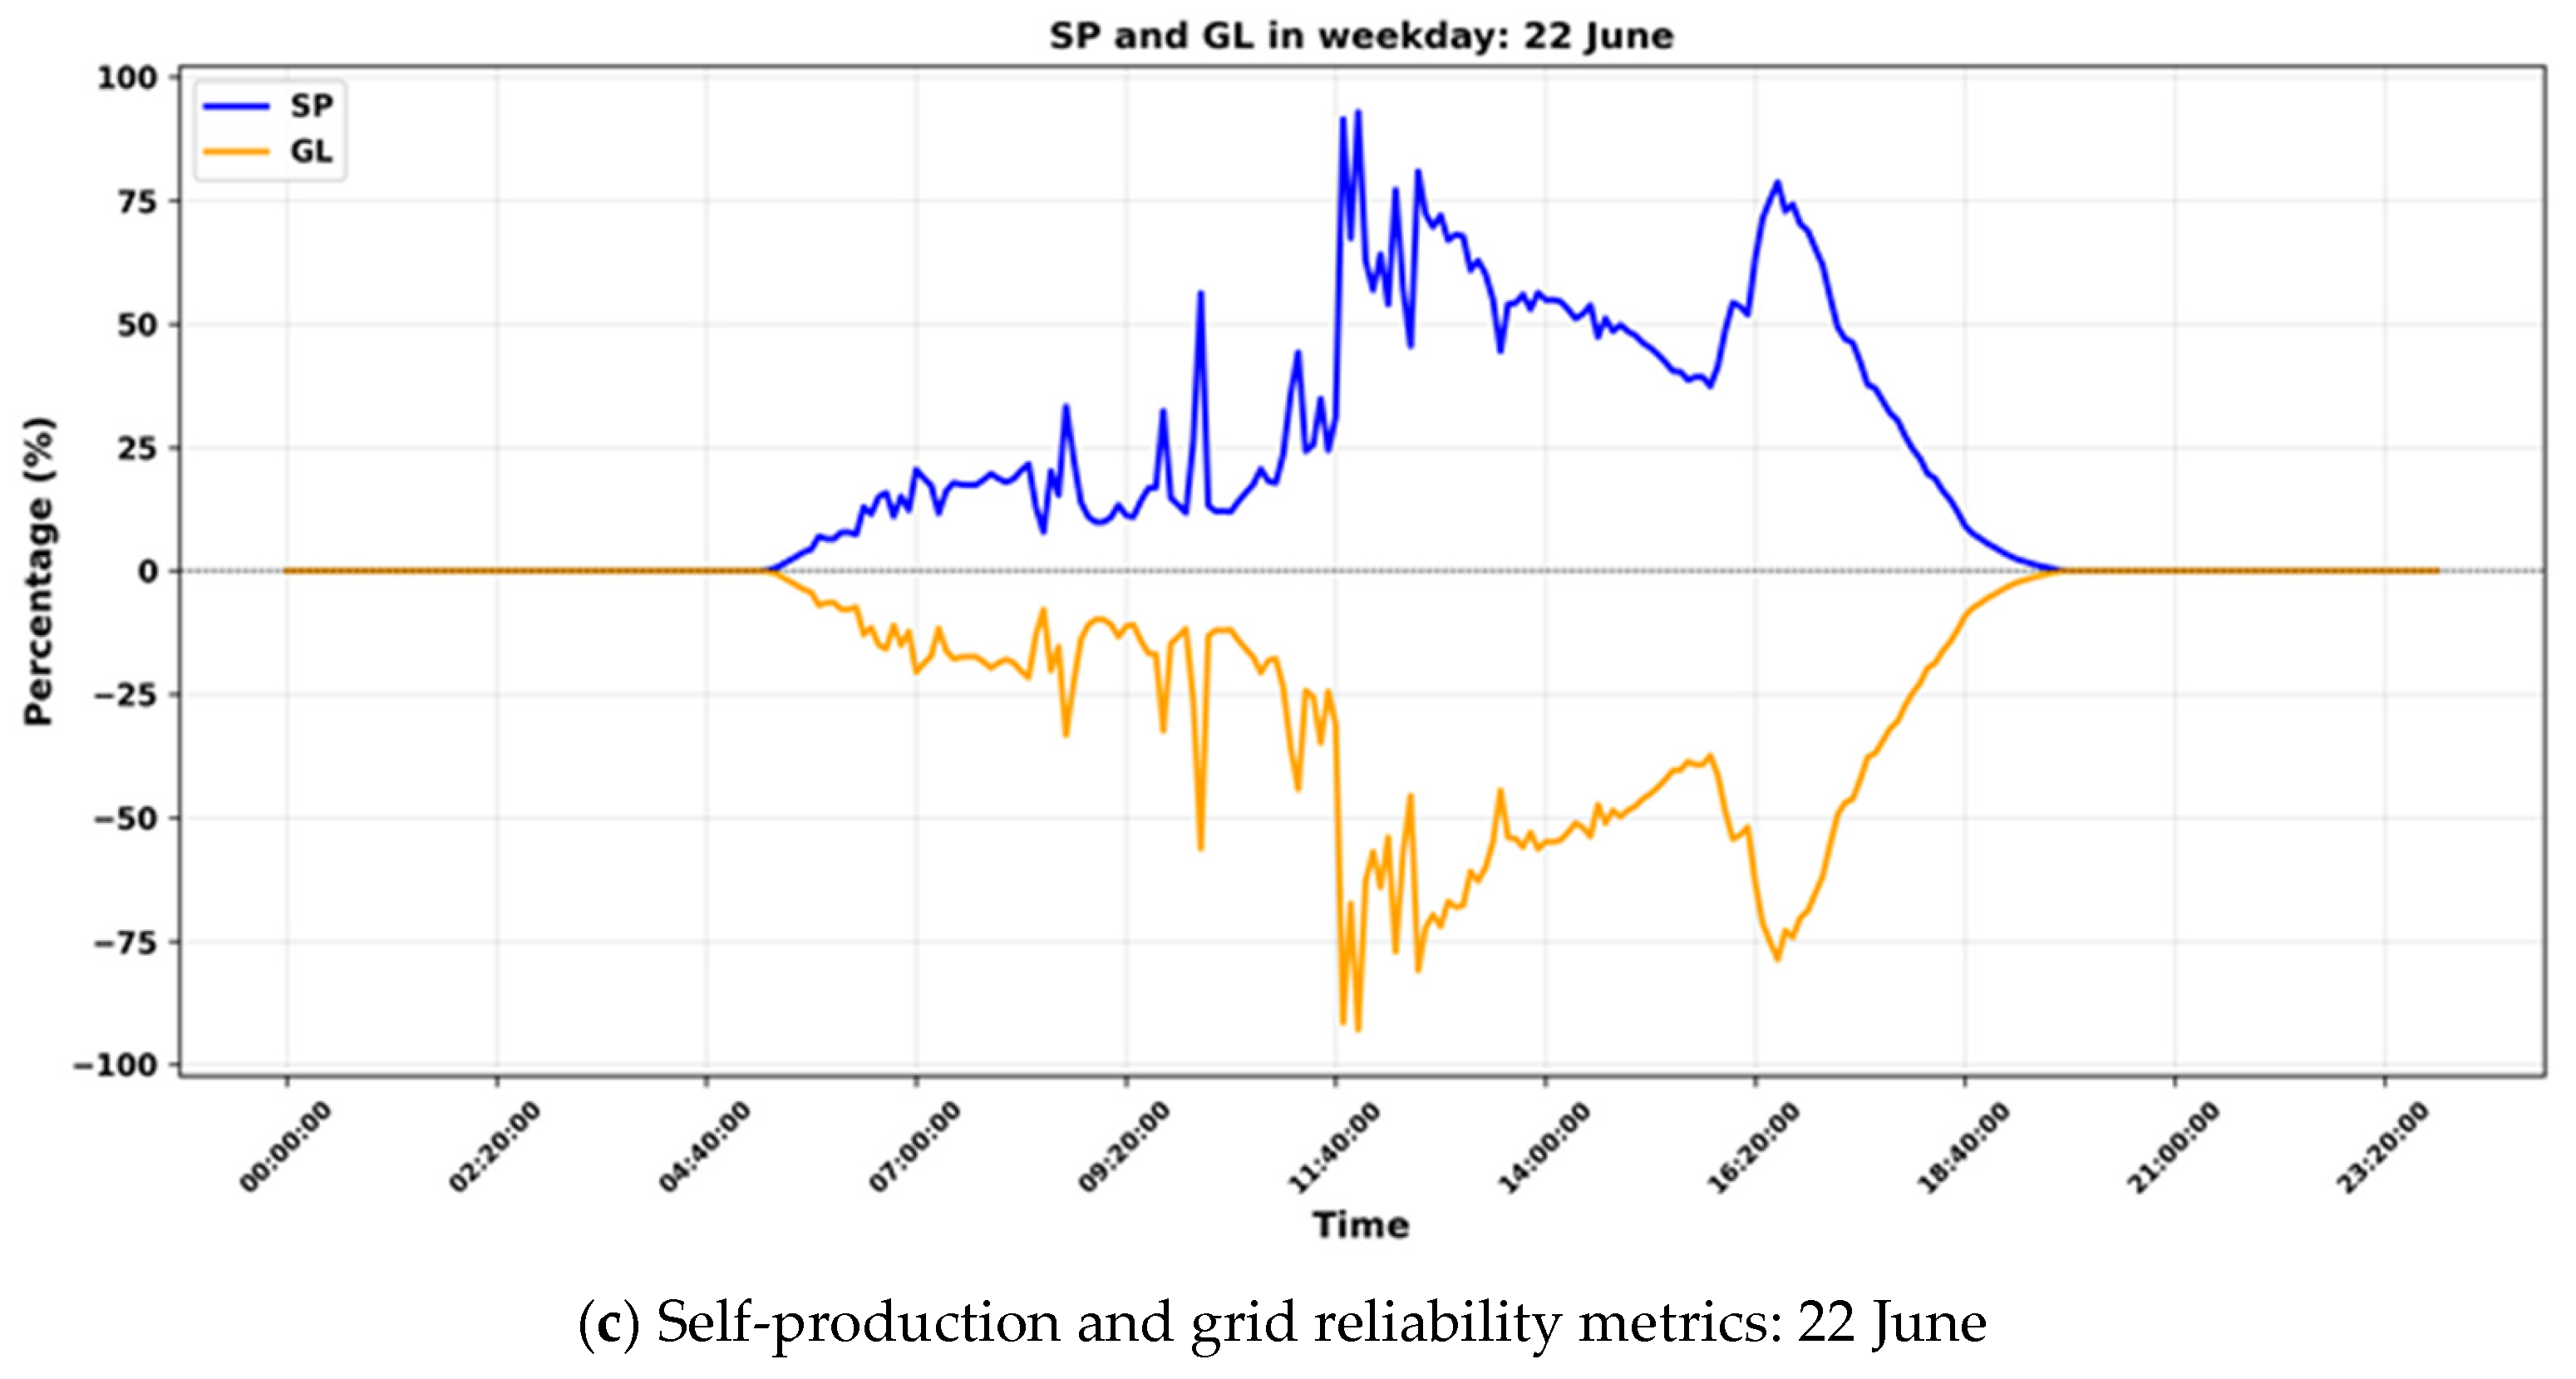
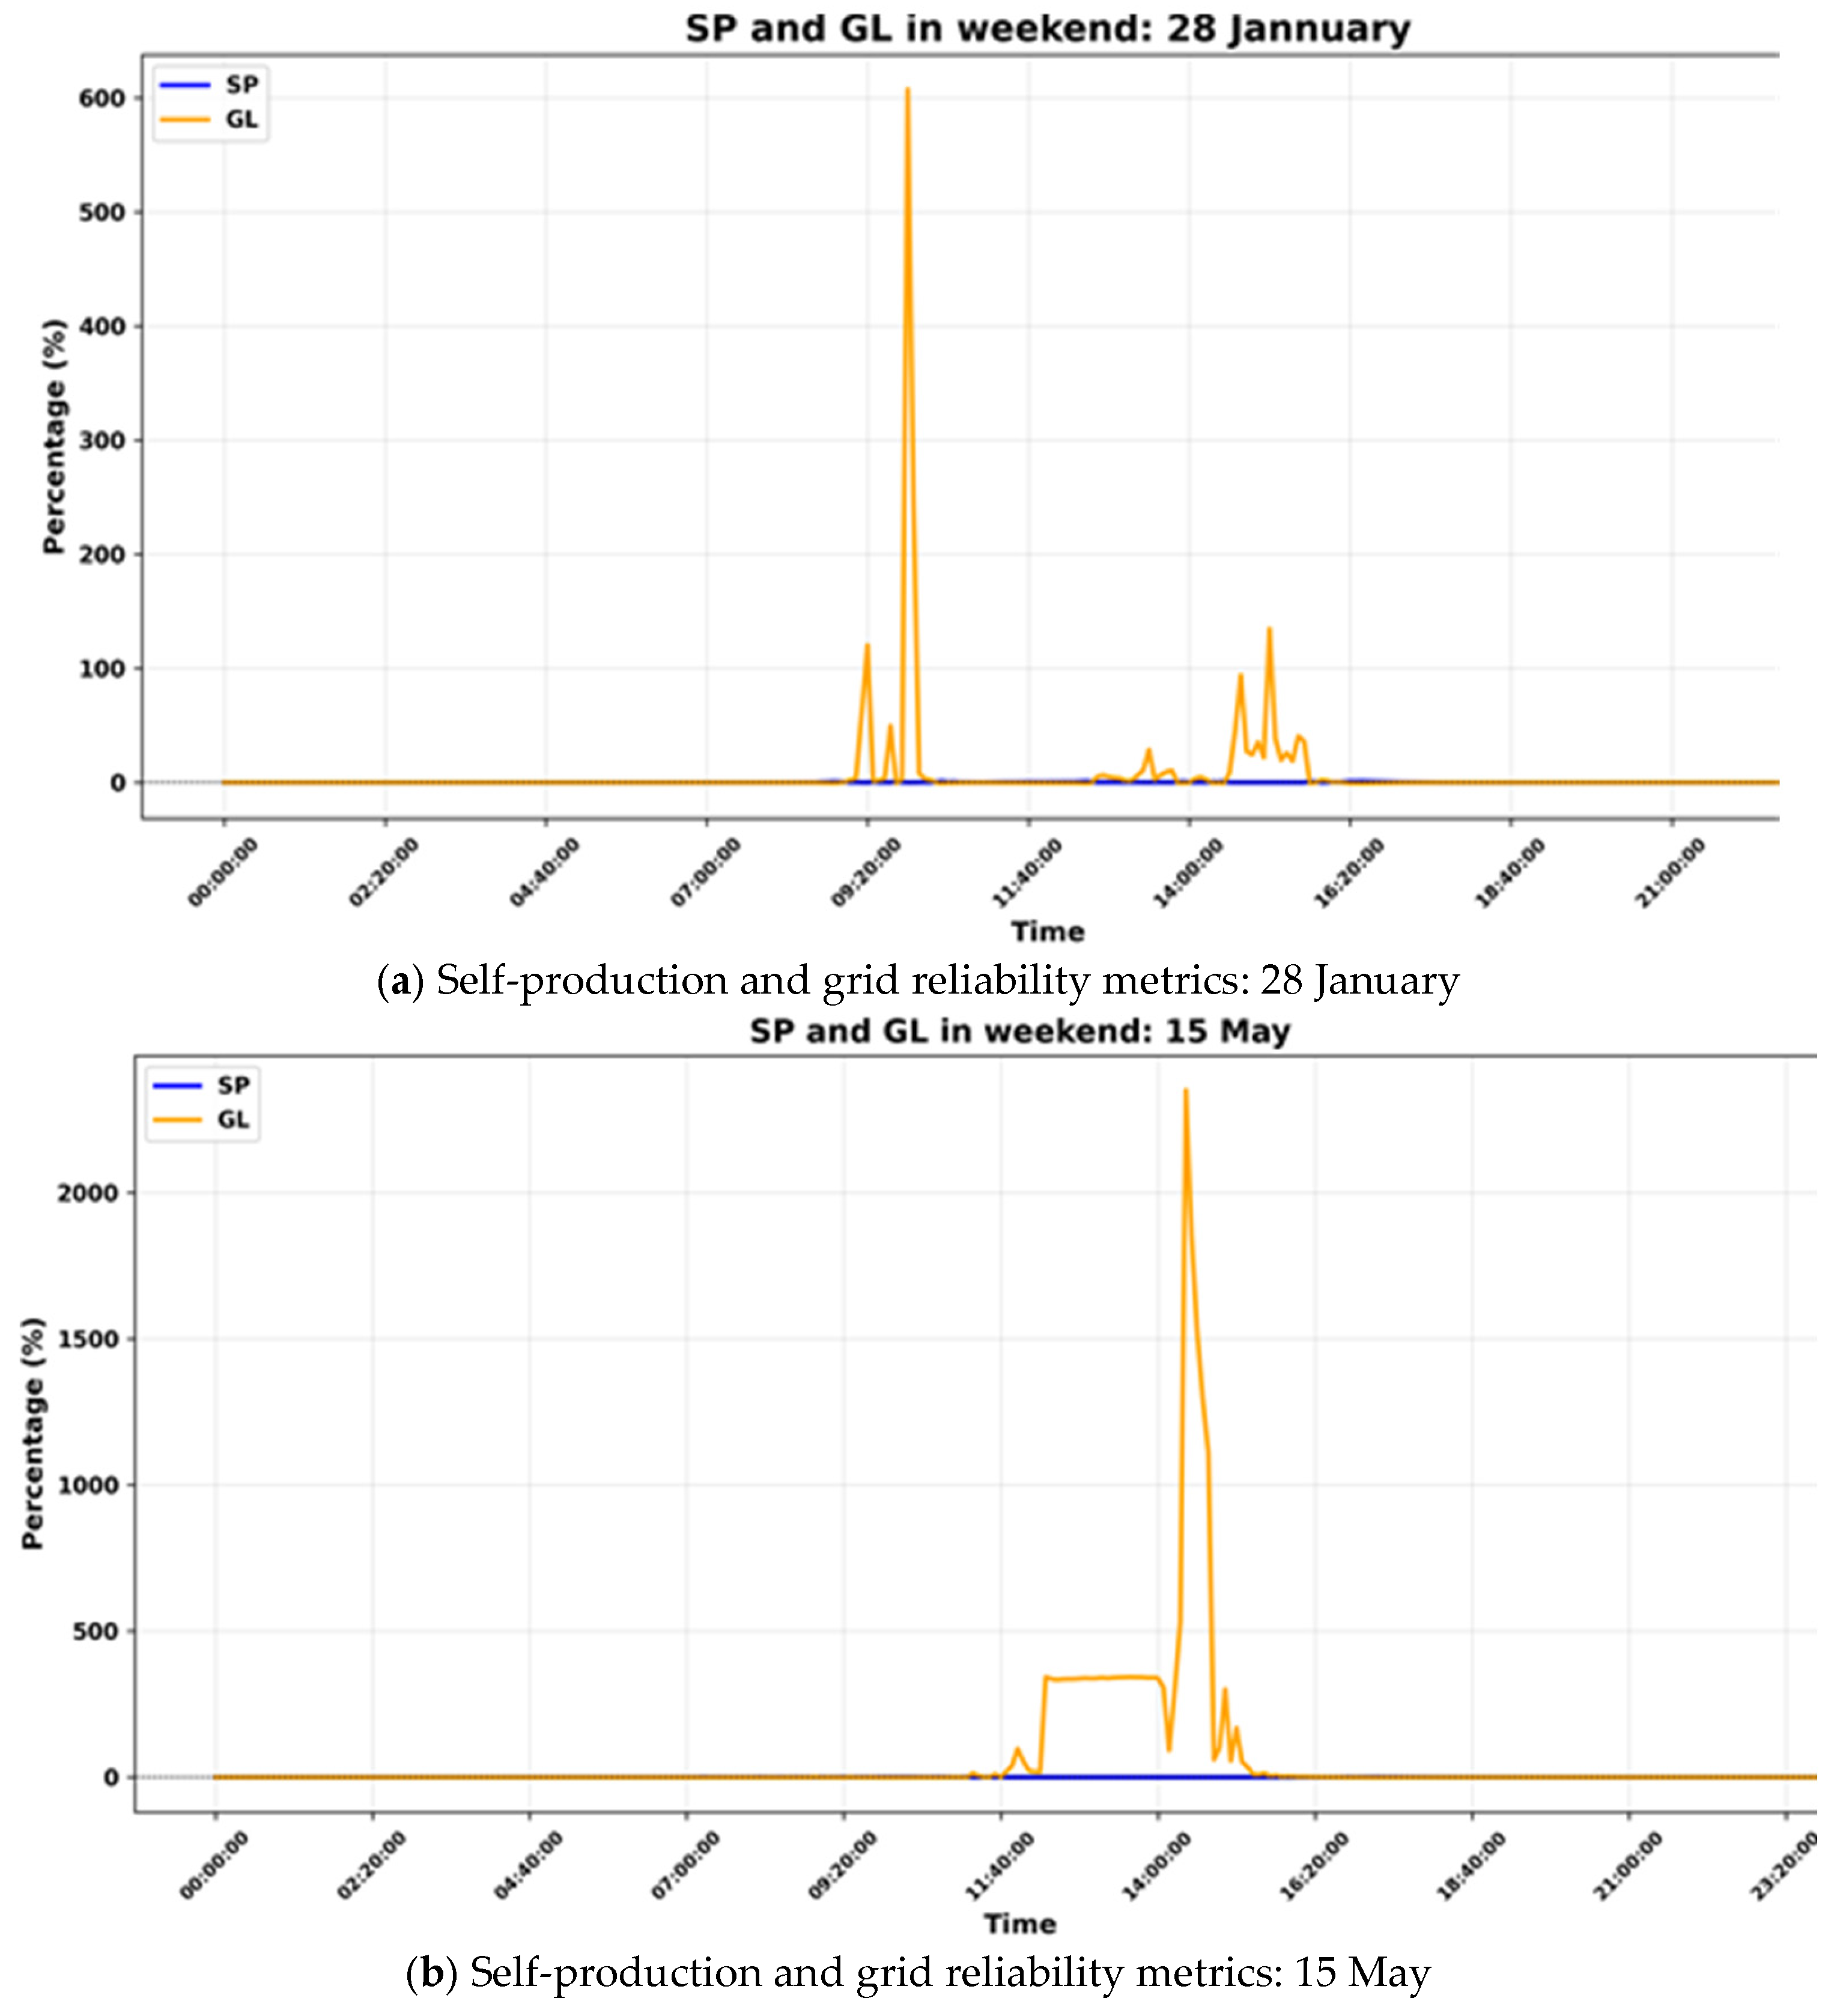
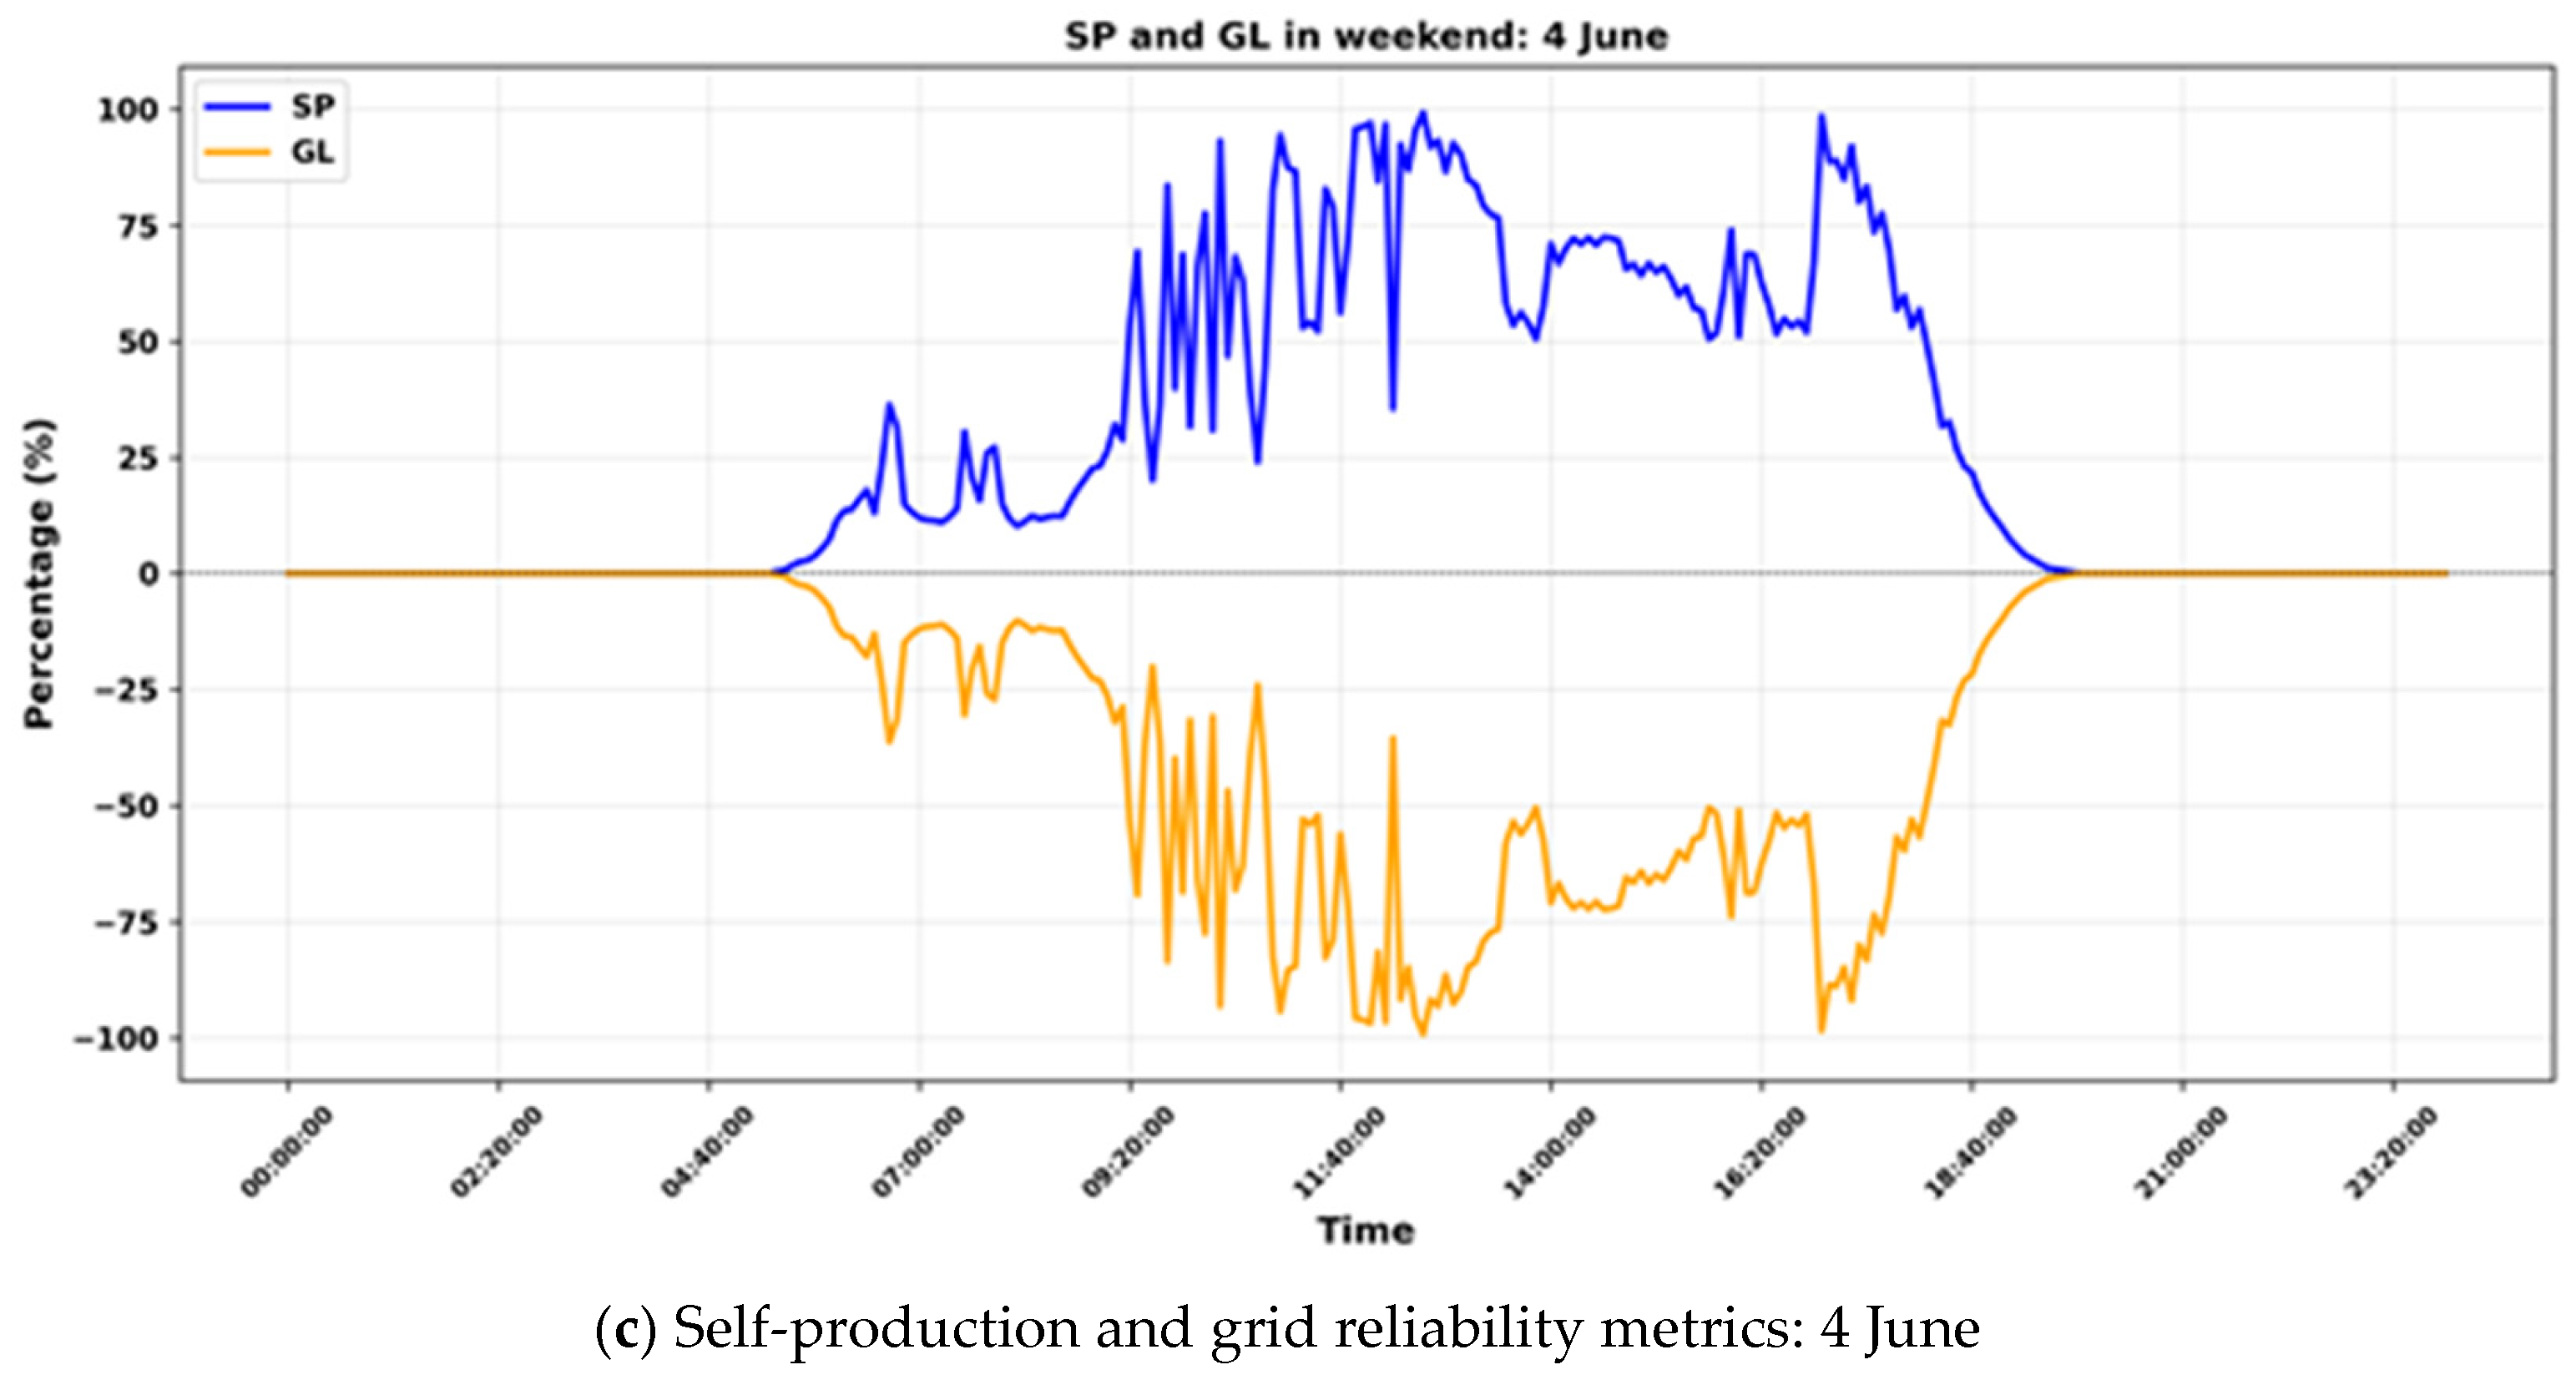
Weekend surplus is greater since the building uses more energy throughout the week than it does on the weekend. To be more specific, in
Figure 8 and
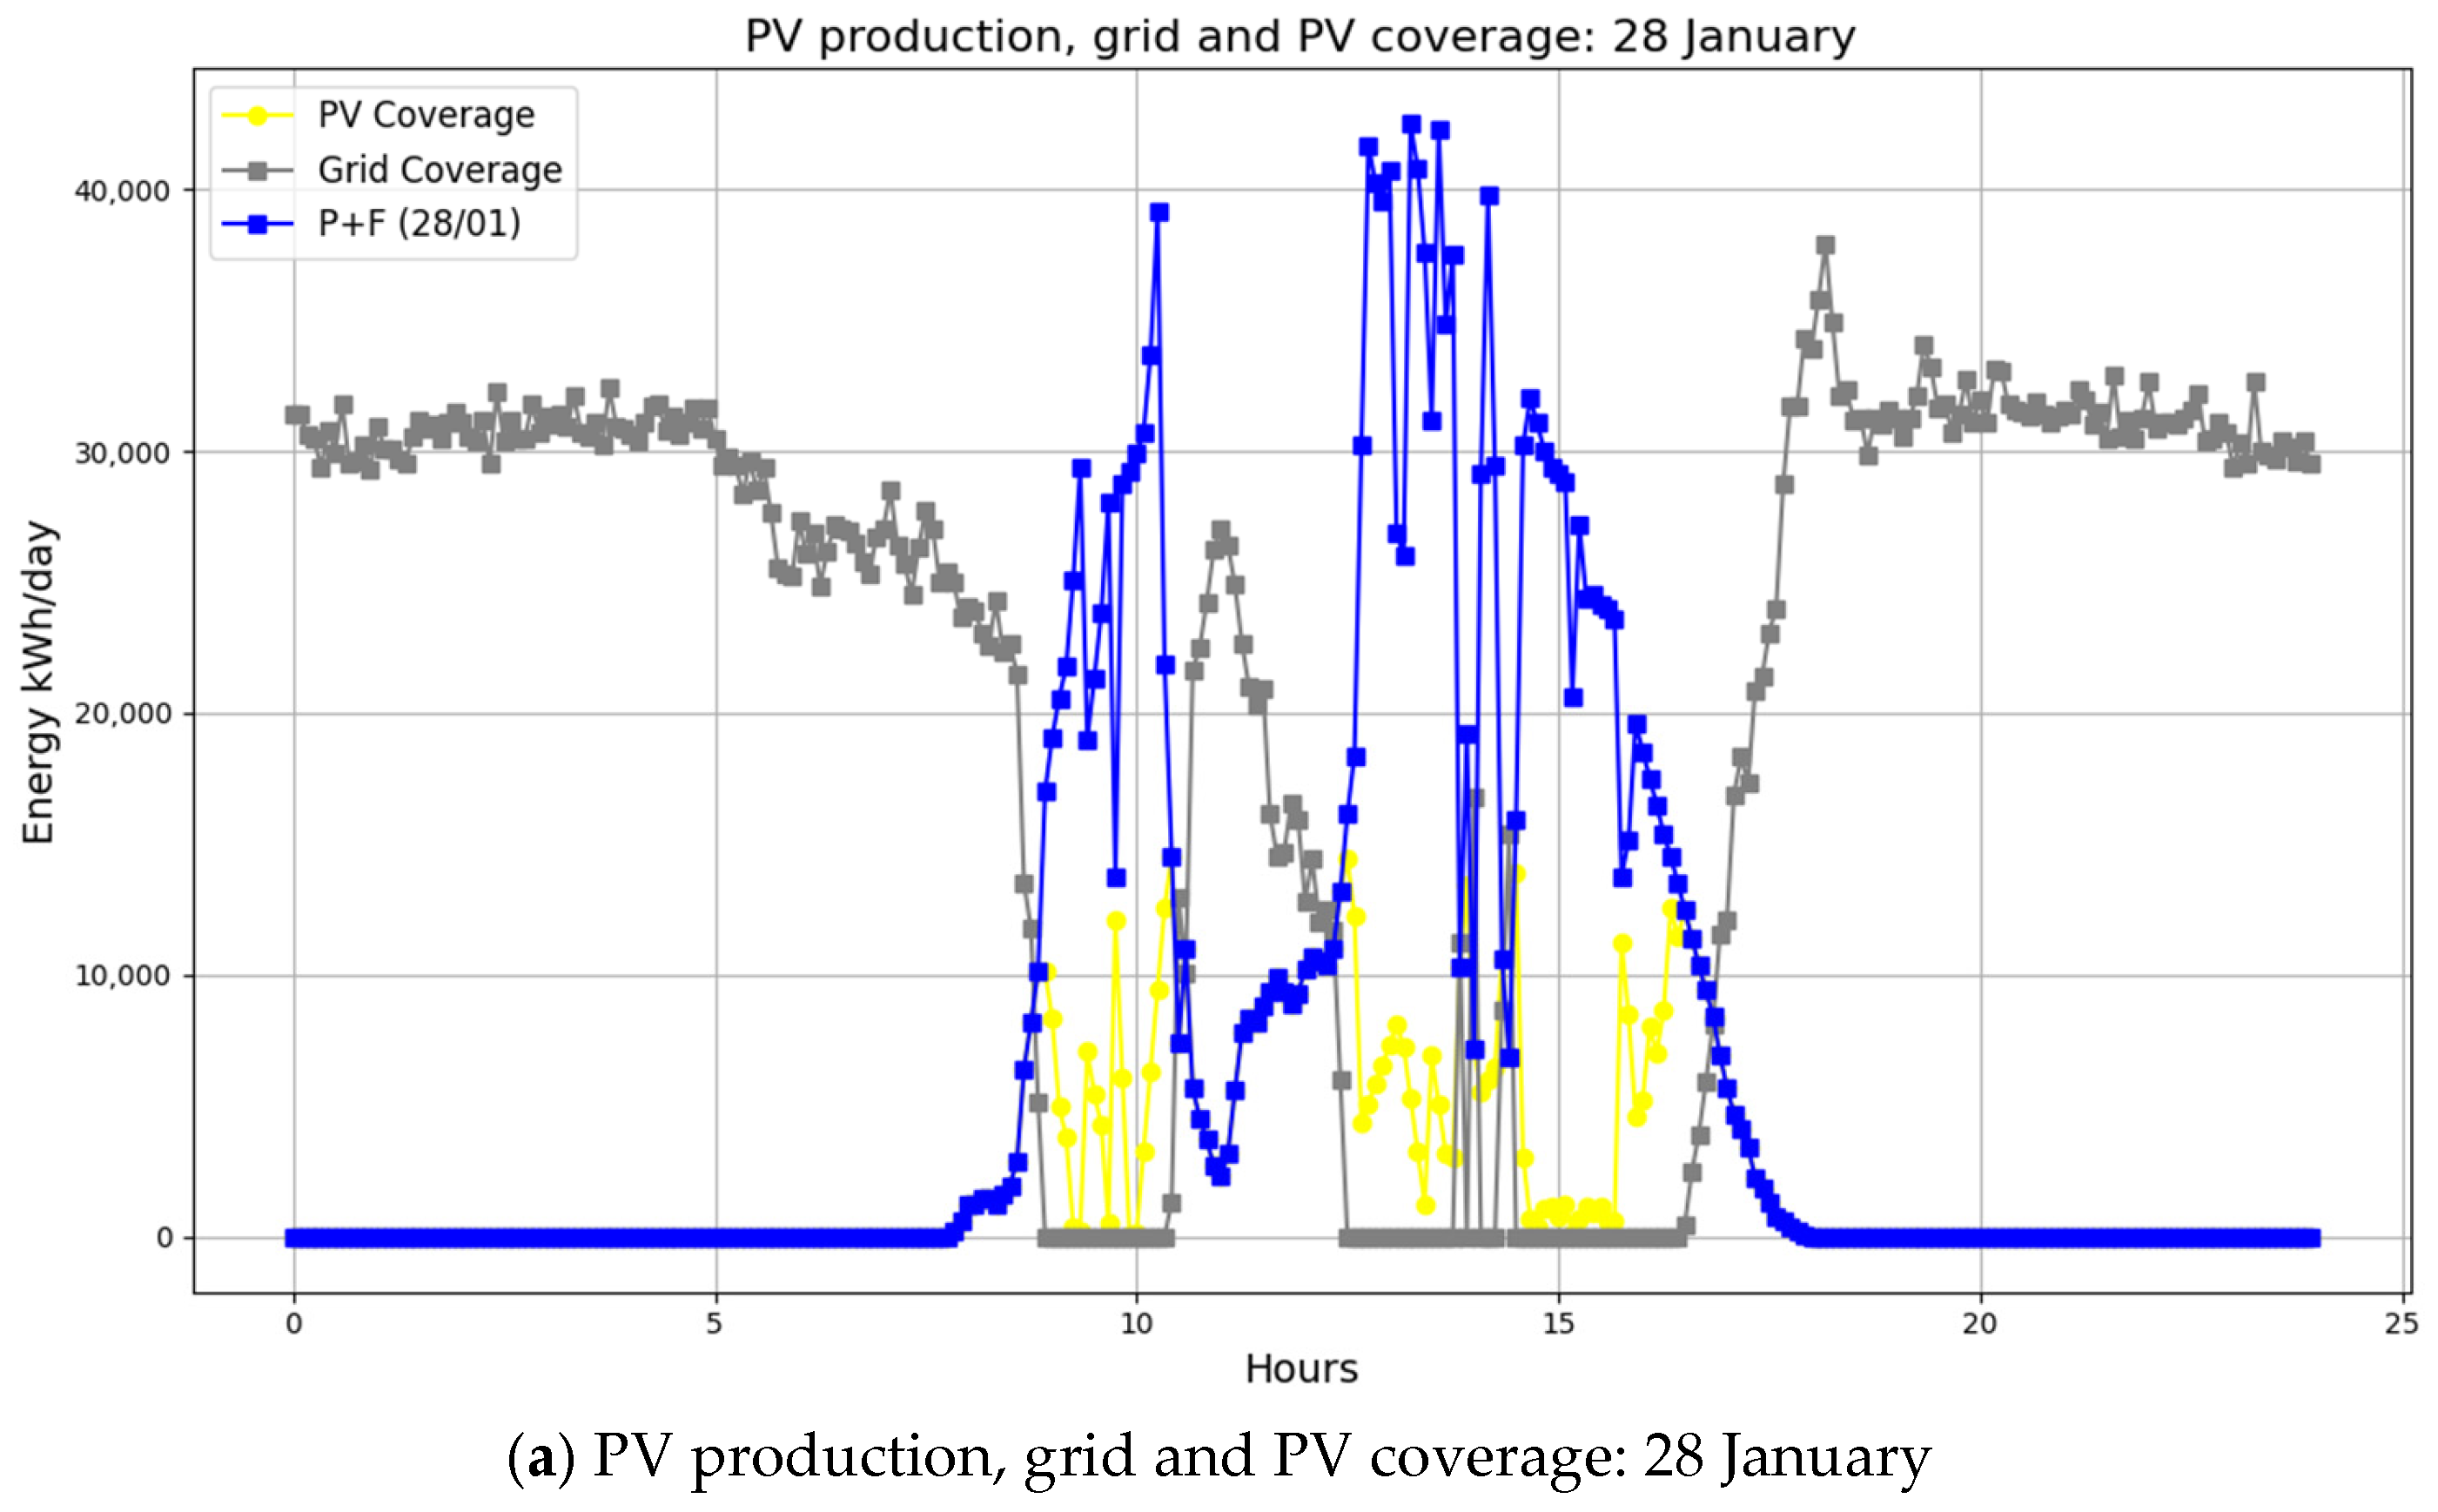
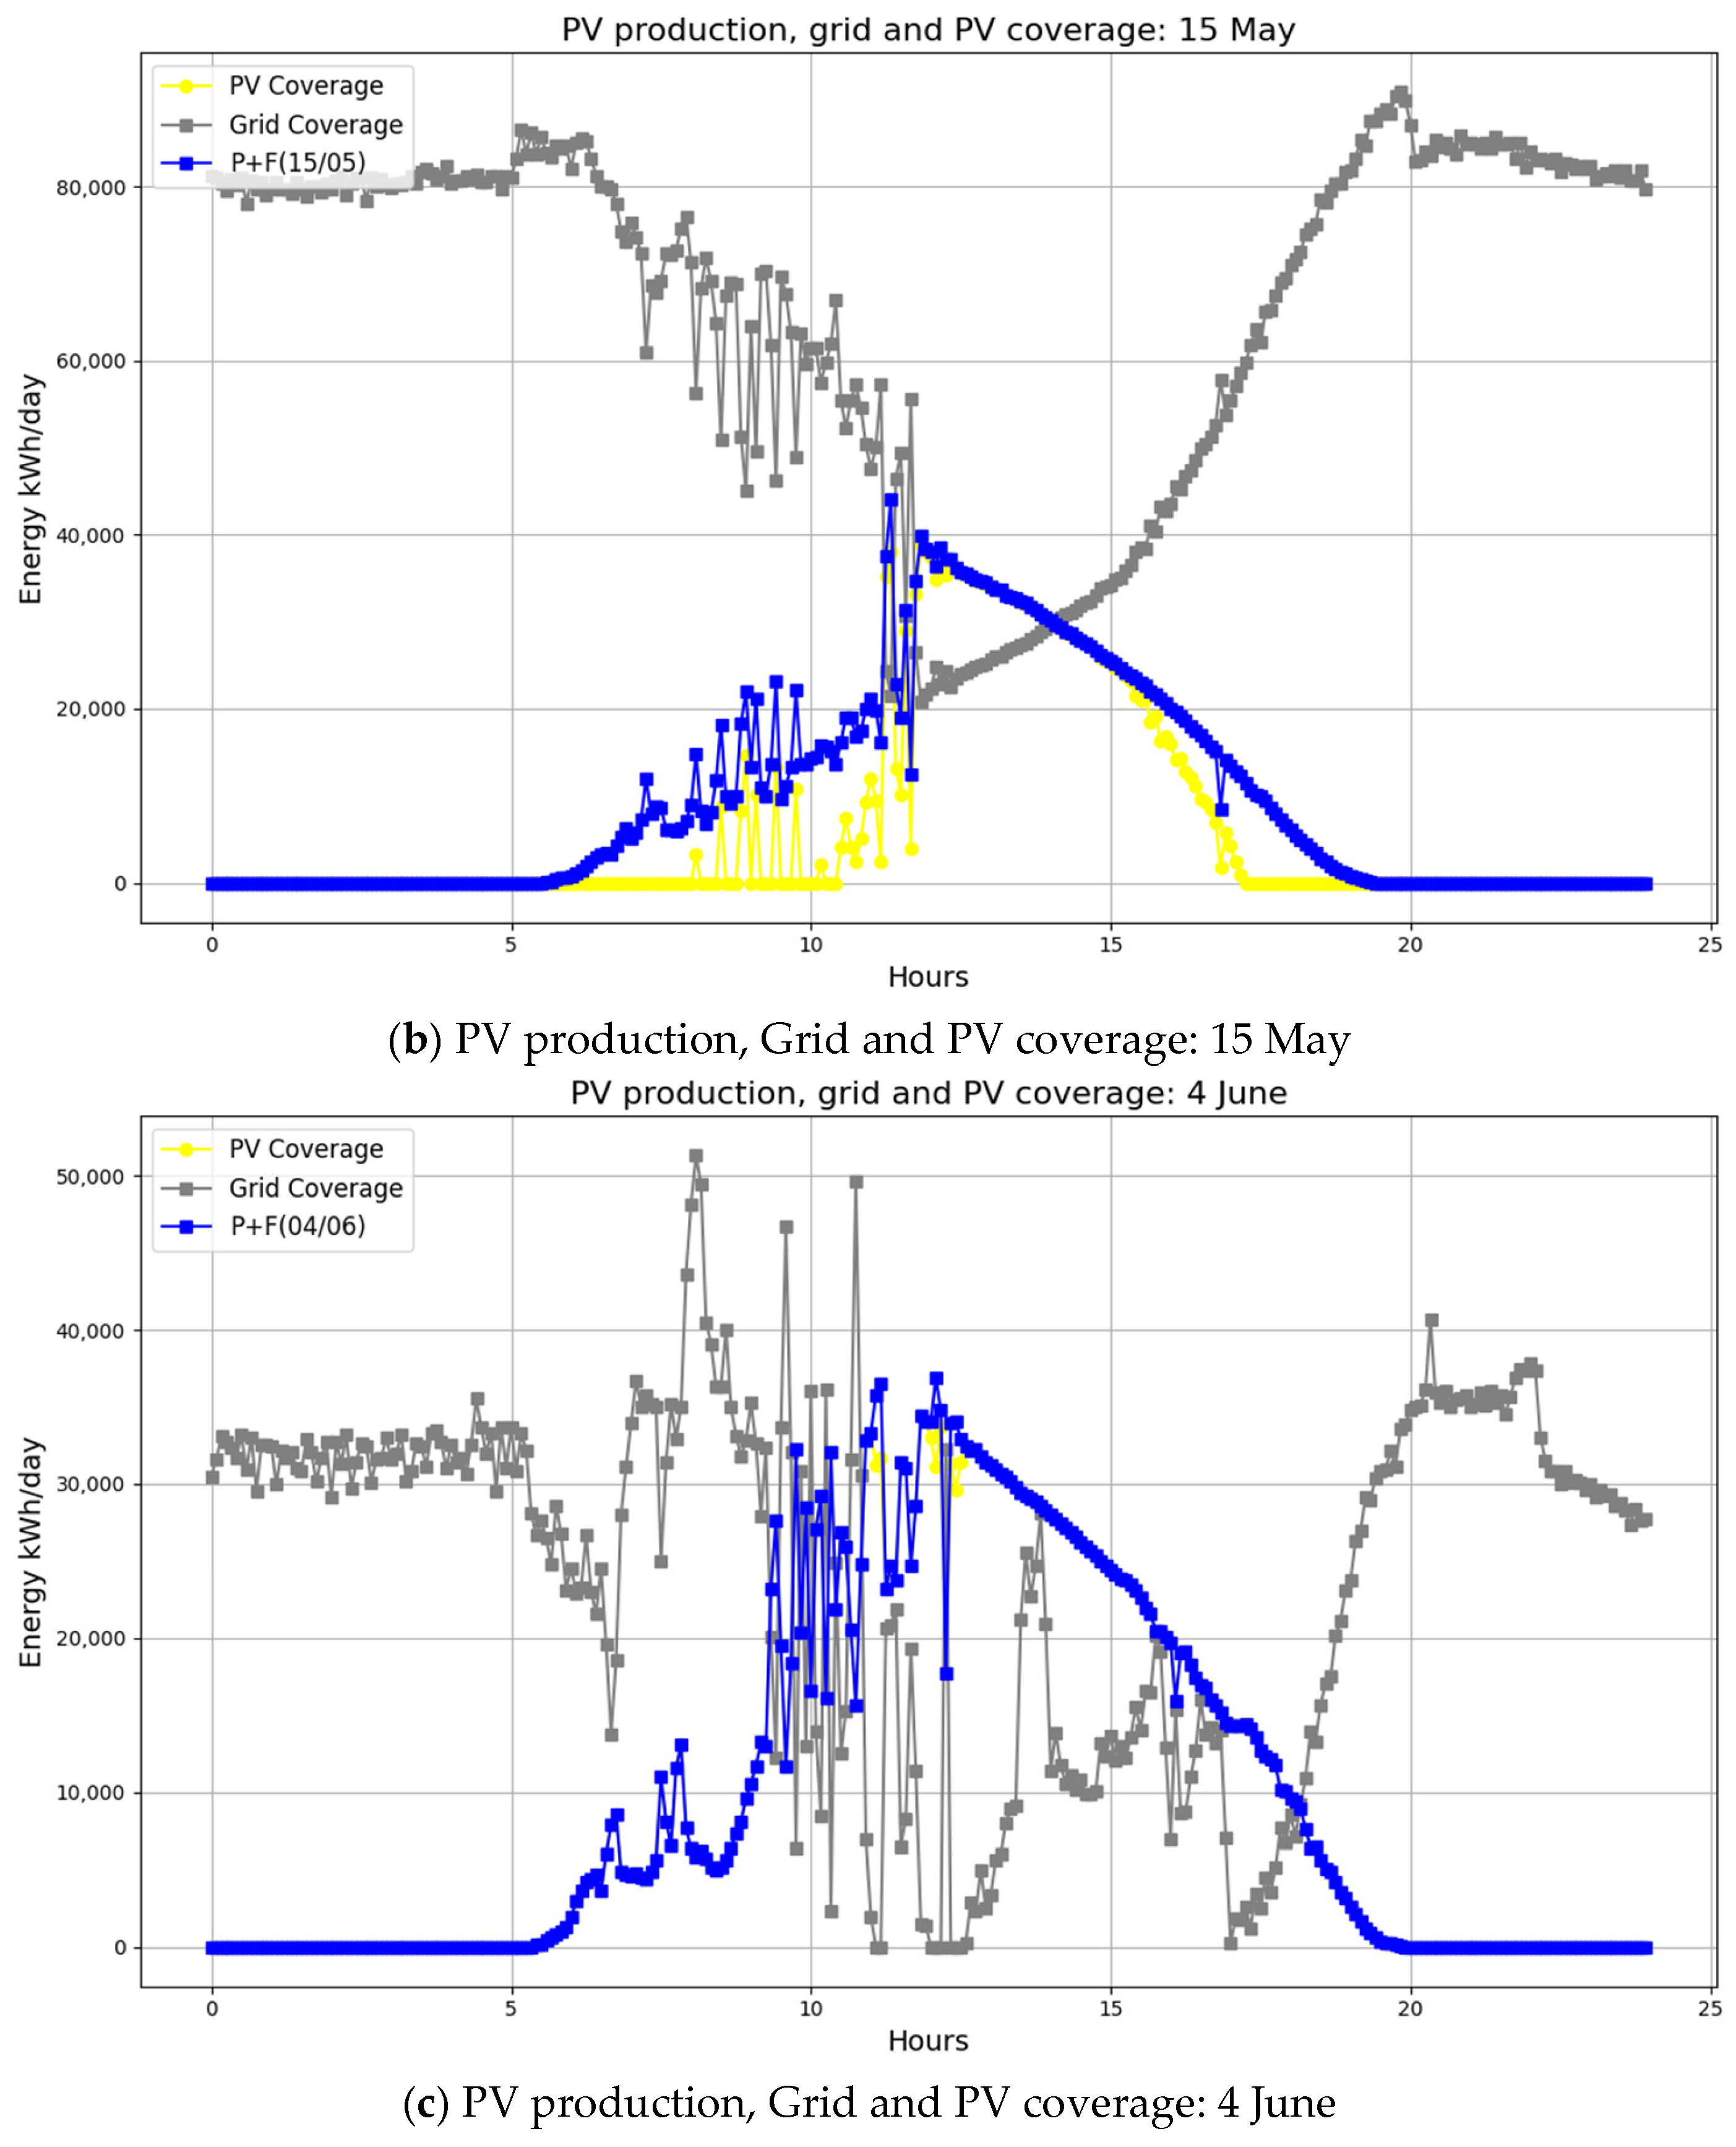
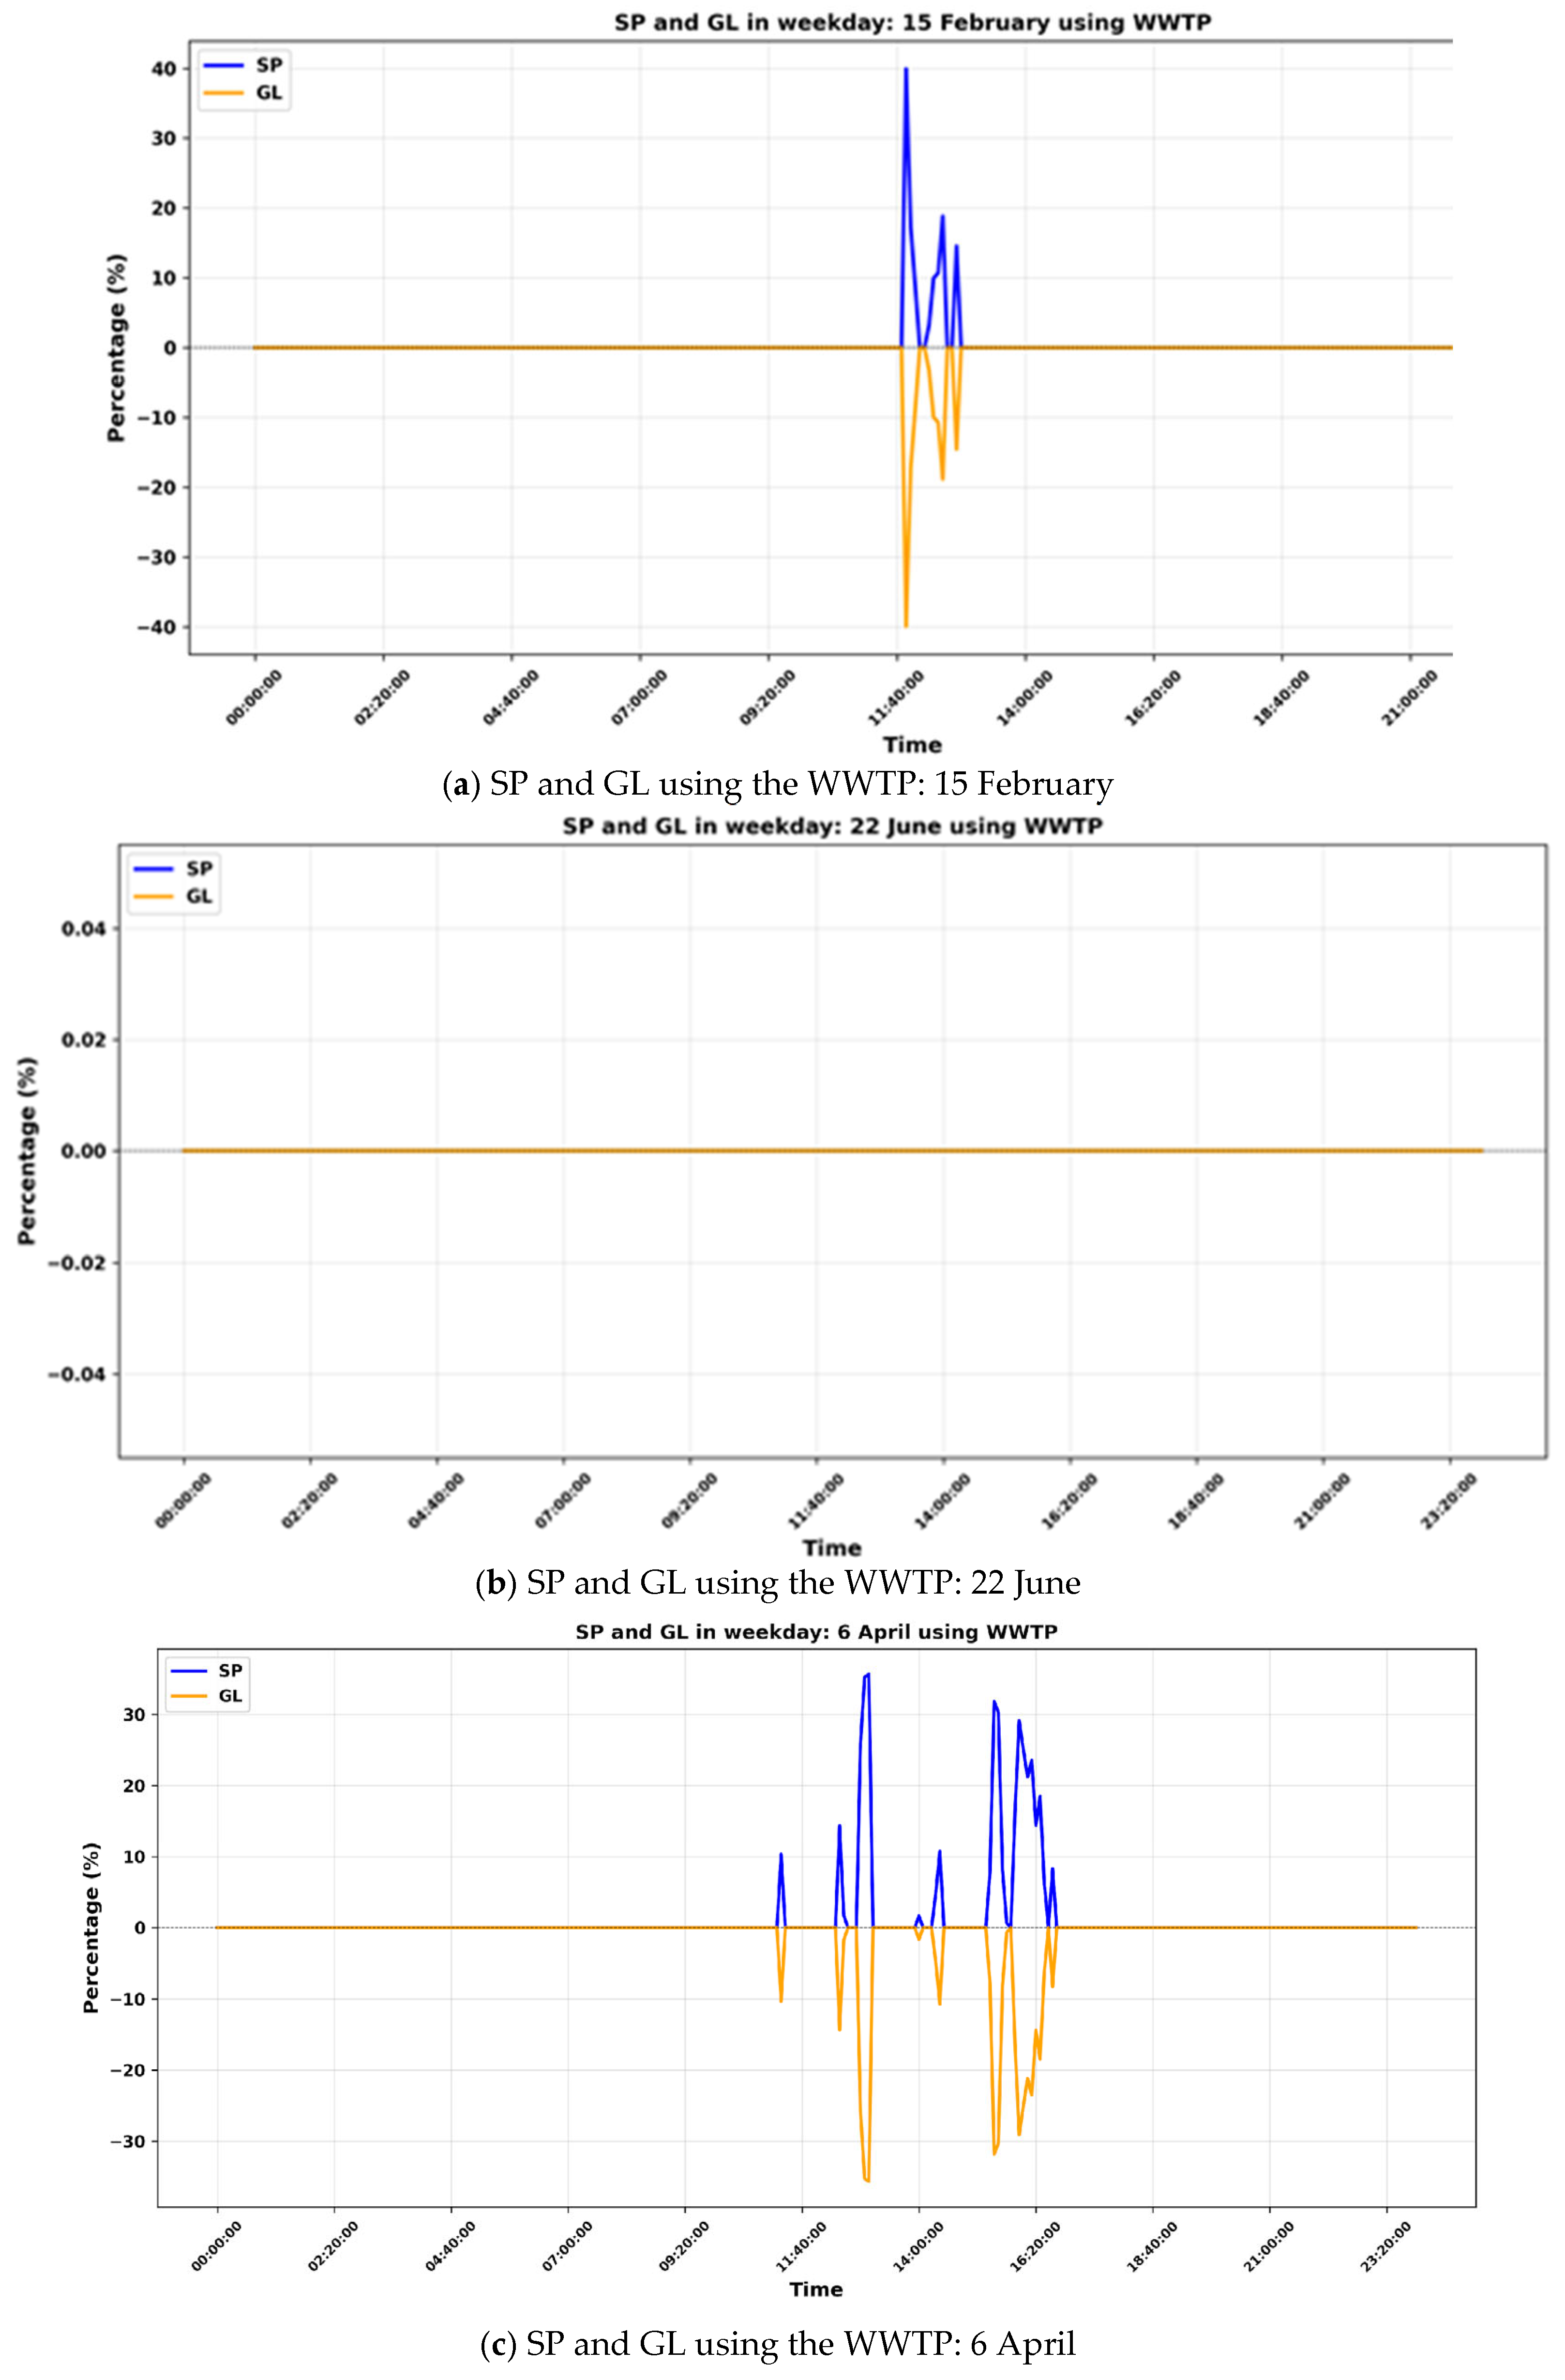
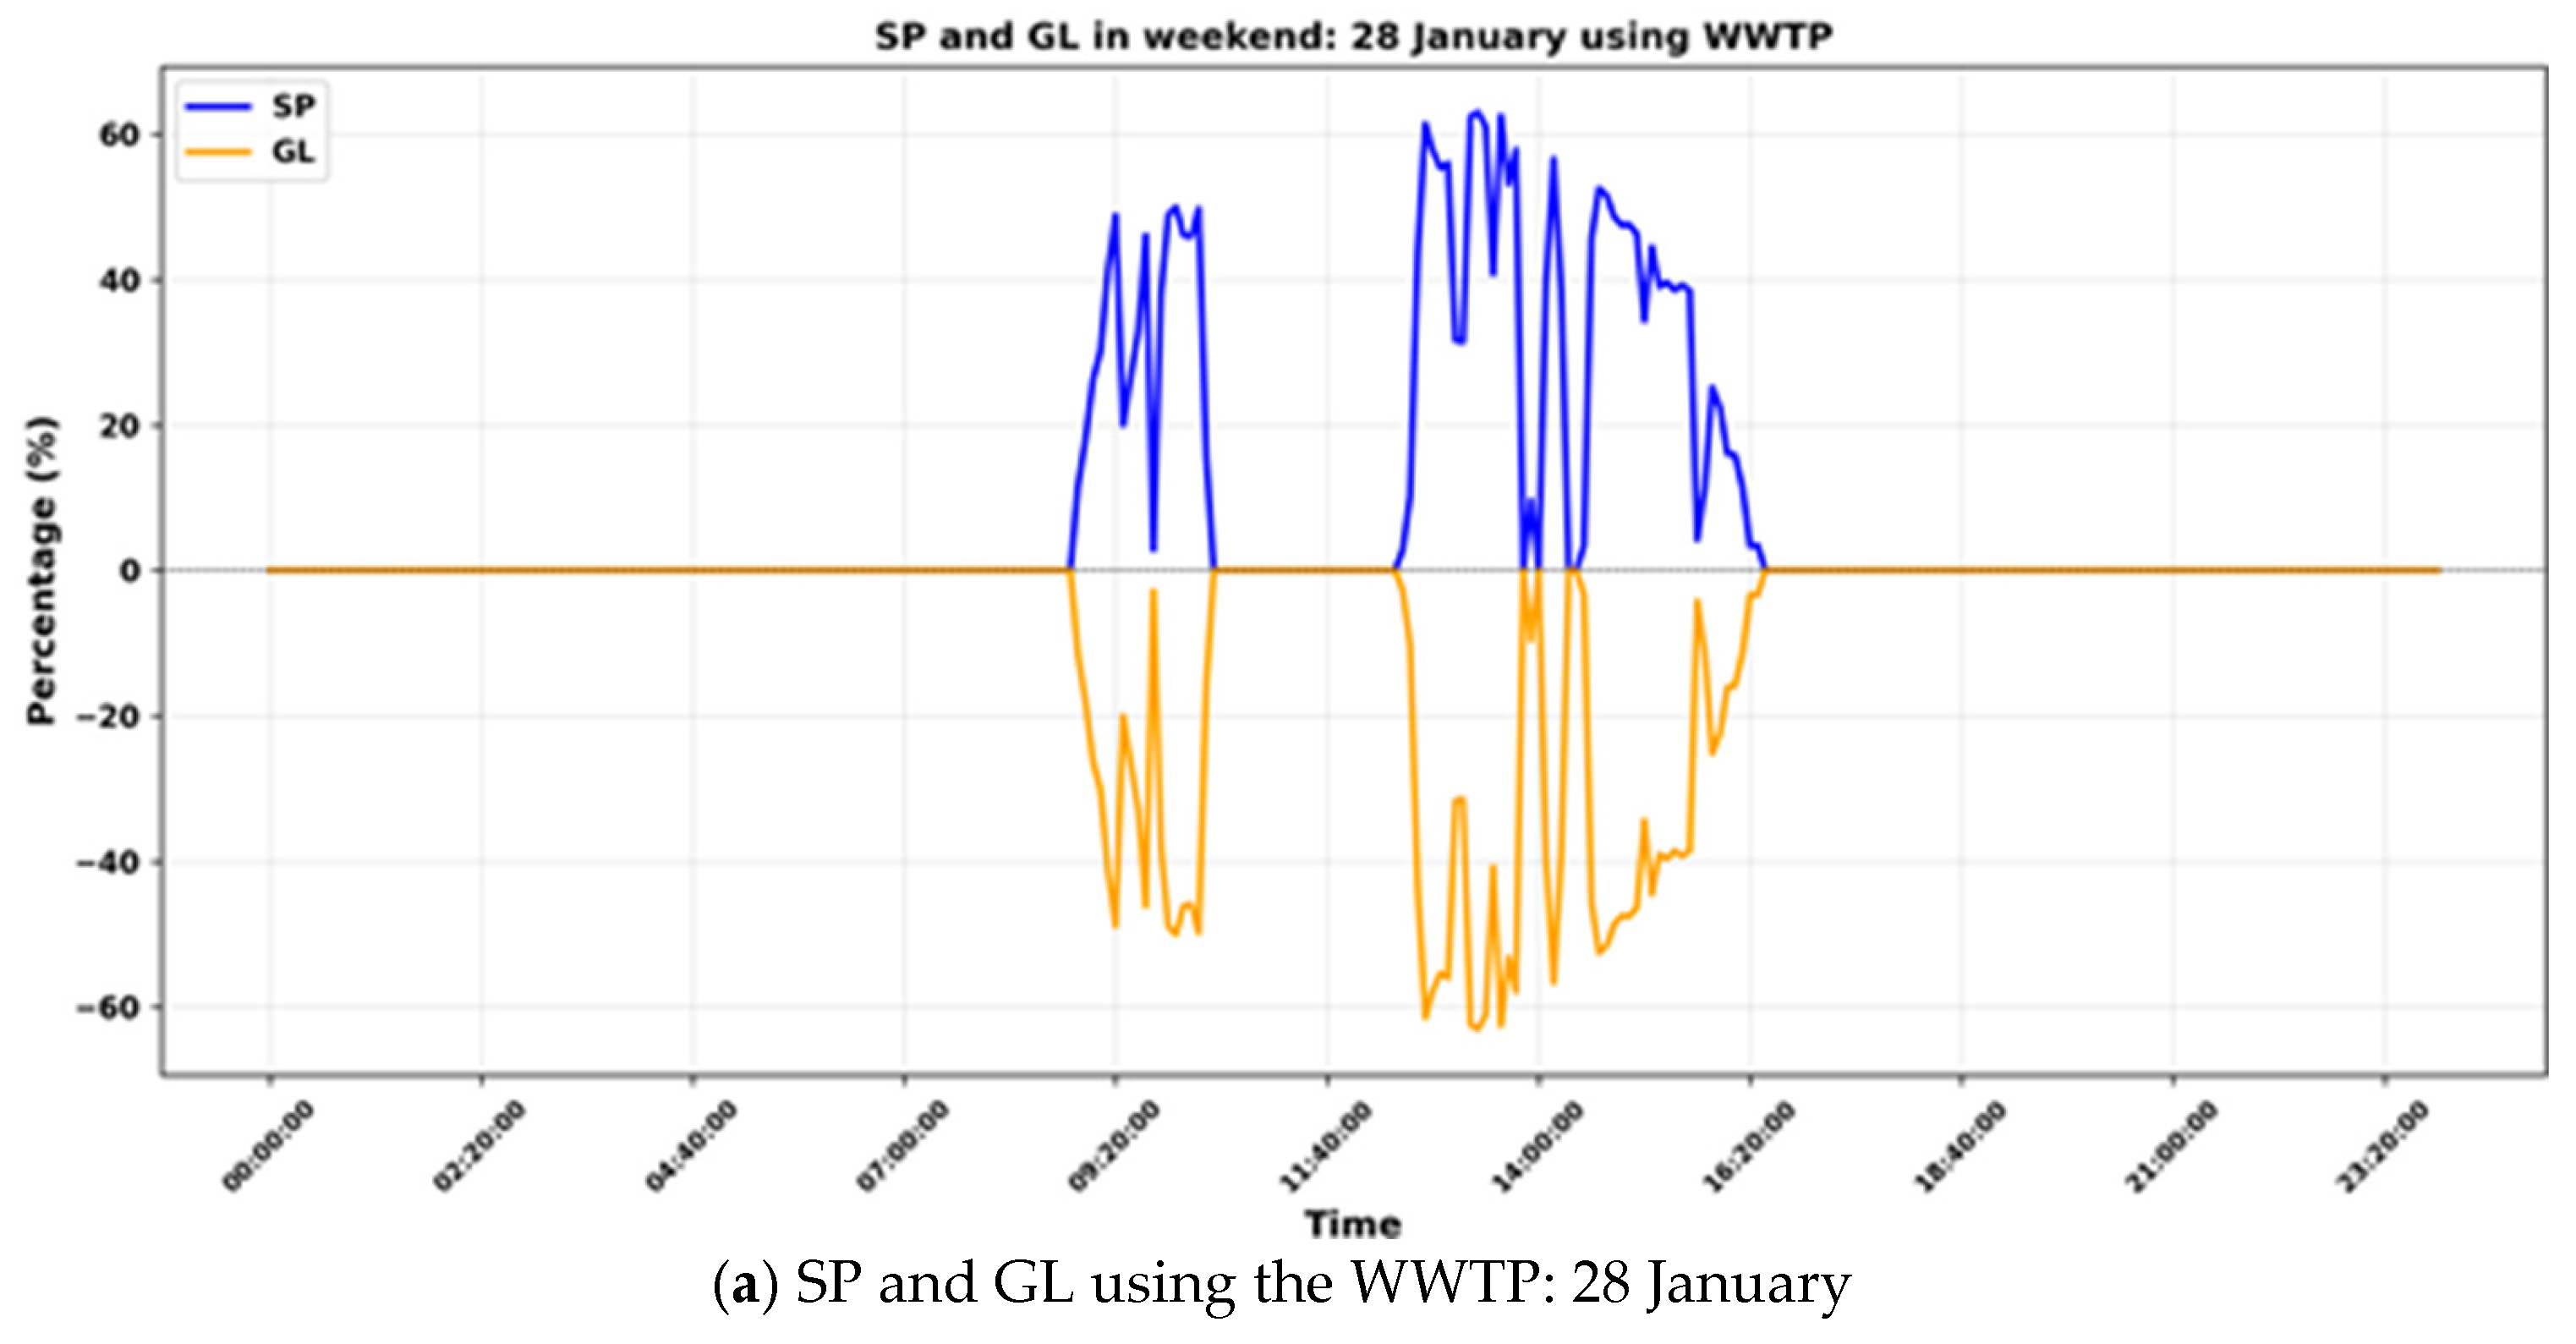
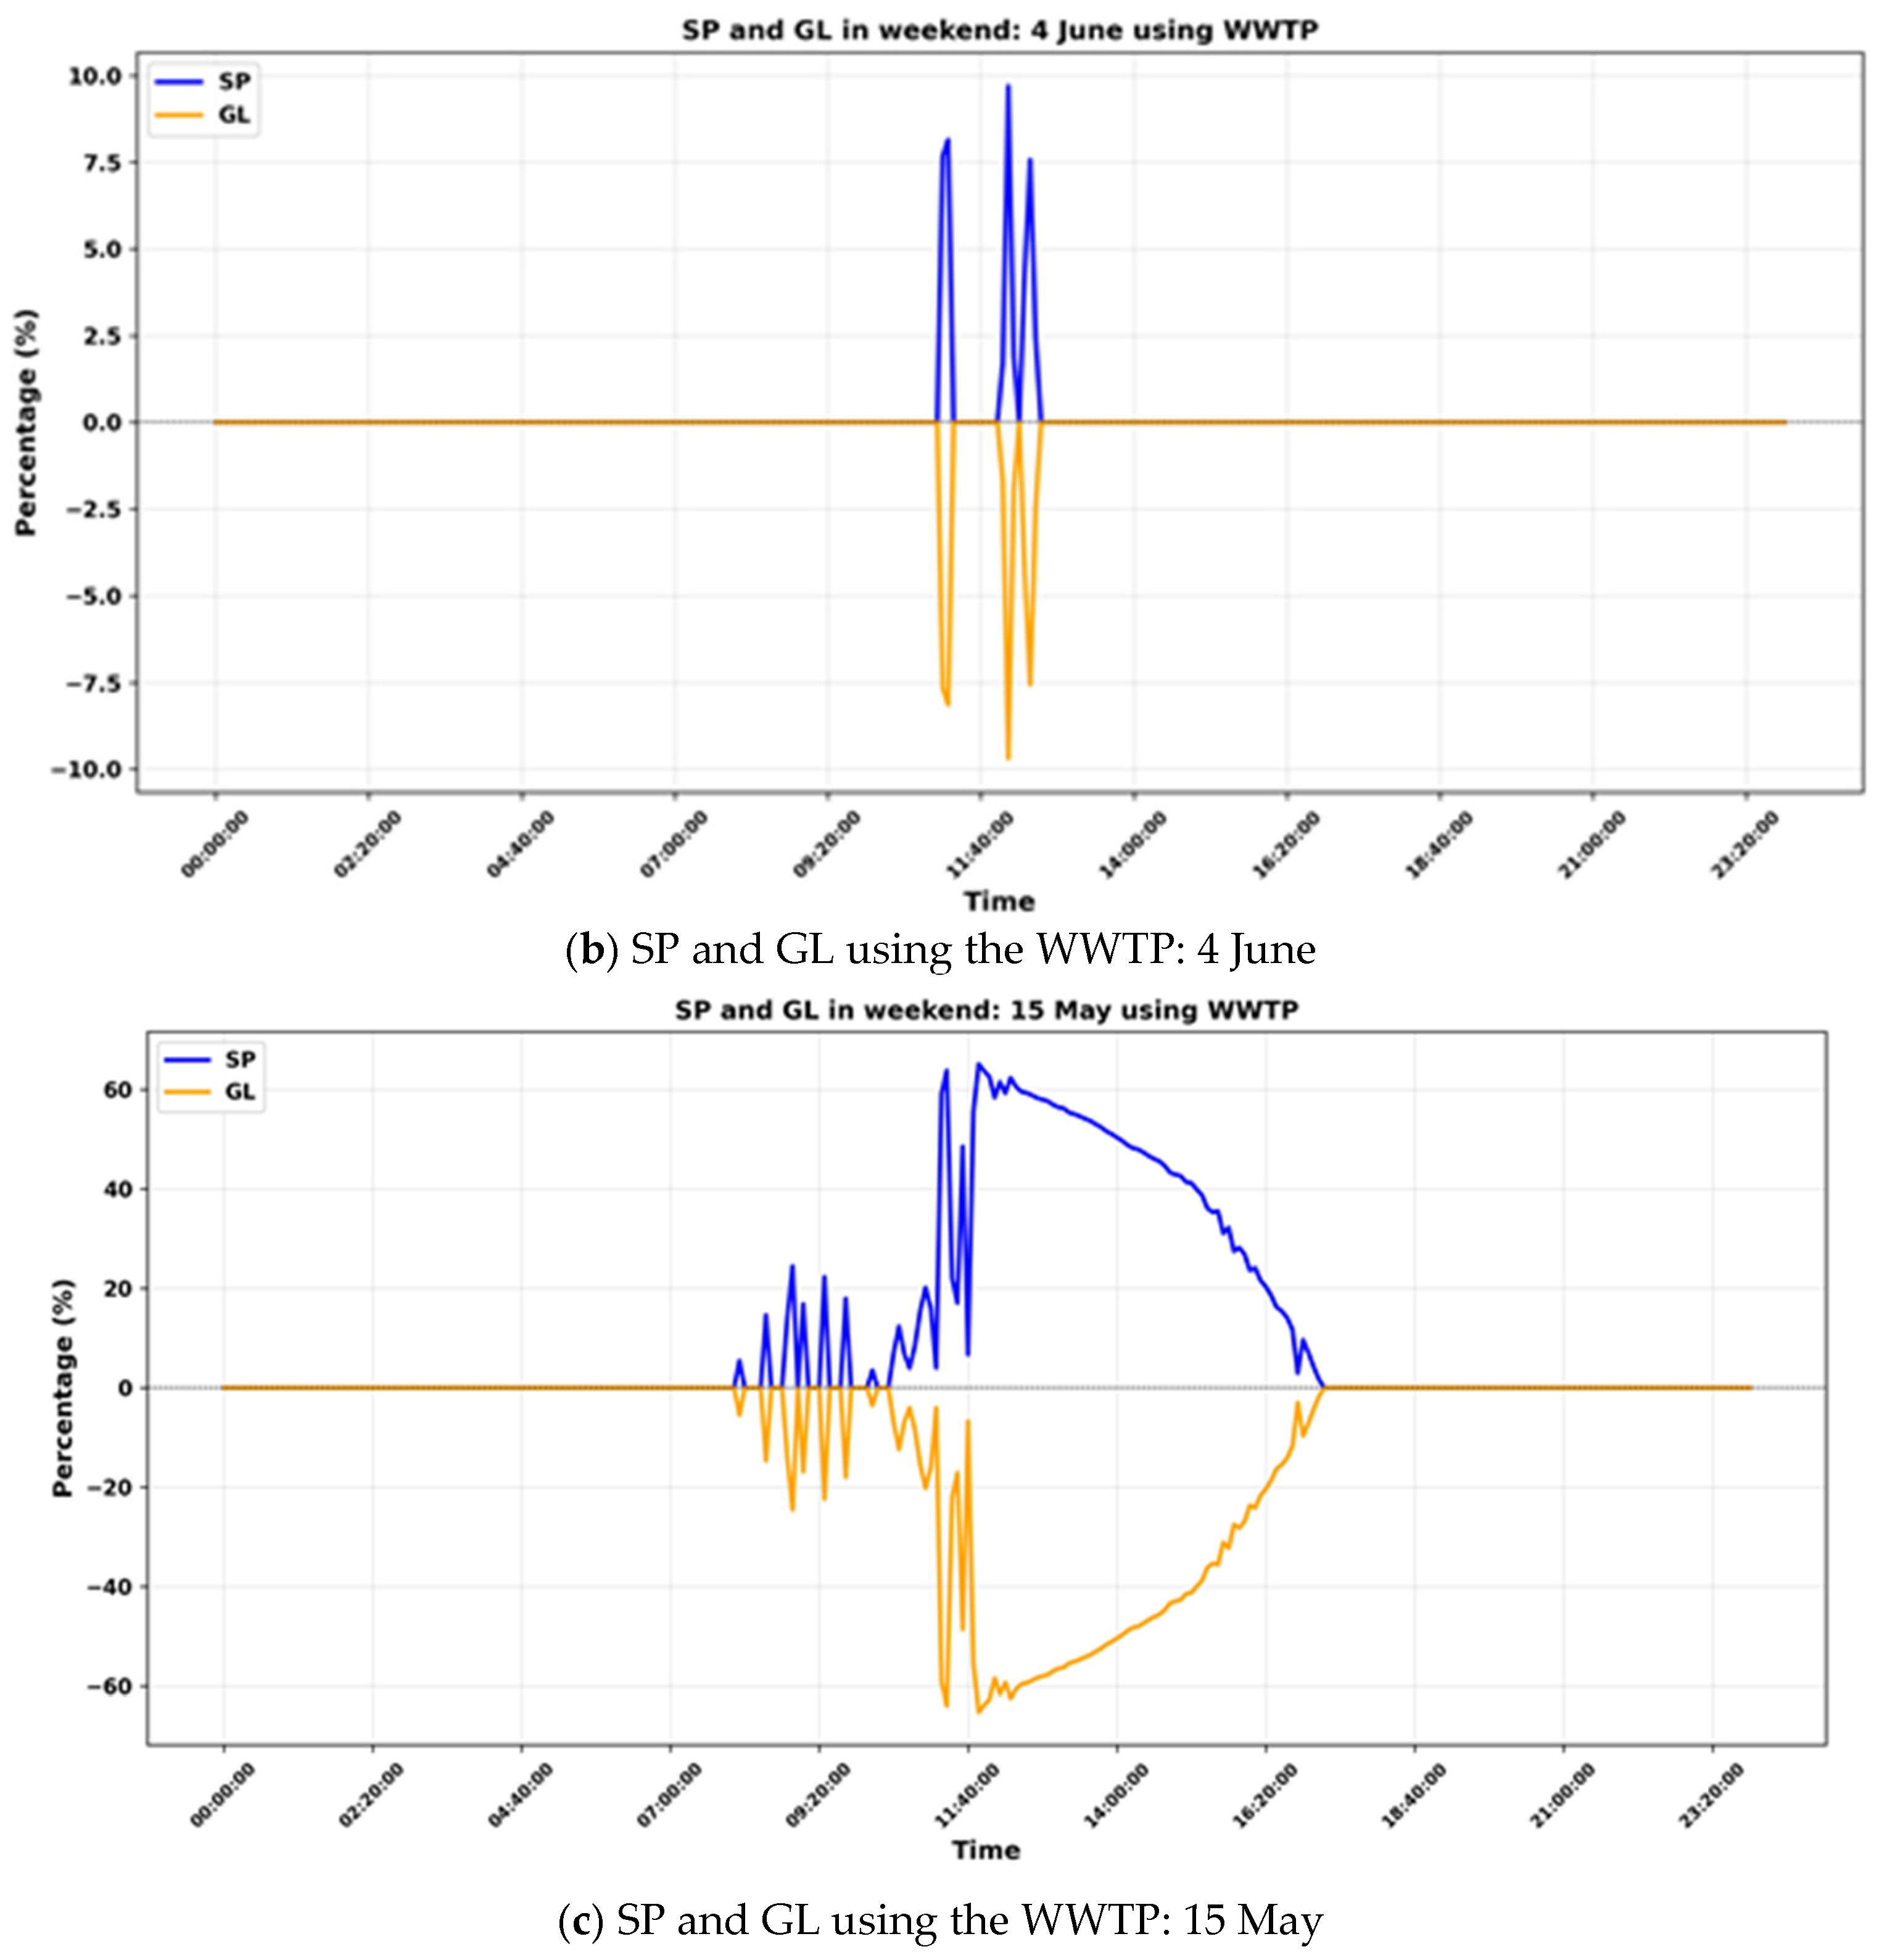
Figure 9, the graphs illustrate the days with the highest production to view the PV production, PV, and grid coverage of each season. The grid and PV coverage and production for the weekdays with the highest peaks are displayed in
Figure 8 and
Figure 9 (weekdays: 6 April, 22 June, and 15 February, weekends: 28 January, 15 May, and 4 June). In these figures, photovoltaic production is highest in April, resulting in greater autonomy. In the graphs, autonomy time varies from around 14 h (for April–June) to 11 h (for February), for the day. And due to the intermittency of PV, grid coverage can take over during these hours. Having the highest production does not necessarily mean that the surplus is greater, but it does depend on consumption, which varies seasonally. Thus, in the data, the maximum PV system surplus was detected on 12 April 2022, 15 February 2023, and 12 August 2022. On weekends, photovoltaic coverage is highest in June, with an autonomy of 14 h, followed by January, which covers loads using the photovoltaic system for 10 h, and May, with an autonomy of 14 h. The maximum surplus is reached on 15 January 2023, 26 March 2022, and 24 July 2022. In the Moroccan context, the sale of photovoltaic surplus is not yet authorized, hence the idea of supplying a water-purification station near the building, but only after assessing the technical feasibility of this suggestion.
Due to the intermittency of solar power, the WWPT needs an alternative renewable energy source of energy to move toward green energy sources. The battery storage in this case is not efficient since it will increase the initial investment expenses. According to [
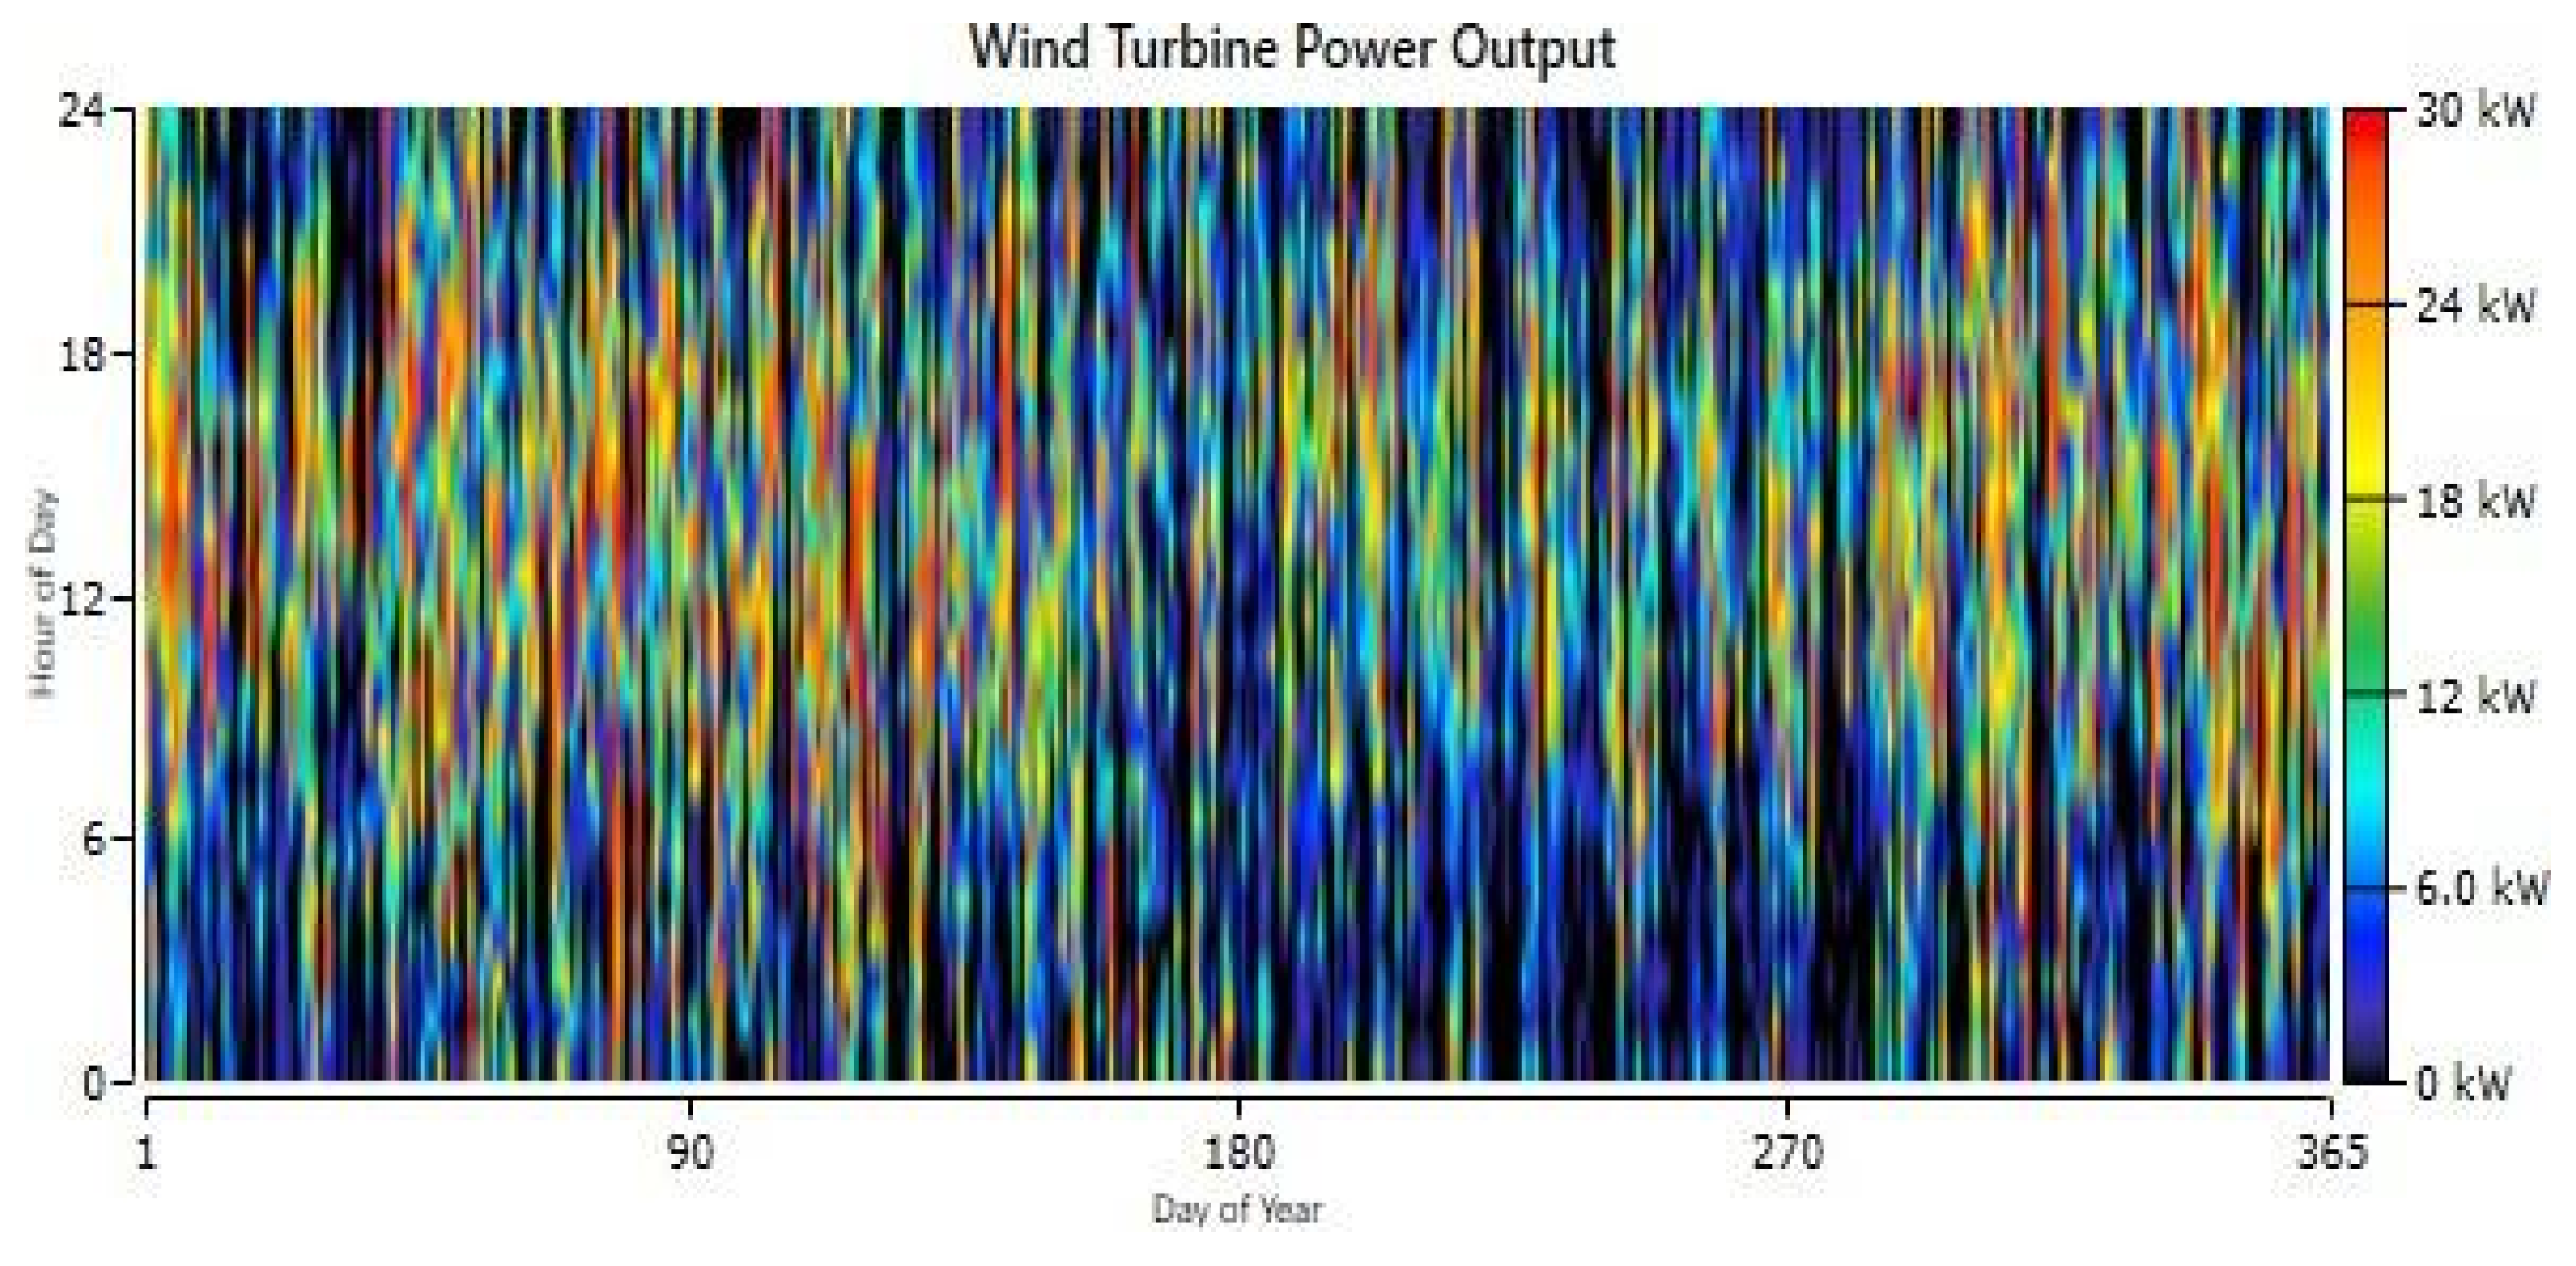
58], the best places to implement wind energy are in areas with an annual average wind speed of at least 9 miles per hour (mph) or 4.0 m per second (m/s), which makes Kenitra a suitable location for wind energy systems, as illustrated in
Figure 10. Thus, an adequate option is to add a wind energy source to the system.
4.2. Water-Purification Station Electrical Profile
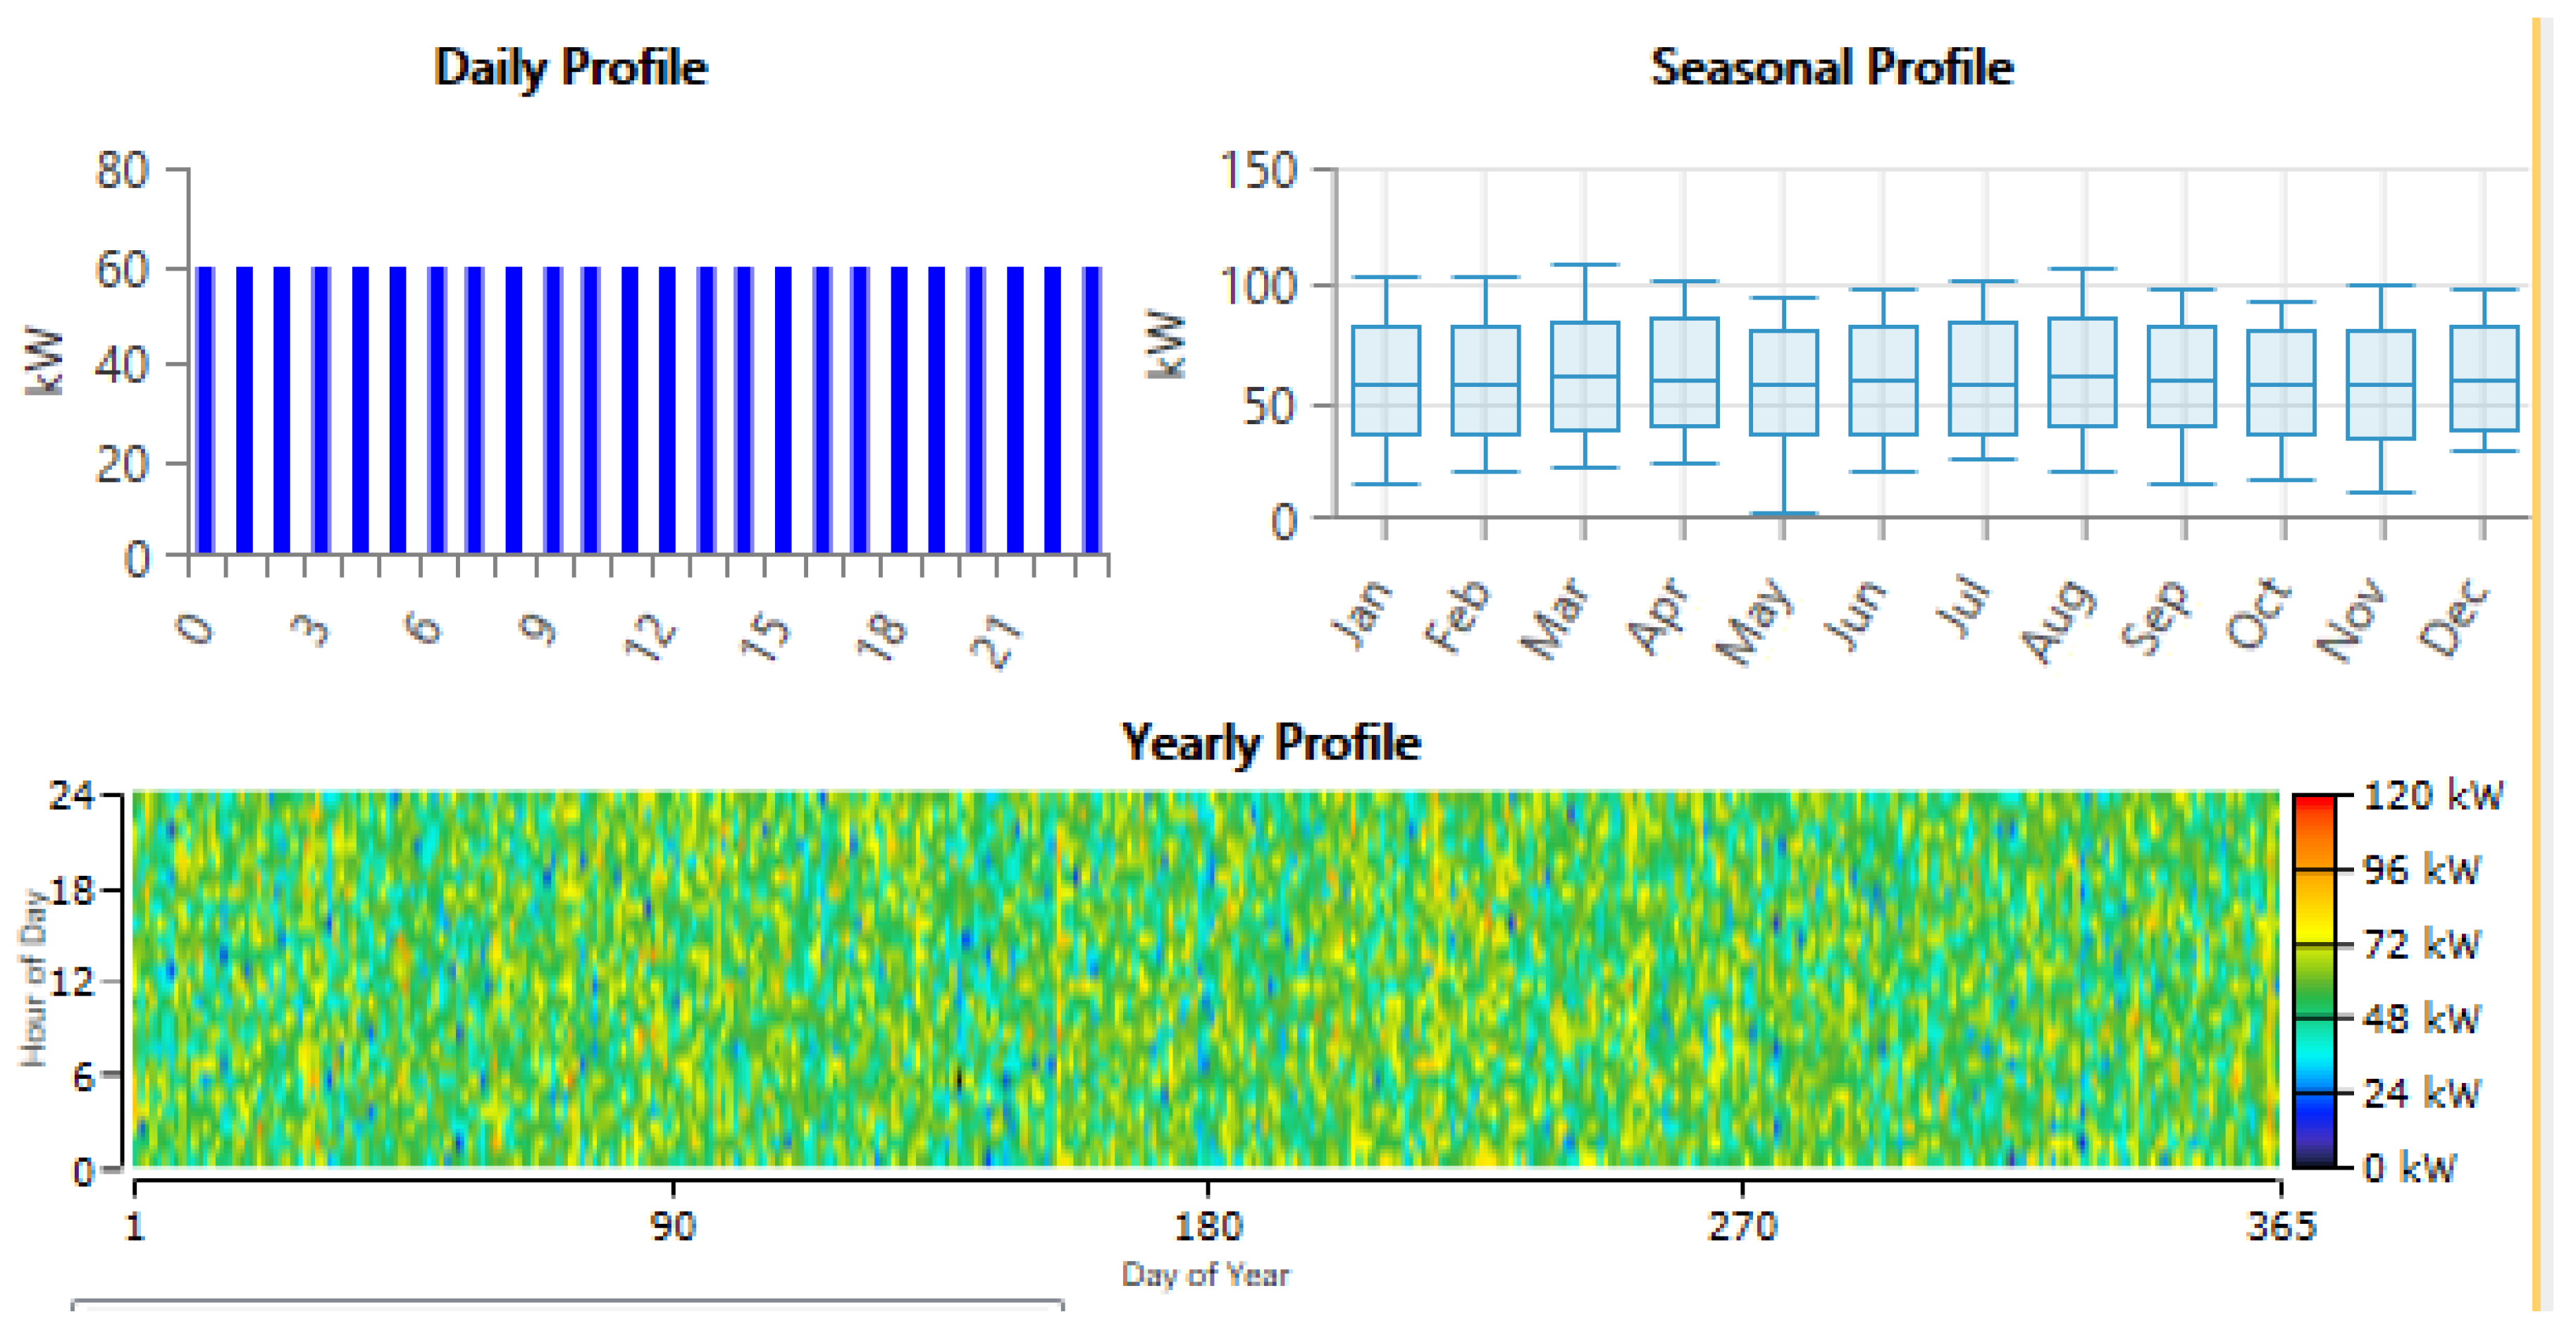
Figure 11 shows the load consumption of the WWPT connected to the building, which consumes 59.6 kW constantly. To represent the load profile, a random day-to-day variability of 10% and a time step of 20 are selected while using Homer-Pro. This design enables us to pre-size the wind system, and the perfect one produces 30 kW. Using load patterns is crucial and essential to integrate HRES for a continuous and optimal energy use.
7. Conclusions
This study develops and applies a load-matching and techno-economic assessment framework—combining hourly HOMER Pro simulations with the metrics of self-consumption, self-sufficiency, self-production, and grid reliability—to a real smart-building micro-grid at Ibn Tofail University (Morocco). The methodology quantifies, first, how much of the joint electricity demand of the building and its coupled water-purification station can be met by the existing rooftop PV array and, second, how those results change when a modest on-site wind resource is introduced.
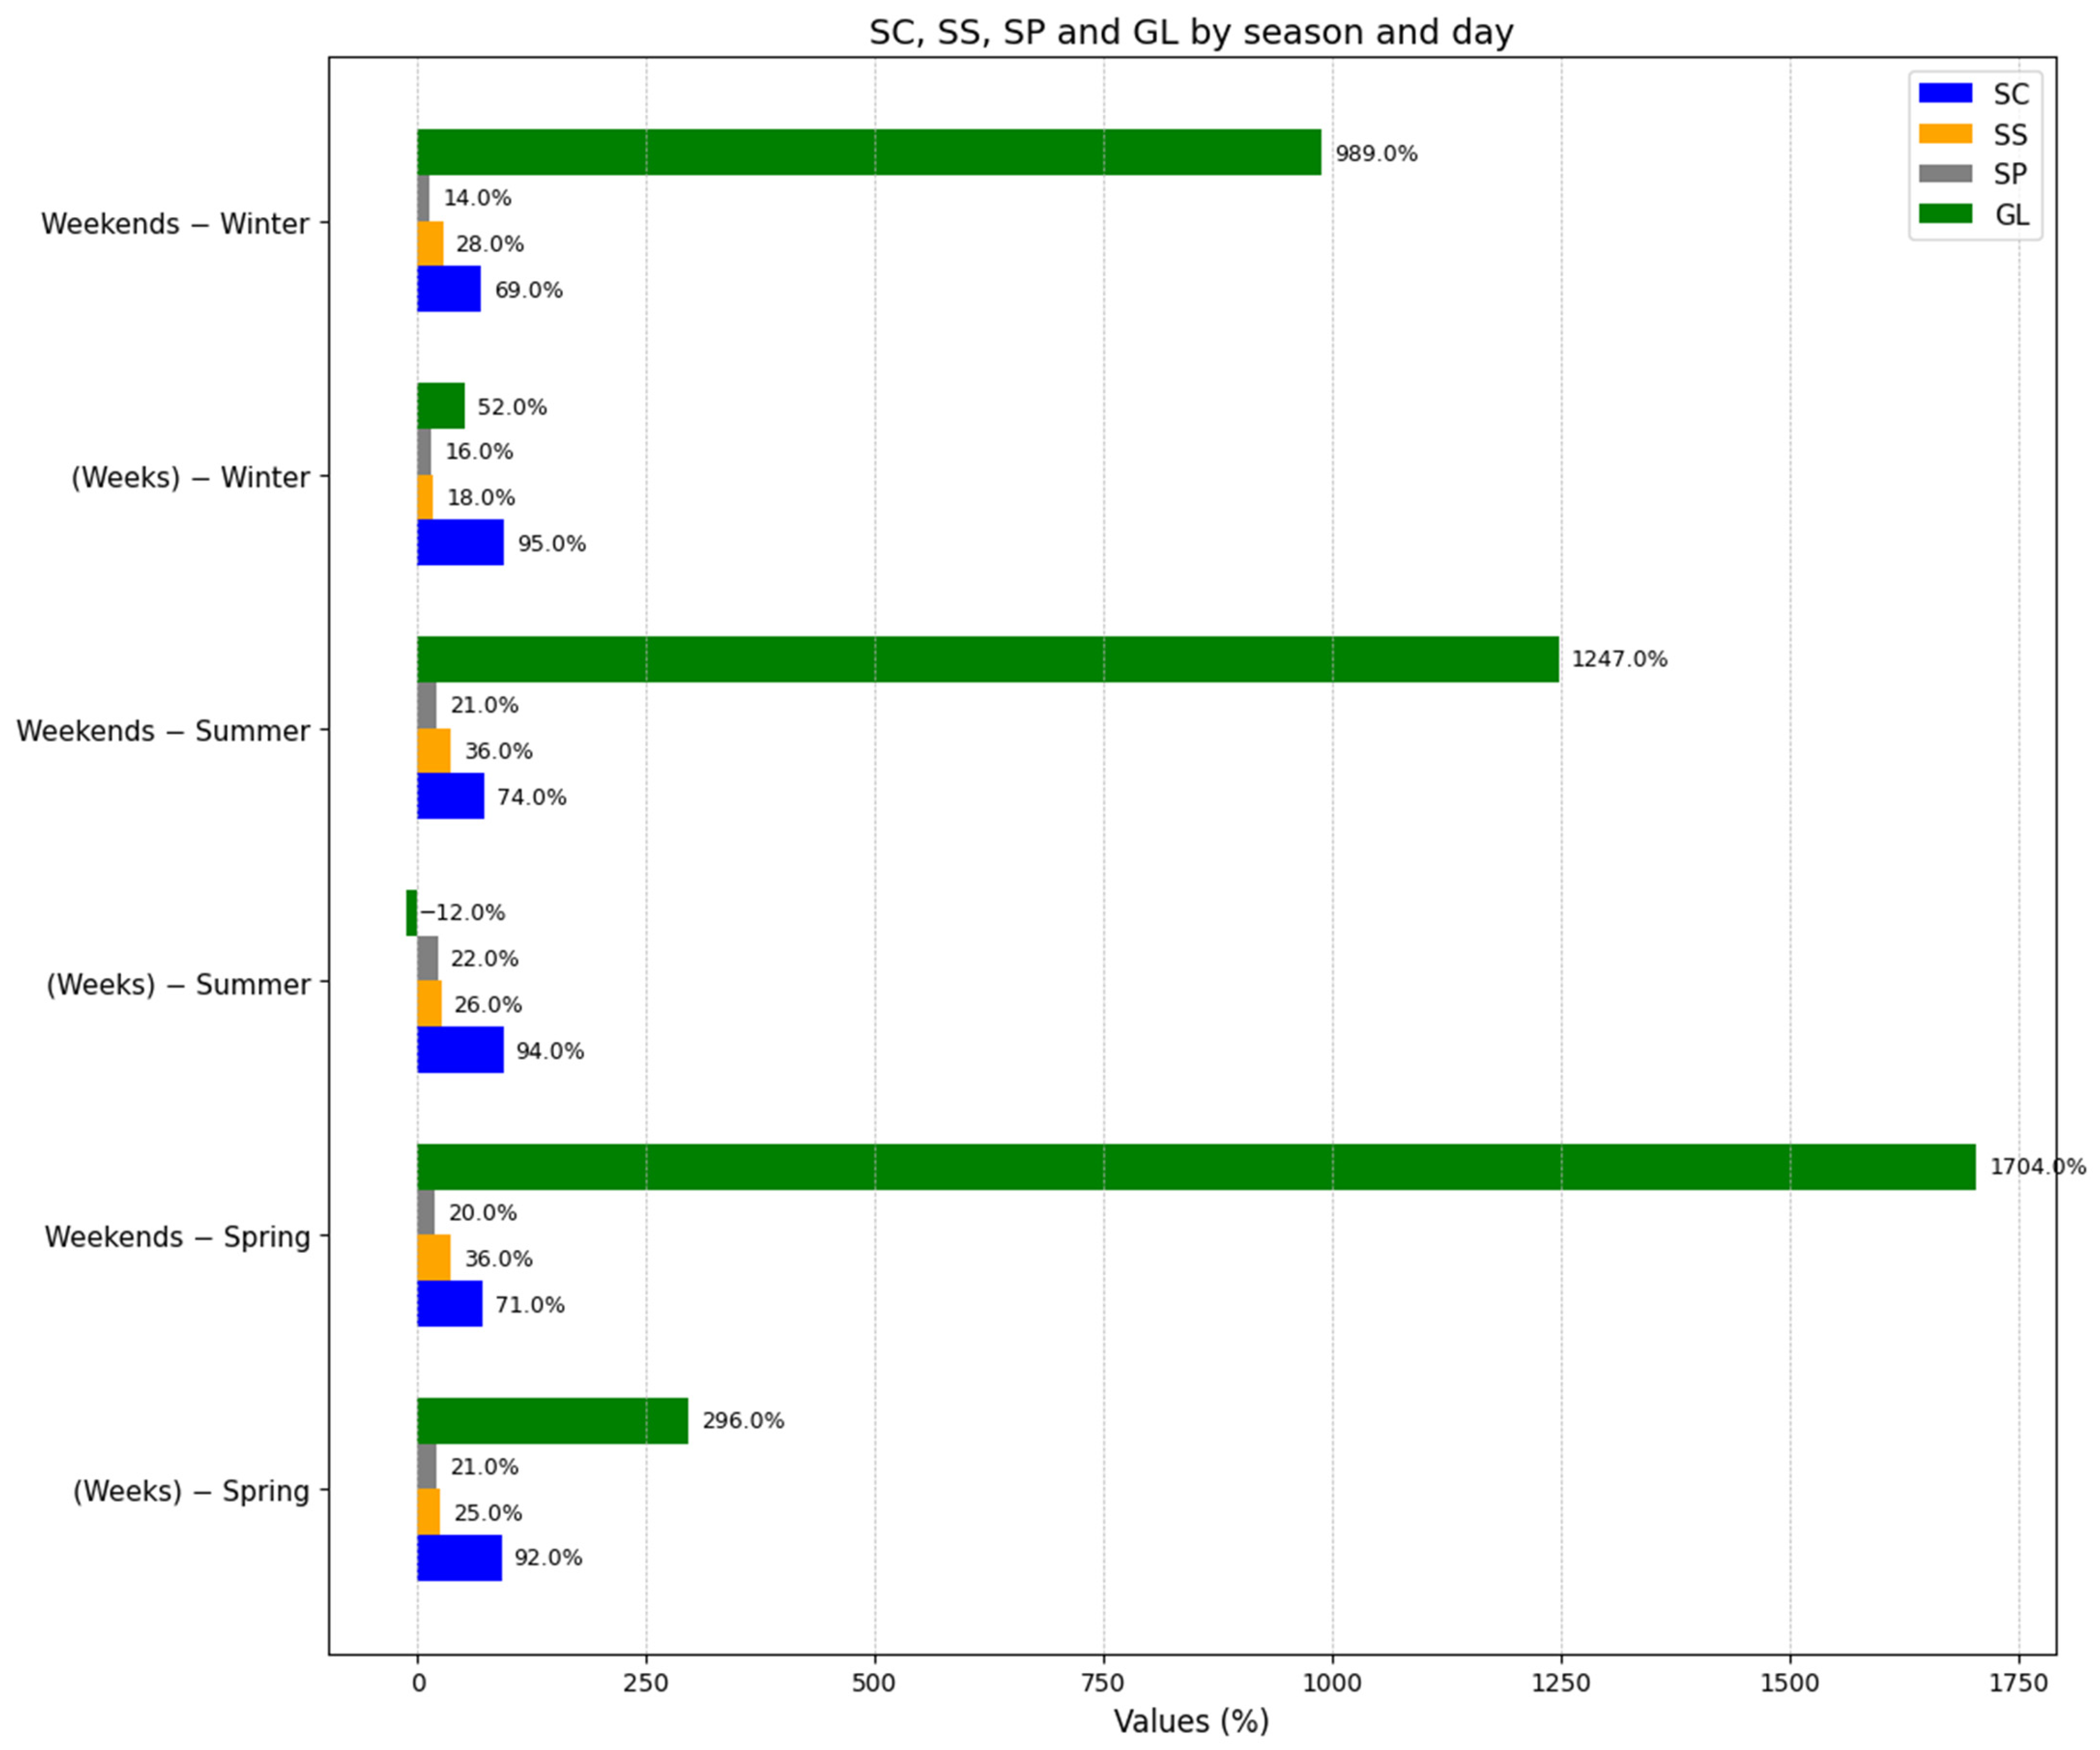
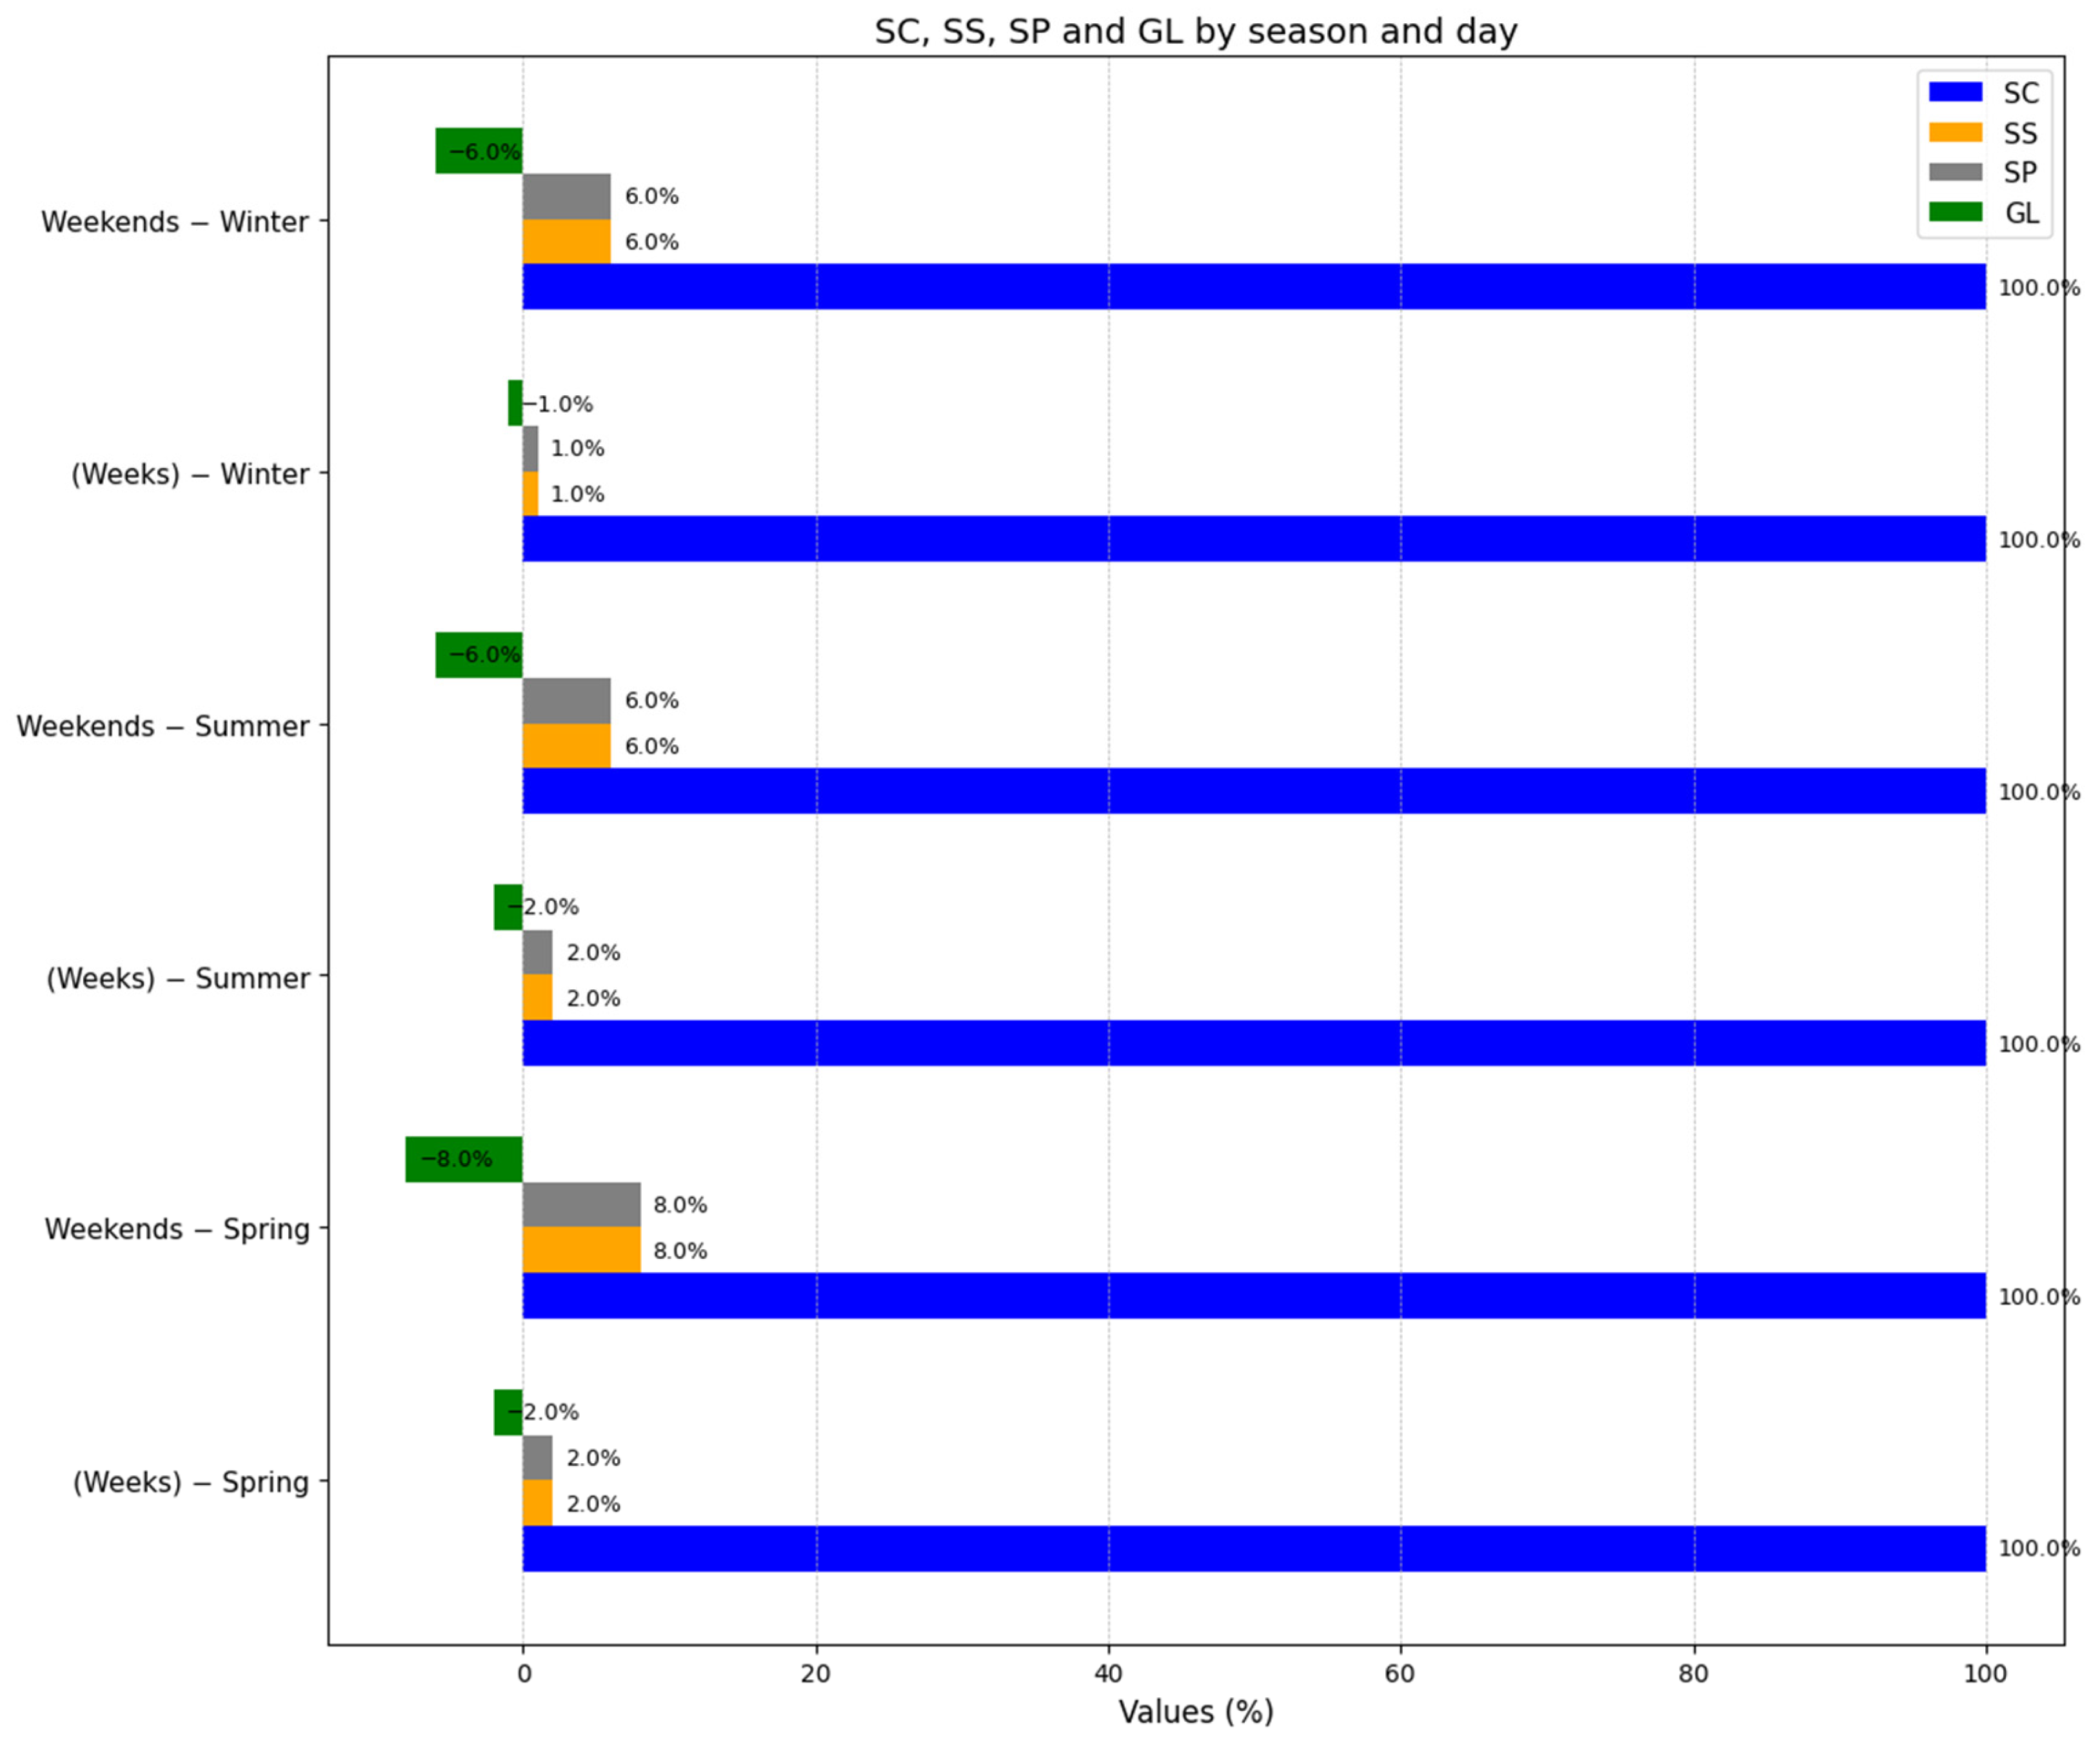
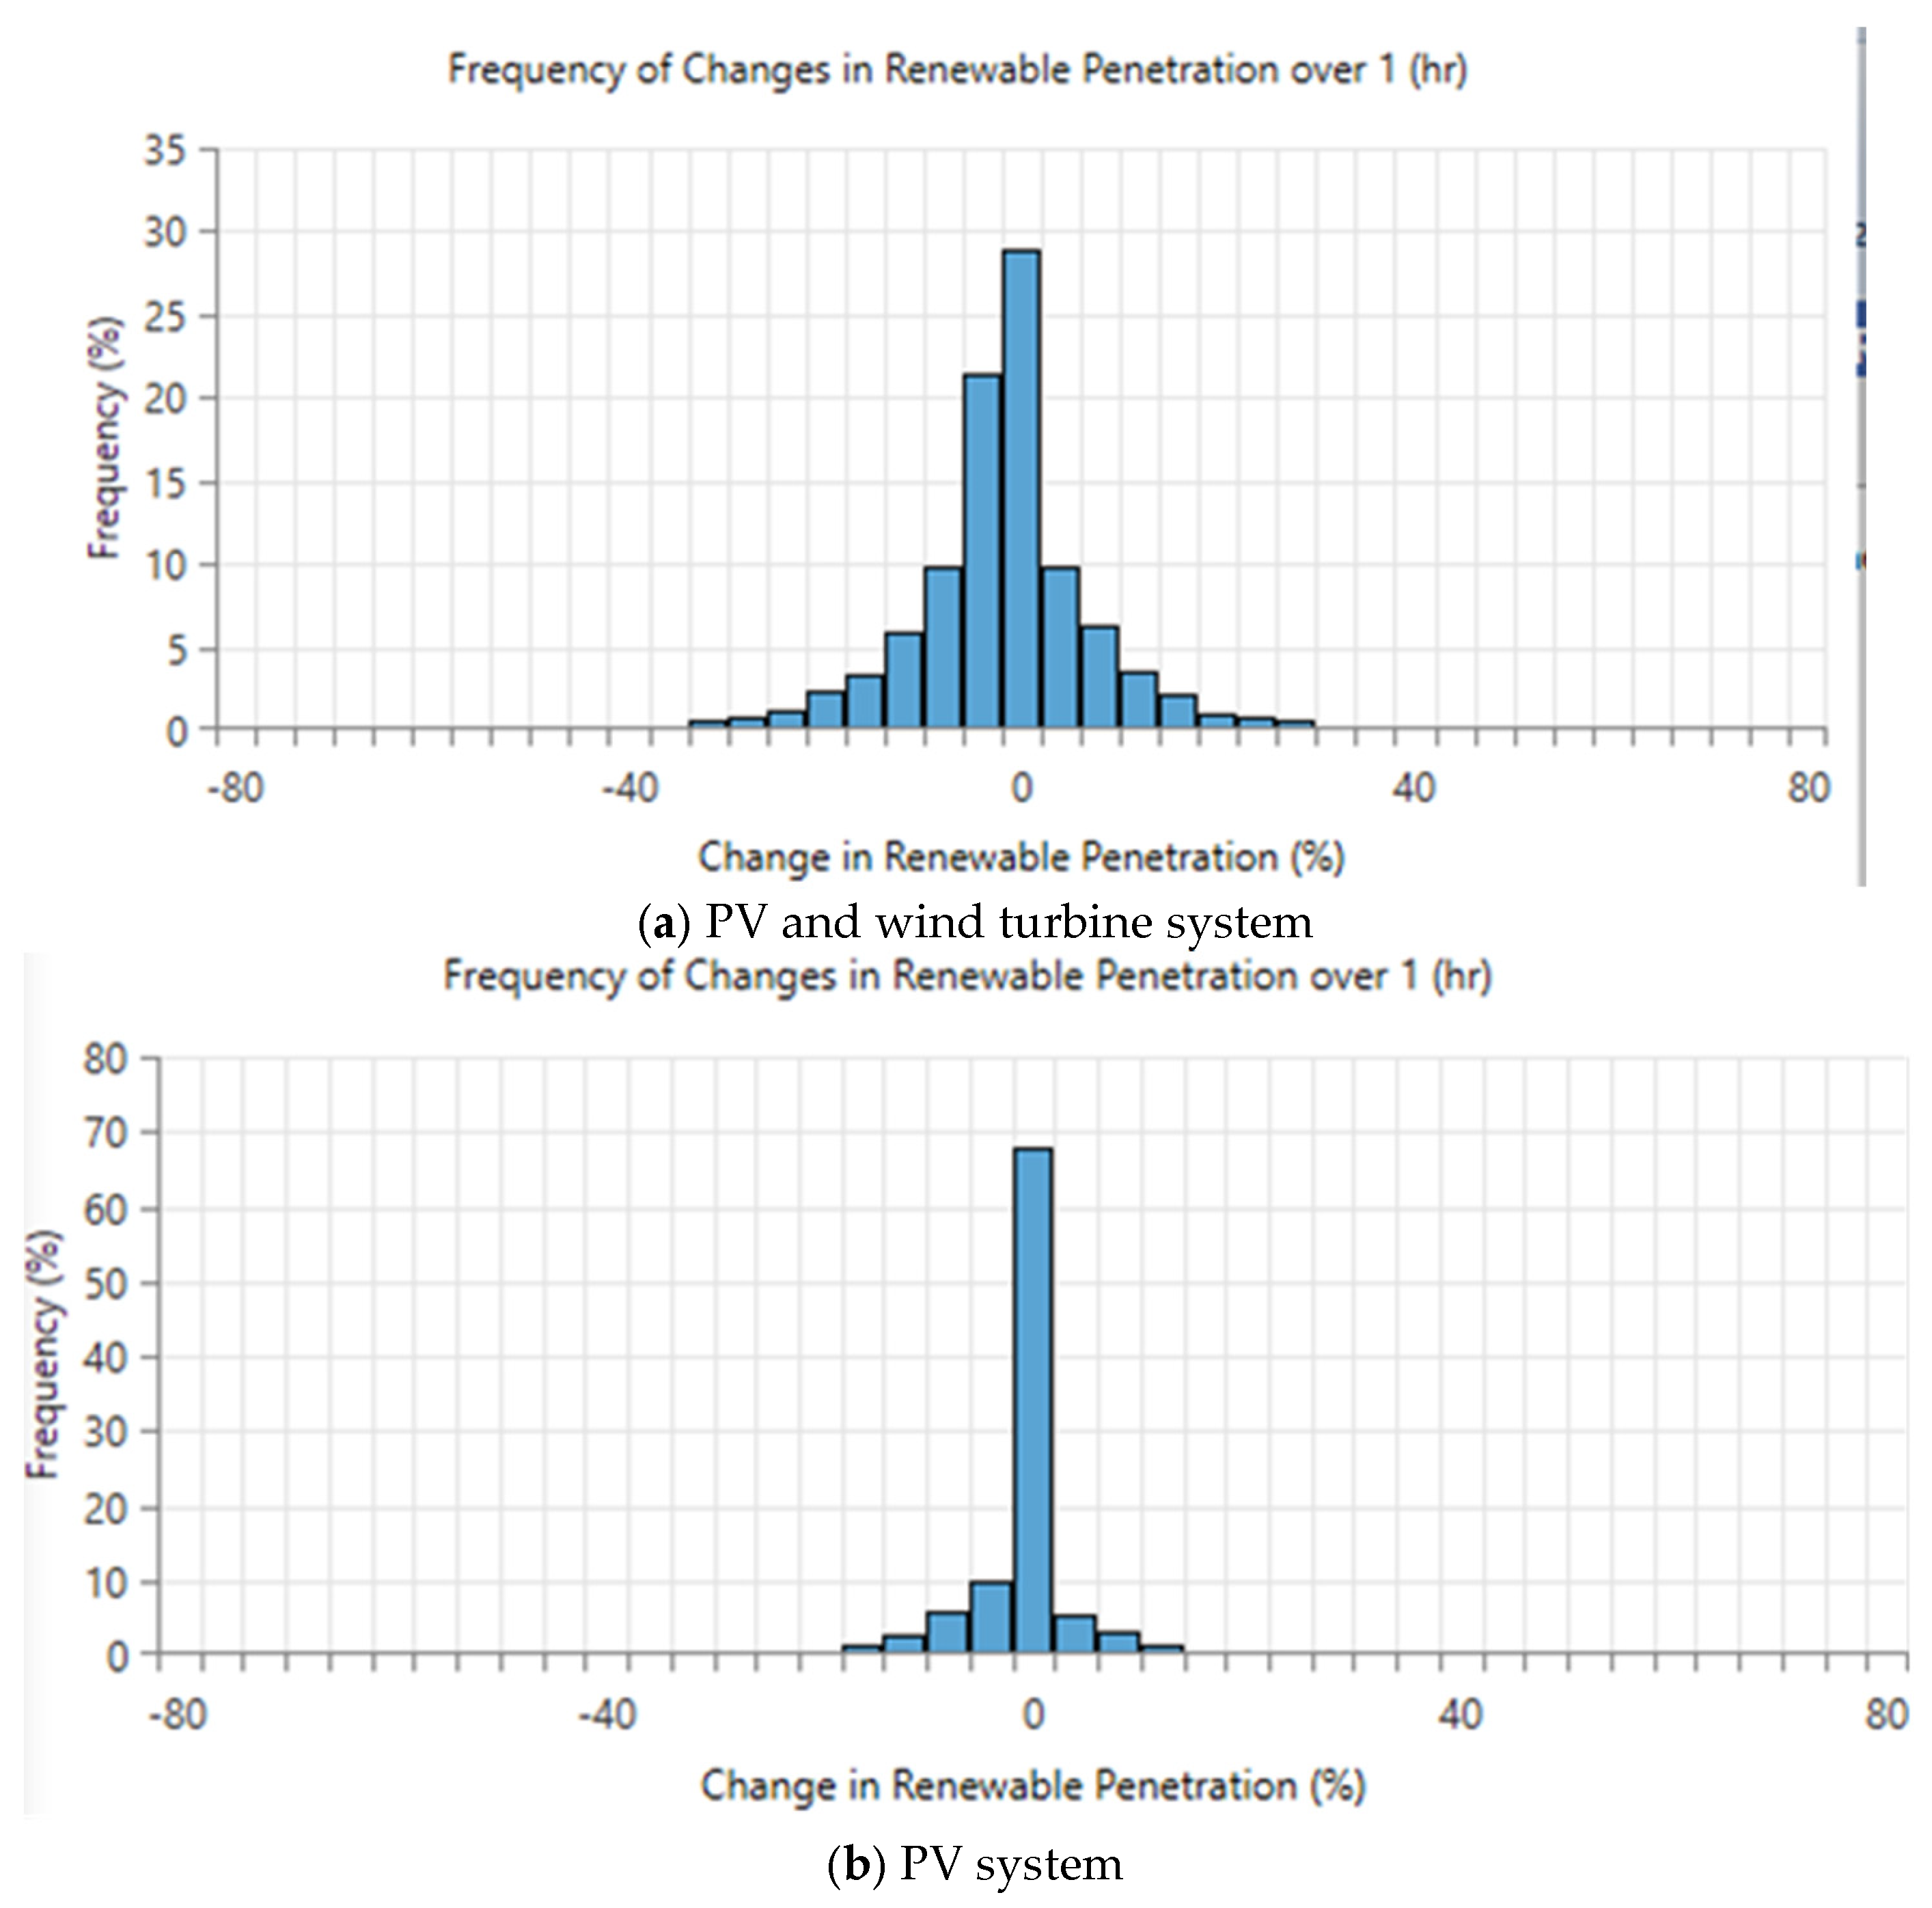
With photovoltaics alone, virtually 100% of the solar energy generated is used on site, yet this covers only 9–29% of total demand throughout the year and drives the grid-reliability index as high as 1704% during spring weekends—evidence of substantial seasonal mismatch. Electrically tying the treatment plant to the PV connection point absorbs part of the midday surplus and lowers the index by about 8%, but dependence on the external grid remains significant.
Supplementing the array with a 30 kW wind turbine nearly doubles the annual renewable fraction (from 8.5% to 17.9%), stretches green-energy availability into the evening hours, and reduces the levelized cost of electricity from 1.08 to 0.97 MAD kWh−1 while trimming the net present cost by roughly 6%. Hour-by-hour results confirm a smoother load match and a substantial improvement in grid reliability without breaching technical limits.
The self-production and grid-reliability indices were crucial for pinpointing when and why surpluses occur and for quantifying how effectively the hybrid configuration mitigates them. Given the favorable cost, performance, and ~48 t CO2 yr−1 emission savings achieved under Moroccan tariffs and wind regimes, similar PV–wind retrofits appear replicable for smart-building/WWTP pairs across the MENA region.
Future research should replace deterministic load profiles with stochastic or machine-learning demand models, extend the analysis to include life-cycle assessment and circular-economy criteria, and explore the added value of battery storage and demand-side flexibility under evolving tariff structures. These steps will further strengthen the design of robust, low-carbon energy solutions where water and energy systems are tightly intertwined.
