Article

Identification of Microplastic Accumulation Zones in a Tidal River: A Case Study of the Fraser River, British Columbia, Canada

by
Shahrzad Hamidiaala
1,*,
Golnoosh Babajamaaty
1,
Abdolmajid Mohammadian
1,*,
Abolghasem Pilechi
2 and
Mohammad Ghazizadeh
2
1
Department of Civil Engineering, Faculty of Engineering, University of Ottawa, Ottawa, ON K1N 6N5, Canada
2
National Research Council Canada, Ottawa, ON K1A 0R6, Canada
*
Authors to whom correspondence should be addressed.
Sustainability 2025, 17(19), 8591; https://doi.org/10.3390/su17198591
Submission received: 17 July 2025 / Revised: 9 September 2025 / Accepted: 17 September 2025 / Published: 24 September 2025
(This article belongs to the Section Sustainable Engineering and Science)

Abstract

Sustainable management of aquatic ecosystems requires effective strategies to monitor and mitigate microplastic pollution, particularly in vulnerable tidal river systems. Microplastic accumulation in these environments poses significant environmental risks, threatening biodiversity, ecosystem health, and long-term water quality. This study employs a three-dimensional hydrodynamic model (TELEMAC-3D—v8p5) coupled with a Lagrangian particle tracking model (CaMPSim-3D—v1.2.1) to simulate microplastic transport dynamics in the lower Fraser River, British Columbia, Canada. The model incorporates tidal forcing, riverine hydrodynamics, and mixing processes, and was validated with good agreement against observed water levels. This model provides a high-resolution representation of microplastic dispersion under varying release scenarios, including emissions from combined sewer overflows (CSOs) and wastewater treatment plants (WWTPs). A novel approach is proposed to identify microplastic accumulation zones using the OPTICS (Ordering Points to Identify the Clustering Structure) clustering algorithm. Accumulation zone locations remain spatially consistent despite variations in release volume. Persistent clusters occurred near channel constrictions and shoreline segments associated with flow deceleration. These findings demonstrate the robustness of the method and provide a systematic framework for prioritizing high-risk areas, supporting targeted monitoring and informing sustainable estuarine management.

1. Introduction

Plastics are indispensable materials worldwide due to their versatility and durability; however, this same durability raises significant concerns for environmental sustainability, as plastics persist in natural environments for extended periods, threatening ecosystems and human health. Among the various forms of plastics, microplastics have gained significant attention due to their widespread presence and potential environmental and health impacts. Microplastics are commonly defined as plastic particles smaller than 5 mm in diameter [1] and can be further classified based on their origin as primary or secondary. Primary microplastics are intentionally manufactured in small sizes for specific uses, such as in cosmetics and technology, while secondary microplastics result from the breakdown of larger plastic items [2].
The physical characteristics of microplastics, such as shape and density, play a crucial role in determining their behavior in aquatic environments. Common shapes include spheres, fibers, and films, each influencing settling velocity differently, which in turn affect the fate and transport of these particles [3]. Microplastic densities can vary significantly, from buoyant polystyrene at 0.05 g/cm3 to denser materials like polytetrafluoroethylene (Teflon) at 2.3 g/cm3 [4]. Over time, processes like biofouling and degradation can alter microplastics density and influence their transport and fate [5].
Microplastics are pervasive across air, soil, and water, with their small size enabling entry into food chains and potential accumulation in marine species, posing risks to both ecosystems and human health [6,7]. They have been linked to reduced feeding activity, impaired reproduction, and oxidative stress in aquatic organisms, as well as potential impacts on human health through seafood consumption [8,9]. Their aggregation in localized areas can disrupt water quality and threaten marine biodiversity. Rivers act as significant conduits for microplastics, with studies estimating that approximately 40% of microplastics in oceans originate from riverine sources [10]. Major contributors include combined sewer overflows (CSOs) and wastewater treatment plant (WWTP) discharges, which release plastic particles into river systems [11].
To support sustainable management of water resources and protect aquatic ecosystems, it is essential to understand the transport and accumulation of microplastics. Hydrodynamic modeling suites and particle tracking models constitute valuable numerical tools for analyzing their behavior. Hydrodynamic models simulate riverine flow field, providing insights into flow dynamics and supporting further analysis. One-dimensional models, such as MIKE 11 [12] and HEC-RAS [13], focus on river profiles and are commonly used for simulating water levels and flow along a river’s length. Two-dimensional models, like TELEMAC-2D [14], MIKE 21 [15], and TUFLOW [16], analyze horizontal flow patterns and are well-suited for floodplain mapping and simulating lateral flow variations. Three-dimensional models, including TELEMAC-3D [17], Delft3D [18], and FLOW-3D [19], provide detailed insights into both vertical and horizontal water dynamics, making them ideal tools for advanced applications such as particle tracking, sediment transport, and ecological modeling. For example, such a 3D modeling approach was recently used to simulate the hydrodynamic-driven transport and accumulation of microplastics in Dongting Lake, highlighting the importance of seasonal variations in flow regimes for understanding microplastics fate in complex fluvial-lacustrine systems [20].
Particle tracking models, coupled with hydrodynamic simulations, predict the transport and fate of microplastics. These models are particularly useful for inaccessible or challenging environments [21]. Lagrangian particle tracking models, such as PELETS 2D [22] and CaMPSim-3D [23,24], simulate individual particle trajectories by incorporating factors such as particle shape, density, and interactions with the environment. For example, CaMPSim-3D employs a systematic four-step process, point location, interpolation, advection-dispersion, and transformation to model the distribution and behavior of microplastics in aquatic systems effectively.
Clustering algorithms offer an additional analytical approach by identifying patterns and grouping microplastic accumulation zones in riverine systems. Despite advancements in integration of hydrodynamic and particle tracking models, the automated identification of microplastic accumulation zones remains a challenge. This study bridges this gap by combining advanced modeling techniques with the OPTICS [25] (Ordering Points to Identify the Clustering Structure) clustering algorithm, which leverages spatial datasets to uncover accumulation dynamics. OPTICS is a powerful density-based clustering method widely used in clustering. Unlike DBSCAN [26], which requires a predefined neighborhood radius, OPTICS adapts to varying data densities by analyzing reachability distances, making it particularly effective for identifying clusters in complex spatial datasets. By leveraging reachability and core distances, OPTICS provides valuable insights into the transport and accumulation of microplastics in riverine environments.
This study aims to demonstrate the application of the OPTICS algorithm as a novel approach to the enhanced identification of microplastic accumulation zones in riverine environments, contributing to improved environmental monitoring and supporting efforts toward sustainable water and ecosystem management. The methodology integrates hydrodynamic modeling, particle tracking, and OPTICS clustering technique. TELEMAC-3D software suite (v8p5) is used to simulate the hydrodynamics of the lower Fraser River, providing data on water velocity, surface elevation, and salinity. A Lagrangian particle tracking model, CaMPSim-3D (v1.2.1), predicts the fate and transport of microplastics under the pre-computed hydrodynamic conditions. Finally, the OPTICS algorithm clusters microplastic particles based on their specific positioning at a specific time step, providing a robust framework for identifying accumulation zones. This work underscores the potential of OPTICS as a novel approach for identifying microplastic accumulation zones, facilitating elaborate research on their behavior and transport in riverine environments. Similar studies in semi-enclosed coastal regions like the Gulf of Finland have also employed 3D particle tracking models to reveal stable accumulation zones under different emission and hydrodynamic conditions [27]. Globally, research on microplastic transport in rivers and estuaries has expanded rapidly, with recent studies highlighting accumulation patterns in systems such as the Gulf of Finland, the Dongting Lake estuary, and other semi-enclosed basins. Despite this growing body of work, systematic approaches for hotspot identification in tidal rivers remain limited. The Fraser River, one of the largest rivers on the Pacific coast of North America, is highly vulnerable to microplastic inputs due to multiple CSOs and WWTP discharges, yet few studies have examined its microplastic transport dynamics or potential accumulation zones. Providing both a local case study and a methodological advance, the present work addresses this gap by integrating hydrodynamic modeling, particle tracking, and clustering analysis. This study develops and tests a workflow that (i) simulates three-dimensional hydrodynamics in the lower Fraser River, (ii) tracks neutrally buoyant microplastic particles from CSO and WWTP sources, and (iii) identifies accumulation zones using the OPTICS clustering algorithm. Section 2 details the study area, hydrodynamic model configuration and verification, grid sensitivity, particle tracking formulation, clustering method, and release scenarios. Section 3 reports the combined modeling results and the identification of stable accumulation zones. Section 4 concludes with the main findings and their implications for microplastic pollution mitigation.

2. Methodology

The methodology integrates hydrodynamic modeling, particle tracking, and density-based clustering to track microplastic movement in the Fraser River and identify accumulation zones. The methodology follows a three-step process: hydrodynamic modeling, particle tracking modeling, and clustering analysis. The subsequent subsections provide detailed descriptions of each component, explaining the configured models, algorithms, and approaches used.

2.1. Study Area

This study focuses on the lower stretch of the Fraser River, one of the largest freshwater sources in British Columbia, Canada. Originating from Fraser Pass in the Rocky Mountains, the river flows over 1370 km before emptying into the Strait of Georgia [28]. The selected study area spans over a 35 km section of the lower Fraser River, extending from Douglas Island to the river’s mouth at the Strait of Georgia. This region is particularly vulnerable to microplastic pollution due to the proximity of rapidly growing urban centers and industrial activities. The Fraser River has been the subject of various hydrodynamic studies due to its ecological and hydrodynamic significance. For example, UMA [29] used MIKE 11 to simulate the flood profile of the river, evaluating flood risks and proposing measures to mitigate associated damages. Additionally, three-dimensional modeling studies, despite being computationally expensive, have been conducted to provide valuable insights into hydrodynamic processes such as particle tracking. For instance, [30] developed a MIKE3 FM model to calculate salinity across vertical layers, accounting for the influence of tidal forces and the mixing of saline ocean water with freshwater [30]. Previous research and our model results confirm that the tidal dynamics and flow velocities in the lower Fraser River enable the dispersion and downstream transport of particles originating from combined sewer overflows and wastewater treatment plant discharges. Such studies underscore the Fraser River’s hydrodynamics and its role as a critical conduit for urban wastewater and stormwater discharges. The Fraser River exhibits significant seasonal variations in discharge, with peak flows occurring during late spring and summer [31]. These dynamic hydrodynamic conditions, combined with the river’s ecological importance and its role as a conduit for wastewater and stormwater discharges, make it an ideal case study for analyzing microplastic transport and accumulation. In addition to hydrodynamic investigations, previous work has examined the presence and transport of microplastics in the Fraser River. Field studies have reported microplastic contamination in river water [32] and in sediments of the lower reaches [33], highlighting the persistence of plastics in both the water column and depositional environments. Other research has emphasized the role of combined sewer overflows as a key source of microplastics to the river system [11]. More recently, numerical modeling approaches have been applied to this system, with clustering-based analyses used to detect accumulation zones [34]. Together, these works establish the Fraser River as a critical site for microplastic research, while also underscoring the need for advanced, high-resolution modeling to improve hotspot identification under tidal forcing. CSOs and WWTPs in the lower Fraser River are, thus, known to contribute microplastic discharges; however, quantitative estimates of these inputs vary across studies and were not directly incorporated in this modeling framework. The Fraser River exhibits strong seasonal discharge variation, with peak flows during late spring and summer due to snowmelt, and reduced flows in winter. These seasonal differences influence river hydraulics and particle transport potential.

2.2. Hydrodynamic Model

A three-dimensional hydrodynamic model of the Fraser River was developed using TELEMAC-3D (v8p5), a widely recognized modeling tool created by Electricité de France [17]. TELEMAC-MASCARET supports 1-, 2-, and 3-dimensional hydrodynamic modeling and is extensively used for simulating complex hydrodynamic processes. In 3D hydrodynamic model, the following continuity and momentum equations under the hydrostatic pressure assumption are utilized [35]:
u x + v y + w z = 0
u t + u u x + v u y + w u z = g Z s x + ν u + F x
v t + u v x + v v y + w v z = g Z s y + ν v + F y
p = p a t m + ρ 0 g Z s z + ρ 0 g z Z s ρ ρ 0 d z
S t + u S x + v S y + w S z = d i v v S + Q
ρ = ρ r e f [ 1 750 S × 10 6 ]
For three-dimensional hydrodynamic models under the hydrostatic pressure assumption, Equations (1)–(6) are utilized [35]. Equation (5) specifically calculates the density of the tracer. In these equations, u , v , and w denote flow velocities in the x , y , and z directions, respectively. Parameter t represents time, g is gravitational acceleration, and ρ is density, with ρ r e f (i.e., 1025 kg/m3 in TELEMAC-3D to represent the density of freshwater) as the reference density. p refers to pressure, Z s is the free surface elevation, and ν is kinematic viscosity. F x and F y are source terms, while S represents salinity, and Q is the tracer source or sink term. Equation (6) calculates the density of water based on salinity. Since the study deals with low concentrations of microplastic particles, their impact on water density is negligible and, therefore, ignored in the governing equations.
The computational mesh for this study was generated using OceanMesh2D (v6.0) [36] open-source MATLAB code, executed in MATLAB R2024b. This advanced meshing suite is designed for the generation of high-quality, unstructured grids for hydrodynamic modeling. The software allows controlled flexibility in defining the resolution and grading of the mesh to capture complex riverine features effectively. The mesh candidates for this study were generated with varying resolution parameters to evaluate the sensitivity of hydrodynamic results to mesh refinement. The final computational mesh consists of 30,883 nodes and 55,632 elements, with 15 vertical layers resulting in 463,245 and 834,480 total grid points and triangular elements, respectively. The vertical layering scheme allows for accurate representation of stratified flow dynamics in the lower Fraser River. The outline shapefiles for mesh generation were sourced from the Government of British Columbia’s official website [37], and the geographic coordinate system used was NAD 1983 UTM Zone 10N. Bathymetry data, referenced to Chart Datum, were interpolated onto the base mesh using the Inverse Distance Weighted (IDW) method. Figure 1 illustrates the selected mesh, with bottom elevations represented by different colors.
In the Fraser River, a full spring-neap tidal cycle occurs every 14.76 days [38]. To capture these tidal dynamics, this study analyzed two complete tidal cycles. The model was initialized with an 11-day warm-up period, followed by a 30-day simulation, all together from 21 October 2019, to 30 November 2019. This period was selected because observed water level and discharge data were available for calibration, and the flow conditions represent a moderate stage between freshet and low-flow extremes. Such conditions provide hydrodynamic stability that allows clearer evaluation of tidal–river interactions and accumulation processes. Although spring freshet flows can reach higher magnitudes, potentially altering transport pathways, the present study focused on autumn conditions as a representative baseline scenario. Seasonal extensions will be an important next step for future research.
In hydraulic engineering, Manning’s roughness coefficient (denoted by n ) is used to characterize the resistance to flow in open channels. In hydraulic models of large riverine systems like the Fraser River, Manning’s coefficient varies depending on local channel conditions. Typical values for large natural rivers with varying roughness range from 0.025 to 0.045, depending on sediment load, vegetation, and channel geometry. According to [39], a Manning’s n value of 0.03 is representative of clean, straight channels without significant obstructions or pools. While the Fraser River exhibits complex morphology, including meandering and braided sections, a sensitivity analysis was conducted to evaluate the influence of different roughness coefficients on the hydrodynamic model’s performance. The results indicated that a value of 0.03 provided the best alignment with observed water levels, particularly in sections of the river with smoother flow conditions. The methodology and detailed results of this analysis are discussed in Section 3.
TELEMAC provides multiple turbulence modeling options to simulate flow dynamics with varying levels of complexity and accuracy: Constant Eddy Viscosity, Constant Horizontal Eddy Viscosity, and k ϵ . The Constant Eddy Viscosity model assumes a uniform turbulence value across both horizontal and vertical directions, providing a simplified representation of turbulence [40]. The Constant Horizontal Eddy Viscosity model, on the other hand, applies a constant value only in the horizontal plane while allowing a separate treatment of vertical turbulence [41]. Finally, the k ϵ turbulence model is a widely used two-equation closure model that predicts turbulence by solving equations for turbulent kinetic energy (denoted by k ) and its dissipation rate (denoted by ϵ ) [42]. This model accounts for energy transfer and dissipation, making it particularly suitable for complex flows in riverine systems, and is widely used and validated in similar contexts [40], making it generally more accurate than the aforementioned methods; thus it is used in this investigation.
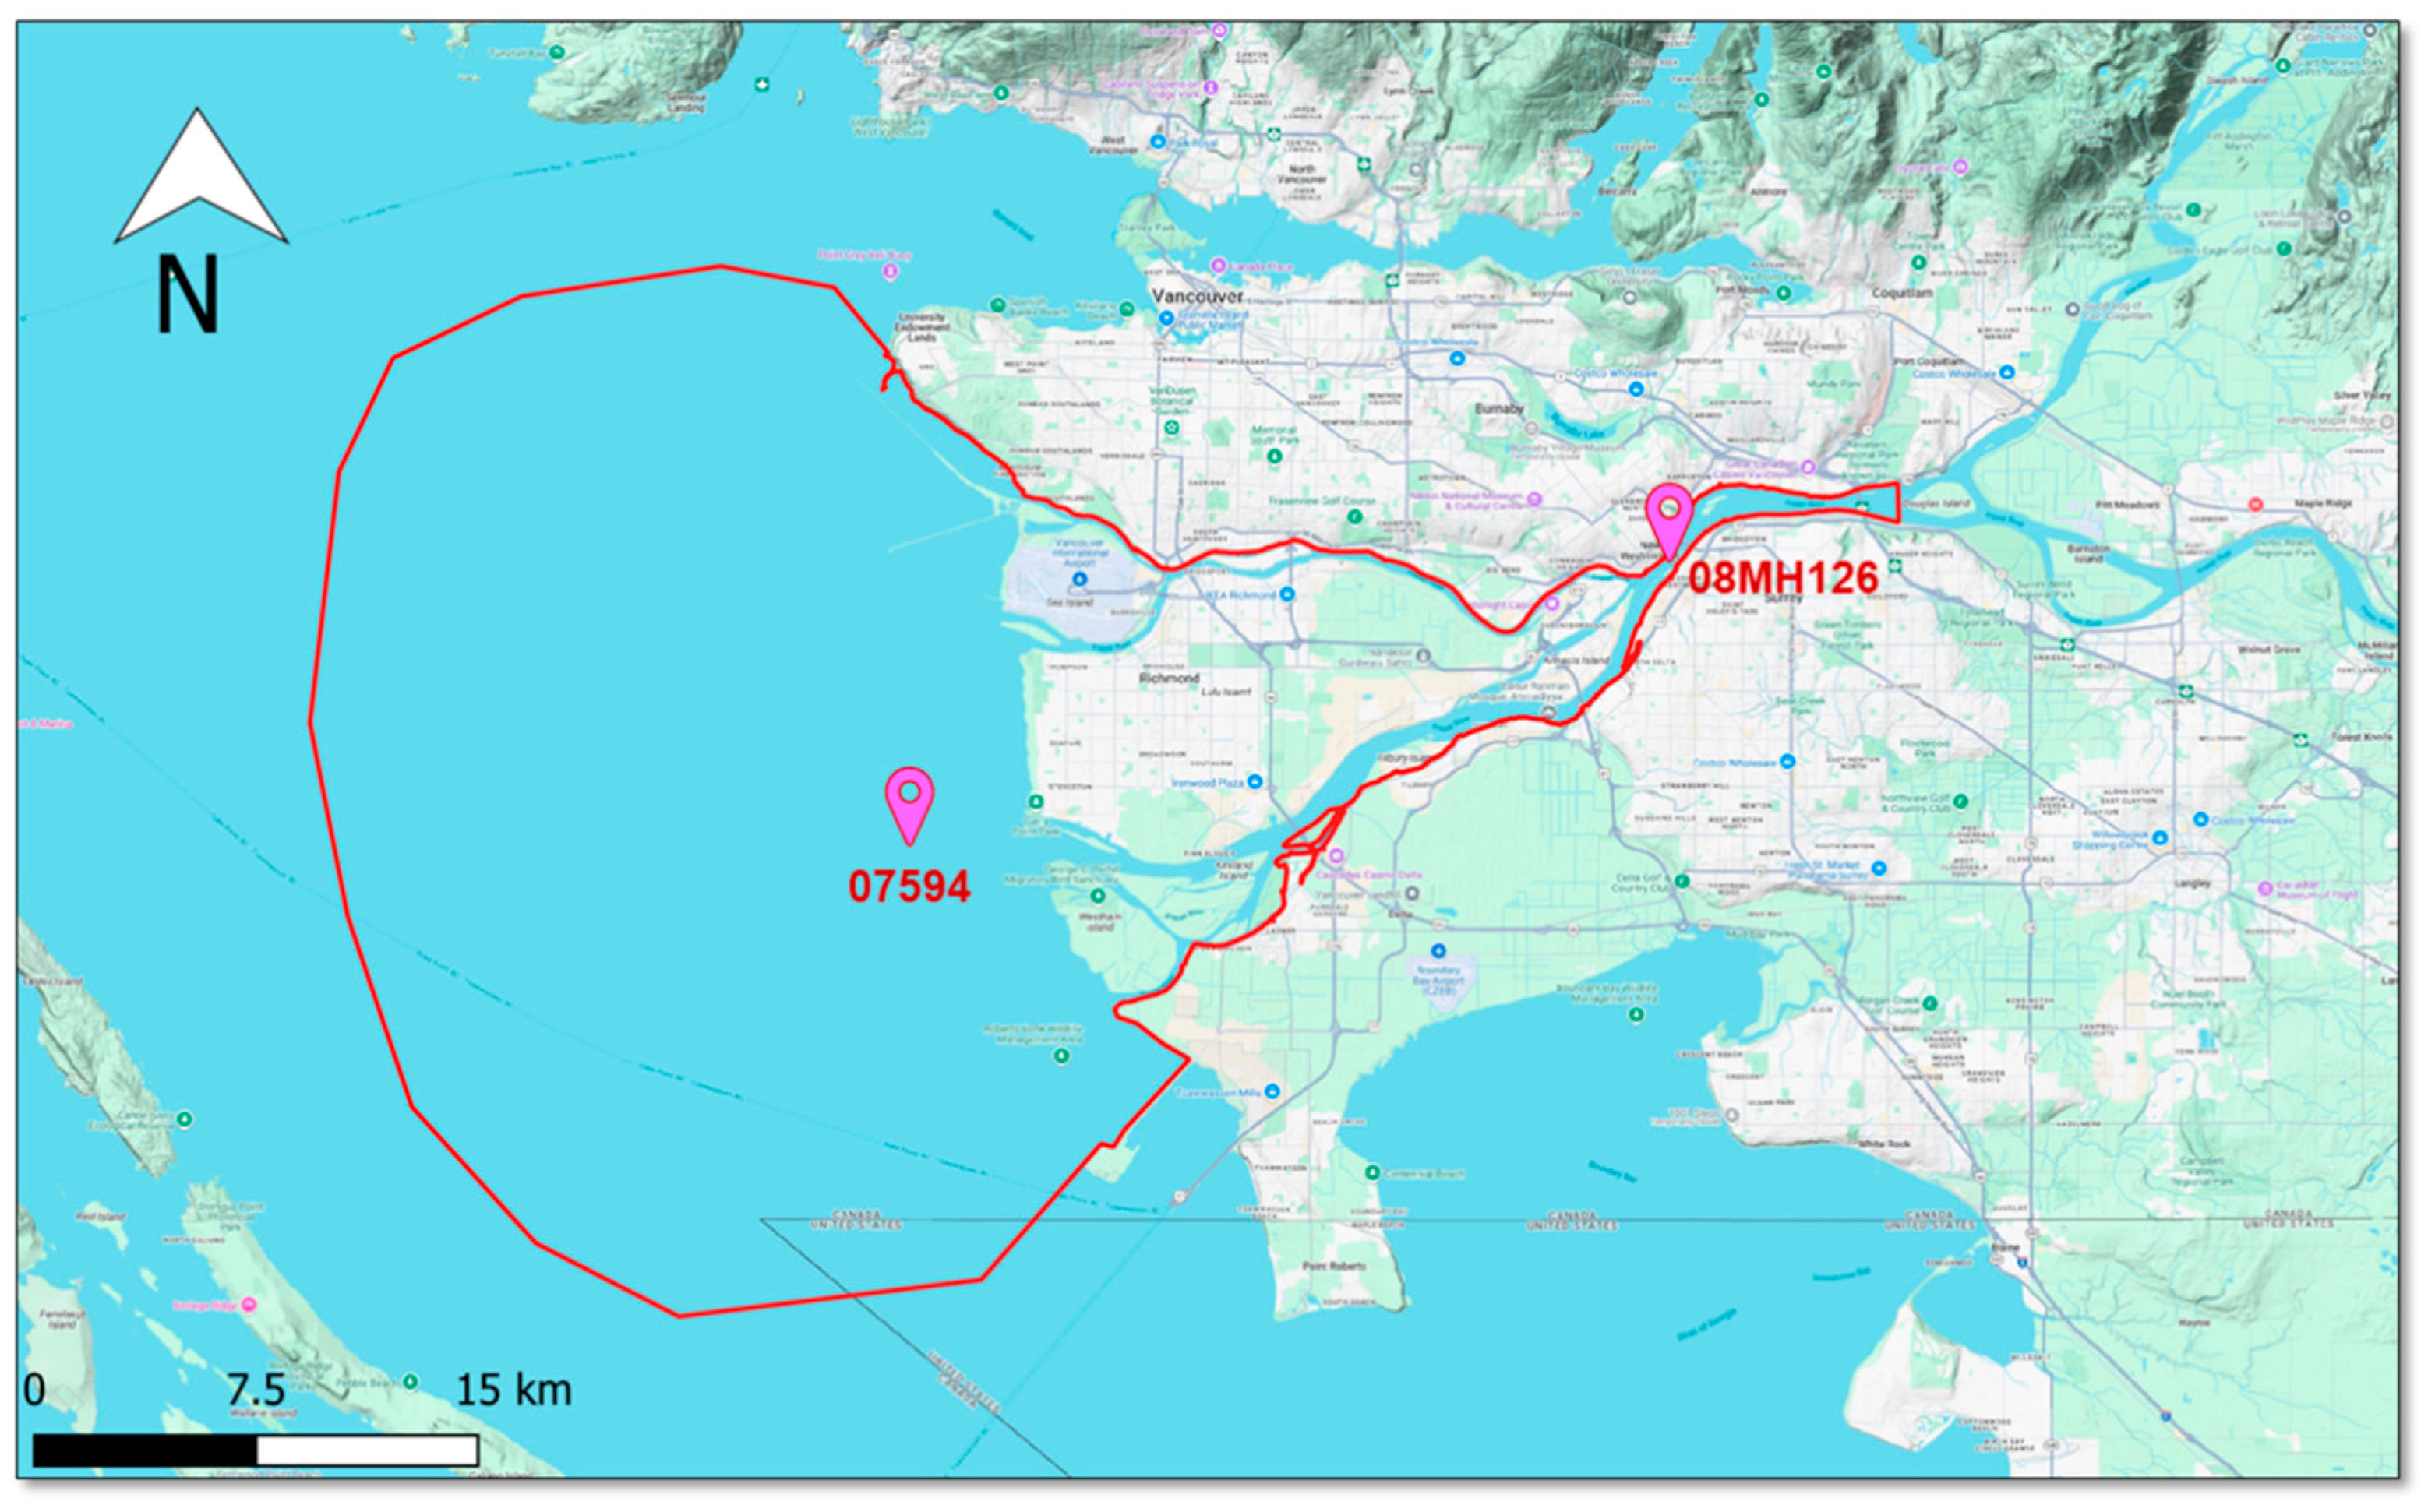
As discussed earlier, the study area is influenced by tidal forces, and the downstream boundary lies within saline waters. A study by [43] measured salinity levels at different stations along the lower Fraser River. Their findings indicate that salinity near the downstream boundary reaches 30 ppm, while salinity at Annacis Island is approximately zero. Based on this finding, the upstream boundary was set near Douglas Island. The boundary conditions for the hydrodynamic model input were developed using discharge data from the Port Mann Pumping Station (08MH126) and water level data from the Sand Heads station (07594). These datasets were retrieved from the Government of Canada’s Water Office [44] and Tides, Currents, and Water Levels [45] online data repositories, respectively. The geographical extent of the domain and the locations of the discharge and water level stations are shown in Figure 2.

2.3. Particle Tracking Model

Several numerical models have been developed to simulate the transport and fate of microplastics in aquatic systems, each with varying levels of complexity and application focus. Among these, TrackMPD [47] is a notable 3D modular framework capable of simulating a wide range of physical processes, including advection, diffusion, sinking, windage, biofouling, beaching, and degradation. Other models such as Ichthyop v3.3 [48] and ARIANE [49] have been widely used in oceanographic contexts, although their applicability to complex riverine or estuarine domains is limited by their reliance on structured grid hydrodynamic models and reduced support for nearshore dynamics. FVCOM-PTM [50] represents an attempt to couple particle tracking with unstructured grid models but requires interpolation between separate numerical frameworks. While these tools provide valuable insights in coastal and open ocean settings, they are often less suited for morphologically complex, tidally influenced rivers. In this study, we applied CaMPSim-3D (v1.2.1) [23], a customizable high-performance pathline-based particle tracking model which is designed to operate seamlessly with TELEMAC-3D outputs. CaMPSim-3D enables Lagrangian tracking in three dimensions and incorporates vertical transport mechanisms, allowing for detailed analysis of accumulation behavior in tidally influenced riverine environments such as the Fraser River. The model leverages the CaMPSim-3D framework, which utilizes pre-computed hydrodynamic outputs from TELEMAC-3D as input data for particle trajectory calculations. The Eulerian component provides the hydrodynamic velocity fields, while the Lagrangian component tracks the paths of discrete particles. The Lagrangian component tracks the individual trajectories of discrete particles, accounting for both deterministic and stochastic processes. Deterministic motion is governed by the advection of particles through interpolated velocity fields, while stochastic motion accounts for turbulent diffusion, simulated using a random walk approach. This dual-component design allows the model to capture fine-scale particle dynamics while maintaining computational efficiency through the use of efficient algorithms. CaMPSim-3D simulates particle displacement at each time step using Equation (7) that incorporate advective and diffusive movement [23]:
x t n + 1 = x t n + u x t n , t n t + ζ t n 2 D t
where x t n is the position vector of a particle at time t n , u x t n ,   t n represents the velocity field interpolated at the particle’s location, t is the hydrodynamic time step, D is the diffusion tensor, and ζ t n is a normally distributed random vector with zero mean and unit variance.
Advection is modeled by solving the velocity interpolation at each time step, while diffusion is treated using a random walk approach. The interpolation is based on the Inverse Distance Weighting (IDW), ensuring smooth transitions in velocity fields across triangular prism elements of the mesh [23]. CaMPSim-3D employs a ray tracing algorithm to track particles within the unstructured mesh. This algorithm calculates the time for a particle to intersect the facets of its hosting triangular prism and updates its position accordingly. This particle tracking framework has been rigorously validated against analytical solutions and benchmark test cases [23,50], demonstrating its accuracy and reliability in predicting particle motion in dynamic hydrodynamic systems.
The diffusive term in Equation (7) uses the naïve random walk model, unlike, e.g., [50] which included turbulent random walk. This assumption is intentional and appropriate for the present study, which focuses on large-scale horizontal dispersion and spatial accumulation patterns of neutrally buoyant particles in a domain with complex geometry where advection is the dominant method of transport. This aligns with the scope of this work, which emphasizes surface clustering behavior rather than vertical stratification or near-bed transport.

2.4. Clustering Algorithm

The final step in the methodology involves identifying the zones where microplastic particles accumulate. As mentioned previously, the accumulation zones were detected using a clustering algorithm designed to identify spatial clusters of microplastics. For this study, the OPTICS [25] algorithm was employed was implemented using Python (v3.13.0) with the Scikit-Learn library (v1.5.2) [51]. This density-based clustering algorithm determines clusters by analyzing the density of points in a dataset, making it highly effective for identifying accumulation zones of microplastics in riverine environments.
While clustering algorithms such as k-means [52,53] and DBSCAN [26] are commonly used, they each carry limitations in dynamic, spatially heterogeneous environments. K-means assumes spherical clusters and requires the number of clusters to be specified a priori, which is inappropriate for organically formed accumulation zones with unknown shapes and counts. DBSCAN improves upon this by using a density-based approach, but still depends on a single global neighborhood radius, making it less adaptable to datasets with spatially varying particle concentrations. In contrast, OPTICS constructs a reachability plot that captures the hierarchical density-based structure of the dataset. This makes it especially well-suited for identifying microplastic convergence zones in tidally influenced rivers, where flow-induced variability leads to complex patterns of particle accumulation. OPTICS’s ability to adapt to multi-scale density variations without rigid parameterization provides a robust foundation for consistent cluster detection across different release scenarios in this numerical investigation.
The prepared input dataset consisted of particle spatial coordinates (easting and northing) extracted from CaMPSim-3D simulation output files. As part of the data preparation process for clustering, particles with x-coordinates less than 485,950 m (in UTM Zone 10N) were excluded from the dataset. These particles were considered to have drifted into the open water and were therefore outside the scope of the study’s objective of identifying microplastic accumulation zones in the domain. The remaining particles were then used as input for the clustering process.
A series of sensitivity analyses were conducted to evaluate the sensitivity of detected microplastic accumulation zone locations to the number of total particles released in the domain. While the release points remained the same for all scenarios, the number of particles dispersed to the river at each point was progressively increased to assess the sensitivity of accumulation zone identification by OPTICS clustering algorithm to this parameter. For each clustering process, the parameters of the OPTICS algorithm, such as minimum cluster size (i.e., the fraction to be considered of the total number of particles in the dataset), minimum number of samples (i.e., defining the minimum number of neighboring points required for a point to qualify as a core point), maximum neighborhood distance (i.e., representing the maximum distance within which points could be considered neighbors), and cluster steepness threshold (i.e., determining the minimum relative change in reachability distance required to form a new cluster boundary) were tuned to align with the spatial distribution of particles in each scenario. This systematic approach ensured that the clustering algorithm accurately identified meaningful accumulation zones for each release scenario. Noise points and un-clustered data (i.e., points not belonging to any cluster) were excluded by filtering out results with negative cluster labels.
The identified clusters, containing the spatial coordinates and cluster IDs for particles within each cluster, were imported into QGIS [46], an open-source Geographic Information System platform, for advanced visualization and spatial analysis. Each cluster was color-coded to distinguish between identified accumulation zones for each release scenario.

2.5. Source Identification and Release Scenarios

The study area includes both residential and industrial regions, increasing its risk of microplastic pollution sourced from various CSOs and WWTPs. The microplastic release points used in this study were selected based on documented infrastructure locations provided in a publicly available report by Metro Vancouver [54], which outlines the geographic positions and discharge activities of CSOs and WWTPs in the lower Fraser River. These points comprise seven CSOs (Glenbrook, New Westminster, Borden, South Hill, Manitoba, Angus, and MacDonald) and two WWTPs (Annacis Island WWTP and Lulu Island WWTP) stretching from Douglas Island to the Strait of Georgia. It should be noted that CaMPSim-3D models particles as non-interacting entities. Due to limited computational memory and processing limitations, only nine release points were selected to study the fate and transport of microplastic particles in the Fraser River. Previous studies have documented the presence of microplastics in the Fraser River, reporting their occurrence in both water and sediment samples [32]. Discharges from CSOs and WWTPs are recognized as key contributors, with loads likely varying seasonally in response to precipitation and river flow [11]. As no systematic field dataset of microplastic fluxes is available for all discharge points, the present work employs synthetic release scenarios designed to evaluate the transport and accumulation dynamics under different particle counts, rather than to reproduce absolute environmental concentrations.
As mentioned in the previous sub-section, these scenarios were designed to evaluate the sensitivity of microplastic accumulation zones to the number of particles released in the domain. Four release scenarios were designed, i. release of 30,000, ii. 40,000, iii. 50,000 and iv. 60,000 microplastic particles with neutral buoyancy at each CSO and WWTP source point. At a consistent timestep across all the results of these scenarios, the tuned OPTICS algorithm was applied to the particle coordinates. This approach ensured a systematic analysis of particle dynamics under varying number of particles. The release locations are schematically illustrated in Figure 3.

3. Results and Discussion

Hydrodynamic modeling is computationally intensive and requires balancing accuracy with efficiency. In this study, sensitivity analyses were conducted on Manning’s roughness coefficient and mesh resolution to evaluate their influence on model performance. These parameters directly affect simulated surface elevation and velocity fields, which in turn control particle transport and accumulation patterns. The analyses were used to determine an optimal configuration that provided reliable hydrodynamic outputs while keeping computational costs manageable. The following sections present the results of these sensitivity tests and discuss their implications for model robustness, as well as the clustering outcomes obtained from different release scenarios.

3.1. Grid Sensitivity Analysis and Mesh Selection

A comprehensive grid sensitivity analysis was conducted to ensure that the hydrodynamic simulation results were independent of the computational mesh resolution. As mentioned earlier, the reference mesh employed in this study consisted of 463,245 grid points, ensuring detailed representation of the river geometry and complexities along the coastline. The mesh gradation, controlling the smoothness of element size transitions within the computational mesh and commonly adopting values between 0.1 and 0.15, was set to 0.13 to ensure smooth transition in triangular elements across the domain, preventing abrupt changes that could otherwise lead to interpolation errors or numerical instabilities. Sensitivity to mesh resolution was evaluated using two additional grids (532,710 and 422,730 nodes), with their specifications summarized in Table 1. The corresponding hydrodynamic and clustering results are presented below.
The inter-comparison of hydrodynamic results obtained from these three grids, illustrated in Figure 4 demonstrated negligible to no difference in the key hydrodynamic output for this study (i.e., water surface elevation). This confirms that the results are mesh-independent, and the selected reference mesh is considered adequate for subsequent simulations while maintaining computational efficiency.

3.2. Hydrodynamic Model Calibration

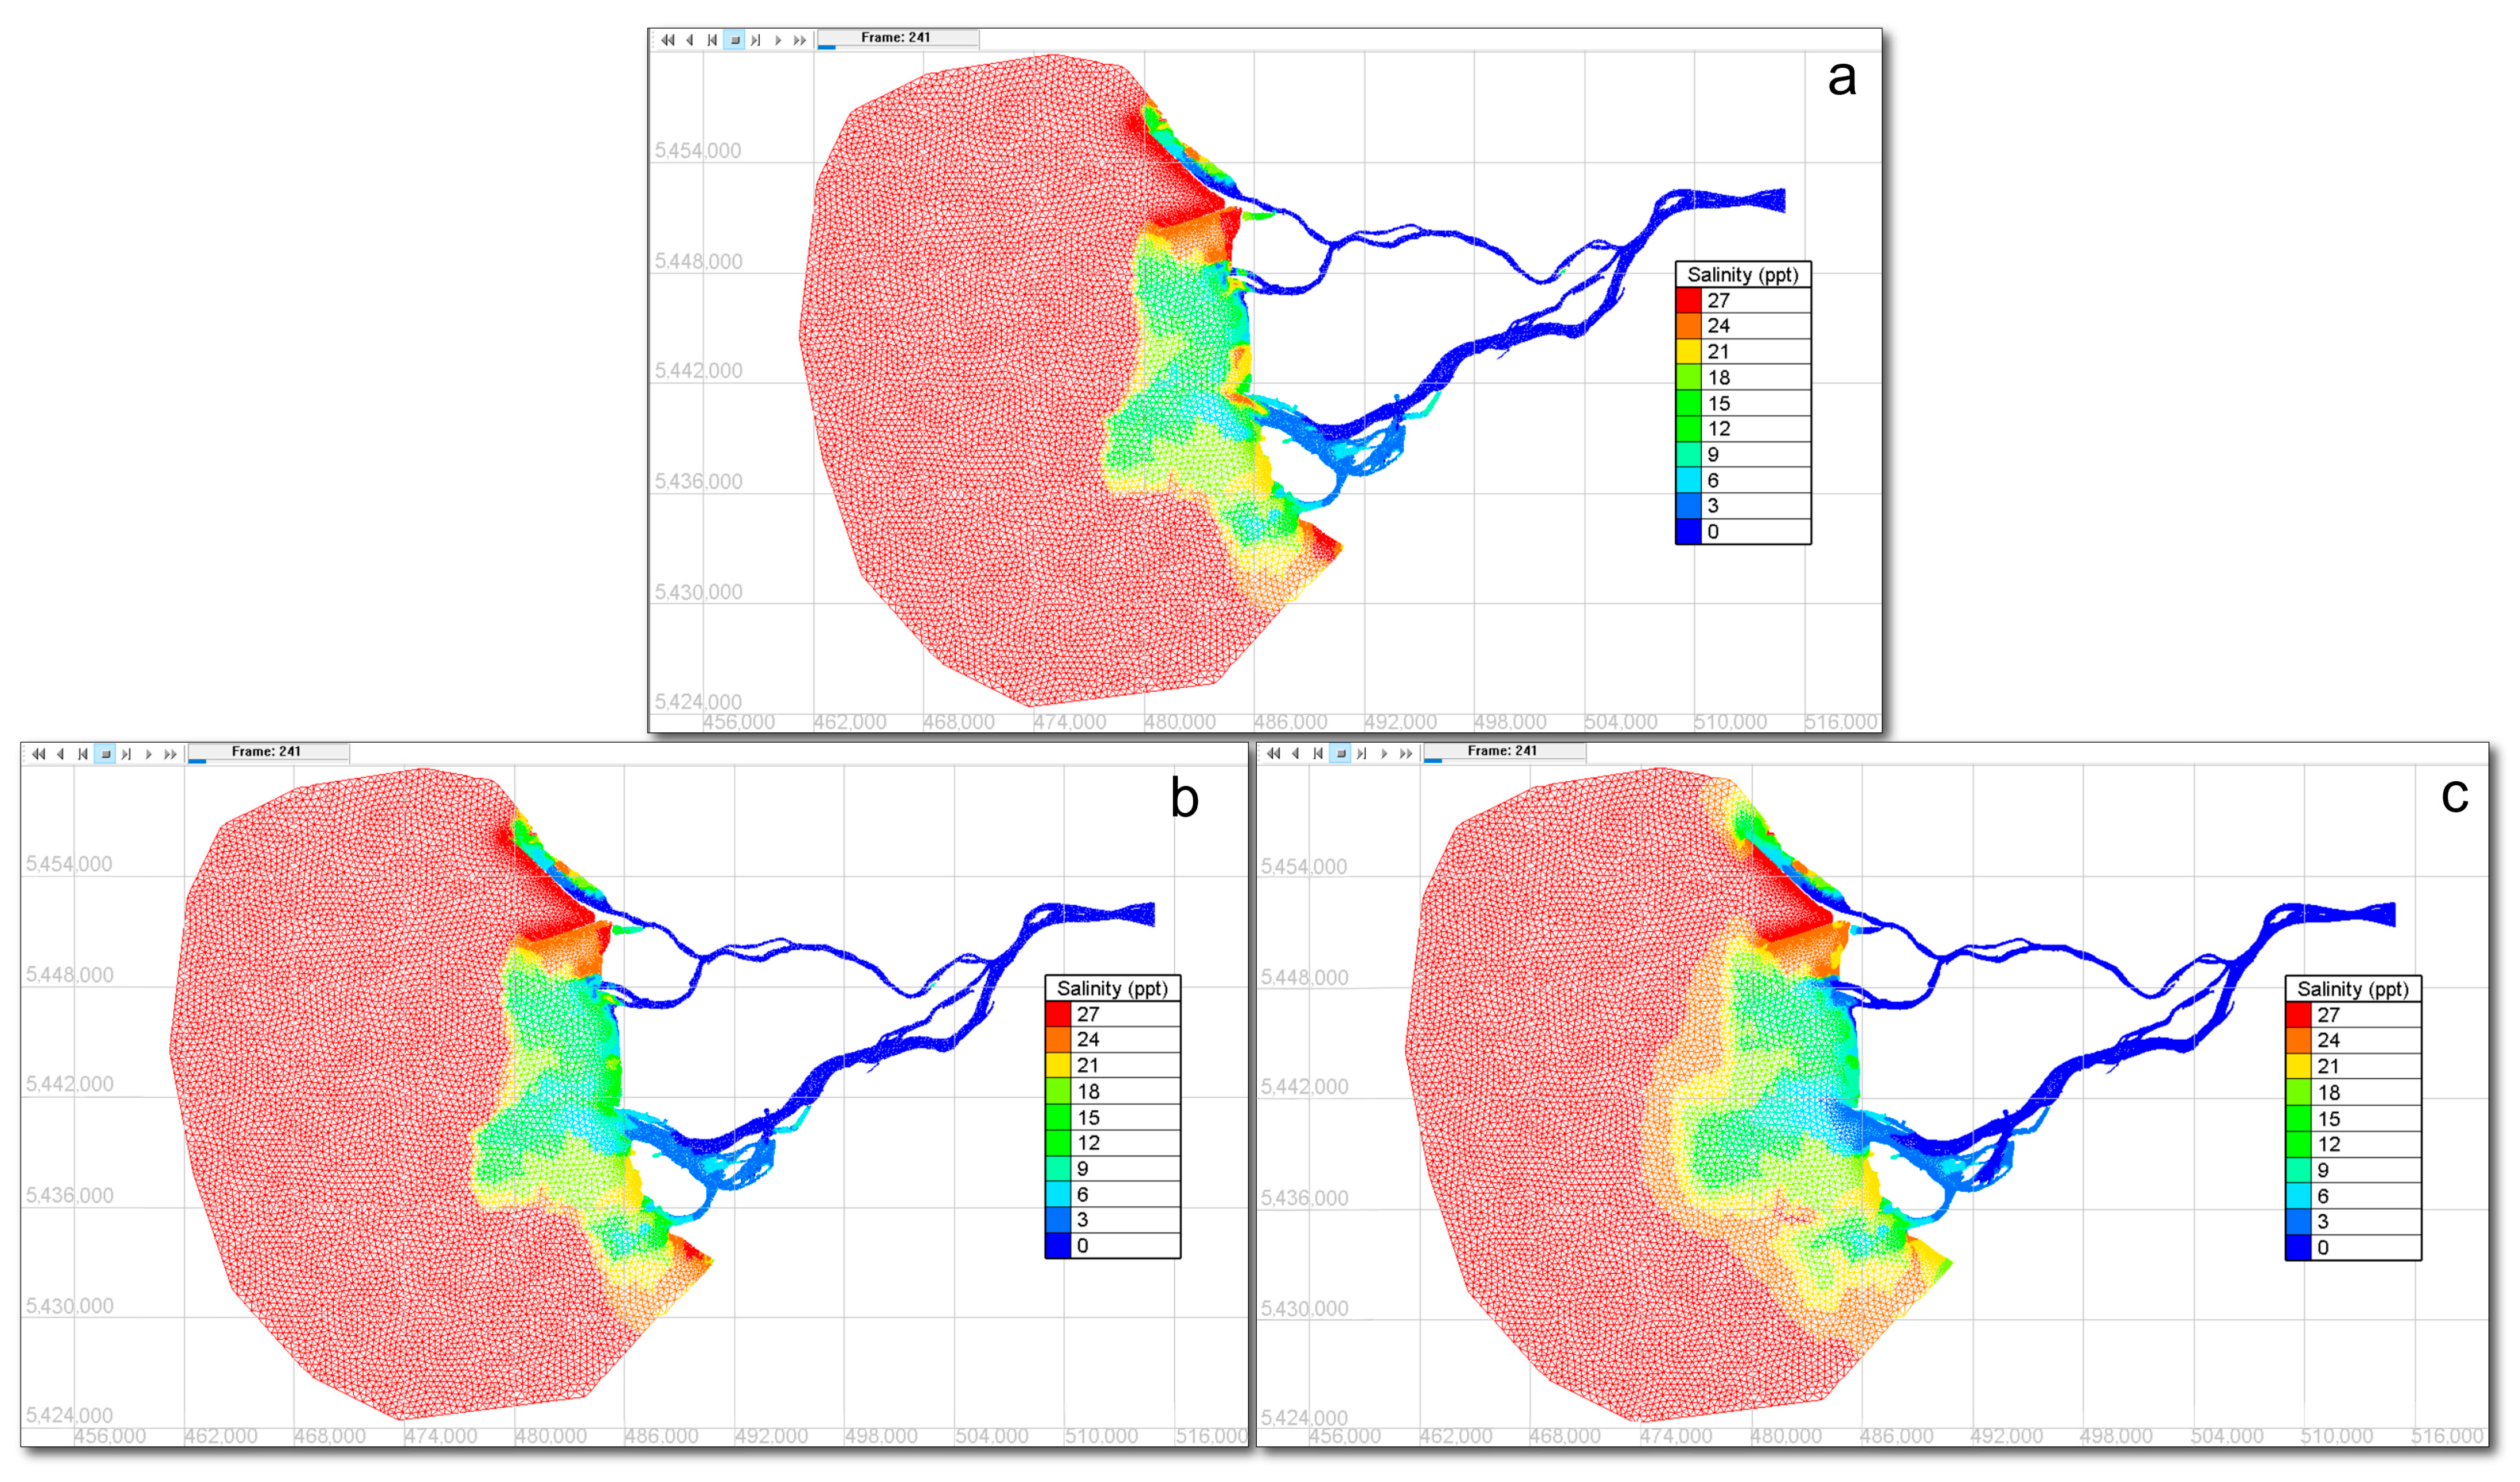
This section presents a detailed discussion of the hydrodynamic model calibration, followed by the validation of the predicted water level values. Although TELEMAC-3D is a well-established model, its application to this domain, especially in three dimensions, required careful calibration to accurately reproduce the tidal dynamics and salinity-driven stratification that strongly influence particle transport. Quantitative performance statistics are presented later in this section (RMSE, MAE, R2), confirming the model’s skill in reproducing observed water levels. As the hydrodynamic output serves as the Eulerian input for the coupled particle tracking simulations, achieving realistic flow fields and vertical salinity gradients is essential. Captured contours of the salinity field in layers 1, 8, and 15 for 26 October 2019 are shown in Figure 5, clearly demonstrating the three-dimensionality of the salinity distribution and the influence of tidal forces on the system.
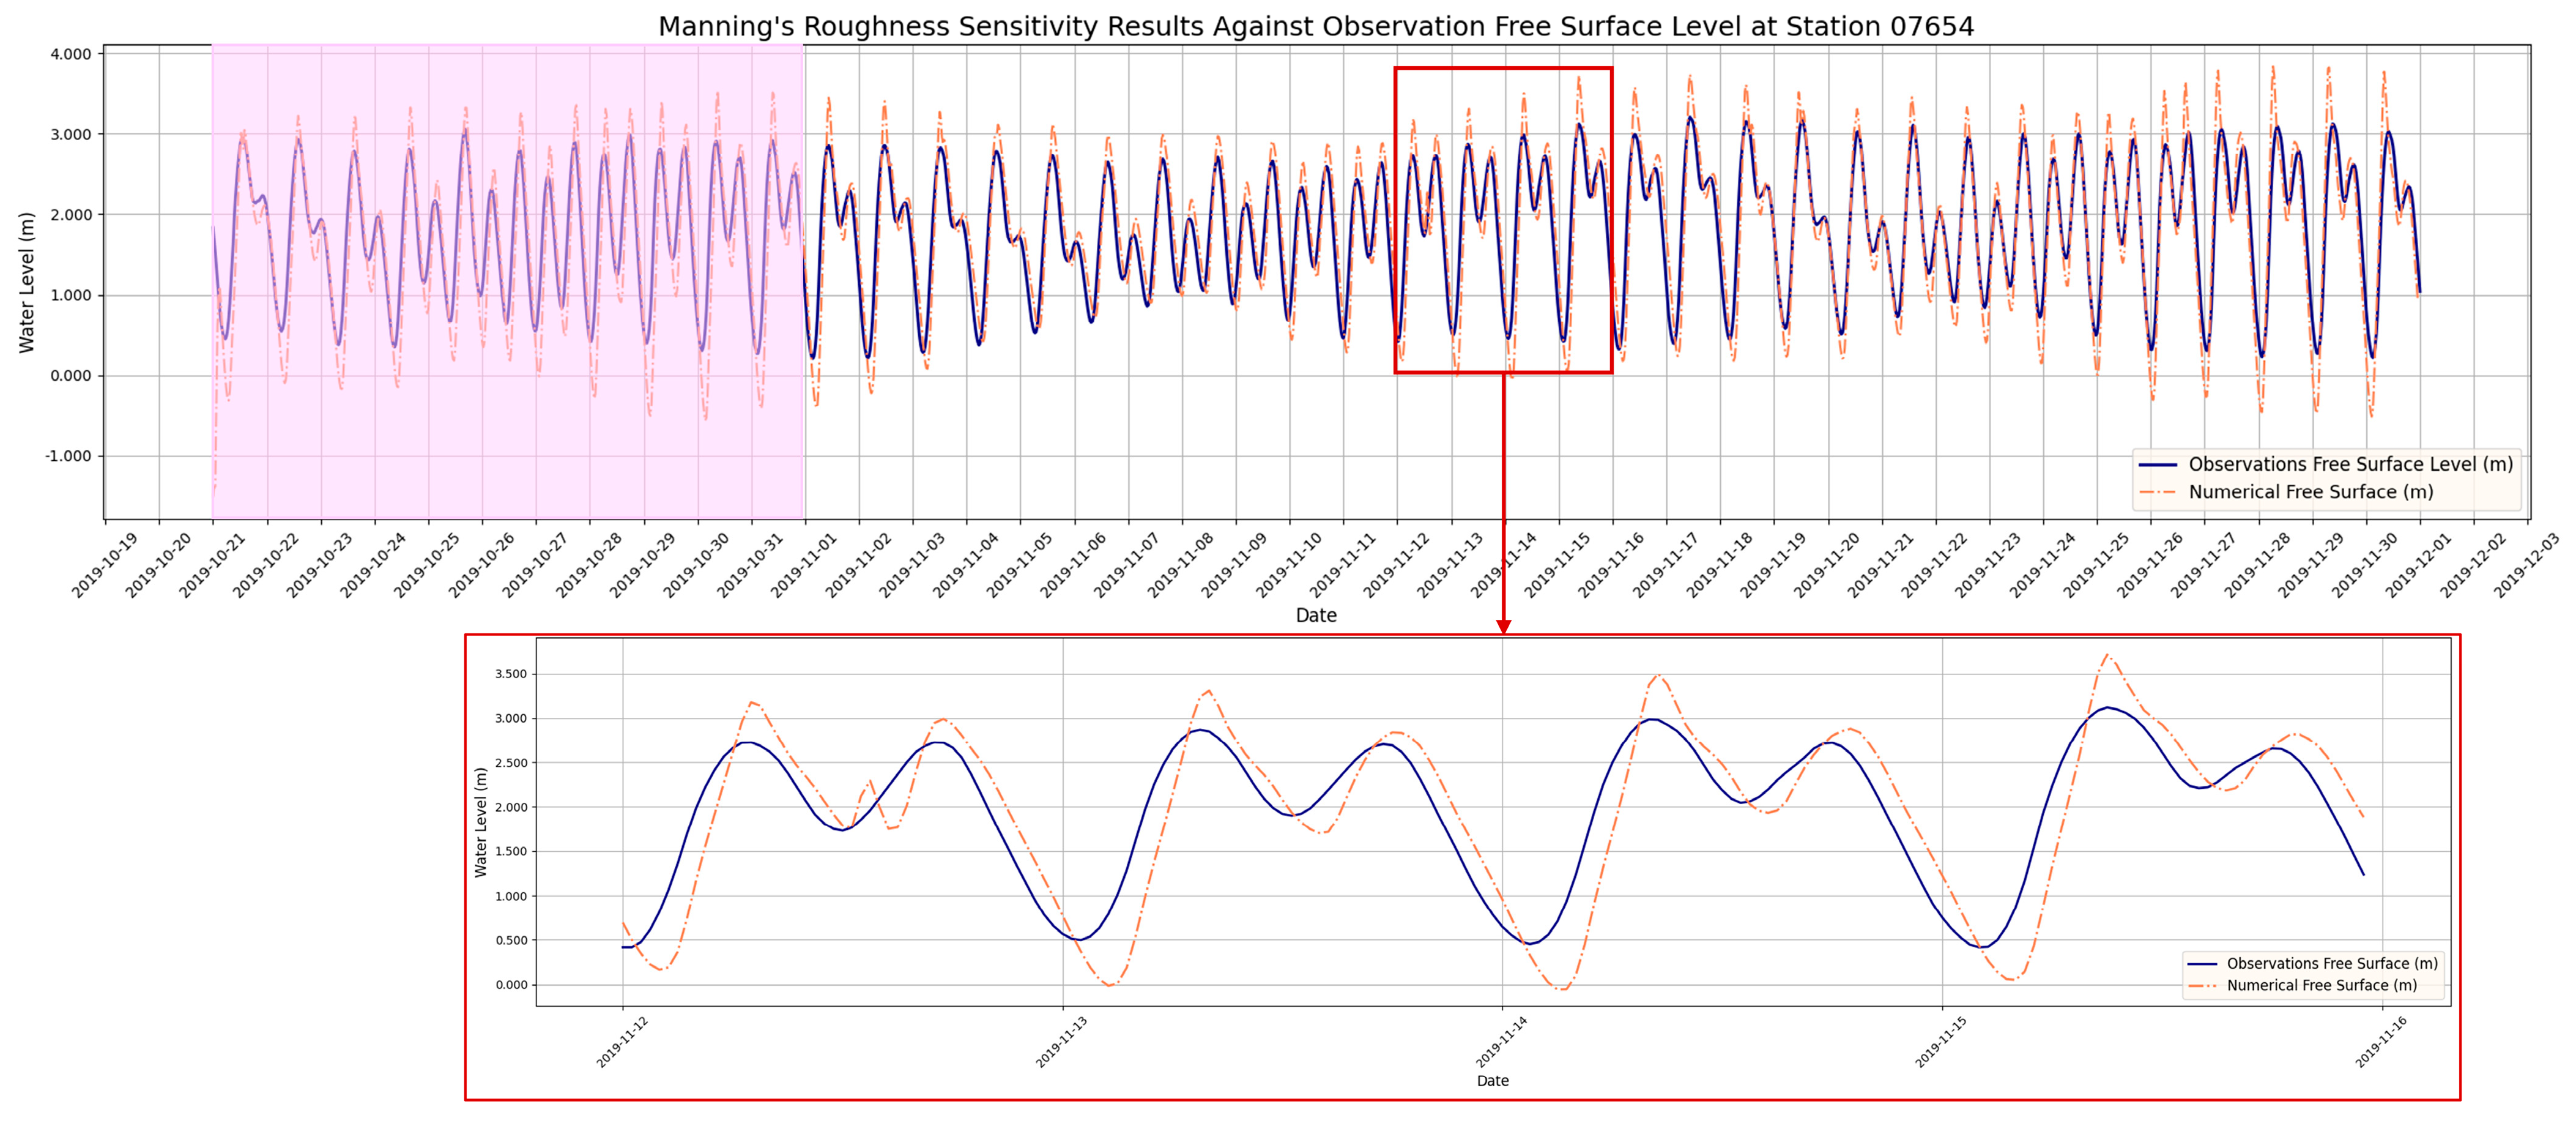
The simulations were conducted using the selected mesh configuration, which consists of 463,245 grid points and is considered adequate for accurately capturing the flow and salinity dynamics of the lower Fraser River. To validate the computed results of the model for water levels, hourly water level data from the station 07654 (shown in Figure 2) was downloaded from the Government of Canada’s website (Tides, Currents, and Water Levels [45]). The comparison between the calculated water levels from the model and the observed data is depicted in Figure 6.
The results show a maximum difference of no more than 10% (i.e., 9.5%), which is acceptable within the scope of this study. Furthermore, the pattern of two full spring-neap tidal cycles is evident in the modeled water levels, providing additional confirmation of the model’s accuracy. To quantitatively assess the accuracy of the model, the Root Mean Square Error (RMSE), Mean Absolute Error (MAE), and Coefficient of Determination (R2) were calculated based on the observed and predicted water level data. RMSE (calculated using Equation (8)) is a standard statistical measure used to quantify the difference between observed data and model predictions. It is widely used to assess the accuracy of numerical models in representing real-world phenomena.
R M S E = 1 N i = 1 N o b s i n u m i 2
where N represents the total number of data points, n u m i is the computed value at i t h time step, and o b s i is the corresponding measured value.
MAE (calculated using Equation (9)) is a similar statistical measure that quantifies the average magnitude of errors between observed and predicted values. Unlike RMSE, which squares the differences, MAE treats all errors equally, making it less sensitive to outliers.
M A E = 1 N i = 1 N o b s i n u m i
Lastly, R2 (calculated using Equation (10)) is another statistical metric that explains the proportion of variance in the observed data that is captured by the model. It is commonly used alongside RMSE to provide a comprehensive evaluation of model performance.
R 2 = 1 i = 1 N o b s i n u m i 2 i = 1 N o b s i O B S 2
where O B S is the mean of the measured values.
As mentioned earlier, a sensitivity analysis was conducted to determine the optimal Manning’s roughness coefficient (denoted by n ) for the hydrodynamic model configuration. This analysis evaluated the model’s performance for various values of n ranging from 0.02 to 0.04, using R2, RMSE, and MAE metrics. The results of this analysis are summarized in Table 2.
The analysis revealed that a Manning’s coefficient of n = 0.03 yielded the best overall performance, with an R2 value of 0.76, RMSE of 0.38 m, and MAE of 0.3 m. These values indicate that the configured model captured 76% of the variability in the observed water levels while minimizing prediction errors. Higher values of n (e.g., 0.035 and 0.04) resulted in the same and slightly poorer performance, respectively. Similarly, smaller values of n (e.g., 0.02 to 0.025) slightly underperformed compared to n = 0.03 , demonstrating less accuracy in capturing the observed data’s variability. This optimal value aligns with literature-reported values for sedimentary riverbeds [39] and ensures compatibility with the TELEMAC-3D model’s numerical framework. The selected coefficient was therefore adopted for subsequent simulations, as it provides an accurate representation of the Fraser River’s flow and bottom friction characteristics.
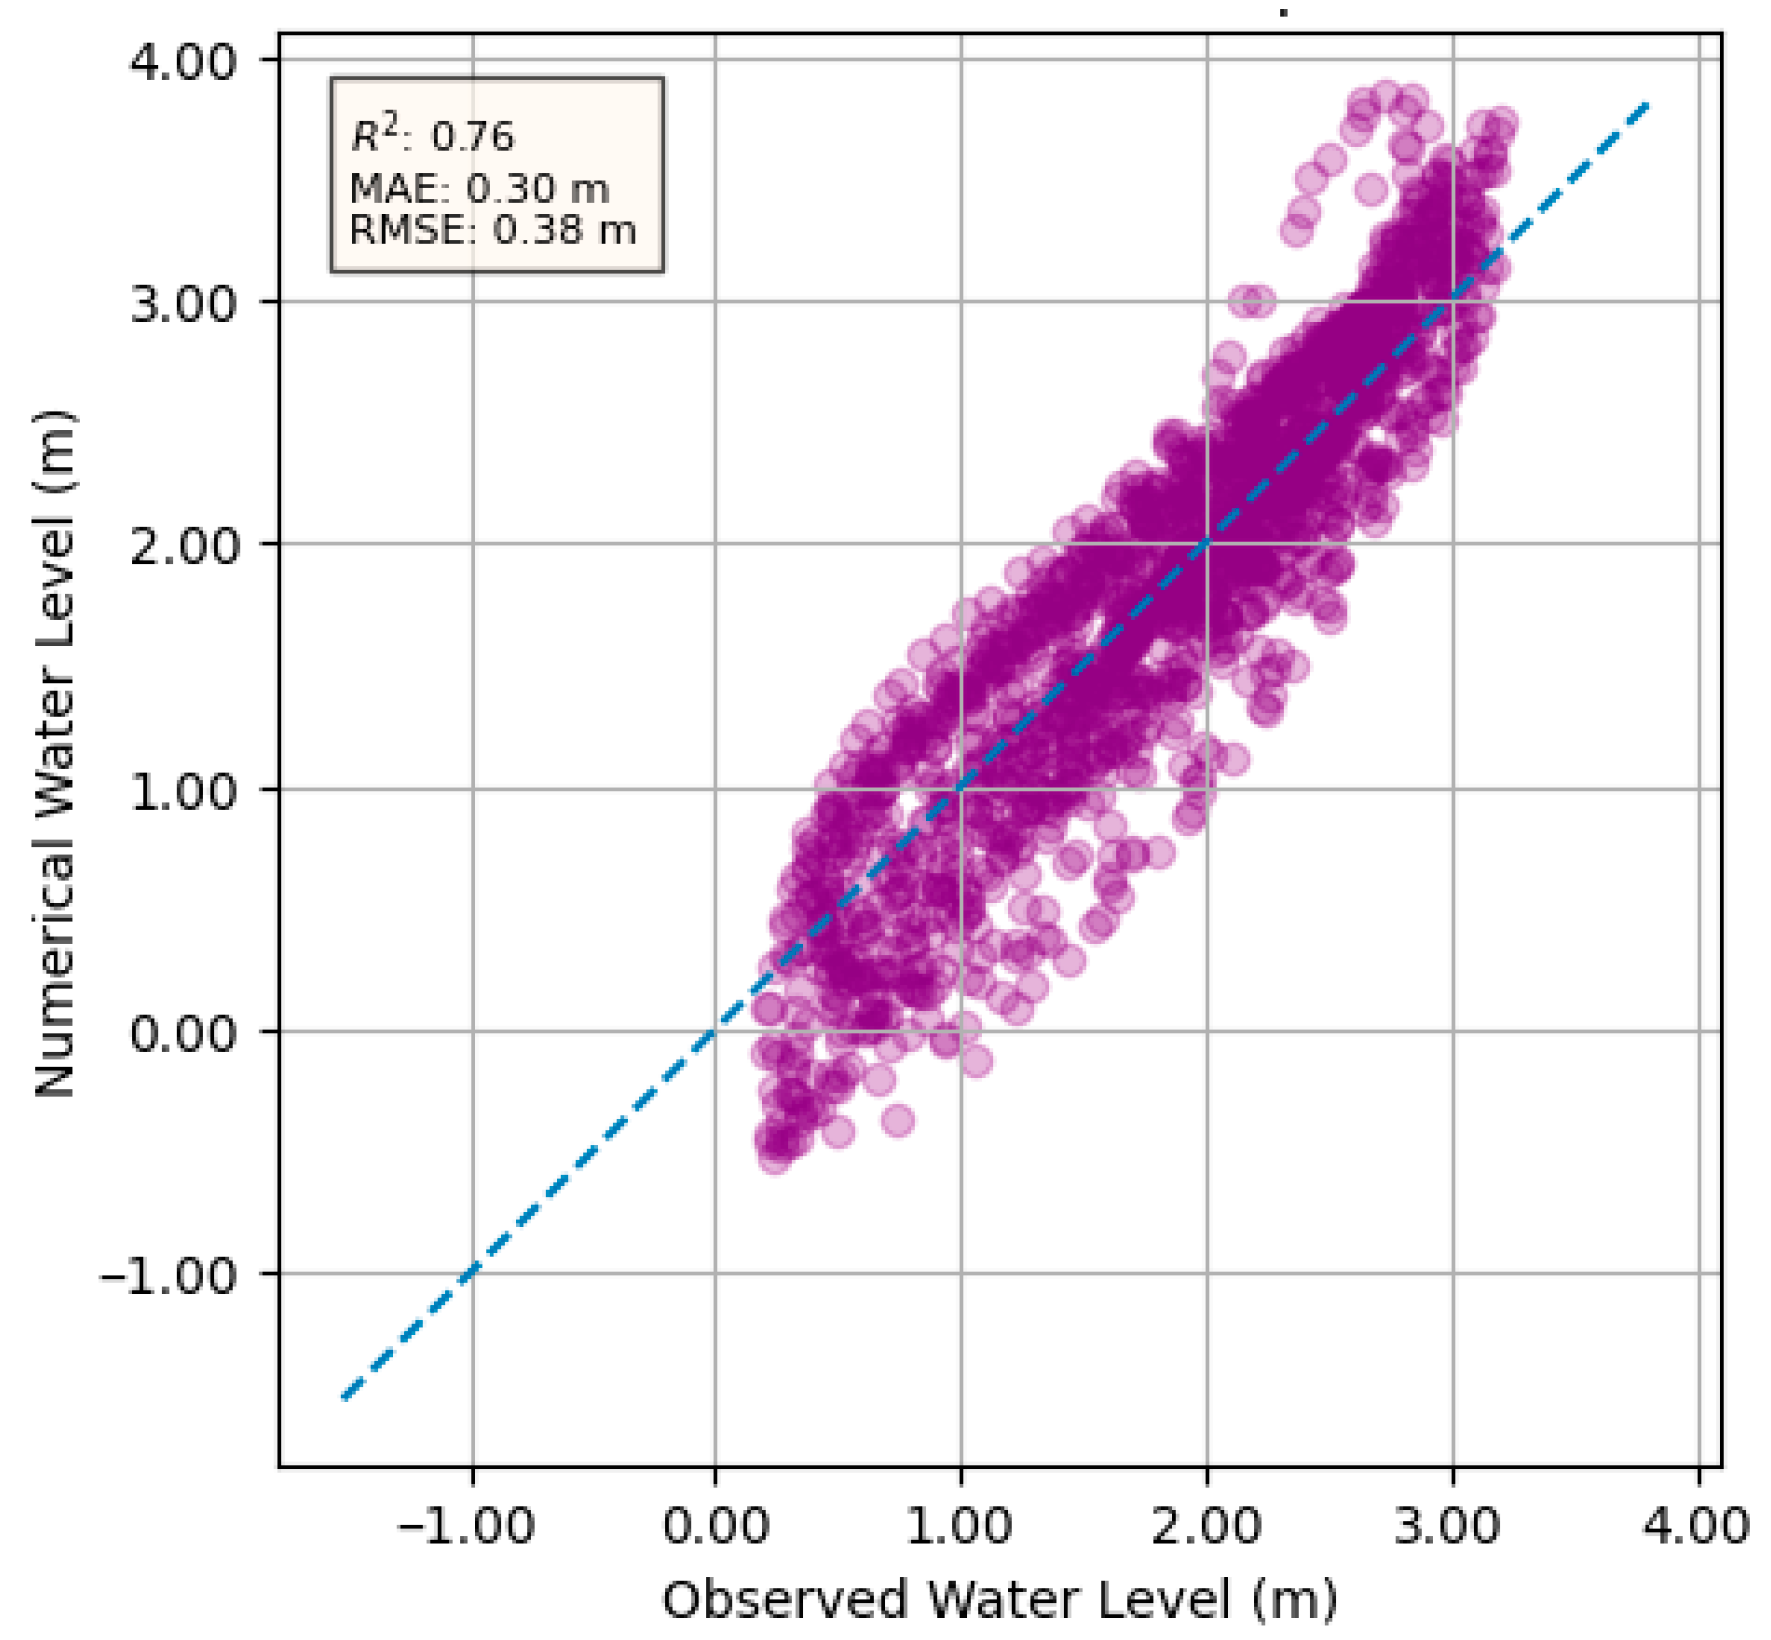
While some discrepancies exist, likely due to bathymetric inaccuracies and the inherent complexities of tidal flow in this area, the overall performance is considered acceptable for the study’s purpose of identifying microplastic accumulation zones. Close replication of the trend in water surface variations suggests that the configured hydrodynamic model was capable of providing reliable input for the particle tracking process which was then used to predict accumulation zones of microplastic particles. The provided parity plot in Figure 7 evaluates the statistical performance of the hydrodynamic model by comparing its numerical water level predictions against observed data for the month of November. To ensure a fair assessment, the model’s warm-up period was excluded. The dashed blue line represents the 1:1 line, reflecting perfect agreement between predictions and observations.

3.3. Particle Tracking Model Results

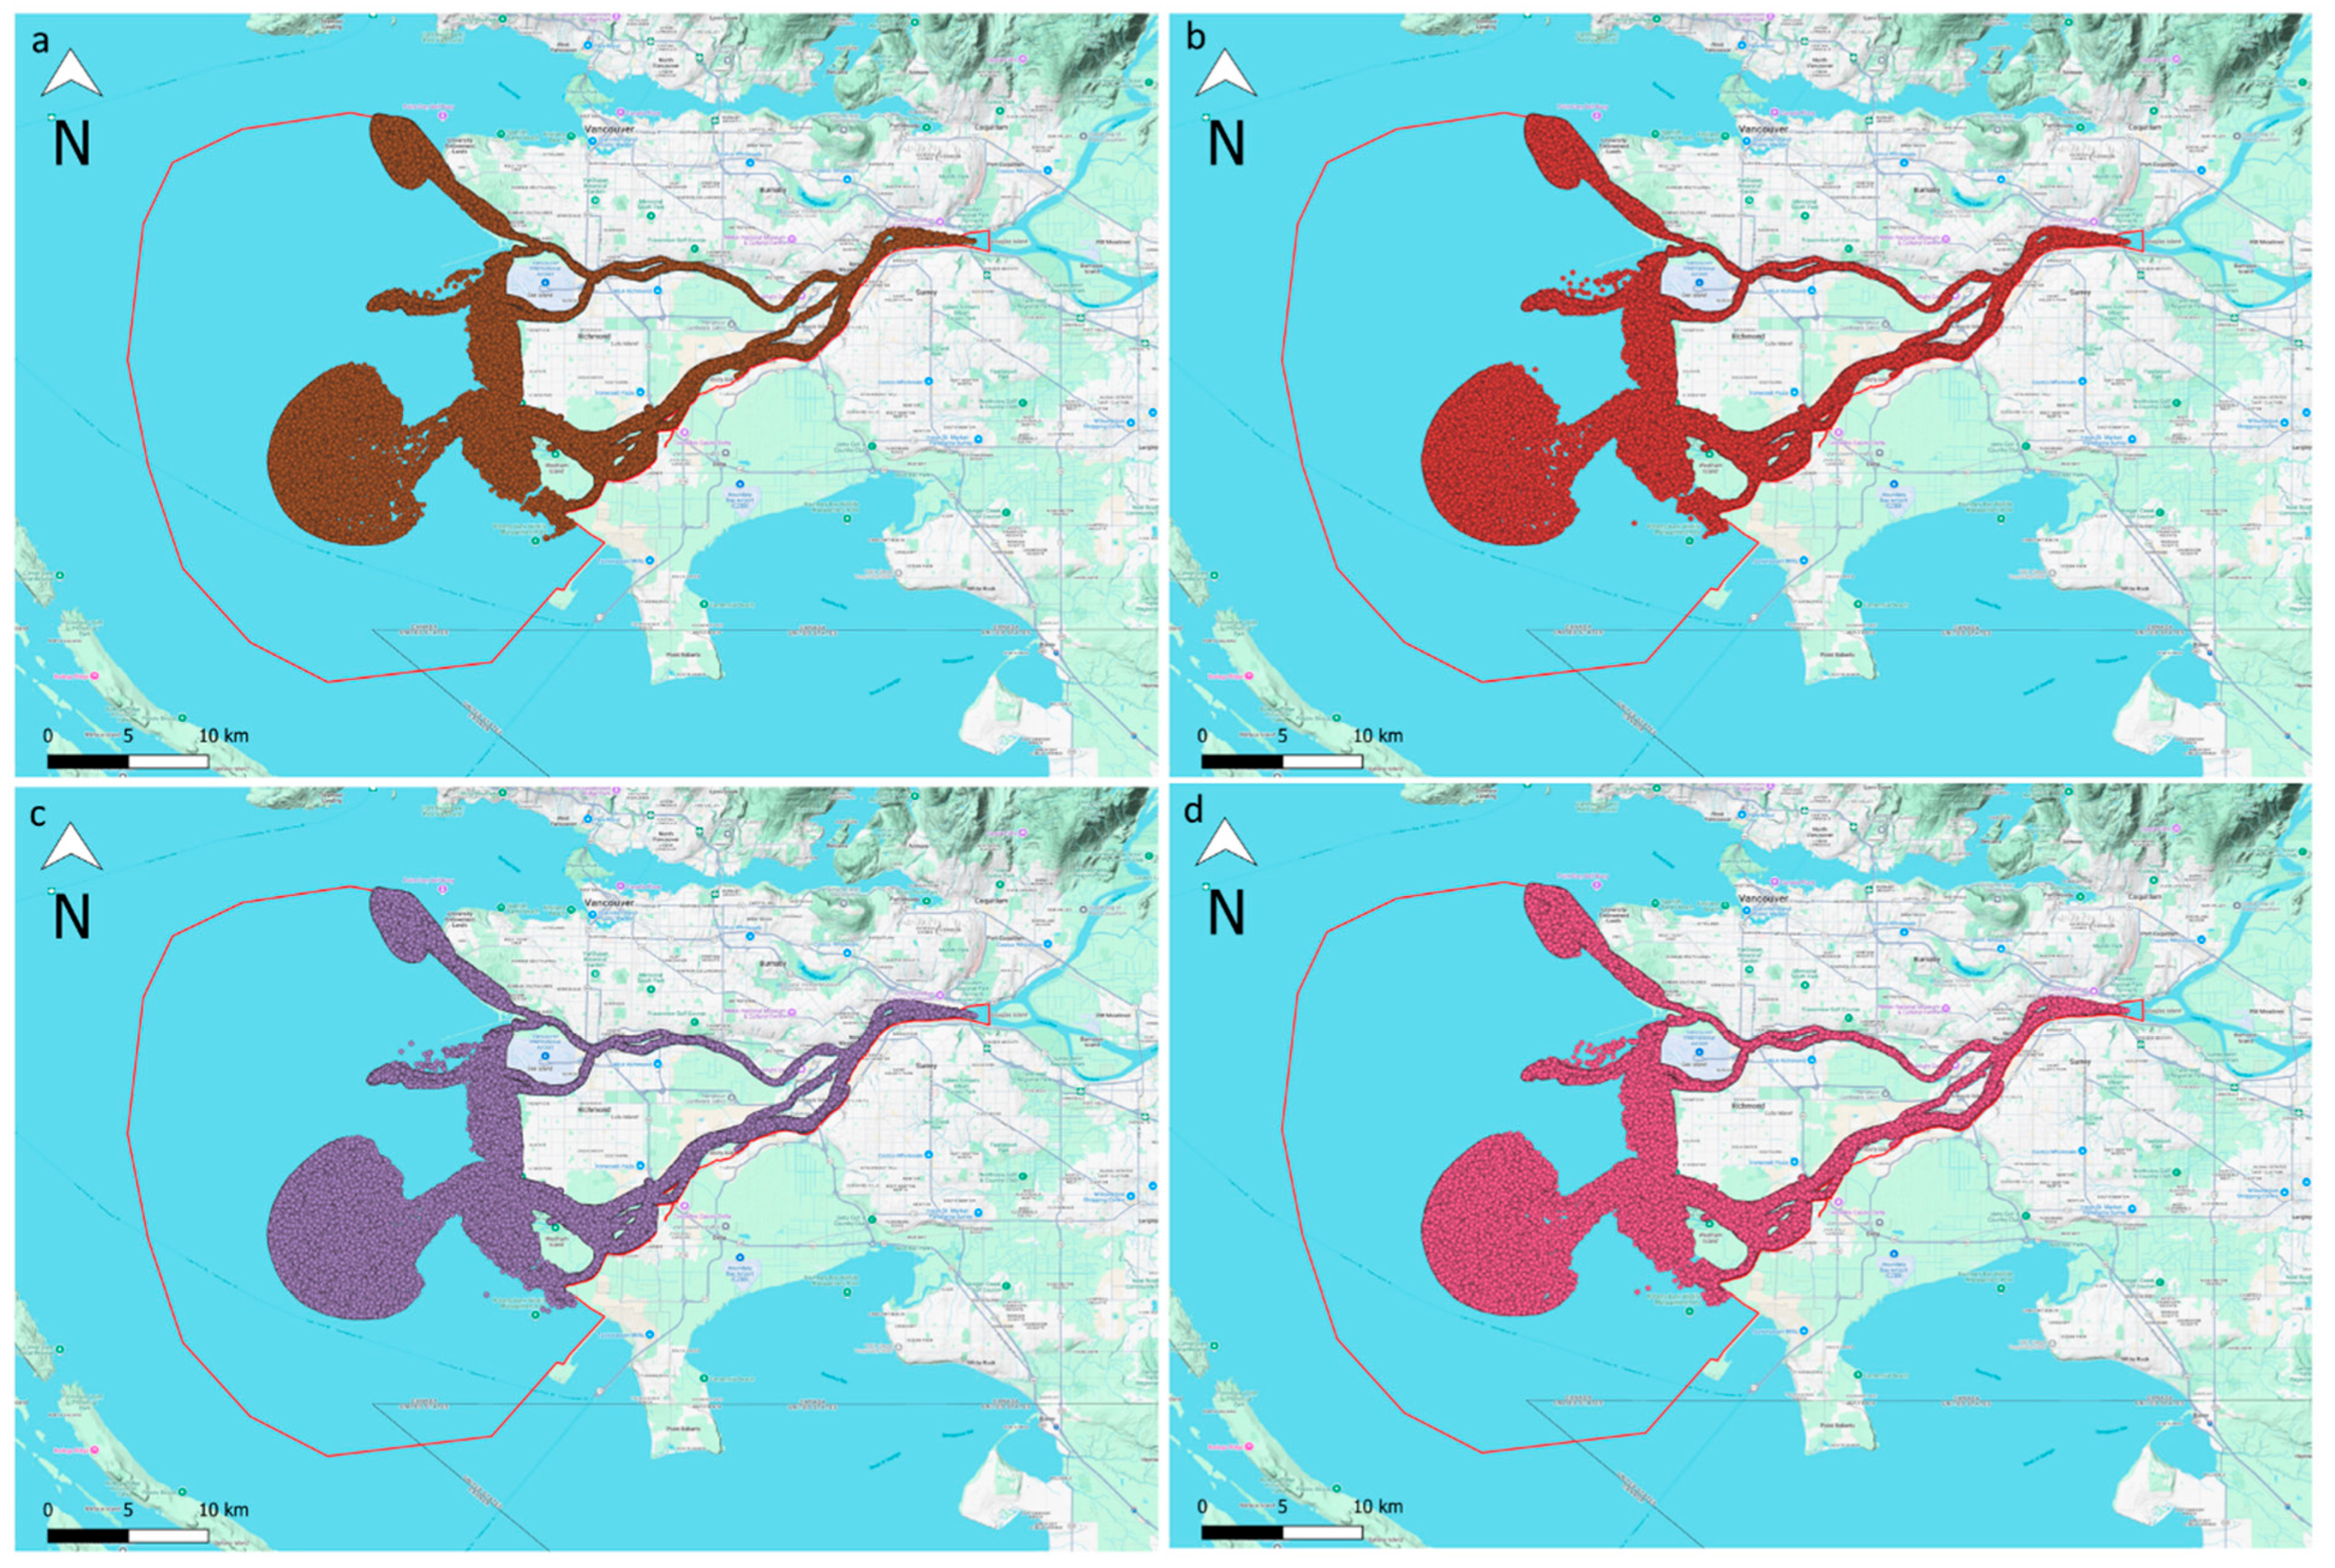
This section presents the results of the particle tracking model, showcasing the identification of microplastic accumulation zones using the OPTICS clustering algorithm. First, for each release scenario, microplastic particles were released with neutral buoyancy, reflecting the behavior of microplastics with densities similar to water. The particle movement within the fluid medium was simulated for 40 h and 30 min. This was the approximate duration within which microplastic particles have fully dispersed within the lower part of the Fraser River and branches. This simulation duration was selected based on preliminary testing which showed that the vast majority of neutrally buoyant particles either exited the domain or converged in persistent accumulation zones within the first 40 to 45 h. As the focus of this study is on spatial clustering behavior under short-term transport conditions, a longer simulation was not required. Figure 8 shows the dispersion of the particles after this duration for each scenario.
Following a series of sensitivity analyses and parameter tuning, the OPTICS algorithm was configured to identify potential accumulation zones of particles for each of these scenarios. The tuned parameters for each of the scenarios are summarized in Table 3, providing an overview of the specific configurations used in the clustering process.
The strategic approach taken to tune the OPTICS clustering algorithm for each scenario ensures consistency in the identification of accumulation zones. As mentioned earlier, noise points and un-clustered data were excluded by filtering out points with negative cluster labels. Figure 9, illustrating the spatial distribution of identified accumulation zones under varying release scenarios (i.e., releases of 30,000, 40,000, 50,000, and 60,000 particles at each of the nine CSO and WWTP locations), provides insights into the behavior and accumulation patterns of particles within the domain. These clusters locate key areas where particles tend to accumulate, influenced by river flow dynamics. Similar patterns were reported in the Adriatic Sea by [10], where floating debris clustered near coastal zones and semi-enclosed regions due to persistent circulation structures.
The results reveal that while each unique cluster size gradually grows with the total number of microplastic particles released within the domain, the location of the accumulation zones remains consistent across all four scenarios, regardless of particle count. This finding is consistent with the work of [21], who modeled microplastic transport in the Göta River and found that accumulation patterns were primarily dictated by hydrodynamic features rather than input volume. This consistency underscores that accumulation zone locations are largely independent of the total particle volume introduced. OPTICS plays a pivotal role in detecting this behavior: unlike traditional clustering methods, OPTICS adapts to variations in spatial density without relying on predefined parameters, making it well suited for identifying microplastic accumulation zones in complex aquatic environments. This insensitivity to particle number further validates the reliability of the OPTICS clustering algorithm and highlights its potential as a robust tool for environmental assessment and microplastic pollution management. The clustering results provide valuable insights into key accumulation hotspots within the lower Fraser River—information that is essential for guiding sampling strategies and cleanup operations. The spatial persistence of clusters along the northern shoreline and near channel constrictions can be attributed to localized flow deceleration zones created by bank geometry and hydrodynamic shear. These areas, particularly near bends and confluences, tend to trap particles due to reduced velocities and eddy formation. The application of the OPTICS algorithm reveals that these zones consistently act as microplastic convergence points, irrespective of the particle release quantity.
The importance of addressing microplastic pollution in the Fraser River has also been highlighted in recent regional and international reports. For example, policy-oriented analyses underscore how chemical and plastic pollution contribute to ecosystem decline and fisheries impacts in the Fraser, while educational and advocacy reports emphasize the urgent need for pollution-to-solution strategies [55,56]. Ongoing monitoring initiatives also point to the spatial and temporal variability of microplastics in the Fraser River and Burrard Inlet [57]. Our findings complement these efforts by providing a modeling-based framework that systematically identifies accumulation zones, thereby supporting both management actions and broader sustainability initiatives.

4. Conclusions

Sustainable management of riverine and estuarine ecosystems requires robust tools to understand and mitigate microplastic pollution. This study aimed to assess the potential of a three-dimensional hydrodynamic model coupled with a particle tracking suite along with clustering analysis in identifying key microplastic accumulation zones in the lower Fraser River, British Columbia, Canada, a tidal river system highly vulnerable to microplastic pollution due to multiple CSOs and WWTPs. The methodology integrated hydrodynamic modeling, particle tracking simulations, and advanced clustering techniques, supported by sensitivity analyses to optimize model configurations and ensure robustness.
Our simulations demonstrated that tidal mixing, particle buoyancy, and the spatial distribution of pollutant discharges are the key factors influencing microplastic transport and accumulation in the Fraser River. Even neutrally buoyant or low-density microplastics can be influenced by riverbed topography and stratification, occasionally resulting in temporary settling and transport within near-bottom layers. Sensitivity analyses were performed on hydrodynamic mesh resolution, Manning’s roughness coefficient, and total microplastic release volume to validate the model’s stability, accuracy, and reliability under different conditions. A summary of the most significant findings of the study is provided below:
  • The hydrodynamic model demonstrated its capability to simulate water levels and velocity fields with acceptable accuracy, validated against observed data with an RMSE of 0.38 m, an MAE of 0.3 m, and an R2 value of 76%. Sensitivity analysis of Manning’s roughness coefficient confirmed that n = 0.03 provided the optimal balance between accuracy and error minimization, ensuring reliable simulations and alignment with established practices in riverine modeling.
  • The clustering results showed that the detected locations of the accumulation zones were perfectly consistent across all release scenarios, regardless of the number of released microplastic particles at the CSO and WWTP sources.
  • The use of OPTICS as part of this methodology proved to be novel and effective, offering a reliable and parameter-flexible approach for identifying density-based microplastic accumulation zones.
  • Although the present simulations were carried out for a single hydrodynamic condition, the Fraser River is characterized by pronounced seasonal variation in flow magnitude. High flows during the freshet period may enhance downstream flushing of particles, whereas lower-flow periods may favor localized retention and accumulation. Future modeling work should incorporate seasonal variability to assess how hydrodynamic changes influence the stability and persistence of accumulation zones.
  • Future research may also expand on this methodology by integrating additional clustering techniques to trace the sources and receptors of particles in accumulation zones or by exploring the influence of particle interactions in high-density regions. Further extensions may also incorporate external forcing such as wind in the hydrodynamic model, variable particle density, and time-varying release scenarios to better represent the complexity of microplastic transport processes. Additionally, shoreline beaching and wash-off processes, which may influence the long-term retention and re-entrainment of microplastics near riverbanks, were not included in this study but represent valuable areas for future investigation.
Overall, the methodology presented in this study provides a valuable tool for enhancing environmental monitoring efforts and informing sustainable management of riverine systems impacted by microplastic pollution. By identifying stable accumulation zones, this research supports targeted mitigation strategies. It also contributes to broader goals of protecting aquatic ecosystems, improving water quality, and advancing sustainable development initiatives related to clean water and ecosystem preservation.

Author Contributions

Conceptualization, A.M. and A.P.; Data curation, S.H. and G.B.; Formal analysis, S.H., G.B., A.M. and A.P.; Funding acquisition, A.M. and A.P.; Investigation, S.H., G.B., A.M. and A.P.; Methodology, S.H., G.B., A.M. and A.P.; Project administration, A.M. and A.P.; Resources, A.M. and A.P.; Software, S.H., G.B., A.M., A.P. and M.G.; Supervision, A.M. and A.P.; Validation, S.H. and G.B.; Visualization, S.H., G.B., A.M. and A.P.; Writing—original draft, S.H. and G.B.; Writing—review and editing, A.M., A.P. and M.G. All authors have read and agreed to the published version of the manuscript.

Funding

The research was supported by Natural Sciences and Engineering Research Council of Canada (NSERC, GR001305).

Institutional Review Board Statement

Not applicable.

Informed Consent Statement

Not applicable.

Data Availability Statement

The data presented in this study are available on request from the corresponding author. The data are not publicly available due to ongoing analyses and future publication plans.

Conflicts of Interest

The authors declare no conflicts of interest.

Abbreviations

The following abbreviations are used in this manuscript:
CaMPSim-3DThree-dimensional Canadian Microplastic Simulation Model
CSOCombined Sewer Overflow
WWTPWastewater Treatment Plant
OPTICSOrdering Points to Identify the Clustering Structure
HEC-RASHydrologic Engineering Center’s River Analysis System
TUFLOWTwo-dimensional Unsteady Flow Software
IDWInverse Distance Weighting
UTMUniversal Transverse Mercator
QGISQuantum Geographic Information System
RMSERoot Mean Square Error
MAEMean Absolute Error
DBSCANDensity-Based Spatial Clustering of Applications with Noise

References

  1. Masura, J.; Baker, J.; Foster, G.; Arthur, C. Laboratory Methods for the Analysis of Microplastics in the Marine Environment: Recommendations for Quantifying Synthetic Particles in Waters and Sediments; NOAA Technical Memorandum NOS-OR&R-48; NOAA: Silver Spring, MD, USA, 2015. [Google Scholar]
  2. Petersen, F.; Hubbart, J.A. The occurrence and transport of microplastics: The state of the science. Sci. Total Environ. 2021, 758, 143936. [Google Scholar] [CrossRef]
  3. Van Melkebeke, M.; Janssen, C.; De Meester, S. Characteristics and Sinking Behavior of Typical Microplastics Including the Potential Effect of Biofouling: Implications for Remediation. Environ. Sci. Technol. 2020, 54, 8668–8680. [Google Scholar] [CrossRef] [PubMed]
  4. Chubarenko, I.; Bagaev, A.; Zobkov, M.; Esiukova, E. On some physical and dynamical properties of microplastic particles in marine environment. Mar. Pollut. Bull. 2016, 108, 105–112. [Google Scholar] [CrossRef]
  5. Skalska, K.; Ockelford, A.; Ebdon, J.E.; Cundy, A.B. Riverine microplastics: Behaviour, spatio-temporal variability, and recommendations for standardised sampling and monitoring. J. Water Process Eng. 2020, 38, 101600. [Google Scholar] [CrossRef]
  6. Li, L.; Li, M.; Deng, H.; Cai, L.; Cai, H.; Yan, B.; Hu, J.; Shi, H. A straightforward method for measuring the range of apparent density of microplastics. Sci. Total Environ. 2018, 639, 367–373. [Google Scholar] [CrossRef]
  7. Mercogliano, R.; Avio, C.G.; Regoli, F.; Anastasio, A.; Colavita, G.; Santonicola, S. Occurrence of Microplastics in Commercial Seafood under the Perspective of the Human Food Chain. A Review. J. Agric. Food Chem. 2020, 68, 5296–5301. [Google Scholar] [CrossRef]
  8. Marcharla, E.; Vinayagam, S.; Gnanasekaran, L.; Soto-Moscoso, M.; Chen, W.-H.; Thanigaivel, S.; Ganesan, S. Microplastics in marine ecosystems: A comprehensive review of biological and ecological implications and its mitigation approach using nanotechnology for the sustainable environment. Environ. Res. 2024, 256, 119181. [Google Scholar] [CrossRef]
  9. Inwati, P.; Verma, D.K.; Harinkhede, H. Impact of Microplastic in Marine Environment and Human Health. Int. J. Sci. Res. Sci. Technol. 2024, 11, 221–231. [Google Scholar]
  10. Liubartseva, S.; Coppini, G.; Lecci, R.; Creti, S. Regional approach to modeling the transport of floating plastic debris in the Adriatic Sea. Mar. Pollut. Bull. 2016, 103, 115–127. [Google Scholar] [CrossRef]
  11. Parizi, A.H. Urban Discharge and Fate of Microplastics: Characterizing the Role of Combined Sewer Overflows and Microplastics in the Fraser River in British Columbia. Ph.D. Thesis, University of British Columbia, Vancouver, BC, Canada, 2022. [Google Scholar] [CrossRef]
  12. DHI. MIKE 11—A Modeling System for Rivers and Channels; Danish Hydraulic Institute (DHI): Hørsholm, Denmark, 2020. [Google Scholar]
  13. US Army Corps of Engineers. HEC-RAS River Analysis System—User’s Manual Version 6.0; Hydrologic Engineering Center: Davis, CA, USA, 2020. [Google Scholar]
  14. Consortium Open℡EMAC-MASCARET. TELEMAC-2D v8p5 User Manual; EDF R&D, Laboratoire National d’Hydraulique et Environnement: Chatou Cedex, France, 2023; 8p. [Google Scholar]
  15. DHI. MIKE 21—A Two-Dimensional Free-Surface Flow Modeling System; Danish Hydraulic Institute (DHI): Hørsholm, Denmark, 2020. [Google Scholar]
  16. BMT Group. TUFLOW User Manual—Build 2020-01-AB; BMT: London, UK, 2020. [Google Scholar]
  17. EDF R&D, Laboratoire National d’Hydraulique et Environnement (LNHE). TELEMAC-3D User Manual, Version 8p5; EDF R&D: Chatou, France, 2024.
  18. Deltares. Delft3D Flexible Mesh Suite; Deltares: Delft, The Netherlands, 2021. [Google Scholar]
  19. Flow Science, Inc. FLOW-3D User Manual; Flow Science: Santa Fe, NM, USA, 2022. [Google Scholar]
  20. Yin, L.; Nie, X.; Deng, G.; Tian, J.; Xiang, Z.; Abbasi, S.; Chen, H.; Zhang, W.; Xiao, R.; Gan, C.; et al. Hydrodynamic driven microplastics in Dongting Lake, China: Quantification of the flux and transportation. J. Hazard. Mater. 2024, 480, 136049. [Google Scholar] [CrossRef]
  21. Bondelind, M.; Sokolova, E.; Nguyen, A.; Karlsson, D.; Karlsson, A.; Björklund, K. Hydrodynamic modelling of traffic-related microplastics discharged with stormwater into the Göta River in Sweden. Environ. Sci. Pollut. Res. 2020, 27, 24218–24230. [Google Scholar] [CrossRef]
  22. Institute of Hydraulic Engineering and Water Resources Management, RWTH Aachen University. PELETS-2D: Particle Tracking in Hydrodynamic Models; RWTH Aachen University: Aachen, Germany, 2020. [Google Scholar]
  23. Ghazizadeh, M.; Rey, A.; Pilechi, A.; Burcher, R.; Drouin, S.S.-O.; Lamontagne, P. A high-performance ray tracing particle tracking model for the simulation of microplastics in inland and coastal aquatic environments. Comput. Phys. Commun. 2025, 307, 109423. [Google Scholar] [CrossRef]
  24. Ghazizadeh, M.; Pilechi, A.; Lamontagne, P. Numerical simulation of microplastics transport in Saguenay Fjord using ray tracing particle tracking model. In Proceedings of the Canadian Society for Civil Engineering Annual Conference; Springer: Berlin/Heidelberg, Germany, 2024. [Google Scholar]
  25. Ankerst, M.; Breunig, M.M.; Kriegel, H.-P.; Sander, J. OPTICS: Ordering points to identify the clustering structure. SIGMOD Rec. 1999, 28, 49–60. [Google Scholar] [CrossRef]
  26. Ester, M.; Kriegel, H.-P.; Sander, J.; Xu, X. A density-based algorithm for discovering clusters in large spatial databases with noise. In Proceedings of the KDD’96: Second International Conference on Knowledge Discovery and Data Mining, Portland, OR, USA, 2–4 August 1996; Volume 96, pp. 226–231. [Google Scholar]
  27. Mishra, A.; Siht, E.; Väli, G.; Liblik, T.; Buhhalko, N.; Lips, U. Mapping microplastic pathways and accumulation zones in the Gulf of Finland, Baltic Sea—Insights from modeling. Front. Mar. Sci. 2025, 11, 1524585. [Google Scholar] [CrossRef]
  28. Thomson, R.E. (Ed.) Oceanography of the British Columbia Coast; Canadian Special Publication of Fisheries and Aquatic Sciences: Ottawa, ON, Canada, 1981; ISBN 0-660-10978-6. [Google Scholar]
  29. Northwest Hydraulic Consultants (nhc). Fraser River Hydraulic Model Update: Final Report; BC Ministry of Environment: Surrey, BC, Canada; Northwest Hydraulic Consultants: North Vancouver, BC, Canada, 2008. [Google Scholar]
  30. Masoom, S.; Gu, L. 3D Hydrodynamic Modeling of Lower Fraser River. In Proceedings of the Salish Sea Ecosystem Conference; University Archives, Heritage Resources, Western Libraries; Western Washington University: Seattle, WA, USA, 2018. [Google Scholar]
  31. Kostaschuk, R.A.; Atwood, L.A. River discharge and tidal controls on salt-wedge position and implications for channel shoaling: Fraser River, British Columbia. Can. J. Civ. Eng. 1990, 17, 452–459. [Google Scholar] [CrossRef]
  32. Bourdages, M.; Ehrenbrink, B.P.E.; Marsh, S.J.; Gillies, S.L.; Paine, J.K.; Bogaerts, P.; Strangway, A.; Robertson, K.; Groeneweg, A. Presence of Microplastics in the Fraser River, British Columbia. In AGU Fall Meeting Abstracts; AGU: Washington, DC, USA, 2017; Volume 2017, p. H31H-1609. [Google Scholar]
  33. Gillies, S.L.; Chauhan, J.; Brunner, K. Microplastics Found in Lower Fraser River Sediments. In Proceedings of the International Conference on Environmental Science and Technology, Paris, France, 19–20 February 2024. [Google Scholar]
  34. Babajamaaty, G. Numerical Simulation of Microplastics Transport in a Part of Fraser River and Detection of Accumulation Zones Based on Clustering Methods. Ph.D. Thesis, University of Ottawa, Ottawa, ON, Canada, 2023. [Google Scholar] [CrossRef]
  35. Gessler, D.; Hall, B.; Spasojevic, M.; Holly, F.; Pourtaheri, H.; Raphelt, N. Application of 3D Mobile Bed, Hydrodynamic Model. J. Hydraul. Eng. 1999, 125, 737–749. [Google Scholar] [CrossRef]
  36. Roberts, K.J.; Pringle, W.J.; Westerink, J.J. OceanMesh2D: An Unstructured Mesh Generator for Coastal and Ocean Modeling. Geosci. Model. Dev. 2025, 12, 1847–1868. [Google Scholar] [CrossRef]
  37. Government of British Columbia Official Shapefiles and Bathymetry Data. 2023. Available online: https://www2.gov.bc.ca/gov/content/data/geographic-data-services (accessed on 29 November 2024).
  38. Kvale, E.P. The origin of neap–spring tidal cycles. Mar. Geol. 2006, 235, 5–18. [Google Scholar] [CrossRef]
  39. Chow, V.T. Open-Channel Hydraulics; McGraw-Hill: Columbus, OH, USA, 1959. [Google Scholar]
  40. Rodi, W. Turbulence Models and Their Application in Hydraulics: A State-of-the-Art Review, 3rd ed.; Rodi, W., Ed.; Routledge: London, UK, 2017; ISBN 978-0-203-73489-6. [Google Scholar]
  41. Stacey, M.T.; Monismith, S.G.; Burau, J.R. Observations of Turbulence in a Partially Stratified Estuary. J. Phys. Oceanogr. 1999, 29, 1950–1970. [Google Scholar] [CrossRef]
  42. Launder, B.E.; Spalding, D.B. The numerical computation of turbulent flows. Comput. Methods Appl. Mech. Eng. 1974, 3, 269–289. [Google Scholar] [CrossRef]
  43. Tsz Yeung Leung, A.; Stronach, J.; Matthieu, J. Modelling Behaviour of the Salt Wedge in the Fraser River and Its Relationship with Climate and Man-Made Changes. JMSE 2018, 6, 130. [Google Scholar] [CrossRef]
  44. Government of Canada Historical Hydrometric Data. Available online: https://wateroffice.ec.gc.ca/mainmenu/historical_data_index_e.html (accessed on 29 November 2024).
  45. Government of Canada Tides, Currents, and Water Levels Stations. Available online: https://www.tides.gc.ca/en/tides-currents-and-water-levels (accessed on 29 November 2024).
  46. QGIS Development Team. QGIS Geographic Information System; Open Source Geospatial Foundation Project: Beaverton, OR, USA, 2023; Available online: https://qgis.org (accessed on 16 September 2025).
  47. Jalón-Rojas, I.; Wang, X.H.; Fredj, E. A 3D numerical model to Track Marine Plastic Debris (TrackMPD): Sensitivity of microplastic trajectories and fates to particle dynamical properties and physical processes. Mar. Pollut. Bull. 2019, 141, 256–272. [Google Scholar] [CrossRef]
  48. Soto-Navarro, J.; Jordá, G.; Deudero, S.; Alomar, C.; Amores, Á.; Compa, M. 3D hotspots of marine litter in the Mediterranean: A modeling study. Mar. Pollut. Bull. 2020, 155, 111159. [Google Scholar] [CrossRef]
  49. Mansui, J.; Darmon, G.; Ballerini, T.; Van Canneyt, O.; Ourmieres, Y.; Miaud, C. Predicting marine litter accumulation patterns in the Mediterranean basin: Spatio-temporal variability and comparison with empirical data. Prog. Oceanogr. 2020, 182, 102268. [Google Scholar] [CrossRef]
  50. Pilechi, A.; Mohammadian, A.; Murphy, E. A numerical framework for modeling fate and transport of microplastics in inland and coastal waters. Mar. Pollut. Bull. 2022, 184, 114119. [Google Scholar] [CrossRef]
  51. Pedregosa, F.; Varoquaux, G.; Gramfort, A.; Michel, V.; Thirion, B.; Grisel, O.; Blondel, M.; Prettenhofer, P.; Weiss, R.; Dubourg, V.; et al. Scikit-learn: Machine learning in Python. J. Mach. Learn. Res. 2011, 12, 2825–2830. [Google Scholar]
  52. Lloyd, S. Least squares quantization in PCM. IEEE Trans. Inform. Theory 1982, 28, 129–137. [Google Scholar] [CrossRef]
  53. MacQueen, J. Some methods for classification and analysis of multivariate observations. In Proceedings of the Fifth Berkeley Symposium on Mathematical Statistics and Probability, Volume 1: Statistics; Le Cam, L.M., Neyman, J., Eds.; University of California Press: Berkeley, CA, USA, 1967; pp. 281–297. [Google Scholar]
  54. Metro Vancouver. Fraser River Environmental Monitoring Programs Comprehensive Review 2014–2019: Summary Report; Metro Vancouver: Burnaby, BC, Canada, 2019. [Google Scholar]
  55. Smart, I. (Ed.) Fraser River Protection: An Initial Assessment of the Legal Failure for Cumulative Impacts; Environmental Law Centre: Edmonton, AB, Canada, 2024. [Google Scholar]
  56. Landos, M. From Pristine to Polluted: How Chemicals and Pollutants Drive Fishery Decline sand Ecosystem Collapse; International Pollutants Elimination Network: Fraser River, BC, Canada, 2024. [Google Scholar]
  57. McHugh, N. Investigating the Spatial and Temporal Distribution of Microplastics in the Fraser River and Burrard Inlet (British Columbia, Canada). Ph.D. Thesis, University of British Columbia, Vancouver, BC, Canada, 2025. [Google Scholar]
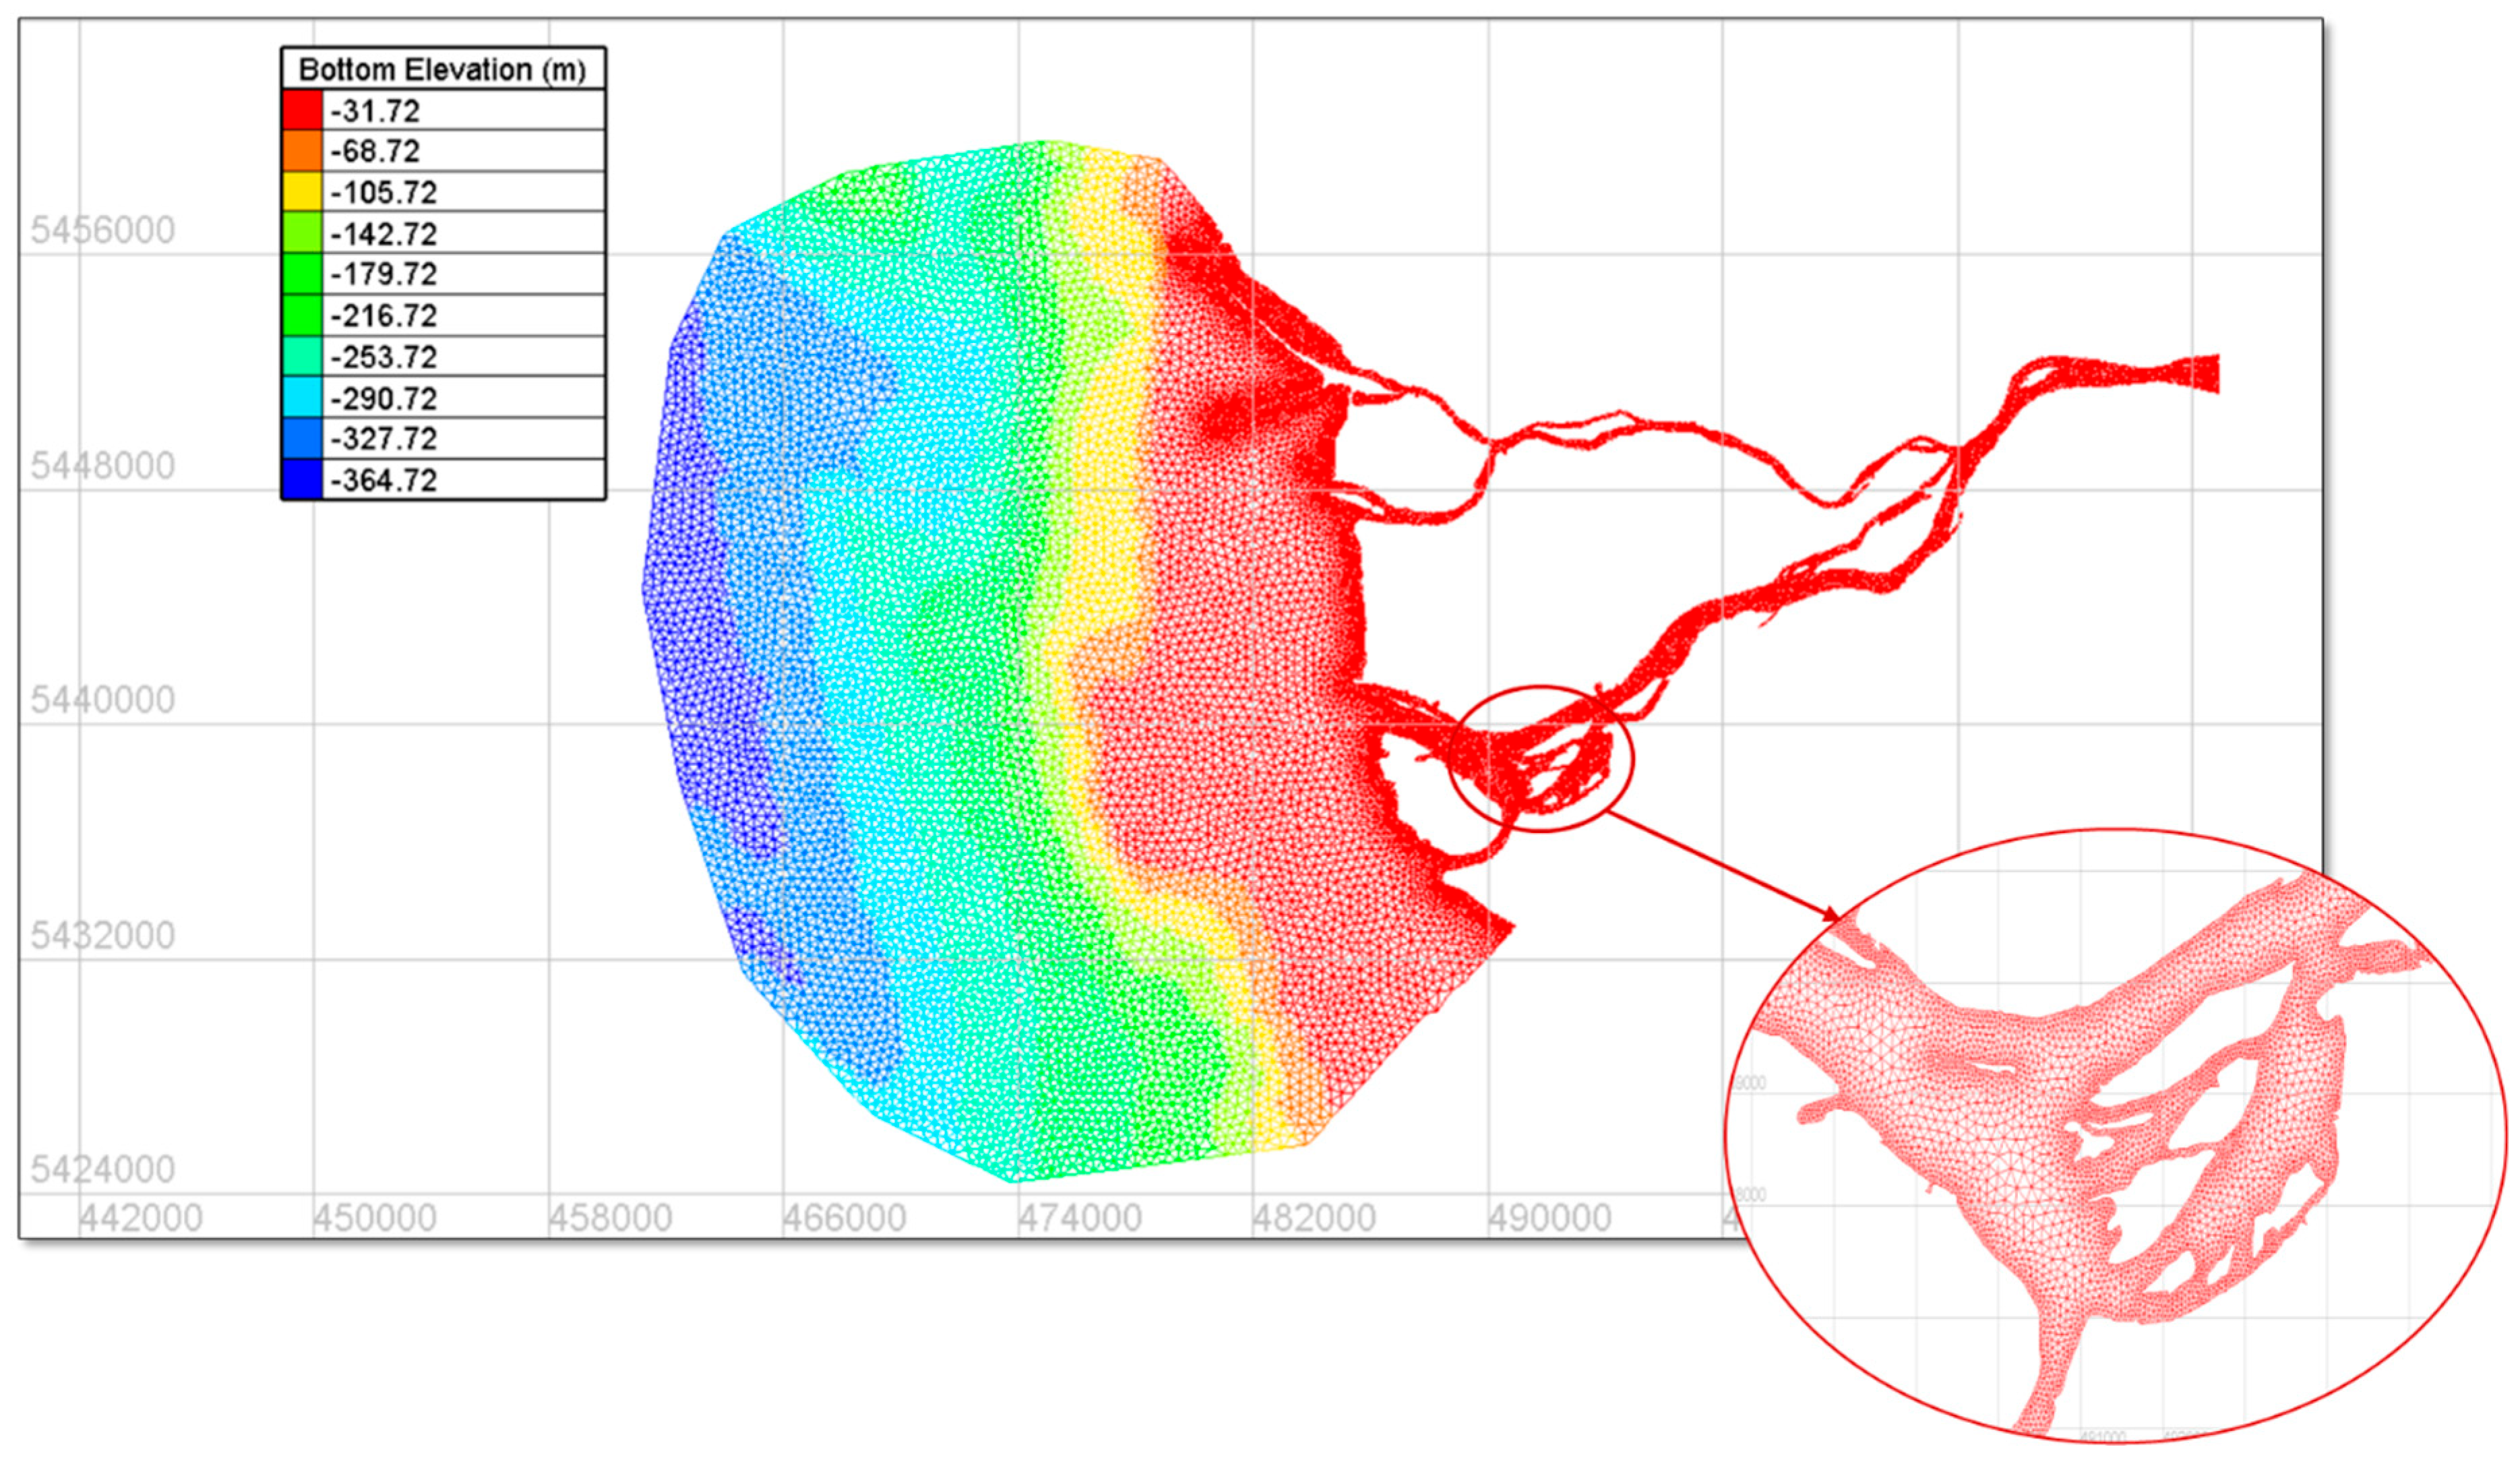
Figure 1. The selected mesh candidate, with color-coded bottom elevations values in meters mapped onto grid points. The inset provides the detailed domain geometry around one of the river’s branching region, showcasing its adequate resolution for hydrodynamic simulations.
Sustainability 17 08591 g001
Figure 2. The 35 km stretch of Fraser River, visualized using QGIS [46], along with the locations of the discharge and water level stations.
Sustainability 17 08591 g002
Figure 3. Locations of CSOs (orange pins) and WWTPs (yellow pins), representing release sources of microplastic particles.
Sustainability 17 08591 g003
Figure 4. Comparison of free surface level results for three mesh candidates at station 07654, confirming the hydrodynamic free surface results’ independency of the computational grid size. Free surface levels calculated over mesh candidate #1 with smallest element size of 35 m, calculated over mesh candidate #2 with smallest element size of 34 m, and calculated over mesh candidate #3 with smallest element size of 40 m are plotted in magenta, green, and coral, respectively.
Sustainability 17 08591 g004
Figure 5. Salinity contour field (ppt) over the selected computational grid on 26 October 2019, resulted from the configured hydrodynamic model, in (a) layers 1, (b) 8, and (c) 15, showing salinity difference in the water column.
Sustainability 17 08591 g005
Figure 6. Validation of hydrodynamic model free surface level results against observed water levels at station 07654. The pink-shaded area in the first 11 days of the model represents the model’s warm-up period, during which the results are not reliable. The zoomed-in section depicts a detailed comparison of numerical and observed free surface levels for a selected time range, illustrating the model’s performance in capturing fluctuations in water levels.
Sustainability 17 08591 g006
Figure 7. Parity plot showing the statistical evaluation of the configured hydrodynamic model’s numerical water level predictions against observed water levels for the month of November (model warm-up period was excluded for fair judgment). The dashed blue line represents the 1:1 line (perfect agreement). Key performance metrics are displayed in the inset: R2 = 0.76, MAE = 0.3 m, and RMSE = 0.38 m. The plot indicates a strong agreement between the model and observations, with some dispersion at higher water levels.
Sustainability 17 08591 g007
Figure 8. Spatial distribution of microplastic particles after 40 h and 30 min of release at CSO and WWTP locations in the lower Fraser River, illustrating the dispersion patterns for four different release scenarios: (a) release of 30,000 (in total 270,000), (b) release of 40,000 (in total 360,000), (c) release of 50,000 (in total 450,000), and (d) release of 60,000 (in total 540,000). Particles were released with neutral buoyancy.
Sustainability 17 08591 g008
Figure 9. Spatial distribution of microplastic particle clusters identified by OPTICS for four scenarios with different numbers of particles released: (a) 30,000, (b) 40,000, (c) 50,000, and (d) 60,000 particles dispersed at each of the nine CSO and WWTP locations. Each cluster is represented by a unique color, with the cluster ID shown in the legend.
Sustainability 17 08591 g009
Table 1. Key parameters used to generate each of the mesh candidates in OceanMesh2D.
Mesh CandidateMinimum Element Size (m)Maximum Element Size (m)Maximum Element Size Near Shores (m)Mesh GradationNode CountElement Count
135300250.13463,245834,480
234350200.1532,710970,800
340400250.1422,730765,150
Table 2. Sensitivity analysis results for Manning’s roughness coefficient.
Manning’s CoefficientR2 (%)RMSE (m)MAE (m)
0.02730.40.31
0.025750.380.3
0.03760.380.3
0.035760.380.3
0.04740.390.31
Table 3. The tuned OPTICS parameters for each of the scenarios.
Particle Count of Release at Each CSO and WWTP SourceMinimum Cluster Size (Percent of Particle Population)Minimum Number of SamplesMaximum Neighborhood Distance (m)Cluster Steepness Threshold
30,0000.024004000.0005
40,0000.0194005000.0005
50,0000.0247005000.0005
60,0000.0247005000.0005
Disclaimer/Publisher’s Note: The statements, opinions and data contained in all publications are solely those of the individual author(s) and contributor(s) and not of MDPI and/or the editor(s). MDPI and/or the editor(s) disclaim responsibility for any injury to people or property resulting from any ideas, methods, instructions or products referred to in the content.