1. Introduction
The issue of energy efficiency is currently one of the most important in the development of sustainable vehicles and has been repeatedly discussed in scientific literature. The research conducted focuses on the overall efficiency of the vehicle [
1,
2,
3,
4] or on specific components, including the drive train [
5,
6]. In addition to the efficiency of the drive system itself, the distribution of drive torque to the individual wheels of the vehicle is also an important issue. In classic drive systems, differential mechanisms are responsible for distributing torque between the wheels and axles. When driving on hard surfaces, the differential mechanism prevents the phenomenon of circulating power in the drive train. However, when driving on a surface with limited traction, one of the wheels may slip, which can cause a loss of directional stability or immobilization of the vehicle. Various solutions are used to prevent this situation, such as differentials with increased internal friction [
7,
8,
9]. However, their operation has downsides, as they cause additional energy losses in the drive train. Publications on the energy consumption of various differential solutions can be found in the literature [
10,
11]. A relatively new approach to drive torque distribution is torque vectoring, which is particularly important in electric vehicles [
12,
13]. Torque vectoring strategies can contribute to significant increases in efficiency, but they generally require efficiency mapping and the development of complex vectoring strategies based on this [
14,
15], especially in the case of multi-axle vehicles [
16,
17]. Some are based on wheel braking, but their purpose is to improve stability and maneuverability [
18,
19], and energy consumption is not a priority there. Efforts are also being made to develop a strategy that will improve both driving performance and efficiency [
20]. There are also solutions based on regenerative braking, in which part of the energy spent on vectoring by braking is recovered [
21,
22]. In addition, torque vectoring requires technical solutions that are much more complex than simple gearboxes [
23] or even independent drive for each wheel [
24,
25,
26,
27,
28].
Most of the studies cited above concern vehicles traveling on paved roads. In the case of off-road vehicles, performance analysis must take into account the different nature of the ground—the soil deforms, both horizontally and vertically, affecting the differential mechanism in a completely different way than paved ground. Heavy wheeled vehicles with high mobility have very high requirements for off-road capability [
29,
30]. Due to the phenomenon of circulating power in all-wheel drive vehicles, not only inter-wheel but also inter-axle differentials are used. For off-road trucks, this role is usually taken over by a transfer case, which distributes the drive torque to the individual axles of the vehicle. In this class of machines, transfer cases with a planetary differential mechanism are often used, which distribute torque to the axles in a fixed ratio. There is little literature on the analysis of the efficiency of off-road vehicles depending on the parameters of the central differential mechanism.
A comprehensive analysis of the traction performance of a four-wheel drive off-road vehicle was presented by Wong [
31]. The analysis focused mainly on slip efficiency. One of the most important conclusions is that in order for the slip efficiency of a four-wheel drive vehicle to reach its maximum value, the slip of the wheels on both axles must be the same. This can be obtained only when torque distribution matches load distribution over axles. The article presents the influence of torque and load distribution among the axles on slip efficiency for a vehicle with rigidly connected axles, with a differential mechanism and an overrunning clutch. In the analysis of the differential mechanism, no internal friction was assumed and no differences in the rolling resistance of the front and rear wheels were taken into account. The continuation of the research is presented in [
32]. The article discusses thrust-slip relationships and their impact on the optimal distribution of drive torque. The authors suggest that the requirement for equal slip under each wheel provides the basis for creating a wheel torque distribution strategy to achieve optimal or near-optimal slip efficiency. The article [
33] presents a mathematical model of a four-wheel drive vehicle with particular emphasis on the role of the viscous clutch. The authors conclude, among other things, that the distribution of torque between the front and rear axles should be proportional to the axle load in order to achieve the same axle slip, which is supposed to guarantee the highest traction efficiency. In article [
34], hardware-in-the-loop simulations were performed on an off-road vehicle with independent drive for each wheel climbing a hill in order to determine the optimal distribution of torque to individual wheels. However, the model does not take into account the parameters of deformable ground. Article [
35] presents methodologies for designing the electric drive transmission of a two-engine off-road vehicle with the aim of optimizing dynamic parameters and energy consumption. The methodology is based on simulations of a vehicle moving in a predefined cycle. However, these simulations also do not take into account the interaction with the soil.
In his article, Vantsevich [
36] presents a theoretical analysis of various factors, including, above all, torque distribution and differential lock on the efficiency of multi-wheeled vehicles. He distinguishes between mechanical losses in the drive system and in the wheel-ground system. Article [
37] presents a mathematical model of an off-road vehicle with an independent electric drive on four wheels and experimental research on a small vehicle moving in a soil tank. The presented model is designed to increase the efficiency of the vehicle by reducing slippage under individual wheels in stochastic terrain (soil). Also, article [
38], in which research on a similar four-wheel model vehicle with independent wheels was conducted, presents a strategy for distributing torque to the wheels in order to minimize energy losses associated with the slippage of each wheel. The authors [
38] developed a mathematical model to determine the efficiency of an off-road vehicle depending on the torque distribution between the front and rear axles. The model takes into account tire stiffness, the multipass effect, and torque distribution, but does not consider the influence of differential friction. As can be seen, most studies on the traction performance of off-road vehicles aim to develop strategies to minimize wheel slip.
The above analyses are generally based on parametric models of vehicle–environment interactions. Their purpose is to predict performance in terms of energy consumption or off-road mobility. However, these models can be used in a much wider range of applications. Other examples include the development of power supply strategies for heavy hybrid-powered mining dump trucks [
39] or the prediction of component reliability in such machines based on estimated loads during different operating modes [
40]. These are further applications of parametric vehicle modeling that support the design and operation of sustainable off-road vehicles.
Due to the complexity of the problem, most analyses are theoretical, and only a few models have been validated experimentally, but only to a limited extent or on a scaled model in laboratory conditions [
32,
37,
41,
42]. This is due to both the complexity of the drive train and the difficulty in preparing repeatable measurement conditions for this class of machines [
43].
For off-road vehicles, most of the motion resistance comes from ground deformation, so when optimizing the differential mechanism in an off-road vehicle, it is necessary to take into account the vehicle-soil interaction. The main objective of this article is to assess the impact of differential friction and the torque distribution between the axles of the differential mechanism of a heavy off-road truck’s transfer case on its tractive efficiency. The article focuses on the impact of the ground on the operation of the differential mechanism and, consequently, on the efficiency of the entire drive train.
2. Mathematical Model
For the purposes of this analysis, a mathematical model of an off-road vehicle was developed and implemented in the MATLAB/Simulink environment. It is a model of a truck with front-wheel drive (FWD), rear-wheel drive (RWD), or four-wheel drive (4WD), with a central differential in the transfer case and reduction gears in the wheels. The following assumptions were made when creating the vehicle model:
The vehicle is longitudinally symmetrical, i.e., the left and right wheels operate under identical conditions. There is no torque differentiation within a single axle.
Axle loads are constant throughout the simulation. Shifts in the center of gravity due to sinkage, inertia, drawbar pull, or aerodynamic drag do not cause changes in axle load.
Aerodynamic drag and hill climb resistance are not calculated as separate resistances. It is assumed that they are included in the drawbar pull.
The model only takes into account the external resistance of the wheel’s interaction with the ground and the internal friction of the differential in open mode. All other vehicle components are treated as ideal.
The friction coefficient of the differential mechanism is independent of load and speed.
In open mode, the transfer case differential mechanism distributes torque proportionally to the torque bias between axles. In closed mode, it distributes torque proportionally to the resistance on each axle.
The wheels are perfectly rigid.
The rear wheels follow the tracks of the front wheels.
The vehicle moves on flat, uniform ground.
Three types of soil were used for the simulation, differing in bearing capacity, shear strength, and shear stress—shear strain relationship. The soil parameters were based on data from the literature.
2.1. Wheel—Soil Interaction Model
The model of wheel-soil interaction was based on the model presented by Wong [
44], therefore it will only be briefly described here, especially the elements that have been modified. An explanation of the meaning of individual symbols relating to soil parameters used in this article and their physical interpretation can be found in that reference. The vehicle is driving at speed
. For wheels with radius
rolling at angular velocity
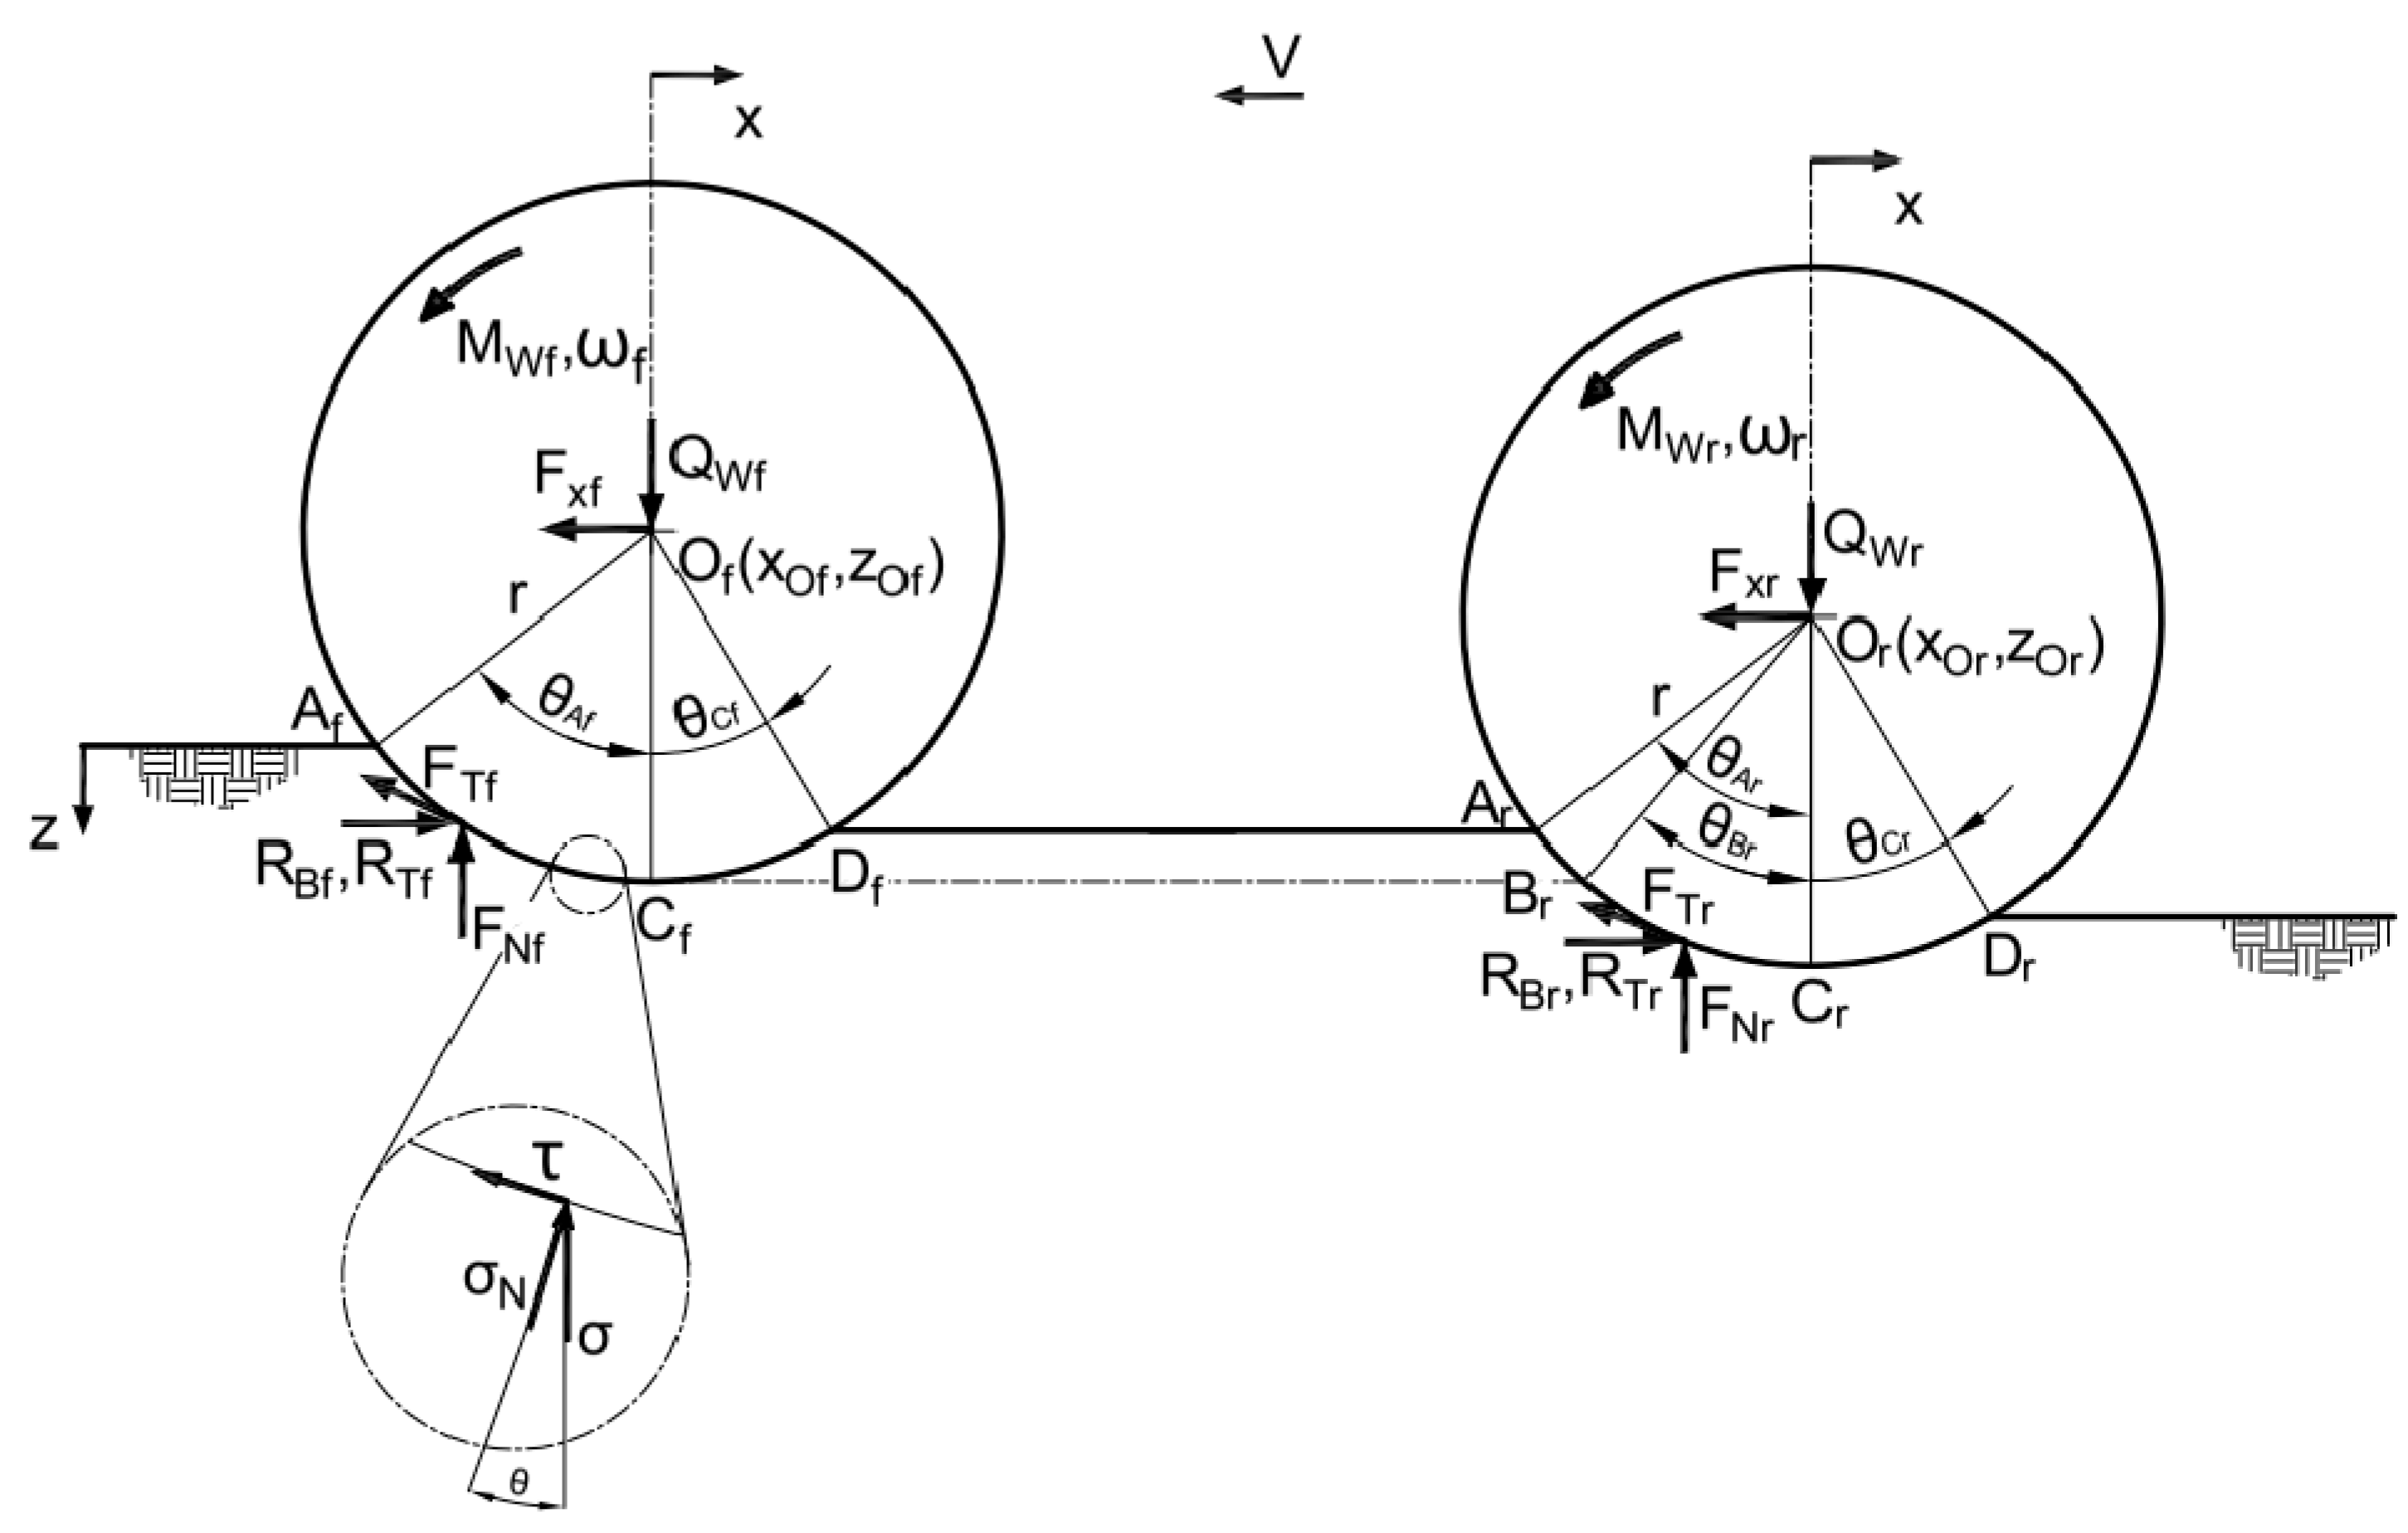
on the ground, a Cartesian coordinate system with axes as shown in
Figure 1 was adopted. The model takes into account the multipass phenomenon, described in more detail in [
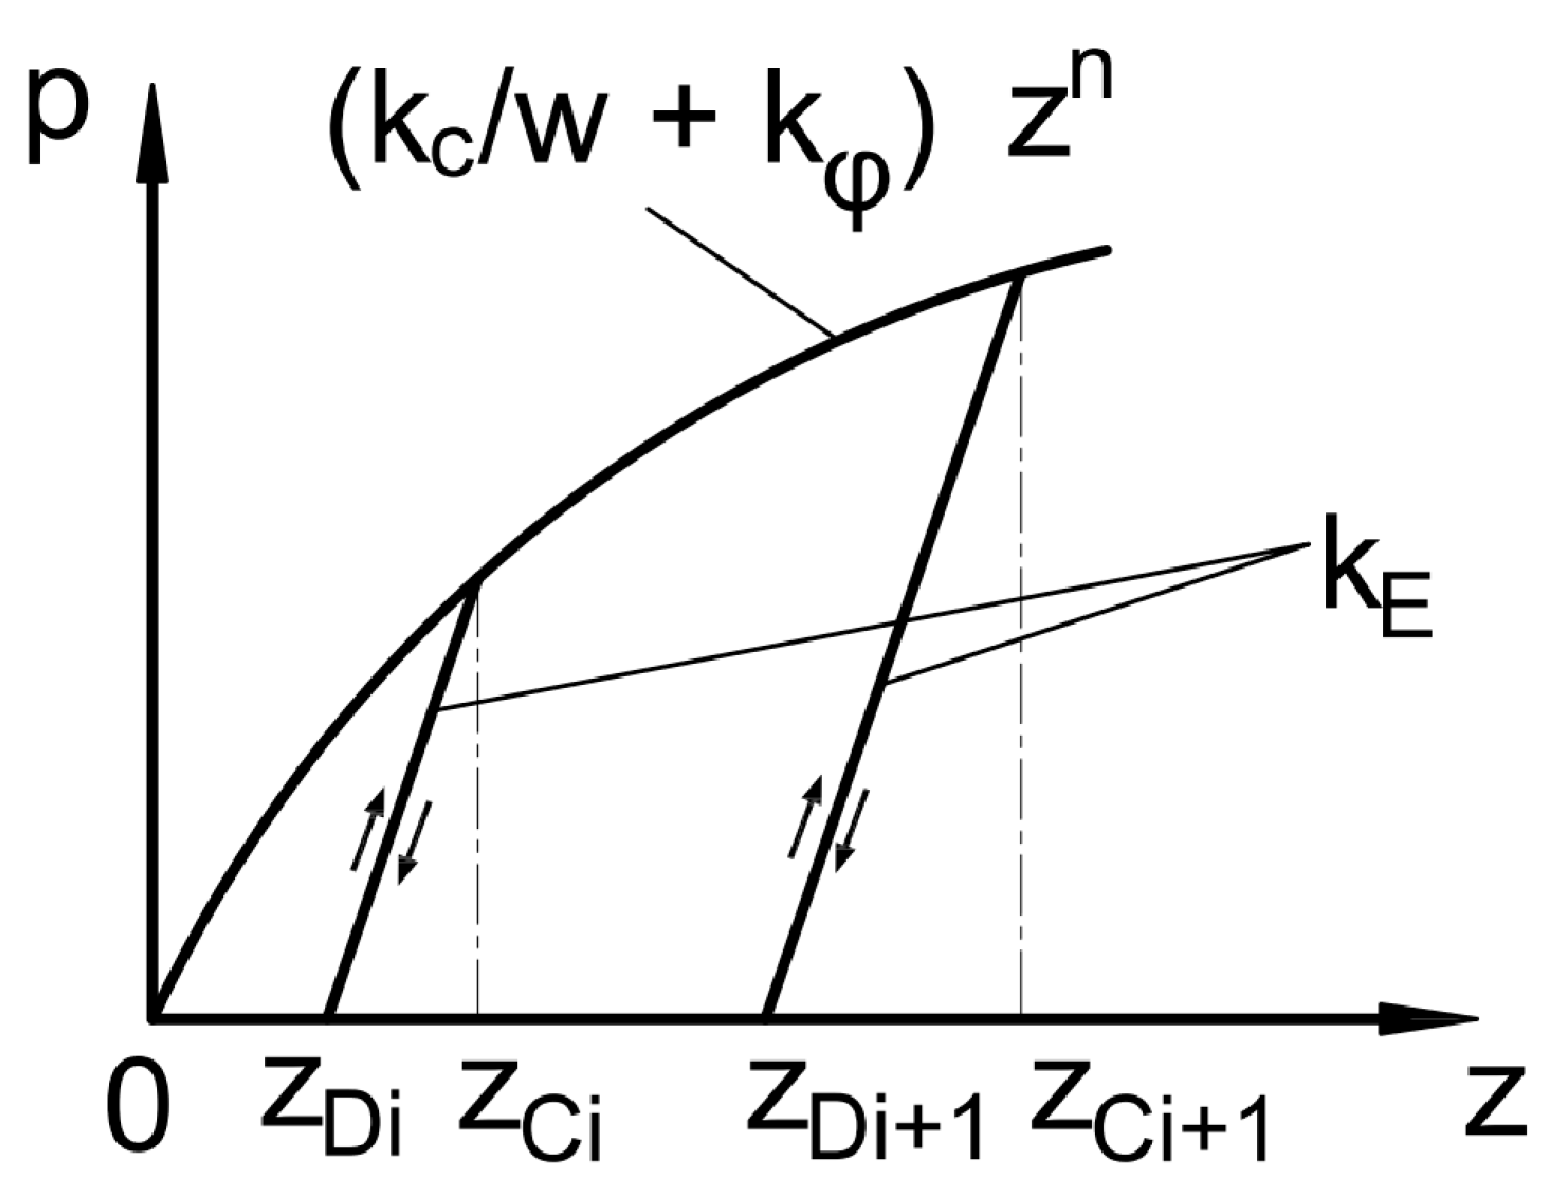
45], among others. It assumes that subsequent wheels moving along the same track sink less because the ground has already been compacted by the preceding wheels. A visual representation of the pressure—sinkage relationship, taking into account repetitive vertical loading, is shown in
Figure 2. The first wheel moves on undisturbed soil. In section
–
, the soil is primarily loaded, which corresponds to the primary compressibility curve
–
, and in section
–
, it is unloaded, which corresponds to the secondary compressibility curve in section
–
. In the case of the second wheel, the first section
–
loads the already compressed ground. Such ground is characterized by a different, usually much higher stiffness [
46]. The pressure—sinkage relationship for this section is represented by the straight line
–
. The further section of the second wheel
–
again corresponds to the primary compressibility curve
–
and the secondary compressibility curve on the section
–
. Further in the text, the indices
and
refer to the front and rear wheels or axles, respectively.
For the primary compressibility curve, Bekker’s pressure—sinkage parameters were adopted. This approach to testing the bearing capacity of substrates is probably the most commonly used for testing vehicle-terrain relations [
47,
48]. The equation for the relationship between pressure
and sinkage
is as follows:
For both wheels, the equation of the wheel contour (circle) and angle
was adopted in the form:
In order to determine the value of the pull force
, it is first necessary to determine the wheel sinkage depth
. It was assumed that the load from the wheel
is balanced by the vertical component of the normal stress
and the tangential (shear) stress
to the wheel surface. The equilibrium equation is as follows:
where
The well-known Janosi-Hanamoto equation [
49] was adopted as the equation of shear stress for sand and sandy loam. This equation describes the shearing of soils in which the shear strength
increases asymptotically with displacement:
For clayey loam, however, Wong’s equation [
50] applies. This is an equation for soils that reach their maximum shear strength
for small displacements, after which they asymptotically decrease:
The horizontal shear displacement of soil
is determined from the relationship:
where
is the slip of the driven wheel defined as:
The term refers to the wheel—ground contact section –, where the primary compression of the ground occurs, while refers to the unloading of the ground in the section –. The terms refer to shear under the corresponding sections.
For the rear wheel, these relationships take the form:
where
Shear stresses, similarly to those for the front wheel, are calculated using Equations (9) and (10).
The term refers to secondary soil compression under the second wheel in the section –, refers to the wheel-soil contact section in the section –, where primary soil compression occurs, and refers to soil unloading in the section –. The terms refer to shear under the corresponding sections.
Knowing the depth
, the rut depth
can be determined.
The coordinate of the rear wheel is equal to of the front wheel.
The wheel pull force is calculated from the equilibrium conditions along the horizontal axis:
where
—tractive force;
—rolling resistance force resulting from vertical soil deformation;
—the resistance force resulting from soil displacement in front of the wheel (bulldozing resistance).
The tractive force is determined as the horizontal component from Equation (9) or (10). The rolling resistance force is determined as the horizontal component of the normal stress (Equations (5) and (6) or (13)–(15)).
The bulldozing resistance is determined by analogy to a retaining wall and the calculation method is described in [
51,
52]. The Brinch Hansen method [
53] was used to determine the bearing capacity coefficients. The consideration of bulldozing resistance is debatable, as the literature [
54,
55] shows that its influence on total resistance increases rapidly for sinkage depths
above 0.1. For lower sinkages its influence is low. In this work, bulldozing resistance was taken into account in the simulations regardless of the sinkage depth, but its influence on the simulation results was also investigated.
The driving torque is determined from the equilibrium of torques around the wheel axis:
where
—dynamic radius of the wheel (equal to wheel radius);
—moment of inertia of the wheel together with the half-shaft;
—resultant wheel vertical pressure force;
—horizontal distance of the resultant pressure force from the wheel axis;
—vertical distance of the resultant force from the wheel axis;
—vertical distance of the resultant force from the wheel axis.
2.2. Vehicle and Driveline Model
The model presented in this article only takes into account the horizontal balance of forces acting on the vehicle. Consequently, the total drawbar pull is:
where
—tractive force under the front and rear wheels;
—rolling resistance of the front and rear wheels;
—bulldozing resistance of the front and rear wheels;
—resistance due to inertia of the vehicle.
The model assumes that the transfer case is equipped with a differential mechanism with constant friction and constant torque bias. The behavior of the mechanism reflects the actual power flow conditions and meets the following three conditions:
—total output torque from the transfer case;
—input torque to the transfer case;
—friction torque in the differential mechanism;
—open mode coefficient of friction;
—angular speeds of the output shafts.
When the differential is locked (), it divides the torques between the two axles in proportion to their load. When the differential is open () the slower axle receives torque in proportion to the mechanism torque bias, increased by half of the differential friction torque, and the faster axle receives torque decreased by half of the differential friction torque.
—moments of resistance on the output shafts of the transfer case;
—output torques from the transfer case to the front and rear shafts;
—transfer case torque bias, expressed as a percentage of the torque transmitted to the rear axle relative to the total torque .
—angular speed of the input shaft to the differential mechanism.
2.3. Algorithm Description
The mathematical model was implemented in the MATLAB/Simulink environment. The algorithm operates in a loop, at the beginning of which the drive torque
is set, which corresponds to the output torque from the gearbox. The torque value is regulated by a PID controller, which measures deviation of the speed V of vehicle from the set value. The simulation time was selected long enough so that each simulation reached a state that could be considered steady at the end (speed change per second less than 0.0005% of the set value).
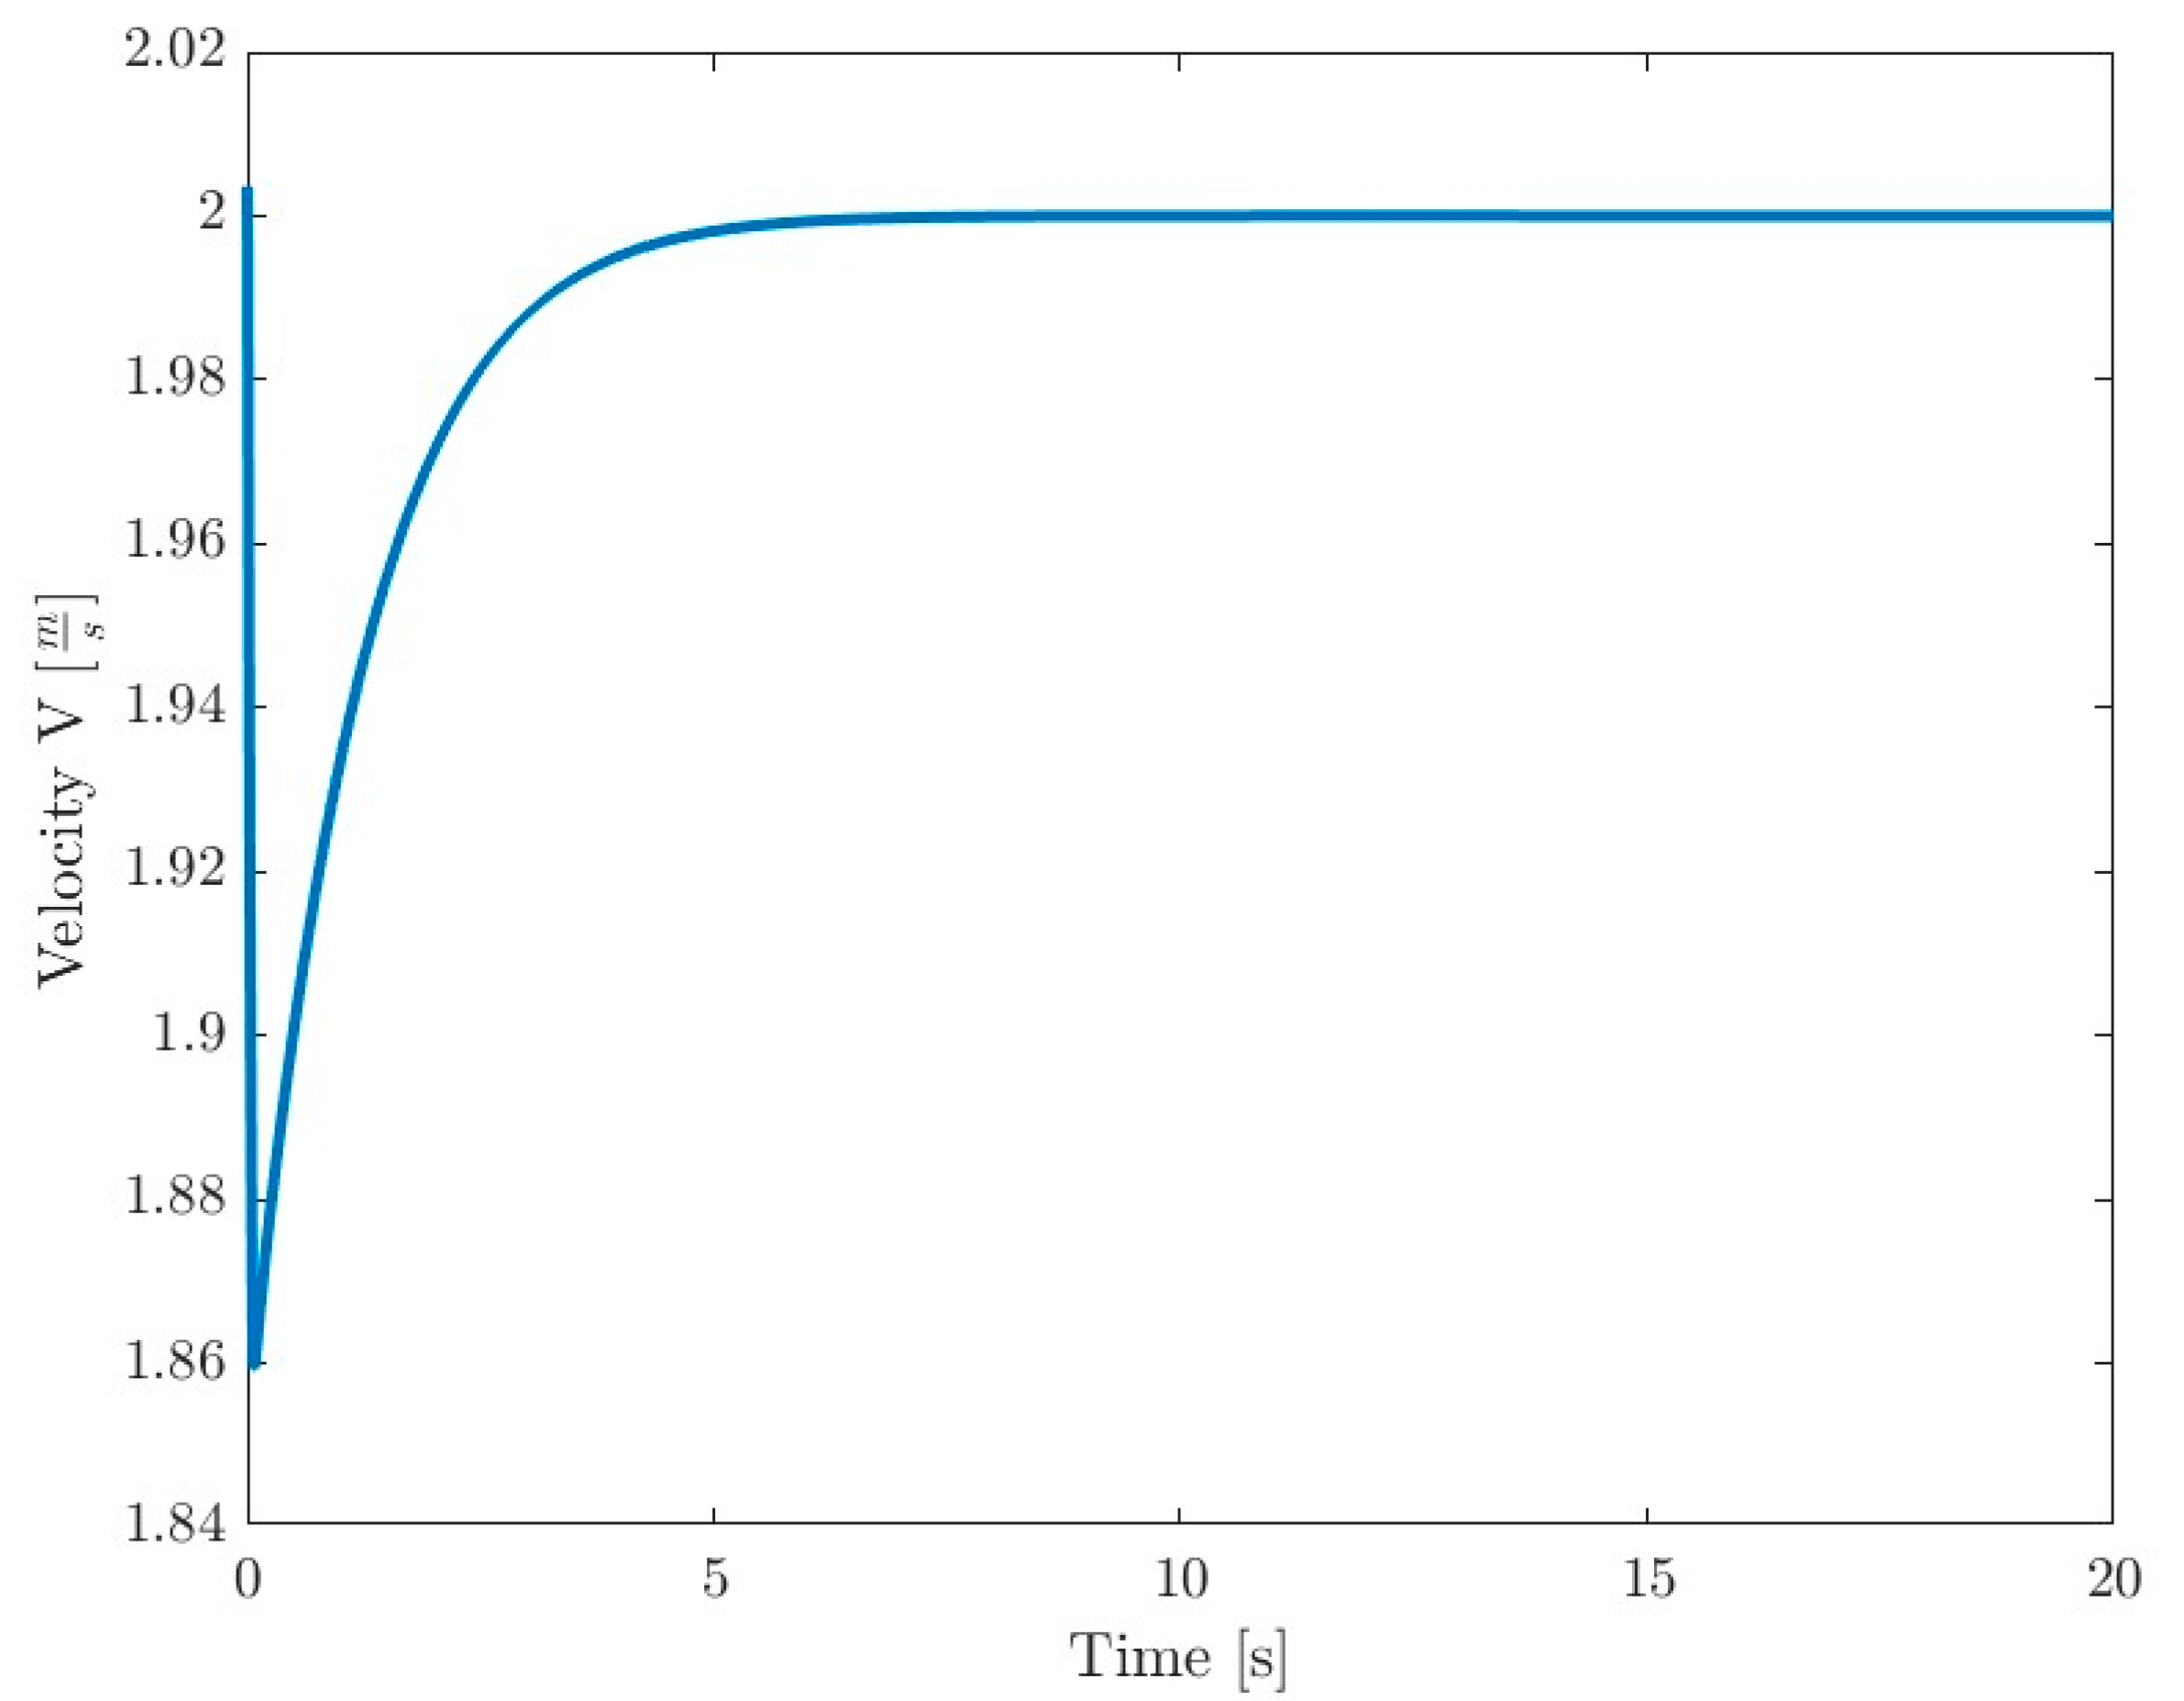
Figure 3 shows an example of the speed curve during the simulation. At the end of each calculation loop, the tested parameters are determined and recorded. If the traction parameters of the ground are insufficient for the given conditions, the vehicle may be immobilized due to slippage. In such a situation, when the vehicle speed drops to 0, and the simulation is interrupted. The efficiency in this case is 0.
In order to determine the efficiency of a vehicle moving off-road, it was necessary to define a measure of this efficiency. It was assumed that the total efficiency is the traction efficiency, i.e., the ability of the vehicle to convert the power of the drive unit
into drawbar power
:
Assuming that the transmission efficiency is
and
is the theoretical speed of the vehicle resulting from the angular velocity of the wheels rolling without slippage, the relationship between the input power and the power delivered to the wheel will be:
—mechanical efficiency of movement describing losses in the conversion of tractive force into pull force;
—slip efficiency describing losses associated with a reduction in vehicle speed as a result of wheel slip.
Since the only resistance in the drive train that was taken into account is the differential friction of the mechanism, the transmission efficiency is as follows:
The simulations used the axle load ratio in the form:
Unless other parameters are specified in the text, the simulations were performed using the parameters given in
Table 1. These parameters correspond to medium and heavy off-road trucks. The soil parameters used in the simulations are presented in
Table 2. A complete set of soil parameters needed as input data for the model can be obtained by performing measurements with a bevameter. The principle of operation and the procedure for measurement and data analysis are given in [
44,
52]. Due to the lack of data on the secondary stiffness
of the soils used, it was estimated on the basis of similar data in [
50] as ten times the stiffness
.
The variables in the model were: the friction coefficient of the differential in open mode , the vehicle axle load ratio , the torque bias between the axles , the type of ground, and the drawbar pull .
The friction coefficient of the differential mechanism for classic differential mechanisms is approximately a few percent [
11]. In solutions using increased friction, such as limited slip differentials, the friction coefficient increases even several times [
56,
57,
58]. For this reason, simulations were performed for friction coefficients ranging from 0 to 0.4 to reflect the possible range of friction between the axles. The simulations presented did not consider the influence of speed or load on the friction coefficient. Thus, no specific design solutions are considered, only the influence of internal resistance between the vehicle axles.
Friction was graded to an accuracy of 0.1. The axle load ratio was assumed to be in the range of 0.3–0.7, which is slightly wider than the actual load ratios for heavy trucks, where 0.3 corresponds to an unloaded truck and 0.7 to a fully loaded truck. It was graded in increments of 0.1 to account for partial load variants. Torque bias in commercial interaxle differentials occurs over a very wide range, which is why was varied from 0 to 1 with an accuracy of 0.1, where 0 means front-wheel drive only and 1 means rear-wheel drive only.
2.4. Model Verification
Numerous checks of the simulation model were carried out at various stages of its development to ensure that it reflected the assumptions of the mathematical model. Below are a few selected tests with their results confirming its correct formulation.
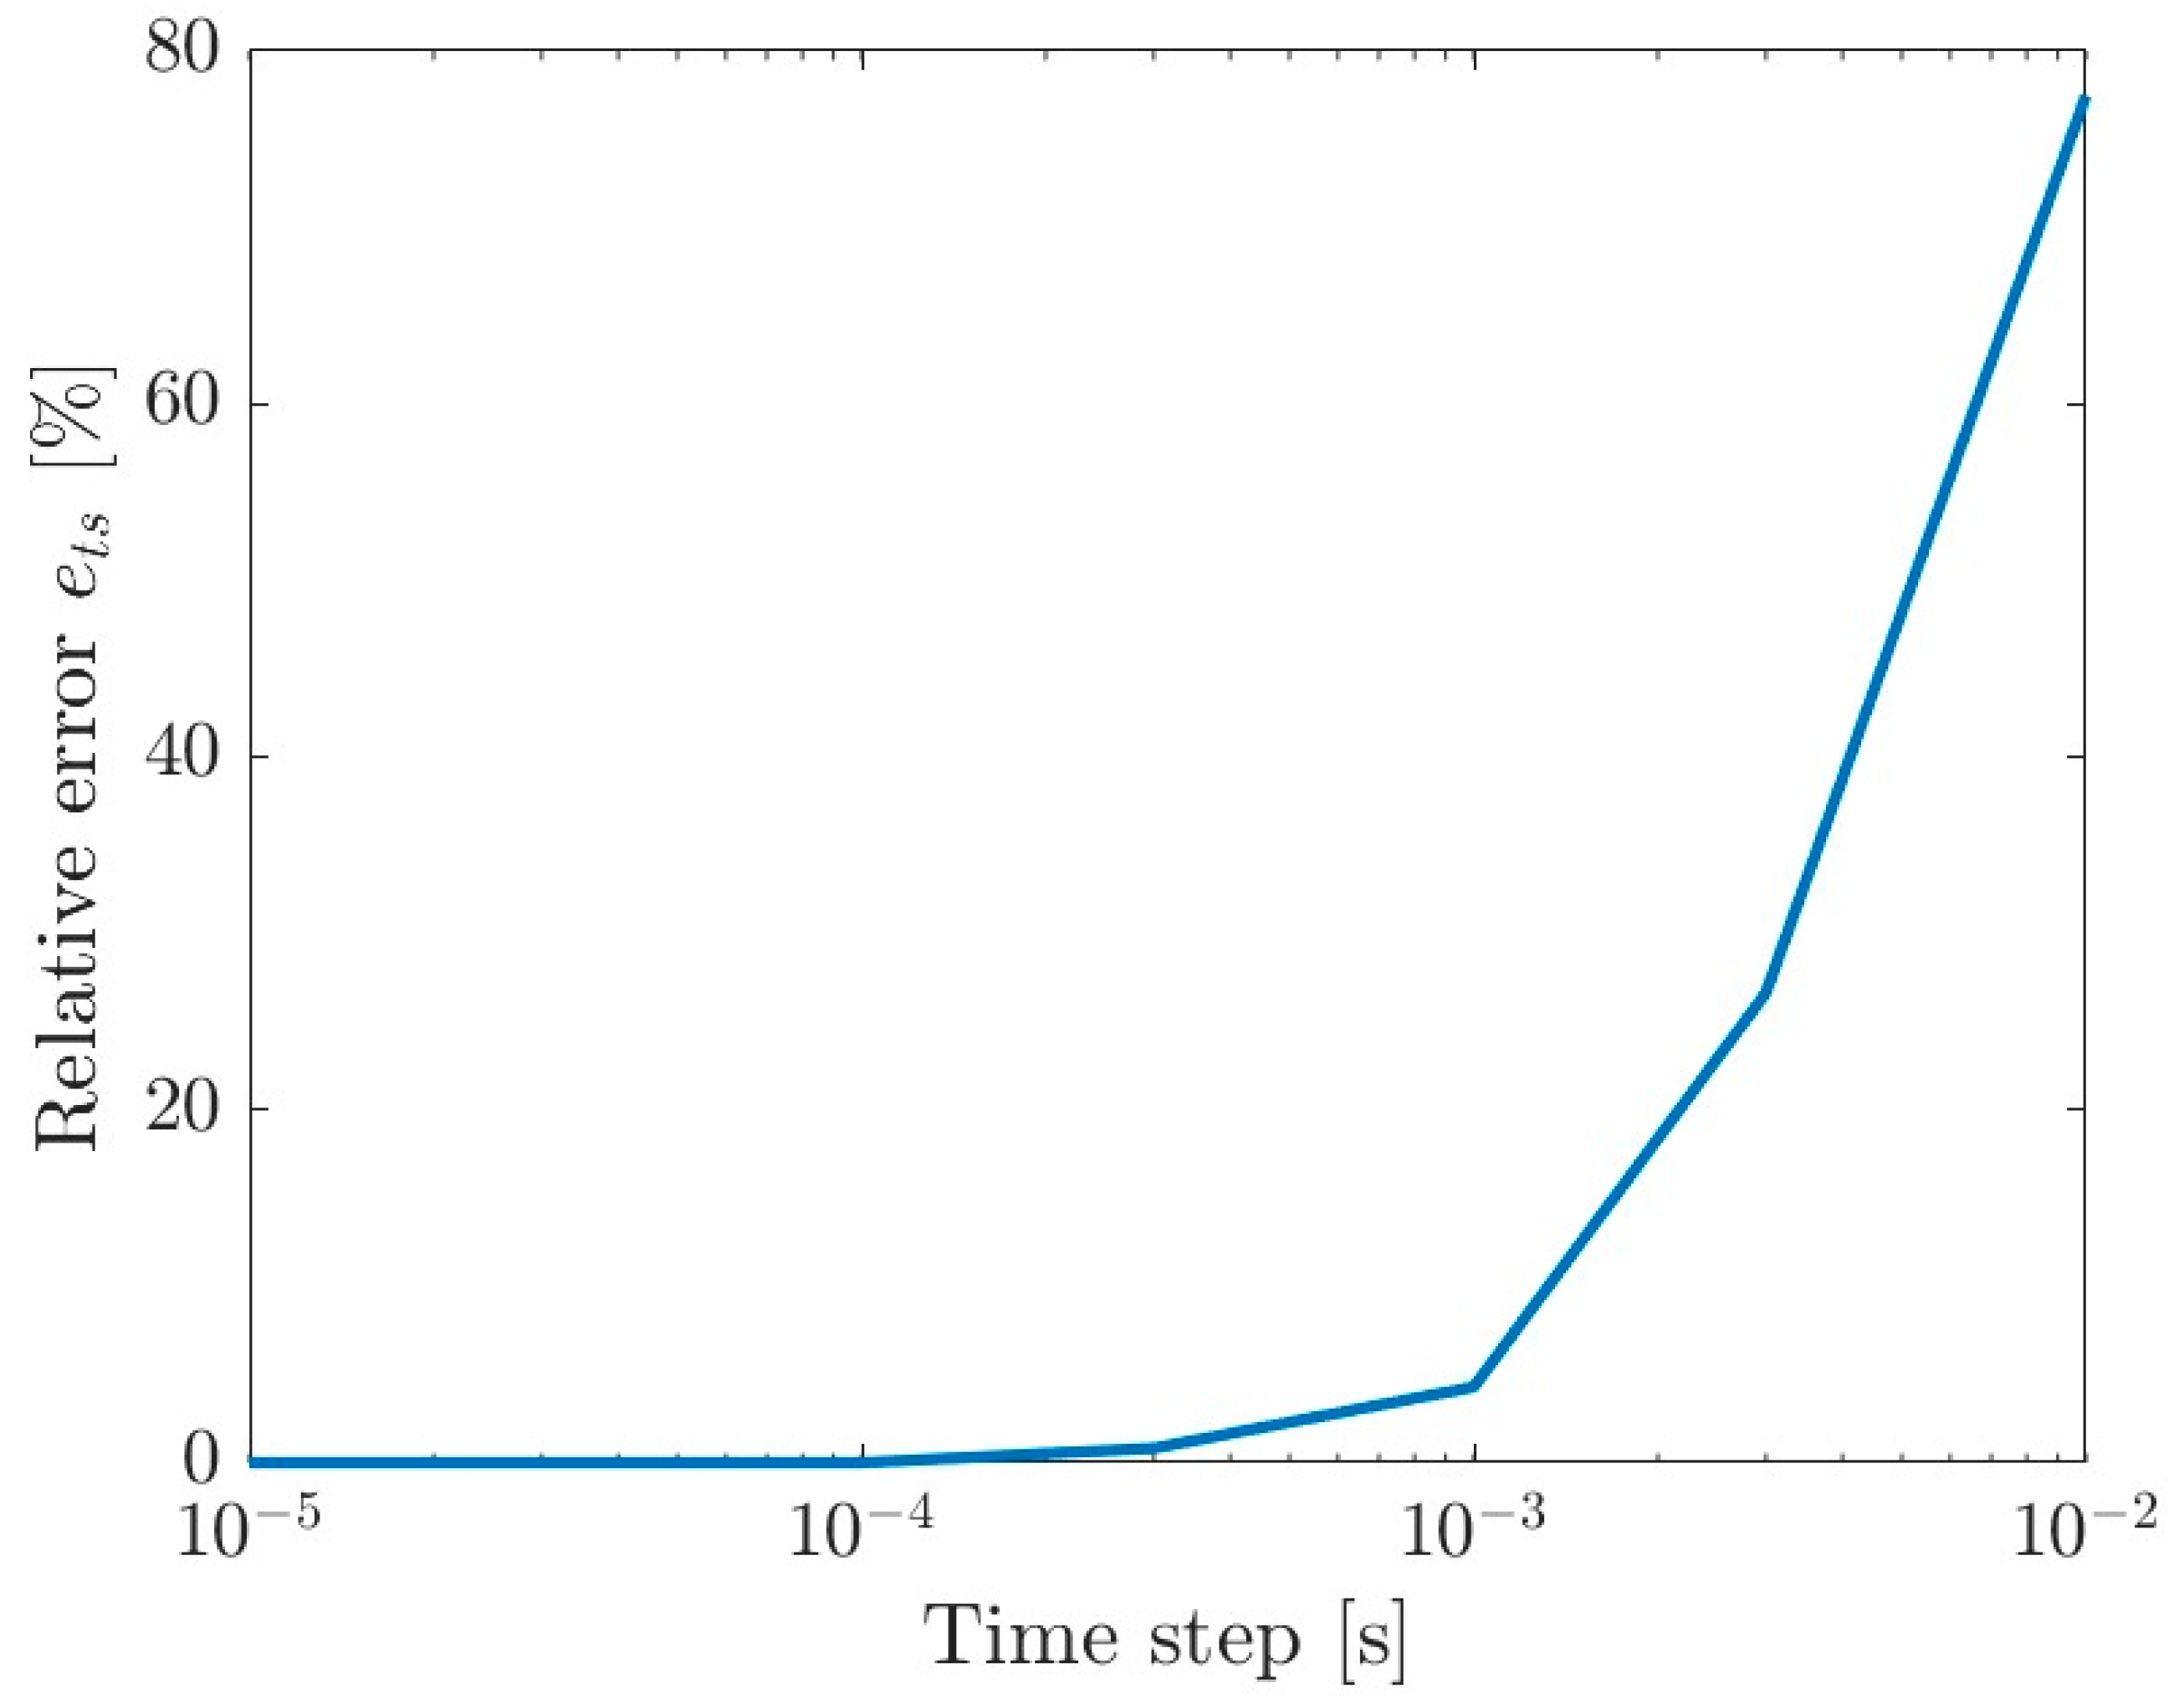
The basic test was to determine the sensitivity of the model to the time step of the simulation and select its appropriate value. For this purpose, reference simulations were performed with different time steps ranging from 0.00001 to 0.01 s. In each simulation, the tractive efficiency
was determined. It was then compared with the efficiency obtained in the simulation with a shorter time step
, obtaining a relative error related to the selected simulation step according to the formula:
As shown in
Figure 4, the error decreases with decreasing time step. On this basis, a step size of
= 0.0001 s was selected for the simulation, for which the relative error is 2.97 × 10
−8%. Further reduction in the time step significantly increases the simulation time with a negligible reduction in error.
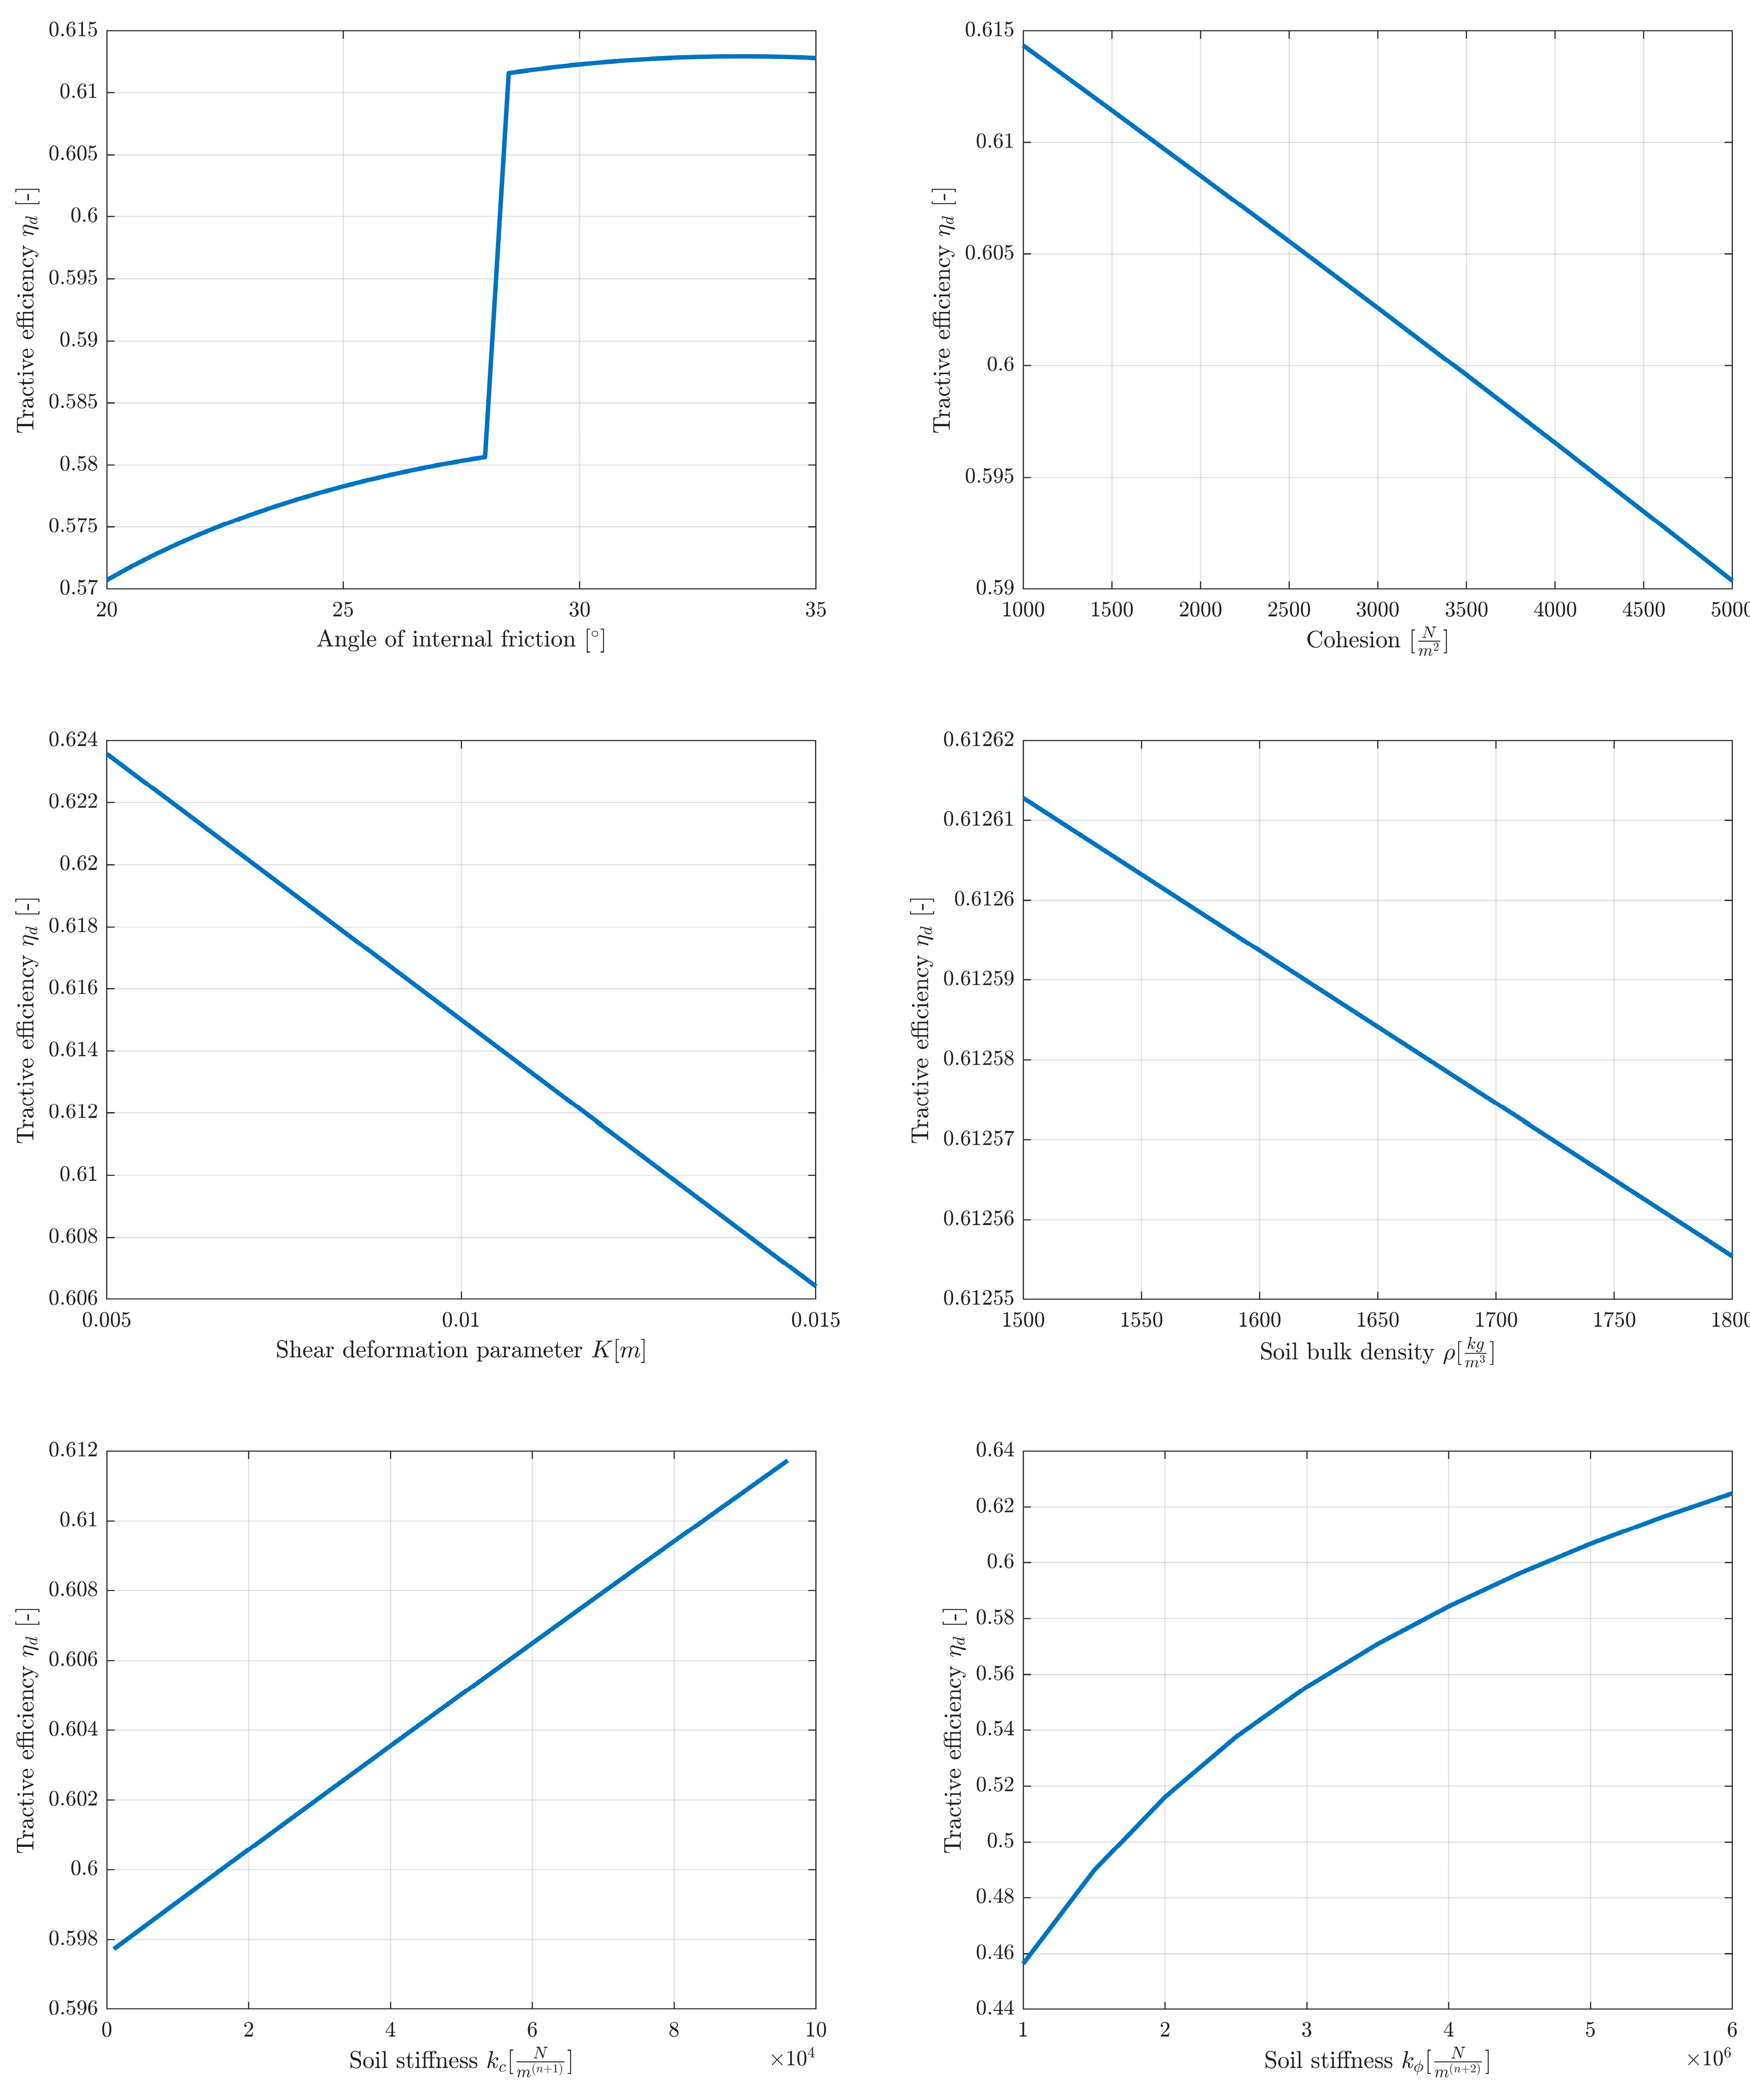
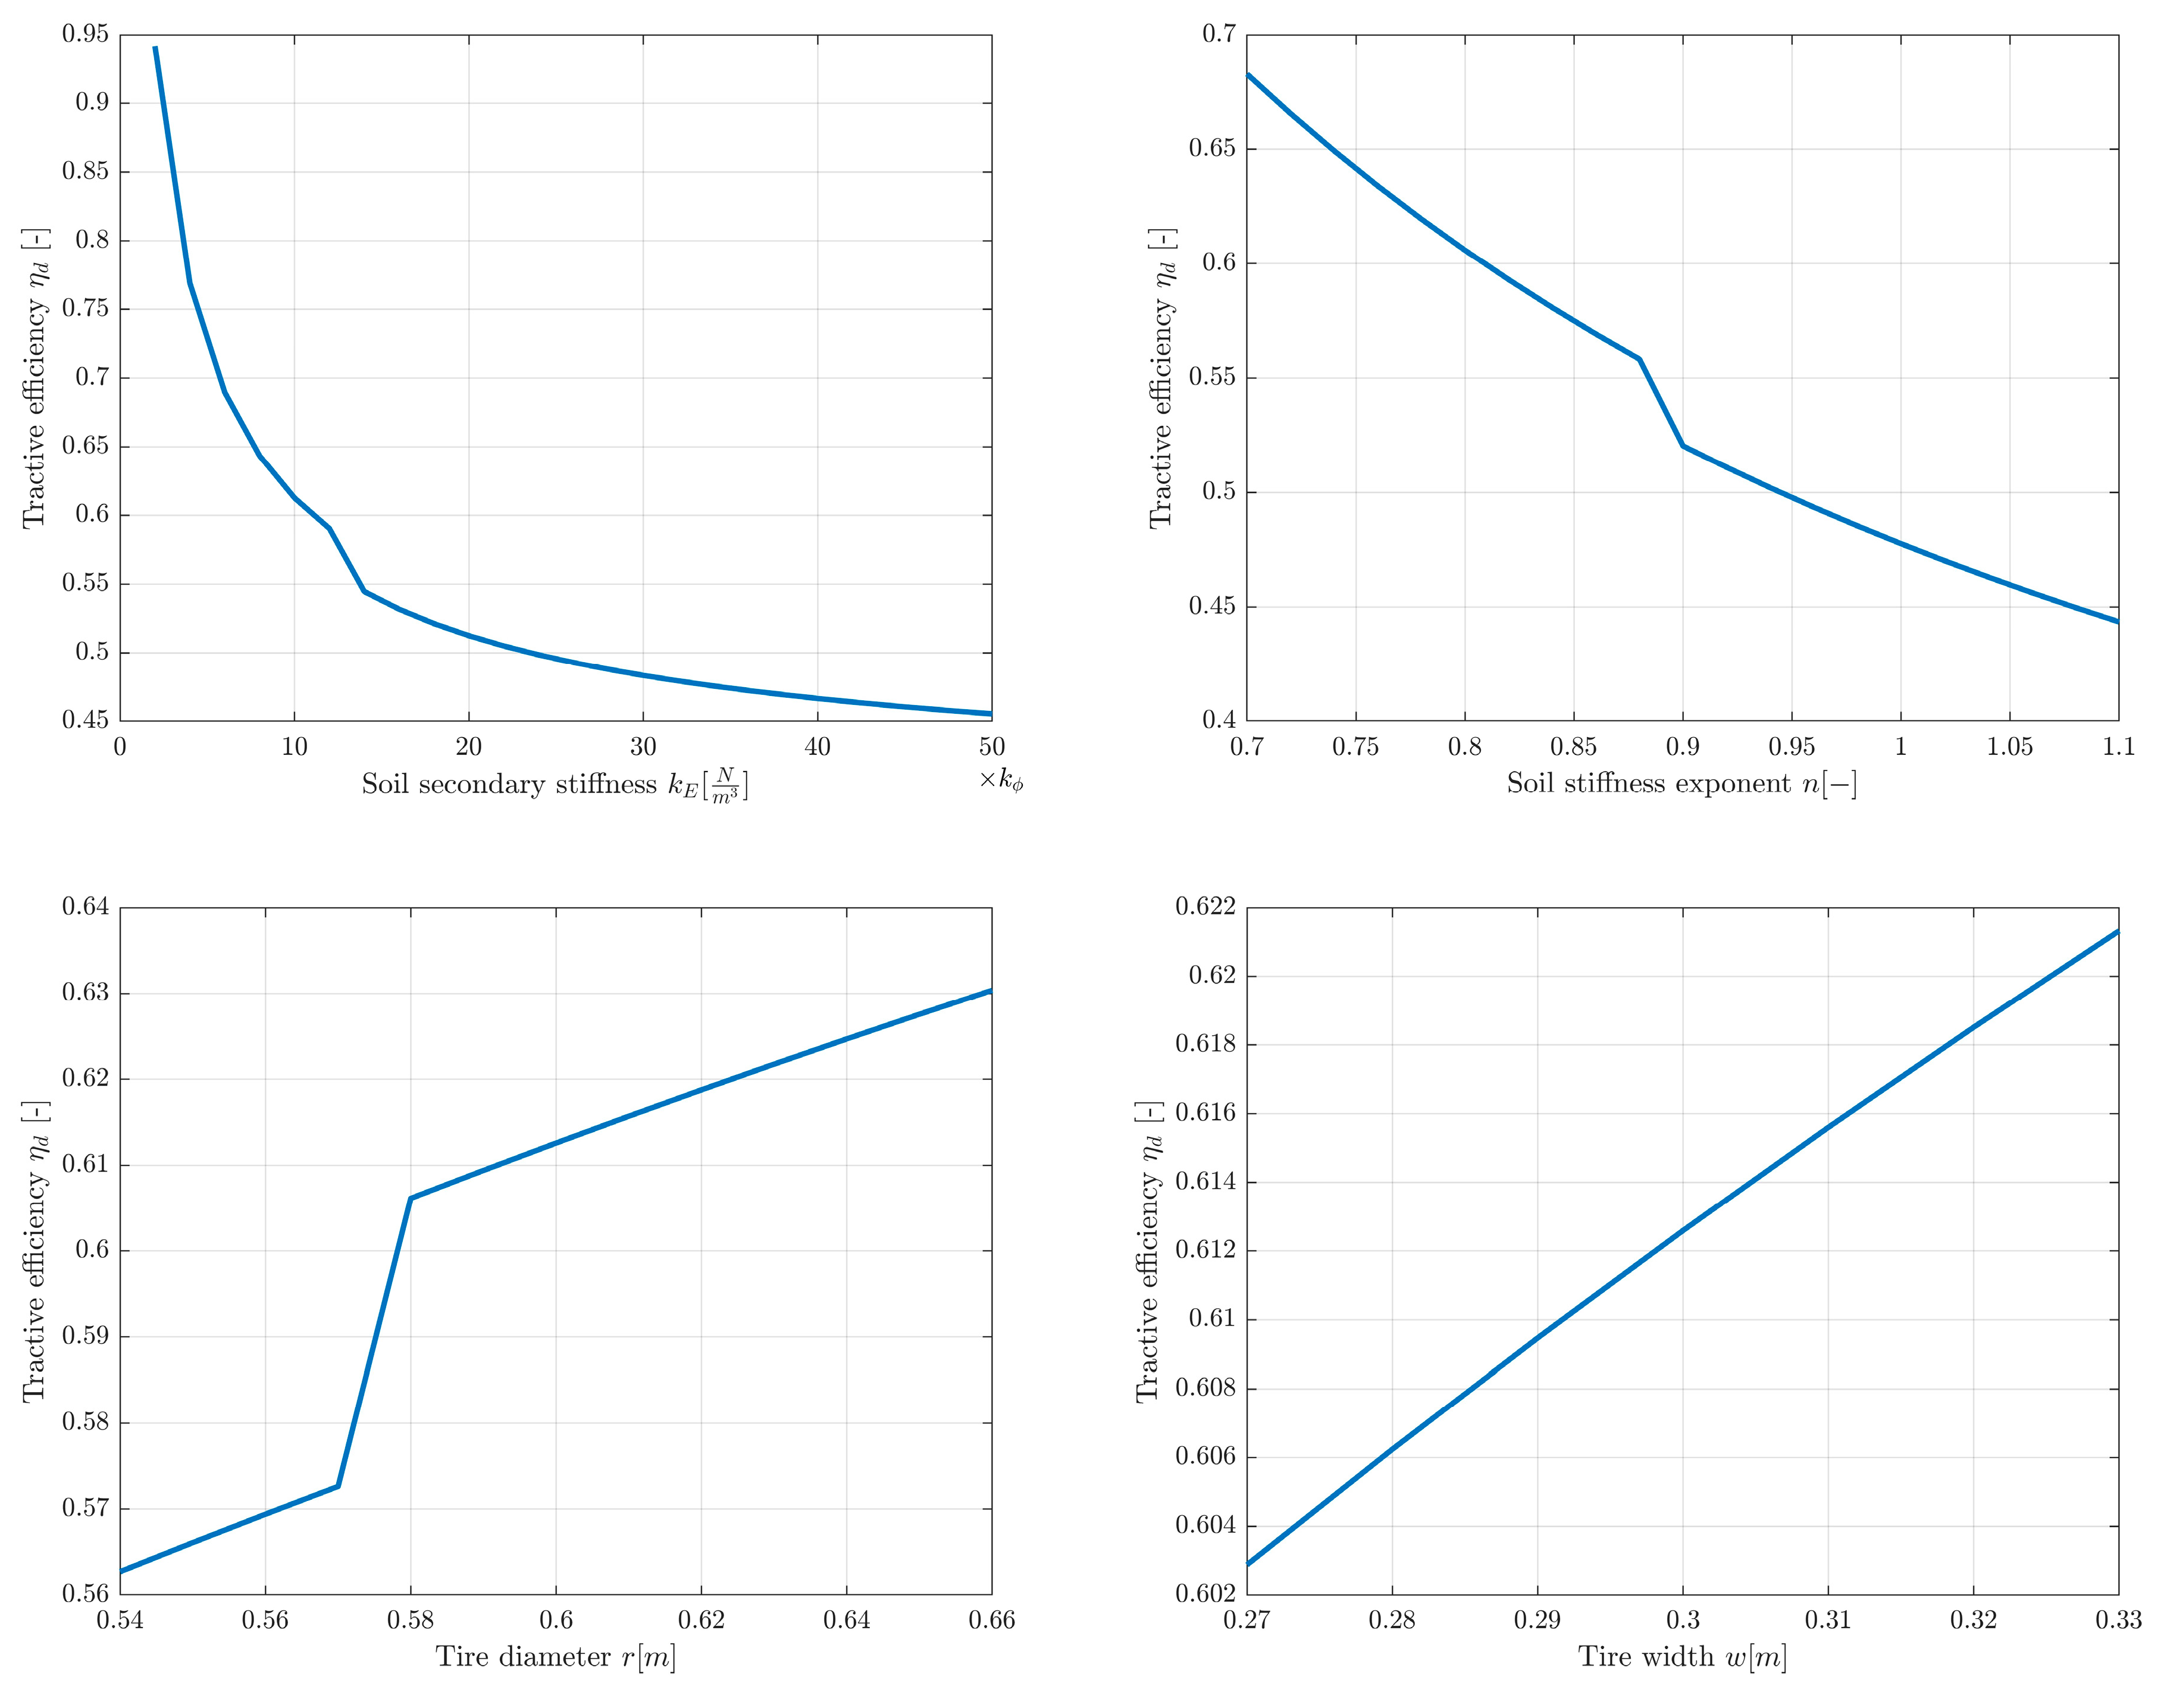
Next, a parameter sensitivity study of the model was carried out. These were one-at-a-time tests, i.e., only one parameter was changed in each simulation. The impact of changes in all soil parameters, wheel diameter and width was examined. These simulations were carried out for sand. The range of parameters reflected the approximate values available in the literature for sand [
42]. In the case of secondary stiffness, its value was expressed as a multiple of the stiffness
. Traction efficiency was taken as a measure of the parameter’s influence on the model. The results are presented in the graphs in
Figure 5.
Of all the parameters tested within the accepted ranges, the model showed the highest sensitivity to changes in secondary stiffness and soil stiffness exponent . Therefore, when using the model to predict the behavior of a specific vehicle in a specific terrain, care should be taken to obtain these parameters with particular attention. The shear deformation parameter , soil density , and tire width have little effect on the results. The step visible in some graphs corresponds to the parameter value at which the differential changes its operating mode (from open to closed or vice versa). The slight decrease in efficiency with increasing cohesion results from the greater influence of cohesion on bulldozing resistance than on the generated traction force for the given parameters. In a simulation with bulldozing resistance turned off, cohesion has a slightly positive effect on efficiency. The results of the sensitivity analysis are consistent with the predictions and physical interpretation of the individual parameters in the model.
Next, simulations were performed to check the model’s response to selected inputs.
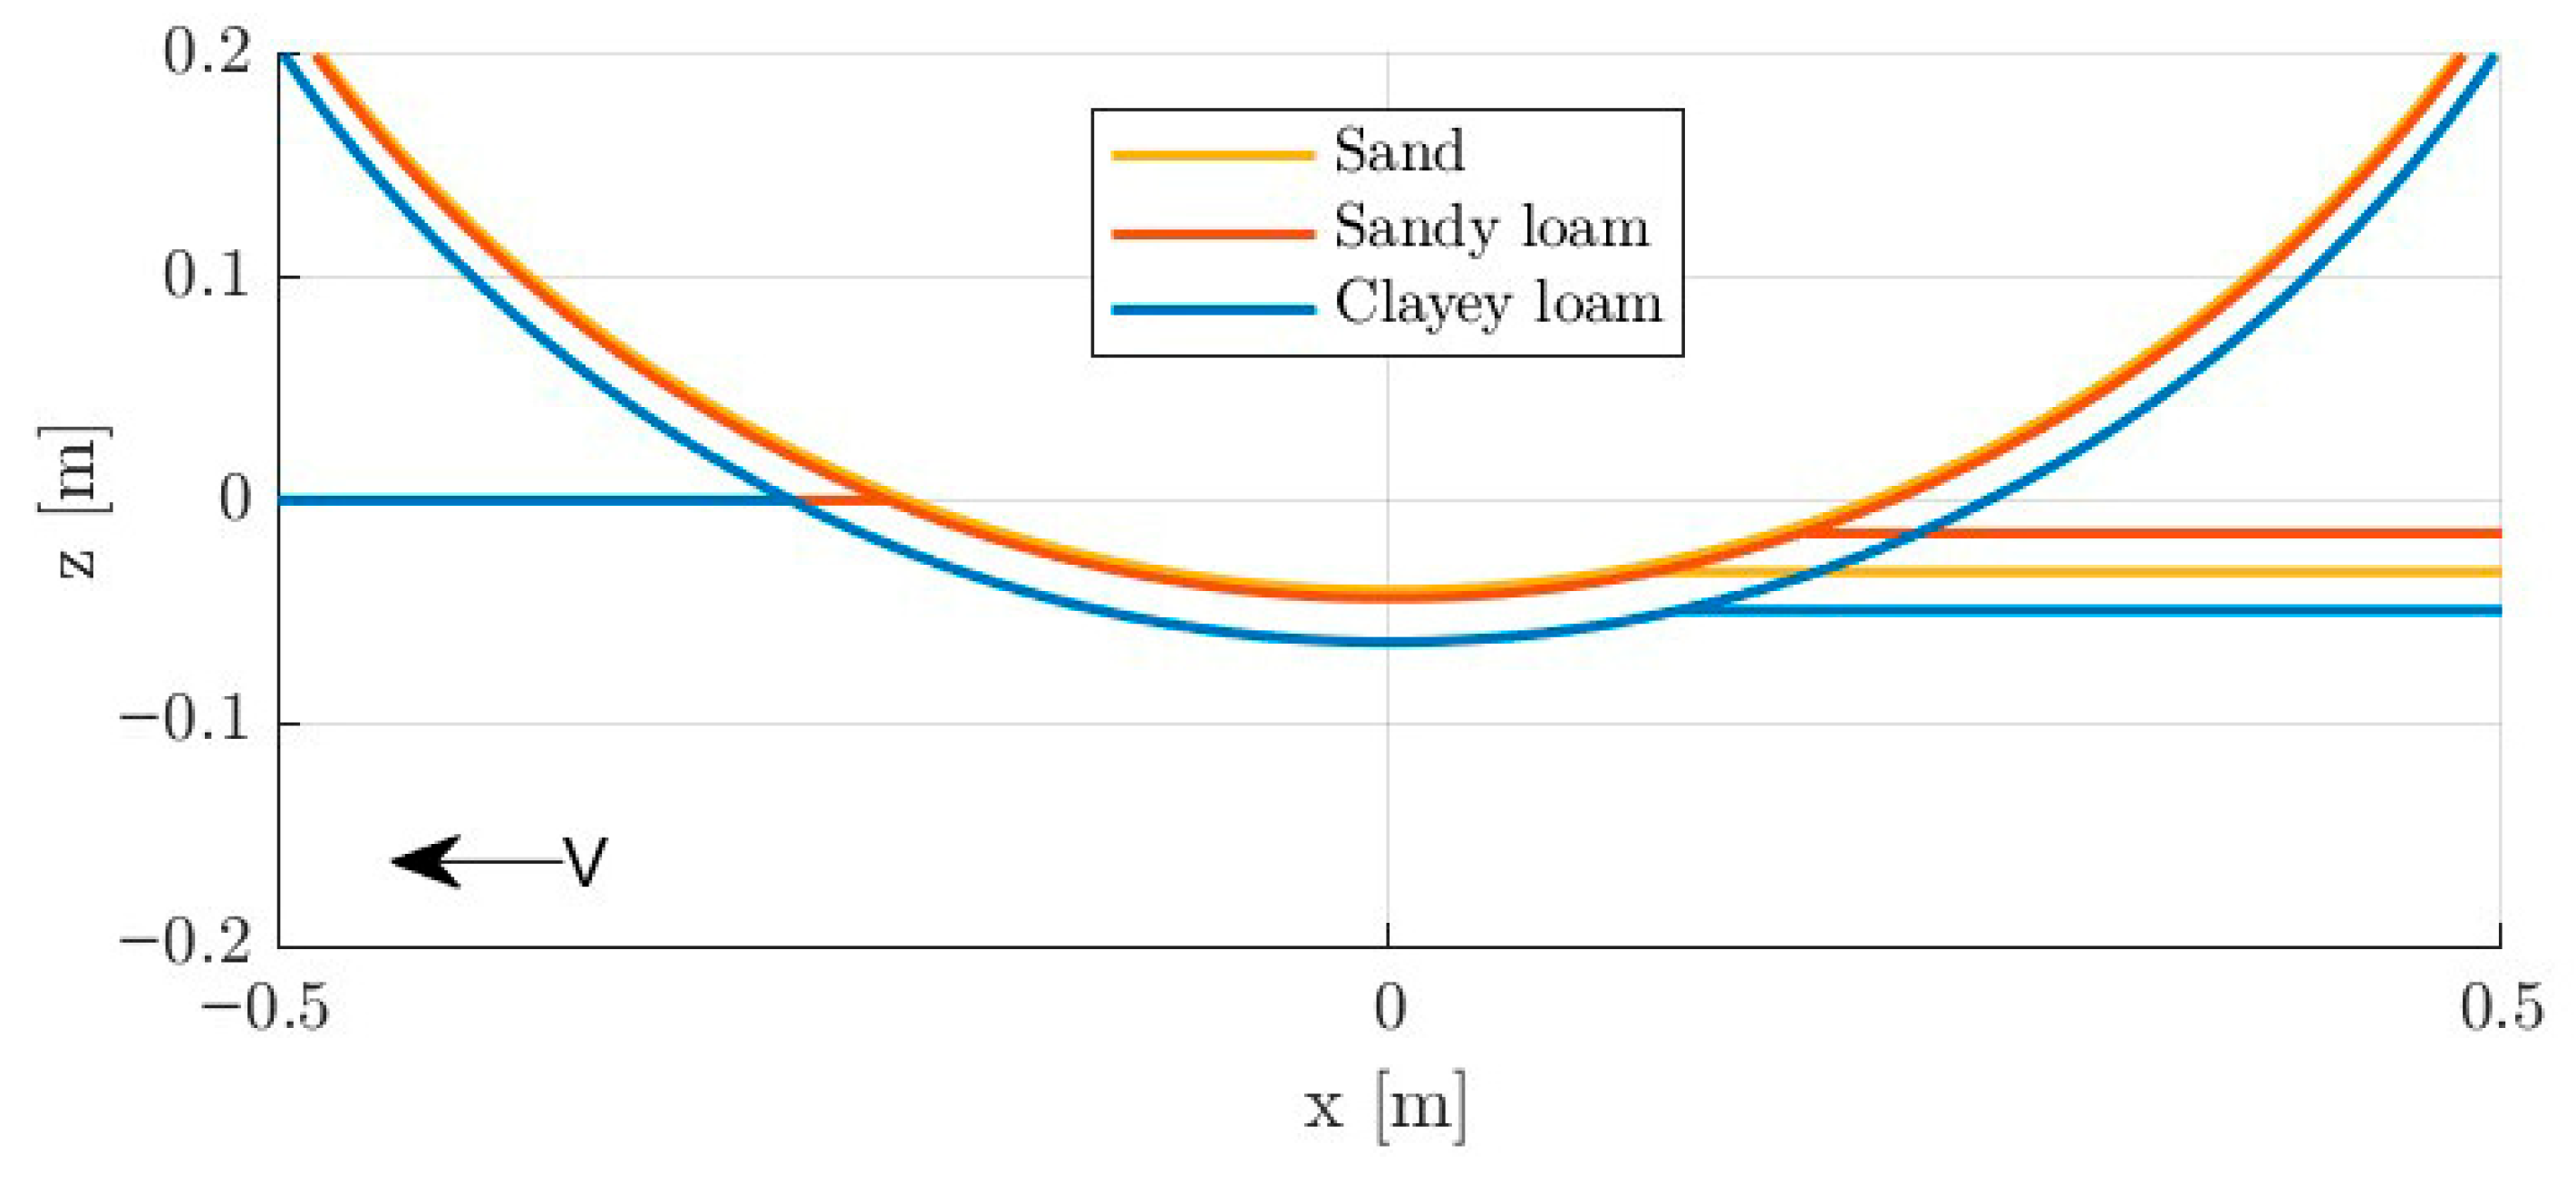
Figure 6 shows the contour of a wheel sinking into three simulated types of soil. The depth of sinkage varies according to the assumed soil stiffness, and the rut visible to the right of the wheel has a depth proportional to the secondary stiffness coefficient
.
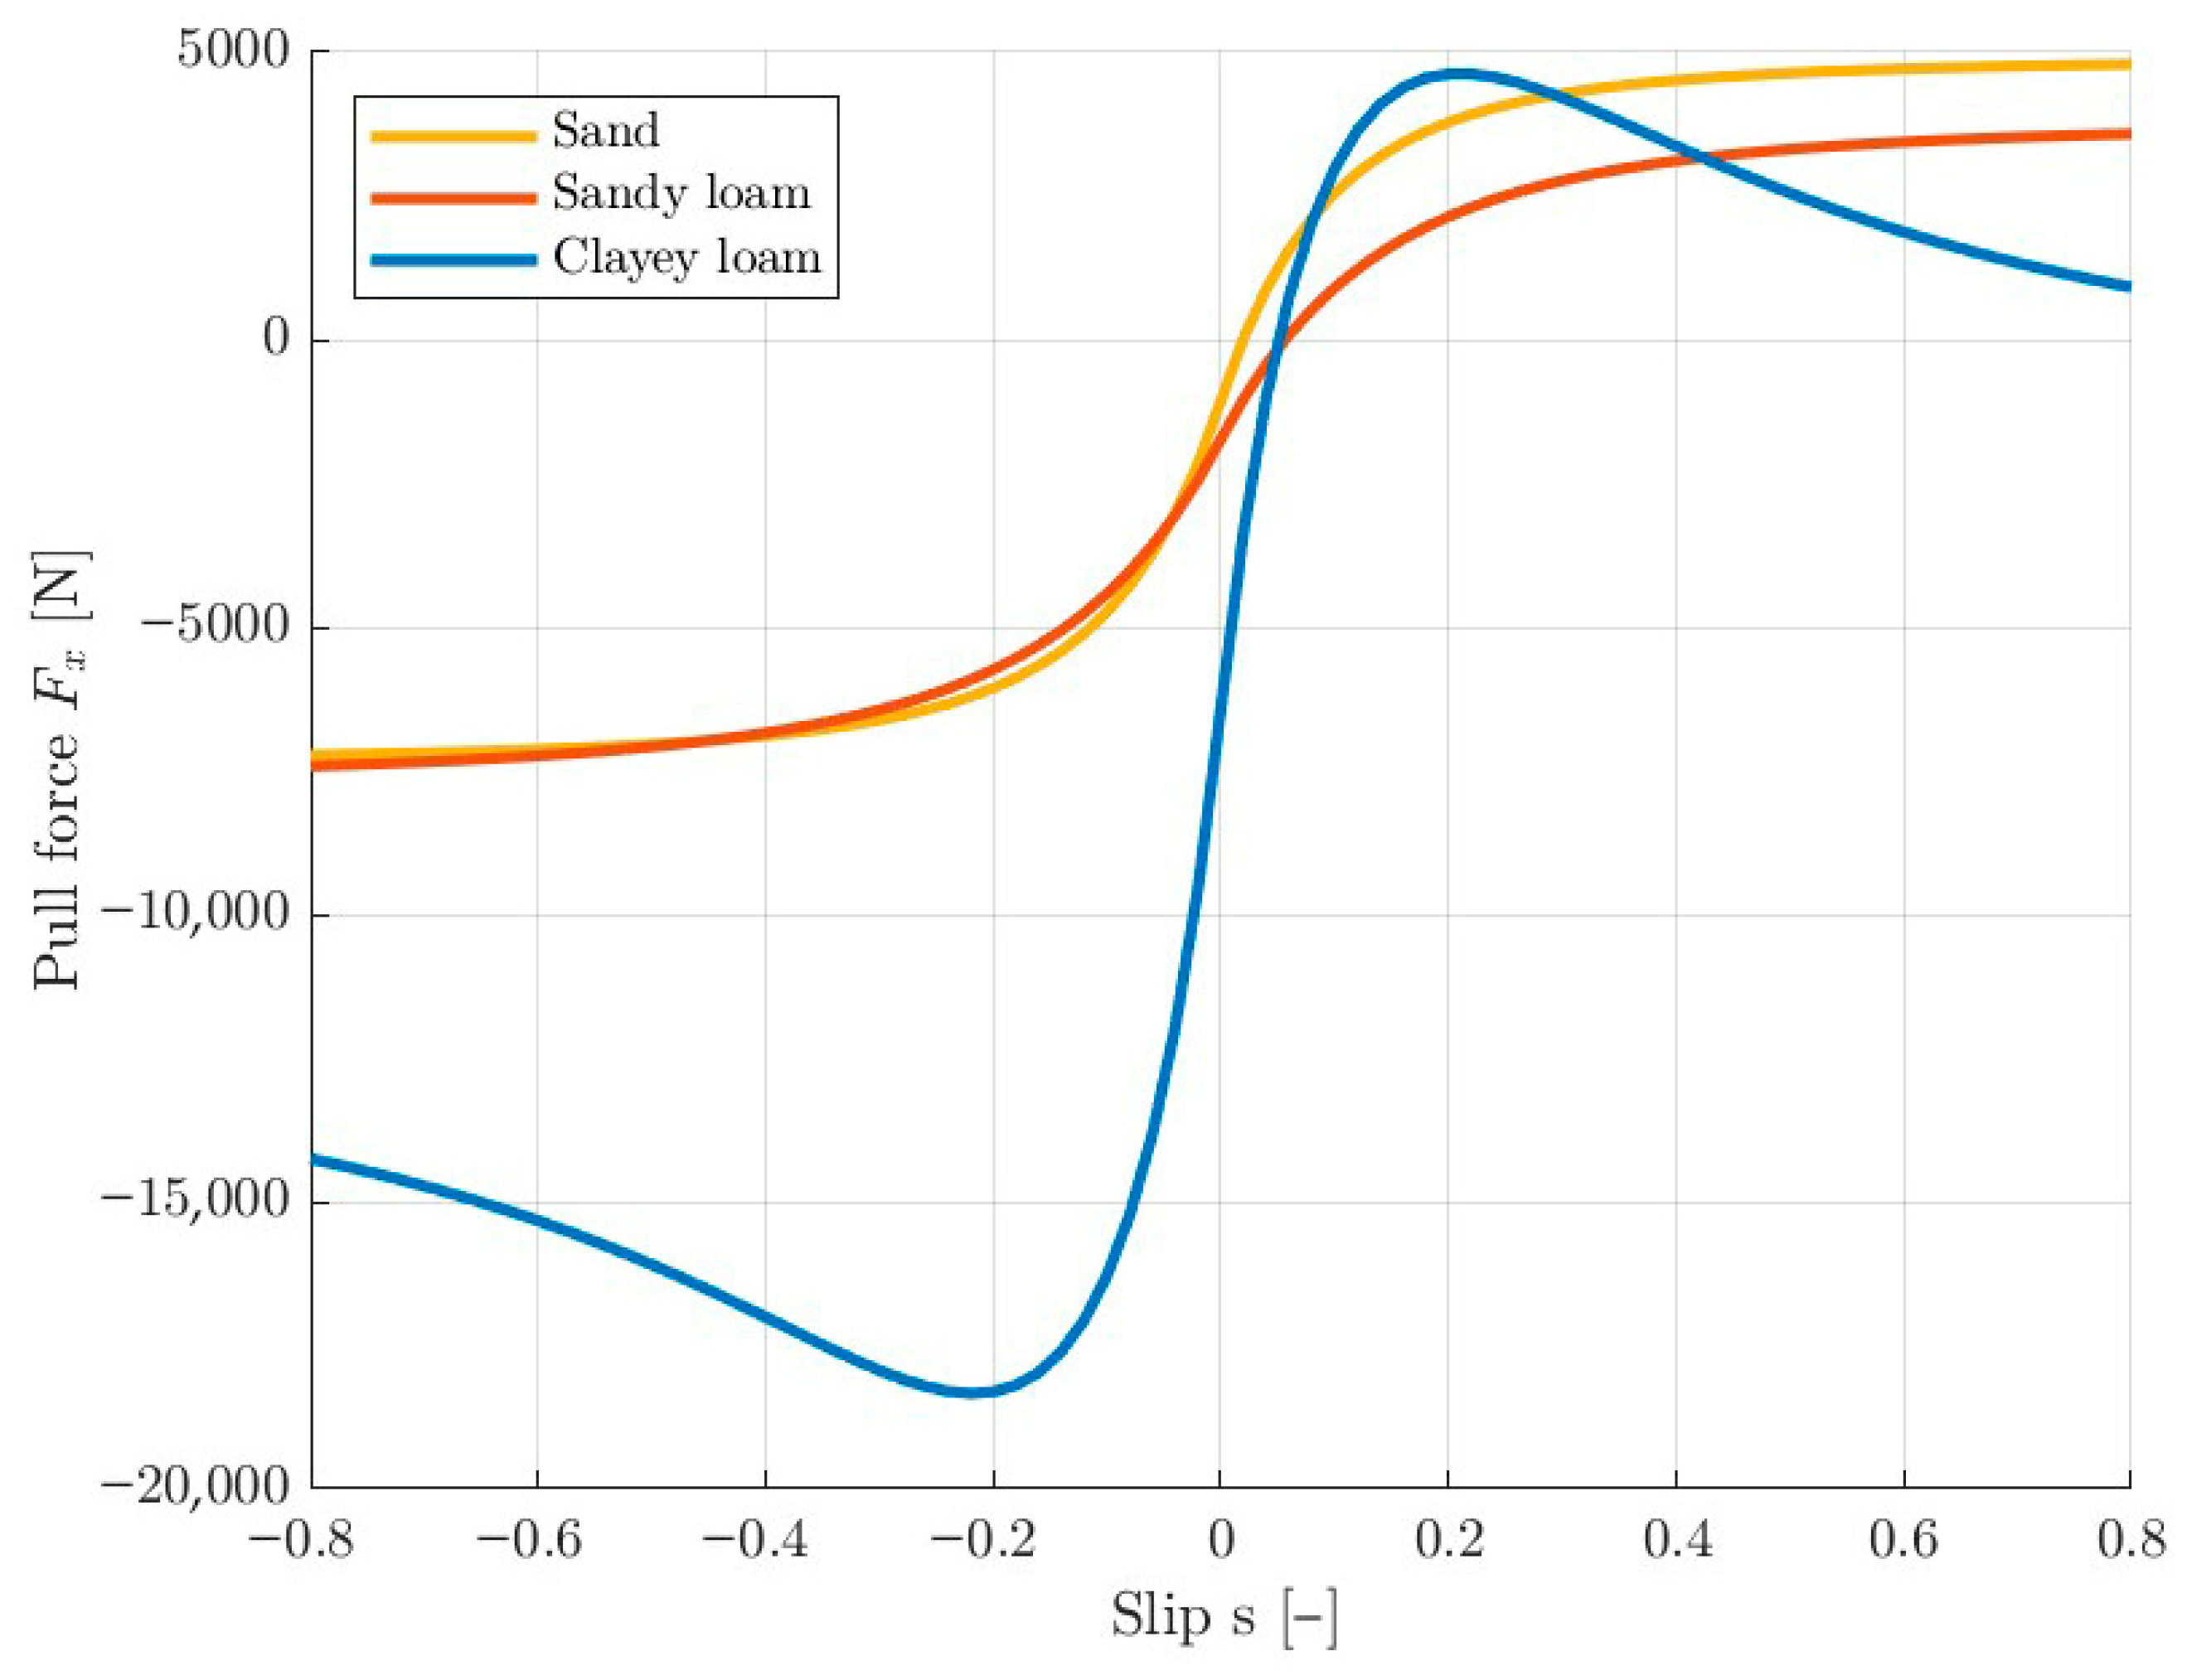
Figure 7 shows the relationship between wheel pull force and slip for the three simulated soils. On sand and sandy loam, the wheel generates an asymptotic pull force with increasing slip, while on clayey loam, it reaches its maximum value for small slip values and then decreases. This behavior is consistent with the assumed soil models. It can be seen that the wheels generate a positive pull force only for slip values above 0, as they have to overcome the resistance to movement.
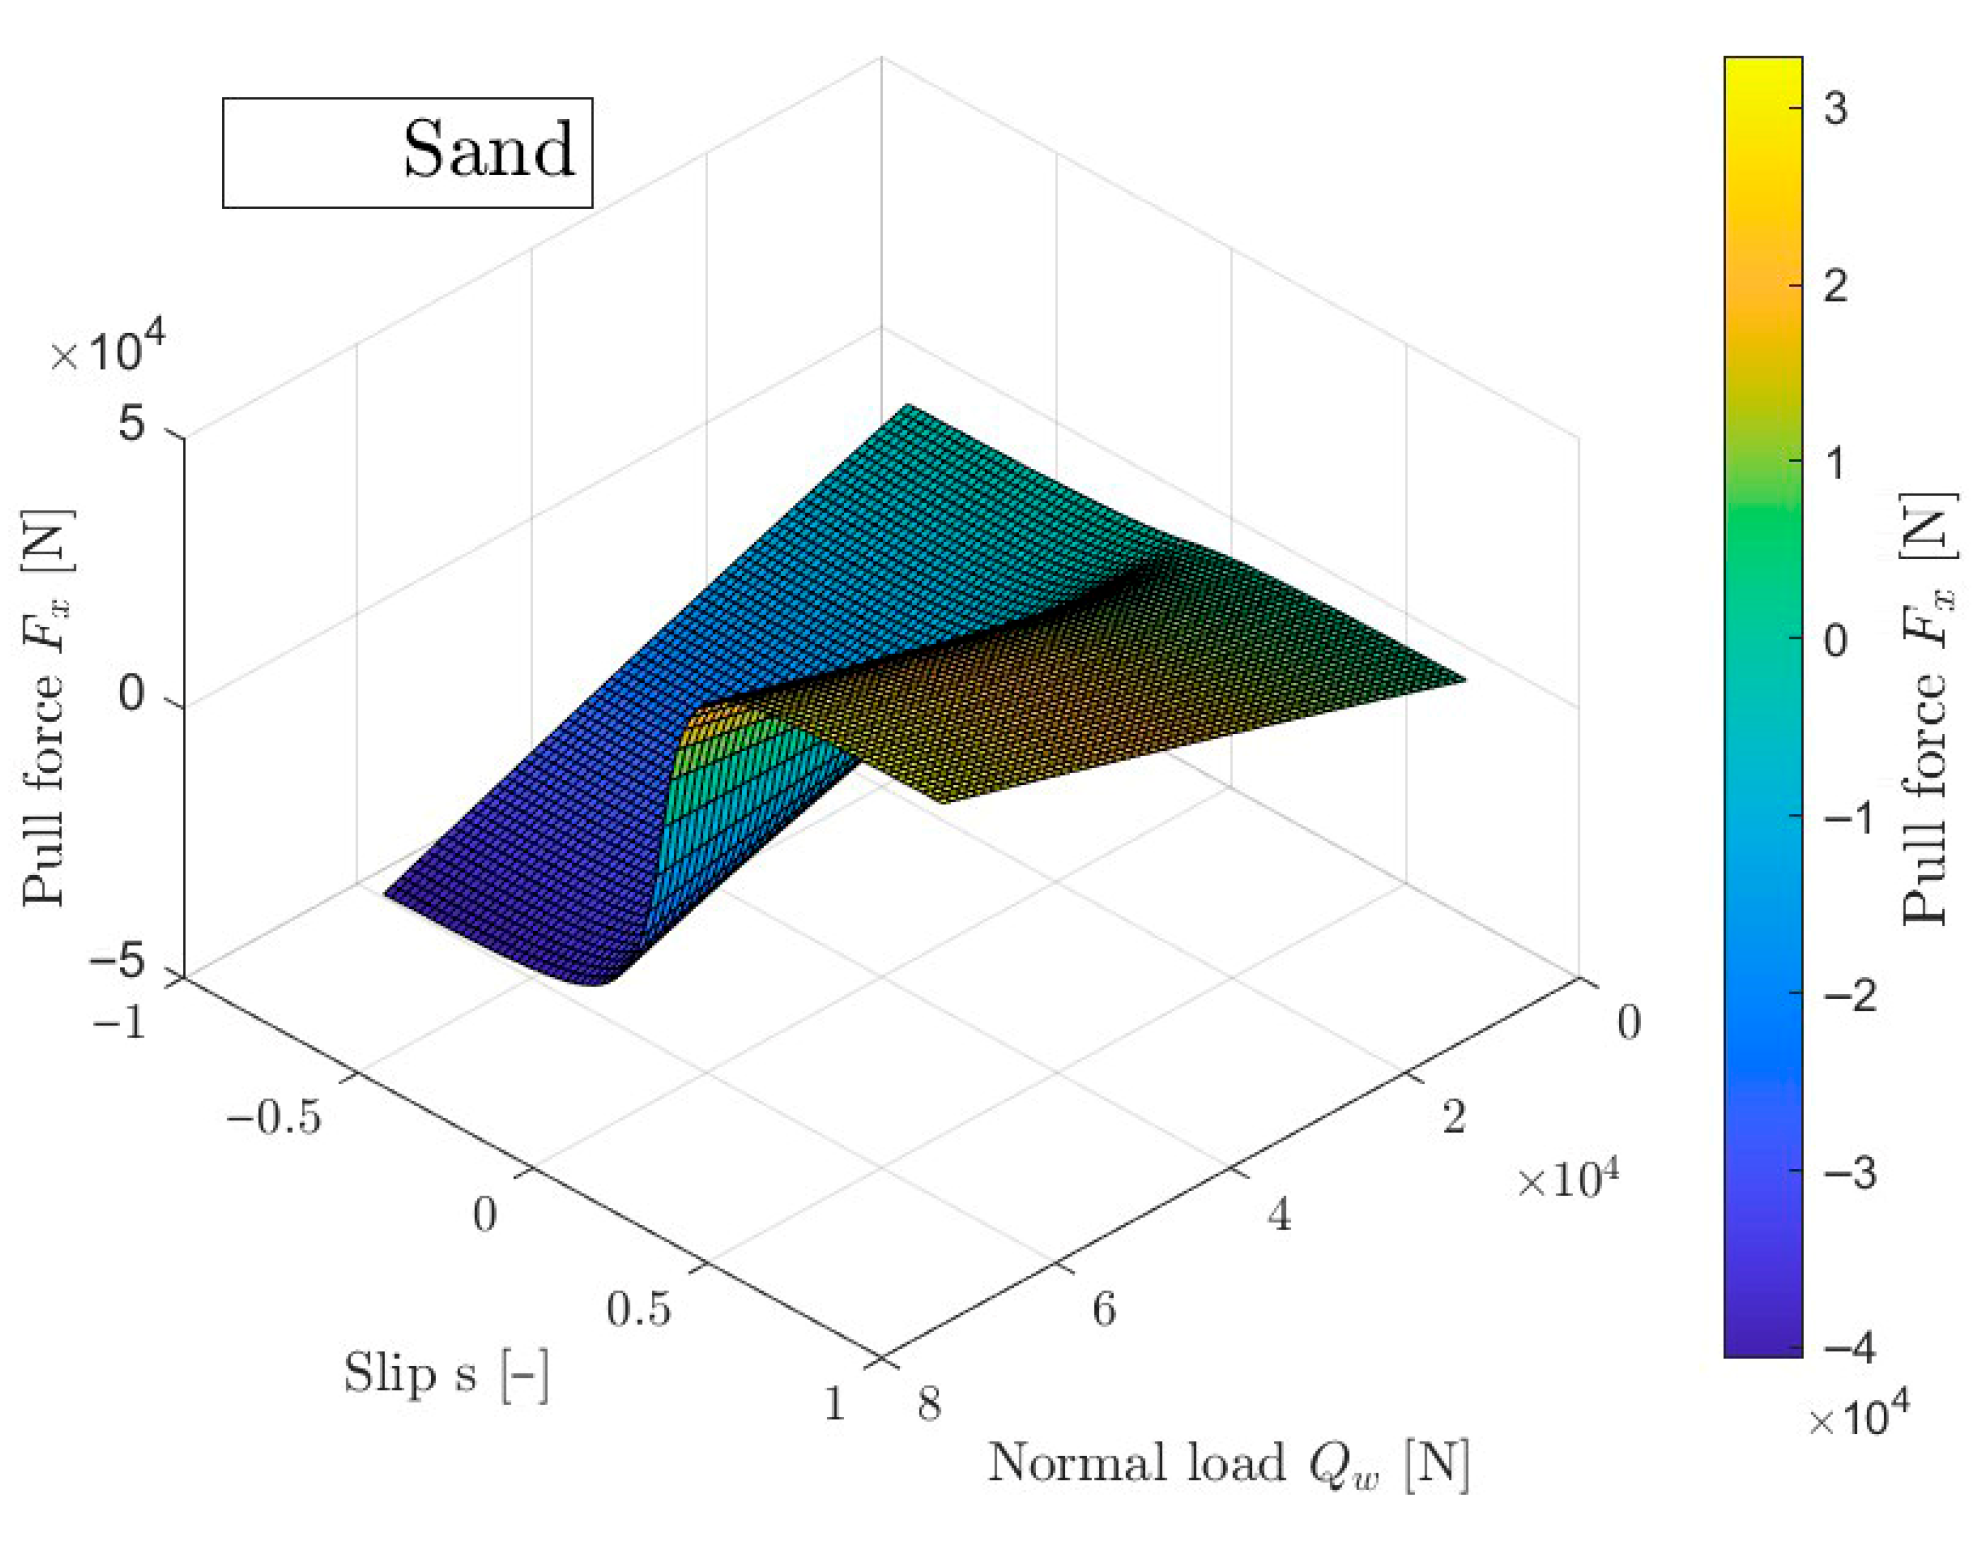
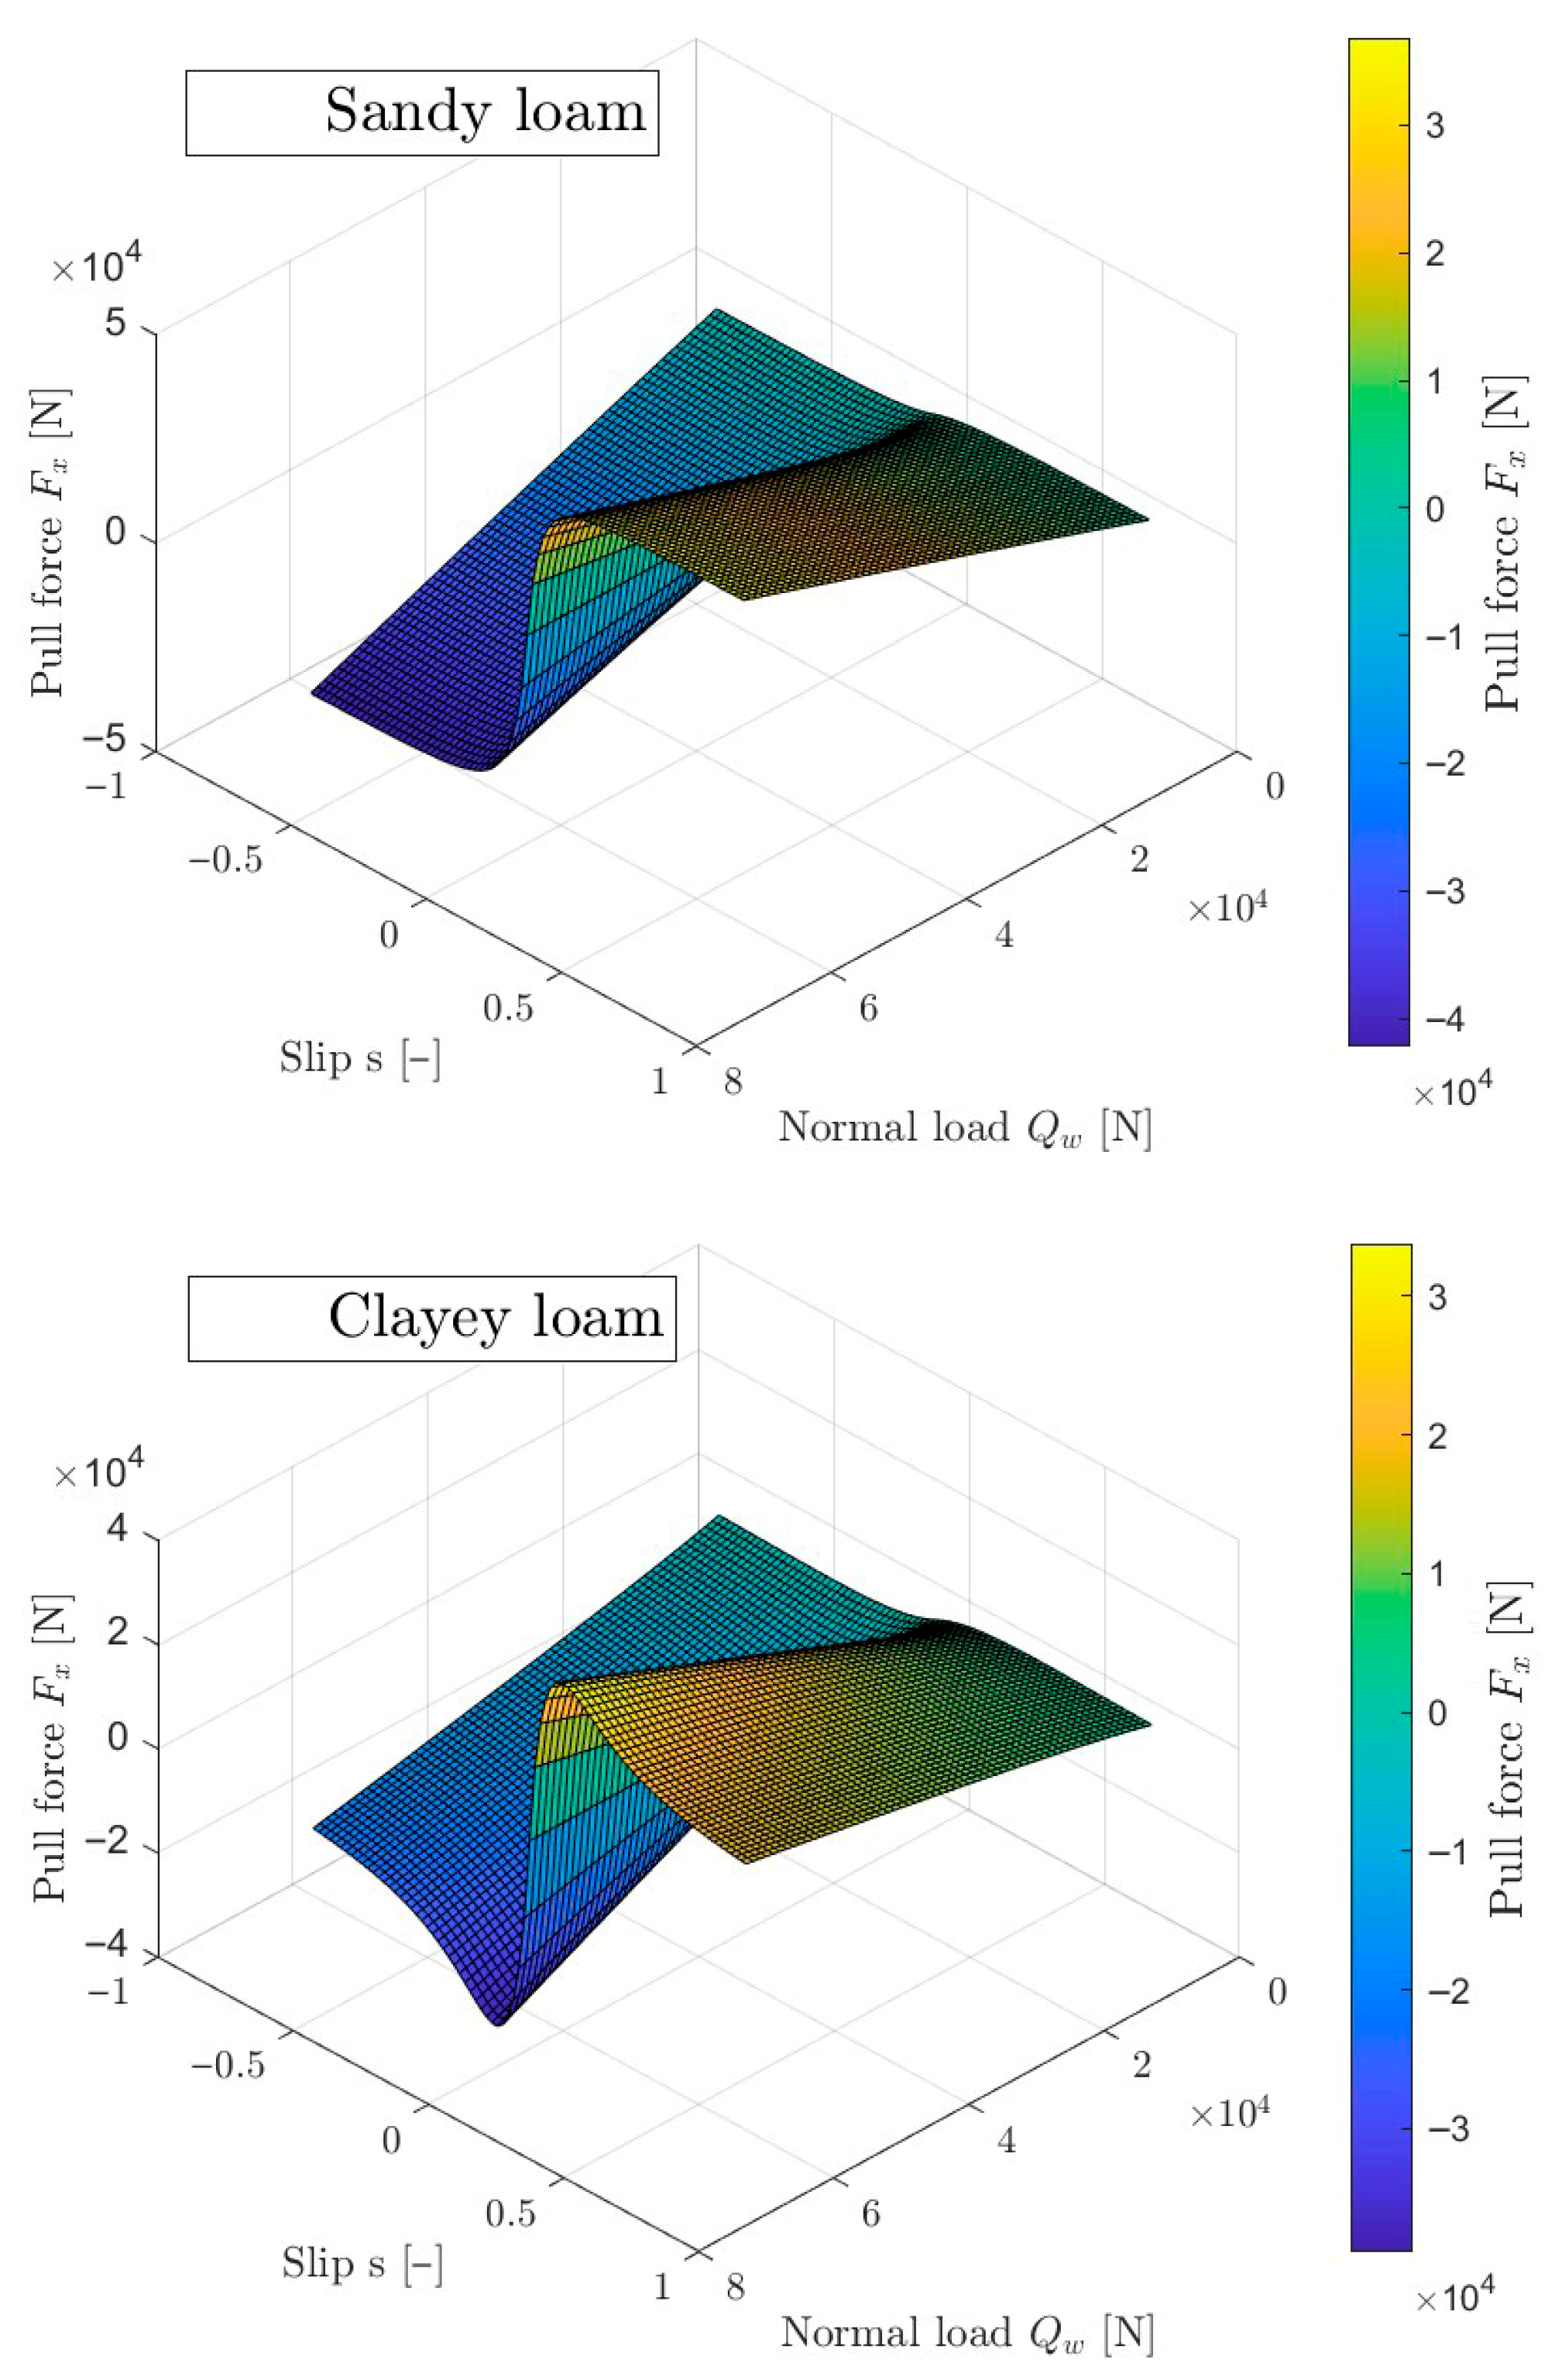
Figure 8 shows the relationship between pull force, wheel slip and wheel load. It can be seen that the nature of the curves in
Figure 7 is particularly clear for high loads. As the wheel load decreases, the effect of slip on traction force decreases. These dependencies are consistent with the adopted model and with the data that can be found in the cited literature.
3. Results and Discussion
All simulations were performed in MATLAB/Simulink R2024b using a fixed step discrete solver. The system of wheel equilibrium equations was solved using the fsolve function, the Levenberg–Marquardt algorithm with default settings (maximum iterations = 400, step tolerance = 1 × 10
−6). In total, over 8000 simulations were performed. Despite this, the resolution of the efficiency maps presented is clearly limited. In order to improve the presentation of the results, graphs with four-point interpolation of the displayed value were used. To facilitate the discussion of the results, the value
was introduced, which expresses the value of torque bias
for which the differential mechanism locks at a given friction value
:
This is one of the most important indicators determining the distribution of torque in the transfer case at which the vehicle achieves optimal performance under given conditions.
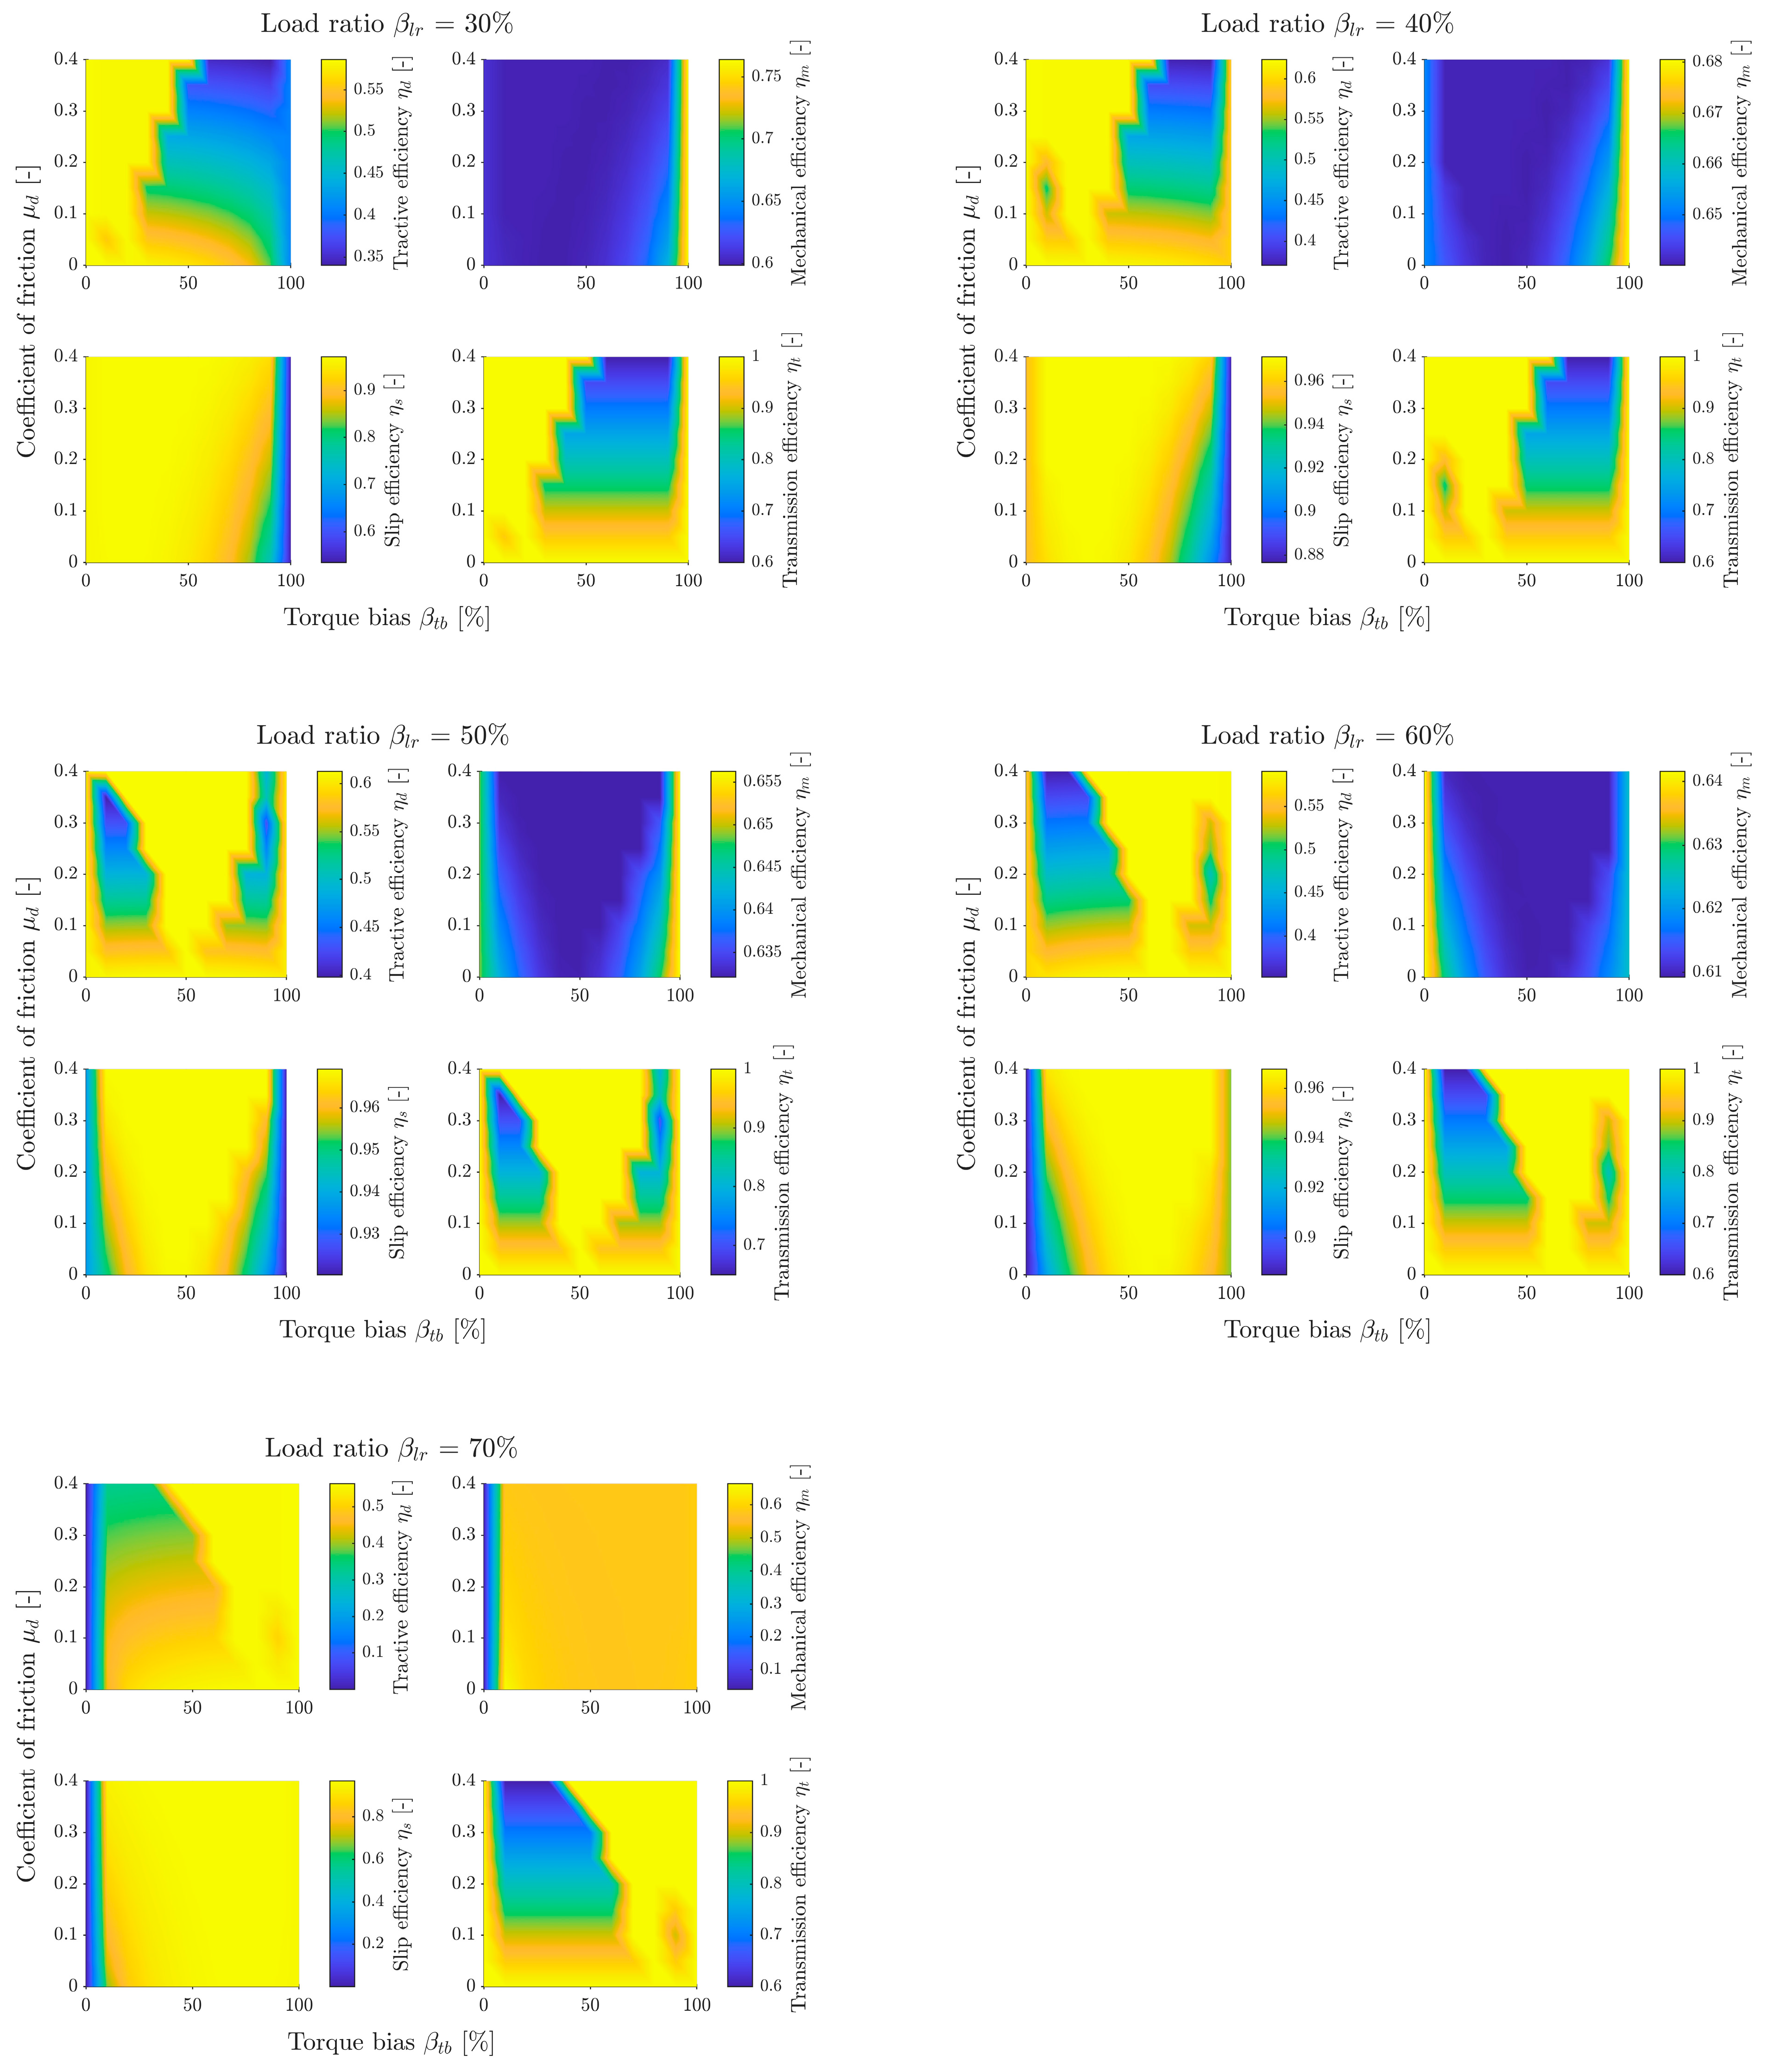
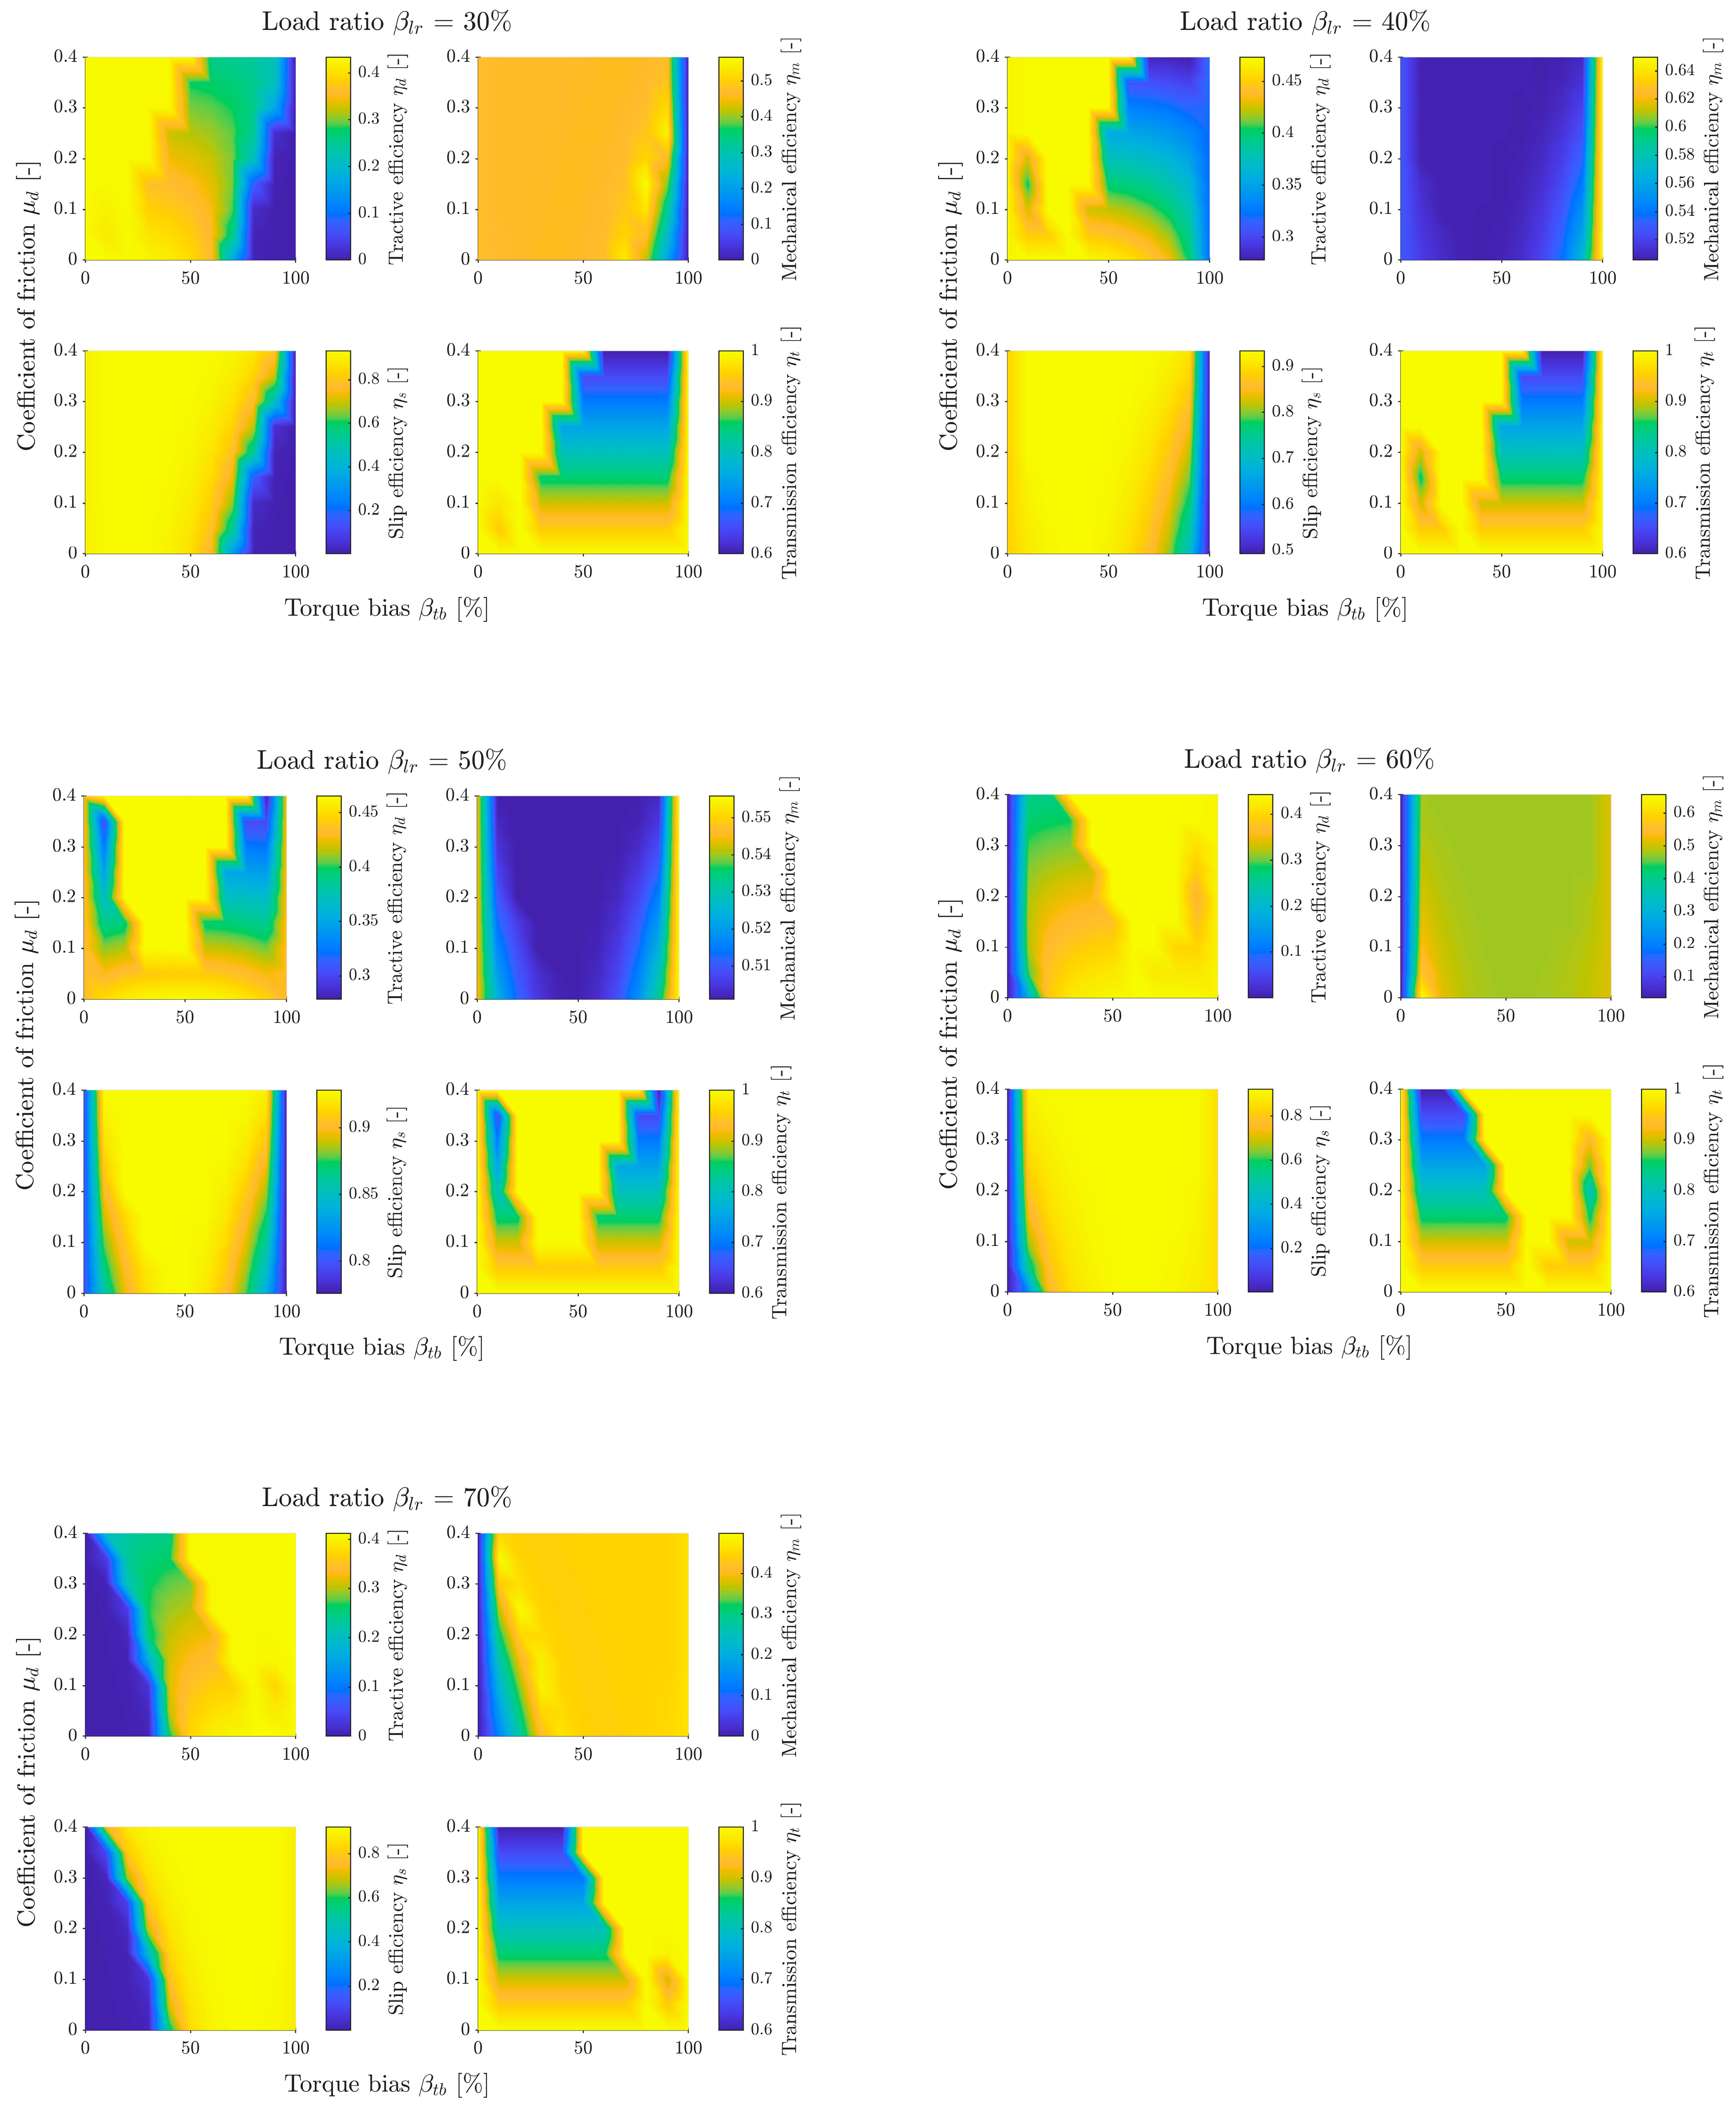
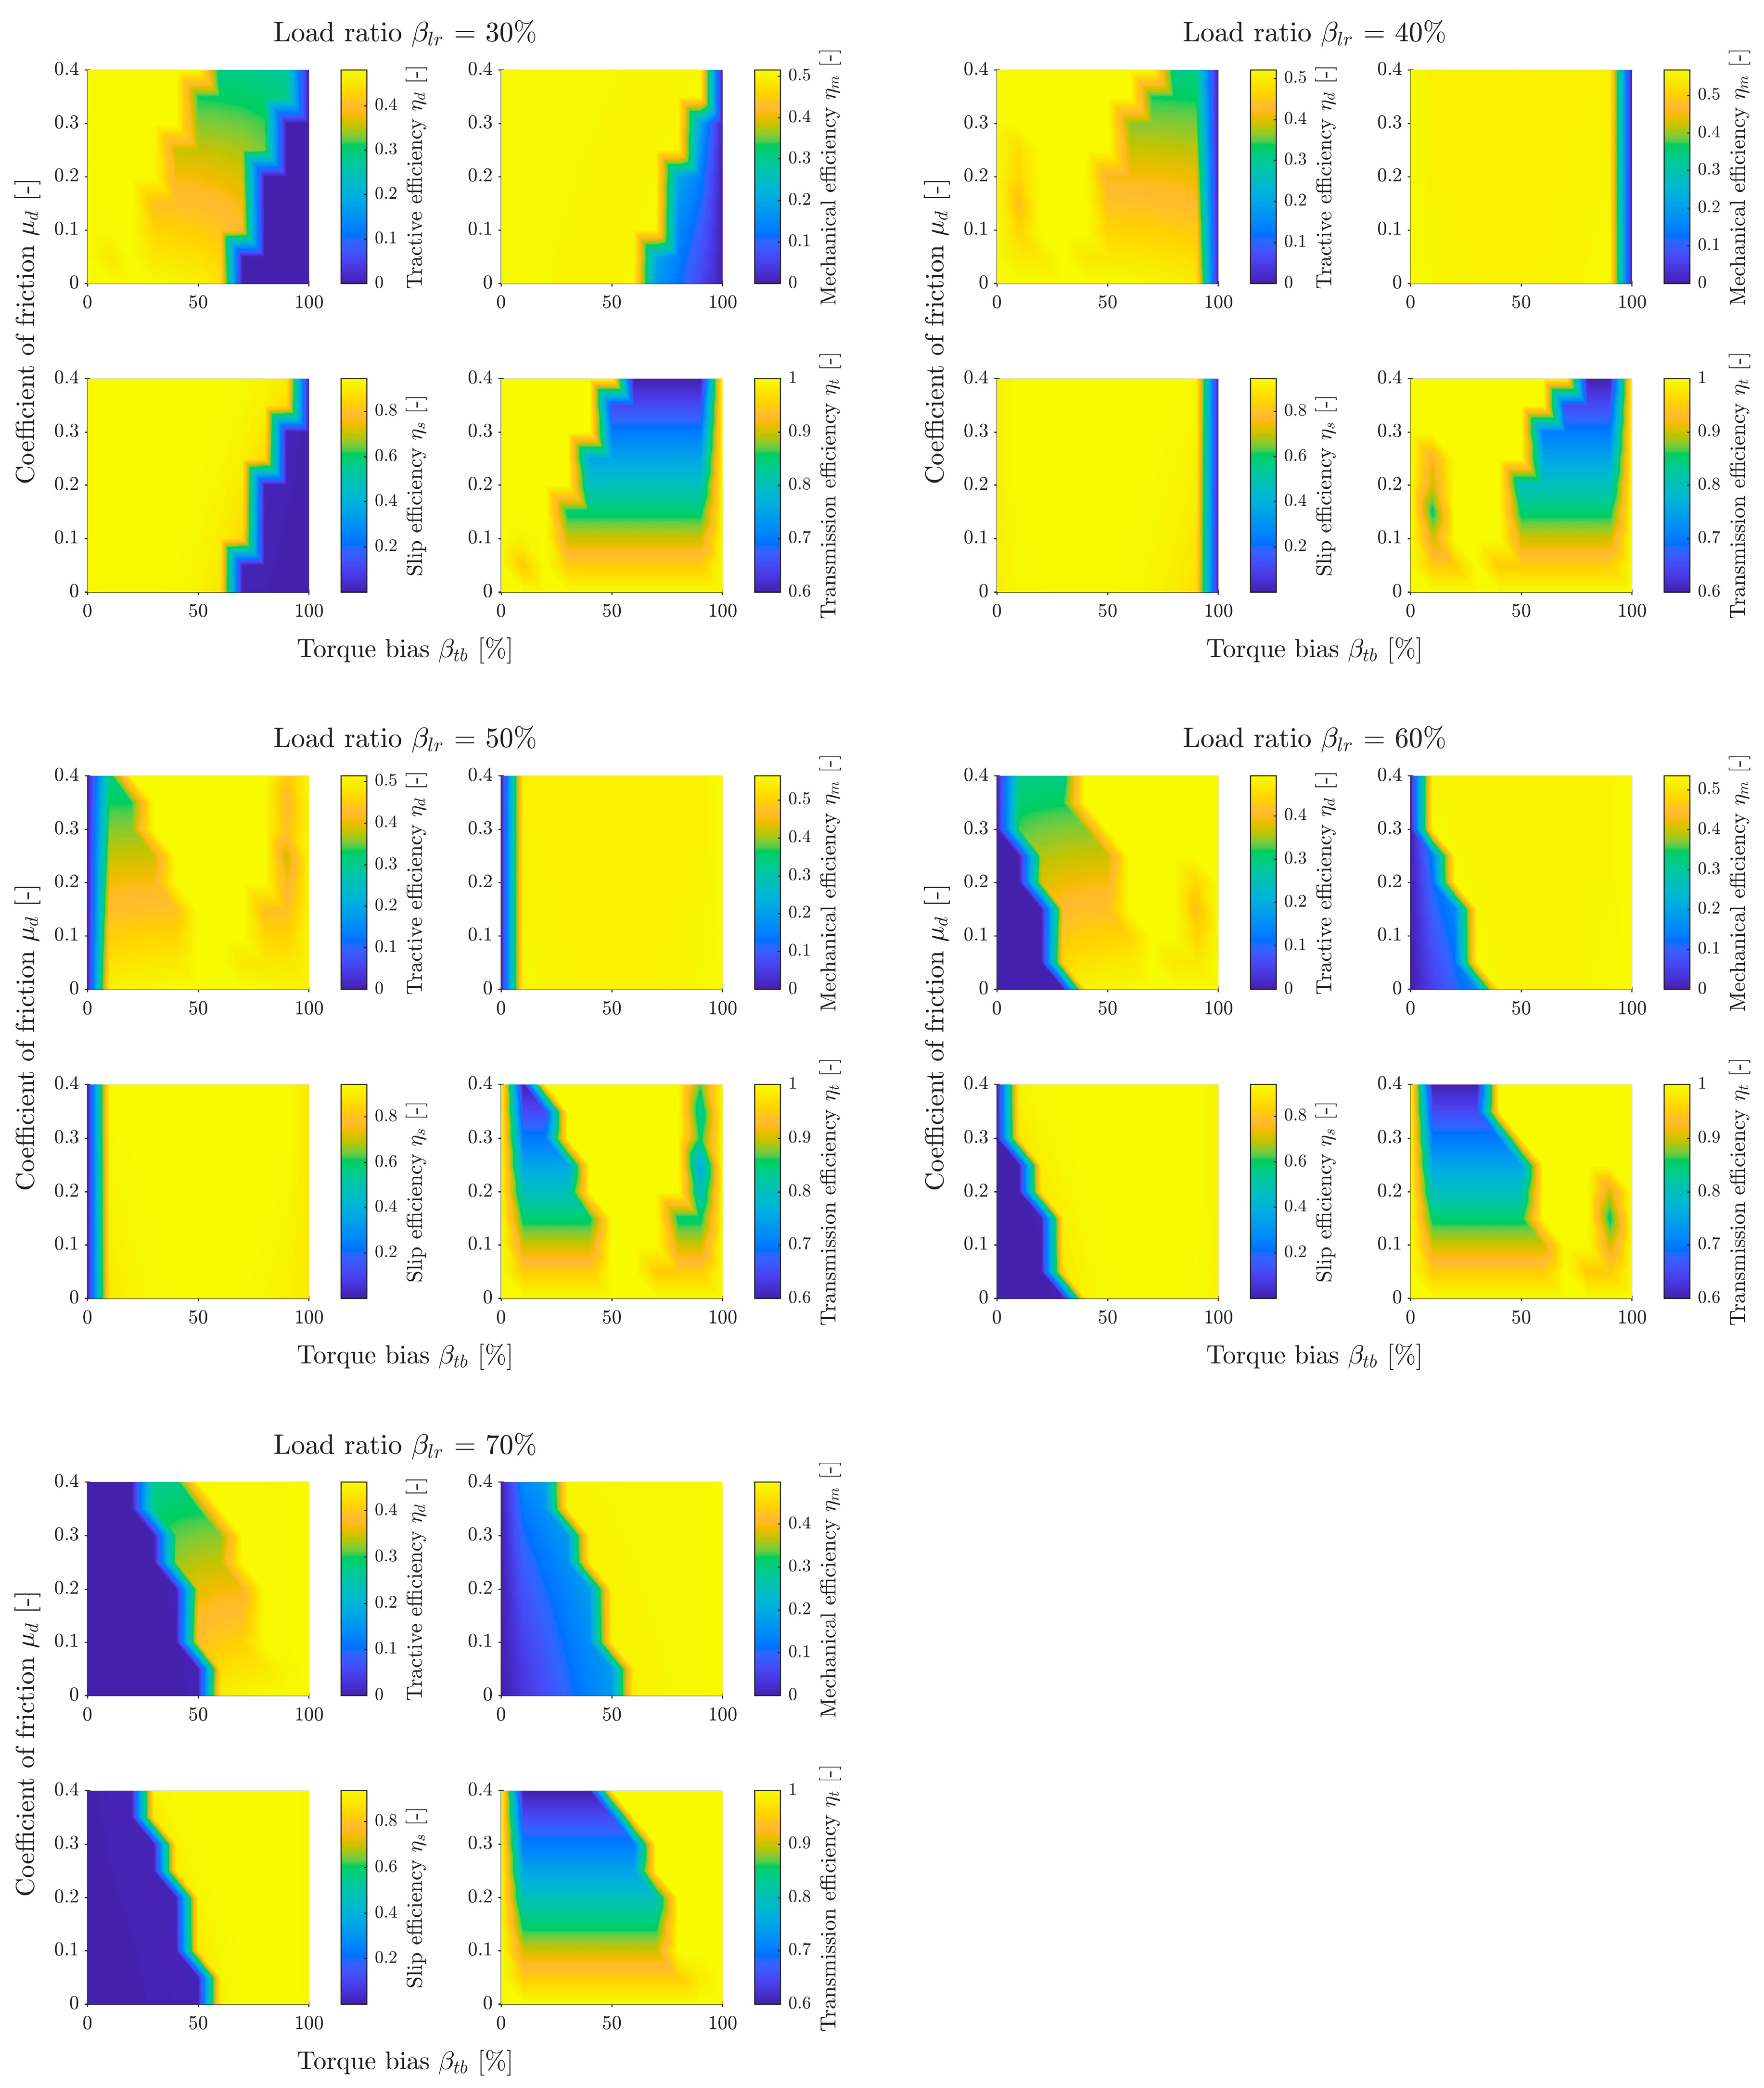
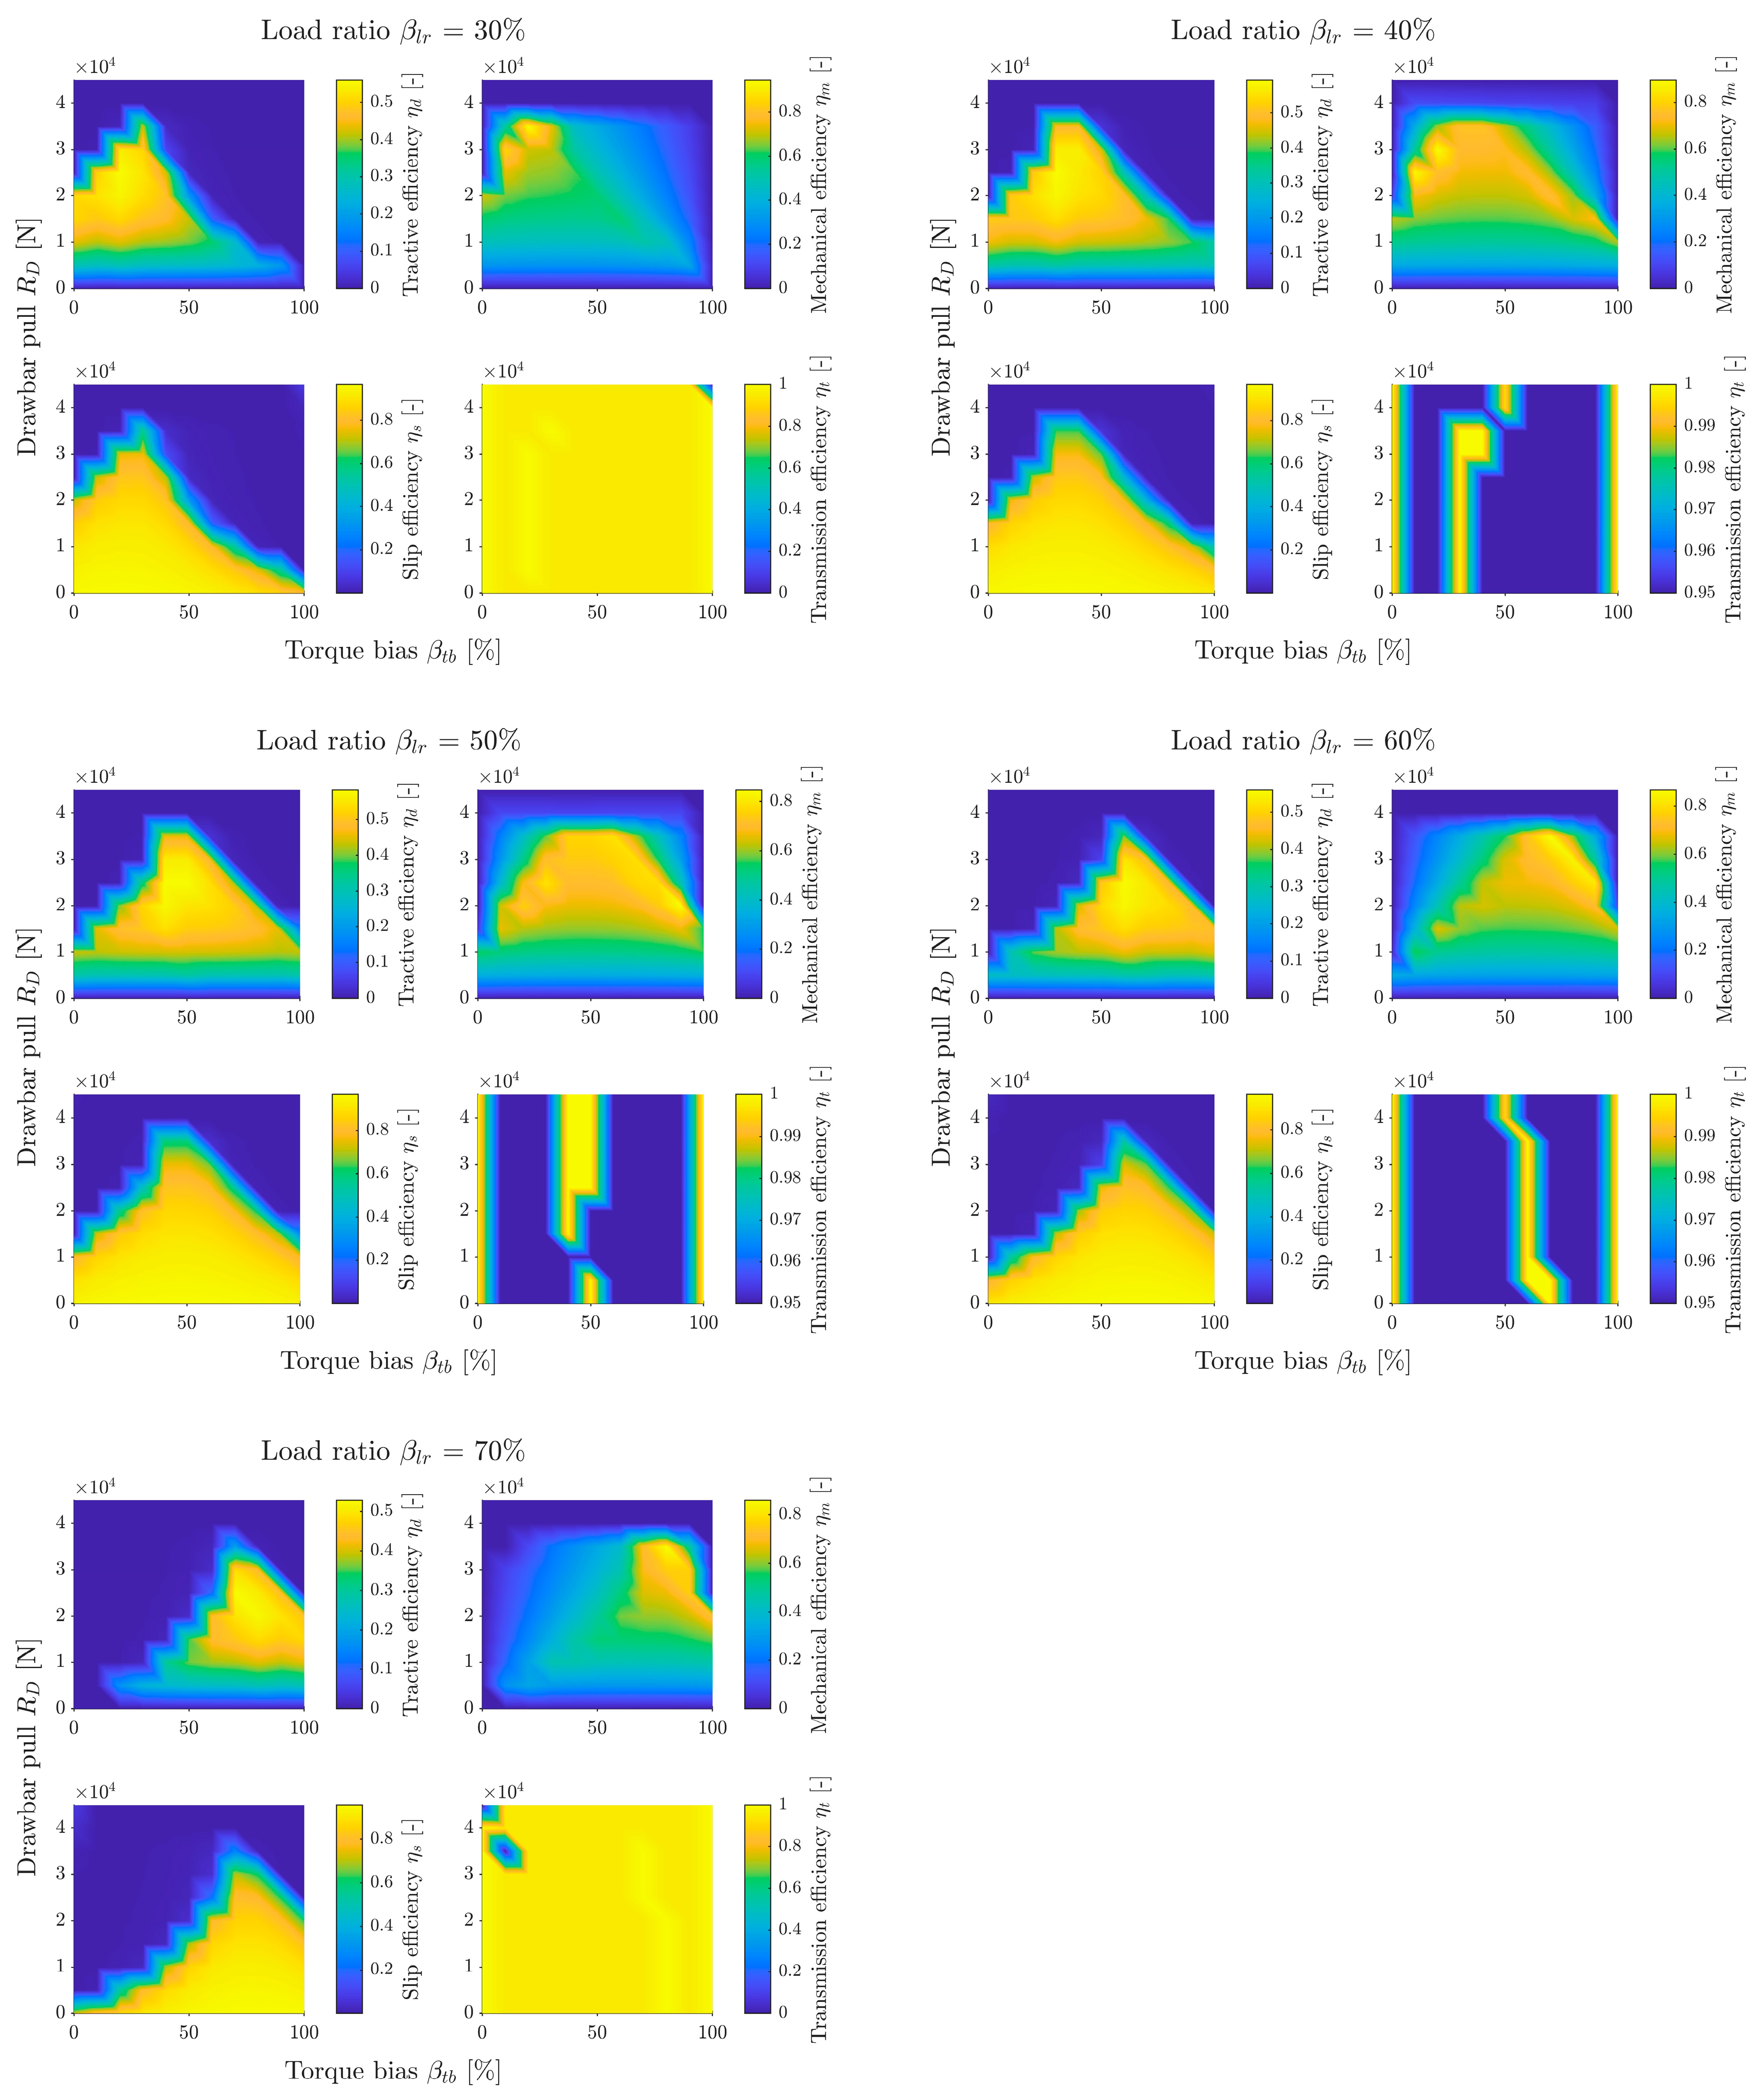
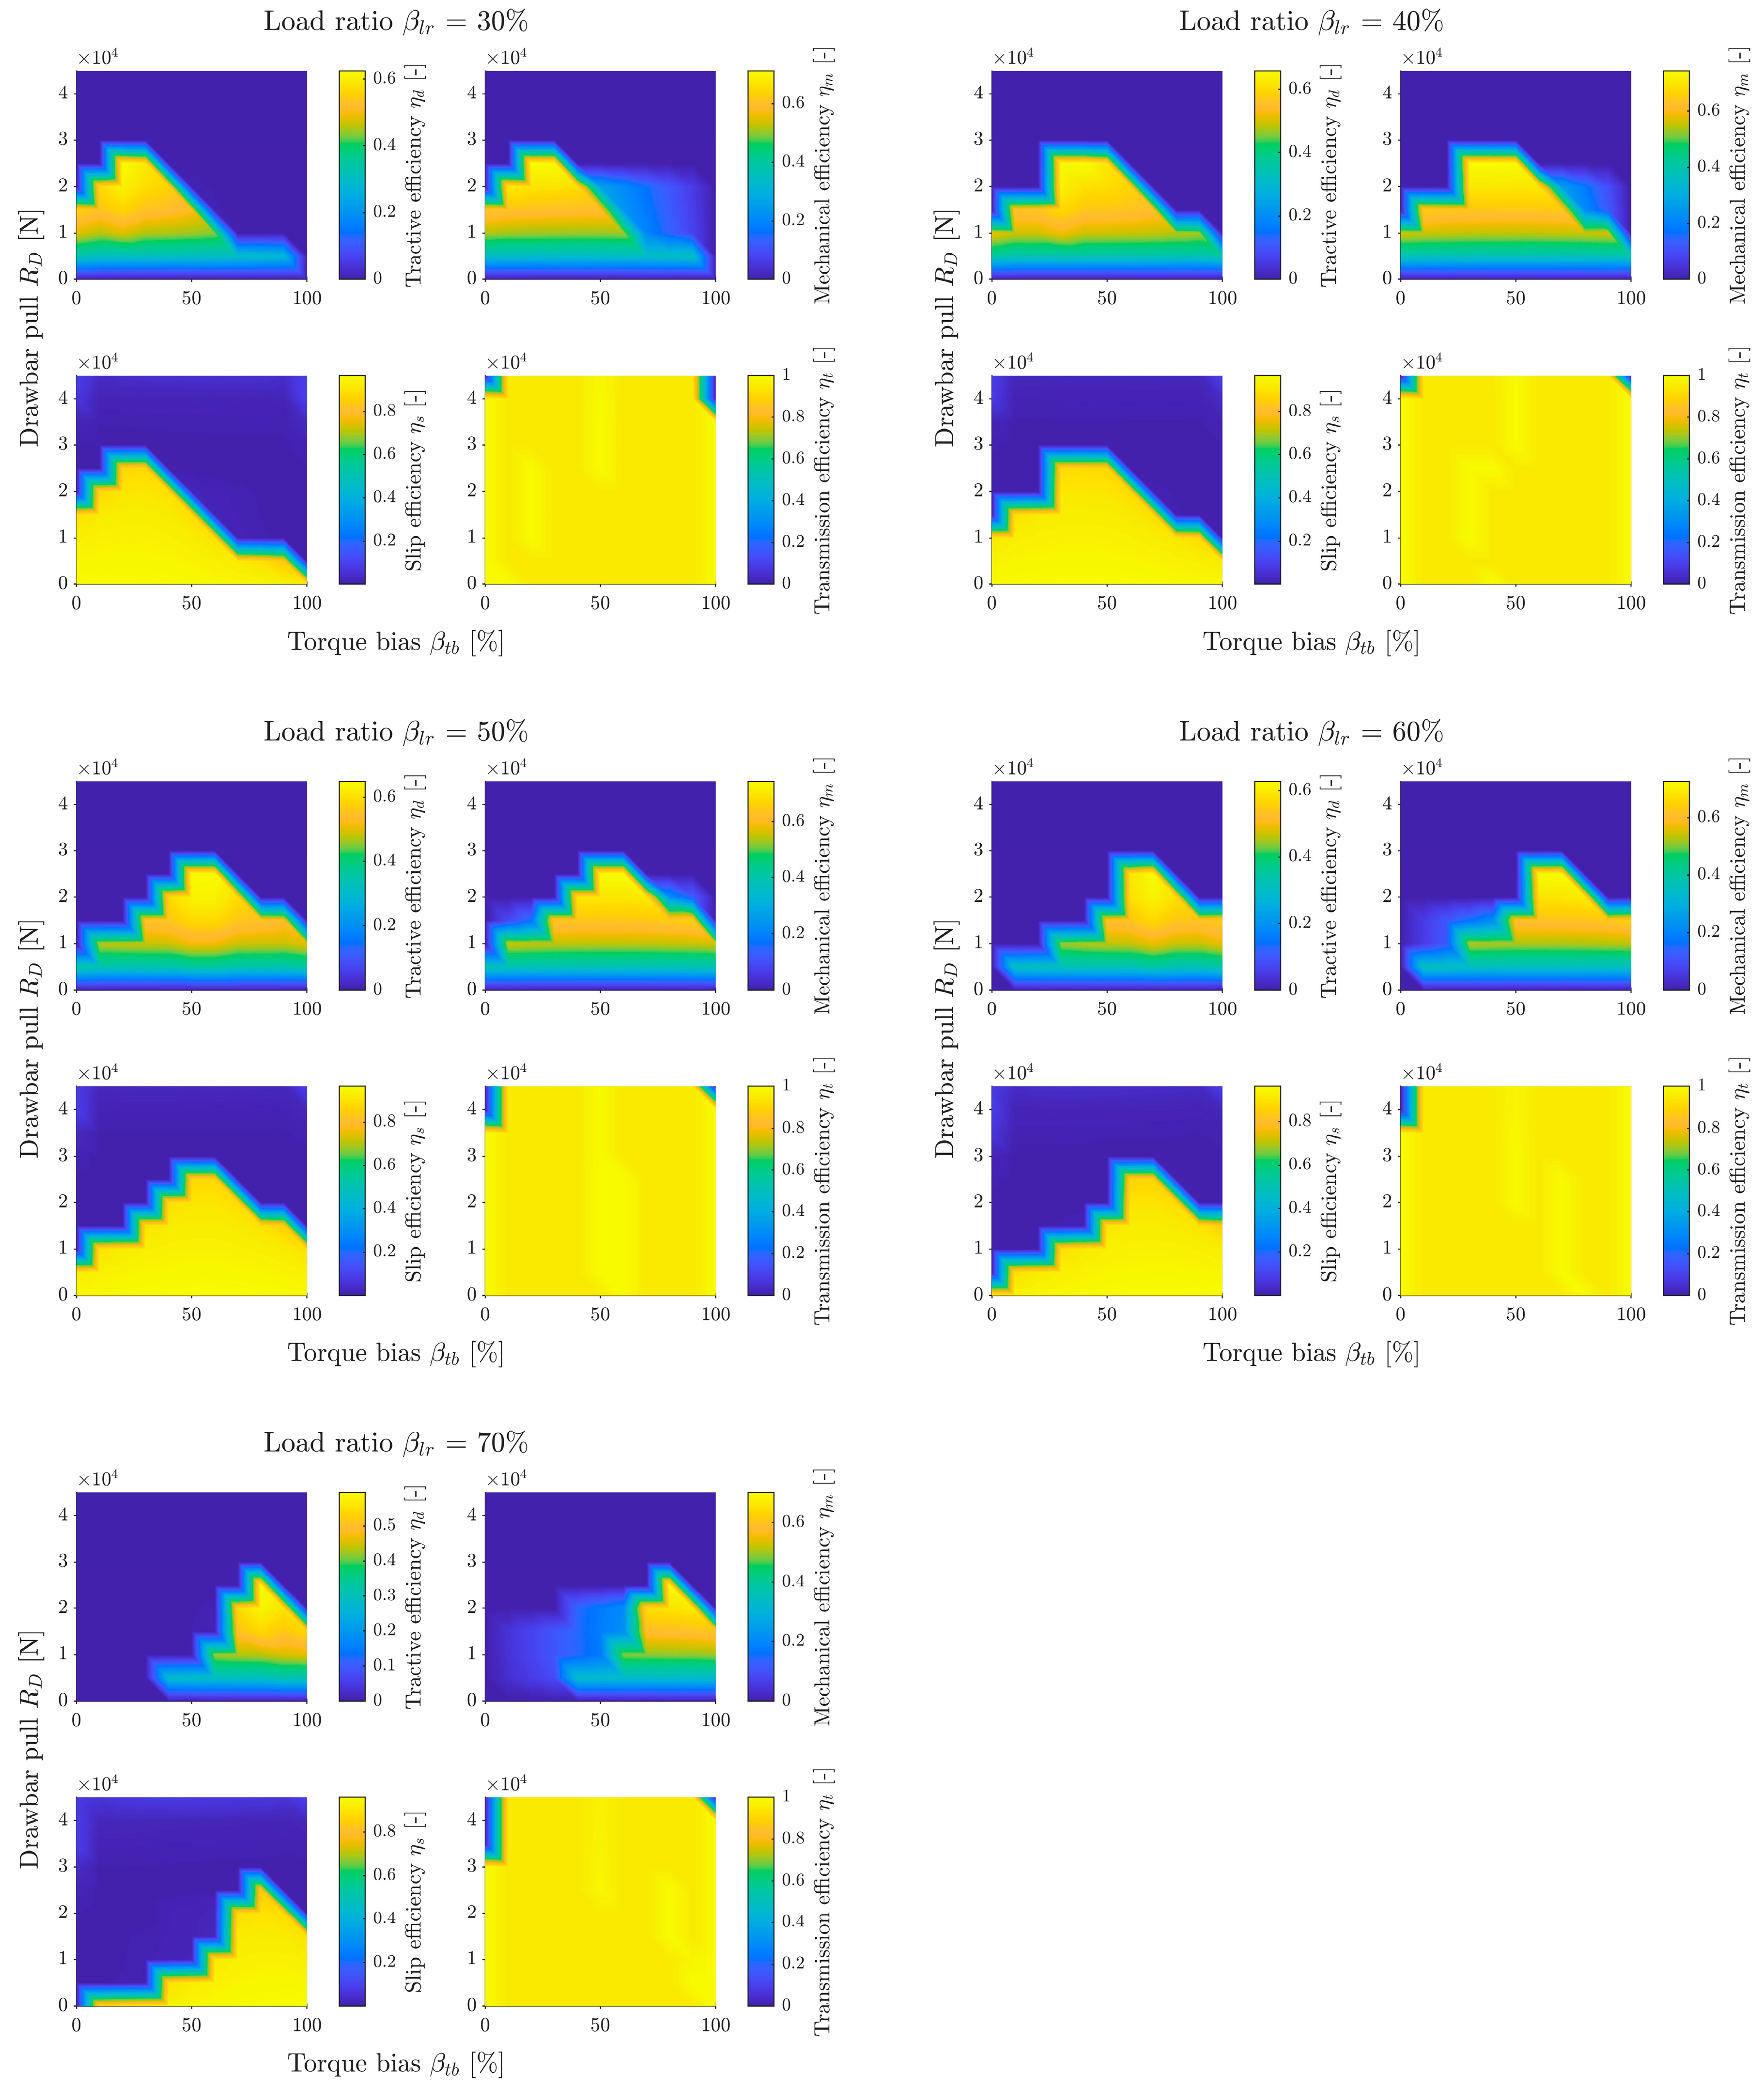
First, simulations were performed to determine the relationship between efficiency and the coefficient of friction and torque bias for different load distributions (a complete set of graphs is provided in
Figure A1,
Figure A2 and
Figure A3 in the
Appendix A). For each soil type and load distribution, a subgraph was generated with a map of tractive efficiency, mechanical efficiency, slip efficiency, and transmission efficiency.
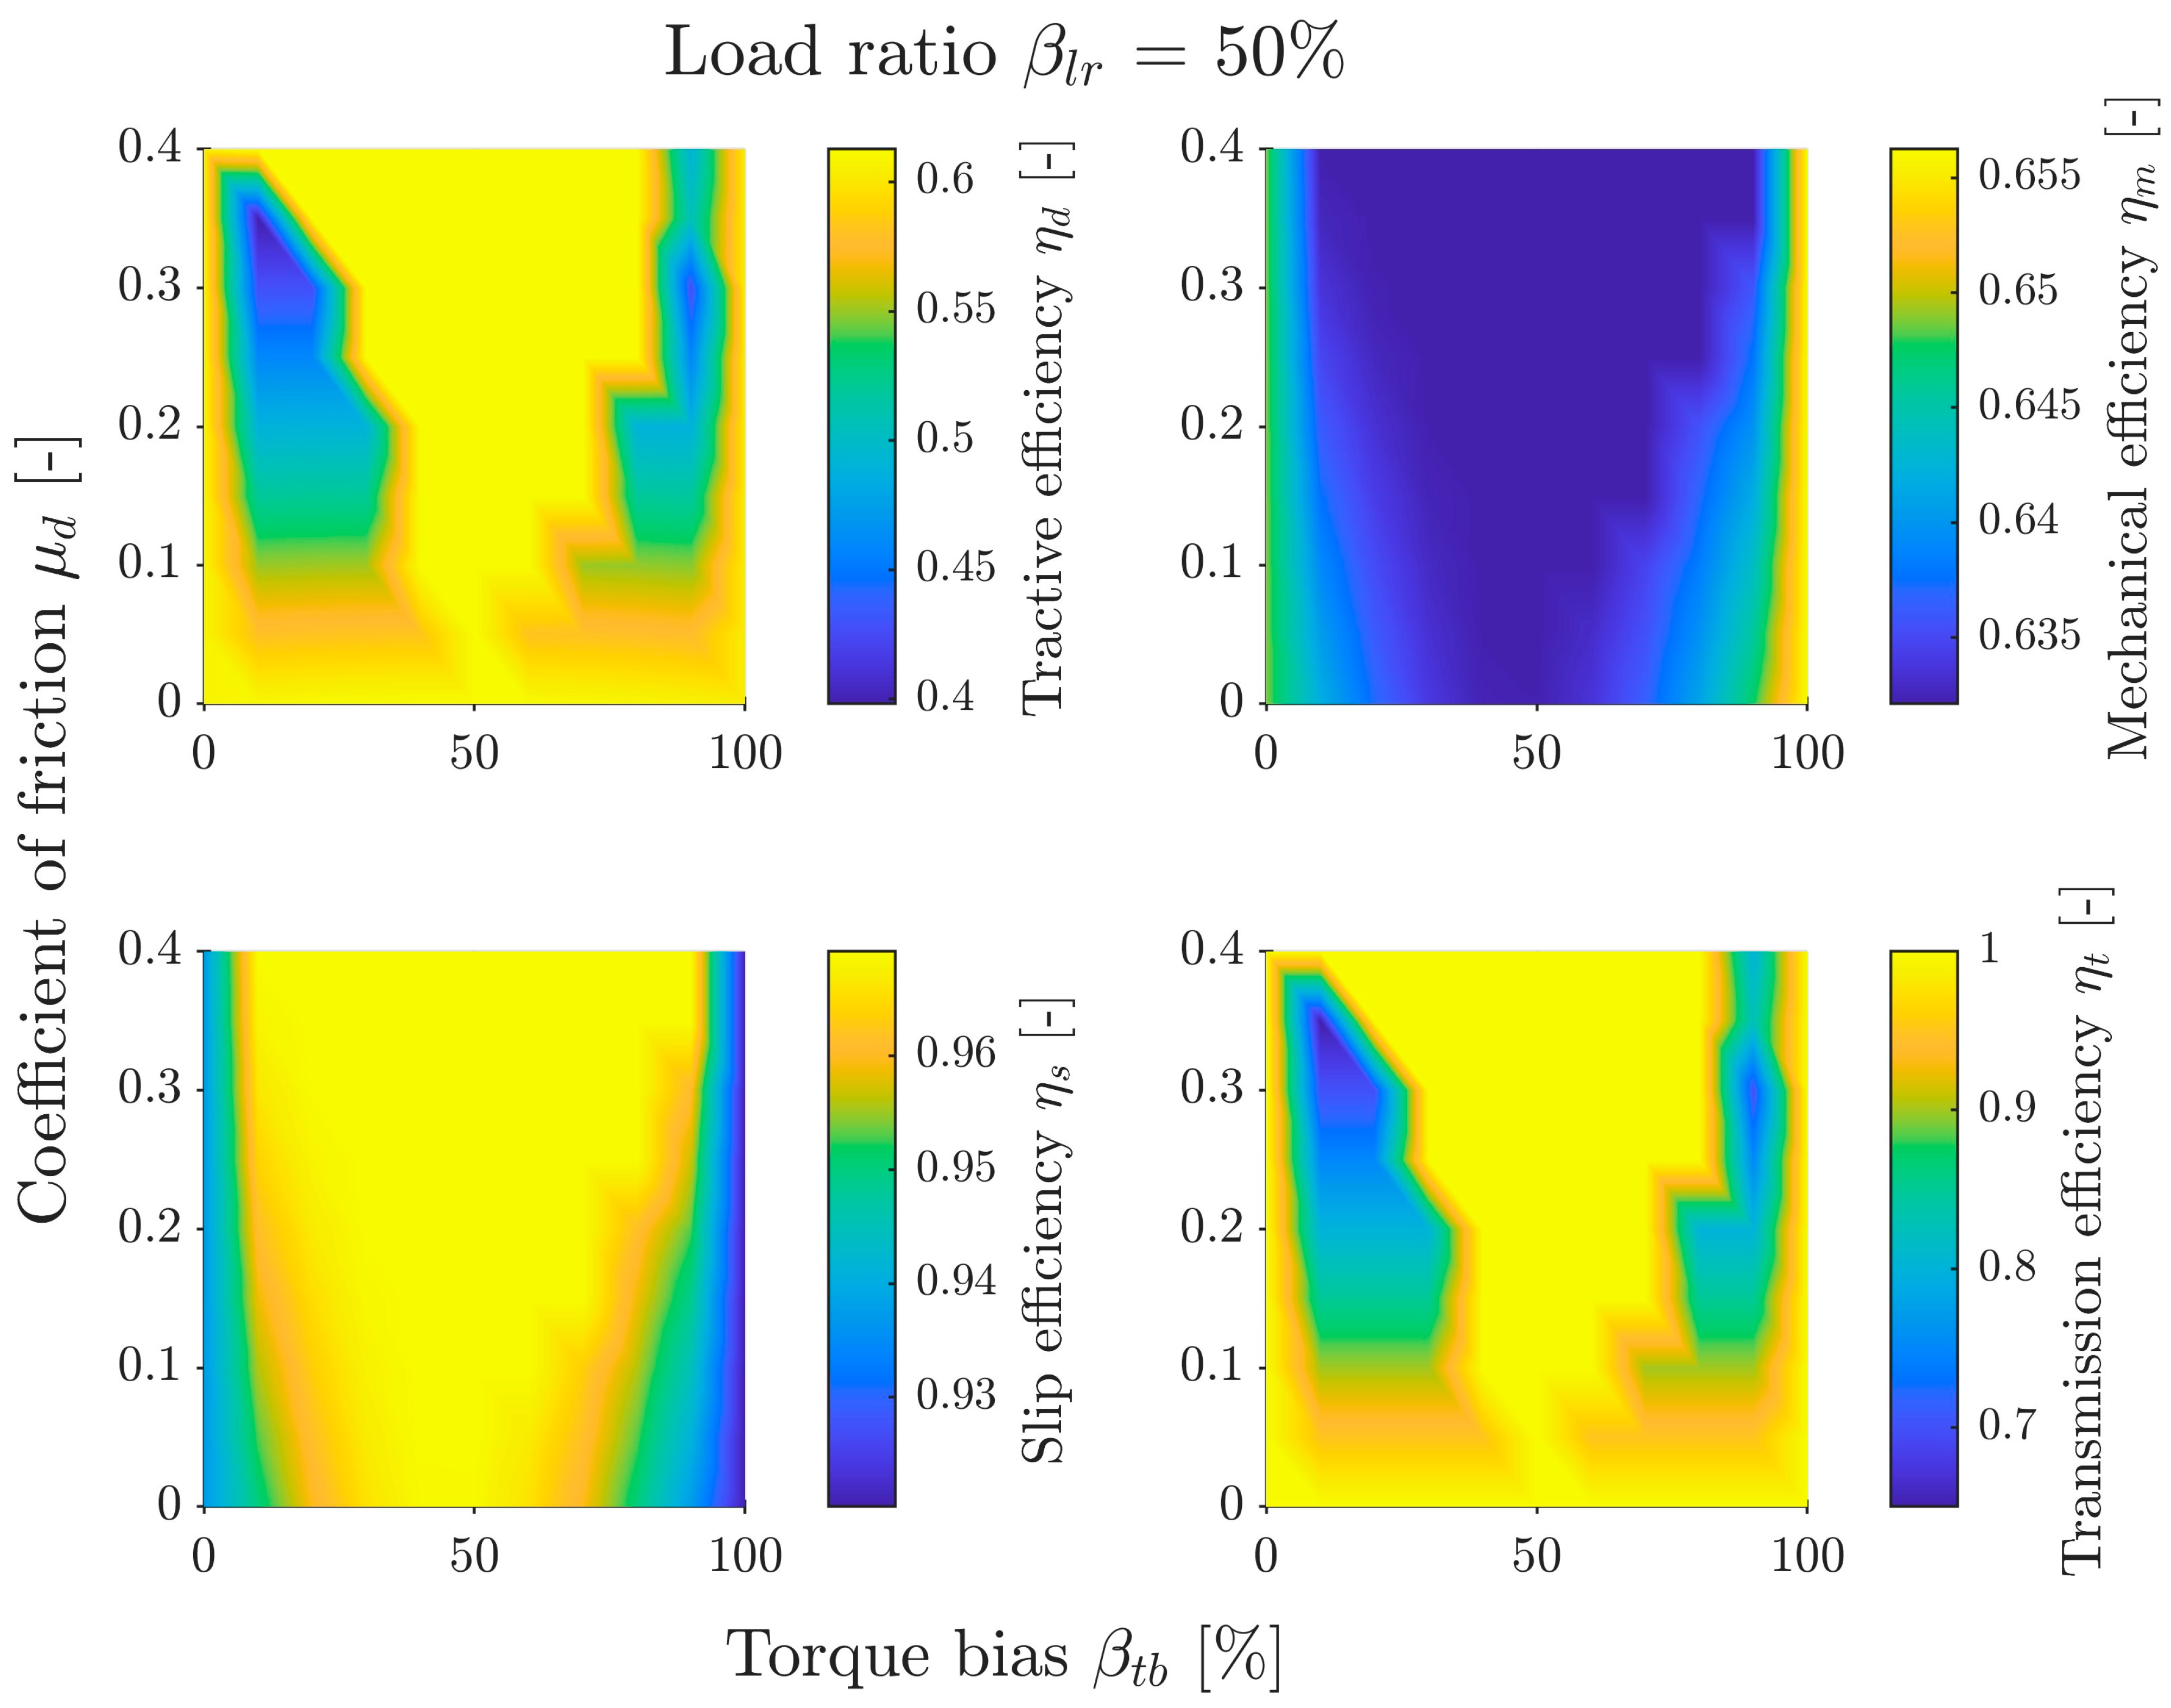
Figure 9 shows an example graph for sand at
= 50%. Each subgraph has a color bar legend. The legend range was automatically set for the values appearing in the subgraph, so these ranges differ between graphs for different
values. The independent assignment of legend colors for each graph facilitates the interpretation of the results of individual graphs.
The most important subgraph of tractive efficiency can be divided into three areas. The first is the two-wheel drive area for = 0% and 100% (FWD and RWD, respectively). The results for each of these areas are independent of friction , because the drive torque is transmitted directly to only one axle, bypassing the differential. The transmission efficiency there is always 1. The second area is the differential lock area. In the graph, it takes on a triangular shape, is narrow for small friction values , and widens as friction increases. The position of this area along the horizontal axis () changes depending on the load distribution . The third area is the remaining part of the graph. There is a clearly visible efficiency gradient, decreasing with increasing friction . This is the area of differential operating in open mode. This subgraph shows a map that is the product of the other three efficiency maps.
When analyzing the first area, it can be seen that when driving on sand with most load on the front axle and front wheel drive, the tractive efficiency is as high as approx. 0.4. This means that even with a heavily loaded front of the vehicle, with rear-wheel drive only, the vehicle will be able to move. However, when the load is transferred to the rear of the vehicle, with front wheel drive, the efficiency is 0. From the point of view of vehicle mobility on sand, it is therefore more advantageous to transfer more torque to the rear axle, as this guarantees mobility over a wider range of vehicle operating parameters. When driving on weaker ground (sandy loam and clayey loam), transferring torque to the opposite axle to the loaded one causes a significant decrease in efficiency, or even immobilization of the vehicle.
The shape of the second area (differential locking) is defined by the transmission efficiency subgraph. In this subgraph, this area has an efficiency of 1 because the mechanism is locked and no energy is dissipated by friction. For small friction values, the differential torque is very small, so the speeds of both axes must be very similar for the mechanism to lock. As friction increases, the value of torque also increases, causing the mechanism to lock over a wider range of speed differences. The speed difference results from the equilibrium of the moments of the individual axles. This, in turn, depends on the torque distribution and the load distribution . Therefore, for the speeds of both axles to be equal, the torque distribution should be close to the load distribution. Under such conditions, the differential locks, ensuring full transmission efficiency. Due to the multipass phenomenon and the consideration of bulldozing resistance, does not coincide with . Analyzing the graphs for different soils and load distributions, it can be seen that the vehicle achieves, in general, the highest tractive efficiency in the second area.
The third area is characterized by efficiency decreasing with increasing friction. There is also a slight shift in the area of increased efficiency towards the more heavily loaded axle. The third area also has the highest efficiency of the entire graph (slightly higher than in the second area), but it only achieves it for friction equal to 0. In practice, this is unattainable, so it is not analyzed further.
When analyzing the mechanical efficiency subgraph, it can be seen that it has a similar shape to the slip efficiency graph, but the color gradient is approximately reversed. This is because as slip increases, slip efficiency decreases, while mechanical efficiency increases.
Figure 10,
Figure 11 and
Figure 12 show efficiency maps with magnification of the area close to
for small friction values
(graded to an accuracy of 0.01) for increasing drawbar pull values
. It can be seen that the value of
for small
is shifted to the right relative to
. As the load increases, it shifts to the left. For small loads, the bulldozing effect on total resistance is relatively large, shifting
towards the rear wheel. As the load increases, the influence of
on the total resistance decreases, causing
to shift towards the front wheel. The influence of the bulldozing effect is described in the text below. Sand from the three soils has the highest stiffness, hence the shape of the second area is visible for all three loads
. In the case of sandy loam, for
= 30,000 N, this shape disappears and the maximum efficiency decreases. This is the area where the slip efficiency decreases rapidly (cf.
Figure 13). For clayey loam, this is noticeable already at
= 20,000 N, and at 30,000 N the vehicle becomes immobilized, hence the efficiency is 0.
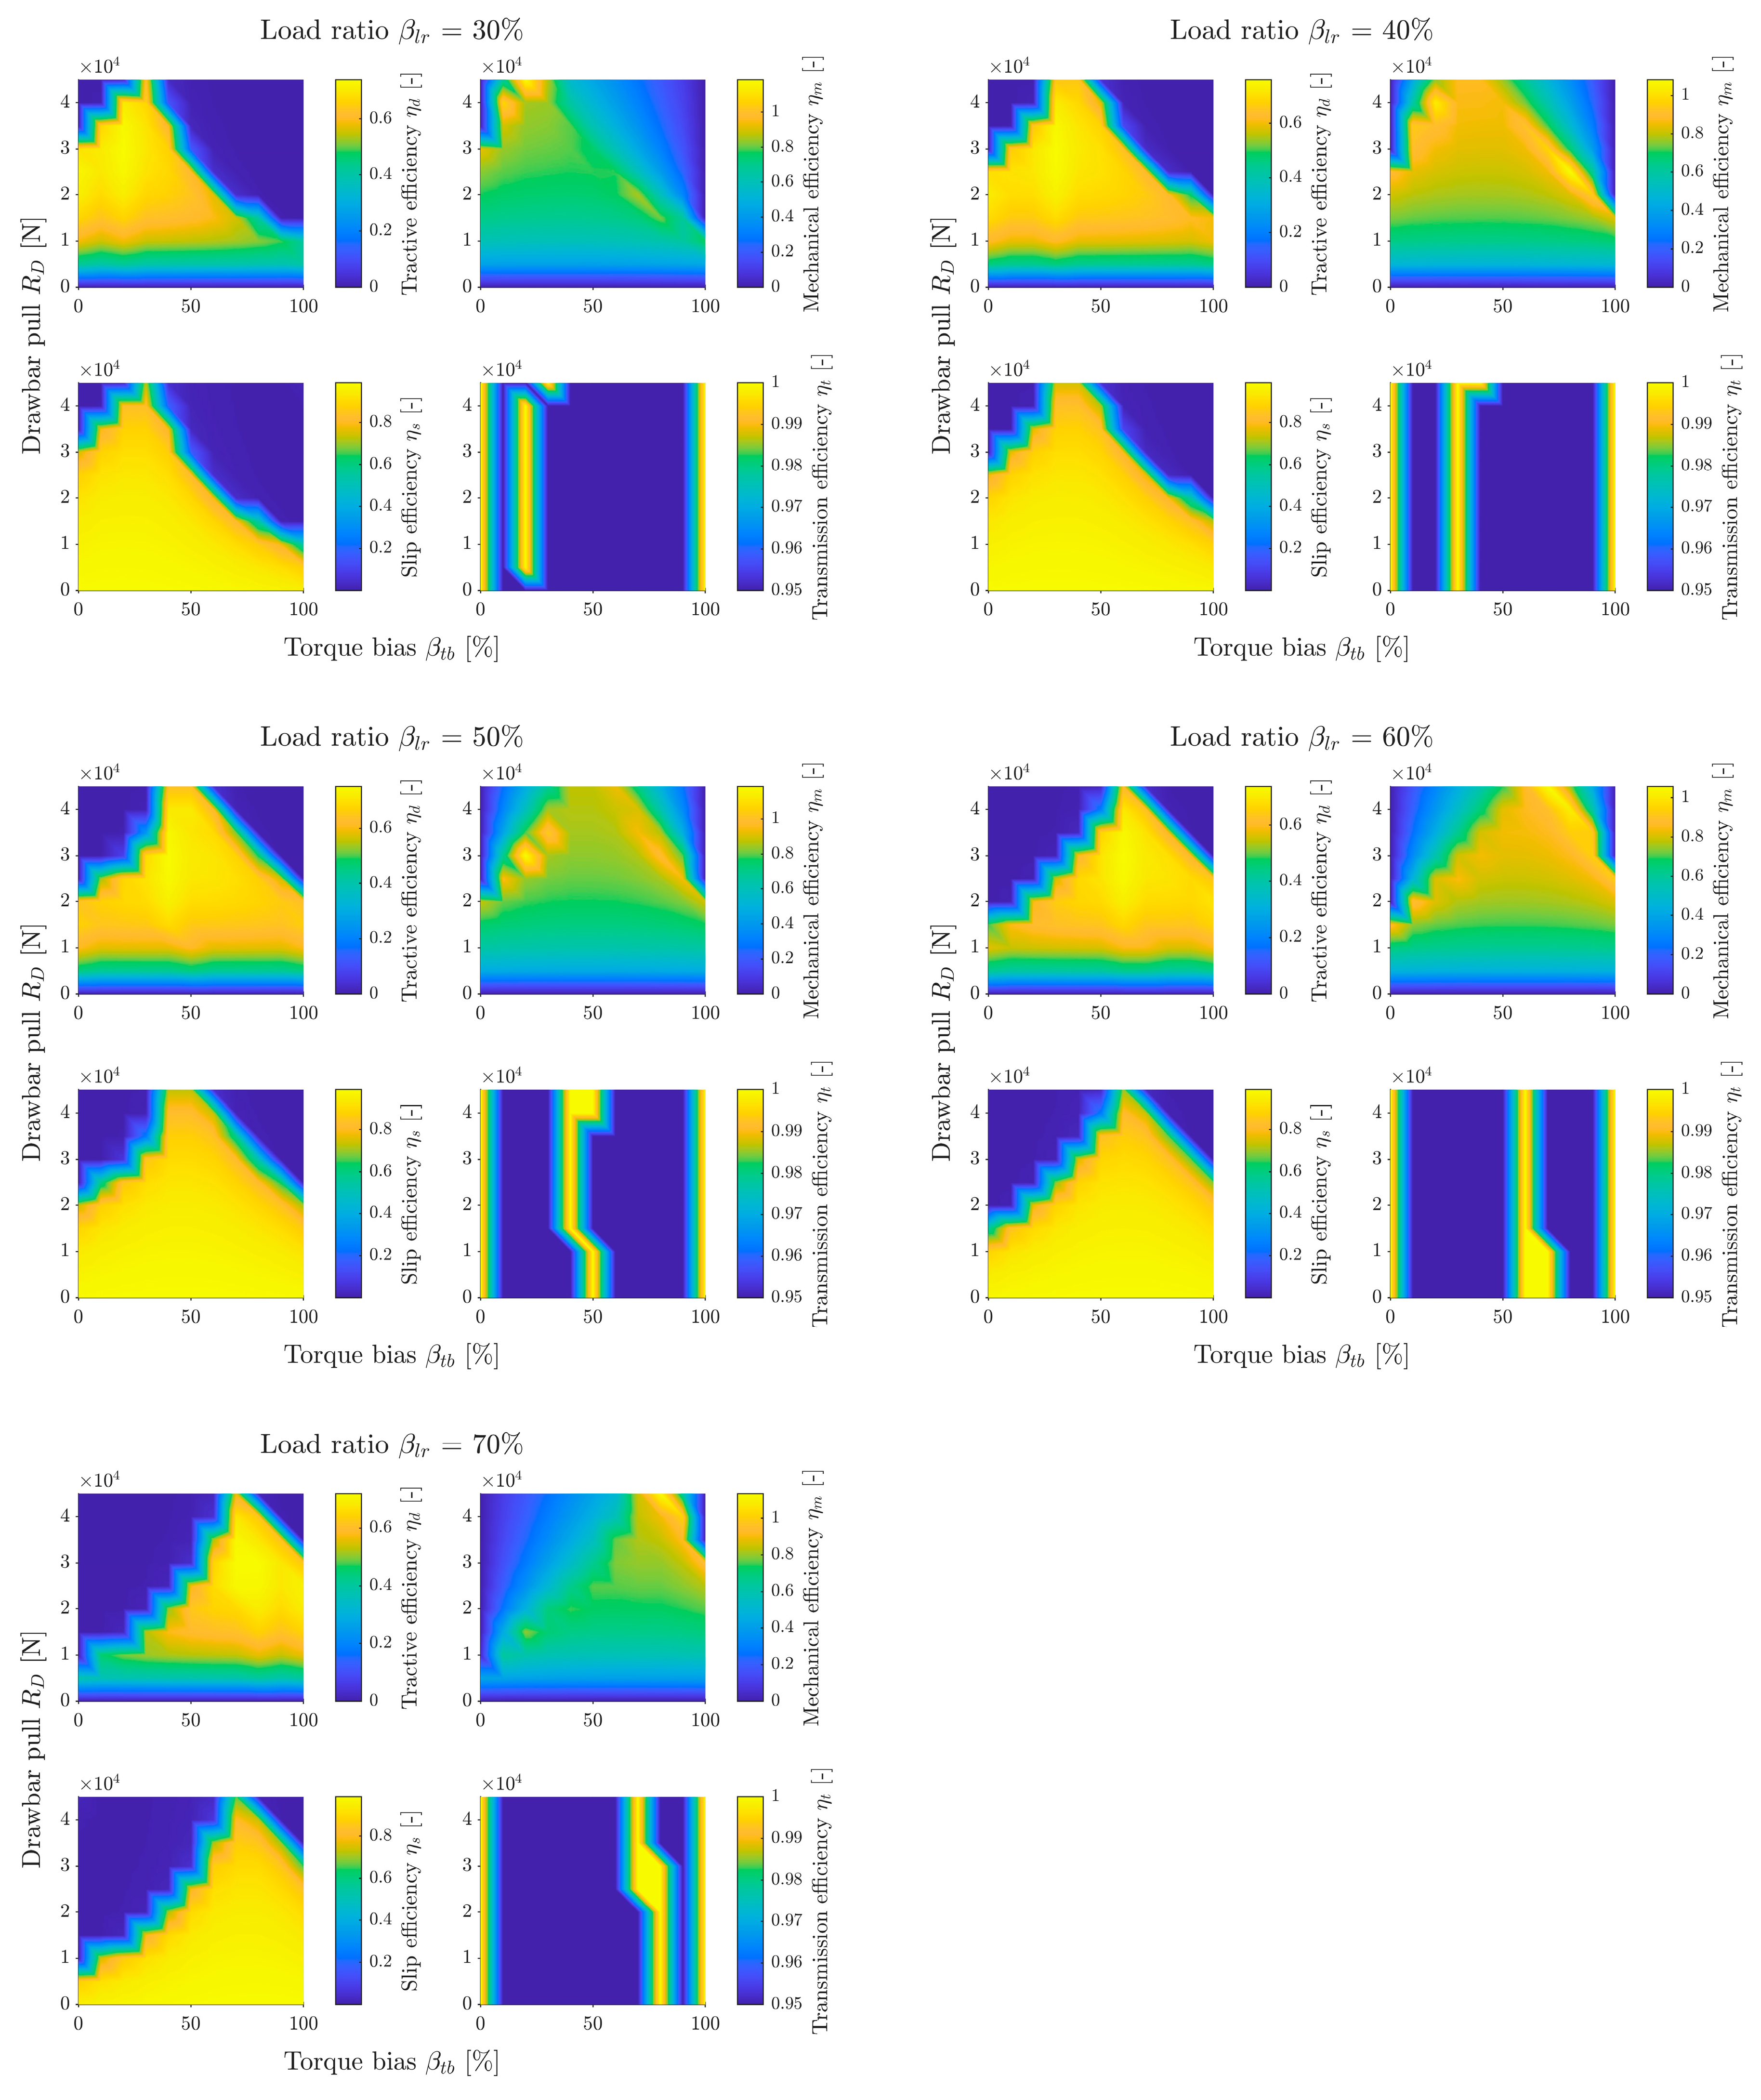
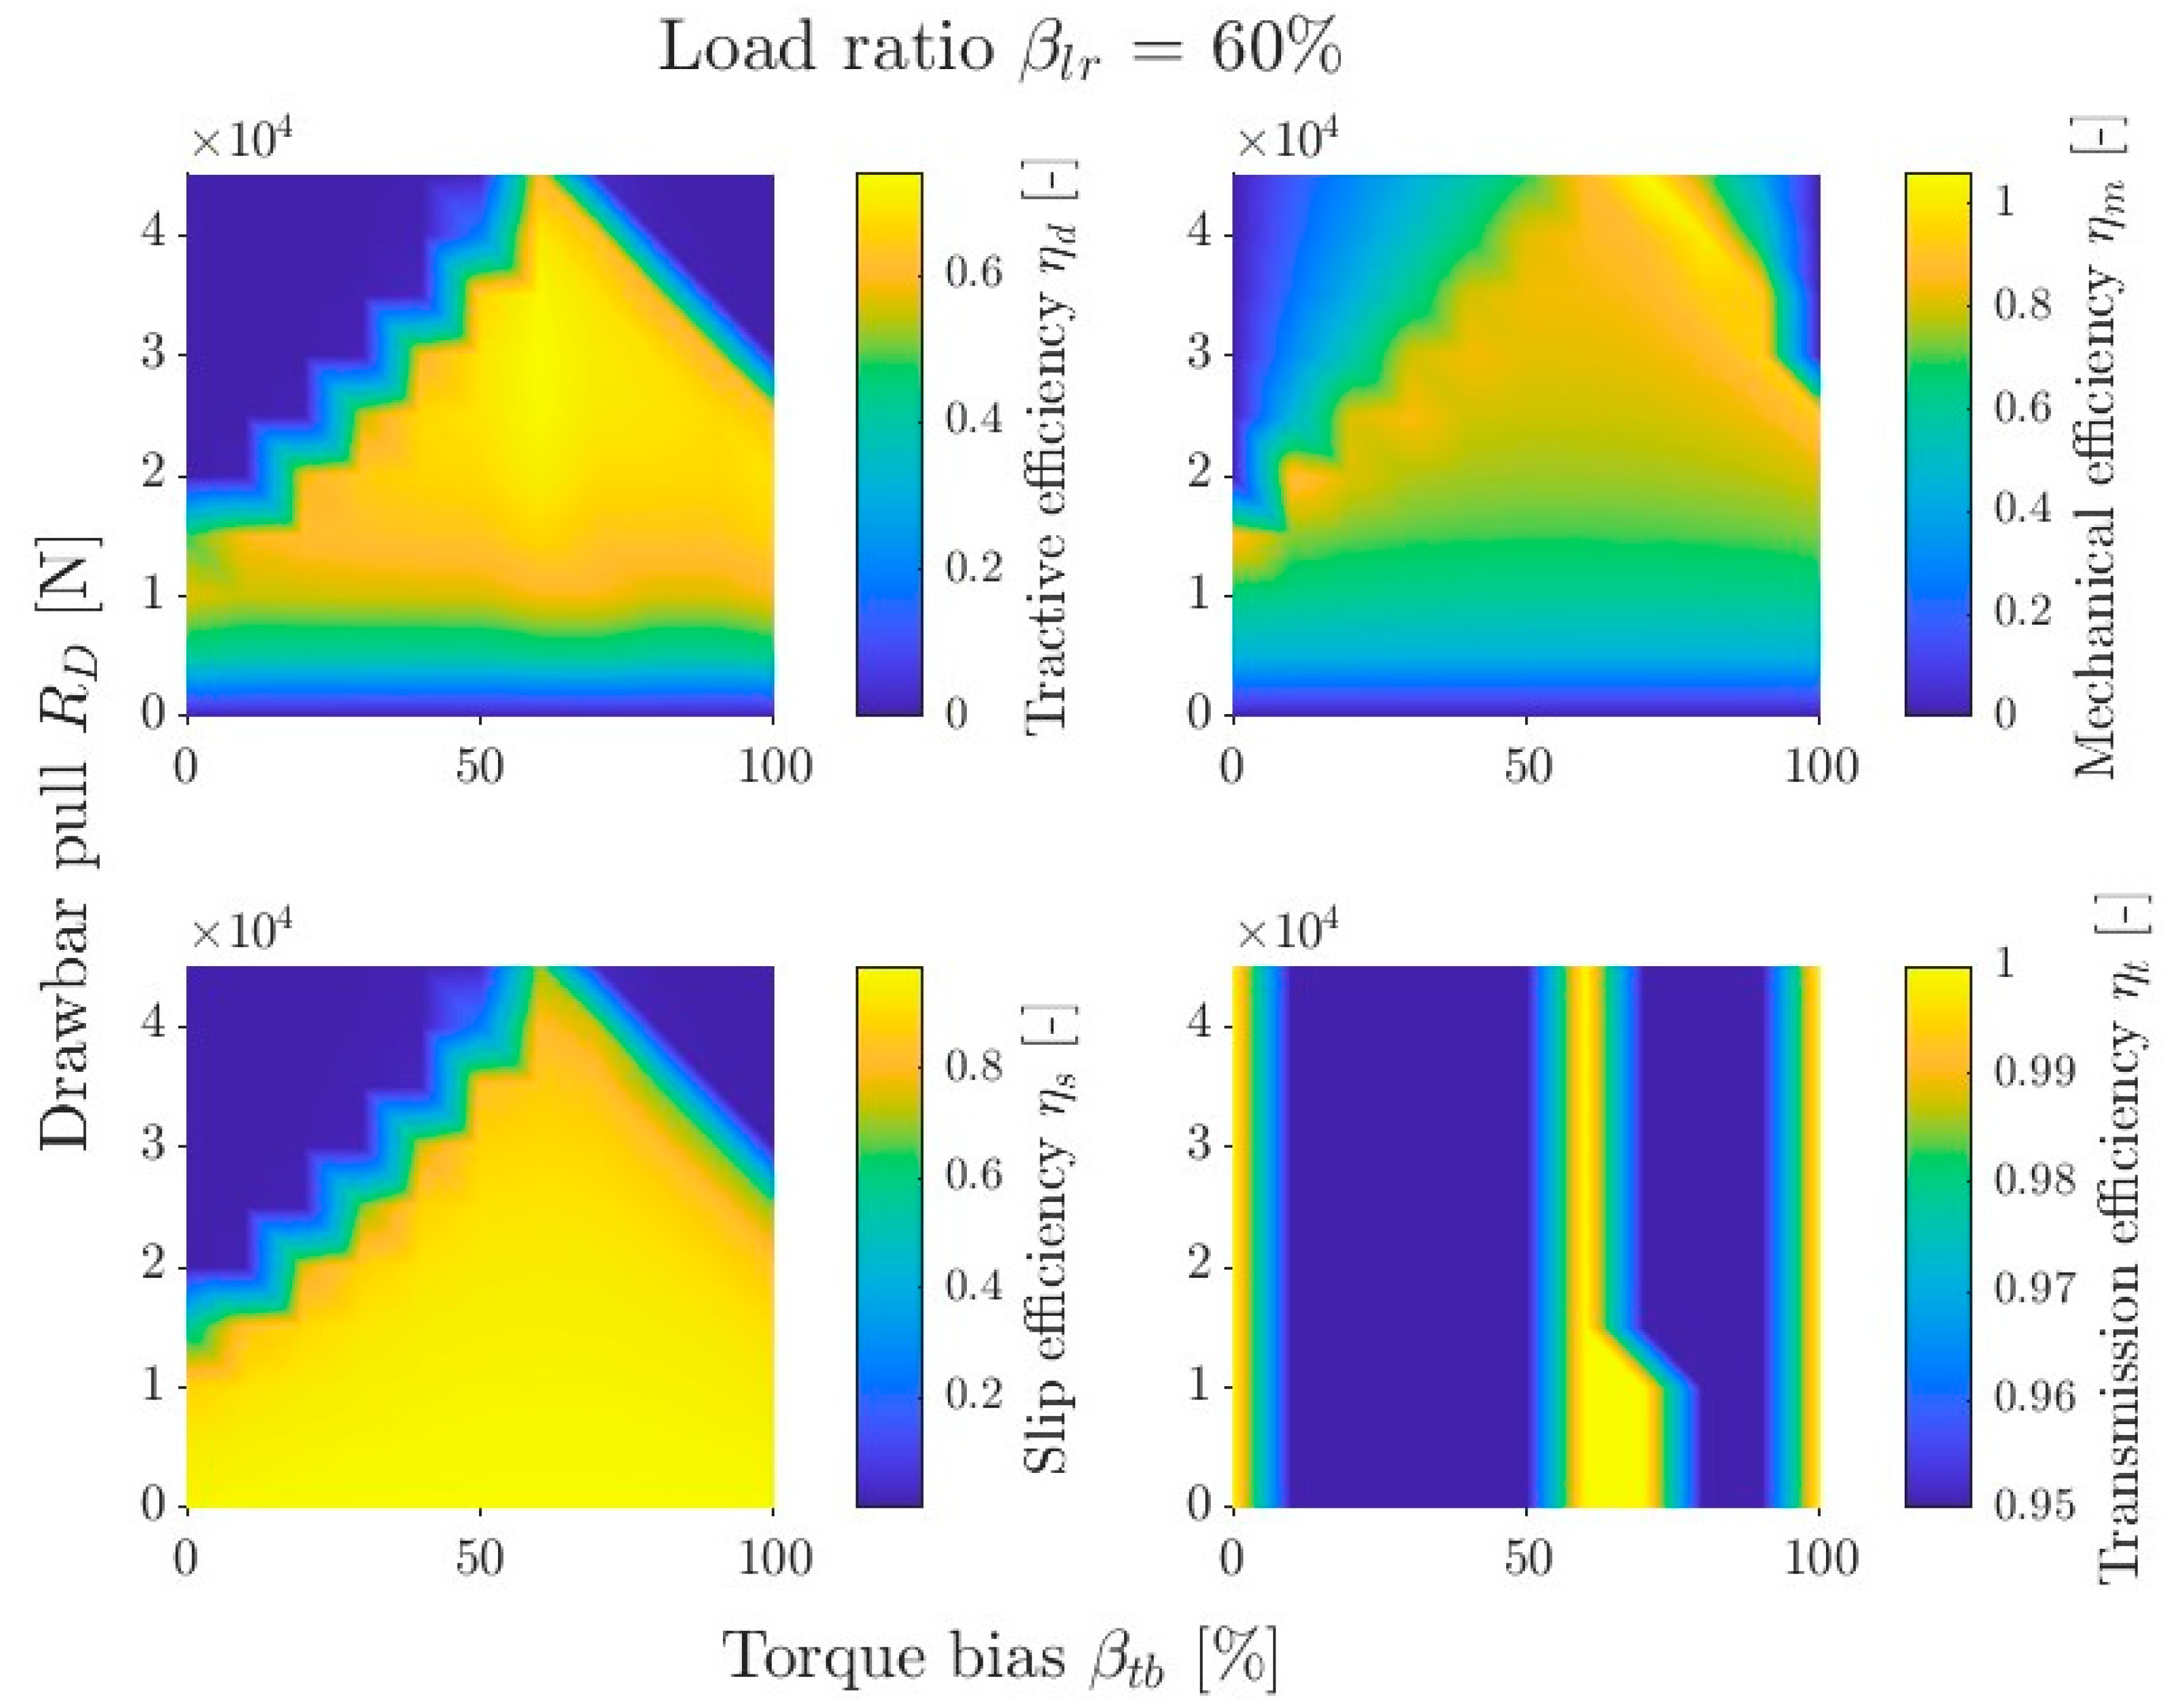
The next set of simulations examined the relationship between efficiency and torque bias
and drawbar pull
for different load distributions
. The complete data set is presented in the appendix in
Figure A4,
Figure A5 and
Figure A6. The traction efficiency subgraph in
Figure 13 shows that the efficiency map takes on a shape similar to a triangle. It is widest at the base—for small
. However, this is also where it has the lowest efficiency, which is 0 for zero
. As the
increases, efficiency increases, but the width of the triangle decreases. This is because, at high loads, redirecting torque away from the more heavily loaded axle causes high slip under the less loaded axle, reducing slip efficiency. The apex of the triangle runs approximately for the value
=
. This is the value for which the slips under the wheels are similar, resulting in high slip efficiency and differential locking, which further increases efficiency. The vehicle reaches maximum efficiency before reaching the apex. The maximum coincides with the light line on the transmission efficiency subgraph representing efficiency
= 1, which corresponds to differential locking. This is the area corresponding to the optimal torque distribution
. This line for small loads is shifted towards the more heavily loaded axle and, as the load increases, it approaches the value
. For
greater than the ground can carry, it shifts to the value
= 50%. This is because in this situation, the slip of both wheels is 1.
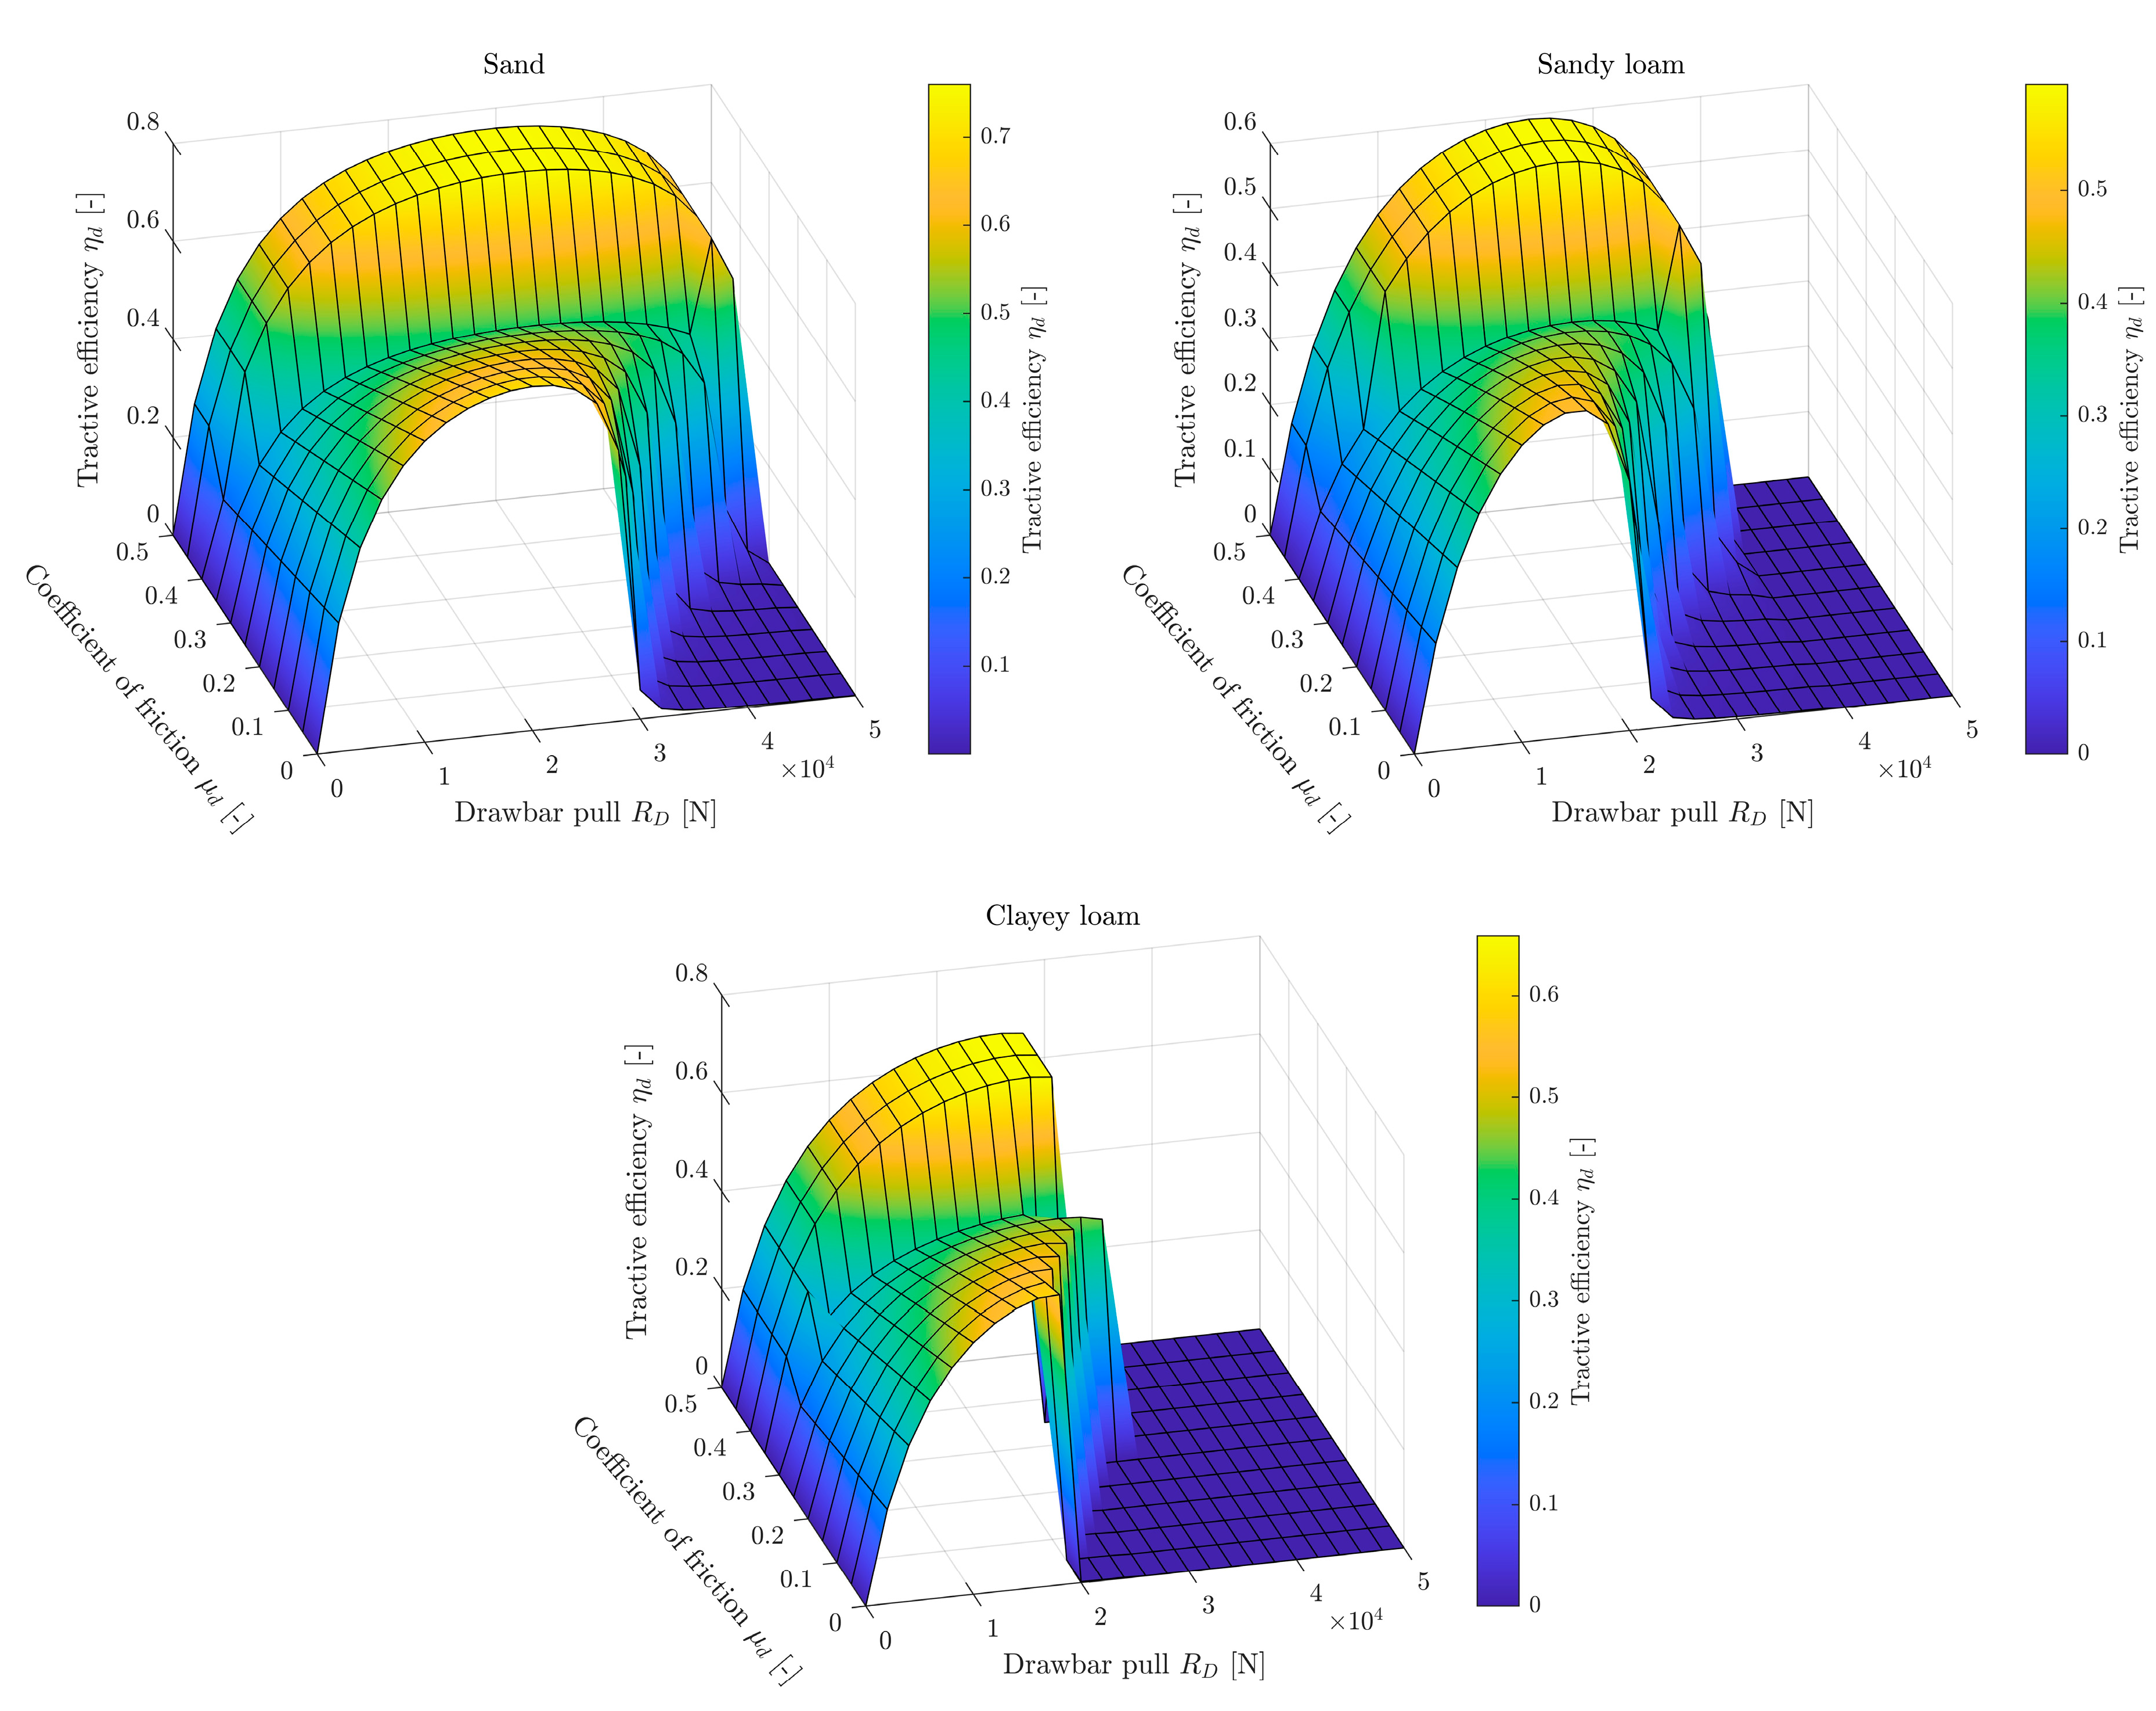
Figure 14 shows tractive efficiency graphs for three soils depending on the drawbar pull
and the coefficient of friction
for load ratio
= 0.4 and torque bias
= 0.66. These values correspond to an average heavy 4WD off-road truck traveling without a load. Two zones can be distinguished in the graphs. The first is for lower
friction values—this is the area of differential operating in open mode, and the second is for friction from approx. 0.4—the area of differential locking. The tractive efficiency as a function of drawbar pull increases with slip and reaches a maximum for large slips, but then decreases rapidly. This is consistent with the efficiency graphs presented in [
44,
59]. The first area has its maximum for the lowest friction values. This is because the transmission efficiency is then at its highest. As the friction increases, efficiency decreases, but drawbar pull value for which the efficiency drops to zero is higher. The second area has the same shape regardless of the friction value. It is also significantly higher and wider for sand and sandy loam. Hence, the conclusion is that for vehicles operating in difficult conditions or under heavy load, it is more advantageous to increase the internal friction of the differential, while for vehicles operating in light conditions, it may be more advantageous to reduce friction. The graph for clayey loam may seem surprising—although the second area is higher, it ends at lower values of
than the first area. This is because in the second area, the differential is locked, increasing efficiency, but in order to lock, it must be in the locking area (the lighter line on the transmission efficiency subplot in
Figure A6). However, for
= 66%, it is outside the locking area and therefore dissipates a very large part of the energy supplied, effectively immobilizing the vehicle.
The above simulations were performed taking into account the bulldozing effect.
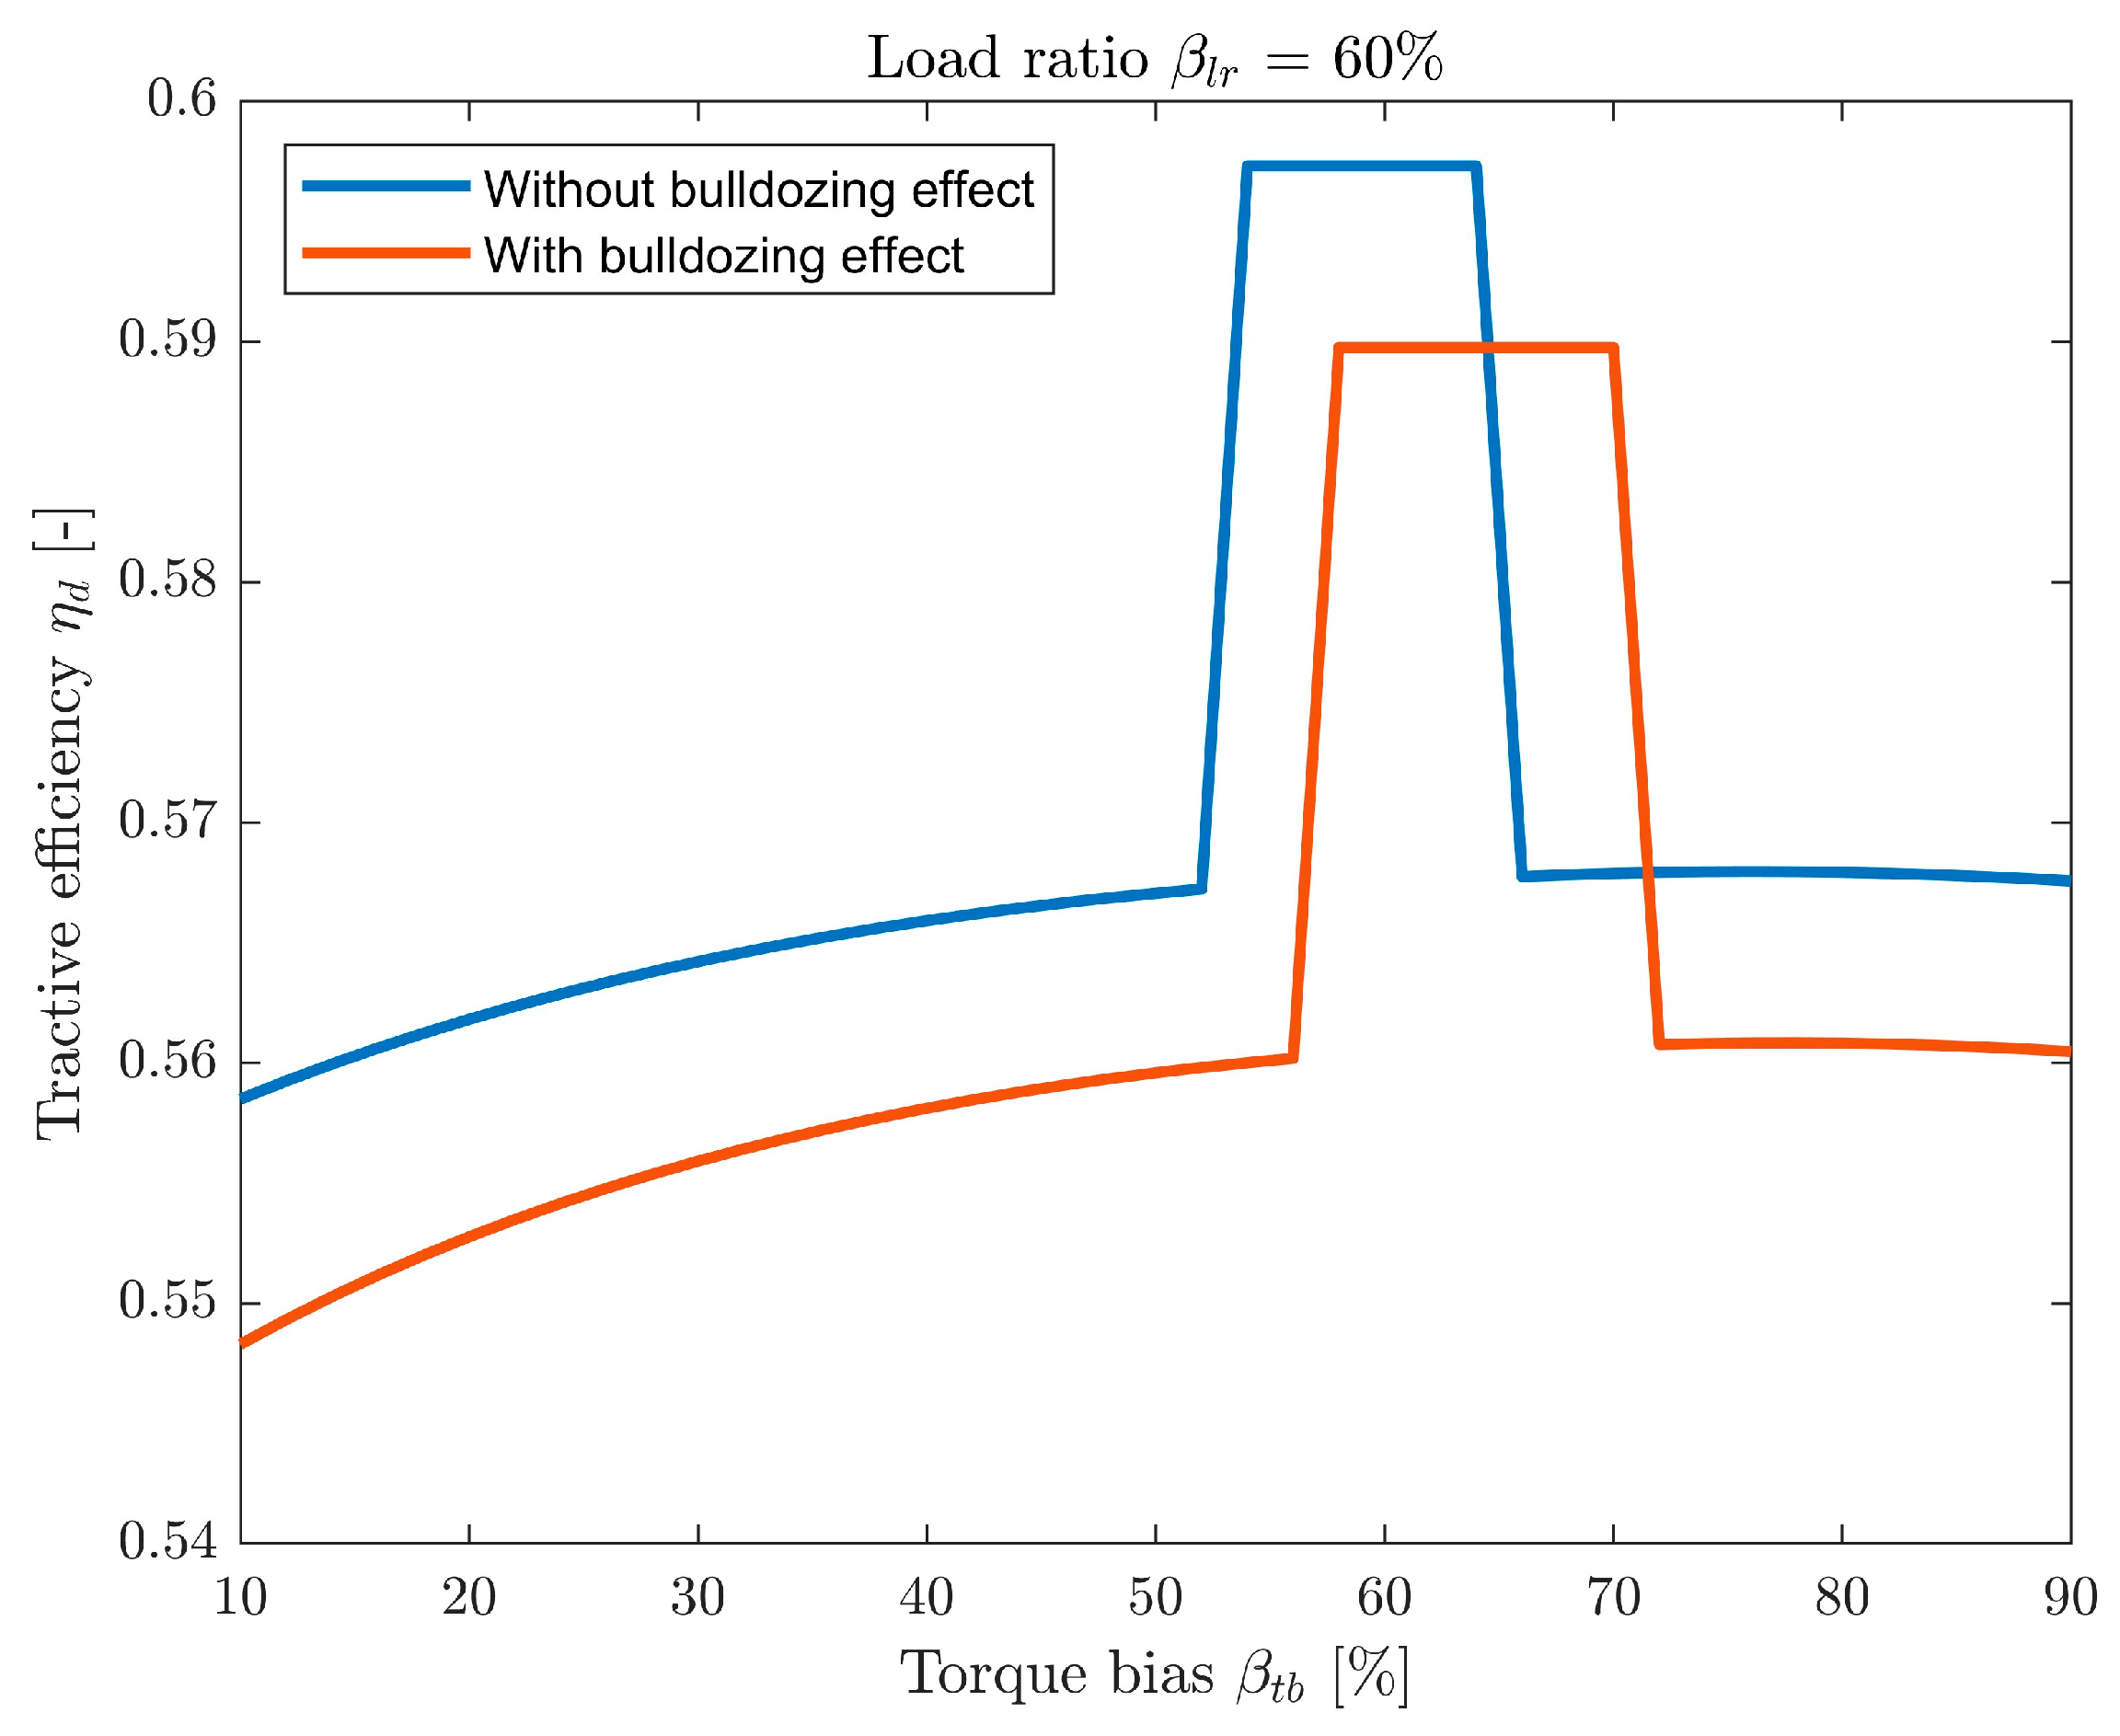
Figure 15 shows a graph depicting the relationship between tractive efficiency and
for sand at
= 60%. The dual effect of bulldozing on the results is clear. First, it increases the total resistance of the vehicle, reducing the overall efficiency. Second, it shifts the position of
, which corresponds to the step in the graph, slightly towards the rear wheel. This is because, despite the greater load on the rear wheel, the front wheel creates a deeper rut, thus generating a greater force
. This, in turn, creates a moment that increases the resultant speed of the front wheel, disturbing the speed balance. To compensate for this, it is necessary to transfer more torque to the rear axle. On the other hand, simulation without the bulldozing effect show that
is shifted toward the front wheel. This is due to the multipass effect. The decision to include bulldozing resistance in the vehicle efficiency analysis should be made individually for each analysis, but it should be taken into account that this resistance not only reduces the overall efficiency, but also affects the optimal torque bias value
.
