Article

A Combined Energy Management Strategy for Heavy-Duty Trucks Based on Global Traffic Information Optimization

School of Vehicle and Mobility, Tsinghua University, Beijing 100084, China
*
Author to whom correspondence should be addressed.
Sustainability 2025, 17(14), 6361; https://doi.org/10.3390/su17146361
Submission received: 9 April 2025 / Revised: 16 June 2025 / Accepted: 1 July 2025 / Published: 11 July 2025
(This article belongs to the Special Issue Powertrain Design and Control in Sustainable Electric Vehicles)

Abstract

As public concern over environmental pollution and the urgent need for sustainable development grow, the popularity of new-energy vehicles has increased. Hybrid electric vehicles (HEVs) represent a significant segment of this movement, undergoing robust development and playing an important role in the global transition towards sustainable mobility. Among the various factors affecting the fuel economy of HEVs, energy management strategies (EMSs) are particularly critical. With continuous advancements in vehicle communication technology, vehicles are now equipped to gather real-time traffic information. In response to this evolution, this paper proposes an optimization method for the adaptive equivalent consumption minimization strategy (A-ECMS) equivalent factor that incorporates traffic information and efficient optimization algorithms. Building on this foundation, the proposed method integrates the charge depleting–charge sustaining (CD-CS) strategy to create a combined EMS that leverages traffic information. This approach employs the CD-CS strategy to facilitate vehicle operation in the absence of comprehensive global traffic information. However, when adequate global information is available, it utilizes both the CD-CS strategy and the A-ECMS for vehicle control. Simulation results indicate that this combined strategy demonstrates effective performance, achieving fuel consumption reductions of 5.85% compared with the CD-CS strategy under the China heavy-duty truck cycle, 4.69% under the real vehicle data cycle, and 3.99% under the custom driving cycle.

1. Introduction

With increasing concerns about environmental pollution and the urgent need for sustainable development, the advancement of new-energy vehicles has accelerated significantly. As a critical component of this transition and a viable solution for the shift toward electric vehicles, hybrid electric vehicles (HEVs) have garnered considerable attention [1]. The economic performance of HEVs is primarily influenced by two key factors: the configuration and parameters of the powertrain and the energy management strategy (EMS) employed [2]. This paper focuses on the study of EMSs for HEVs. Research indicates that HEV EMSs can be categorized into three types: rule-based strategies, optimization-based strategies, and learning-based strategies [2]. Each of these strategies presents distinct advantages and disadvantages.
Rule-based strategies determine energy distribution based on predefined rules and empirical knowledge [3]. In recent years, research on these strategies has increasingly focused on integrating them with other approaches or adopting specific methods to optimize established rules [3,4]. For instance, Lian et al. [5] incorporated determination rules into a reinforcement learning framework based on the DDPG algorithm, combining it with the optimal fuel consumption curve to improve fuel economy while maintaining system stability. Similarly, Zhou et al. [6] designed a fuzzy control strategy for an HEV equipped with a hybrid energy storage system and optimized the membership function by using a genetic algorithm. Test results indicate that this method enhances fuel economy and extends battery life. Although rule-based strategies are straightforward and require low computational resources, their lack of flexibility may lead to sub-optimal performance in complex driving environments [2,3,4].
Optimization-based strategies often utilize mathematical models or specific algorithmic frameworks to optimize the operating states of power sources [3]. These strategies account for various factors, such as energy costs and driving demands, to achieve optimal vehicle performance and efficiency [3,4]. For instance, Fan et al. [7] replaced certain rules in the charge depleting–charge sustaining (CD-CS) strategy with the equivalent consumption minimization strategy (ECMS), optimizing the equivalent factors for different driving distances and battery states of charge (SOCs) by using a genetic algorithm, thus enhancing control effectiveness during the CD phase. Similarly, Xin et al. [8] integrated a quality estimation algorithm for hybrid electric commercial vehicles into a model predictive control framework, analyzing the effects of control strategies under various loads, which significantly reduced additional fuel costs. Wang et al. [9] developed a speed prediction-based EMS for a dual-mode power-split HEV, employing the Powell modified algorithm to determine the power distribution ratio, resulting in improved fuel economy. Guo et al. [10] designed an EMS for a dual-mode HEV that combines improved sequential quadratic programming with a deep Q-learning algorithm to address challenges in model predictive control, achieving excellent real-time capability and robustness. While optimization-based strategies provide greater adaptability and efficiency in dynamic environments, they also introduce increased computational complexity. Real-time optimization may require substantial computational resources, potentially leading to longer response times [3,4].
Learning-based strategies continuously optimize energy distribution through machine learning algorithms [11]. These strategies enhance their performance over time by analyzing historical data and real-time feedback [11,12]. Yan et al. [13] introduced a non-parametric reward function within the double-delay deep deterministic policy gradient strategy, thereby reducing the workload associated with EMS parameter adjustments and improving the energy management effectiveness of HEVs. Guo et al. [14] developed an EMS for a plug-in HEV using a quadruple deep Q-network. Simulation results indicate that this algorithm-based EMS achieves superior fuel economy and demonstrates robust performance. Bin et al. [15] investigated the effects and robustness of a Q-learning-based EMS under various decay patterns of the exploration-to-exploitation ratio. They ultimately designed a weighted ensemble learning scheme that resulted in significant improvements compared with traditional Q-learning approaches. While learning-based strategies offer strong adaptability and flexibility, they require a substantial number of data for training, and the processes of model development and validation can be complex and time-consuming [2,3].
Additionally, many scholars have combined different types of EMSs to achieve better control performance. For instance, integrating rule-based strategies with other approaches can enhance the real-time performance and reliability of the combined strategy. The method presented in Ref. [7] essentially combines the CD-CS strategy and the ECMS, improving the effectiveness of the CD-CS strategy. Wu et al. [16], focusing on fuel cell vehicles, compared rule-based strategies, optimization-based strategies, and combined strategies, finding that the combined strategy outperformed individual strategies across different driving cycle types. With the development of learning-based strategies, rule-based strategies are also being integrated to reduce data dependence. Lian et al. [5] embedded expert knowledge into deep deterministic policy gradients, creating a rule-assisted deep reinforcement learning framework. This framework not only accelerates the learning process but also achieves better fuel economy and enhances the robustness of the EMS. Chang et al. [17] reorganized driving cycles by reducing dimensionality and classifying motion sequence features, utilizing a learning vector quantization neural network for training and the recognition of driving cycle types. They then integrated rule-based strategies into the deep reinforcement learning framework, demonstrating that this approach effectively reduces fuel consumption. Moreover, some scholars have combined optimization-based strategies with learning-based strategies, as noted earlier in Ref. [10]. Cheng et al. [18] proposed a dual neural network-based ECMS along with a Bayesian regularization neural network for equivalent factor correction, enabling the adaptive adjustment of the equivalent factor to achieve near-optimal fuel economy without charging state reference support.
In recent years, as vehicles have increasingly gained the capability to acquire traffic information, many researchers have begun exploring EMSs based on traffic data [19,20]. Relevant studies indicate that this approach not only optimizes energy utilization efficiency but also enhances vehicle performance under complex traffic conditions. Zhou et al. [21] developed a chance-constrained stochastic model predictive control method, which was employed alongside a two-layer predictive model that estimates future driving cycles based on traffic information. This strategy improved driving safety and enhanced the computational efficiency of speed planning in stochastic environments. Cui et al. [22] proposed a multi-objective hierarchical EMS specifically for intersection scenarios. This strategy utilizes traffic light information obtained from the Internet of Vehicles to guide EMS operation and employs alternating direction multiplier methods to efficiently solve the speed prediction model. Hardware-in-the-loop experimental results demonstrate that this EMS performs exceptionally well. Sun et al. [23] utilized the K-means algorithm to cluster historical traffic data, constructing a Markov speed prediction model based on the clustering results, which was then integrated with the ECMS. This strategy optimizes the equivalent factors using traffic information, thereby enhancing energy management effectiveness. Simulation results indicate that this method can significantly improve the fuel economy of the studied hybrid bus.
Hou et al. [24] developed a vehicle–environment cooperative EMS based on the V2X framework. This strategy optimizes instantaneous energy management using observer results and refines control thresholds with the improved Beetle Antennae Search algorithm. Verification demonstrates significant improvements in economic efficiency compared with rule-based strategies. Ref. [25] proposed an A-ECMS that combines cooperative eco-driving guidance with road information from V2X communication. This strategy provides guidance signals and recommended speeds while calculating the target SOC based on simplified road data. Simulation results indicate enhanced fuel economy. Liu et al. [26] introduced a framework that classifies operating cycles to determine the optimal power distribution between the auxiliary power unit and the battery. An adaptive method using V2X information adjusts key thresholds in real time with a fuzzy logic controller, reducing algorithm complexity and improving performance. Niu et al. [27] proposed a bootstrap error reduction strategy to improve energy efficiency across different datasets. They also introduced a data-driven EMS updating framework utilizing V2X to enhance fuel economy and adaptability through multiple updates. This system uses V2X-based buses to collect real-time data and periodically update the strategy, outperforming offline EMSs in terms of fuel economy. Ma et al. [28] integrated an improved variable-time headway strategy into a model predictive control framework for vehicle following under slippery conditions. This strategy enhances dynamic perception and prediction by considering the relative speeds, positions, and accelerations of leading vehicles, optimizing safety, comfort, and economy.
In summary, as the demand for the comprehensive effectiveness of EMSs increases, the intelligence and informatization of vehicle EMSs will become both a future trend and a necessary requirement for sustainable economic development. Research on constructing EMSs using traffic information is diverse; however, existing methods generally do not incorporate optimization algorithms into real-time energy management frameworks. This is likely due to the potential for excessive optimization time, which could compromise the timeliness of the strategy. Nevertheless, advanced optimization algorithms can significantly enhance energy management performance by optimizing key parameters within the EMS. Therefore, this study aims to explore the online application of high-quality optimization algorithms and investigate feasible methods and the effects of integrating optimization algorithms into the EMS framework. Specifically, a combined EMS consisting of the CD-CS strategy and the A-ECMS was designed. When global traffic information is unavailable or insufficient, the CD-CS method controls the vehicle. When sufficient information is available, the CD-CS strategy initially manages the vehicle while simultaneously optimizing the equivalent factor of the A-ECMS in real time using the Nutcracker Optimization Algorithm (NOA). Once the optimization is complete, control switches to the A-ECMS. The goal of this research study is to investigate the potential effects of an online optimization framework when sufficient traffic information is accessible. The main contributions of this study are as follows:
  • An optimization framework for the A-ECMS equivalent factor based on global traffic information and the NOA is designed, enabling the rapid acquisition of a high-quality equivalent factor.
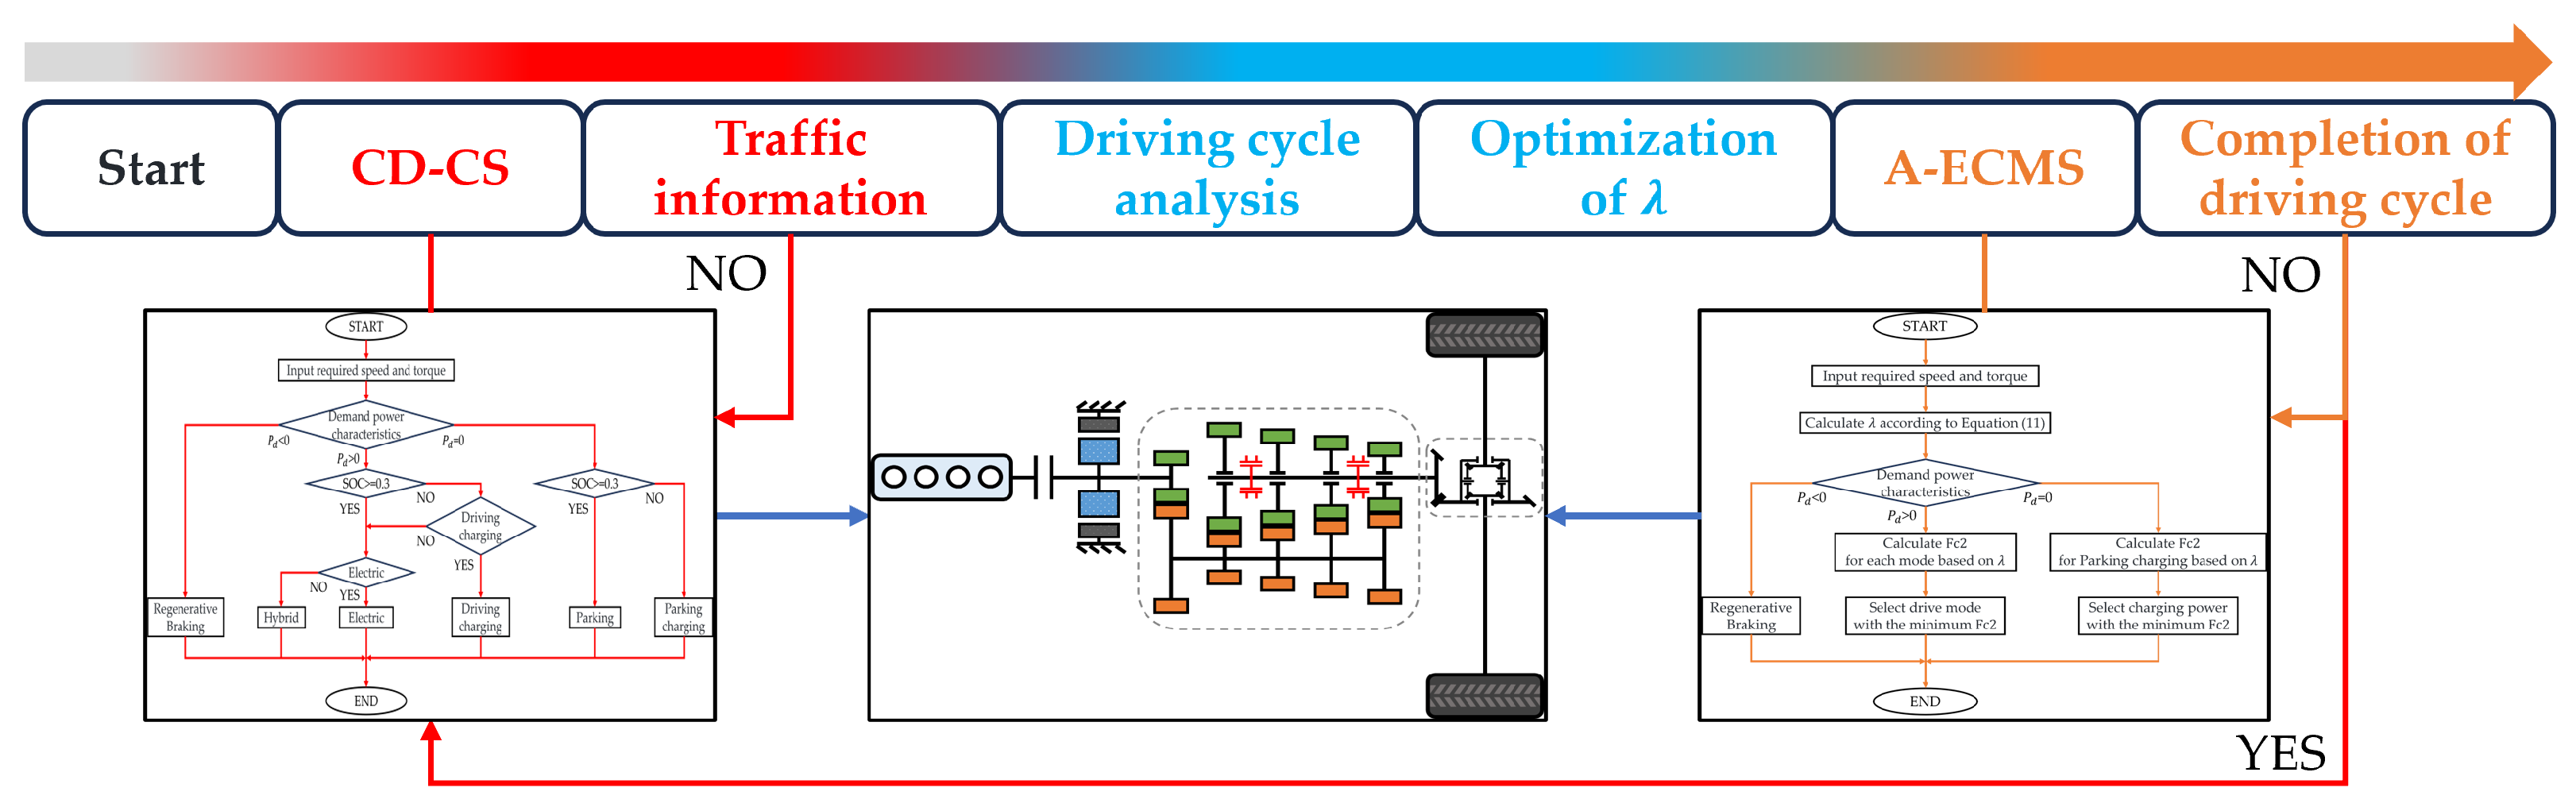
  • The CD-CS strategy is combined with the A-ECMS as a combined strategy, addressing the negative impacts caused by the inability to use the A-ECMS during the equivalent factor optimization phase.
The remainder of this paper is organized as follows: Section 2 establishes the vehicle model for the hybrid electric heavy-duty truck in this study; Section 3 presents the structure and operational logic of the CD-CD, the A-ECMS, and the combined strategy; Section 4 details the process of optimizing equivalent factors using global traffic information and the NOA; Section 5 validates the proposed strategy and analyzes the results; Section 6 concludes the paper.

2. Hybrid Electric Heavy-Duty Truck Model

2.1. Powertrain Structure and Operating Modes

The powertrain configuration of the hybrid electric heavy-duty truck under investigation is based on an engineering project. This truck utilizes a parallel hybrid architecture, and its powertrain structure is illustrated in Figure 1. The system comprises an engine, clutch, ISG motor, 12-speed AMT, final drive, and differential.
The truck operates in several modes, including electric mode, engine mode, hybrid mode, driving charging mode, parking charging mode, and regenerative braking mode. The working states of the main components of the powertrain for each mode are summarized in Table 1. Additionally, the primary vehicle parameters are provided in Table 2.
Table 3. The AMT gear ratios and efficiency.
AMT GearGear RatioEfficiency
Gear 112.1096.6%
Gear 29.4196.9%
Gear 37.3197.0%
Gear 45.7197.1%
Gear 54.4698.3%
Gear 63.4897.1%
Gear 72.7198.4%
Gear 82.1198.2%
Gear 91.6498.4%
Gear 101.2898.6%
Gear 111.0099.6%
Gear 120.7898.4%

2.2. Transmission System and Vehicle Longitudinal Dynamic Model

The transmission structure of the truck in this study is relatively simple; therefore, the analysis will focus on the hybrid mode as an example. In this mode, the engine and ISG motor work in tandem to propel the vehicle. At this time, the vehicle speed and total driving torque are described by Equations (1) and (2):
v = 3.6 2 π R t n e 60 i t i 0
t d = ( t e η c + t i ) η t η f d
where v is the vehicle speed, R t is the tire radius, and n e is the engine speed. i t is the AMT gear ratio. i 0 is the final drive gear ratio. The value 3.6 is the conversion factor from m/s to km/h, and 60 is the conversion factor from r/min to r/s. Since the engine speed is lower than that of the motor and both are mounted on the same axis, n e is used as the AMT input speed. t d is the total drive torque, and t e and t i are the engine and motor output torque, respectively. The symbols η c , η t , and η f d indicate the efficiency of the clutch, AMT, and final drive with differential, respectively.
In this paper, the efficiency of the clutch is 98.5%, while both the final drive and the differential exhibit an efficiency of 96.1%. The gear ratios and efficiency of the AMT are provided in Table 3.
The AMT efficiency was determined through bench tests that simulated various vehicle states (including different speeds and accelerations) under full load, with lubricating oil parameters within the normal range. During these tests, the efficiency variation across different gears was minimal, and the values in the table represent the average efficiency for each gear.
During vehicle operation, the driving torque equals the external resisting torque. The resisting torque consists of four types of resistance: rolling resistance, air resistance, grade resistance, and acceleration resistance. The relationship between the driving torque and resistance is given by Equation (3):
t d = m g c o s ( θ ) μ + 1 2 ρ A C D ( v 3.6 ) 2 + m g s i n ( θ ) + δ m a R t
where m is the vehicle mass, g is the acceleration due to gravity, θ is the grade angle, μ is the rolling resistance coefficient, ρ is the air density, A is the windward area, C D is the air resistance coefficient, δ is the rotational mass conversion factor, and a is the vehicle acceleration. In this paper, μ is calculated using empirical Equation (4).
μ = 0.00344 + 0.0000296 v

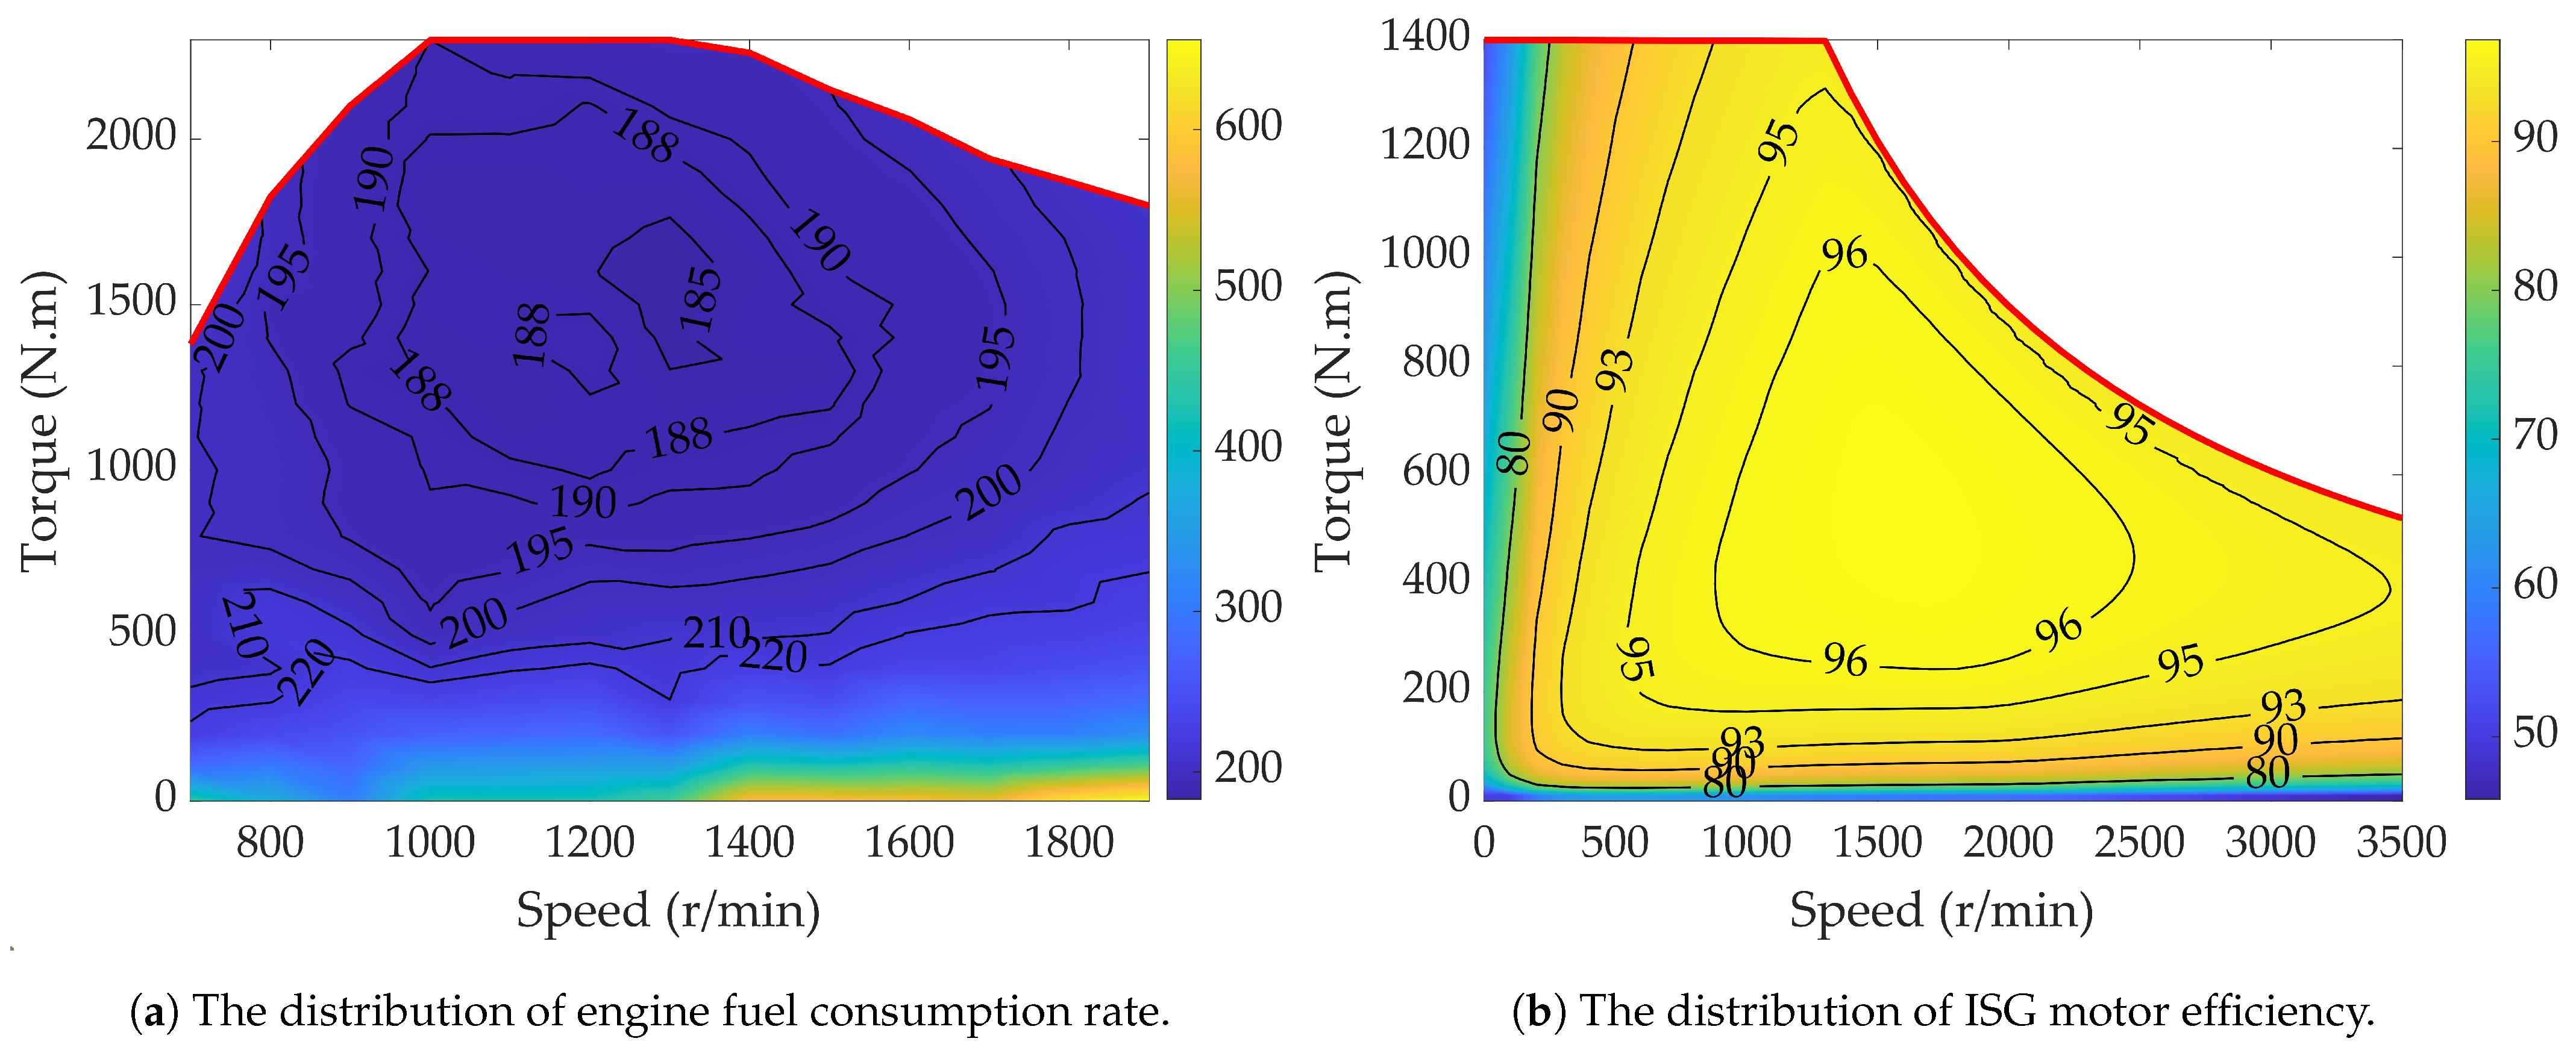
2.3. Engine, ISG Motor, and Battery Models

This paper primarily focuses on improving the vehicle’s fuel economy by optimizing the distribution of the power source operating points. In constructing the EMS, test bench data tables are referenced to obtain the engine fuel consumption rate and ISG motor efficiency. These can be expressed by Equations (5) and (6):
m f = f ( n e , t e )
η i = g ( n i , t i )
where m f and η i denote the engine fuel consumption rate and the motor efficiency, respectively; f ( n , t ) and g ( n , t ) are the lookup functions for engine and motor; and n i is the motor speed.
The energy consumption characteristics of the engine and the motor are shown in Figure 2a,b. The data presented in these figures were obtained from bench tests. The testing accuracy for the engine tests is a speed interval of 50 rpm and a torque interval of 100 Nm. For the motor tests, the testing accuracy is a speed interval of 100 rpm and a torque interval of 10 Nm. During the test period, the room temperature was maintained at 25 °C, the engine coolant temperature was kept between 85 °C and 95 °C, and the motor coolant temperature was maintained between 50 °C and 60 °C.
For the battery, this study assumes that the battery thermal management system can maintain the battery temperature within the normal range; thus, the impact of temperature on the battery is not considered. An equivalent internal resistance model is employed [29], and the current is represented as shown in Equation (7):
I = U o c U o c 2 4 R b P o u t 2 R b
where U o c is the open-circuit voltage. R b is the internal resistance. P o u t is the output power, and the change in the SOC can be obtained from Equation (8):
d S O C d t = I Q
where Q is the battery capacity.

3. EMS Based on Traffic Information

3.1. CD-CS in the Absence of Traffic Information

The CD-CS strategy is one of the most widely used approaches for addressing energy management challenges in HEVs. During the CD phase, this strategy primarily operates in electric mode, while in the CS phase, it utilizes all available modes to maintain the SOC close to a specified value. In this paper, considering the constraints of the battery SOC range, the SOC is limited to 0.2. However, to accommodate the requirements of the combined strategy, the SOC limit is set to 0.3. The flowchart of the CD-CS strategy is presented in Figure 3.
During the operation of the CD-CS strategy, the demand power characteristics are first analyzed. When the demand power is less than 0, the regenerative braking mode is activated. Conversely, when the demand power is greater than 0, an appropriate mode is selected based on the relationship between the current SOC and the specified value. Additionally, when the demand power equals 0, the SOC status is assessed to determine if charging is required, and the charging power is selected accordingly.
In summary, this strategy is a real-time approach that selects appropriate control variables based on the required vehicle speed and torque, as well as the current SOC of the battery and hardware constraints. In most cases, the primary objective of this strategy is to regulate the SOC. However, if no operational modes are available due to SOC management constraints, the strategy will automatically switch to alternative modes to ensure that the vehicle operates normally. This approach does not rely on traffic information and manages the vehicle’s state independently. The fuel consumption for each time stage in this strategy is represented by Equation (9):
F c 1 ( k ) = 2 π n e ( k ) t e ( k ) m f ( k ) 60.3600000
where k is the stage number divided by time, with an interval of 1 s. The numerator value of 3,600,000 is the conversion factor from J to kWh.

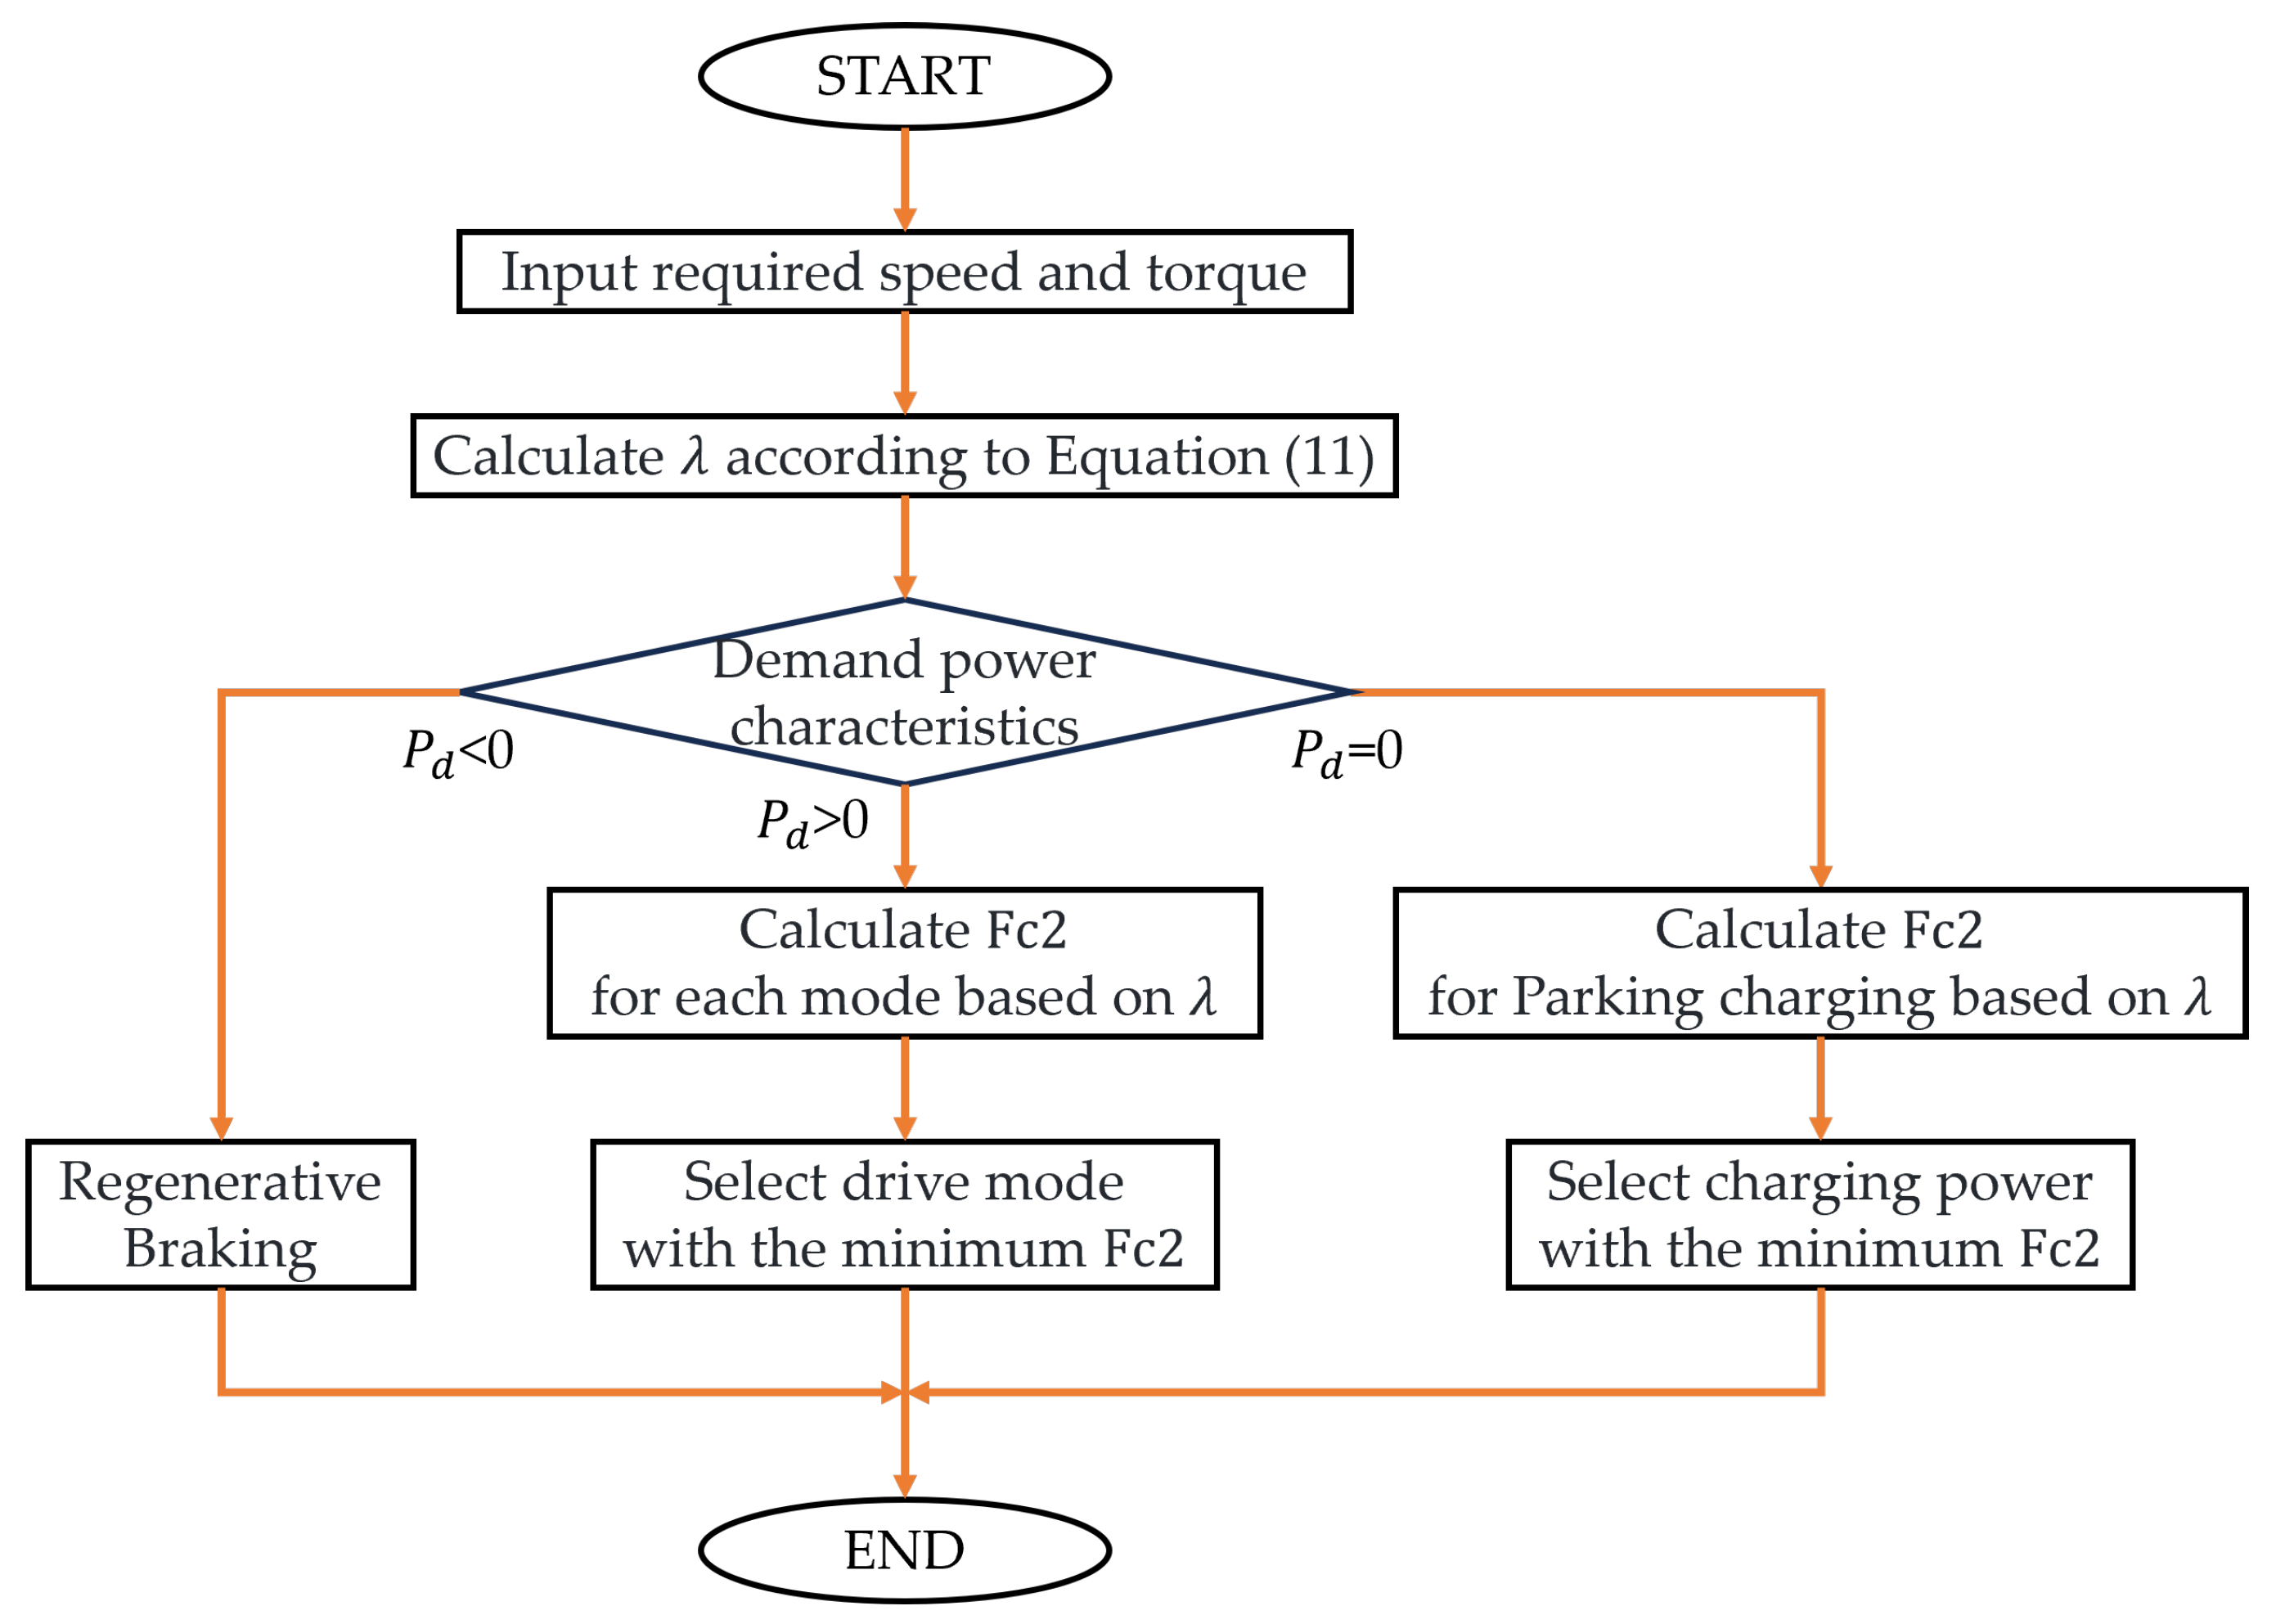
3.2. A-ECMS Based on Global Traffic Information

The A-ECMS is an instantaneous optimization strategy where the effectiveness of energy management depends on the quality of the equivalent factor. This strategy selects the mode that minimizes equivalent fuel consumption at each time stage. During this process, the electrical energy consumed by the battery is converted into fuel consumption at a specified ratio for comparison. The equivalent fuel consumption is as shown in Equation (10):
F c 2 ( k ) = 2 π n e ( k ) t e ( k ) m f ( k ) 60.3600000 + λ P b a t ( k ) H
where λ is the equivalent factor; P b a t is the battery output power, which can be obtained by multiplying the open-circuit voltage and the current; H is the calorific value of gasoline.
To ensure that the SOC does not fall below 0.2 during the operation of the strategy, the equivalent factor λ is adaptively adjusted to the specified SOC of 0.3. By maintaining a 0.1 SOC buffer, the SOC is prevented from dropping below the lower limit, even when the global optimal decision calls for a more aggressive reduction. At the same time, a linear correction formula is employed to dynamically adjust the equivalent factor, as shown in Equation (11), ensuring smooth and safe SOC management throughout the process:
λ = λ 0 1 S O C ( k ) 0.3 0.1
where λ 0 is the initial equivalent factor. When the A-ECMS starts operating, λ 0 is determined based on λ . λ 0 remains constant during the operation of the A-ECMS, while λ changes with the SOC.
The flowchart of the A-ECMS constructed in this paper is shown in Figure 4. This strategy first evaluates the nature of the demand power based on the required vehicle speed and torque, while simultaneously updating the equivalent factor according to Equation (11). If the demand power is less than 0, the regenerative braking mode is activated. When the demand power exceeds 0, the driving mode with the minimum equivalent fuel consumption is selected. If the demand power equals 0, the parking charging power is determined based on the equivalent fuel consumption. During this process, selection is made only from the pre-determined efficient operating point combinations.
Generally, this strategy does not rely on traffic information. However, to enhance its adaptability to various driving scenarios and improve overall fuel economy, this paper incorporates driving cycle data obtained from intelligent transportation systems to optimize the equivalent factor, allowing for adjustments based on traffic conditions.

3.3. Combined Strategy of CD-CS and A-ECMS

The A-ECMS approach outlined in this section utilizes traffic information to optimize the equivalent factor based on future operating cycles provided by intelligent transportation systems, thereby enhancing fuel efficiency. However, optimizing the equivalent factor requires some time, leading to an initial optimization window at the beginning of the operational phase, which limits the applicability of this method. To address this issue, this paper proposes a combination of the CD-CS strategy and the A-ECMS. Specifically, during the equivalent factor optimization phase, the CD-CS strategy is used to control the vehicle; once the optimization is complete, the A-ECMS takes over for the remainder of the journey.
The process of this combined strategy is illustrated in Figure 5 and can be divided into seven parts. The first part is the initialization module, which, upon the completion of initialization, places the vehicle under the control of the CD-CS module. Next, the traffic information module is activated to check for the availability of traffic information, which is obtained from the intelligent transportation system. Once sufficient information is gathered and the operational conditions are predicted, the system enters the driving cycle analysis module, which analyzes the required optimization time. The system then proceeds to the equivalent factor optimization module for optimization. After optimization is complete, the A-ECMS replaces the CD-CS strategy and takes control of the vehicle. The final module, completion of driving cycle, determines the offline time of the A-ECMS. There are two possible scenarios: one is the end of the driving cycle, and the other is an unexpected situation. In either case, control will switch back to the CD-CS module.
The combined strategy proposed in this paper can be understood as a two-tier strategy, with the upper tier being the A-ECMS, which optimizes the equivalent factor based on global traffic information, and the lower tier being the CD-CS strategy, which operates independently of such information. The lower tier is employed when traffic information is insufficient, while the entire two-tier strategy is activated once global traffic data become available. During the optimization period of the upper tier, the lower tier manages vehicle control; after the optimization is complete, the upper tier assumes control. Additionally, if the upper tier strategy fails or if there are anomalies in the traffic information, the lower tier can provide emergency control of the vehicle.

4. Optimization Framework for A-ECMS Equivalent Factor Based on NOA

As mentioned in the previous section, the constructed strategy utilizes the predicted driving cycles provided by intelligent transportation systems to optimize the equivalent factor of the A-ECMS within the combined strategy. To ensure that the optimized combined strategy effectively enhances fuel economy, it is crucial to select a high-performance optimization algorithm. The NOA chosen in this study is a novel approach inspired by a bird species native to the United States and Canada. This algorithm mimics the foraging, storage, and cache search and recovery behaviors of these birds. The NOA is a single-objective optimization algorithm that offers exceptional search capabilities while maintaining computational efficiency compared with traditional optimization algorithms [30]. This characteristic may provide a distinct advantage in addressing the optimization problems discussed in this paper.
The fitness function of the NOA is defined as the fuel consumption required to achieve the predicted driving cycle based on global traffic information. The optimization objective is to minimize fuel consumption while satisfying specific constraints. The expression for the fitness function is as shown in Equation (12):
F i t = k = 1 N 2 π n e ( k ) t e ( k ) m f ( k ) 60.3600000 + λ P b a t ( k ) H + h ( S O C ( N ) )
where N is the total number of stages in the predicted driving cycles and h ( S O C ( N ) ) is the adaptive component. After completing the calculations for the final stage, the algorithm will analyze the deviation between the final SOC and the specified value. If the deviation between the final SOC and the specified value meets certain conditions, the adaptive value will be calculated using Equation (13) as follows:
h ( S O C ( N ) ) = α 3600 | S O C ( N ) 0.3 | Q U o c H η c
where α is the adaptive factor, and η c is the average charging efficiency of the engine when charging the battery. The value 3600 is the conversion factor for converting from Ah to C. The reason for using this formula as an adaptive term is that the energy associated with deviating from the specified SOC value can be considered to be generated by the engine-driven motor. The value of the adaptive term is directly linked to the selection of the factor α , which is determined based on S O C ( N ) , as shown in Equation (14):
α = 1000 if S O C ( N ) < 0.3 1 if 0.3 S O C ( N ) 0.31 500 if S O C ( N ) > 0.31
In the first scenario, when S O C ( N ) falls below the specified value, this condition is strictly prohibited; consequently, α is assigned a relatively large value. When S O C ( N ) is between 0.3 and 0.31, it is deemed to be within a reasonable range, and α is set to −1 to align fuel consumption with that observed when S O C ( N ) is exactly 0.3. Conversely, when S O C ( N ) exceeds 0.31, it signifies a notable deviation from the specified value; however, since the SOC remains within the specified battery SOC range, α is assigned a slightly larger value.
The constraints stipulate that each power source must operate within its designated range and not exceed specified limits. Additionally, the battery must maintain its SOC within the defined range during operation, as indicated in Equation (15):
t e ( n e ( k ) ) t e , m a x ( n e ( k ) ) | t i ( n i ( k ) ) | t i , m a x ( n i ( k ) ) S O C m i n S O C ( k ) S O C m a x
where t e ( n e ( k ) ) and t e , m a x ( n e ( k ) ) represent the torque that the engine is expected to produce at a certain RPM and the maximum allowable output torque, respectively. Similarly, t i ( n i ( k ) ) and t i , m a x ( n i ( k ) ) have analogous meanings. However, since the motor can output negative torque for regenerative braking, absolute value signs are included.
Finally, regarding the NOA operational parameters, the population size is set to 50, and the number of iterations is also set to 50. Additionally, to facilitate the determination of optimization duration, it is specified that the parameter optimization duration for every 30 min driving cycle is 60 s, while cycles shorter than 30 min are treated as 30 min. The optimization process is illustrated in Figure 6, and the program terminates when the maximum number of iterations is reached. During this period, the calculation of fitness occurs in two steps, foraging and storage, followed by cache search and recovery. Once the optimization concludes, the optimal equivalent factor and fitness are output.

5. Results and Discussion

5.1. Verification of CD-CS Strategy

The core components of the EMS developed in this paper are the CD-CS strategy and the A-ECMS. However, the A-ECMS does not operate independently throughout the entire driving process; it relies on the CD-CS strategy until the equivalent factor is appropriately optimized. Consequently, the section on strategy validation focuses solely on verifying the CD-CS strategy and the combined strategy with the selected driving cycle—China heavy-duty truck cycle (CHTC)—illustrated in Figure 7. Since this paper does not address the generation of global driving cycle information from traffic data, this information is directly provided during the validation phase.
The validation of the CD-CS strategy primarily evaluates its ability to maintain the SOC close to the specified value, which is why multiple rounds of testing were conducted. These tests encompass evaluations of both the CD and CS phases, with the simulation results presented in Table 4. The SOC variation curves for each group during the simulation are illustrated in Figure 8.
As shown in Figure 8, when the initial SOC is 0.3, the CD-CS strategy operates in the CS phase, maintaining the SOC value around 0.3. Deviations primarily occur above 0.3, which can be attributed to regenerative braking. For the other three groups, as there is sufficient electrical energy initially and for a subsequent period, the CD-CS strategy first enters the CD phase. Once the SOC drops to approximately 0.3, it transitions to the CS phase and continues with the subsequent energy management process. These results indicate that the designed CD-CS strategy prioritizes the use of battery energy when it is abundant and stabilizes the battery energy as it approaches the lower constraint, thereby achieving its intended control objectives.
Table 4 presents the validation results, including the initial and final SOCs, fuel consumption, and the RMS error between the CS phase SOC and the specified value. As shown, the final SOC for all groups is nearly the same and slightly exceeds the specified value. This is because, towards the end of the operating cycle, the vehicle primarily relies on regenerative braking. In this context, the SOC deviation effectively reflects the efficiency of regenerative braking. Consequently, this leads to an increase in the RMS error, as regenerative braking causes a significant deviation in the SOC from the specified value.

5.2. Verification of Combined Strategy

The validation of the combined strategy also utilizes the operating cycles shown in Figure 7, with an initial SOC set to 0.3. During the validation process, the equivalent factor optimization time is set to 60 s. Figure 9 illustrates the changes in SOC and fuel consumption during the operation of the combined strategy. From Figure 9a, it can be observed that the SOC variation of the combined strategy is significantly more flexible than that of the CD-CS strategy, indicating that the combined strategy offers greater adaptability in reallocating the output ratio between the engine and the electric motor. Furthermore, by establishing the lower limit of SOC constraints at 0.3 and employing the optimized equivalent factors along with the adjustment method based on Equation (13), the SOC remains within the hardware requirements of the battery, while the final SOC consistently approaches the specified value.
Figure 10 shows the distribution of operating points during the implementation of the combined strategy. Figure 10a presents the distribution of engine operating points. In most cases, the engine fuel consumption rate remains below 200 g/kW·h, indicating that the combined strategy ensures operation within a low-fuel consumption zone. Figure 10b illustrates the distribution of ISG motor operating points, with the majority achieving efficiency exceeding 90%.
Additionally, the distribution of operating points across different energy consumption ranges is quantified in Figure 11. The results indicate that over 81.5% of engine operating points maintain fuel consumption below 200 g/kW·h, while over 96.6% of motor operating points achieve efficiency above 90%. This distribution confirms that the combined strategy effectively coordinates the engine and ISG motor for optimal performance.
Figure 12 presents a comparison of the SOC variation among the CD-CS strategy, combined strategy, and the A-ECMS. It can be observed that the SOC variations for the combined strategy and the A-ECMS are largely consistent, indicating that the proposed framework for the combined strategy can effectively adjust the A-ECMS to the optimized level. Furthermore, compared with the CD-CS strategy, both the combined strategy and the A-ECMS demonstrate stronger control over the final SOC and the process SOC. Even when the SOC remains at a low level, they still ensure the appropriate use of electric energy and timely utilize the recovered energy for replenishment. This highlights the advantage of global information in addressing energy management challenges.
Table 5 presents the simulation results for three different strategies. The findings indicate that the combined strategy achieves a 5.85% reduction in fuel consumption compared with the CD-CS strategy, demonstrating an energy consumption advantage over rule-based approaches. Furthermore, only minor differences are observed when compared to the A-ECMS. This suggests that the operational rules employed in the combined strategy framework do not significantly impair the performance of the A-ECMS, despite the introduction of the CD-CS strategy. Rather, it allows the A-ECMS to obtain equivalent factors online, facilitating low fuel consumption in subsequent journeys.

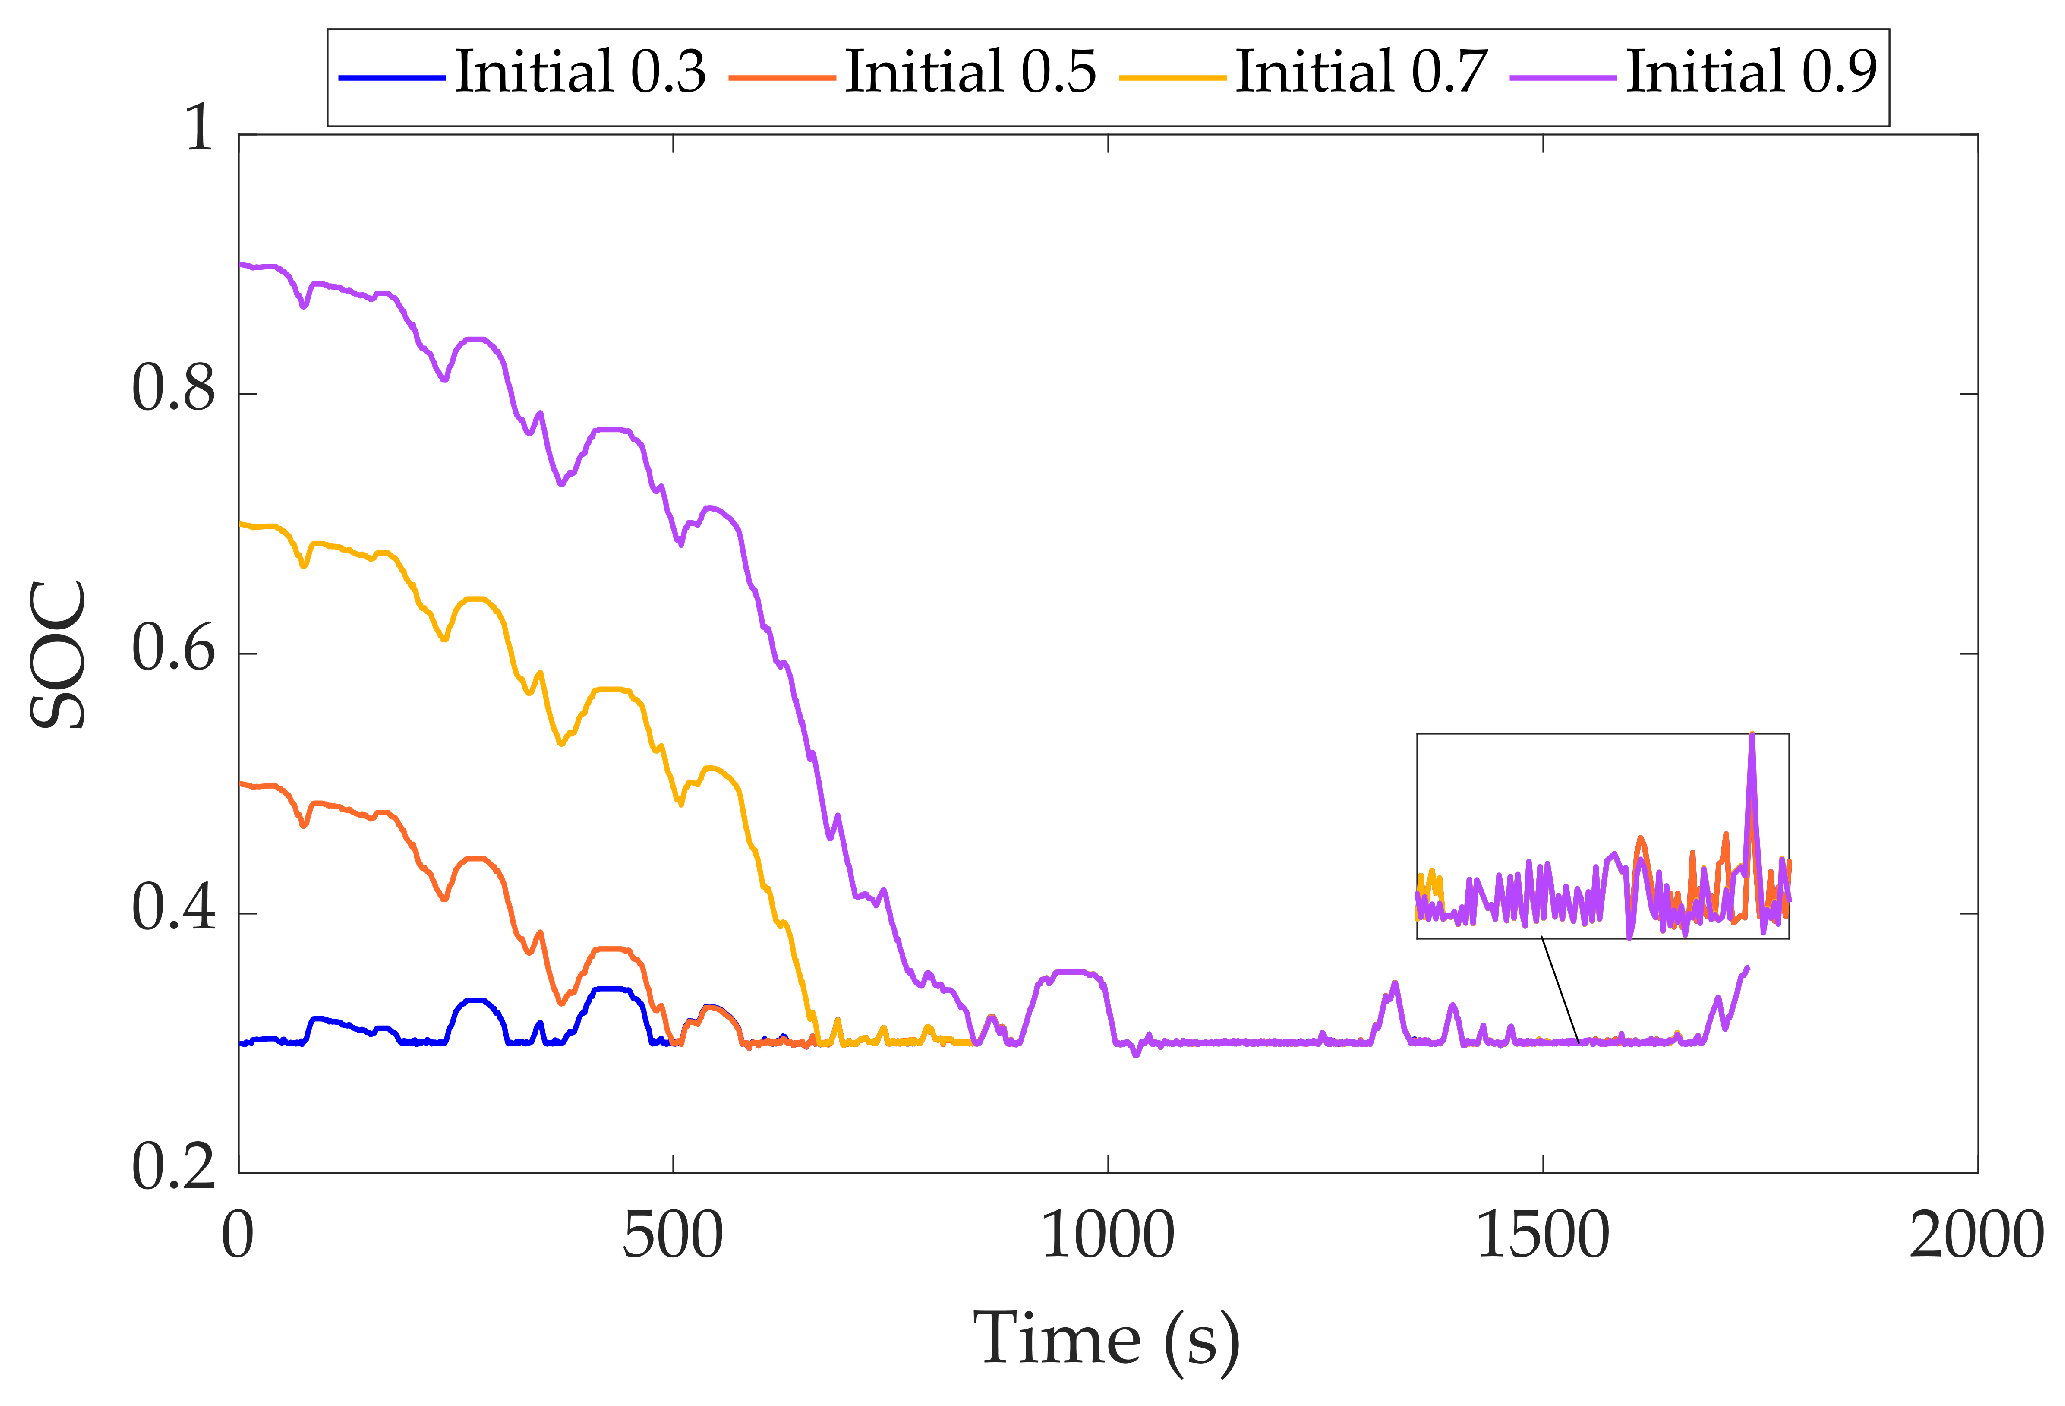
5.3. Validation of Robustness of Combined Strategy

To validate the robustness of the proposed combined strategy, real driving data are used as the predicted cycle output from the intelligent transportation system. The simulation is conducted with an initial SOC of 0.3. The operating cycle profile used is shown in the Figure 13, with the data collected from a suburban-to-highway route. The total length of the route is 60 min; thus, the optimization duration for the A-ECMS equivalent factor within the combined strategy is set to 120 s.
This section continues to adopt a comparative validation approach, with the simulation results presented in Figure 14, Figure 15, Figure 16 and Table 6. From Figure 14, it can be observed that even though the operating cycles used in this section differ from those of the CHTC, the operating points of both the engine and the motor are still primarily concentrated in the efficient zone.
The statistical distribution of operating points is shown in Figure 15. The results indicate that 75.3% of the engine operating points are within 200 g/kWh, and 95.9% of the motor operating points are in the region with an efficiency above 90%. This result is similar to that in Figure 11; however, the proportion of engine operating points within 200 g/kWh has decreased, which may be related to the randomness of actual-driving cycles.
From the SOC variations of the three strategies shown in Figure 16, it is evident that the SOC curve of the combined strategy closely matches that of the A-ECMS, except for the initial portion. This indicates that when the optimization time for the equivalent factor is relatively long, the constructed combined strategy framework still allows the A-ECMS to promptly take over the subsequent energy management process from the CD-CS strategy.
From the data in Table 6, the performance of the combined strategy remains intermediate among the three strategies: it reduces fuel consumption by 4.69% compared with the CD-CS strategy while increasing consumption by 0.13% compared with the A-ECMS. The driving cycle used in this section is derived from real-world data, featuring a longer duration and significant randomness, thus providing greater reference value than the CHTC. Nevertheless, the combined strategy still demonstrates favorable fuel economy. This suggests that incorporating high-quality optimization algorithms into the optimization process of the A-ECMS equivalent factor is a theoretically feasible approach to leveraging global traffic information.
To further validate the robustness of the combined strategy, a custom test cycle modeled after the WVU 5-peak cycle was employed, as illustrated in Figure 17. This cycle consists of five uphill segments with varying gradients and corresponding transition sections. The gradient data for the uphill segments are based on the five levels of the Chinese road gradient standards, while the vehicle speeds reference the WVU 5-peak cycle, with higher gradients corresponding to lower speeds.
The distribution of operating points during the verification process is shown in Figure 18. From Figure 18, it can be observed that both the engine and motor operating points are confined to a limited area. The statistical analysis of the operating points is presented in Figure 19, indicating that the distribution results from this verification differ from those in Figure 11 and Figure 15. More than half of the engine operating points fall within the range of 210–220 g/kWh, predominantly concentrated in the lower left corner of Figure 18a. Although these points have a high proportion, their power output is low, resulting in a limited impact. A similar phenomenon is also observed in the distribution of motor operating points, with nearly half of the operating points falling within the efficiency range of 90% to 95%, corresponding to the lower left corner of Figure 18b. The similar patterns in the distribution of operating points for both the engine and motor may be attributed to the limited randomness of the custom cycle data or may be related to the structural characteristics of the powertrain of the heavy-duty truck under study.
Figure 20 illustrates the SOC variations under the three strategies, where the SOC exhibits fluctuations. This behavior results from the near-constant speed and fixed gradient of each uphill segment, leading to a periodic switching pattern during vehicle operation. Specifically, the vehicle alternates between the driving charging mode and either the hybrid mode or the electric mode, with the primary pattern being the cycle between the driving charging mode and hybrid modes. A closer examination of Figure 20 also reveals that the SOC trends for the combined strategy and the A-ECMS are similar. The difference between them is due to the CD-CS control phase in the early stage of the combined strategy.
The relevant numerical results are summarized in Table 7, and they are similar to those in Table 5 and Table 6. Although the distribution of the operating points for the power sources may vary due to the custom cycle and the powertrain structure, the fuel consumption data still show that the difference between the combined strategy and the A-ECMS is minimal. At the same time, the fuel consumption of the combined strategy is 3.99% lower compared with the CD-CS strategy, indicating a certain advantage.

5.4. Verification of Rationality of NOA Operational Parameter Settings

The final part of this section primarily focuses on validating the reasonableness of the operational parameter settings for the NOA. Figure 21 shows the variation in fitness with the number of iterations during the optimization process of the equivalent factors for the A-ECMS, along with the program runtime. As illustrated in Figure 21, the NOA converges after 26 iterations, taking 24.18 s. This indicates that the 60 s optimization interval for every 30 min of operation, as outlined in Section 4, is sufficient to meet the requirements of the strategies.
To further validate the reasonableness of the NOA operational parameter settings, 50 optimization runs were conducted under the selected parameters, and the data characteristics of the samples were analyzed. The collected data include the number of iterations at which the algorithm converged and the algorithm’s runtime. Given the volume of data, the results are summarized using four statistical measures: minimum, maximum, median, and average. As illustrated in Figure 22, the maximum number of iterations is less than 50, and the maximum runtime is also under 60 s. This indicates that the NOA operational parameters not only facilitate the timely convergence of the algorithm but also do not impose an excessive computational burden. Additionally, during NOA operation, the CPU utilization (Intel(R) Core(TM) i5-10500 CPU @ 3.10 GHz) remained around 15% (with a maximum of 19.6%), suggesting that the online optimization within the combined strategy places relatively low demand on hardware resources.

6. Conclusions

This study proposes a combined strategy that integrates the CD-CS strategy with the A-ECMS, optimized based on the NOA, to leverage traffic information for enhancing fuel economy in HEVs. The fusion of the A-ECMS with the CD-CS strategy facilitates a more efficient EMS capable of adapting to varying traffic conditions. In scenarios where global traffic data are limited, the CD-CS strategy ensures effective vehicle operation. Conversely, when comprehensive traffic information is available, the combined strategy improves control and operational efficiency.
Simulation results show that the proposed combined strategy achieves fuel economy improvements of 5.85%, 4.69%, and 3.99% across three different driving cycles compared with the CD-CS strategy, with no significant performance gap relative to the A-ECMS despite incorporating CD-CS. This indicates that online optimization, using high-quality algorithms and traffic information, is effective.
In this study, the approach of online optimization through strategy combination is a new idea, representing a novel application method that leverages global traffic information. This research study provides certain insights into the development of energy management solutions, potentially contributing to more sustainable transportation systems.
In future research, the focus will be on predicting driving cycles using traffic information, including the analysis and utilization of information, driving cycle prediction, and the establishment of a framework for evaluating prediction results. Additionally, the deployment of the proposed online optimization methods on real vehicles or vehicle–cloud computing platforms will be explored.

Author Contributions

Methodology, H.W., L.L. and X.W.; Software, X.W.; Validation, H.W.; Investigation, H.W.; Resources, H.W.; Data curation, L.L.; Writing—original draft, H.W.; Supervision, L.L.; Project administration, X.W. All authors have read and agreed to the published version of the manuscript.

Funding

This research received no external funding.

Institutional Review Board Statement

Not applicable.

Informed Consent Statement

Not applicable.

Data Availability Statement

The original contributions presented in this study are included in the article. Further inquiries can be directed to the corresponding author.

Conflicts of Interest

The authors declare no conflicts of interest.

Nomenclature

HEVHybrid electric vehicle
EMSEnergy management strategy
CD-CS strategyCharge depleting–charge sustaining strategy
ECMSEquivalent consumption minimization strategy
SOCState of charge
V2XVehicle-to-Everything
NOANutcracker Optimization Algorithm
mVehicle mass
gAcceleration due to gravity
μ Rolling resistance coefficient
AWindward area
C D Air resistance coefficient
δ Rotational mass conversion factor
R t Tire radius
i t AMT gear ratio
i 0 Final drive gear ratio
U o c Battery open-circuit voltage
R b Battery internal resistance
QBattery capacity
vVehicle speed
n e Engine speed
t d Total drive torque
t e Engine output torque
η c Efficiency of clutch
t i ISG motor output torque
η t Efficiency of AMT
η f d Efficiency of the final drive and differential
θ Grade angle
ρ Air density
aVehicle acceleration
m f Engine fuel consumption rate
η i ISG motor efficiency
η i ISG motor speed
IBattery current
P o u t Battery output power
F c 1 Fuel consumption of CD-CS
kStage number divided by time
F c 2 Fuel consumption of A-ECMS
λ Equivalent factor
P b a t Battery output power
HCalorific value of gasoline
λ 0 Initial equivalent factor
F i t Fitness function for equivalent factor optimization
h ( S O C ( N ) ) Adaptive component of fitness function
α Adaptive factor

References

  1. Ehsani, M.; Singh, K.V.; Bansal, H.O.; Mehrjardi, R.T. State of the Art and Trends in Electric and Hybrid Electric Vehicles. Proc. IEEE 2021, 109, 967–984. [Google Scholar] [CrossRef]
  2. Tran, D.D.; Vafaeipour, M.; El Baghdadi, M.; Barrero, R.; Van Mierlo, J.; Hegazy, O. Thorough state-of-the-art analysis of electric and hybrid vehicle powertrains: Topologies and integrated energy management strategies. Renew. Sustain. Energy Rev. 2020, 119, 109596. [Google Scholar] [CrossRef]
  3. Zhang, F.; Wang, L.; Coskun, S.; Pang, H.; Cui, Y.; Xi, J. Energy Management Strategies for Hybrid Electric Vehicles: Review, Classification, Comparison, and Outlook. Energies 2020, 13, 3352. [Google Scholar] [CrossRef]
  4. Mohammed, A.S.; Atnaw, S.M.; Salau, A.O.; Eneh, J.N. Review of optimal sizing and power management strategies for fuel cell/battery/super capacitor hybrid electric vehicles. Energy Rep. 2023, 9, 2213–2228. [Google Scholar] [CrossRef]
  5. Lian, R.; Peng, J.; Wu, Y.; Tan, H.; Zhang, H. Rule-interposing deep reinforcement learning based energy management strategy for power-split hybrid electric vehicle. Energy 2020, 197, 117297. [Google Scholar] [CrossRef]
  6. Zhou, S.; Chen, Z.; Huang, D.; Lin, T. Model Prediction and Rule Based Energy Management Strategy for a Plug-in Hybrid Electric Vehicle With Hybrid Energy Storage System. IEEE Trans. Power Electron. 2021, 36, 5926–5940. [Google Scholar] [CrossRef]
  7. Fan, L.; Wang, Y.; Wei, H.; Zhang, Y.; Zheng, P.; Huang, T.; Li, W. A GA-based online real-time optimized energy management strategy for plug-in hybrid electric vehicles. Energy 2022, 241, 122811. [Google Scholar] [CrossRef]
  8. Xin, W.; Xu, E.; Zheng, W.; Feng, H.; Qin, J. Optimal energy management of fuel cell hybrid electric vehicle based on model predictive control and on-line mass estimation. Energy Rep. 2022, 8, 4964–4974. [Google Scholar] [CrossRef]
  9. Wang, W.; Guo, X.; Yang, C.; Zhang, Y.; Zhao, Y.; Huang, D.; Xiang, C. A multi-objective optimization energy management strategy for power split HEV based on velocity prediction. Energy 2022, 238, 121714. [Google Scholar] [CrossRef]
  10. Guo, L.; Liu, H.; Han, L.; Yang, N.; Liu, R.; Xiang, C. Predictive energy management strategy of dual-mode hybrid electric vehicles combining dynamic coordination control and simultaneous power distribution. Energy 2023, 263, 125598. [Google Scholar] [CrossRef]
  11. Jui, J.J.; Ahmad, M.A.; Molla, M.I.; Rashid, M.I.M. Optimal energy management strategies for hybrid electric vehicles: A recent survey of machine learning approaches. J. Eng. Res. 2024, 12, 454–467. [Google Scholar] [CrossRef]
  12. Urooj, A.; Nasir, A. Review of intelligent energy management techniques for hybrid electric vehicles. J. Energy Storage 2024, 92, 112132. [Google Scholar] [CrossRef]
  13. Yan, F.; Wang, J.; Du, C.; Hua, M. Multi-Objective Energy Management Strategy for Hybrid Electric Vehicles Based on TD3 with Non-Parametric Reward Function. Energies 2023, 16, 74. [Google Scholar] [CrossRef]
  14. Guo, D.; Lei, G.; Zhao, H.; Yang, F.; Zhang, Q. Quadruple Deep Q-Network-Based Energy Management Strategy for Plug-In Hybrid Electric Vehicles. Energies 2024, 17, 6298. [Google Scholar] [CrossRef]
  15. Shuai, B.; Hua, M.; Li, Y.; Shuai, S.; Xu, H.; Zhou, Q. Optimal Energy Management of Plug-in Hybrid Electric Vehicles Through Ensemble Reinforcement Learning With Exploration-to-Exploitation Ratio Control. IEEE Trans. Intell. Veh. 2024, 8, 1–11. [Google Scholar] [CrossRef]
  16. Wu, J.; Zhang, Y.; Ruan, J.; Liang, Z.; Liu, K. Rule and optimization combined real-time energy management strategy for minimizing cost of fuel cell hybrid electric vehicles. Energy 2023, 285, 129442. [Google Scholar] [CrossRef]
  17. Chang, C.; Zhao, W.; Wang, C.; Song, Y. A Novel Energy Management Strategy Integrating Deep Reinforcement Learning and Rule Based on Condition Identification. IEEE Trans. Veh. Technol. 2023, 72, 1674–1688. [Google Scholar] [CrossRef]
  18. Chen, Z.; Liu, Y.; Zhang, Y.; Lei, Z.; Chen, Z.; Li, G. A neural network-based ECMS for optimized energy management of plug-in hybrid electric vehicles. Energy 2022, 243, 122727. [Google Scholar] [CrossRef]
  19. Zhang, F.; Hu, X.; Langari, R.; Cao, D. Energy management strategies of connected HEVs and PHEVs: Recent progress and outlook. Prog. Energy Combust. Sci. 2019, 73, 235–256. [Google Scholar] [CrossRef]
  20. Hu, X.; Liu, T.; Qi, X.; Barth, M. Reinforcement Learning for Hybrid and Plug-In Hybrid Electric Vehicle Energy Management: Recent Advances and Prospects. IEEE Ind. Electron. Mag. 2019, 13, 16–25. [Google Scholar] [CrossRef]
  21. Zhou, X.; Sun, F.; Zhang, C.; Sun, C. Stochastically predictive co-optimization of the speed planning and powertrain controls for electric vehicles driving in random traffic environment safely and efficiently. J. Power Sources 2022, 528, 231200. [Google Scholar] [CrossRef]
  22. Cui, W.; Cui, N.; Li, T.; Cui, Z.; Du, Y.; Zhang, C. An efficient multi-objective hierarchical energy management strategy for plug-in hybrid electric vehicle in connected scenario. Energy 2022, 257, 124690. [Google Scholar] [CrossRef]
  23. Sun, X.; Cao, Y.; Jin, Z.; Tian, X.; Xue, M. An Adaptive ECMS Based on Traffic Information for Plug-in Hybrid Electric Buses. IEEE Trans. Ind. Electron. 2023, 70, 9248–9259. [Google Scholar] [CrossRef]
  24. Hou, Z.; Guo, J.; Li, J.; Hu, J.; Sun, W.; Zhang, Y. Exploration the pathways of connected electric vehicle design: A vehicle-environment cooperation energy management strategy. Energy 2023, 271, 127081. [Google Scholar] [CrossRef]
  25. Ha, S.; Lee, H. Energy Management Strategy Based on V2X Communications and Road Information for a Connected PHEV and Its Evaluation Using an IDHIL Simulator. Appl. Sci. 2023, 13, 9208. [Google Scholar] [CrossRef]
  26. Liu, H.; Lei, Y.; Sun, W.; Chang, C.; Jiang, W.; Liu, Y.; Hu, J. Research on approximate optimal energy management and multi-objective optimization of connected automated range-extended electric vehicle. Energy 2024, 306, 132368. [Google Scholar] [CrossRef]
  27. Niu, Z.; He, H. A data-driven solution for intelligent power allocation of connected hybrid electric vehicles inspired by offline deep reinforcement learning in V2X scenario. Appl. Energy 2024, 372, 123861. [Google Scholar] [CrossRef]
  28. Ma, Z.; Zhang, F.; Xie, S.; Zhang, T.; Chen, Y.; Peng, G. Co-optimization of speed planning and energy management for connected plug-in hybrid electric vehicles on slippery roads. Energy 2025, 324, 135835. [Google Scholar] [CrossRef]
  29. Miao, Y.; Tian, Y.; Zhang, Y.; Ma, L. Parameter Optimization and Energy Management for a Dual-Motor Powertrain in Battery Electric Heavy Trucks. In Proceedings of the 2024 IEEE 22nd International Conference on Industrial Informatics (INDIN), Beijing, China, 18–20 August 2024; pp. 1–6. [Google Scholar] [CrossRef]
  30. Abdel-Basset, M.; Mohamed, R.; Jameel, M.; Abouhawwash, M. Nutcracker optimizer: A novel nature-inspired metaheuristic algorithm for global optimization and engineering design problems. Knowl.-Based Syst. 2023, 262, 110248. [Google Scholar] [CrossRef]
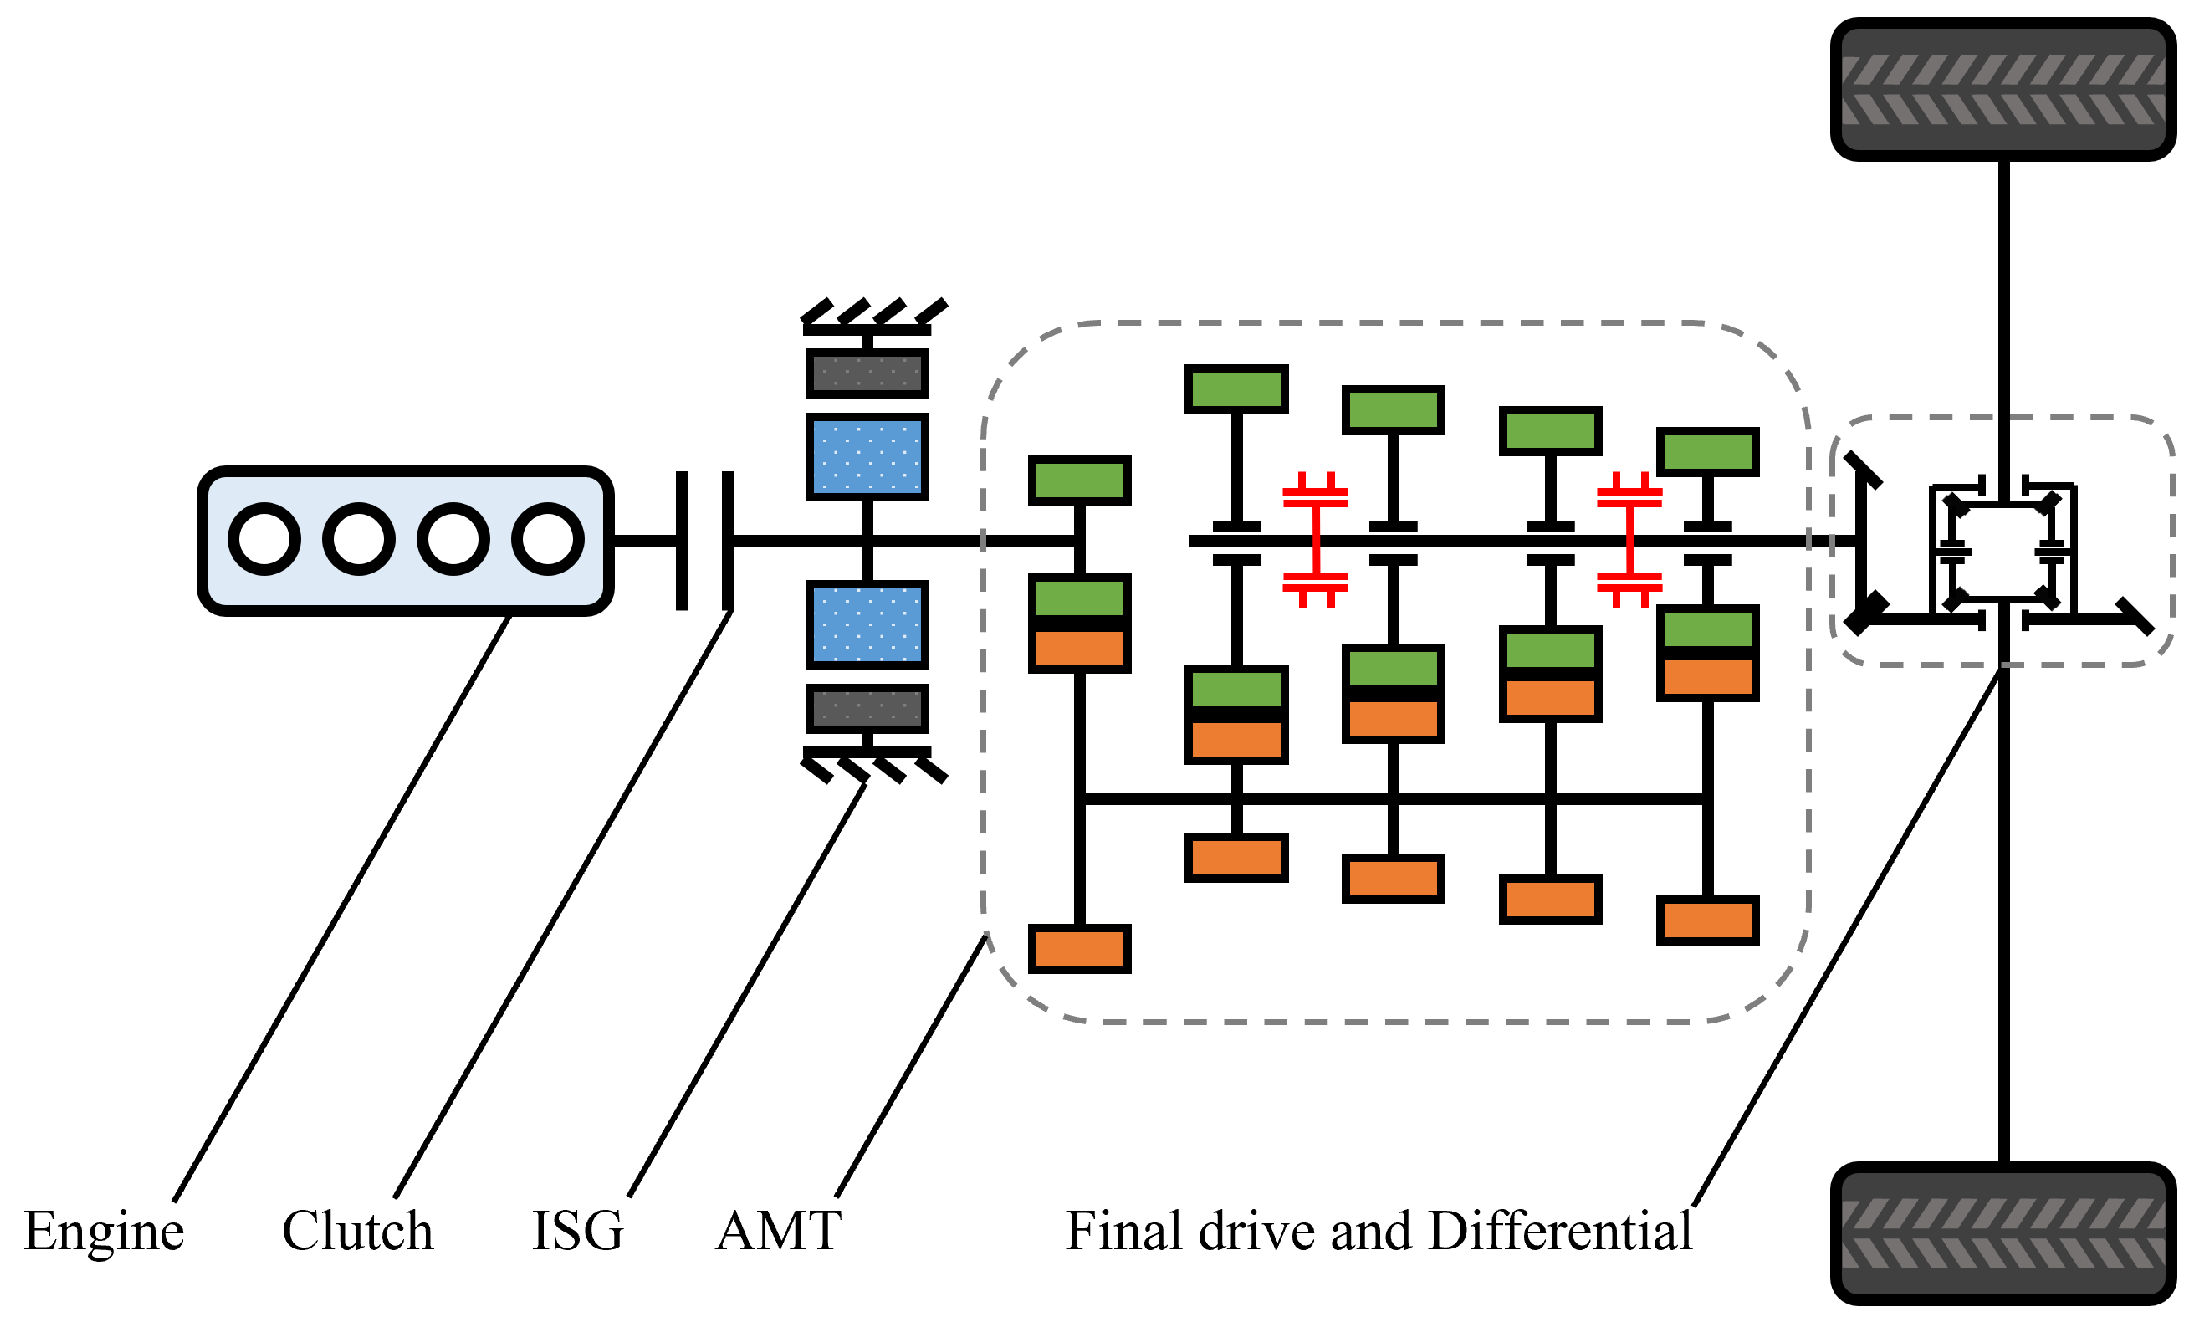
Figure 1. The structure of the hybrid electric heavy-duty truck powertrain.
Sustainability 17 06361 g001
Figure 2. The energy consumption characteristics of the engine and the ISG motor.
Sustainability 17 06361 g002
Figure 3. The CD-CS flowchart.
Sustainability 17 06361 g003
Figure 4. The A-ECMS flowchart.
Sustainability 17 06361 g004
Figure 5. Operating logic of combined strategy.
Sustainability 17 06361 g005
Figure 6. The flowchart of equivalent factor optimization based on the NOA.
Sustainability 17 06361 g006
Figure 7. The vehicle speed and demand power in the test driving cycle.
Sustainability 17 06361 g007
Figure 8. The SOC variation under different initial SOCs.
Sustainability 17 06361 g008
Figure 9. The SOC variation and fuel consumption in each stage during the validation process.
Sustainability 17 06361 g009
Figure 10. The distribution of power source operating points.
Sustainability 17 06361 g010
Figure 11. The distribution statistics of operating points.
Sustainability 17 06361 g011
Figure 12. The comparison of SOC variations among different strategies.
Sustainability 17 06361 g012
Figure 13. The vehicle speed in the real vehicle driving cycle.
Sustainability 17 06361 g013
Figure 14. The distribution of operating points under the real vehicle data cycle.
Sustainability 17 06361 g014
Figure 15. The distribution statistics of operating points under the real vehicle data cycle.
Sustainability 17 06361 g015
Figure 16. The SOC variations under the real vehicle data cycle.
Sustainability 17 06361 g016
Figure 17. The vehicle speed in the custom driving cycle.
Sustainability 17 06361 g017
Figure 18. The distribution of operating points under the custom driving cycle.
Sustainability 17 06361 g018
Figure 19. The distribution statistics of operating points under the custom driving cycle.
Sustainability 17 06361 g019
Figure 20. The vehicle speed under the custom driving cycle.
Sustainability 17 06361 g020
Figure 21. The fitness and runtime of the optimization for the A-ECMS.
Sustainability 17 06361 g021
Figure 22. The data characteristics of the NOA operational parameter analysis and validation.
Sustainability 17 06361 g022
Table 1. Table of main component operating states in different modes.
ModeEngineClutchISG MotorAMT
Electric modeOffOffOnOn
Engine modeOnOnOffOn
Hybrid modeOnOnOnOn
Driving chargingOnOnOnOn
Parking chargingOnOnOnOff
Regenerative
braking
OffOffOnOn
Table 2. The main vehicle parameters.
ParameterSymbolValue
Vehicle massm49,000 kg
Acceleration due to gravityg9.8 m / s 2
Rolling resistance coefficient μ Equation (4)
Windward areaA6.163 m 2
Air resistance coefficient C D 0.7
Rotational mass conversion factor δ 1.1
Tire radius R t 0.526 m
AMT gear ratio i t Table 3
Final drive gear ratio i 0 3.364
Battery open-circuit voltage U o c 540 V
Battery internal resistance R b 0.157 Ω
Battery capacityQ27.6 Ah
Allowed SOC rangeSOC0.2–1.0
Table 4. The testing results under different initial SOCs.
Initial SOCFinal SOCFuel ConsumptionRMS Error for CS Phase SOC
0.30.35888.3332 L0.0179
0.50.35887.5321 L0.0174
0.70.35886.8140 L0.0180
0.90.35876.0639 L0.0195
Table 5. The fuel economy and differences among different strategies.
EMSFinal SOCFuel
Consumption
Difference
from A-ECMS
Difference
from CD-CS
Strategy
Combined
strategy
0.30047.8457 L0.15%−5.85%
CD-CS
strategy
0.35888.3332 L6.37%-
A-ECMS0.30947.8342 L-−5.99%
Table 6. The fuel economy and differences under the real vehicle data cycle.
EMSFinal SOCFuel
Consumption
Difference
from A-ECMS
Difference
from CD-CS
Strategy
Combined
strategy
0.300314.2498 L0.13%−4.69%
CD-CS
strategy
0.353614.9512 L5.06%-
A-ECMS0.300314.2309 L-−4.82%
Table 7. The fuel economy and differences under the custom driving cycle.
EMSFinal SOCFuel
Consumption
Difference
from A-ECMS
Difference
from CD-CS
Strategy
Combined
strategy
0.30532.9504 L0.08%−3.99%
CD-CS
strategy
0.30113.0729 L4.23%-
A-ECMS0.30122.9481 L-−4.06%
Disclaimer/Publisher’s Note: The statements, opinions and data contained in all publications are solely those of the individual author(s) and contributor(s) and not of MDPI and/or the editor(s). MDPI and/or the editor(s) disclaim responsibility for any injury to people or property resulting from any ideas, methods, instructions or products referred to in the content.

