Article

Experimental Study on Ultra-Light Sand Packing in Multi-Lateral Horizontal Well for Natural Gas Hydrate Reservoirs

1
School of Petroleum Engineering, China University of Petroleum (East China), Qingdao 266580, China
2
Shandong Key Laboratory of Offshore Oil & Gas and Hydrates Development, Qingdao 266580, China
3
Well Services Branch of CNPC Offshore Engineering Co., Ltd., Tianjin 300451, China
*
Author to whom correspondence should be addressed.
Sustainability 2025, 17(19), 8563; https://doi.org/10.3390/su17198563
Submission received: 11 August 2025 / Revised: 11 September 2025 / Accepted: 23 September 2025 / Published: 24 September 2025
(This article belongs to the Special Issue Advanced Research on Marine and Deep Oil & Gas Development)

Abstract

We investigated the use of gravel packing sand control technology in multi-lateral horizontal wells to support the development of natural gas hydrate reservoirs. An experimental apparatus was developed to investigate the effects of well configurations and operational parameters on ultra-light sand packing behavior and to estimate the field operational parameters through the application of similarity criteria. The results showed that the ultra-light sand packing process includes four stages in a single horizontal main bore, i.e., sand bank formation, alpha-wave, beta-wave, and simultaneous annulus packing, and two stages in lateral wellbores: a sand bank formation and then an alpha-wave pattern or an initial alpha-wave pattern followed by a slope pattern. At comparable injection rates and sand concentrations, the packing sequence is predominantly governed by leakage rates and the quantity of lateral wellbores. When the lateral wellbore is 1 m and the leakage rate exceeds 20%, the lateral packs first. When the lateral wellbore is 2 m and the leakage rate is below 30%, the main bore packs first. For the field prototype (480 m main bore and 200 m lateral wellbore), the deviation angle of lateral wellbores should be controlled within 30°, and it is recommended that the distance between the junction point and the heel of the horizontal main bore be 160 m. When the leakage rates exceed 50%, the recommended injection rates are less than 1.69 m3/min. When the leakage rates range from 10 to 50%, the recommended injection rates range from 1.69 to 3.38 m3/min, with predicted end-of-packing pressures ranging from 6.56 to 19.92 MPa. This study provides valuable insights into the development of gravel packing sand control technologies in a multi-lateral horizontal well for hydrate reservoirs.

1. Introduction

Natural gas hydrate (NGH) is an ice-like crystalline compound formed by methane and water under high pressure and low temperature. It is an important low-carbon resource in achieving the goals of “carbon peak” and “carbon sequestration”. It is considered the most promising clean alternative energy source in the 21st century [1,2]. It has been produced and tested for over 20 years, starting in 1998 [3,4,5,6,7]. The results of hydrate production testing have shown that multiple factors contribute to sand production. These factors include (1) the weak cementation strength of hydrate reservoirs, (2) the low overburden pressure in shallow formations, (3) the high production pressure differences, and (4) the fluid drag forces during depressurization [8,9,10,11,12,13,14]. The decrease in production is caused by slight sand production, while the production test process is disrupted or stopped by severe sand production. The effects of sand production in limiting NGH production and threatening long-term developmental safety represent a key challenge [15,16].
A significant amount of practical research on the prevention and control of sand production has been conducted in hydrate reservoirs. Building upon the practical outcomes of sand control in unconsolidated sandstone reservoirs, both internal and external gravel packing completions, a gravel-packed sand control screen completion with ceramic or quartz sand, and moderate sand control methodologies were investigated [17,18]. A novel gravel sizing method for sand control packing, achieved by “holding coarse while eliminating fine particles”, was developed. The hydrate production testing cycle can only be extended when effective control of the three-phase flow of gas, liquids, and solids is achieved [19]. Sand control technologies, including an open-hole gravel pack, pre-expanded GeoForm screen, and post-expanded GeoForm screen, were successively implemented as part of sand control efforts in hydrate test production in Japan. Notably, the post-expanded GeoForm screen utilizes shape memory polymer (SMP) that expands and conforms to the borehole wall under downhole conditions, effectively preventing the production of sand formations during the 24-day production test period. SMP exhibits exceptional shape memory and permeability characteristics; however, its relatively low strength after expansion limits its long-term effectiveness in sand control applications. It is essential to enhance the strength of SMP to augment its long-term effectiveness in efficient sand control in hydrate reservoirs [20,21,22,23]. A three-stage composite sand control technology for horizontal wells, utilizing “coarse + fine” gravel packing combined with a high-precision pre-packed sand control screen, was implemented in the Shenhu hydrate reservoir located in the South China Sea. This technology achieved continuous stable production over a period of 30 days, with a total gas output reaching 8.61 × 10⁵ m3, and accomplished the stage transition from “exploratory production” to “experimental production” successfully [24,25]. Nevertheless, it continues to encounter a variety of challenges, including a rapid decline in production and short periods of production, which impede its path toward commercialization [26,27].
Based on the field test results for sand control technology for hydrate reservoirs, several innovative schemes and methodologies are currently under investigation. The multi-lateral horizontal well productivity of hydrate was calculated using a numerical simulation method. In comparison to a single horizontal well, the gas production rate can be enhanced by 20% to 50% [28]. The design concept of a “self-cleaning” precise composite screen is proposed for hydrate sand control. The principle of “self-cleaning” involves the periodic removal of sand plugs from the sand flushing system to solve the blockage problem caused by hydrate sanding [29]. A gas recovery method with ultrasonic atomization for sand control and water drainage for hydrate reservoirs was proposed, which can effectively block sand particles greater than 10 microns and produce water in the form of mist with small droplets of about 5 microns to achieve the continuous production of water and gas [30]. These preliminary works provide new ideas for enhancing sand control and gas recovery in hydrate reservoirs.
An exploitation scheme for multi-lateral horizontal wells in conjunction with gravel packing and a high-precision pre-packed sand control screen could represent the most promising approach in advancing the commercial development of hydrate. A light gravel packing sand control completion technology for ultra-short multilateral wells (with a lateral wellbore length less than 100 m) has been piloted and field-tested in the Bohai Oilfield. Assuming that the light gravel packing includes only the α-wave and β-wave stages, the influence of the fluid density, sand concentration, leakage rate, and injection rate on the packing pressure was evaluated using numerical simulation, and the light gravel mass used for this technique was reported as 6.2 t; however, the packing effectiveness was not reported [31,32]. This approach neglects the evolution of the packing process and the quantification of packing effectiveness for the light gravel. The aim of this study is to illustrate the ultra-light sand packing process and packing efficiency in a multi-lateral horizontal well. Based on similarity criteria, field operational parameters are recommended. Our results are of great significance in the commercial development of hydrate.

2. Experimental Work

2.1. Apparatus

Gravel particles are transported forward along the flow by the drag force and buoyancy force of the fluid and slowly settle to form a sand bank due to the gravity of particles during the packing process in the horizontal well. Based on the gravel packing string structure of horizontal wells and the production test parameters in the Shenhu hydrate reservoir in 2020, a multi-lateral horizontal well experimental apparatus for gravel packing was set up (Figure 1). It consisted of a screw pump (with a flow rate range of 0–45 m3/h), a mixing tank (with a volume of 1 m3), two flowmeters (with a flow rate of 0–70 m3/h), three pressure transducers (with a pressure of 0–1.6 MPa), and a multi-lateral horizontal well model with an adjustable wellbore structure.
This model was composed of a single main bore, two lateral wellbores of varying lengths, a slot screen, and a wash pipe. The main bore and the two lateral wellbores were constructed from Polymethyl Methacrylate (PMMA) and were capable of withstanding pressures up to 2 MPa. The main bore, which had a diameter of 177.8 mm and a length of 6000 mm, was interconnected with two lateral wellbores via two stainless steel short connectors with lateral angles of 30 and 45 degrees, while the lateral wellbores had a diameter of 139.7 mm and a length of 1000 mm and 2000 mm, respectively. The slot screen, which had a diameter of 88.9 mm and a length of 5480 mm, was arranged to have 768 slots with a length of 200 mm and a width of 0.2 mm in a staggered pattern and made from stainless steel. The wash pipe, which had a diameter of 48.26 mm and a length of 4900 mm, was also made from stainless steel.

2.2. Materials

The black ultra-light sand used in the experiment was purchased from Tianjin Jinwanhang Petroleum Equipment CO., LTD (Tianjin, China). It has a bulk density of 0.60 g/cm3, an apparent density of 1.07 g/cm3, a sphericity value of 0.9, and particle sizes ranging from 212 to 425 µm (40–70 mesh). The sand-carrying fluid utilized was laboratory water.

2.3. Determination of Gravel Packing Effectiveness

The determination procedure was conducted as follows:
(1)
Air evacuation of the apparatus: A volume of 450 L of laboratory water was introduced into the mixing tank. The outlet valve and exhaust valve were then opened, while the drain valve was closed. The screw pump was activated at a low flow rate to supply water to the apparatus. The exhaust valves were closed upon the observation of water discharge at the valve outlet.
(2)
Leakage control: At low injection flow rates, leakage was controlled through the coordinated use of the return flow valve and the leak-off valve, with the leakage rate calculated based on readings from the injection and return flowmeters. The injection flow rate was subsequently increased to the specified design value, followed by the verification of the leakage rate and micro-adjustments to the return flow valve to ensure conformity with design requirements.
(3)
Gravel addition rate: The rate of gravel addition during experimentation was quantified through the multiplication of the injection flow rate and predetermined gravel concentration parameters.
(4)
Gravel packing: Once stable flow conditions had been achieved, the gravel packing operation was launched at the rate of gravel addition, determined in Step (3). The gravel packing was stopped when the sand-out pressure began to increase rapidly.
(5)
Cleaning: The water was released from the multi-lateral horizontal well model through the drain valve; then, we disassembled the outlet, flushed out the gravel in the model with the jetting machine, and reset the model.
(6)
Gravel packing effectiveness calculation: The gravel packing effectiveness (Rp) is defined as the ratio of the apparent volume of packing gravel to the theoretical volume of the packing section within the annulus, perforation, and sand production void zones near the well. The theoretical volume of the packing section is calculated as the sum of the annular volume between the casing and the blank tubing, the annular volume between the casing and the slot screen, the casing volume corresponding to the pocket length, and the theoretical packing volume outside the casing. In field operations, the apparent volume of packing gravel is determined by subtracting both the volume of gravel lost on the ground and the volume left in the work string from the total gravel volume used during the packing operation. For a visible multi-lateral horizontal well apparatus for gravel packing in the laboratory, the apparent volume of packing gravel can be determined by subtracting the unfilled space volume, which can be calculated based on the geometric parameters of the casing and screen, as well as the morphology of the unfilled space, from the total packing section volume of the apparatus. The calculation equation for gravel packing effectiveness is as follows:
R p = V t V np V t ×   100 %
where R p is the gravel packing effectiveness, V t is the total packing section volume of the apparatus, and V np is the unfilled space volume.

3. Results

3.1. Ultra-Light Sand Packing in Single Horizontal Main Bore

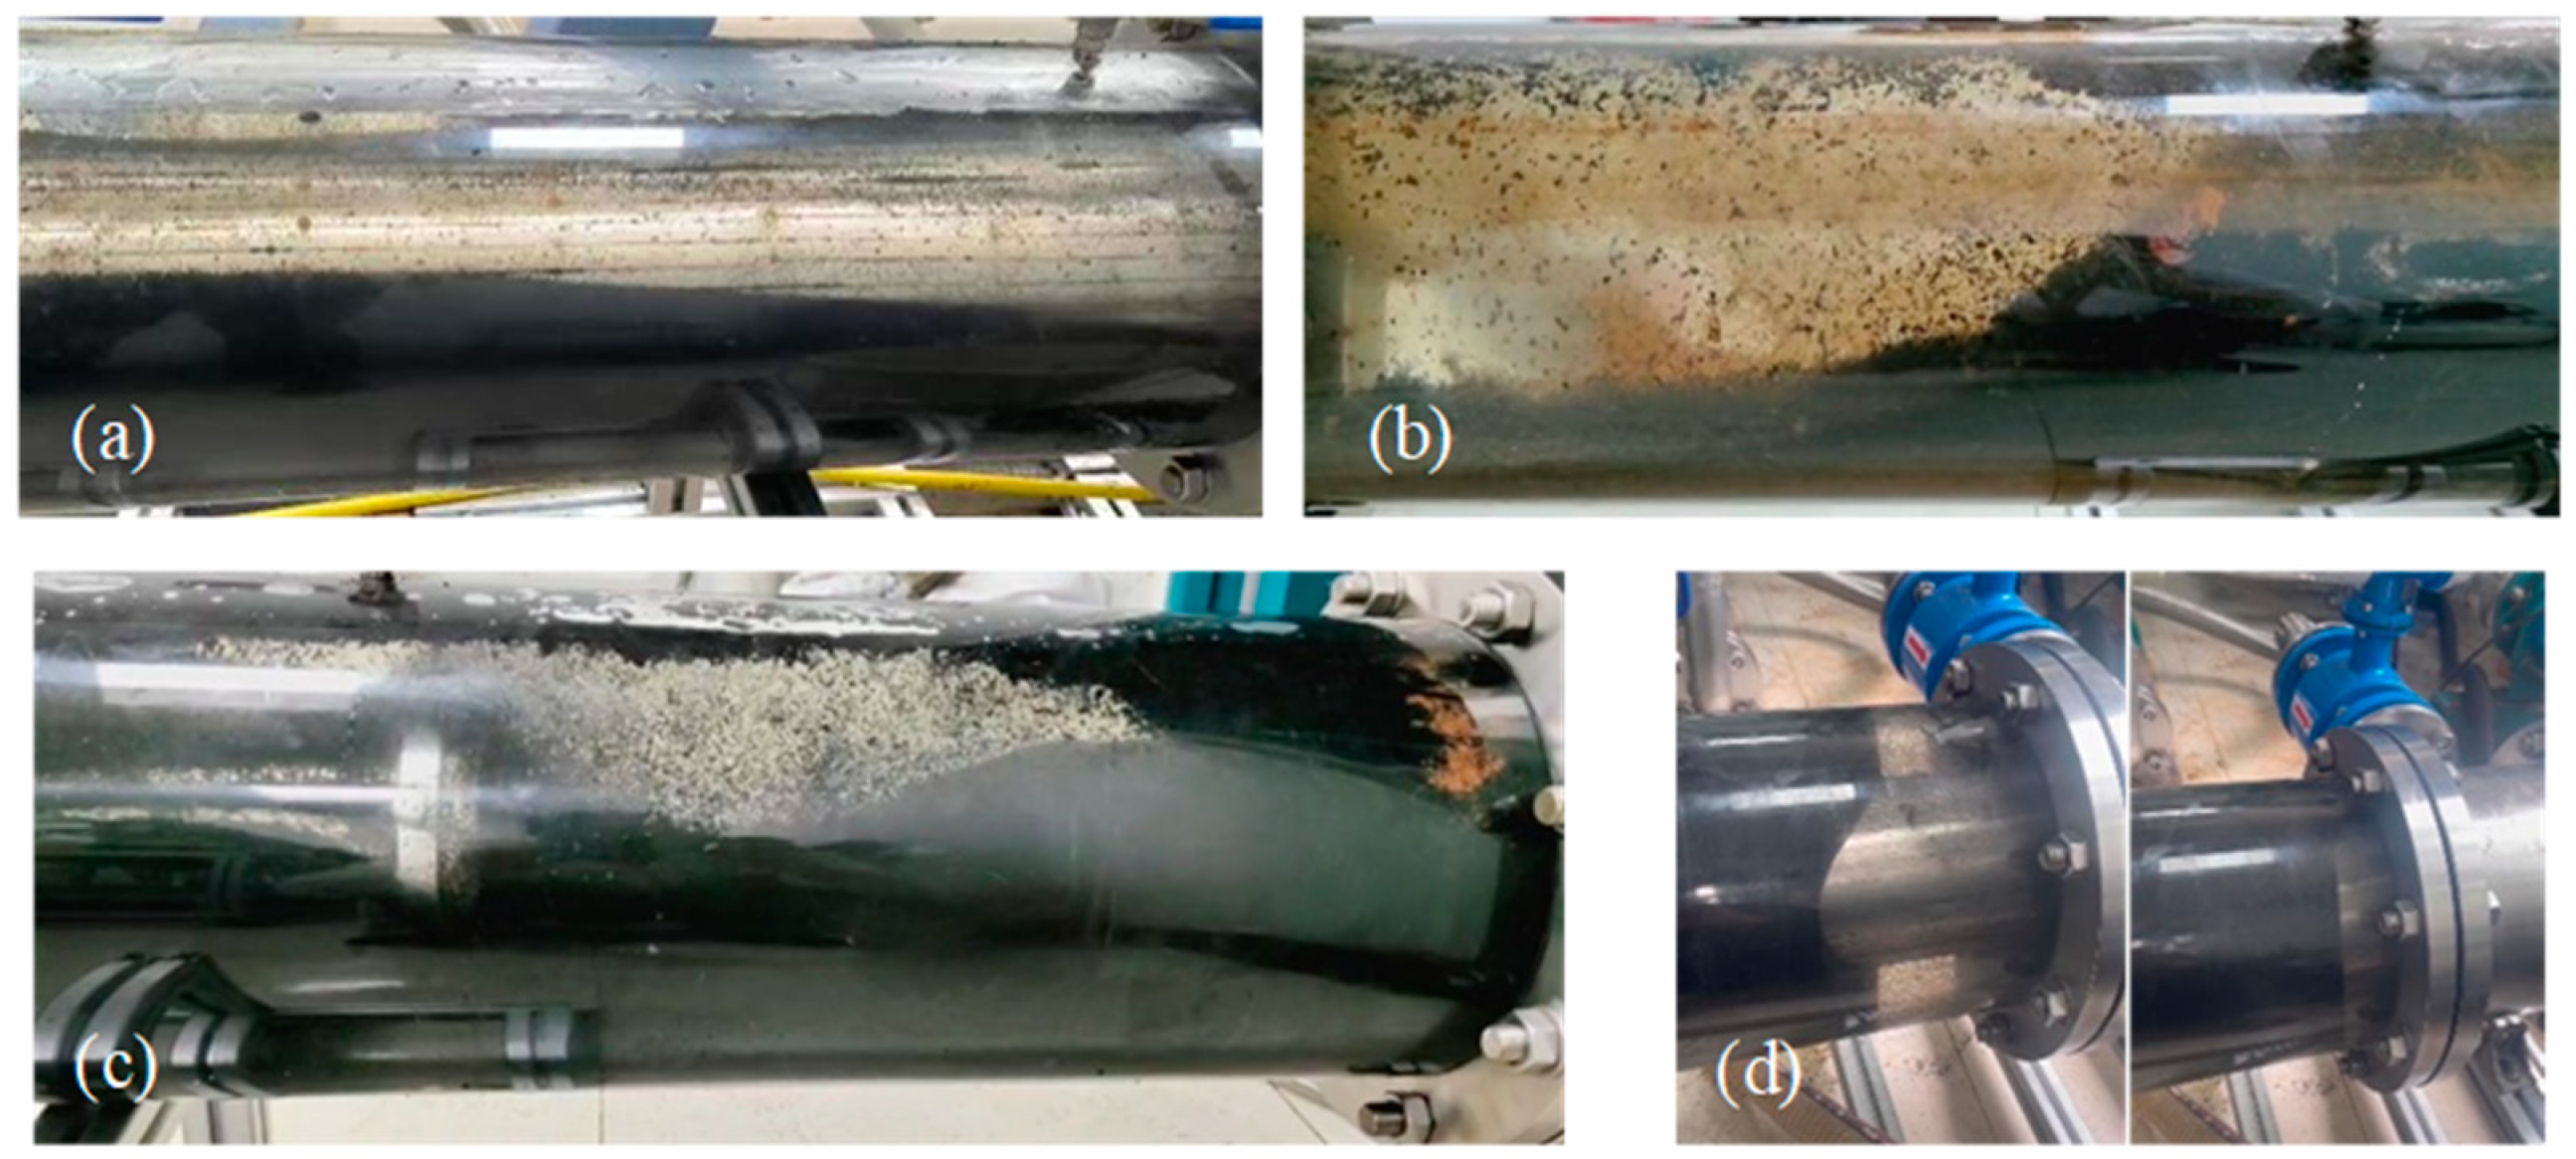
The single horizontal main bore was constructed through the dismantlement of two lateral wellbores and the subsequent sealing of the stainless-steel short connectors using flange blind plates. The packing behavior of the ultra-light sand in the single horizontal main bore is given in Figure 2, Figure 3, Figure 4, Figure 5 and Figure 6 under varying conditions regarding sand concentrations (3% and 6%), injection rates (0.1, 0.16, and 0.2 m3/min), and leakage rates (10% and 30%).
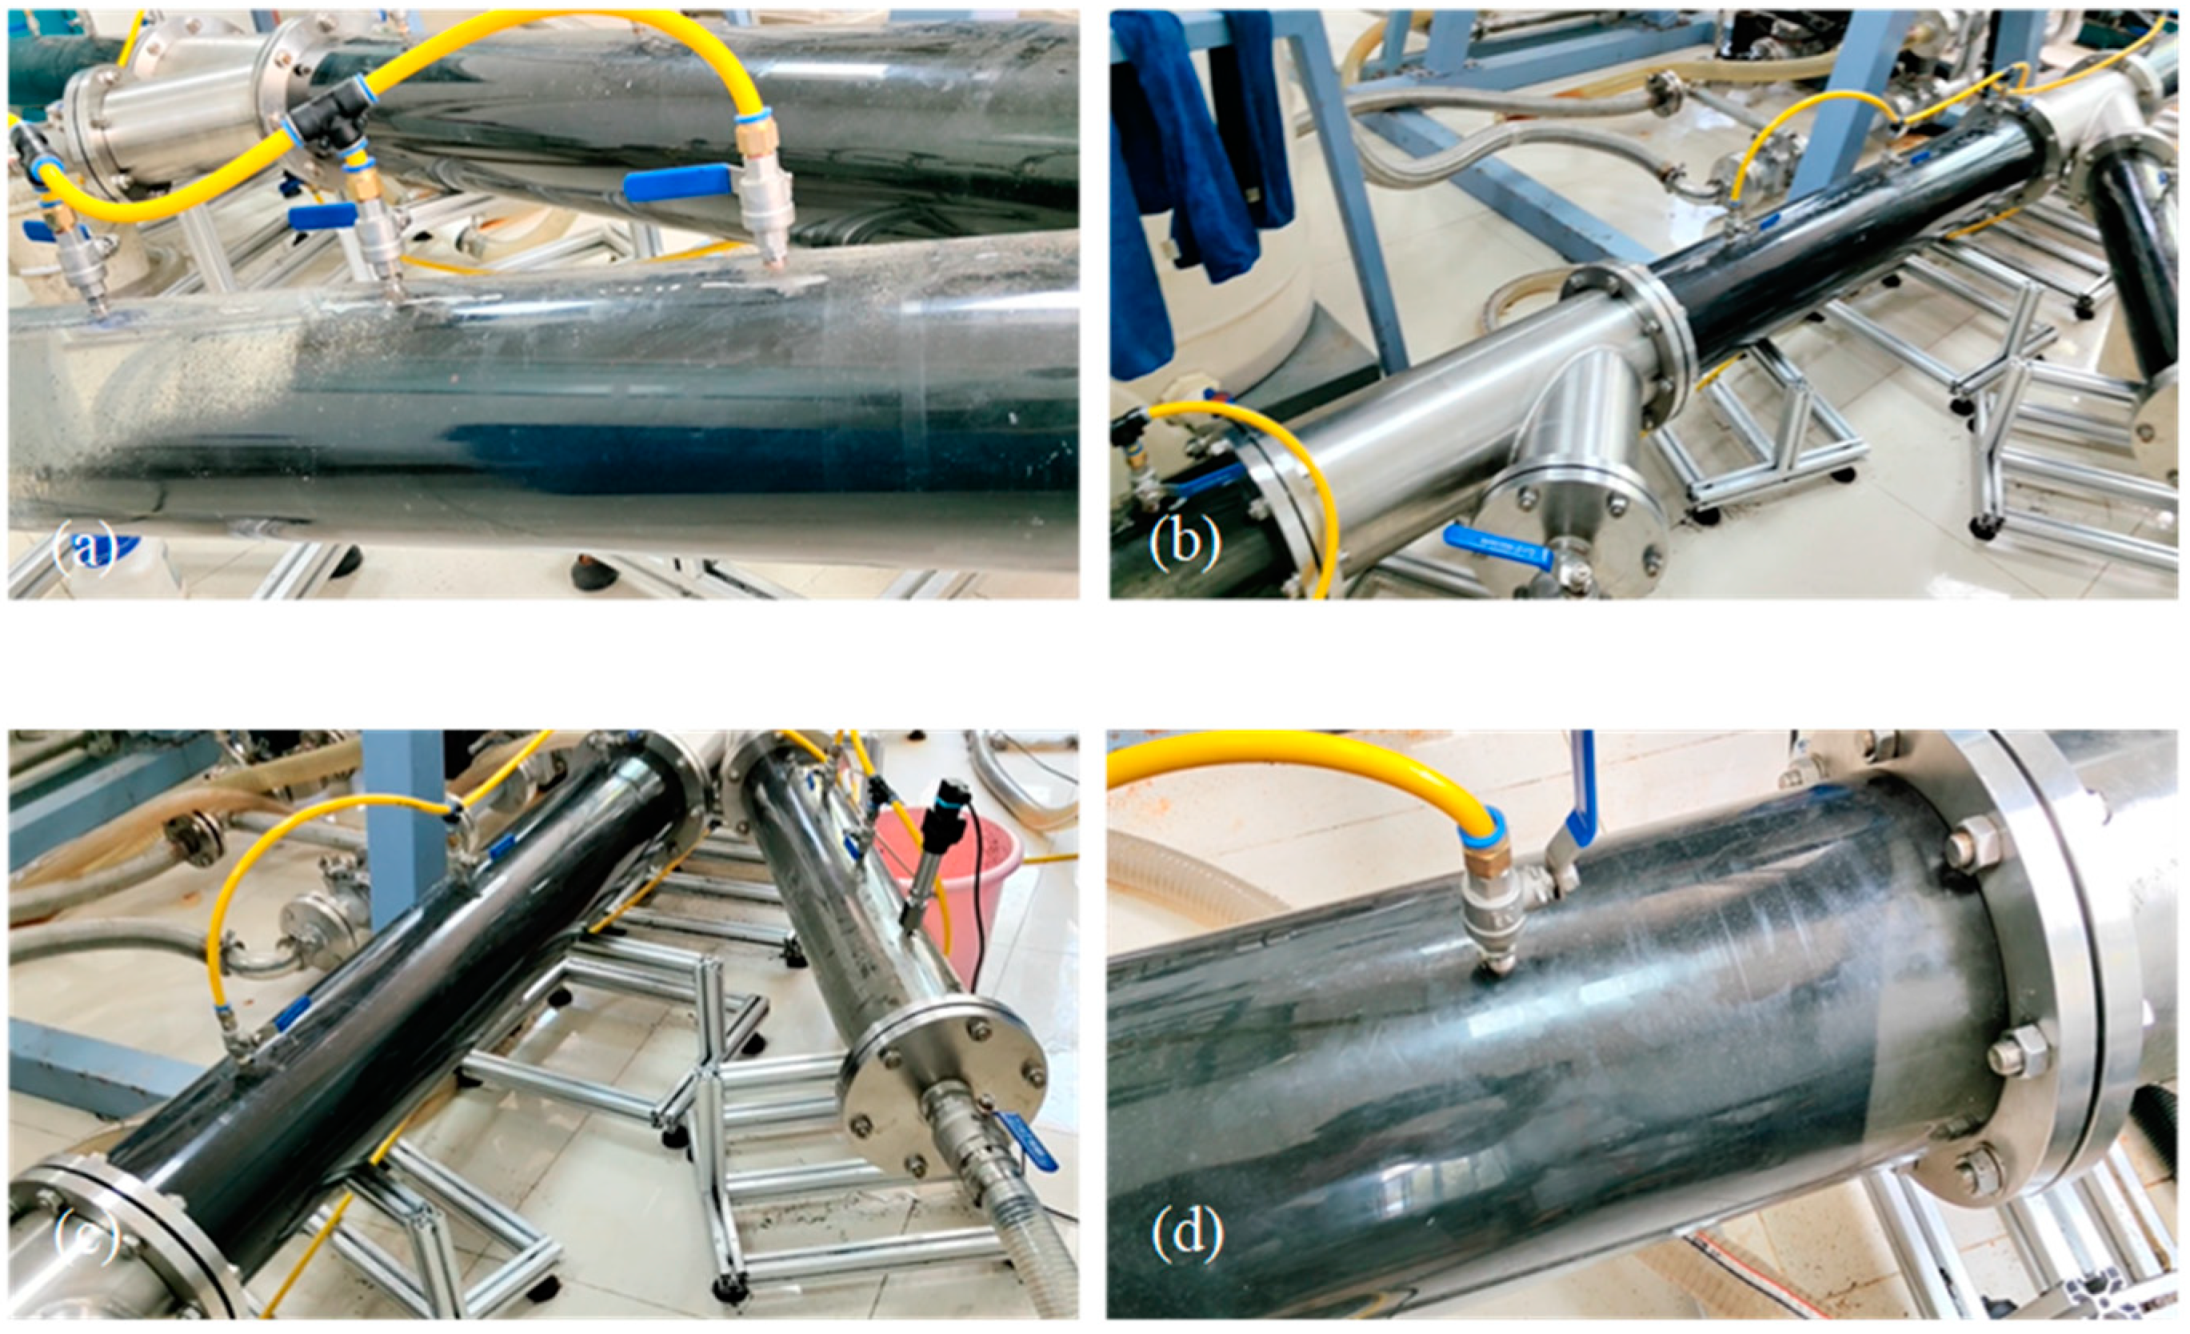
Figure 2 demonstrates the spatial distribution of ultra-light sand at different locations within a single horizontal main bore at a specific moment in the packing operation. The packing process for ultra-light sand, utilizing laboratory water as the carrying fluid, progresses through four distinct stages. Initially, a sand bank builds up in the lower casing-screen annulus and gradually develops into an equilibrium sand bank (Figure 2a). Subsequently, the sand bank front proceeds toward the toe of the horizontal main bore in an alpha-wave pattern (Figure 2b). Following this, upon the completion of ultra-light sand placement in the lower section of the toe region of the horizontal main bore, back-packing in a beta-wave pattern initiates and progresses within the upper casing-screen annulus (Figure 2c). Ultimately, as the sand wave reaches the sand bank position, the ultra-light sand begins simultaneous packing in both the upper and lower casing-screen annuli, advancing towards the heel of the horizontal main bore (Figure 2d) until the entire filling space achieves complete packing and consolidation.
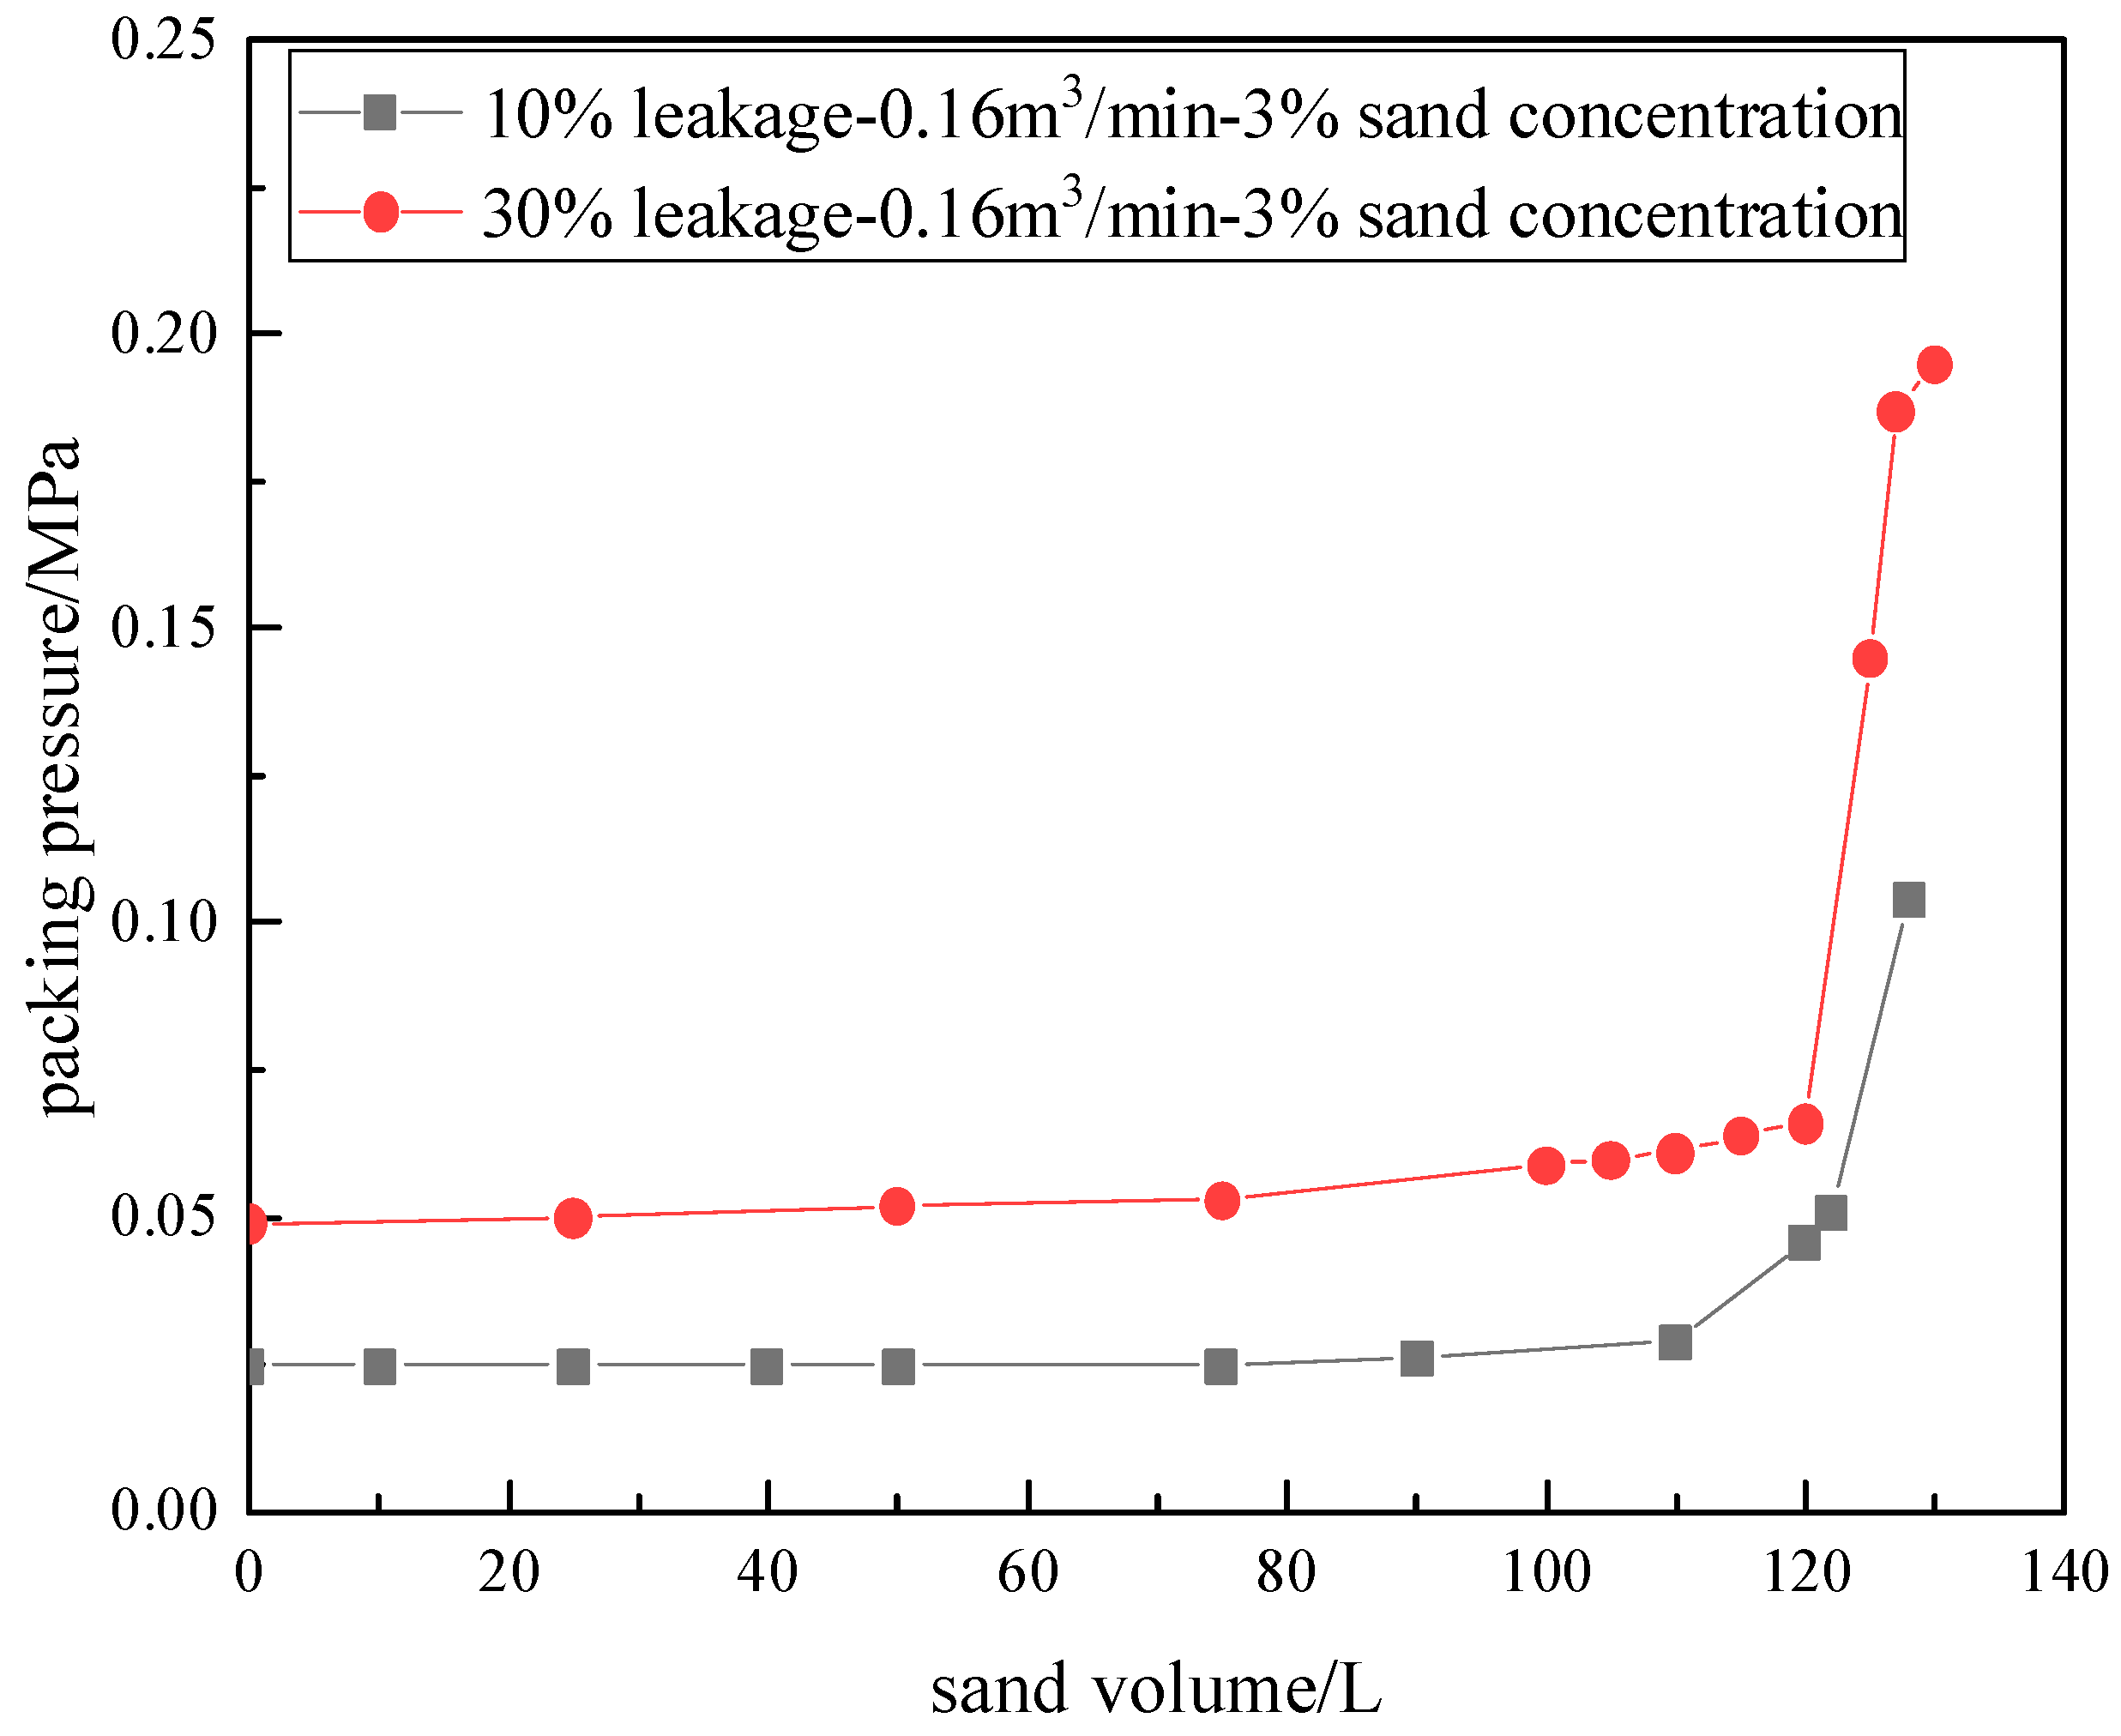
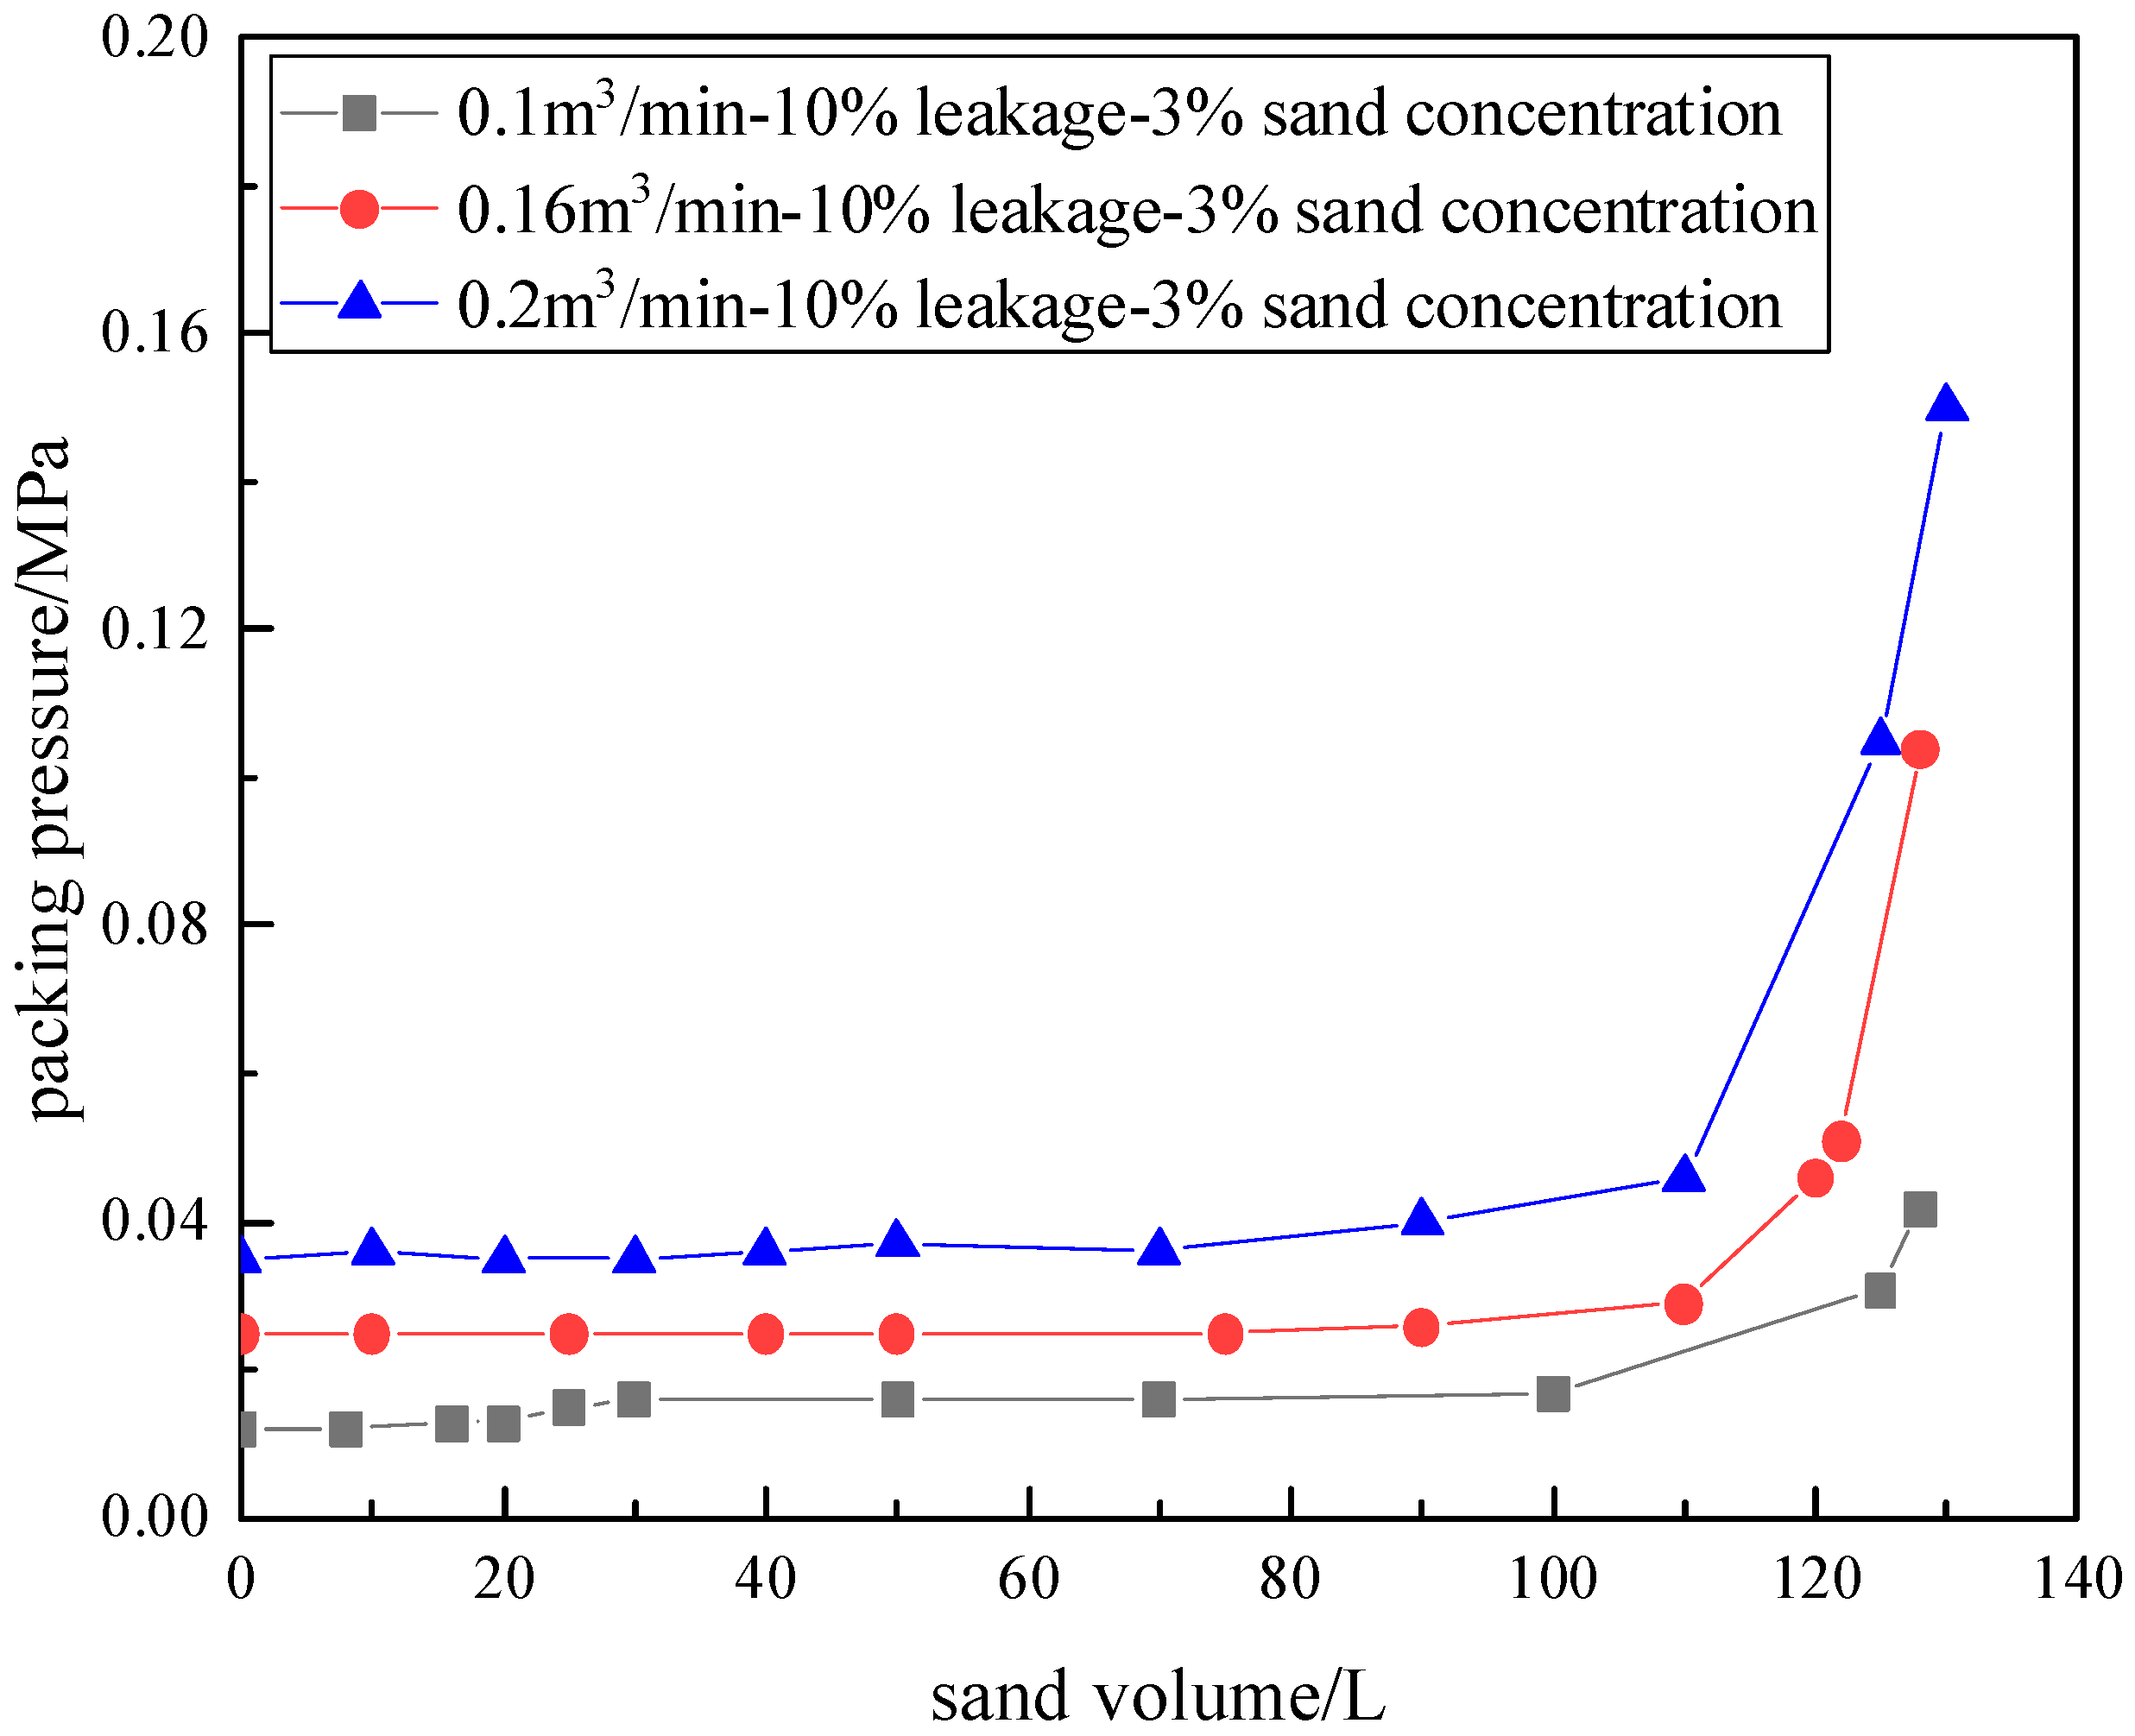
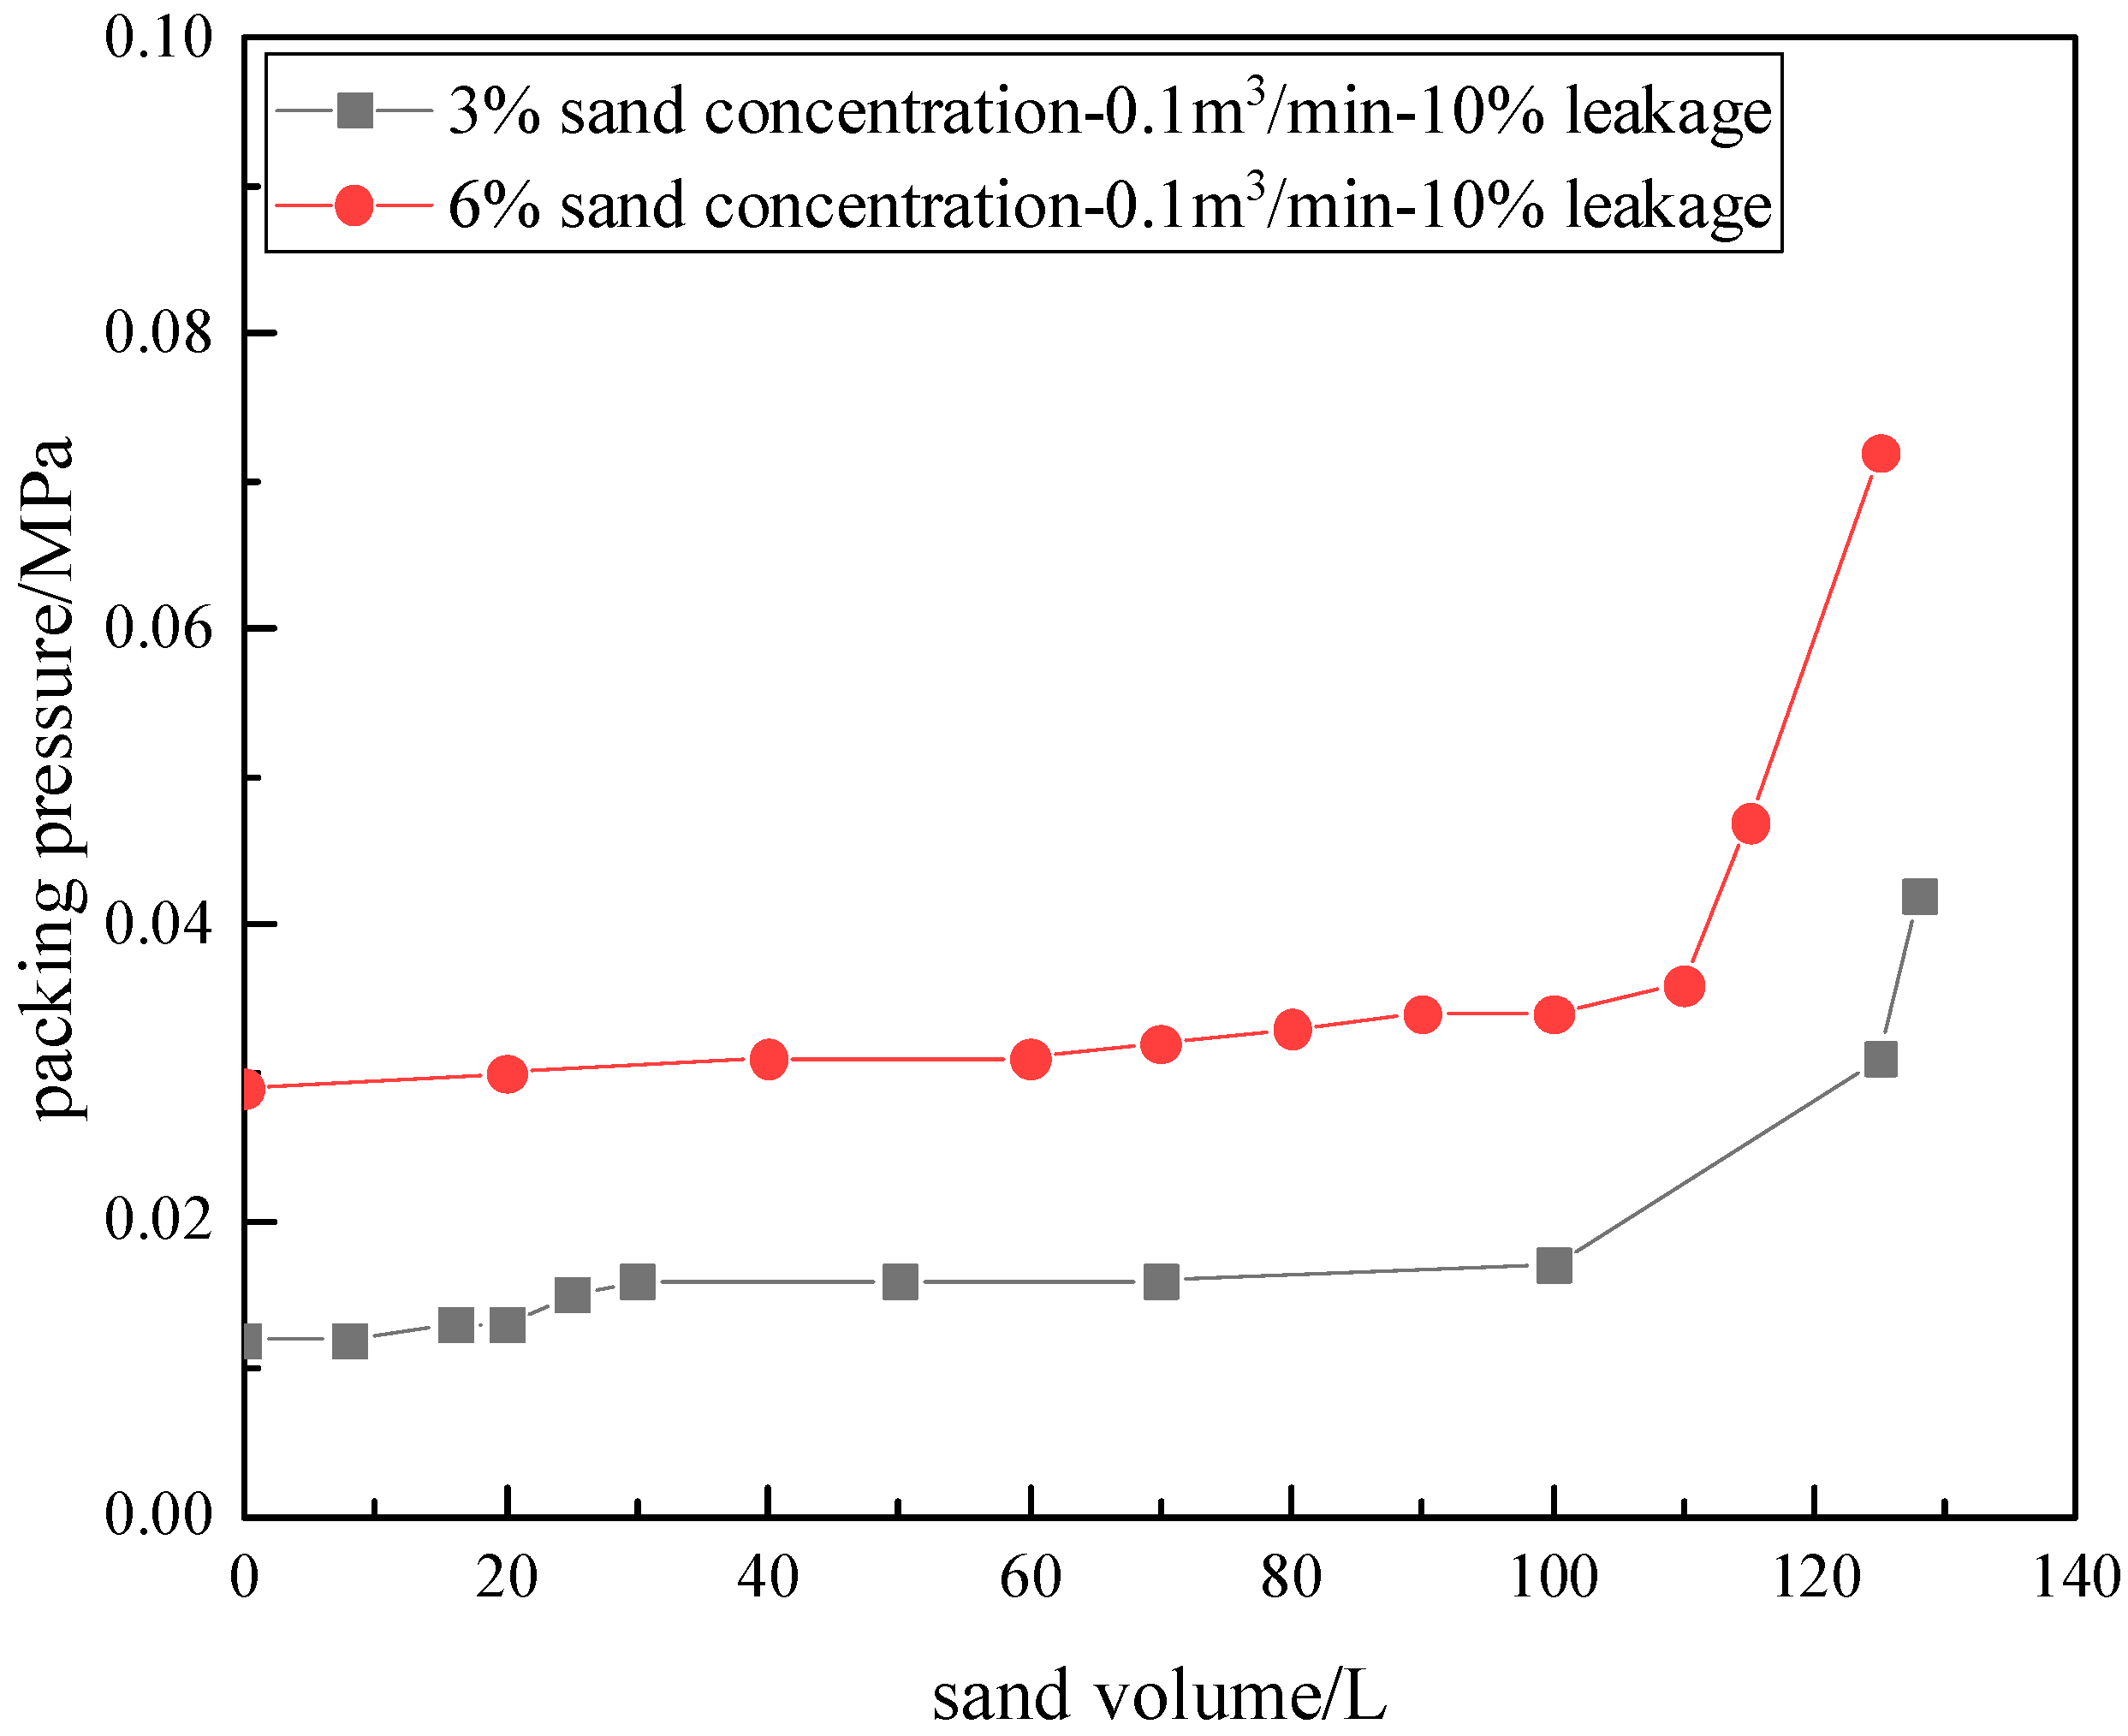
Figure 3, Figure 4 and Figure 5 present the evolutionary characteristics of packing pressure within a horizontal main bore under varying conditions, including changes in leakage rate, injection rate, and sand concentration. The evolutionary behaviors of packing pressure under varying conditions demonstrate remarkable similarity: maintaining a relatively stable state before the simultaneous packing stage in the casing-screen annulus near the horizontal wellbore heel, followed by a significant pressure increase in the final phase, which is consistent with the pumping pressure variation observed in field horizontal well open-hole gravel packing operations [33].
The results of single-factor analysis indicate that the packing pressure increases with the rise in leakage rates, injection rates, and sand concentrations. Based on the structural characteristics of the experimental apparatus, the leakage rate is equal to the difference between the injection rate and return flow rate, which reflects the magnitude of the flow rate within the casing-screen annulus toward the toe of the horizontal wellbore. Under constant conditions of injection rate and sand concentration, the packing pressure rises with the increasing leakage rate (Figure 3). Under constant conditions of leakage rate and sand concentration, the packing pressure rises with the increasing injection rate (Figure 4). With an increasing leakage rate and injection rate, the flow rate magnitude within the casing-screen annulus toward the toe of the horizontal wellbore is increased, raising the velocity. According to the pipe/annular viscous resistance theory and the Darcy relation ( p v 2 ), the flow pressure loss in the casing-screen annulus rises with the viscous shear and turbulent dissipation, requiring a higher driving pressure to sustain the fluid flow, which subsequently leads to a rise in packing pressure. Under constant conditions of leakage and injection rate, the packing pressure rises with the increasing sand concentration (Figure 5). The apparent viscosity of solid–liquid suspension systems can be described using D.G. Thomas’s empirical formulas [34,35] as follows:
η = μ f e k c
k = 2.5 + 14 d φ
where η is the apparent viscosity of solid–liquid suspension systems. μ f is the viscosity of suspension liquid. k is the empirical constant. c is the volume fraction of particles. d is the mean particle diameter. φ is the shape factor ( φ   =   1 for spherical particles).
As demonstrated in Equations (2) and (3), the apparent viscosity of the sand-carrying fluid increases with a higher volumetric fraction of sand. This enhancement in suspension viscosity requires higher pressure differentials to overcome the combined effects of molecular and particulate interaction forces, consequently resulting in elevated pressures during packing operations.
Based on the packing pressure characteristics (Figure 3, Figure 4 and Figure 5), the packing position can be inferred through monitoring and analyzing the dynamic response characteristics of the injection pressure during field packing operations.
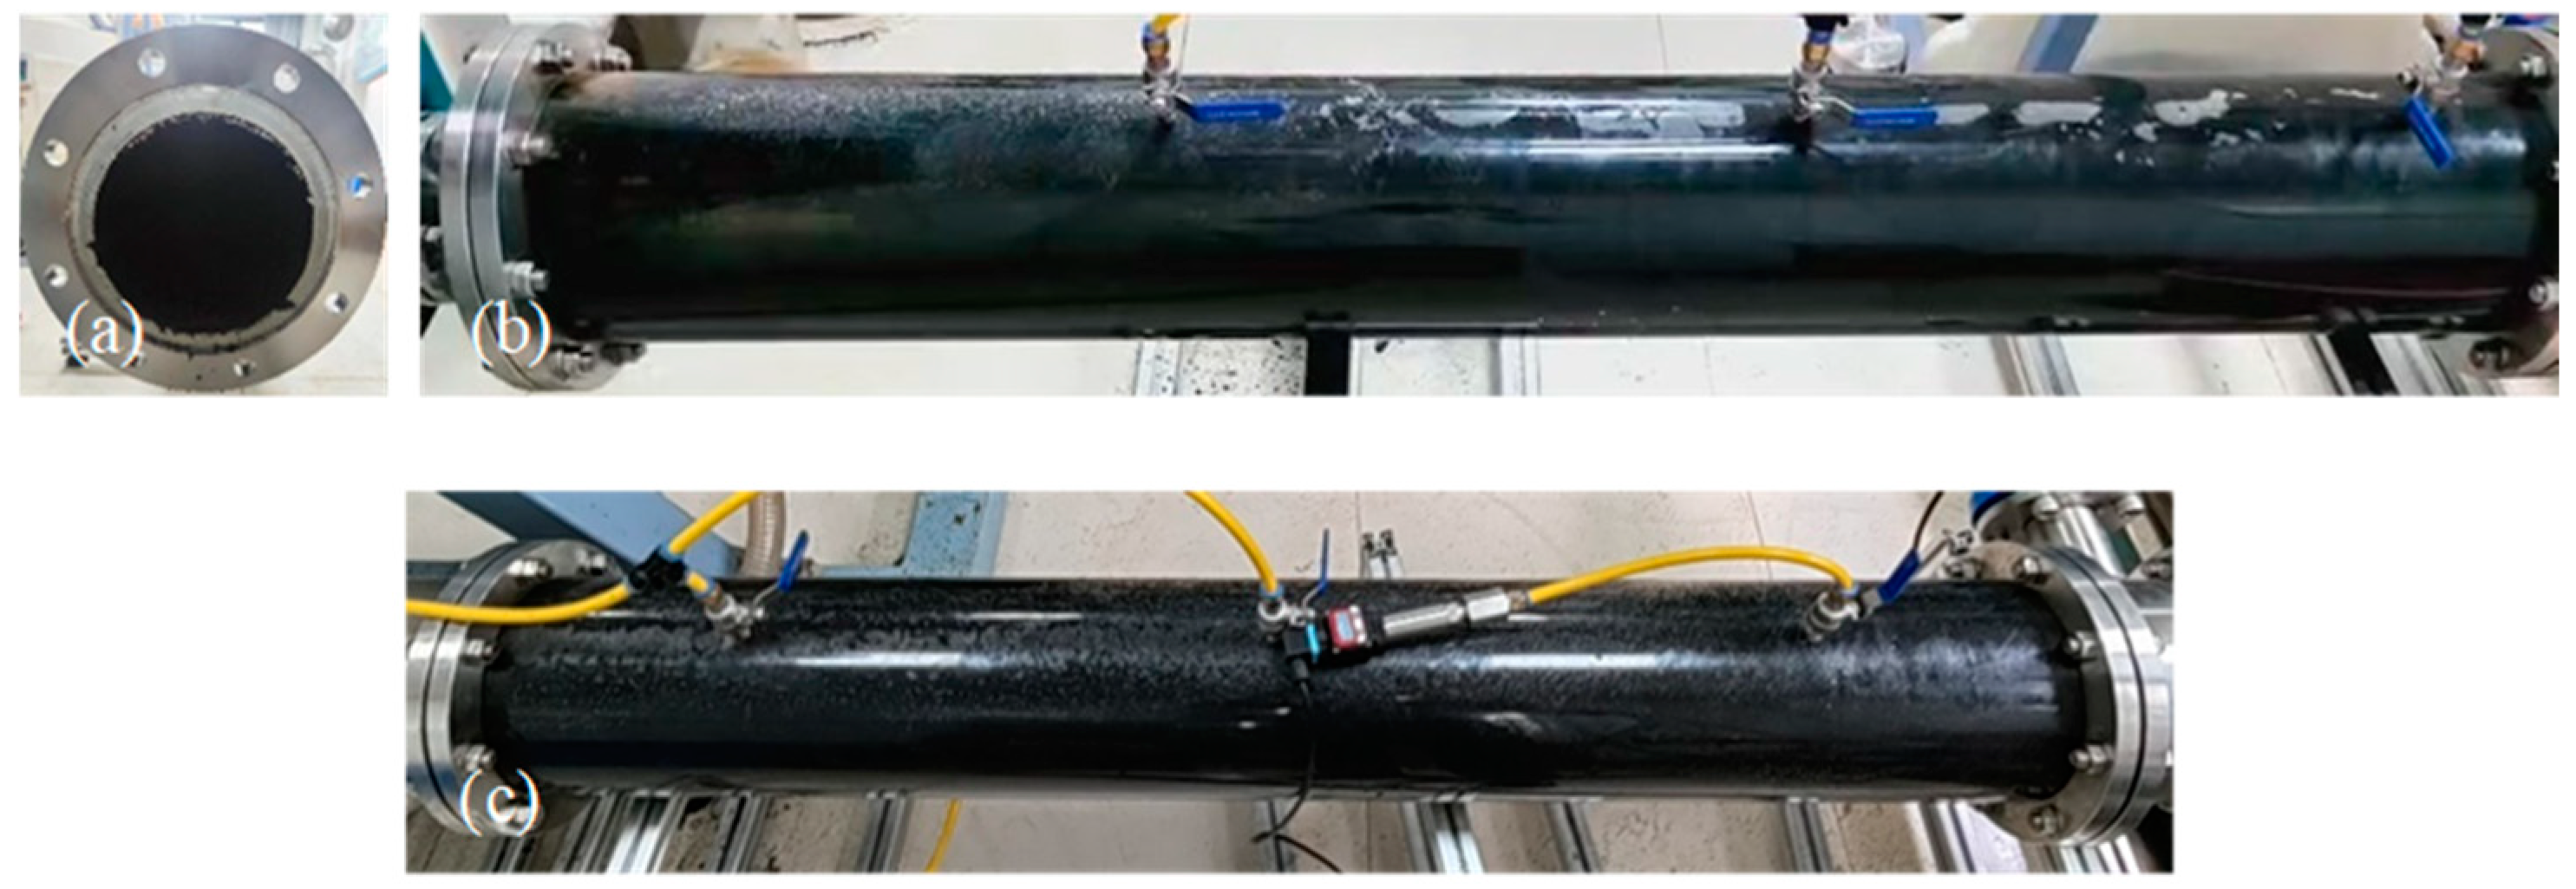
Low injection rates tend to result in insufficient sand packing at the toe section of the single horizontal main wellbore. Figure 6 shows the effectiveness of ultra-light sand packing along the horizontal main wellbore at an injection rate of 0.1 m3/min, 10% leakage, and 6% sand concentration. The experimental results demonstrated that black sand achieved complete packing throughout the horizontal section of the test apparatus, including full coverage at the toe face. This observation substantiates the validity and reliability of determining the gravel packing effectiveness within the casing through the apparatus geometry and sand packing morphology. A packing effectiveness of 100% was achieved for ultra-light sand in a single horizontal main bore under various experimental parameters, as calculated using Equation (1).

3.2. Ultra-Light Sand Packing in Single-Lateral Well Configurations of Varying Lengths

3.2.1. The 1 m Lateral Well Configuration

Two distinct single-lateral horizontal well configurations were obtained by connecting a 1 m lateral wellbore to the horizontal main bore through stainless steel short connectors at angles of 30° and 45°. The single-lateral horizontal well with a 30° deviation angle consists of a 6 m horizontal main bore and a 1 m lateral wellbore, with the junction point located 2 m from the heel of the horizontal main bore. The single-lateral horizontal well with a 45° deviation angle consists of a 6 m horizontal main bore and a 1 m lateral wellbore, with the junction point located 4 m from the heel of the horizontal main bore. The packing behavior of the ultra-light sand in the 1 m single-lateral horizontal well configuration is given in Figure 7, Figure 8 and Figure 9 under varying conditions regarding sand concentrations (3% and 6%), injection rates (0.1, 0.16, and 0.2 m3/min), and leakage rates (5–65%). The packing effectiveness of the ultra-light sand in the 1 m single-lateral horizontal well configuration is calculated using Equation (1), with the results shown in Table 1.
Figure 7 illustrates the packing process of ultra-light sand in the 6 m horizontal main bore and 1 m single-lateral wellbore. The experimental results indicate that the leakage rate is the dominant factor controlling the packing sequence between the 6 m horizontal main bore and the 1 m lateral wellbore.
When the leakage rate exceeds 20%, the packing of ultra-light sand in the lateral wellbore is completed ahead of the horizontal main bore. In the lateral wellbore, the sand bank front proceeds in an alpha-wave pattern until the lateral wellbore is fully filled with no occurrence of beta-wave back-packing (Figure 7a,b). In the horizontal main bore, the sand bank front initially proceeds toward the toe of the main bore in an alpha-wave pattern, followed by beta-wave-pattern back-packing to the sand bank location, and it subsequently proceeds in a simultaneous packing pattern in both the upper and lower casing-screen annuli until reaching the heel of the horizontal main bore.
When the leakage rate is less than 20%, the packing of ultra-light sand in the horizontal main bore is completed ahead of the lateral wellbore (Figure 7c). In the horizontal main bore, the sand bank front initially proceeds toward the toe of the main bore in an alpha-wave pattern. Subsequently, it proceeds in a beta-wave pattern, back-packing to the lateral junction position. The lateral wellbore is then packed completely in an alpha-wave pattern with no occurrence of beta-wave back-packing. Finally, the packing is completed in a simultaneous packing pattern in both the upper and lower casing-screen annuli (Figure 7d).
The National General Ventilation Duct Fittings Chart recommends the following empirical formulas [36,37] for calculating the local resistance coefficient for Y-type branch tees:
ξ 12 = 0.35   ×   ( L 1 A 2 L 2 A 1 1 ) 2
ξ 13 = 0.4 + ( c 0.81 ) 2 c 2                                 θ = 45 ° ξ 13 = s i n 2 θ + ( c o s 2 θ c ) 2 / c                               c < c o s θ ξ 13 = s i n 2 θ + 0.5 c ( c c o s θ ) / c 2           c c o s θ
where ξ 12 and ξ 13 are the local resistance coefficients of main duct and branch duct. L 1 and L 2 are the lengths of main duct before and after the junction point, mm. c is the ratio of the lateral velocity to the main velocity, which is equal to L 3 A 1 L 1 A 3 . θ is the deviation angle °. A 1 , A 2 , and A 3 are the cross-sectional areas of main duct and branch duct, mm2. c o s θ is direction cosine of the main velocity relative to the lateral axis for Y-type branch tees. c < c o s θ indicates that the lateral-to-main velocity ratio is less than c o s   θ . c c o s θ indicates that the lateral-to-main velocity ratio is greater than or equal to c o s θ .
Based on Equation (4), the local resistance coefficient of the main duct is 0.271 for stainless steel short connectors with both 30° and 45° deviation angles. According to Equation (5), the local resistance coefficients of the branch duct are 0.502 and 0.788 for stainless steel short connectors with 30° and 45° deviation angles, respectively. Due to the presence of local resistance coefficients, the carrying fluid preferentially flows toward the horizontal main bore at low leakage or injection rates. At high leakage or injection rates, the flow overcomes the local resistance at the lateral junction, resulting in the lateral wellbore being packed first, followed by the horizontal main bore.
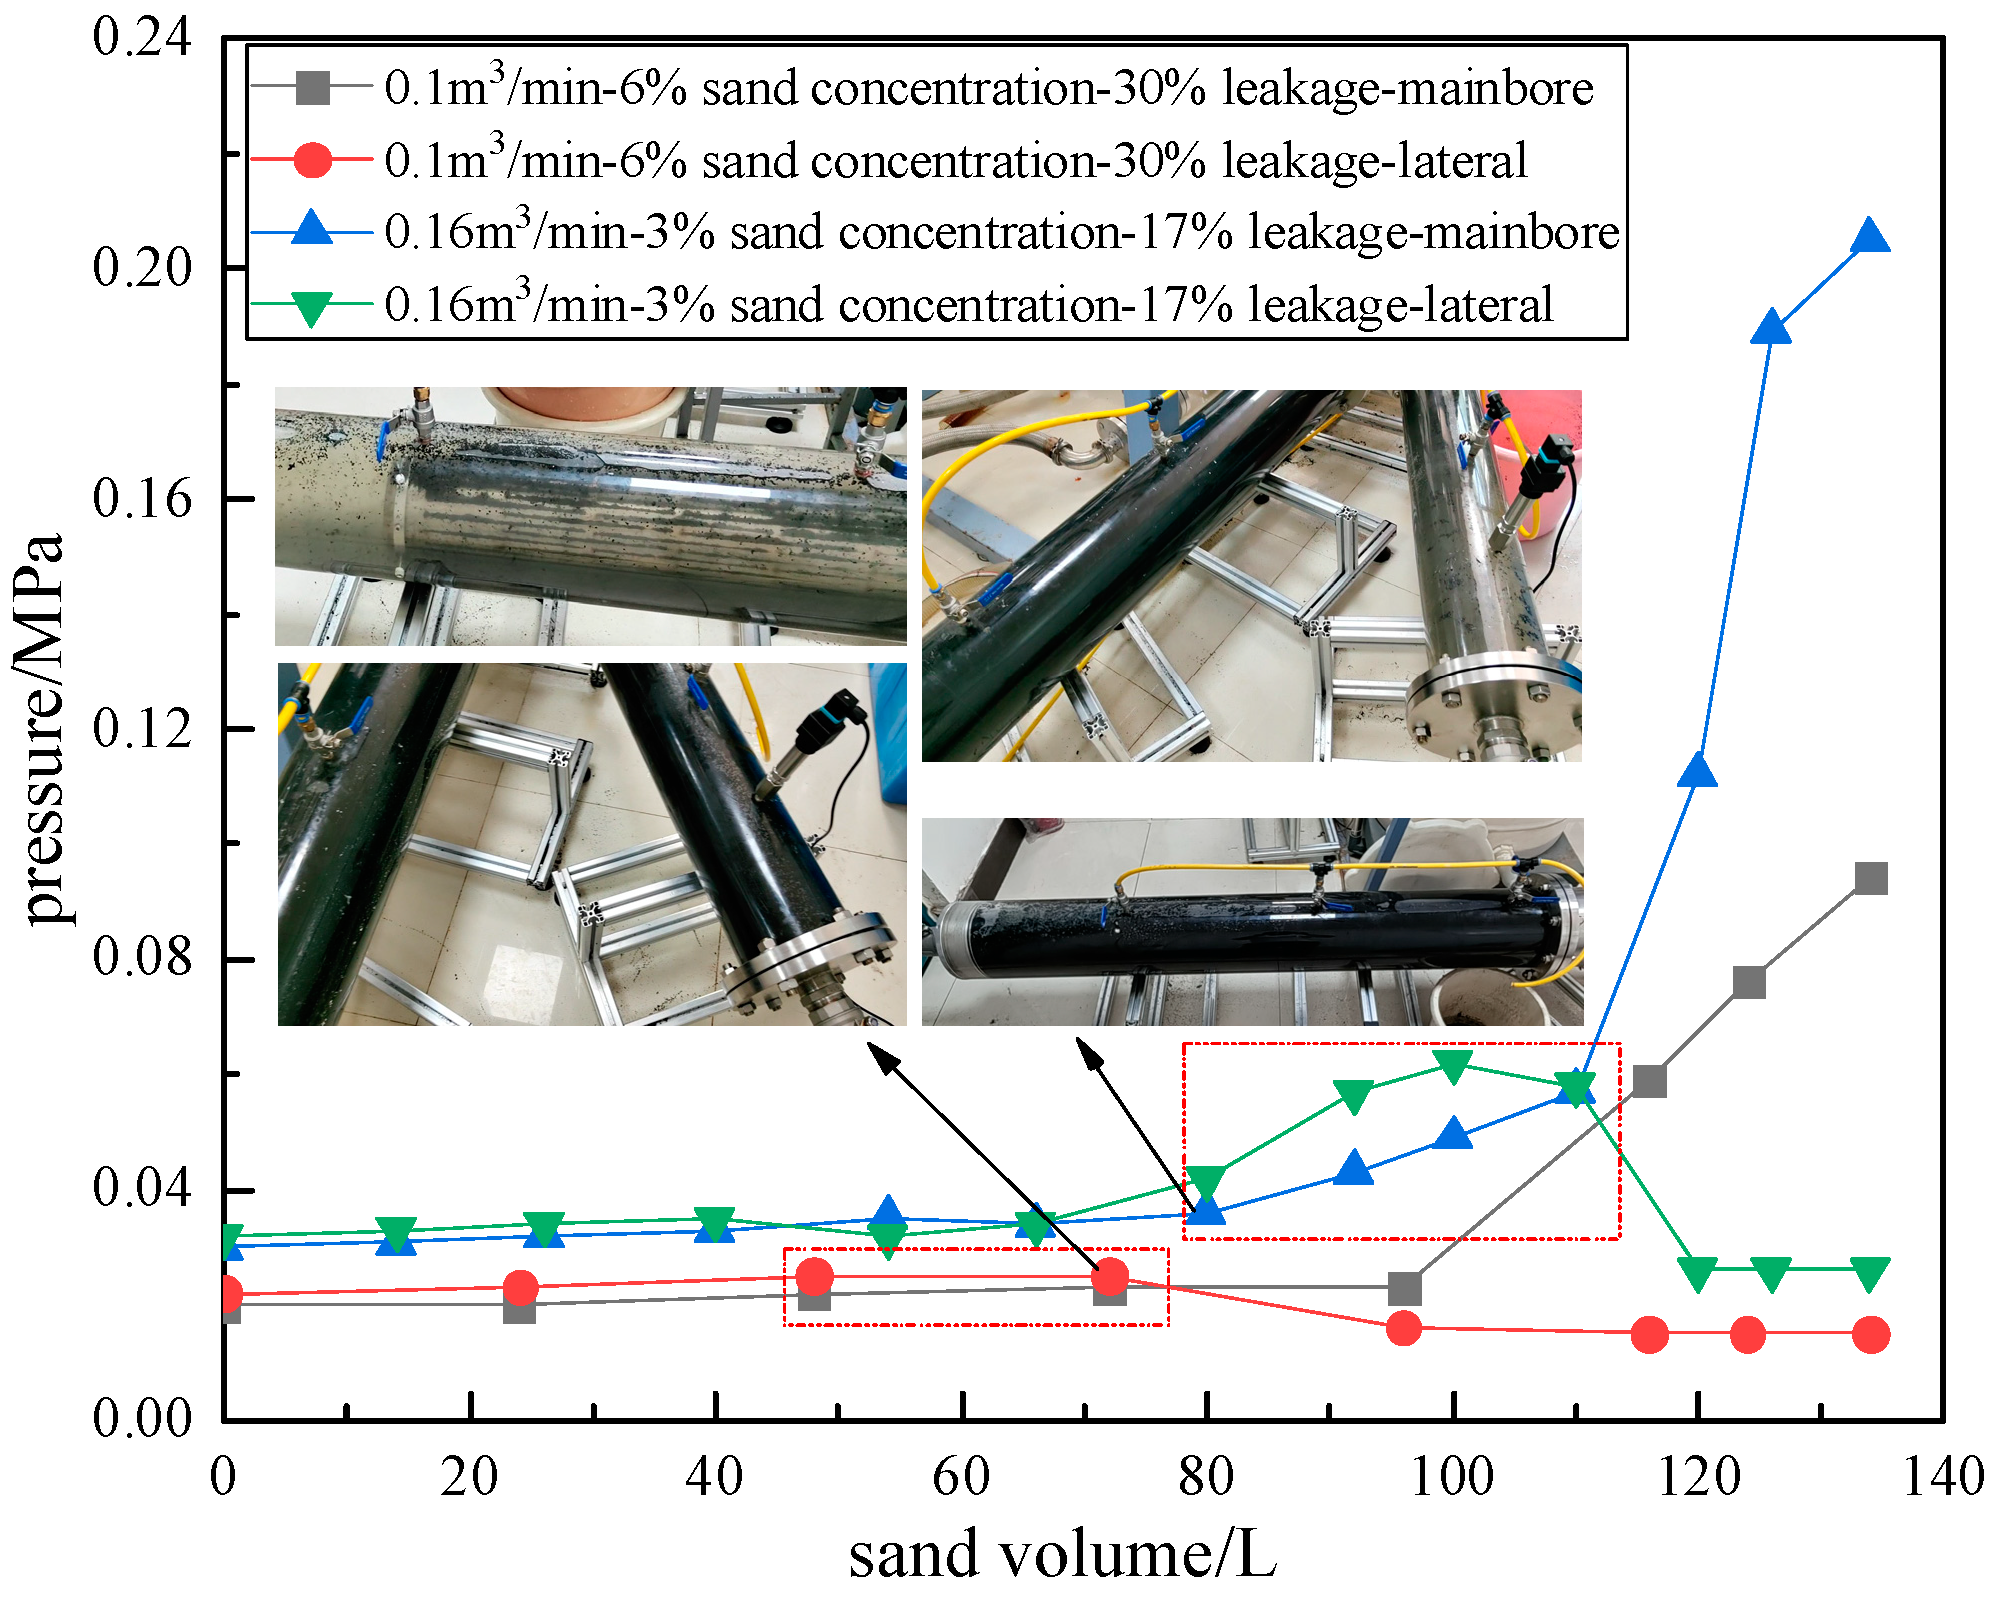
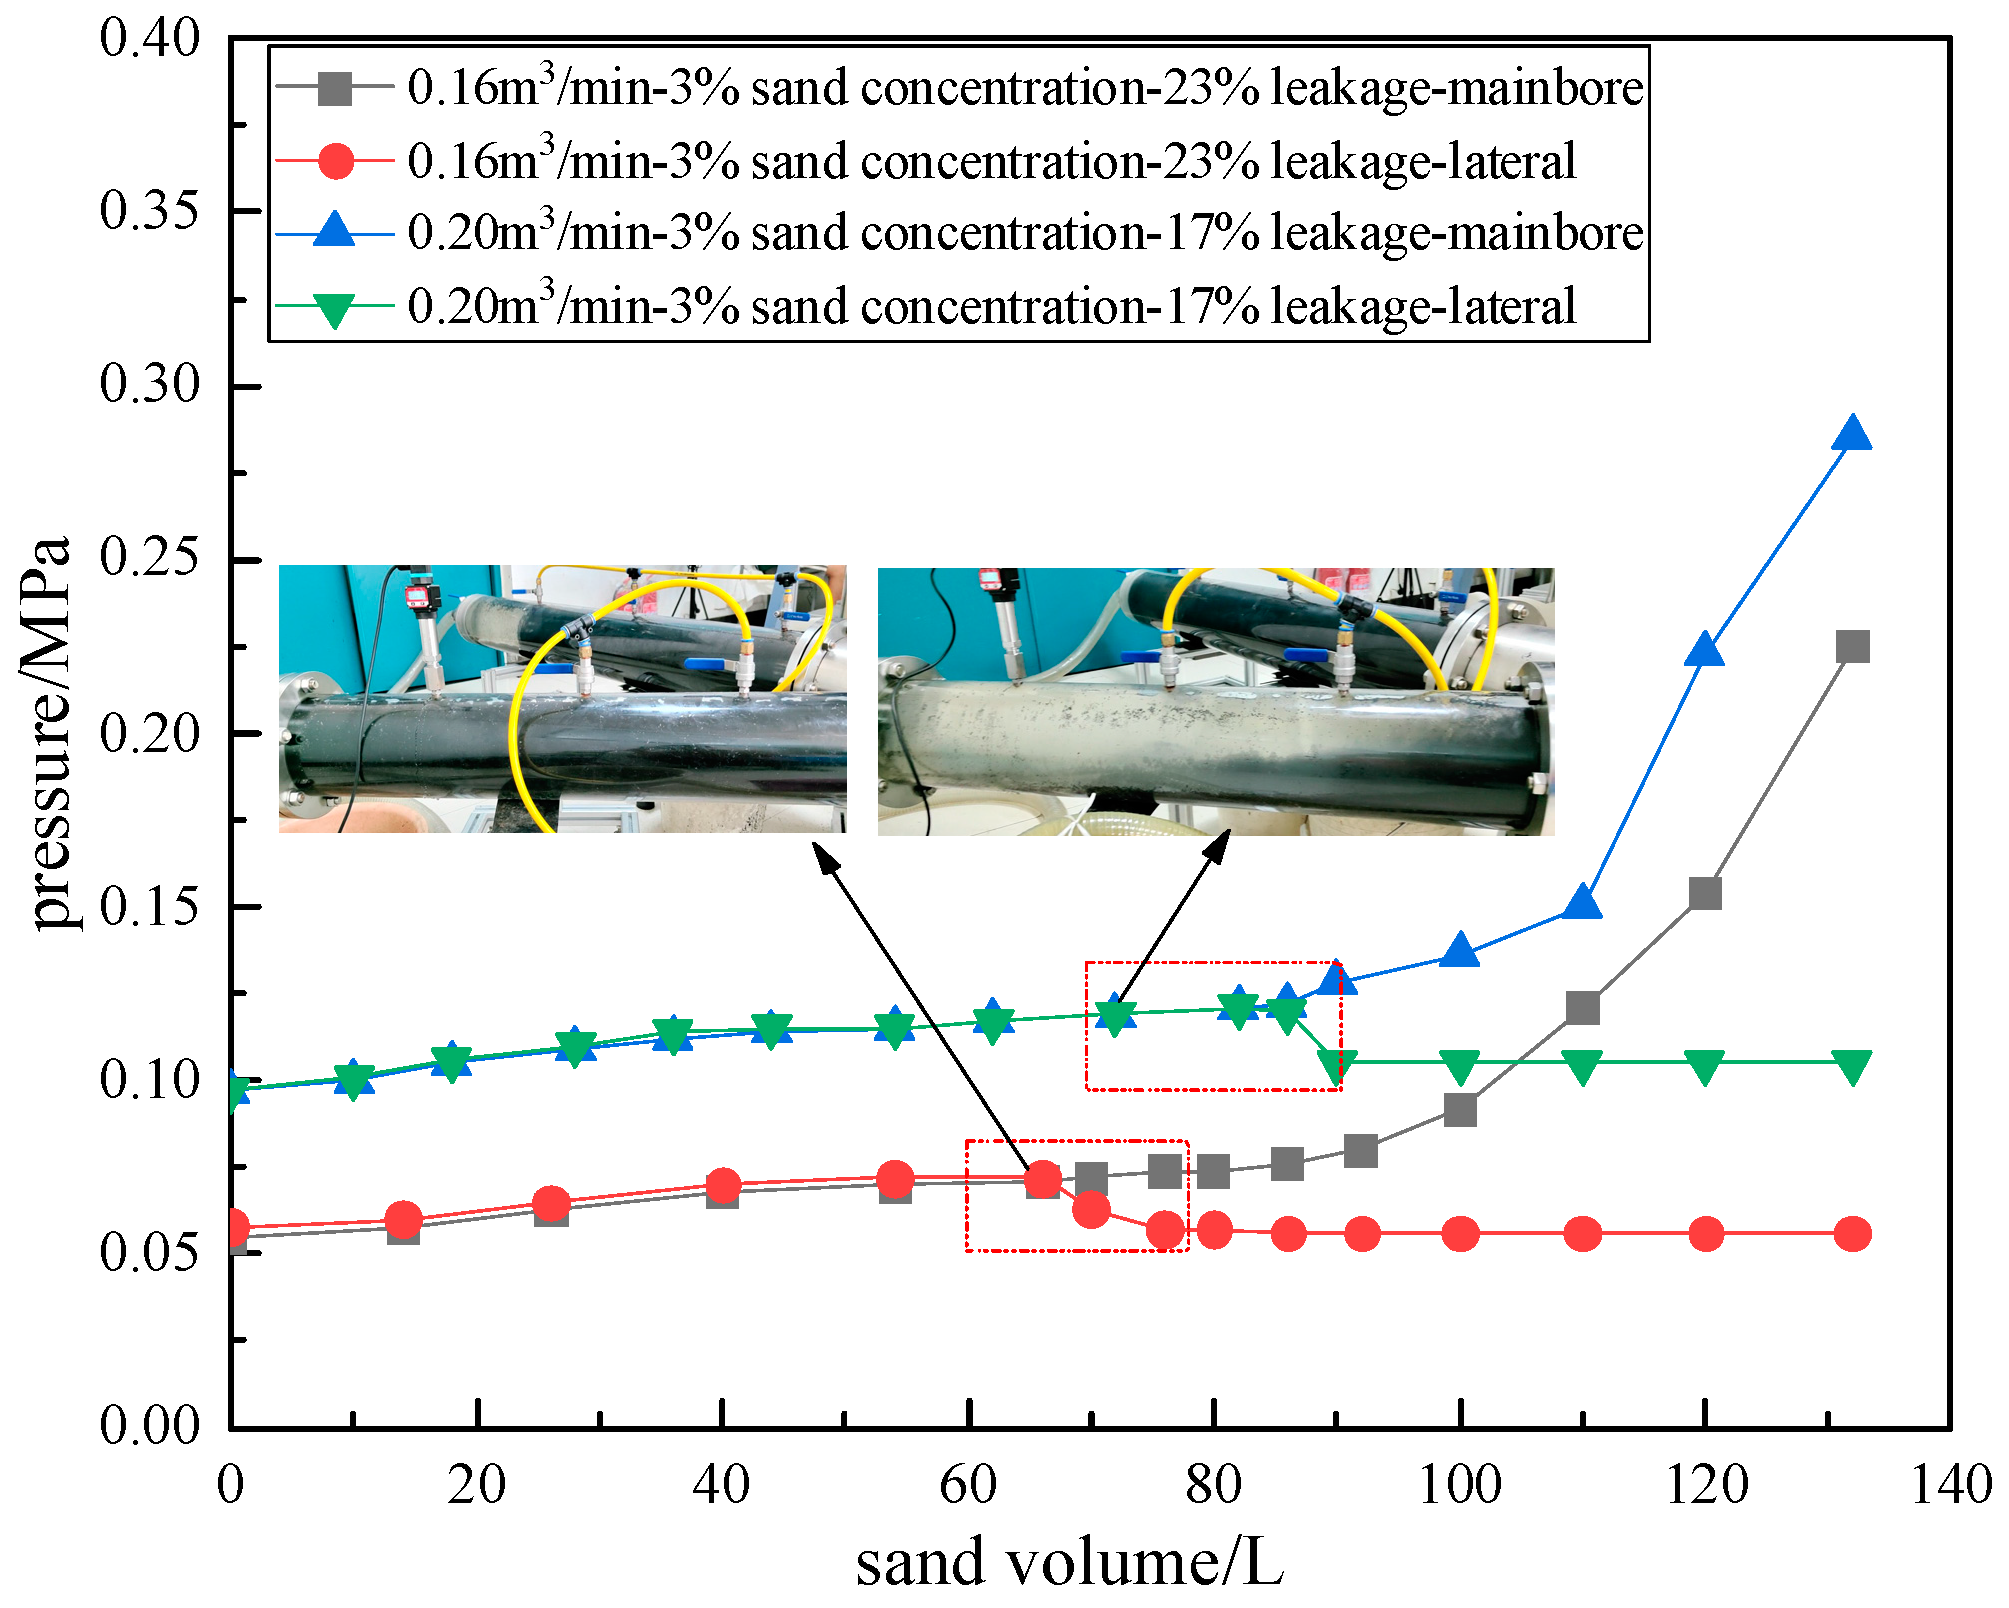
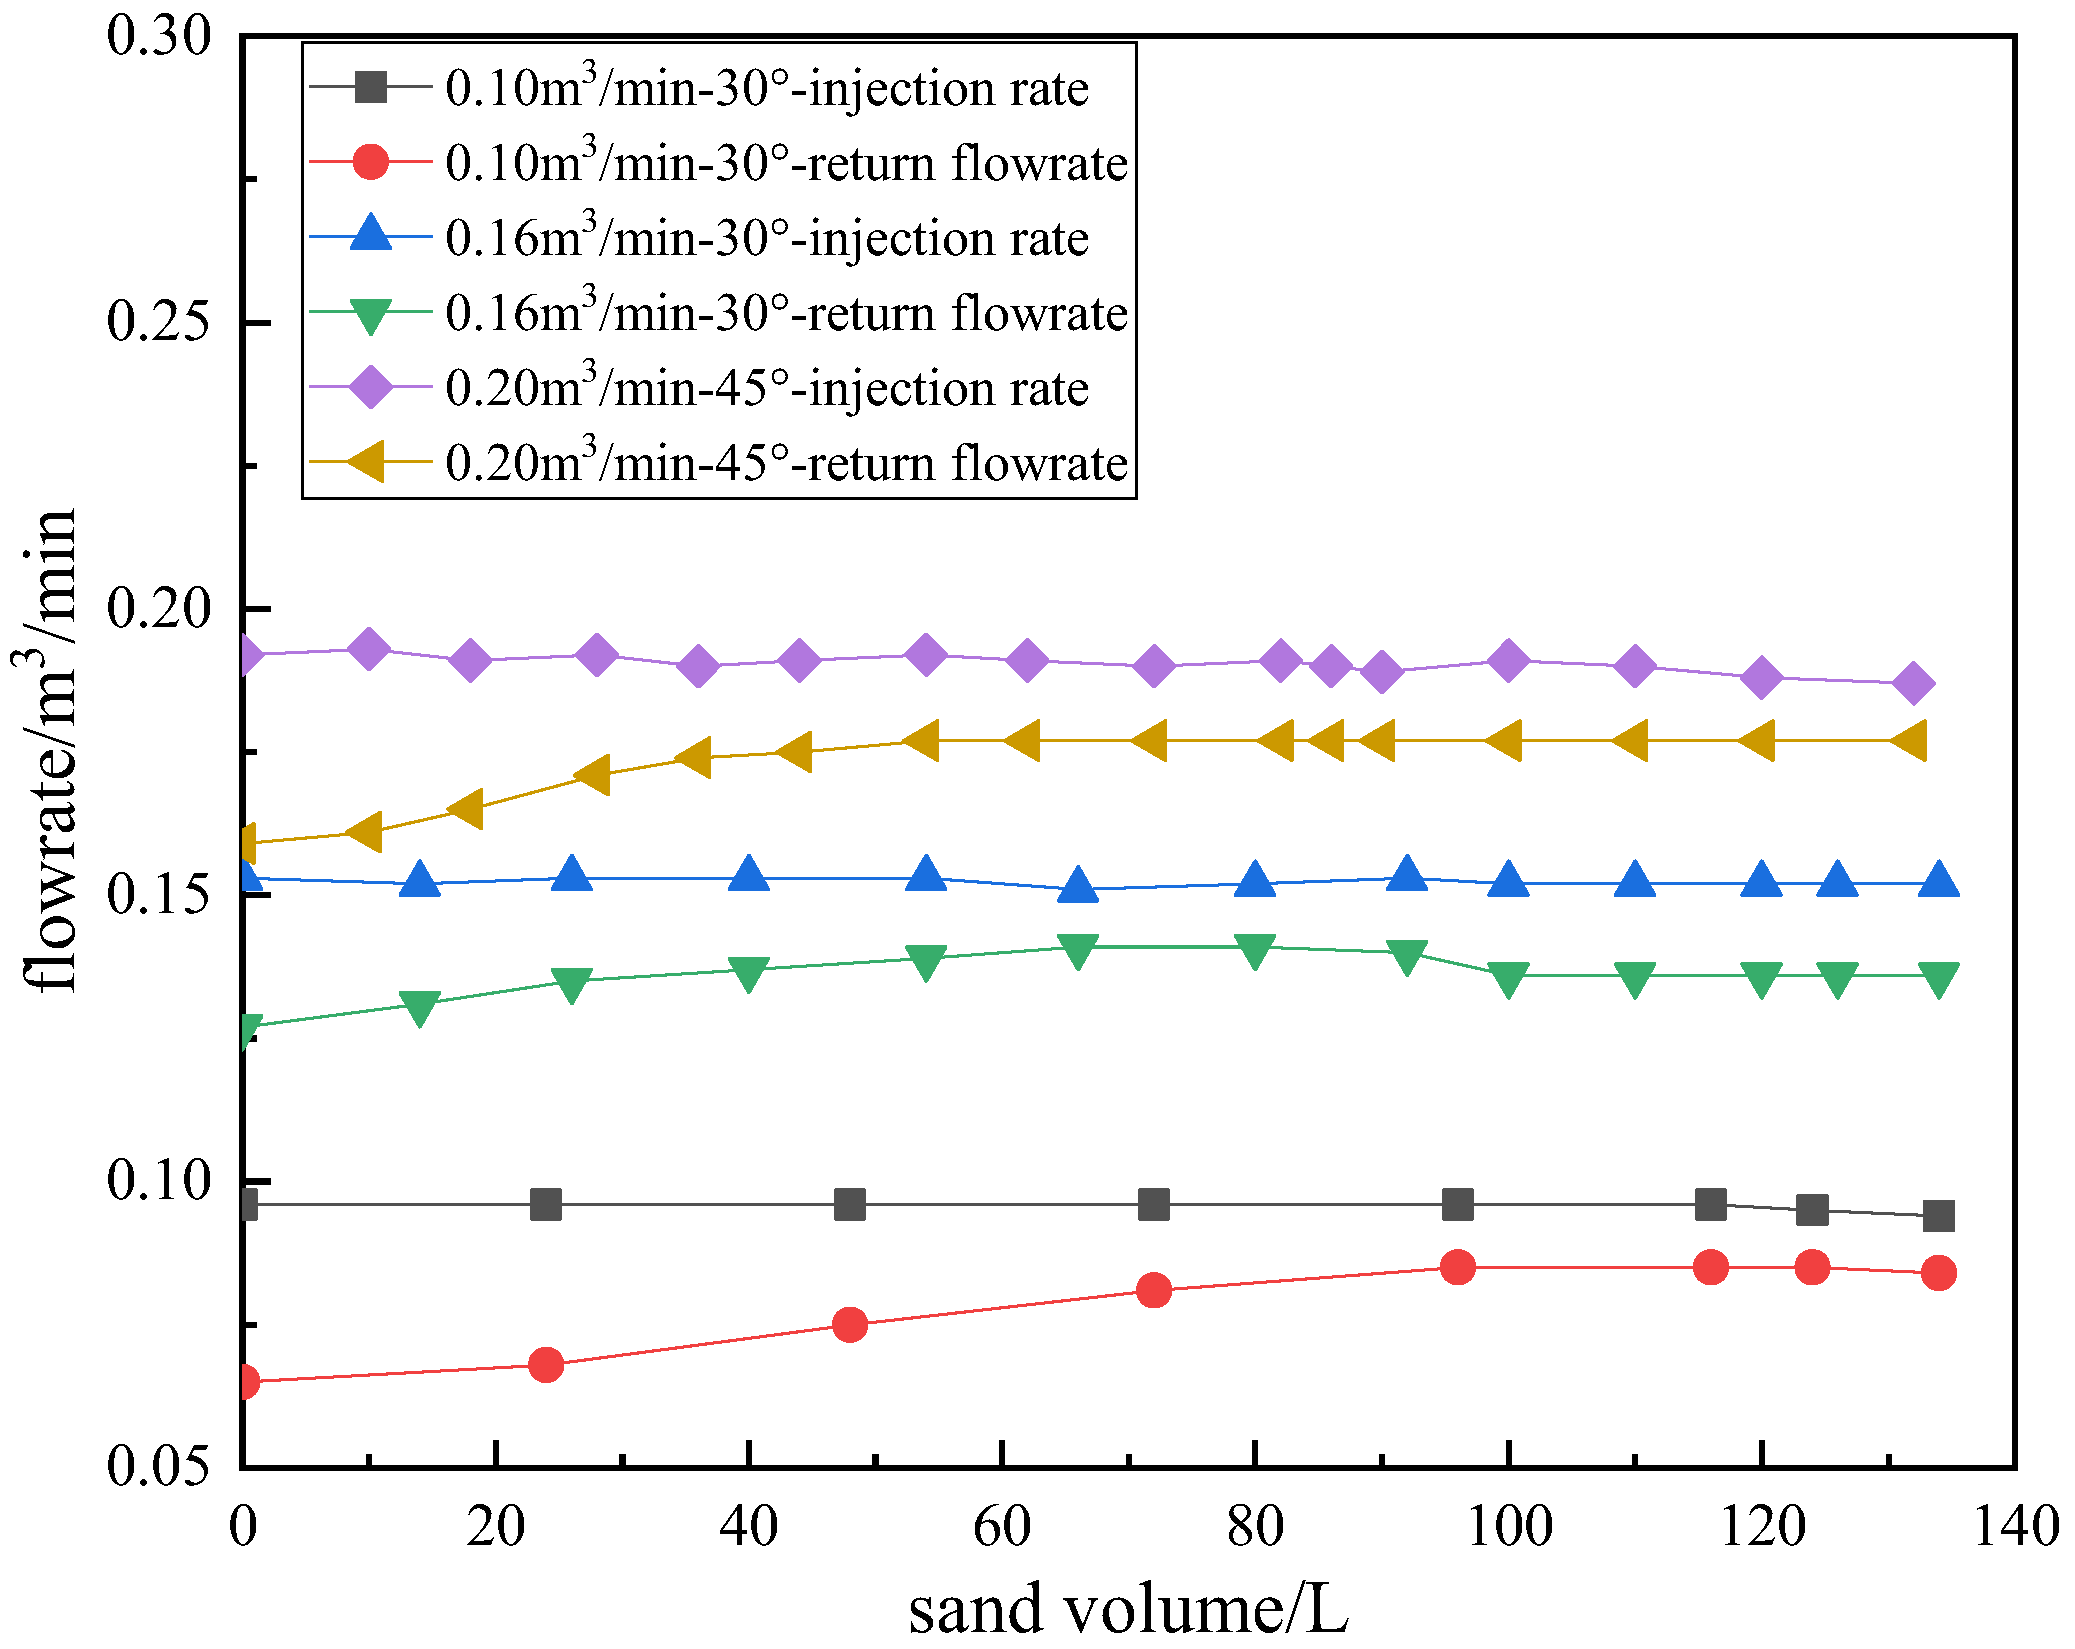
Figure 8 and Figure 9 present the evolutionary characteristics of packing pressure and lateral wellbore pressure within a 6 m horizontal main bore and a 1 m lateral wellbore under different conditions, including variations in leakage rate, injection rate, and sand concentration. The evolutionary pattern of packing pressure in the configuration with a 1 m lateral wellbore exhibits similar characteristics to that of the single horizontal main bore, characterized by relatively stable pressure during the initial phase, followed by a rapid pressure increase in the later stage. However, the pressure in the lateral wellbore exhibits a characteristic three-stage behavior pattern: an initial gradual increase, followed by a decline, ultimately reaching a steady state. This pressure response indicates that the packed sand in the lateral wellbore effectively impedes the carrying fluid’s flow into the lateral section. Furthermore, the onset time of pressure decline varies, occurring earlier when the leakage rate exceeds 20% compared to when it is below 20%. The pressure decline in the lateral wellbore signifies the packing completion of the lateral well, which means that when the leakage rate exceeds 20%, the lateral wellbore completes sand packing before the horizontal main wellbore, while when the leakage rate is below 20%, the horizontal main wellbore completes sand packing before the lateral wellbore. This observation is consistent with the packing process demonstrated in Figure 7. Concurrently, the return flow rate of the carrying fluid through the wash pipe along the slot screen gradually approaches the injection rate, demonstrating that the packed sand has successfully restricted the diverted flow of the injection rate (Figure 10).
In summary, the experimental results demonstrate that the packing pressure and local resistance coefficient of the 45° lateral well configuration are both higher than those of the 30° lateral well configuration under the condition of a single-lateral wellbore length of 1 m. These experimental findings demonstrate that increased deviation angles and extended distances from the horizontal main bore heel necessitate higher injection rates during operations. Therefore, it is recommended that the sidetracking point of the lateral wellbore should be maintained at an appropriate distance from the horizontal main bore heel, while the angle should be moderately controlled.
The experimental results show that there is an incomplete filling section of ultra-light sand at the toe of the horizontal main bore in the configuration of a 6 m horizontal main bore with a 1 m lateral wellbore at a 30° deviation angle when operating with an injection rate of 0.1 m3/min, 33% leakage, and 6% sand concentration. The unfilled section length is 0.475 m, which is less than the distance of 0.520 m between the slot screen and the toe of the horizontal main bore (Figure 11). Based on the structural dimensions of the experimental apparatus, the packing effectiveness can be calculated using Equation (1):
R p   =   1   V np V t   ×   100 %   =   ( 1     π 4 d np 2 l np π 4 [ d br 2 l br   + ( d c 2 d s 2 ) l s   +   d c 2 ( l c l s ) ] )   ×   100 %   =   90.95 %
where d np , d br , d c , and d s are the diameters corresponding to the unpacked pipe section, lateral wellbore, casing, and slot screen, respectively, dm. l np , l br , l c , and l s are the lengths corresponding to the unpacked pipe section, lateral wellbore, casing, and slot screen, respectively, dm.
Using the above method, the packing effectiveness for the 1 m single-lateral well configuration under different experimental conditions can be calculated (Table 1). In comparison to the 1 m lateral well configuration with a 45° angle, the 1 m lateral well configuration with a 30° angle demonstrates a broader operational window for achieving 100% packing effectiveness. Consequently, it is advisable to minimize the deviation angle in lateral wellbore designs.

3.2.2. The 2 m Lateral Well Configuration

A 2 m single-lateral horizontal well configuration was constructed, comprising a 6 m horizontal main bore and a 2 m lateral wellbore. The 2 m lateral wellbore was connected to the main bore through stainless steel short connectors at a 30° angle, with the junction point situated 2 m from the heel of the main bore.
The packing behavior of the ultra-light sand in this 2 m single-lateral horizontal well configuration is given in Figure 12 under varying conditions regarding sand concentrations (3% and 6%), injection rates (0.1, 0.16, and 0.2 m3/min), and leakage rate (8–30%). The packing effectiveness of the ultra-light sand is calculated using Equation (1), with the results shown in Table 2.
As shown in Figure 12, under the specified experimental conditions (leakage below 20%), the ultra-light sand packing in the horizontal main bore is ahead of that in the 2 m lateral wellbore. In the horizontal main bore, the sand bank front initially proceeds toward the toe of the main bore in an alpha-wave pattern. Subsequently, it transitions to a beta-wave pattern back-packing to the lateral junction position. Thereafter, the 2 m lateral wellbore is packed rapidly in an alpha-wave pattern during the initial stage and then evolves into a slope pattern in the latter stage. The slope pattern is a stable accumulation stage in the late filling stage, which occurs after the alpha-wave pattern or when the sand body concentration increases. At this stage, the sand body stops advancing in waves and instead accumulates in a gradual and uniform manner, forming a stable slope geometry (such as an inclination of 30–45°). Specifically, the front of the sand body declines smoothly, similar to the formation of a natural slope. According to the Darcy relation ( p l ), the 2 m lateral presents a larger flow resistance than the 1 m lateral. The diverted flow rate is lower, and its sand transport capacity is comparatively weak. The sand bank is built up rapidly, reduces the effective flow cross-section, increases the flow resistance, and decreases the diverted flow rate. Then, the pack sand settles down rapidly to occupy the cross-section of the lateral wellbore, next to the junction point. The lateral wellbore was constructed from Polymethyl Methacrylate (PMMA), resulting in a wall surface with low relative roughness and a correspondingly low friction factor. Due to the low density (bulk density of 0.60 g/cm3, apparent density of 1.07 g/cm3) and high sphericity (0.9) of the ultra-light sand, it is subject to lower normal stress and lower static friction in wellbores and is easily pushed forward. Therefore, driven by the injection pressure, the sand bank proceeds in a slope pattern. Finally, the packing is completed in a simultaneous packing pattern in both the upper and lower casing-screen annuli.
The packing effectiveness for the 2 m single-lateral well configuration under different experimental conditions can be calculated (Table 2). In comparison to the 1 m lateral well configuration with a 30° angle, the operational window for achieving 100% packing effectiveness is relatively narrow for the 2 m lateral well configuration with a 30° angle. A higher injection rate (0.16 m3/min) is required to achieve 100% packing effectiveness. Therefore, it is recommended that the lateral wellbore length should be reasonably selected and designed according to actual conditions, avoiding excessive length.

3.3. Ultra-Light Sand Packing in Dual-Lateral Well Configuration

A dual-lateral well configuration was obtained, consisting of a 6 m horizontal main bore and two lateral wellbores with lengths of 1 m and 2 m, respectively. The lateral wellbores were connected to the main bore through stainless steel short connectors: the 1 m lateral at a 45° angle, with the junction point situated 4 m from the main bore heel, and the 2 m lateral wellbore at a 30° angle, with the junction point situated 2 m from the main bore heel.
The packing behavior of the ultra-light sand in this dual-lateral horizontal well configuration is given in Figure 13 under varying conditions regarding injection rates (0.1 and 0.2 m3/min), leakage rates (9–30%), and dynamic sand concentrations. The packing efficiency of the ultra-light sand is calculated by using Equation (1), with the results shown in Table 3.
As shown in Figure 13a, when the leakage rate exceeds 20%, the packing sequence of ultra-light sand proceeds successively through the 1 m lateral wellbore, the horizontal main bore, and the 2 m lateral wellbore. In the 1 m lateral wellbore, the sand bank front initially proceeds in an alpha-wave pattern, followed by a slope pattern, until it is fully filled with no occurrence of beta-wave back-packing. Meanwhile, in the horizontal main bore, the sand bank front initially proceeds toward the toe of the main bore in an alpha-wave pattern, followed by beta-wave-pattern back-packing to the 2 m lateral wellbore junction. Finally, upon the completion of packing in the 2 m lateral wellbore, simultaneous packing is conducted in both the upper and lower casing-screen annuli until the heel of the horizontal main bore is reached. In the 2 m lateral wellbore, the sand bank front initially proceeds in an alpha-wave pattern, followed by a slope pattern until it is fully filled.
As shown in Figure 13b, when the leakage rate is less than 20%, the packing sequence of ultra-light sand proceeds successively through the horizontal main bore, the 1 m lateral wellbore, and the 2 m lateral wellbore. In the horizontal main bore, the sand bank front initially proceeds toward the toe of the main bore in an alpha-wave pattern, followed by beta-wave-pattern back-packing to the 1 m and 2 m lateral wellbore junctions sequentially. Finally, upon the completion of packing in the 1 m and 2 m lateral wellbore, simultaneous packing is conducted in both the upper and lower casing-screen annuli until the heel of the horizontal main bore is reached. The packing in the 1 m lateral wellbore is completed ahead of that of the 2 m lateral wellbore. In the 1 m and 2 m lateral wellbores, the sand bank front initially proceeds in an alpha-wave pattern, followed by a slope pattern until it is fully filled with no occurrence of beta-wave back-packing.
The packing effectiveness in the dual-lateral well configuration under different experimental conditions can be calculated (Table 3). In comparison with the single-lateral well configuration, the operational window for achieving 100% packing efficiency is relatively narrow for the dual-lateral well configuration. A higher injection rate (0.2 m3/min) combined with a lower sand concentration (3-1%) is required to achieve 100% packing effectiveness.
Based on Equations (4) and (5), the local resistance coefficient of the main duct in the dual-lateral well configuration is 0.542, which is twice that of the single-lateral well configuration. The local resistance coefficient of the lateral wellbores, which is the sum of the coefficients from both branch ducts, equals 1.290. The increase in the number of lateral wellbores leads to higher local resistance coefficients at lateral junctions, requiring a larger injection rate to overcome the local resistance. Consequently, under identical operational conditions, the packing effectiveness of the dual-lateral well configuration is inferior to that of the single-lateral well configuration. Therefore, it is recommended that the number of lateral wellbores should be reasonably selected and designed according to actual conditions, avoiding excessive laterals. Alternatively, the enhancement of gravel packing effectiveness in multi-lateral wellbores can be achieved either by decreasing the operational sand concentration (thereby reducing the viscosity of the solid–liquid mixture system) or implementing alternative resistance reduction strategies.

4. Optimization of Operational Parameters

4.1. Determination of Similarity Criteria

Laboratory-scale gravel packing experiments have emerged as a critical methodology for the optimization of operational parameters in gravel packing processes. To ensure that the experimental model accurately represents the characteristics of the field prototype, it is imperative to establish and implement appropriate similarity criteria between the laboratory model and the field prototype. The injection rate and pressure are two critical parameters affecting the operational safety of gravel packing in hydrate reservoirs. The gravity similarity criterion (Froude number), which considers the ratio of inertial force to gravitational force, and the pressure similarity criterion (Euler number), which considers the ratio of pressure to viscous force, are selected as the similarity criteria. Assuming identical fluid density and gravitational acceleration between the laboratory model and the field prototype, the pack length is chosen as the characteristic length. Scale factors ( λ ) are defined as the model-to-prototype corresponding parameter ratios. The specific similarity criteria are as follows:
λ Q = λ l λ d 2 λ p = λ Q 2 λ d 4 = λ l
where λ Q is the ratio of the laboratory model injection rate to the field prototype injection rate. λ l is the ratio of the laboratory model pack length to the field prototype pack length. λ p is the ratio of the laboratory model pressure to the field prototype pressure. λ d is the ratio of the laboratory model diameter to the field model diameter.

4.2. Multi-Lateral Horizontal Well Configuration and Determination of Operational Parameters

Table 4 summarizes the end-of-packing pressure and packing effectiveness of ultra-light sand under different lateral configurations and experimental parameters. Among the various lateral well configurations studied, the design that achieved the highest packing effectiveness consisted of a 6 m horizontal main bore and a 1 m lateral wellbore, with the lateral wellbore deviating from the main bore at an angle of 30° and the junction point located 2 m from the heel of the horizontal main bore. Under experimental conditions with an injection rate of 0.16 m3/min, leakage rate of 10–17%, and sand concentration of 6%, this configuration demonstrated lower end-of-packing pressure (0.185–0.225 MPa) and higher packing effectiveness (both were 100%). Therefore, this configuration was selected as the laboratory model to estimate the field prototype parameters.
Based on the diameter and length of the main bore, the operational parameters were performed for a field prototype consisting of a Φ244.5 mm × 480 m horizontal main bore and a Φ215.9 mm × 200 m lateral wellbore with the established similarity criteria. The key parameters considered included the injection rate, end-of-packing pressure, and distance between the junction point and the heel of the horizontal main bore. The results are presented in Table 5.
Based on the experimental parameters with 100% packing effectiveness in the laboratory model, the structural and operational parameters for field prototype were determined (Table 5). In terms of structural design, the deviation angle of lateral wellbores should be controlled within 30°, with the distance between the junction point and the heel of the horizontal main bore being 160 m. For formations with high leakage rates (>50%), the proposed injection rate is 1.69 m3/min, with predicted pressures ranging from 6.56 to 8.32 MPa. When the leakage rate of the formation is between 10% and 20%, the proposed injection rate 2.71 m3/min, with predicted pressures ranging from 14.80 to 18.00 MPa. When the leakage rate of formations is less than 10%, the proposed injection rate is 3.38 m3/min, with predicted pressures ranging from 11.36 to 19.92 MPa.

5. Conclusions

This study demonstrated that the packing process of ultra-light sand in a single horizontal well configuration proceeds as follows: Initially, a sand bank builds up, followed by alpha-wave packing extending to the toe of the horizontal well. Subsequently, beta-wave reverse packing occurs within the upper casing-screen annulus to the sand bank position. Finally, simultaneous reverse packing occurs in both the upper and lower of casing-screen annuli until the heel of the horizontal well is reached. Under the experimental parameters, 100% packing efficiency is achieved.
Furthermore, for the single-lateral well configuration, when the leakage rate exceeds 20%, the lateral wellbore achieves complete packing prior to the horizontal main bore. When the leakage rate is below 20%, the horizontal main bore completes packing before the lateral wellbore. Within the single-lateral wellbore, the ultra-light sand packs in an alpha-wave pattern or initially packs in an alpha-wave pattern and subsequently transitions to a slope pattern.
Moreover, for the dual-lateral well configuration, when the leakage rate exceeds 20%, the packing process proceeds as follows: the 1 m lateral wellbore is packed first, followed by the horizontal main bore and finally the 2 m lateral wellbore. However, when the leakage rate is below 20%, the packing process occurs in a different sequence: the horizontal main bore is packed first, followed by the 1 m lateral wellbore and finally the 2 m lateral wellbore. Identical packing patterns are observed in the ultra-light sand in the 1 m and 2 m lateral wellbores, characterized by an initial alpha-wave pattern followed by a slope pattern, independent of leakage rates.
The angle, length, and number of laterals all significantly affect packing efficiency. Under the same experimental conditions, the 1 m, 30° lateral well configuration achieves 100% packing and provides a wider operating range. It is recommended that the lateral angle is maintained at or below 30°, an overly long lateral length is avoided (for optimization within field constraints), and the number of laterals is minimized, subject to meeting production/drainage requirements. Based on the experimental results for the 1 m, 30° lateral well configuration, the lateral wellbore deviation angle should be maintained within 30° and the distance between the junction point and the heel of the horizontal main bore should be 160 m for the field prototype (480 m main bore and 200 m lateral wellbore). When the leakage rate exceeds 50%, the recommended injection rate is less than 1.69 m3/min. When the leakage rate is between 20 and 50%, the recommended injection rates range from 1.69 to 2.71 m3/min. When the leakage rate is between 10 and 20%, the recommended injection rate is 2.71 m3/min. When the leakage rates are less than 10%, the recommended injection rates are less than 3.38 m3/min. The corresponding predicted end-of-packing pressures span from 6.56 to 19.92 MPa. This study provides valuable insights into the development of gravel packing sand control technologies in a multi-lateral horizontal well for hydrate reservoirs.

Author Contributions

Conceptualization, P.J. and L.G.; methodology, P.J.; validation, P.J., L.G. and W.D.; formal analysis, W.D.; investigation, Z.L.; resources, Z.L.; data curation, J.Z.; writing—original draft preparation, P.J.; writing—review and editing, Z.W.; visualization, Z.L.; supervision, J.Z.; project administration, Z.W.; funding acquisition, Z.W. All authors have read and agreed to the published version of the manuscript.

Funding

This research was funded by the National Natural Science Foundation of China, grant number U21B2069, the Major Scientific and Technological Innovation Projects in Shandong Province, grant number 2022CXGC020407, the Fundamental Research Funds for the Central Universities, grant number 24CX10004A, the Fundamental Research Funds for the Central Universities, grant number 25CX06003A, the Special Funds of the Taishan Scholars Program, the Program for Scientific Research Innovation Team of Young Scholar in Colleges and Universities of Shandong Province, grant number 2024KJH131.

Institutional Review Board Statement

Not applicable.

Informed Consent Statement

Not applicable.

Data Availability Statement

Data will be made available on request.

Conflicts of Interest

Authors Liyong Guan and Weigang Du were employed by the company Well Services Branch of CNPC Offshore Engineering Co., Ltd. The remaining authors declare that the research was conducted in the absence of any commercial or financial relationships that could be construed as a potential conflict of interest.

References

  1. Gong, Y.H.; Yang, S.X.; Wang, H.B.; Liang, J.Q.; Liang, J. Prospect of Gas Hydrate Resources in Qiong Dongnan Basin. Jilin Daxue Xuebao Diqiu Kexue Ban J. Jilin Univ. Earth Sci. Ed. 2018, 48, 1030–1042. [Google Scholar] [CrossRef]
  2. Chen, L.; Merey, S.; Pecher, I.; Okajima, J.; Komiya, A.; Diaz-Naveas, J.; Li, S.; Maruyama, S.; Kalachand, S.; Kvamme, B.; et al. A review analysis of gas hydrate tests: Engineering progress and policy trend. Environ. Geotech. 2022, 9, 242–258. [Google Scholar] [CrossRef]
  3. Hunter, R.B.; Collett, T.S.; Boswell, R.; Anderson, B.J.; Digert, S.A.; Pospisil, G.; Baker, R.; Weeks, M. Mount Elbert gas hydrate stratigraphic test well, Alaska North Slope: Overview of scientific and technical program. Mar. Pet. Geol. 2011, 28, 295–310. [Google Scholar] [CrossRef]
  4. Kvamme, B. Feasibility of simultaneous CO2 storage and CH4 production from natural gas hydrate using mixtures of CO2 and N2. Can. J. Chem. 2015, 93, 897–905. [Google Scholar] [CrossRef]
  5. Kurihara, M.; Sato, A.; Funatsu, K.; Ouchi, H.; Yamamoto, K.; Numasawa, M.; Ebinuma, T.; Narita, H.; Masuda, Y.; Dallimore, S.R.; et al. Analysis of production data for 2007/2008 Mallik gas hydrate production tests in Canada. In Proceedings of the SPE International Oil and Gas Conference and Exhibition in China, Beijing, China, 8–10 June 2010; SPE: Richardson, TX, USA, 2010. [Google Scholar]
  6. Terao, Y.; Duncan, M.; Hay, B.; Dang, L. Deepwater methane hydrate gravel packing completion results and challenges. In Proceedings of the Offshore Technology Conference, Houston, TX, USA, 5–8 May 2014; SPE: Richardson, TX, USA, 2014. [Google Scholar]
  7. Li, J.F.; Ye, J.L.; Qin, X.W.; Qiu, H.J.; Wu, N.Y.; Lu, H.L.; Xie, W.W.; Lu, J.A.; Peng, F.; Xu, Z.Q.; et al. The first offshore natural gas hydrate production test in South China Sea. China Geol. 2018, 1, 5–16. [Google Scholar] [CrossRef]
  8. Shen, J.; Chiu, C.; Ng, C.; Lei, G.; Xu, J. A state-dependent critical state model for methane hydrate-bearing sand. Comput. Geotech. 2016, 75, 1–11. [Google Scholar] [CrossRef]
  9. Wan, Y.; Wu, N.; Hu, G.; Xin, X.; Jin, G.; Liu, C.; Chen, Q. Reservoir stability in the process of natural gas hydrate production by depressurization in the Shenhu area of the South China Sea. Nat. Gas Ind. B 2018, 5, 631–643. [Google Scholar] [CrossRef]
  10. Fang, X.; Ning, F.; Wang, L.; Liu, Z.; Lu, H.; Yu, Y.; Li, Y.; Sun, J.; Shi, H.; Zhao, Y.; et al. Dynamic coupling responses and sand production behavior of gas hydrate-bearing sediments during depressurization: An experimental study. J. Pet. Sci. Eng. 2021, 201, 108506. [Google Scholar] [CrossRef]
  11. Tong, S.; Ren, Y.; Jin, Y.; Yan, K.; Zhang, J.; Wang, Z. Investigation of synergistic inhibition effect of hydrate inhibitors and paraffin inhibitors on hydrate formation. Fuel 2025, 385, 134105. [Google Scholar] [CrossRef]
  12. Jin, Y.; Li, Y.; Wu, N.; Yang, D. Characterization of sand production for clayey-silt sediments conditioned to openhole gravel-packing: Experimental observations. SPE J. 2021, 26, 3591–3608. [Google Scholar] [CrossRef]
  13. Jin, Y.; Wu, N.; Li, Y.; Yang, D. Characterization of sand production for clayey-silt sediments conditioned to hydraulic slotting and gravel packing: Experimental observations, theoretical formulations, and modeling. SPE J. 2022, 27, 3704–3723. [Google Scholar] [CrossRef]
  14. Tong, S.; Yan, K.; Jin, Y.; Ren, Y.; Xie, H.; Zhang, J.; Liu, C.; Wang, Z. Microscopic interactions between hydrate particles/droplets in gas or heavy hydrocarbon under high pressure conditions: Cohesion, adhesion and tensile strength. Colloids Surf. A Physicochem. Eng. Asp. 2025, 710, 136264. [Google Scholar] [CrossRef]
  15. Wu, N.; Li, Y.; Wan, Y.; Sun, J.; Huang, L.; Mao, P. Prospect of marine natural gas hydrate stimulation theory and technology system. Nat. Gas Ind. B 2021, 8, 173–187. [Google Scholar] [CrossRef]
  16. Yamamoto, K. Overview and introduction: Pressure core-sampling and analyses in the 2012–2013 MH21 offshore test of gas production from methane hydrates in the eastern Nankai Trough. Mar. Pet. Geol. 2015, 66, 296–309. [Google Scholar] [CrossRef]
  17. Li, Y.; Liu, L.; Liu, C.; Sun, J.; Ye, Y.; Qiang, C. Sanding prediction and sand-control technology in hydrate exploitation: A review and discussion. Mar. Geol. Front. 2016, 32, 36–43. [Google Scholar]
  18. Wang, H.; Wang, J.; Yu, J.; Yu, C.; Liu, Y. Key technologies for natural gas hydrate mining. Drill. Prod. Technol. 2022, 45, 51–56. [Google Scholar]
  19. Li, Y.; Hu, Y.; Hu, G.; Liu, C.; Wu, C.; Wu, N.; Chen, Q.; Liu, L.; Li, C. Gravel sizing method for sand control packing in hydrate production test wells. Pet. Explor. Dev. 2017, 44, 1016–1021. [Google Scholar] [CrossRef]
  20. Zuo, R.; Li, Y. Japan’s sampling study and successful production test for NGH in Nankai through. Explor. Eng. Rock Soil Drill. Tunneling 2017, 44, 1–20. [Google Scholar]
  21. Mohamed, A.; Salehi, S.; Ahmed, R.; Li, G. Experimental study on rheological and settling properties of shape memory polymer for fracture sealing in geothermal formations. J. Pet. Sci. Eng. 2022, 208, 109535. [Google Scholar] [CrossRef]
  22. Farouk, S.; Saada, S.A.; Fagelnour, M.S.; Arafat, M. Petrophysical and Gas Chromatographic Analysis Integration for Hydrocarbon Identifications in Cretaceous Reservoirs, Azhar Field, Beni Suef Basin, Egypt. Egypt. J. Pet. 2024, 33, 7. [Google Scholar] [CrossRef]
  23. Farouk, S.; Sen, S.; Ahmed, F.; Qteishat, A.; Al-Kahtany, K.; Moreno, H.M.; Mitra, S.; Arafat, M. Assessment of the Upper Cretaceous Abu Roash carbonate source rocks from the Beni Suef field, Western Desert, Egypt. J. Afr. Earth Sci. 2024, 215, 105272. [Google Scholar] [CrossRef]
  24. Lu, J.; Lin, D.; Li, D.; Liang, D.; Zhang, Y.; Wu, S.; He, Y.; Shi, L. Research status on water controllina and sand controllina in horizontal well completion durina gas hydrate exploitation. Adv. New Renew. Energy 2022, 10, 447–455. [Google Scholar]
  25. Lu, J.S.; Wu, S.T.; Li, D.L.; Liang, D.Q.; Wei, W.; He, Y.; Shi, L.L.; Deng, F.C.; Xiong, Y.M. Solid phase control strategy during the exploitation of marine gas hydrates. Adv. New Renew. Energy 2022, 10, 137–145. [Google Scholar]
  26. Hancock, S.; Boswell, R.; Collett, T. Development of deepwater natural gas hydrates. In Proceedings of the Offshore Technology Conference, Houston, TX, USA, 6–9 May 2019; SPE: Richardson, TX, USA, 2019. [Google Scholar]
  27. Ayan, C.; Aktepe, S.; Cig, K.; Gokmen, M.; Ceyhan, A.; Tugan, M.; Shumakov, Y.; Dolu, A.; Theuveny, B. Frontiering Ultra-Deep Water Gas Field Development, Offshore Black Sea-Turkey: Solutions to Complex Well Testing Challenges and Proving Production Potential. In Proceedings of the SPE Annual Technical Conference and Exhibition? Houston, TX, USA, 16–18 October 2023; SPE: Richardson, TX, USA, 2023. [Google Scholar]
  28. Xin, X.; Shan, Y.; Xu, T.; Li, S.; Zhu, H.; Yuan, Y. Multi-Lateral Well Productivity Evaluation Based on Three-Dimensional Heterogeneous Model in Nankai Trough, Japan. Energies 2023, 16, 2406. [Google Scholar] [CrossRef]
  29. Wei, W.; Zhang, G.; Yang, G.; Jiang, B.; Yue, G.; Mao, X. Exploration and research on long-term sand control completion in natural gas hydrate reservoir. Drill. Prod. Technol. 2022, 45, 67. [Google Scholar]
  30. Luo, Q.; Liu, Z.; Ning, F. Sand control and water drainage by ultrasonic atomization for gas recovery from hydrate reservoirs. Drill. Eng. 2022, 49, 23–28. [Google Scholar]
  31. Chen, N.; Xue, X.; Guan, H. Application analysis of ultra-short multilateral well drilling and completion technology in the Bohai oilfield. J. Shandong Inst. Pet. Chem. Technol. 2023, 7, 75–79. [Google Scholar]
  32. Zhang, S.; Guan, H.; Zhang, W. Research on operational parameters of gravel packing sand control completion for ultra-short multilateral Wells. J. Shandong Inst. Pet. Chem. Technol. 2024, 38, 77–83. [Google Scholar]
  33. Aragao, A.F.L.; Calderon, A.; Lomba, R.F.T.; Moreira, J.N.V.C.; de Sá, A.N.; Martins, A.L.; Quintero, L.; Moura, E. Field Implementation of Gravel Packing Horizontal Wells Using a Solids-Free Synthetic Fluid with Alpha/Beta Wave Technology. In Proceedings of the SPE Annual Technical Conference and Exhibition, Anaheim, CA, USA, 11–14 November 2007; SPE: Richardson, TX, USA, 2007. [Google Scholar]
  34. Thomas, D.G. A note on the viscosity of Newtonian suspensions of uniform spherical particles. J. Colloid Sci. 1965, 20, 267–277. [Google Scholar] [CrossRef]
  35. Hu, Z.-W. Theoretical study of prop-laden fluid flow resistance in hydraulic fracture. Nat. Gas Geosci. 2005, 16, 784–787. [Google Scholar]
  36. Kuang, J.; Wang, Z.; Dai, M. Review of coefficient of local resistance for pipe fittings in district cooling systems. Heat. Vent. Air Cond. 2022, 52, 88–95. [Google Scholar]
  37. Qin, H. Research on the local resistance coefficient of ventilation duct tees. Heat. Vent. Air Cond. 1980, 10–13. [Google Scholar] [CrossRef]
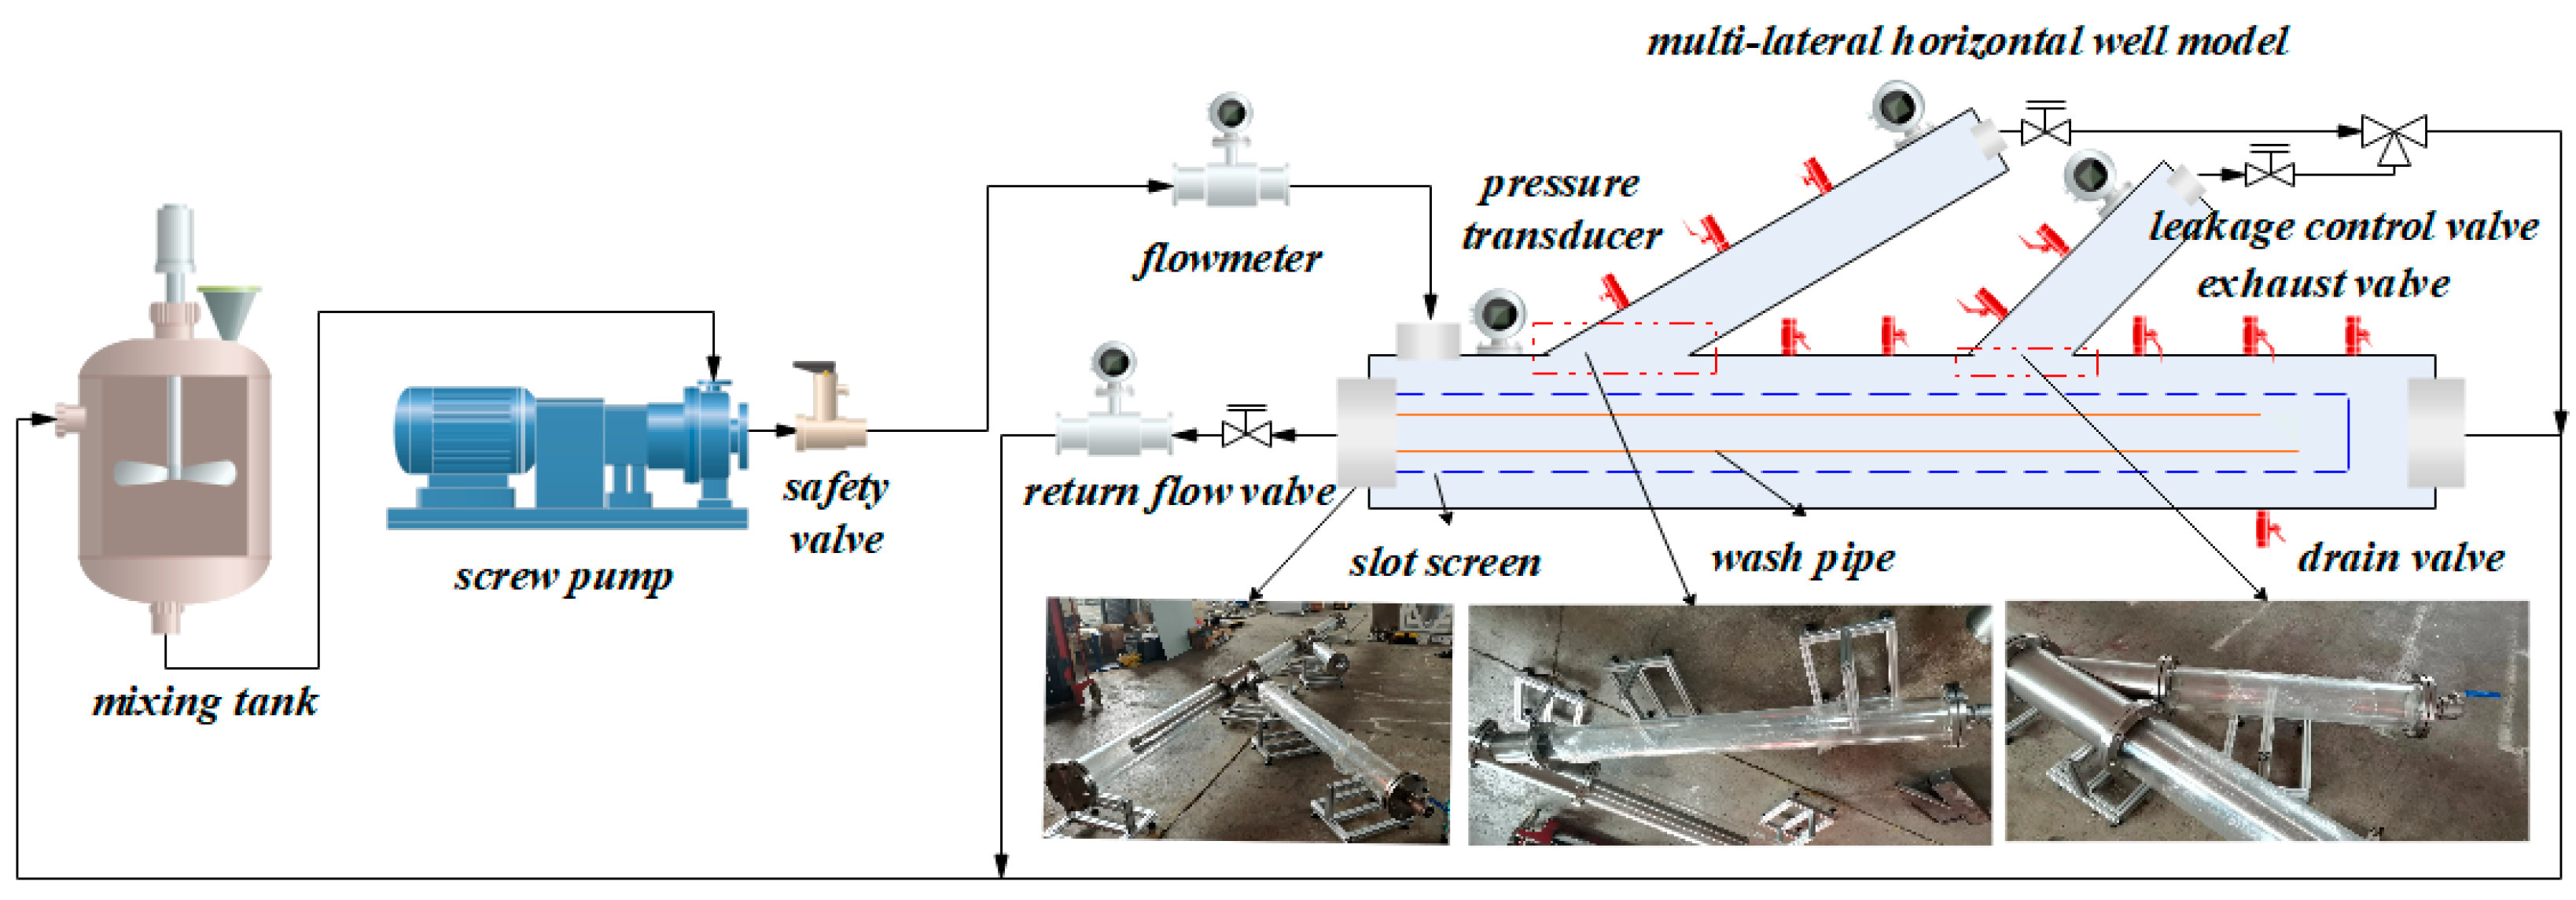
Figure 1. Multi-lateral horizontal well experimental apparatus for gravel packing.
Sustainability 17 08563 g001
Figure 2. Spatial distribution of ultra-light sand at different locations within a single horizontal main bore at a specific moment in the packing operation. (a) Evolution from initial sand bank to equilibrium state within the lower casing-screen annulus. (b) Alpha-wave packing of ultra-light sand in the toe region of the horizontal main bore. (c) Beta-wave back-packing initiation of ultra-light sand after complete settlement in the lower section of the casing at the toe region of the horizontal main bore. (d) Simultaneous packing of ultra-light sand in the upper and lower casing-screen annulus near the heel of the horizontal sand.
Sustainability 17 08563 g002
Figure 3. Relationship between packing pressure and leakage.
Sustainability 17 08563 g003
Figure 4. Relationship between packing pressure and injection rate.
Sustainability 17 08563 g004
Figure 5. Relationship between packing pressure and sand concentration.
Sustainability 17 08563 g005
Figure 6. The packing effectiveness of the ultra-light sand in different sections under the conditions of 0.1 m3/min, 10% leakage, and 6% sand concentration: (a) the toe face; (b) the toe section of the horizontal wellbore; (c) the heel section of the horizontal wellbore.
Sustainability 17 08563 g006
Figure 7. Packing process in the 6 m horizontal main bore and 1 m lateral wellbore. (a) Alpha-wave packing of ultra-light sand in the lateral wellbore. (b) The priority completion of the packing of the lateral wellbore at a leakage rate exceeding 20%. (c) The priority completion of the packing of the main bore at a leakage rate below 20%. (d) Simultaneous packing of ultra-light sand in the upper and lower casing-screen annuli near the heel of the horizontal main bore.
Sustainability 17 08563 g007
Figure 8. The pressure for horizontal main bore and 1 m lateral wellbore with 30°.
Sustainability 17 08563 g008
Figure 9. The pressure for horizontal main bore and 1 m lateral wellbore with 45°.
Sustainability 17 08563 g009
Figure 10. The injection and return flow rates for 1 m lateral well configuration.
Sustainability 17 08563 g010
Figure 11. The packing effectiveness of the ultra-light sand under conditions of 0.1 m3/min, 33% leakage, and 6% sand concentration.
Sustainability 17 08563 g011
Figure 12. Packing process in 2 m lateral well configuration under the condition of leakage below 20%. (a) Alpha-wave packing of ultra-light sand during the initial stage in the 2 m lateral wellbore. (b) Slope-pattern packing of ultra-light sand during the late stage in the 2 m lateral wellbore.
Sustainability 17 08563 g012
Figure 13. Packing process in dual-lateral well configuration. (a) Packing sequence of 1 m lateral main bore and 2 m lateral with a leakage rate exceeding 20%. (b) Packing sequence of 1 m main bore and 2 m lateral bore at a leakage rate below 20%.
Sustainability 17 08563 g013
Table 1. The packing effectiveness for the 1 m single lateral well configuration.
StructureInjection Rate/m3/minLeakage/%Sand Concentration/%Packing Effectiveness/%
6 m main bore with a 1 m, 30° lateral wellbore0.1673100
566100
33690.95
0.16173100
116100
106100
0.273100
76100
63100
6 m main bore with a 1 m, 45° lateral wellbore0.126385.49
27686.93
0.1612395.05
233100
273100
0.293100
126100
173100
166100
Table 2. The packing effectiveness for the 2 m single lateral well configuration.
StructureInjection Rate/m3/minLeakage/%Sand Concentration/%Packing Effectiveness/%
6 m main bore with a 2 m 30° lateral wellbore0.110389.59
10682.73
31393.74
23693.62
0.16113100
10696.24
283100
266100
0.2123100
83100
Table 3. The packing effectiveness for the dual lateral well configuration.
StructureInjection Rate/m3/minLeakage/%Sand Concentration/%Packing Effectiveness/%
dual lateral well configuration0.130385.71
10dynamic: 3-185.29
0.222dynamic: 3-1100
11dynamic: 1.5-1100
Table 4. Packing pressure and effectiveness of ultra-light sand under various lateral configurations and operational parameters.
StructureInjection Rate/m3/minLeakage/%Sand Concentration/%Packing Efficiency/%End-of-Packing Pressure/MPa
6 m main bore with a 1 m, 30° lateral wellbore0.16731000.082
5661000.104
33690.950.094
0.161731000.205
1161000.185
1061000.225
0.2731000.142
761000.163
631000.249
6 m main bore with a 1 m, 45° lateral wellbore0.126385.490.022
27686.930.059
0.1612395.050.119
2331000.225
2731000.232
0.2931000.260
1261000.227
1731000.285
1661000.310
6 m main bore with a 2 m, 30° lateral wellbore0.110389.590.145
10682.730.080
31393.740.154
23693.620.190
0.161131000.320
10696.240.363
2831000.334
2661000.341
0.21231000.297
831000.429
6 m main bore with a 1 m, 45° and 2 m, 30° lateral wellbores0.130385.710.052
10dynamic: 3-185.290.045
0.222dynamic: 3-11000.290
11dynamic: 1.5-11000.219
Table 5. The operational parameters of the field prototype with 30° lateral well configuration.
Laboratory Model (6 m Main Bore with 1 m, 30° Lateral Wellbore)Field Prototype (480 m Main Bore with 200 m, 30° Lateral Wellbore)
D/mQ/m3/minL/md/mP/MPaD/mQ/m3/minP/MPad/m
0.17780.1620.0820.24451.696.56160
0.1048.32
0.160.2052.7116.40
0.18514.80
0.22518.00
0.20.1423.3811.36
0.16313.04
0.24919.92
Abbreviations: Diameter—D; Injection rate—Q; Packing length—L; Junction point distance—d; End-of-packing pressure—P.
Disclaimer/Publisher’s Note: The statements, opinions and data contained in all publications are solely those of the individual author(s) and contributor(s) and not of MDPI and/or the editor(s). MDPI and/or the editor(s) disclaim responsibility for any injury to people or property resulting from any ideas, methods, instructions or products referred to in the content.