1. Introduction
The building sector accounts for approximately 40% of total energy consumption and nearly 36% of CO
2 emissions in the European Union [
1]. A considerable proportion of this stock comprises residential buildings constructed prior to 1945, a significant number of which are designated as heritage buildings. These buildings are subject to increasing pressure to enhance their energy performance without compromising their cultural significance. In this context, Mechanical Ventilation with Heat Recovery (MVHR) systems are increasingly recognised as effective strategies to improve indoor air quality (IAQ) and reduce heating demand in energy-retrofitted buildings. Moreover, the study emphasises the vital importance of effective ventilation in limiting airborne disease transmission, an issue that was brought to the forefront during the SARS-CoV-2 pandemic and is now central to strategies for resilient and healthy buildings [
2]. This underscores the necessity for the implementation of robust ventilation strategies within residential properties.
Advanced MVHR systems often include Demand-Controlled Ventilation (DCV), which adjusts airflow in real time based on indoor CO
2 levels, temperature, and humidity through Building Management Systems (BMS). Recent contributions, such as the experimental assessment by Mejri et al. [
3] and Duffield & Bunn [
4] have demonstrated the energy-saving potential and IAQ benefits of DCV strategies under various control schemes and occupancy conditions, highlighting the growing relevance of this approach in the context of sustainable building retrofits. However, following commissioning, system performance is seldom monitored or evaluated in real-life conditions, particularly in heritage dwellings, thereby limiting opportunities for operational optimisation, early fault detection, and user feedback [
5]. This absence of post-occupancy evidence is of particular significance in the context of heritage retrofits, where system integration constraints can impede the efficacy of the retrofitted systems.
Despite growing interest in MVHR systems for energy retrofits, most existing studies rely on simulation-based assessments or short-term field trials, often excluding heritage contexts. Recent works by Alhindawi et al. [
6] and Bartolucci et al. [
7] underscore the challenges of maintaining IAQ and energy performance in airtight dwellings and historic buildings, respectively, yet lack operational data collected under real-use conditions. This study addresses that gap by providing an empirical evaluation of MVHR performance in a protected residential dwelling, offering insights into airflow imbalance, thermal recovery, and pressure losses under heritage-constrained conditions. The findings contribute to the refinement of commissioning protocols and support evidence-based retrofit strategies for culturally significant buildings.
The process of retrofitting heritage-protected buildings is a complex undertaking, characterised by a multitude of challenges. Interventions must be minimally invasive and reversible in order to preserve architectural integrity, whilst simultaneously ensuring compliance with energy and indoor environmental quality (IEQ) targets. Although MVHR systems are often considered unsuitable for heritage buildings due to the difficulty of achieving airtightness and the potential loss of heat recovery benefits, retrofitting practices are increasingly incorporating measures to improve the performance of the building envelope. In this study, the dwelling underwent a comprehensive energy retrofit that enhanced airtightness while preserving historical features, creating a relevant context to assess the operational viability of MVHR in heritage settings. In this context, ensuring adequate IAQ through effective ventilation is critical yet challenging. MVHR systems present a compelling solution by ensuring the continuous supply of fresh air while minimising thermal losses. However, empirical evidence of their operational performance in heritage settings remains scarce. The majority of studies either concentrate on design-stage assessments or neglect to consider post-retrofit usage patterns. It is imperative that the system demonstrates efficacy in maintaining carbon dioxide levels below recommended thresholds across variable occupancy and climate conditions, whilst concomitantly reducing heating demand [
8].
The pressing necessity for a swift transition towards sustainable and climate-resilient urban centres necessitates the incorporation of existing buildings, particularly those of architectural and cultural significance, into the overarching solution. As emphasised by the European Green Deal [
9] and the United Nations Sustainable Development Goals (SDGs) [
10], enhancing energy efficiency, advocating for healthy indoor environments, and prolonging the lifespan of buildings are foundational elements for a more sustainable urban future. In this context, the retrofitting of energy-efficient measures in combination with advanced ventilation systems is of critical importance in enabling heritage dwellings to meet 21st-century sustainability standards without compromising their historical significance. This research is consistent with broader policy and scientific objectives, providing insights that are applicable to the ongoing renovation initiatives throughout Europe.
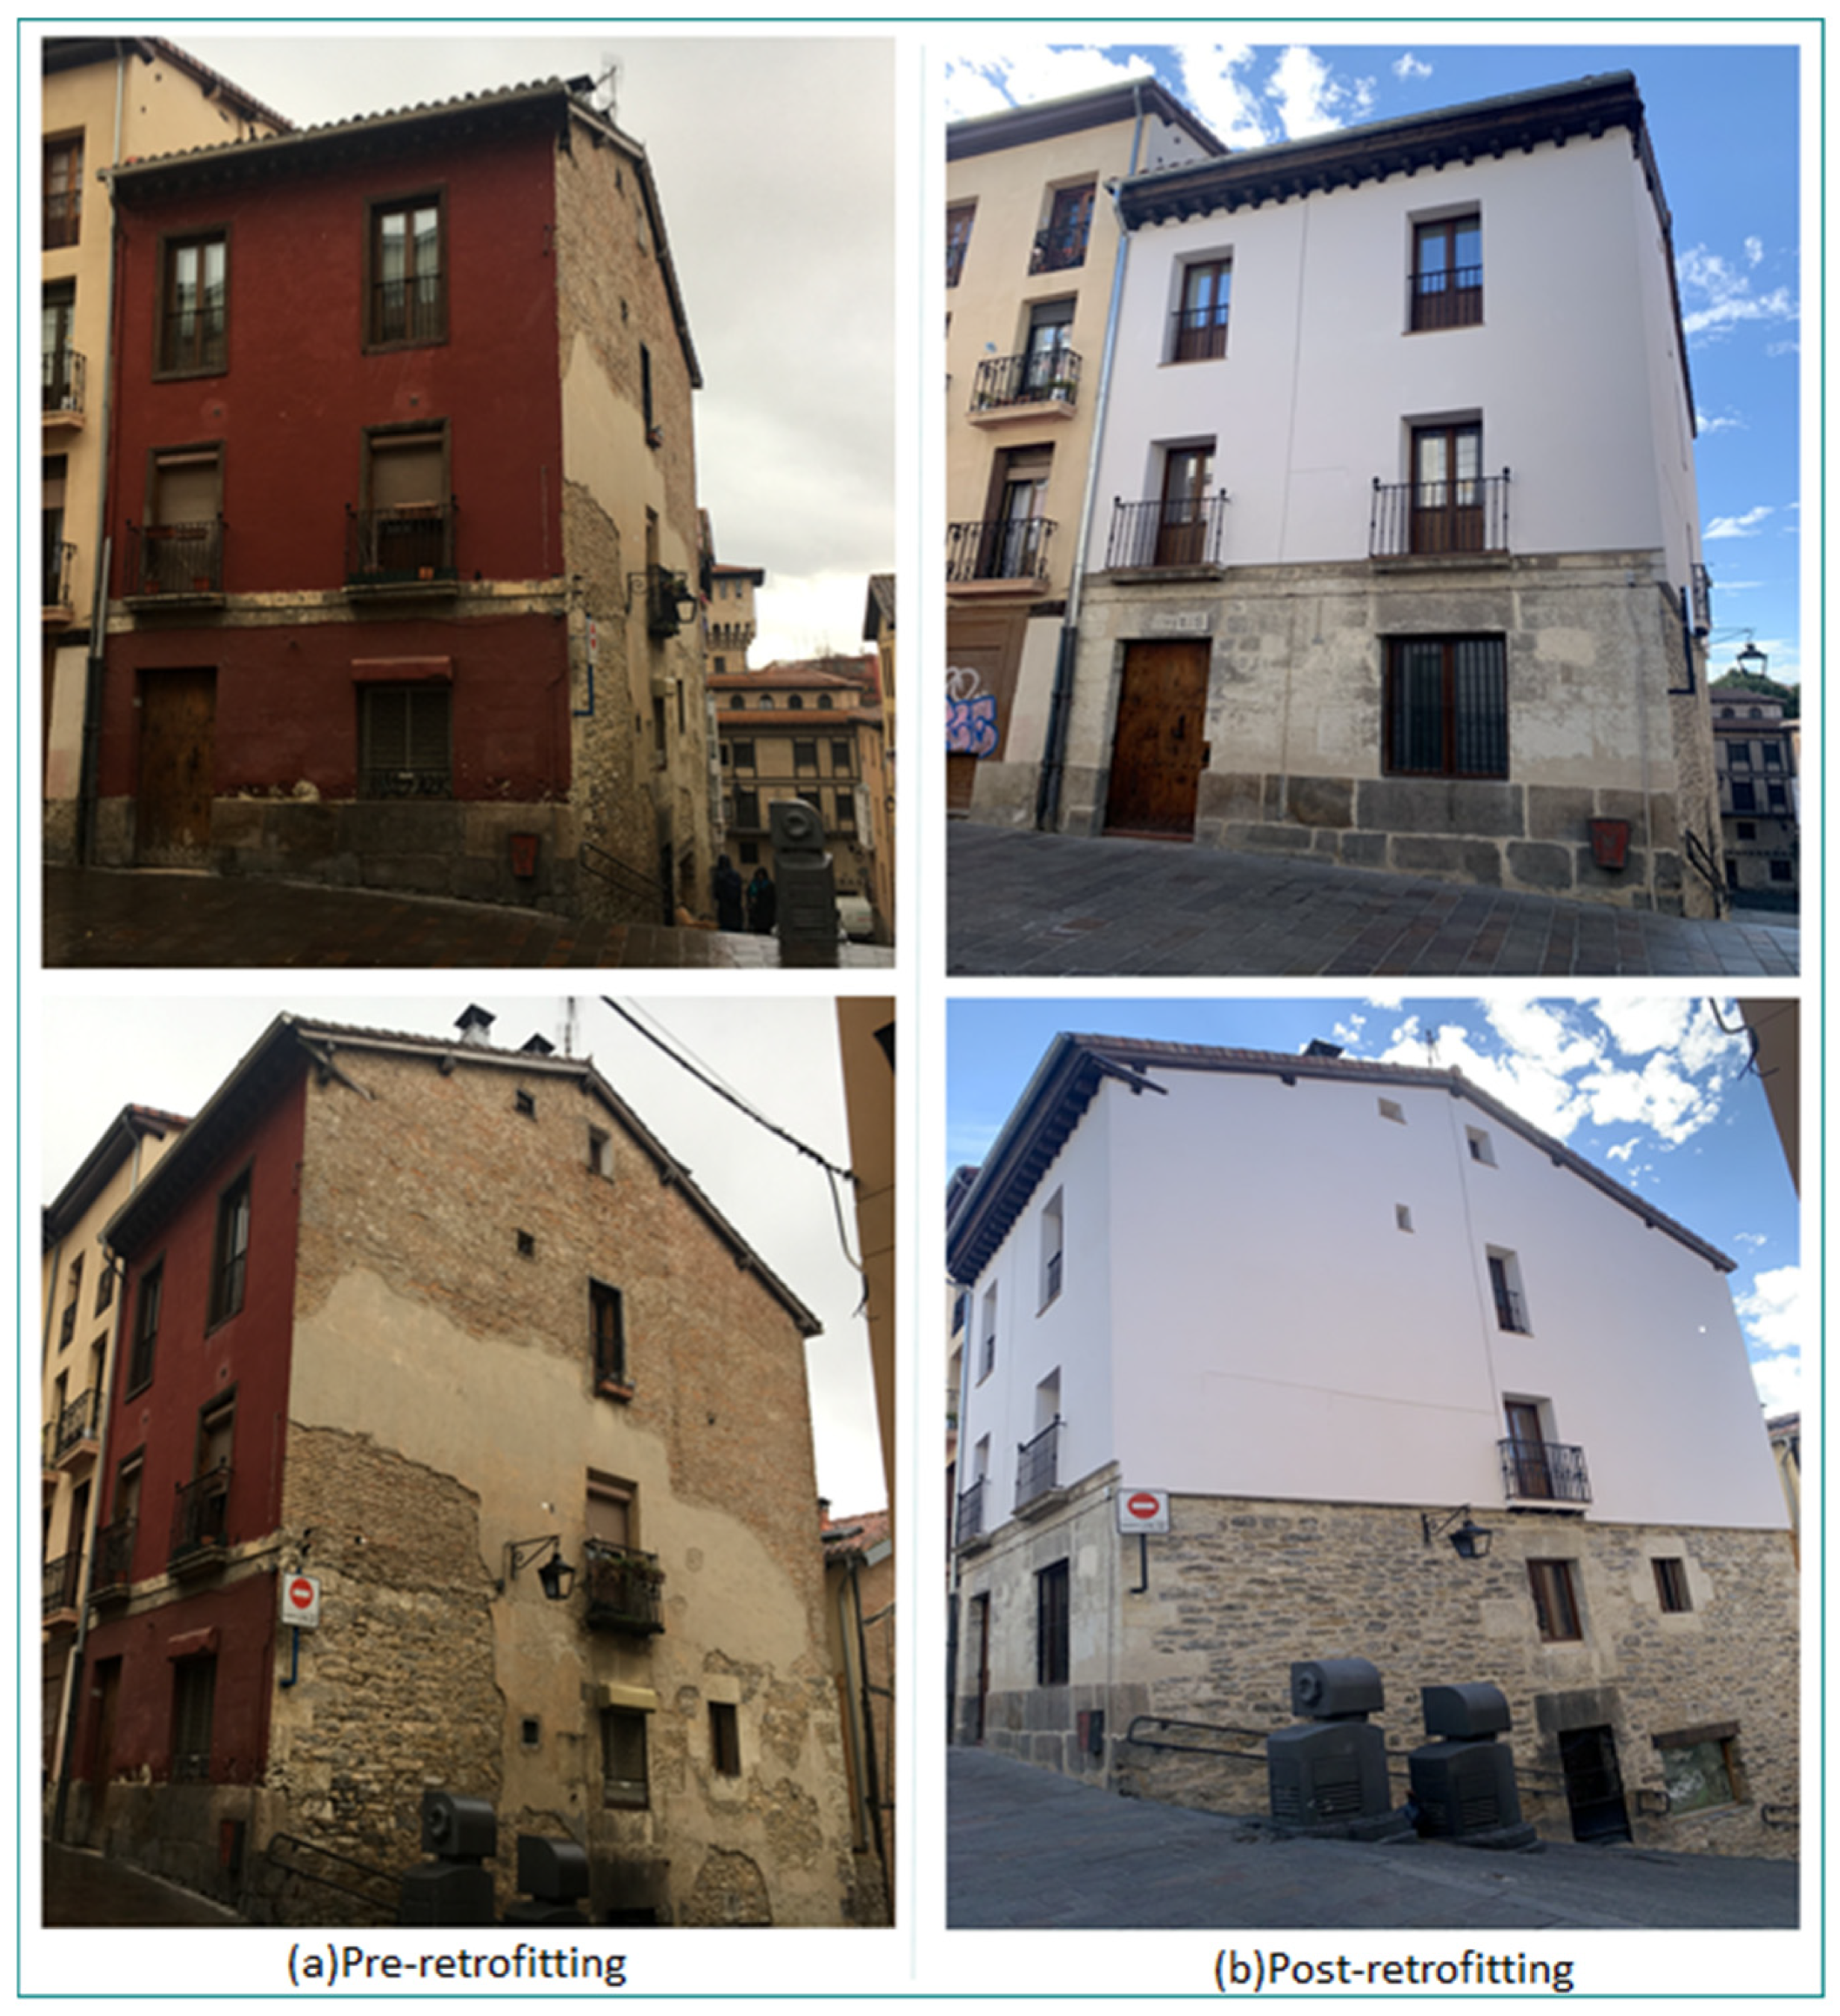
A critical gap exists not only in design-stage and simulation-based assessments but also in post-occupancy evaluations. Very few studies report long-term, real-use monitoring of MVHR systems in heritage dwellings, limiting opportunities for operational optimisation and lessons for future retrofits. This paper addresses this gap by presenting the results of an operational campaign covering 22 days across three seasons, with continuous MVHR operation, in a social heritage dwelling within a heritage-listed building in Vitoria-Gasteiz, northern Spain. The heritage dwelling was subject to a comprehensive energy retrofit, which was designed to preserve the building’s historical features while enhancing its thermal performance. Environmental monitoring data were collected and analysed to evaluate the system’s performance under real-use conditions, considering parameters such as carbon dioxide concentration, temperature, and relative humidity.
This study aims to provide a comprehensive operational assessment of an MVHR system installed in a heritage-listed dwelling that underwent an energy retrofit. By analysing real-time environmental data (CO2, temperature, and relative humidity) under actual occupancy conditions, the study demonstrates the applicability of MVHR systems to ensure indoor air quality while minimising heating energy demand in heritage contexts. This operational approach provides evidence to support sustainable retrofit strategies, helping building operators and designers optimise ventilation performance, maintain occupant comfort, and preserve the historical value of the heritage dwelling. The study addresses two critical dimensions of sustainable retrofit performance: indoor air quality, represented by CO2 concentration, and energy performance, represented by heat recovery efficiency. Both indicators are essential for assessing sustainability in heritage dwellings. By considering thermal recovery efficiency alongside indoor air quality, the analysis acknowledges that sustainable retrofit strategies must integrate energy and health-related aspects.
The academic contributions of this research are as follows:
- (a)
Empirical evaluation of MVHR performance in a heritage residential context under real-use conditions, addressing a gap in post-occupancy studies.
- (b)
Analysis of the interaction between occupancy patterns and indoor CO2 dynamics, providing insights for demand-oriented ventilation strategies.
- (c)
Evidence-based guidance for heritage building retrofits, supporting interventions that balance energy efficiency, indoor environmental quality, and conservation requirements.
- (d)
Provision of long-term evidence of the MVHR system’s effectiveness in heritage dwelling, demonstrating its capacity to meet current energy and health standards without compromising cultural value.
The structure of this paper is as follows:
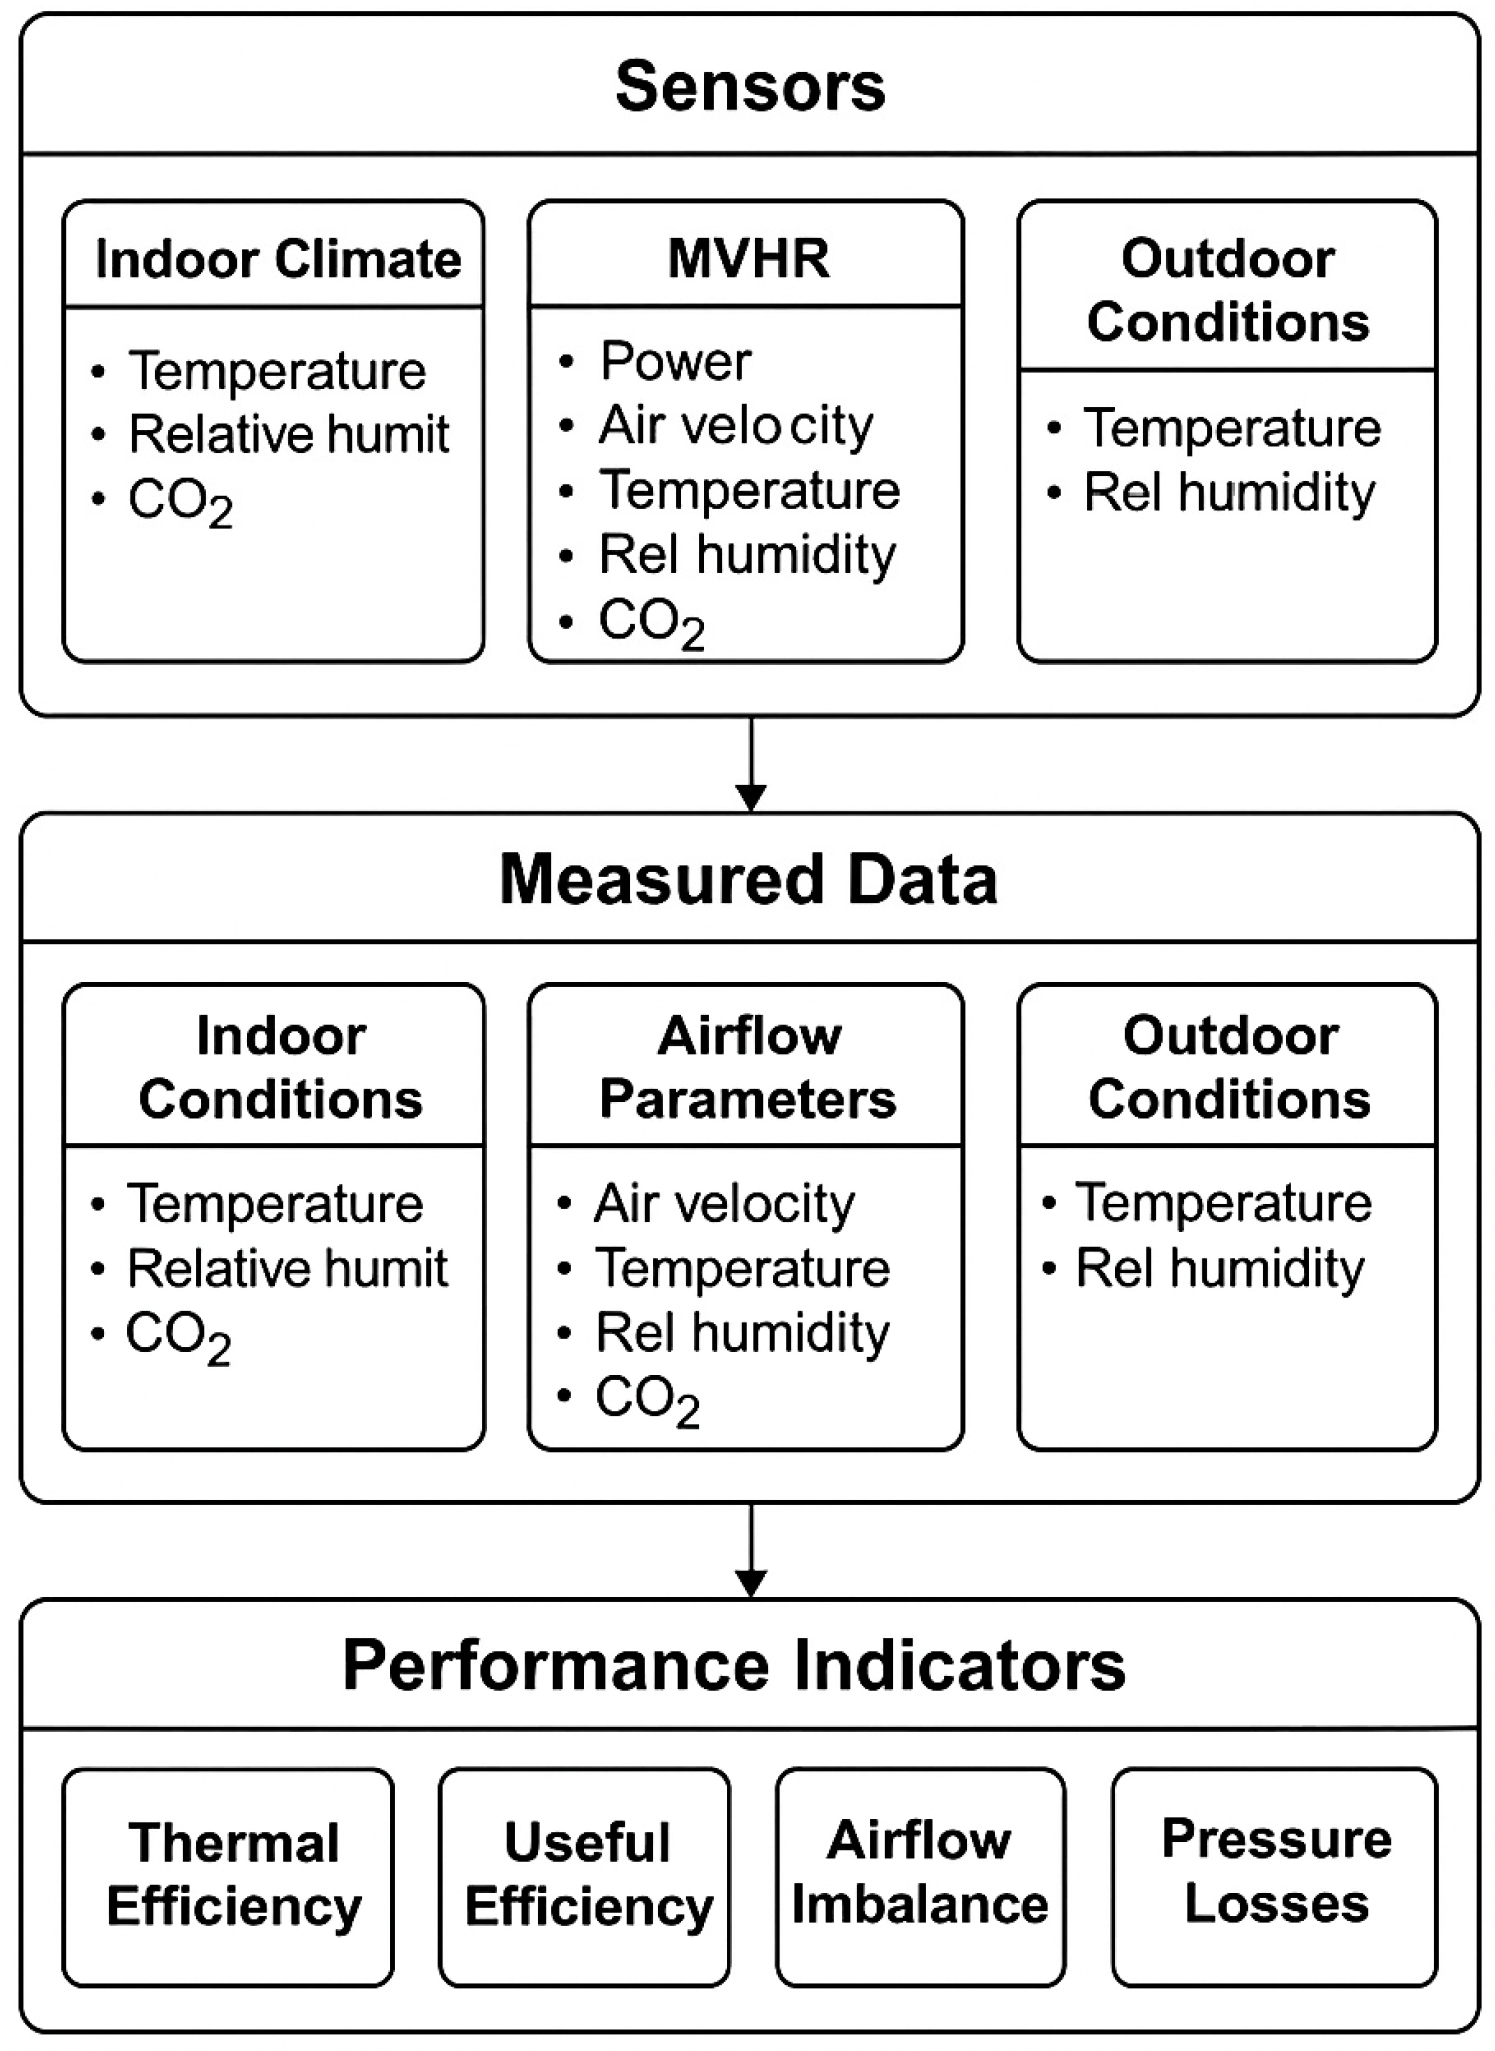
Section 2 provides a detailed description of the case study, encompassing the architectural characteristics of the heritage dwelling, the energy retrofit strategy, and the MVHR system configuration.
Section 3 provides a comprehensive overview of the monitoring setup and methodology.
Section 4 reports and discusses the operational performance of the MVHR system under real-world conditions, focusing on indoor air quality, temperature, and humidity trends in relation to occupancy.
Section 5 offers a concise overview of the key findings, emphasising their implications for sustainable heritage retrofits.
Related Work
MVHR systems have emerged as essential technologies for enhancing IAQ and improving energy efficiency in residential buildings, especially within the context of energy retrofits. Early investigations predominantly relied on theoretical assessments and simulation-based evaluations. For example, Garman et al. [
11] analysed the potential of MVHR systems in cold climates through dynamic simulations, emphasising reductions in heating energy demand exploring real operational performance.
Later studies shifted toward empirical evidence, capturing the behaviour of MVHR systems under actual operating conditions. Stamp et al. [
12] performed an experimental study on retrofitted housing in London, documenting seasonal variations in MVHR efficiency, although detailed analyses of user interactions and building-specific constraints were limited. Similarly, Hesaraki and Holmberg [
13] combined field measurements and simulations in Nordic climates, focusing on overall energy performance but overlooking the impacts of occupancy patterns and partial-load operations.
Recent studies, such as the one by Alhindawi et al. [
6] have conducted a seasonal evaluation of indoor air quality and thermal performance in naturally ventilated, airtight, energy-efficient dwellings. Their findings highlight that, even in the absence of mechanical ventilation systems, challenges related to maintaining adequate indoor air quality persist, especially during colder months when occupants tend to reduce natural ventilation to preserve thermal comfort. These results emphasise the importance of carefully balancing airtightness and ventilation strategies to ensure both energy efficiency and healthy indoor environments, a balance that becomes even more complex when dealing with retrofitting constraints in heritage buildings.
In the context of historic buildings, few works address the integration of MVHR systems from an operational perspective. Bartolucci et al. [
7] emphasised, through a review of energy efficiency strategies in historic buildings, the importance of implementing ventilation systems that maintain both high IAQ and the architectural integrity of heritage assets. Similarly, Robaerti et al. [
14] developed theoretical frameworks combining multi-objective optimisation and analytic hierarchy processes to guide MVHR integration into historic Italian buildings; however, their approach did not include post-occupancy monitoring to validate system performance under real operating conditions. Compared with these prior works—largely based on theoretical frameworks, catalogue values or design-stage assumptions—our study contributes post-occupancy operational evidence under heritage constraints. Specifically, we document (i) persistent supply–exhaust imbalance beyond the ±10% post-commissioning target, (ii) heritage-driven hydraulic penalties in the external duct runs (≈24–36 Pa in the exhaust path versus ≈2–5 Pa in supply), and (iii) IAQ outcomes that improve the mean yet still present daily CO
2 means >900–1000 ppm under high occupancy. This operational picture complements the strategic recommendations in Bartolucci et al. by showing that balancing, duct routing and spatially distributed demand control are first-order drivers of delivered performance in retrofitted heritage dwellings.
In contrast to previous research, which has focused on theoretical optimisation or high-level reviews, this study provides detailed operational evidence of MVHR in a retrofitted heritage dwelling. This is of particular importance as it addresses the lack of empirical data in this domain. By quantifying efficiency, pressure losses, and IAQ under actual conditions, the evidence base for sustainable heritage retrofits is strengthened.
In addition to technical standards such as ASHRAE 62.1, EN 16798-1 and CIBSE Guide C, heritage retrofits are guided by conservation frameworks including the ICOMOS Principles for the Conservation of Heritage Sites and Historic England’s guidance on energy efficiency in traditional dwellings. These documents highlight the need for reversible and minimally invasive interventions, reinforcing that the operational constraints observed in this study are not only technical but also regulatory. Our findings provide empirical evidence that complements such guidance by quantifying the performance penalties associated with heritage-constrained duct geometries and imbalanced airflow conditions.
The effectiveness of MVHR also depends on proper installation and operational tuning. White et al. [
15] showed that design–execution mismatches, such as misplacement of supply/exhaust terminals or incorrect airflow rates, can severely degrade performance, a problem particularly relevant in architecturally constrained environments. Hamid et al. [
16] further demonstrated that occupancy-driven ventilation modes, like boost functions, have a significant impact on both energy use and CO
2 concentrations.
Further research has examined the socio-technical and comfort-related aspects of the operation of MVHR, which are of particular significance in the context of heritage retrofits. In such cases, architectural and spatial constraints have been shown to exacerbate the challenges associated with the implementation of MVHR. Berneiser et al. [
17] emphasised that the long-term acceptance of mechanical ventilation systems is influenced not only by technical performance but also by user attitudes, perceived comfort, and trust in the technology. Concurrently, Ouis et al. [
18] conducted a review of noise emissions from ventilation systems, asserting that acoustic disturbances persist as a primary source of dissatisfaction and have the potential to compromise the efficacy of ventilation, particularly in residential settings where retrofitting constraints limit the options for effective sound insulation.
Occupancy sensing via environmental monitoring has attracted increasing interest, driven by the potential for optimising building energy management and ensuring occupant comfort. Passive, indirect methods, particularly those based on CO2 concentration monitoring, have been extensively studied as proxies for human presence, alongside auxiliary indicators such as temperature and humidity.
Initial research on occupancy estimation predominantly utilized physics-based models grounded in mass balance equations. Wei et al. [
19] evaluated both steady-state and dynamic modelling approaches based on CO
2 concentrations, applying them to simulations of spaces such as small offices and large conference rooms. Their study compared physical and statistical methods, highlighting trade-offs between simplicity, responsiveness, and estimation accuracy. Rather than focusing solely on energy-saving potentials, they assessed the feasibility of CO
2-based methods for real-time occupancy prediction.
Experimental studies under real-world conditions have also explored the relationship between indoor CO
2 concentrations and building ventilation performance. Grygierek and Ferdyn-Grygierek [
20] conducted a summer-long experimental campaign in a single-family test house, using in situ measurements of metabolic CO
2. Although occupancy was controlled and monitored, the primary aim was to develop a method to create specific occupancy prediction models. Their results nonetheless reinforced the close link between indoor CO
2 dynamics, occupant presence, and ventilation effectiveness.
Sensor placement plays a critical role in enhancing the accuracy of CO
2-based environmental monitoring for occupancy-related applications. Pei et al. [
21] investigated the impact of sensor placement in mechanically ventilated spaces, finding that in mixing ventilation systems, sensors installed at exhaust vents provide more accurate predictions of breathing-zone CO
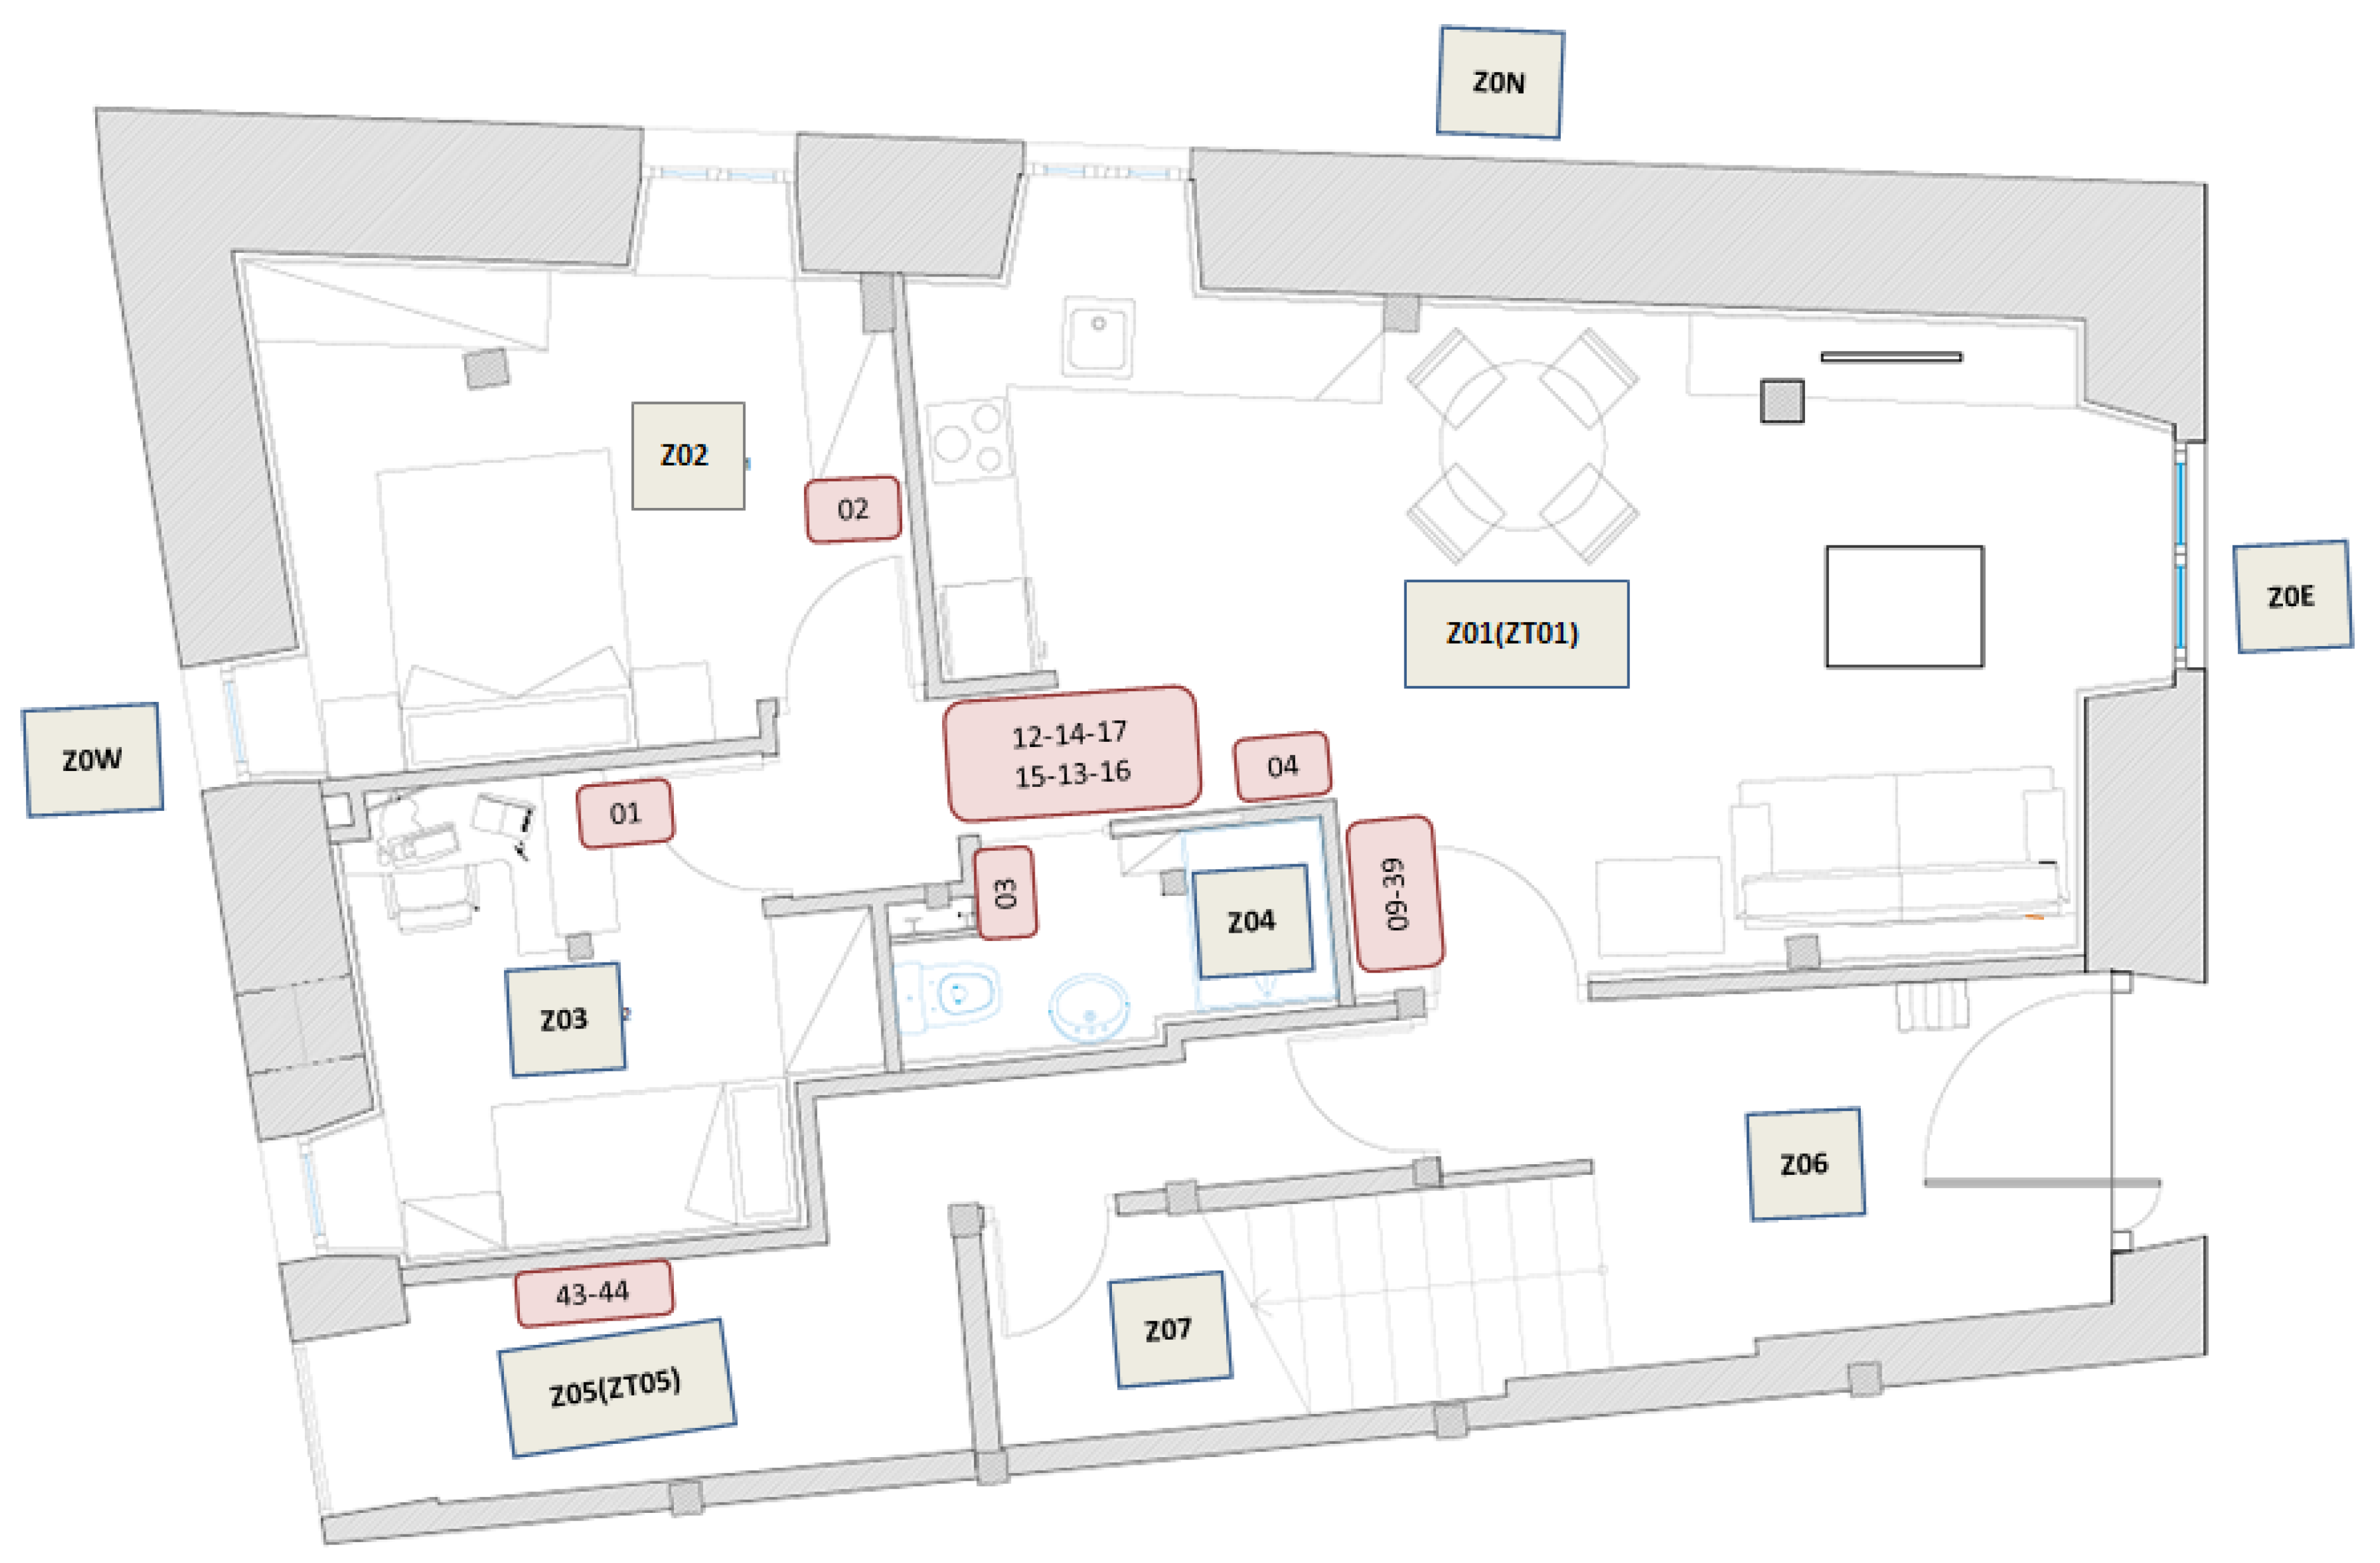
2 concentrations. Conversely, in displacement ventilation systems, wall-mounted sensors at occupant breathing height yield better results. Our study (see
Section 3) corroborates these findings, emphasising that strategic sensor placement is essential for improving the reliability of occupancy estimation in mechanically ventilated environments.
Comprehensive reviews by Rueda et al. [
22], Chen et al. [
23] and Song & Calautit et al. [
24] detailed syntheses of the evolution of environmental-based occupancy detection technologies. These works systematically highlight the trade-offs among modelling complexity, data collection and processing demand, and the feasibility of deploying such systems in real-world building environments.
The technical benefits of MVHR systems are well established, nevertheless there is still a shortage of long-term empirical studies examining their operational behaviour in dwellings of heritage buildings. Furthermore, a few studies have addressed occupancy estimation, indoor air quality (IAQ) and ventilation system performance simultaneously under real-world, post-retrofit conditions. This research addresses this issue by integrating environmental monitoring, occupancy inference and system analysis in a heritage dwelling that has been retrofitted for energy efficiency.
4. Results and Discussion
This section presents the results of the performance evaluation of the MVHR system installed in the ground-floor (F0) dwelling. The analysis focuses on twenty-two days of monitored operation during 2021. The selection of these days was made on the basis that both the supply and exhaust fans were operating continuously at their standard settings. This ensured the stability of system performance. This selection enables a representative evaluation of the system’s performance under typical real-use conditions.
Table 2 summarizes the operating periods of the ventilation system during selected 22 days in 2021, identified through cross-referencing the fan power profiles and airflow measurements in the F0 dwelling.
Table 3 compiles the physical and geometrical constants used in KPI estimation, including air density, specific heat capacity, and duct dimensions. These values form the basis for consistent thermodynamic calculations across the dataset.
Table 4 shows the mean values of indoor and outdoor environmental conditions, including air temperature, relative humidity, and CO
2 concentrations. These averages provide insight into the prevailing conditions during the analysis window and establish context for assessing system effectiveness [
28].
Table 5 details the monitored performance of the ventilation unit itself, including temperature and velocity measurements at various duct points, as well as fan power consumption. This data serves as the raw input for KPI estimation [
28].
Table 6 summarizes the key performance metrics derived from the monitoring campaign. These include thermal recovery efficiency, useful energy efficiency, airflow imbalance ratio, and thermal power recovery, offering a comprehensive assessment of system performance under real operating conditions.
Table 7 presents the calculated airflow velocities and volumetric flows in the external ducts, both for the supply and exhaust paths. This information enables verification of compliance with ASHRAE 62.1 [
27] requirements regarding flow balance and proper ventilation rates.
Table 8 shows the estimated pressure losses in the external duct network due to both friction and local resistances. These losses are relevant for understanding the increased electrical demand observed in the fans, particularly in retrofit contexts involving long or complex duct routing.
Table 9 provides statistical descriptors (mean, standard deviation, min, max) for all physical variables and calculated KPIs over the operational period. This allows for evaluation of variability and consistency in system behaviour.
The integrated analysis demonstrates that, while the MVHR system exhibited acceptable performance regarding thermal efficiency and flow balance, the pressure losses induced by the extended external ductwork contributed significantly to increased fan energy use. These findings underscore the significance of meticulous duct routing in heritage retrofits and substantiate the pertinence of the multi-sensor monitoring approach utilised in this study.
Table 2.
Studied periods where ventilation system was turned on in F0 dwelling.
Table 2.
Studied periods where ventilation system was turned on in F0 dwelling.
| Date | Start Hour | End Hour | Operating Time [min] |
|---|
| 31 March 2021 | 9:52 | 16:46 | 415 |
| 3 April 2021 | 9:55 | 21:11 | 677 |
| 6 April 2021 | 15:16 | 20:40 | 325 |
| 8 April 2021 | 9:31 | 21:19 | 709 |
| 9 April 2021 | 18:00 | 20:41 | 162 |
| 10 April 2021 | 9:36 | 15:06 | 331 |
| 11 April 2021 | 15:34 | 16:04 | 31 |
| 14 April 2021 | 9:40 | 16:29 | 140 |
| 14 April 2021 | 19:50 | 22:09 | 410 |
| 25 April 2021 | 18:44 | 20:39 | 116 |
| 27 April 2021 | 9:23 | 21:38 | 736 |
| 5 November 2021 | 11:39 | 11:51 | 13 |
| 7 November 2021 | 11:29 | 17:30 | 362 |
| 12 November 2021 | 16:45 | 19:59 | 195 |
| 14 November 2021 | 9:57 | 20:01 | 605 |
| 20 November 2021 | 14:05 | 14:54 | 50 |
| 22 November 2021 | 9:06 | 10:00 | 55 |
| 30 November 2021 | 11:14 | 11:29 | 16 |
| 12 December 2021 | 10:52 | 20:09 | 558 |
| 16 December 2021 | 14:17 | 18:37 | 261 |
| 17 December 2021 | 9:04 | 12:06 | 183 |
| 25 December 2021 | 10:42 | 12:00 | 79 |
The operational behaviour of the MVHR system was evaluated over a set of selected days in 2021, during which the system remained continuously active. The analysis is structured around three key performance indicators (KPIs): thermal efficiency, electrical consumption and energy recovery performance. These indicators are defined in
Section 3. To ensure consistent interpretation of the monitored values, the physical and geometrical constants utilised in the calculations are outlined in
Table 3. These constants include air density, specific heat capacity, and duct dimensions.
Table 3.
Physical and geometrical constants.
Table 3.
Physical and geometrical constants.
| ρa [kg/m3] | Ca [kJ/kgK] | Dduct_xy [m] | Dduct_z [m] | Aduct_xy [m] | Aduct_z
[m] | Lduct_xy [m] | Ldcut_z
[m] |
|---|
| 1.22 | 1.01 | 0.13 | 0.25 | 0.01 | 0.05 | 8.50 | 9.60 |
As illustrated in
Table 4, the mean environmental conditions during each operating period are presented, both in indoor and outdoor settings. The findings indicate that the indoor air temperature maintained a relatively stable range of 22–23 °C, while outdoor temperatures exhibited significant fluctuations. The concentrations of indoor carbon dioxide (CO
2) ranged from 480 to 1000 parts per million (ppm), with several instances of exceedances of the commonly recommended thresholds for indoor air quality (IAQ) (e.g., 900 ppm). This confirms that IAQ performance was not uniform across the campaign, with distinct differences between seasons (
Figure 7 and
Figure 8). Importantly, although the global dataset mean remained below 650 ppm, two days (14 April 2021 and 5 November 2021) daily averages surpassed 900 ppm during autumn and winter. As
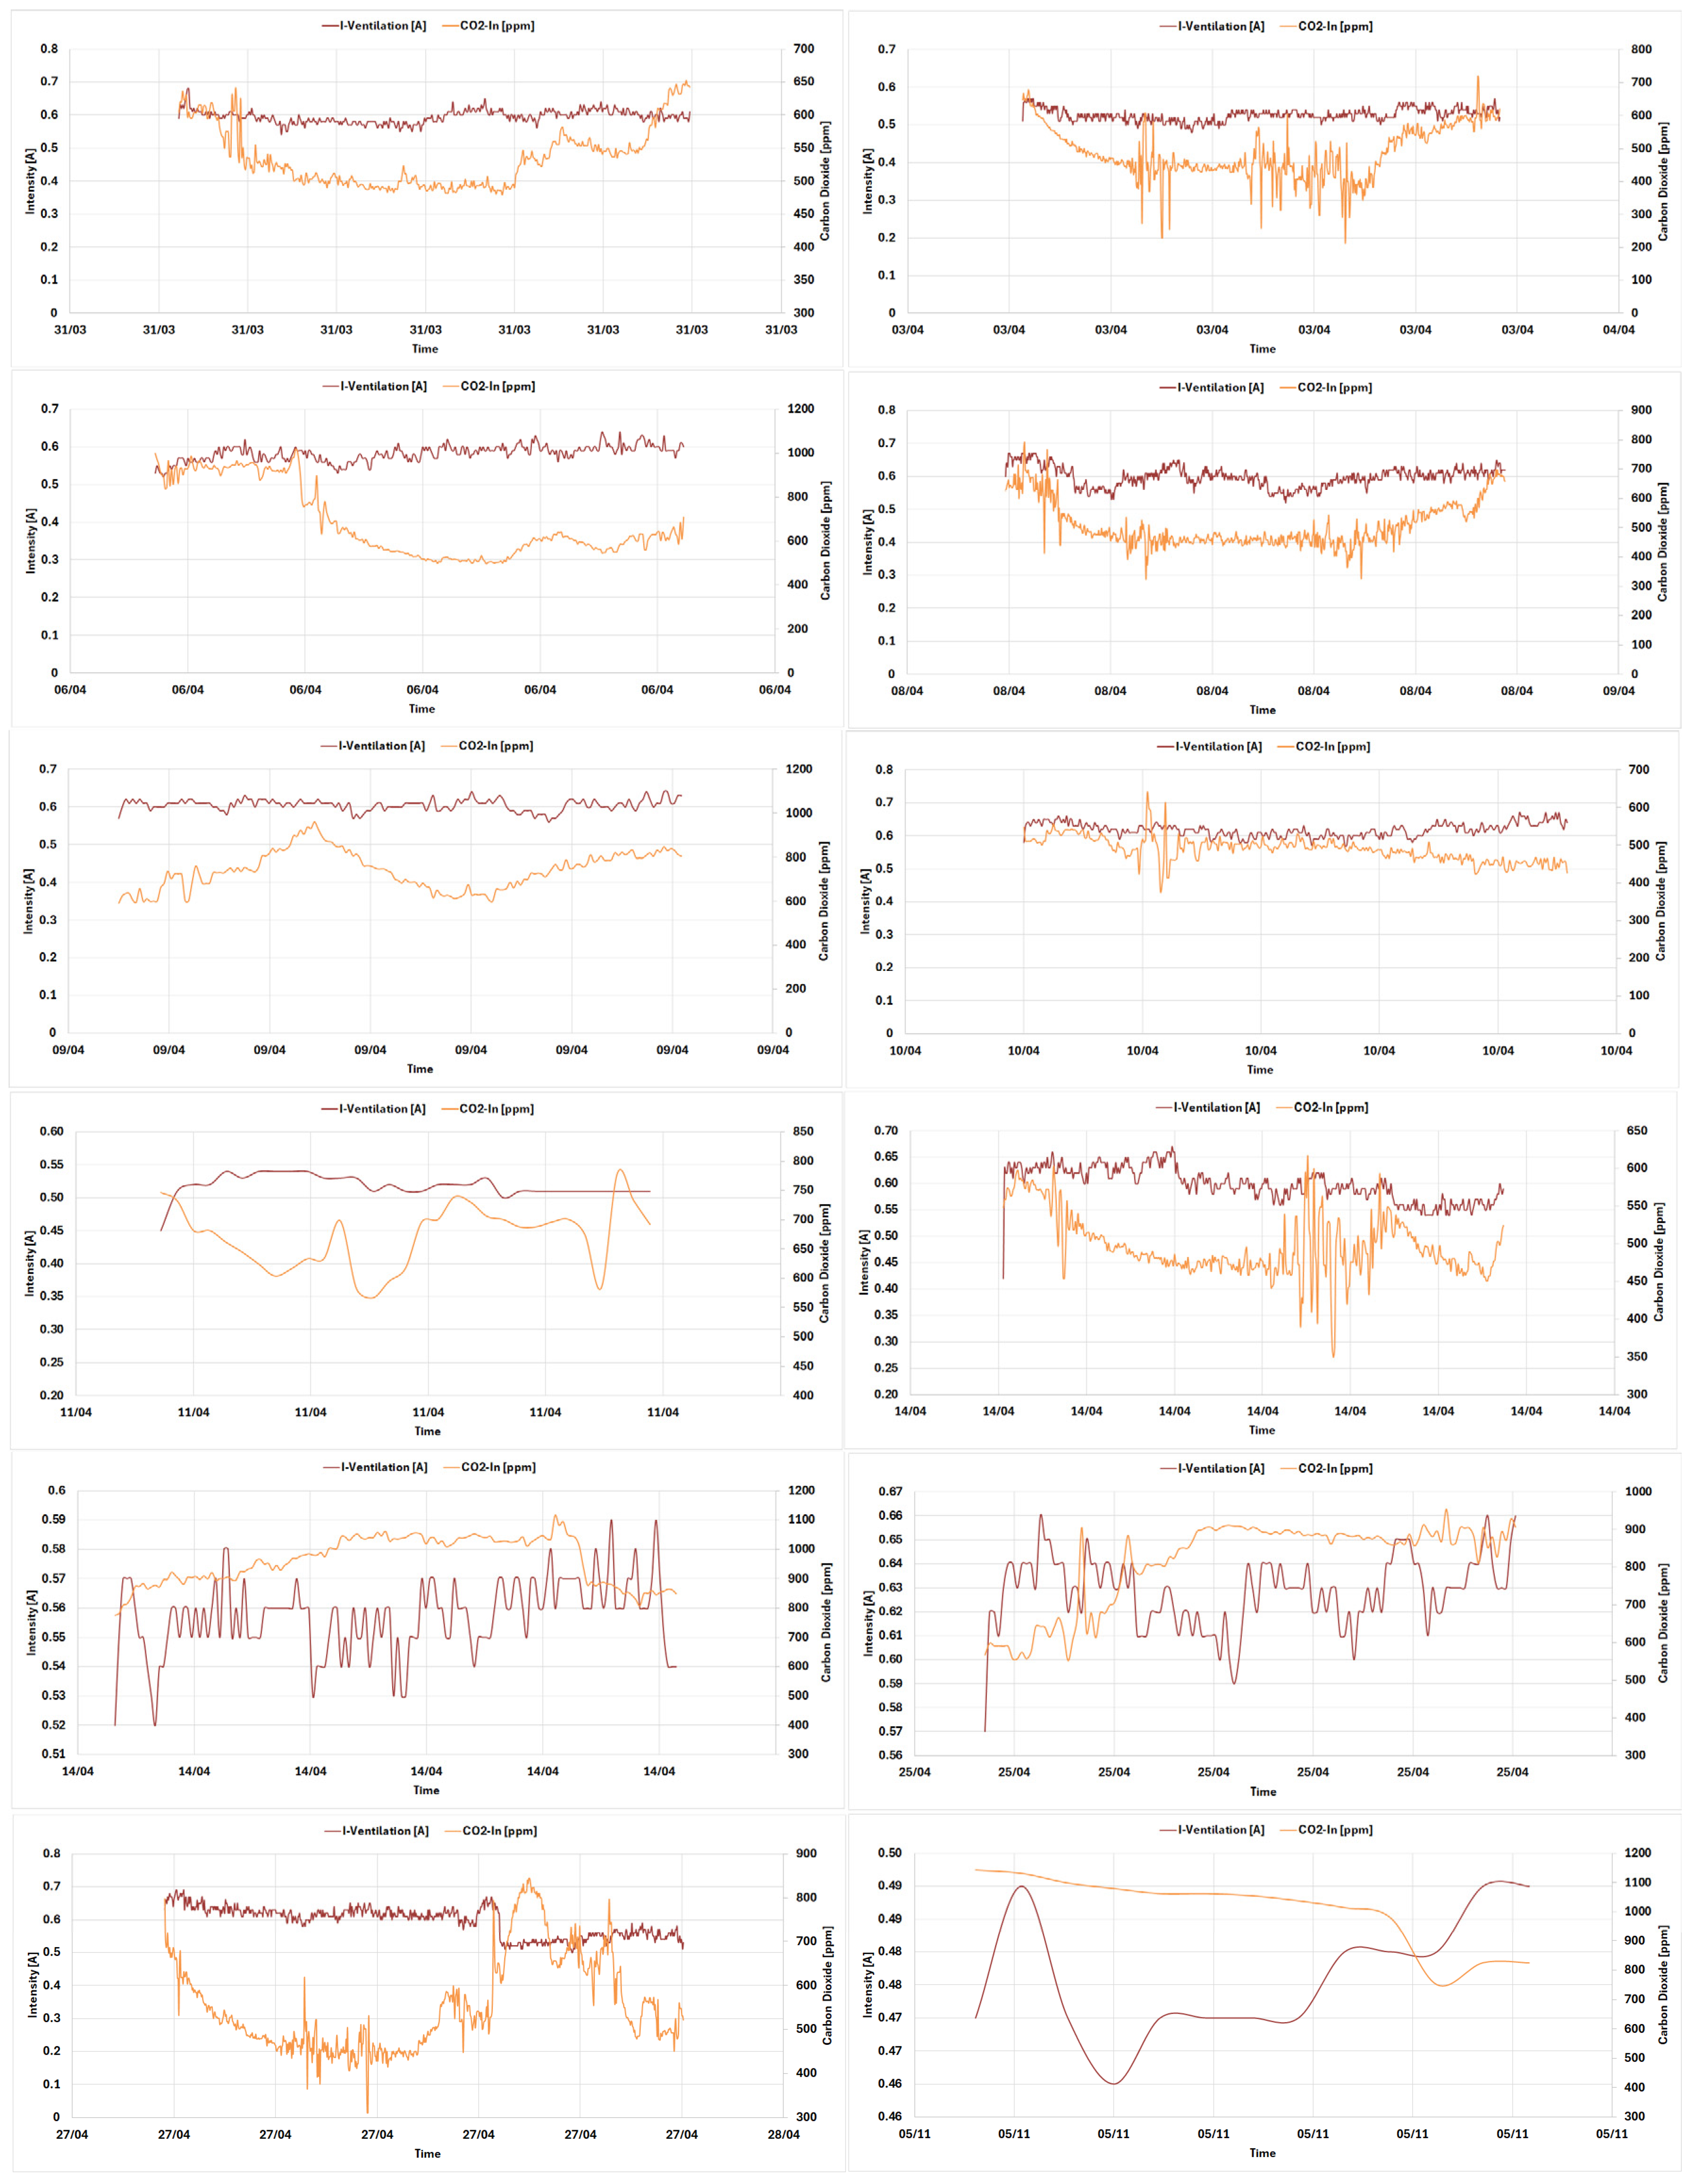
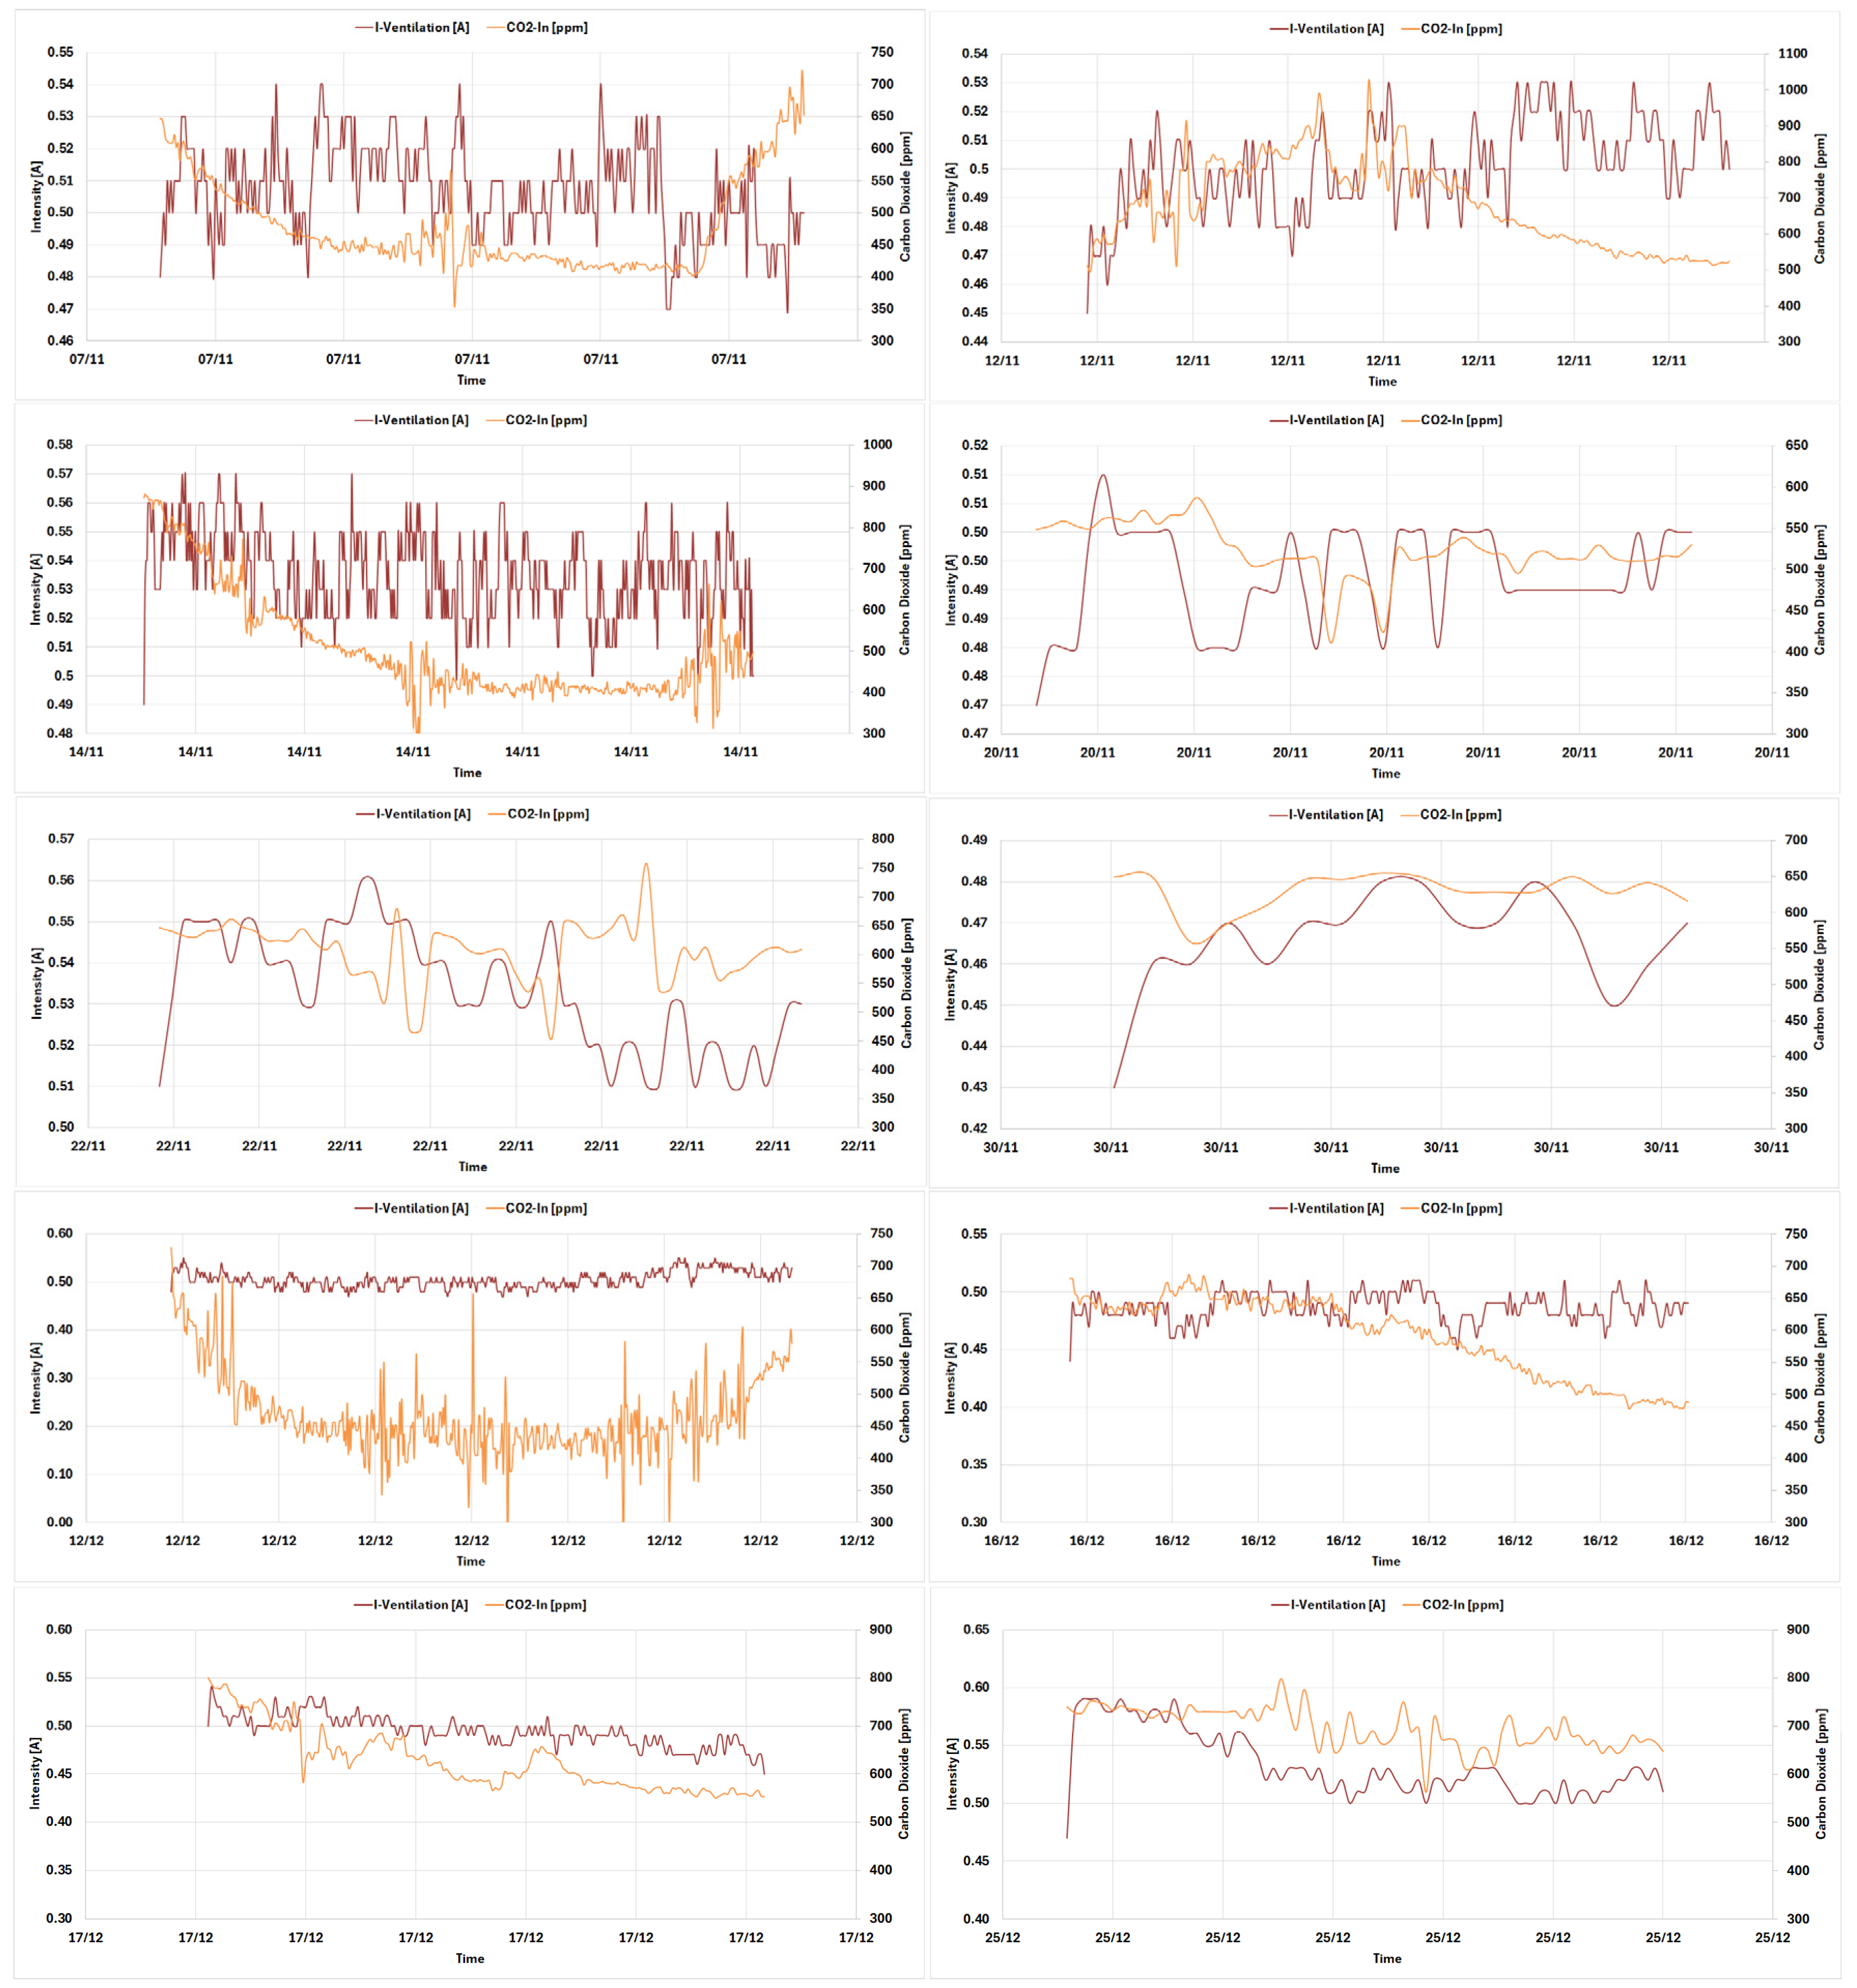
Figure 7 shows, both days had an increase in dwelling occupancy of more than 1000 ppm, being unable to improve the indoor air quality despite the MVHR being in operation. This reflects reduced window airing and higher occupancy intensity in colder periods, underlining the relevance of demand-controlled ventilation strategies.
Table 4.
Physical variables’ average of indoor and outdoor air of F0 dwelling.
Table 4.
Physical variables’ average of indoor and outdoor air of F0 dwelling.
| Date | Ta-Out
Average
[C] | RHOut
Average
[%] | CO2-Out
Average [ppm] | Vwind-Out
Average [m/s] | Ta-In
Average
[C] | CO2-In
Average [ppm] | RHIn
Average
[%] |
|---|
| 31 March 2021 | 10.70 | 77.00 | 410.69 | 0.00 | 22.91 | 535.13 | 40.58 |
| 3 April 2021 | 10.70 | 77.00 | 401.35 | 0.00 | 22.66 | 485.42 | 43.55 |
| 6 April 2021 | 0.00 | 70.64 | 414.12 | 0.00 | 22.45 | 683.72 | 40.07 |
| 8 April 2021 | 6.00 | 52.30 | 404.45 | 1.10 | 22.58 | 507.61 | 35.52 |
| 9 April 2021 | 6.00 | 52.30 | 403.91 | 1.10 | 22.75 | 740.77 | 41.85 |
| 10 April 2021 | 6.00 | 52.30 | 405.62 | 1.10 | 22.58 | 488.84 | 43.64 |
| 11 April 2021 | 6.00 | 52.30 | 410.15 | 1.10 | 22.53 | 671.80 | 43.12 |
| 14 April 2021 | 6.00 | 52.30 | 432.00 | 1.10 | 23.67 | 960.50 | 39.61 |
| 14 April 2021 | 6.00 | 52.30 | 410.37 | 1.10 | 22.63 | 496.88 | 37.37 |
| 25 April 2021 | 6.00 | 52.30 | 411.15 | 1.10 | 21.90 | 812.30 | 57.13 |
| 27 April 2021 | 6.00 | 52.30 | 413.50 | 1.10 | 22.64 | 554.44 | 49.27 |
| 5 November 2021 | 6.91 | 88.09 | 453.92 | 1.21 | 23.22 | 1004.96 | 47.57 |
| 7 November 2021 | 8.81 | 87.36 | 418.38 | 2.09 | 22.48 | 478.60 | 42.57 |
| 12 November 2021 | 11.35 | 91.27 | 443.52 | 2.05 | 22.36 | 682.18 | 46.64 |
| 14 November 2021 | 9.97 | 90.26 | 417.95 | 2.56 | 22.43 | 507.35 | 48.73 |
| 20 November 2021 | 10.15 | 78.17 | 446.49 | 1.92 | 22.38 | 523.64 | 40.51 |
| 22 November 2021 | 5.32 | 87.73 | 413.45 | 1.58 | 22.36 | 605.75 | 42.52 |
| 30 November 2021 | 10.44 | 77.63 | 415.91 | 0.48 | 22.31 | 629.57 | 43.97 |
| 12 December 2021 | 11.82 | 80.09 | 419.14 | 0.91 | 22.36 | 467.11 | 43.66 |
| 16 December 2021 | 4.99 | 90.87 | 480.09 | 1.05 | 22.16 | 590.42 | 38.20 |
| 17 December 2021 | 6.30 | 99.71 | 469.79 | 0.85 | 22.09 | 626.55 | 37.21 |
| 25 December 2021 | 10.80 | 82.74 | 402.81 | 1.46 | 22.39 | 696.27 | 45.37 |
The raw measurements of the ventilation system’s physical variables, air temperatures, velocities, humidity levels, CO
2 concentrations, and accumulated fan energy consumption, are displayed in
Table 5. These values constitute the direct input for the KPI calculations. It is noteworthy that the velocity measurements in the exhaust ducts were systematically higher than those in the supply ducts, indicating a persistent flow imbalance that affects overall system performance.
Table 5.
Average and accumulated values of ventilation system’s physical variables of F0 dwelling.
Table 5.
Average and accumulated values of ventilation system’s physical variables of F0 dwelling.
| Date | Ta-SupExt Average
[C] | Ta-ExhExt Average [C] | Ta-SupInt
Average [C] | Ta-ExhInt Average [C] | Va-SupExt_xy Average
[m/s] | Va-ExhExt_xy Average
[m/s] | CO2-SupIn Average [ppm] | CO2-ExhInt Average [ppm] | RHSupExt Average [%] | RHExhExt Average [%] | RHSupInt Average [%] | RHExhInt Average [%] | Pe-Ventilation
Accumulated [kWh] |
|---|
| 31 March 2021 | 19.72 | 20.92 | 20.56 | 21.12 | 1.39 | 3.47 | 462.12 | 455.71 | 41.53 | 41.55 | 42.22 | 37.95 | 0.50 |
| 3 April 2021 | 19.43 | 20.96 | 21.09 | 21.51 | 1.07 | 3.47 | 413.12 | 421.92 | 47.06 | 45.20 | 44.58 | 41.28 | 0.72 |
| 6 April 2021 | 17.82 | 19.43 | 19.81 | 20.24 | 1.45 | 3.44 | 511.76 | 491.81 | 45.91 | 43.86 | 42.53 | 39.50 | 0.39 |
| 8 April 2021 | 17.77 | 19.14 | 18.96 | 19.51 | 1.41 | 3.46 | 436.15 | 451.33 | 41.95 | 39.55 | 39.71 | 37.53 | 0.86 |
| 9 April 2021 | 18.21 | 19.49 | 19.13 | 19.72 | 1.44 | 3.45 | 494.83 | 492.29 | 46.55 | 44.82 | 45.41 | 42.17 | 0.20 |
| 10 April 2021 | 18.25 | 19.59 | 19.28 | 19.86 | 1.42 | 3.42 | 425.06 | 441.19 | 49.70 | 47.20 | 47.64 | 44.71 | 0.41 |
| 11 April 2021 | 18.34 | 19.80 | 19.87 | 20.31 | 1.04 | 3.34 | 500.97 | 474.21 | 49.78 | 48.76 | 48.22 | 43.93 | 0.03 |
| 14 April 2021 | 17.96 | 19.66 | 19.93 | 20.36 | 1.07 | 3.48 | 632.19 | 532.34 | 43.40 | 43.87 | 43.13 | 37.61 | 0.16 |
| 14 April 2021 | 17.47 | 18.89 | 18.89 | 19.40 | 1.42 | 3.43 | 427.37 | 437.41 | 43.44 | 41.90 | 41.85 | 38.58 | 0.50 |
| 25 April 2021 | 19.77 | 21.10 | 20.85 | 21.40 | 1.42 | 3.35 | 607.27 | 645.53 | 50.97 | 49.12 | 49.29 | 45.91 | 0.15 |
| 27 April 2021 | 19.32 | 20.81 | 20.87 | 21.34 | 1.32 | 3.37 | 449.71 | 455.89 | 52.42 | 50.00 | 49.46 | 46.18 | 0.88 |
| 5 November 2021 | 16.46 | 17.89 | 18.42 | 18.79 | 1.33 | 3.80 | 556.19 | 490.56 | 51.17 | 52.27 | 50.39 | 44.52 | 0.01 |
| 7 November 2021 | 16.86 | 18.13 | 18.14 | 18.66 | 1.36 | 3.88 | 429.49 | 439.80 | 50.33 | 48.85 | 48.50 | 45.00 | 0.37 |
| 12 November 2021 | 17.67 | 18.82 | 18.63 | 19.17 | 1.36 | 3.85 | 515.77 | 491.83 | 53.23 | 52.01 | 52.22 | 48.48 | 0.20 |
| 14 November 2021 | 17.59 | 18.88 | 18.86 | 19.38 | 1.37 | 3.88 | 436.14 | 448.02 | 55.59 | 54.07 | 53.77 | 49.84 | 0.66 |
| 20 November 2021 | 16.39 | 17.74 | 18.10 | 18.54 | 1.35 | 3.81 | 445.66 | 447.26 | 49.06 | 47.60 | 46.44 | 43.18 | 0.05 |
| 22 November 2021 | 15.91 | 17.33 | 17.58 | 18.07 | 1.41 | 3.89 | 440.32 | 435.53 | 50.02 | 48.95 | 47.81 | 43.96 | 0.06 |
| 30 November 2021 | 15.23 | 16.49 | 16.60 | 17.05 | 1.34 | 3.86 | 483.74 | 482.01 | 54.08 | 52.21 | 51.39 | 48.46 | 0.02 |
| 12 December 2021 | 16.43 | 17.77 | 17.97 | 18.45 | 1.37 | 3.86 | 418.02 | 443.95 | 55.92 | 52.62 | 51.83 | 49.44 | 0.57 |
| 16 December 2021 | 14.17 | 15.73 | 16.11 | 16.59 | 1.41 | 3.86 | 490.52 | 499.15 | 49.12 | 47.22 | 46.08 | 42.62 | 0.25 |
| 17 December 2021 | 13.46 | 15.10 | 15.60 | 16.07 | 1.39 | 3.84 | 486.23 | 494.38 | 47.70 | 46.04 | 44.57 | 40.97 | 0.18 |
| 25 December 2021 | 16.17 | 17.51 | 17.58 | 18.10 | 1.56 | 4.02 | 489.26 | 503.30 | 54.17 | 52.70 | 52.06 | 48.13 | 0.08 |
The calculated performance indicators are summarised in
Table 6, including apparent thermal efficiency (ξ
thermal,app), total useful efficiency (η
tot), and supply/exhaust energy recovery. The results obtained demonstrate a mean thermal efficiency of 0.74 (10th–90th percentile: 0.59–0.88), and a total useful efficiency (η
tot), close to unity. These values are below the catalogue specifications but consistent with expectations under real operating conditions with heritage-imposed constraints.
The investigation revealed that flow imbalance emerged as a predominant factor affecting both thermal efficiency and energy use in the installation that was the subject of the study. As demonstrated in
Table 6, the imbalance ratio ranged from 3.66% to 67.33%, with a mean of 23.41%. These values exceed the post-commissioning limits recommended by ASHRAE 62.1 [
27], which advises supply and exhaust flow rates to remain within 10% of each other.
Table 6.
Studied KPI of the F0 dwelling’s ventilation systems: accumulated energies, efficiency and imbalance values.
Table 6.
Studied KPI of the F0 dwelling’s ventilation systems: accumulated energies, efficiency and imbalance values.
| Date | Pe-Ventilation
Accumulated [kWh] | QExh
Accumulated [kWh]
(Equation (6)) | QSup
Accumulated [kWh]
(Equation (7)) | ηuseful_Exh
(Equation (2)) | ηuseful_Sup
(Equation (3)) | ηtot
(Equation (4)) | ξthermal,app (Equation (1)) | Imbalance
[%]
(Equation (8)) |
|---|
| 31 March 2021 | 0.50 | 0.07 | 0.12 | 0.24 | 0.15 | 0.39 | 0.81 | 66.69 |
| 3 April 2021 | 0.72 | 0.32 | 0.30 | 0.41 | 0.45 | 0.86 | 0.87 | 7.17 |
| 6 April 2021 | 0.39 | 0.22 | 0.23 | 0.60 | 0.58 | 1.19 | 0.88 | 3.66 |
| 8 April 2021 | 0.86 | 0.23 | 0.30 | 0.34 | 0.27 | 0.61 | 0.78 | 29.06 |
| 9 April 2021 | 0.20 | 0.03 | 0.05 | 0.27 | 0.16 | 0.43 | 0.78 | 67.33 |
| 10 April 2021 | 0.41 | 0.08 | 0.12 | 0.29 | 0.18 | 0.47 | 0.80 | 58.27 |
| 11 April 2021 | 0.03 | 0.01 | 0.01 | 0.39 | 0.42 | 0.81 | 0.84 | 6.85 |
| 14 April 2021 | 0.16 | 0.08 | 0.07 | 0.46 | 0.53 | 0.99 | 0.79 | 12.11 |
| 14 April 2021 | 0.50 | 0.18 | 0.21 | 0.42 | 0.36 | 0.78 | 0.78 | 14.56 |
| 25 April 2021 | 0.15 | 0.03 | 0.04 | 0.30 | 0.19 | 0.49 | 0.93 | 56.48 |
| 27 April 2021 | 0.88 | 0.33 | 0.38 | 0.43 | 0.38 | 0.81 | 0.89 | 14.84 |
| 5 November 2021 | 0.01 | 0.01 | 0.01 | 0.71 | 0.94 | 1.65 | 0.71 | 24.19 |
| 7 November 2021 | 0.37 | 0.19 | 0.16 | 0.43 | 0.51 | 0.94 | 0.68 | 16.18 |
| 12 November 2021 | 0.20 | 0.07 | 0.06 | 0.32 | 0.34 | 0.66 | 0.66 | 3.85 |
| 14 November 2021 | 0.66 | 0.29 | 0.26 | 0.40 | 0.45 | 0.85 | 0.71 | 10.80 |
| 20 November 2021 | 0.05 | 0.04 | 0.03 | 0.60 | 0.79 | 1.39 | 0.65 | 24.43 |
| 22 November 2021 | 0.06 | 0.04 | 0.03 | 0.55 | 0.67 | 1.23 | 0.72 | 17.73 |
| 30 November 2021 | 0.02 | 0.01 | 0.01 | 0.48 | 0.57 | 1.06 | 0.52 | 15.44 |
| 12 December 2021 | 0.57 | 0.37 | 0.29 | 0.52 | 0.64 | 1.16 | 0.58 | 19.99 |
| 16 December 2021 | 0.25 | 0.22 | 0.18 | 0.71 | 0.86 | 1.57 | 0.65 | 18.10 |
| 17 December 2021 | 0.18 | 0.17 | 0.14 | 0.76 | 0.95 | 1.70 | 0.59 | 19.87 |
| 25 December 2021 | 0.08 | 0.05 | 0.04 | 0.52 | 0.56 | 1.08 | 0.59 | 7.46 |
To provide a more comprehensive characterisation of the airflow performance,
Table 7 presents the air velocities and volumetric flows in the external ducts. The data confirm the presence of a significant supply–exhaust imbalance. The exhaust velocities and flow rates were consistently higher than those of the supply branch. This imbalance consequently engenders disparate heat capacity rates within the exchanger, thereby inducing a direct distortion in thermal recovery indicators.
The present findings demonstrate that system-level metrics, such as ξthermal,app and ηtot, are structurally depressed under unbalanced conditions. The data indicates that the proper testing, adjusting, and balancing (TAB) procedures were either not sufficient or were circumvented during commissioning, which is a significant oversight with substantial consequences for energy and IAQ performance.
Table 7.
Velocity and flow of air in exterior conducts of the F0 dwelling’s ventilation system.
Table 7.
Velocity and flow of air in exterior conducts of the F0 dwelling’s ventilation system.
| Date | Va-SupExt_xy [m/s] | Va-ExhExt_xy [m/s] | QSupExt_xy [m3/s]
(Equation (5)) | QExh_Ext_xy [m3/s] (Equation (5)) | Va-SupExt_z [m/s]
(Equation (5)) | Va-ExhExt_z [m/s] (Equation (5)) |
|---|
| 31 March 2021 | 1.39 | 3.47 | 0.02 | 0.04 | 0.35 | 0.87 |
| 3 April 2021 | 1.07 | 3.47 | 0.01 | 0.04 | 0.27 | 0.87 |
| 6 April 2021 | 1.45 | 3.44 | 0.02 | 0.04 | 0.36 | 0.86 |
| 8 April 2021 | 1.41 | 3.46 | 0.02 | 0.04 | 0.35 | 0.86 |
| 9 April 2021 | 1.44 | 3.45 | 0.02 | 0.04 | 0.36 | 0.86 |
| 10 April 2021 | 1.42 | 3.42 | 0.02 | 0.04 | 0.35 | 0.86 |
| 11 April 2021 | 1.04 | 3.34 | 0.01 | 0.04 | 0.26 | 0.83 |
| 14 April 2021 | 1.07 | 3.48 | 0.01 | 0.04 | 0.27 | 0.87 |
| 14 April 2021 | 1.42 | 3.43 | 0.02 | 0.04 | 0.35 | 0.86 |
| 25 April 2021 | 1.42 | 3.35 | 0.02 | 0.04 | 0.35 | 0.84 |
| 27 April 2021 | 1.32 | 3.37 | 0.02 | 0.04 | 0.33 | 0.84 |
| 5 November 2021 | 1.33 | 3.80 | 0.02 | 0.05 | 0.33 | 0.95 |
| 7 November 2021 | 1.36 | 3.88 | 0.02 | 0.05 | 0.34 | 0.97 |
| 12 November 2021 | 1.36 | 3.85 | 0.02 | 0.05 | 0.34 | 0.96 |
| 14 November 2021 | 1.37 | 3.88 | 0.02 | 0.05 | 0.34 | 0.97 |
| 20 November 2021 | 1.35 | 3.81 | 0.02 | 0.05 | 0.34 | 0.95 |
| 22 November 2021 | 1.41 | 3.89 | 0.02 | 0.05 | 0.35 | 0.97 |
| 30 November 2021 | 1.34 | 3.86 | 0.02 | 0.05 | 0.34 | 0.97 |
| 12 December 2021 | 1.37 | 3.86 | 0.02 | 0.05 | 0.34 | 0.96 |
| 16 December 2021 | 1.41 | 3.86 | 0.02 | 0.05 | 0.35 | 0.97 |
| 17 December 2021 | 1.39 | 3.84 | 0.02 | 0.05 | 0.35 | 0.96 |
| 25 December 2021 | 1.56 | 4.02 | 0.02 | 0.05 | 0.39 | 1.01 |
As demonstrated in
Table 8, quantitative analysis is employed to measure the pressure losses that occur in both the exhaust and supply ducts. This analysis reveals a clear asymmetry between the two branches. The exhaust path demonstrated a consistent loss of pressure, ranging from 26 to 35 Pa, while the supply path remained below 6 Pa.
This asymmetry, attributable to the elongated duct runs and the multiple bends in the exhaust path, resulted in the fans operating under augmented resistance, consequently escalating electrical consumption (see
Table 5). The resulting energy overhead led to a reduction in net efficiency of the system, even when thermal recovery performance was satisfactory.
These findings elucidate the “hydraulic penalty” imposed by duct geometry and routing, which were shaped by the need to comply with heritage preservation constraints. This “hydraulic tax” exemplifies a broader challenge in sustainable heritage retrofits: striking a balance between respecting architectural integrity and achieving seamless integration of energy-efficient systems.
Although this work did not monitor the heating system directly, the reduction in infiltration and the recovery of sensible heat documented here are expected to reduce overall heating energy demand in the dwelling. Extrapolation of the measured ηtot values indicates that fan energy use was generally offset by recovered heat, thereby contributing to a net reduction in space-heating loads.
Table 8.
Pressure losses in exterior conducts of the F0 dwelling’s ventilation system.
Table 8.
Pressure losses in exterior conducts of the F0 dwelling’s ventilation system.
| Date | ΔPf-ExhExt_xyz [Pa]
(Equation (9)) | ΔPl-ExhExt_xyz
[Pa]
(Equation (10)) | Δptot_ExhExt_xyz
[Pa]
(Equation (11)) | ΔPf-SupExt_xyz
[Pa]
(Equation (9)) | ΔPlSupExt_xyz
[Pa]
(Equation (10)) | ΔPtot-SupExt_xyz
[Pa]
(Equation (11)) |
|---|
| 31 March 2021 | 10.87 | 15.62 | 26.49 | 1.75 | 2.52 | 4.28 |
| 3 April 2021 | 10.86 | 15.61 | 26.47 | 1.04 | 1.49 | 2.53 |
| 6 April 2021 | 10.69 | 15.37 | 26.06 | 1.89 | 2.72 | 4.60 |
| 8 April 2021 | 10.77 | 15.49 | 26.26 | 1.79 | 2.58 | 4.37 |
| 9 April 2021 | 10.71 | 15.39 | 26.10 | 1.88 | 2.70 | 4.58 |
| 10 April 2021 | 10.56 | 15.17 | 25.73 | 1.81 | 2.61 | 4.42 |
| 11 April 2021 | 10.05 | 14.44 | 24.49 | 0.98 | 1.41 | 2.40 |
| 14 April 2021 | 10.92 | 15.69 | 26.61 | 1.04 | 1.49 | 2.53 |
| 14 April 2021 | 10.61 | 15.25 | 25.85 | 1.81 | 2.60 | 4.41 |
| 25 April 2021 | 10.10 | 14.52 | 24.62 | 1.82 | 2.61 | 4.43 |
| 27 April 2021 | 10.26 | 14.75 | 25.01 | 1.57 | 2.25 | 3.82 |
| 5 November 2021 | 13.02 | 18.72 | 31.74 | 1.59 | 2.28 | 3.87 |
| 7 November 2021 | 13.56 | 19.50 | 33.06 | 1.67 | 2.40 | 4.08 |
| 12 November 2021 | 13.36 | 19.21 | 32.57 | 1.67 | 2.40 | 4.07 |
| 14 November 2021 | 13.58 | 19.51 | 33.09 | 1.69 | 2.43 | 4.13 |
| 20 November 2021 | 13.12 | 18.85 | 31.97 | 1.64 | 2.36 | 4.01 |
| 22 November 2021 | 13.64 | 19.61 | 33.26 | 1.79 | 2.58 | 4.37 |
| 30 November 2021 | 13.47 | 19.36 | 32.82 | 1.63 | 2.34 | 3.97 |
| 12 December 2021 | 13.43 | 19.30 | 32.73 | 1.70 | 2.44 | 4.13 |
| 16 December 2021 | 13.44 | 19.31 | 32.75 | 1.80 | 2.59 | 4.39 |
| 17 December 2021 | 13.27 | 19.07 | 32.34 | 1.75 | 2.51 | 4.26 |
| 25 December 2021 | 14.59 | 20.98 | 35.57 | 2.19 | 3.15 | 5.34 |
Collectively, these tables furnish a thoroughgoing overview of the MVHR system’s operational performance under real-world conditions, thereby enabling a nuanced interpretation of its energy efficiency, airflow balance, and capacity to deliver acceptable indoor air quality in a protected building context.
As illustrated in
Table 9, the mean value of the thermal expansion coefficient, designated as ξ
thermal,app, was found to be 0.74, with no observed values exceeding 0.93. The energy recovery (η
tot) metric oscillated around unity, with sporadic periods exceeding 1.0, suggesting that energy recovery was, at times, adequate to counterbalance fan consumption. However, these conditions were not sustained, largely due to flow imbalance and pressure loss penalties.
The analysis demonstrates that catalogue values are performance ceilings rather than guarantees, a fact that is especially evident in the context of heritage retrofits characterised by complex geometries. The empirical evidence collected thus far appears to provide a robust basis for the introduction of updated commissioning standards. These new standards should include mandatory TAB verification, performance-based acceptance criteria (e.g., ηtot > 1.5), and careful airflow tuning to approach the declared efficiencies in real-world applications.
Table 9.
Statistical parameters of physical variables and studied KPI of the F0 dwelling’s ventilation system.
Table 9.
Statistical parameters of physical variables and studied KPI of the F0 dwelling’s ventilation system.
| | Mean | Standard
Deviation | Min | Max | IQ1 | IQ2 | IQ3 | Interquartile Range |
|---|
| Pe-Ventilation Accumulated [kWh] | 0.33 | 0.28 | 0.01 | 0.88 | 0.08 | 0.23 | 0.52 | 0.44 |
| Qexh Accumulated [kWh] | 0.14 | 0.12 | 0.01 | 0.37 | 0.04 | 0.08 | 0.23 | 0.19 |
| Qsup [kWh] | 0.14 | 0.11 | 0.01 | 0.38 | 0.04 | 0.12 | 0.24 | 0.20 |
| ηuseful_Sup | 0.50 | 0.24 | 0.15 | 0.95 | 0.32 | 0.48 | 0.65 | 0.33 |
| ηuseful_Exh | 0.46 | 0.15 | 0.24 | 0.76 | 0.34 | 0.43 | 0.57 | 0.23 |
| ηtot | 0.96 | 0.39 | 0.39 | 1.70 | 0.65 | 0.90 | 1.20 | 0.55 |
| ξthermal,app | 0.74 | 0.11 | 0.52 | 0.93 | 0.65 | 0.75 | 0.82 | 0.17 |
| Imbalance [%] | 23.41 | 19.94 | 3.66 | 67.33 | 9.97 | 16.96 | 25.59 | 15.62 |
| Δptot-ExhExt_xyz [Pa] | 29.35 | 3.74 | 24.49 | 35.57 | 26.01 | 29.17 | 32.77 | 6.76 |
| Δptot-SupExt_xyz [Pa] | 4.04 | 0.71 | 2.40 | 5.34 | 3.94 | 4.20 | 4.41 | 0.47 |
To complement the tabulated results,
Figure 9,
Figure 10,
Figure 11,
Figure 12 and
Figure 13 provide synthesized visualizations that enhance the understanding of seasonal performance trends and system behaviour under real-use conditions.
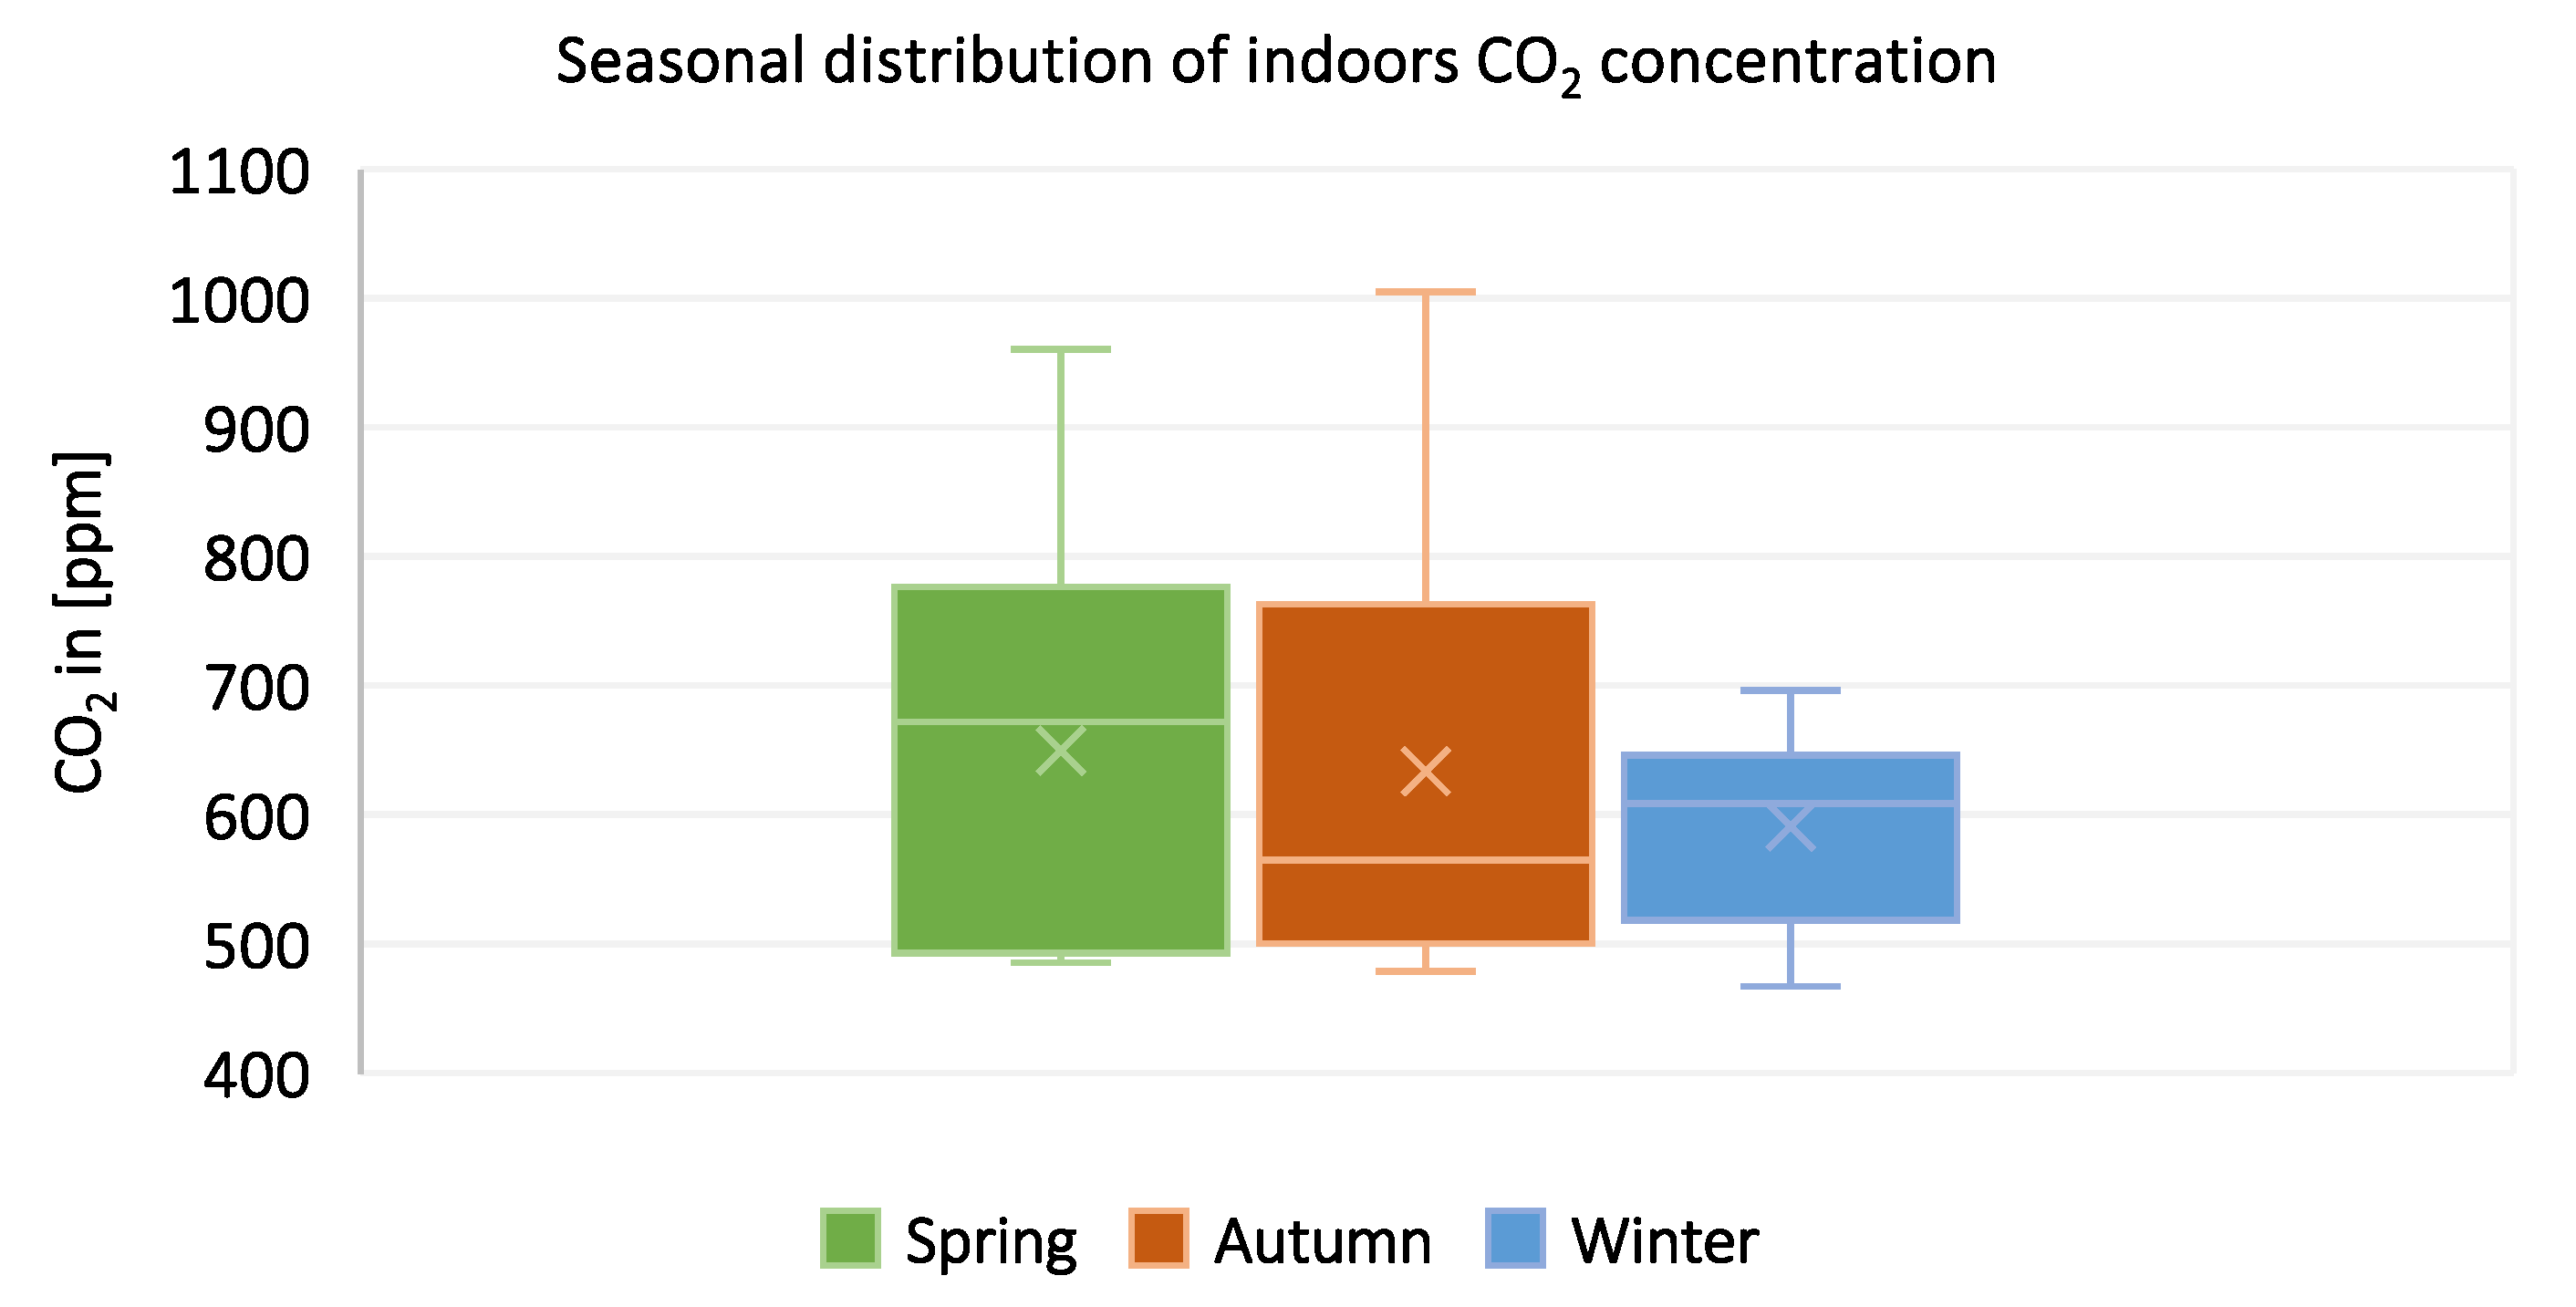
Figure 9 highlights the seasonal distribution of indoor CO
2 levels recorded during selected days in spring, autumn, and winter 2021. Although mean concentrations remained below 650 ppm, several exceedances above 900 ppm occurred in autumn and winter. These peaks reveal insufficient spatial ventilation control, underscoring the need for spatially distributed demand-controlled ventilation strategies in heritage retrofits, where architectural constraints often hinder airflow optimisation.
As shown in
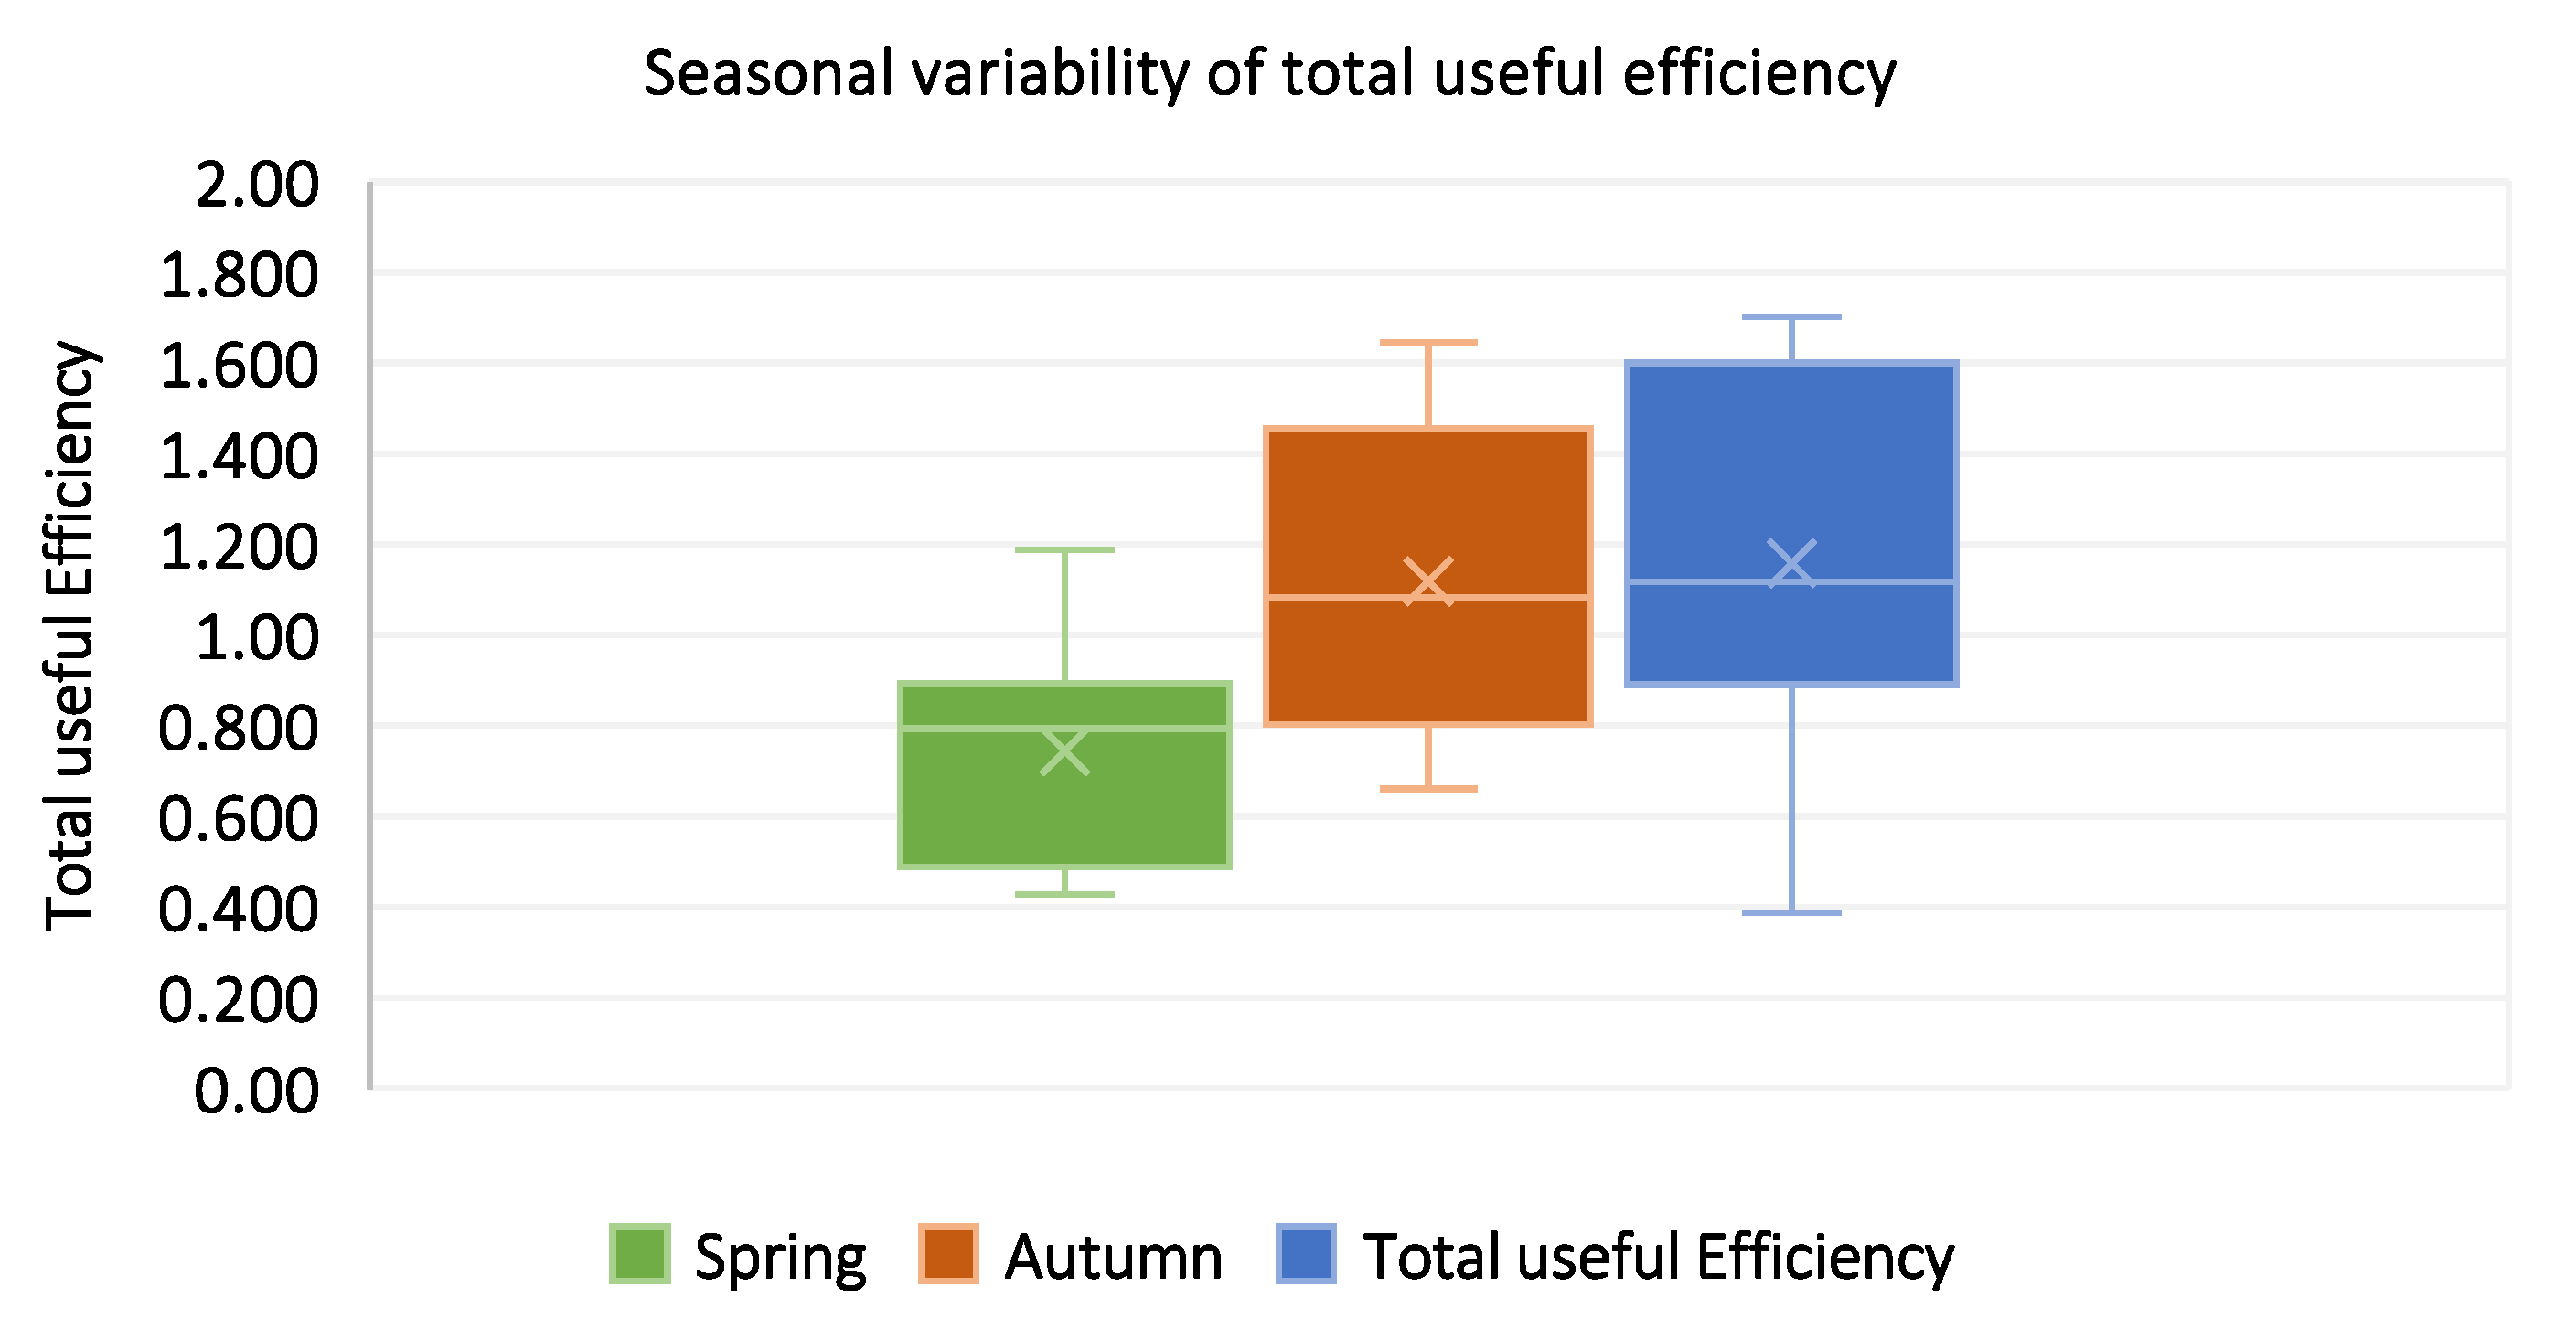
Figure 10, total useful efficiency (η
tot) exhibited noticeable seasonal variability. While median values clustered near unity, the data displayed significant dispersion across seasons. This variability stems from persistent supply–exhaust imbalances and hydraulic penalties imposed by heritage-driven duct geometry. Notably, the system occasionally achieved η
tot values above 1.0, indicating periods when recovered sensible heat exceeded fan energy consumption. However, this performance was not consistently maintained over extended periods.
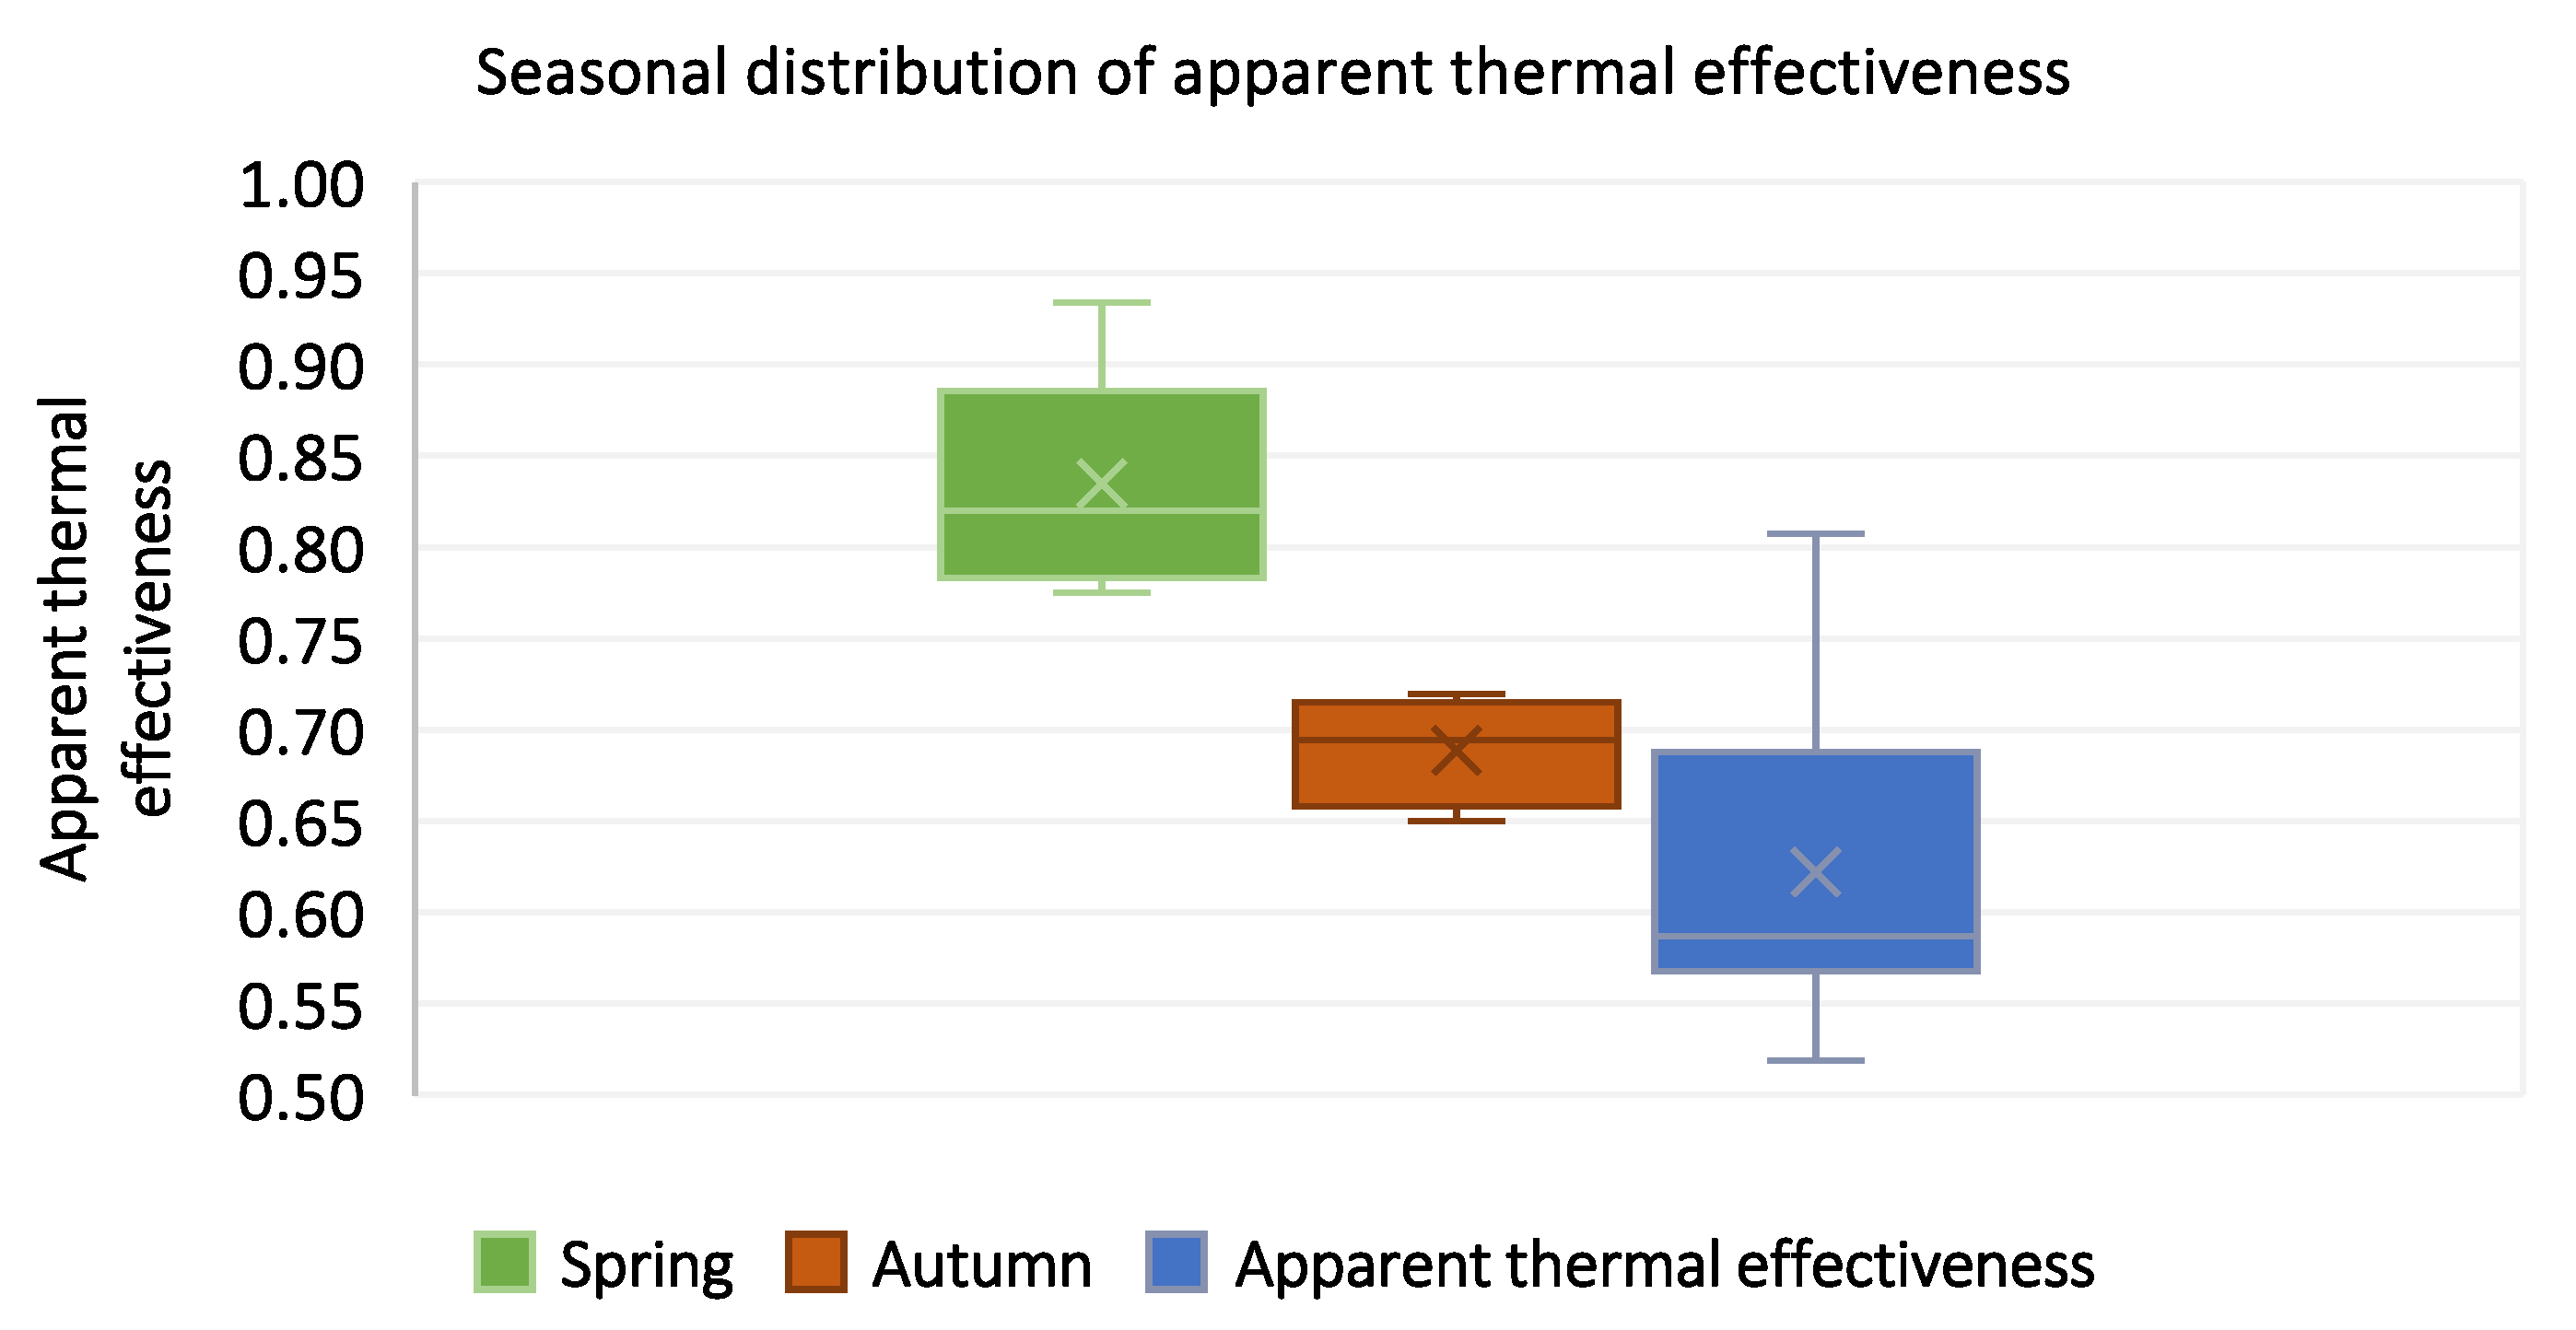
Figure 11 illustrates the distribution of apparent thermal effectiveness (ξ
thermal,app), with values approaching 0.9 under optimal conditions but ranging overall from 0.59 to 0.93—below manufacturer specifications. This deviation reflects the combined effects of airflow imbalance, duct losses, and non-ideal operating conditions, confirming that catalogue values represent theoretical ceilings rather than guaranteed performance.
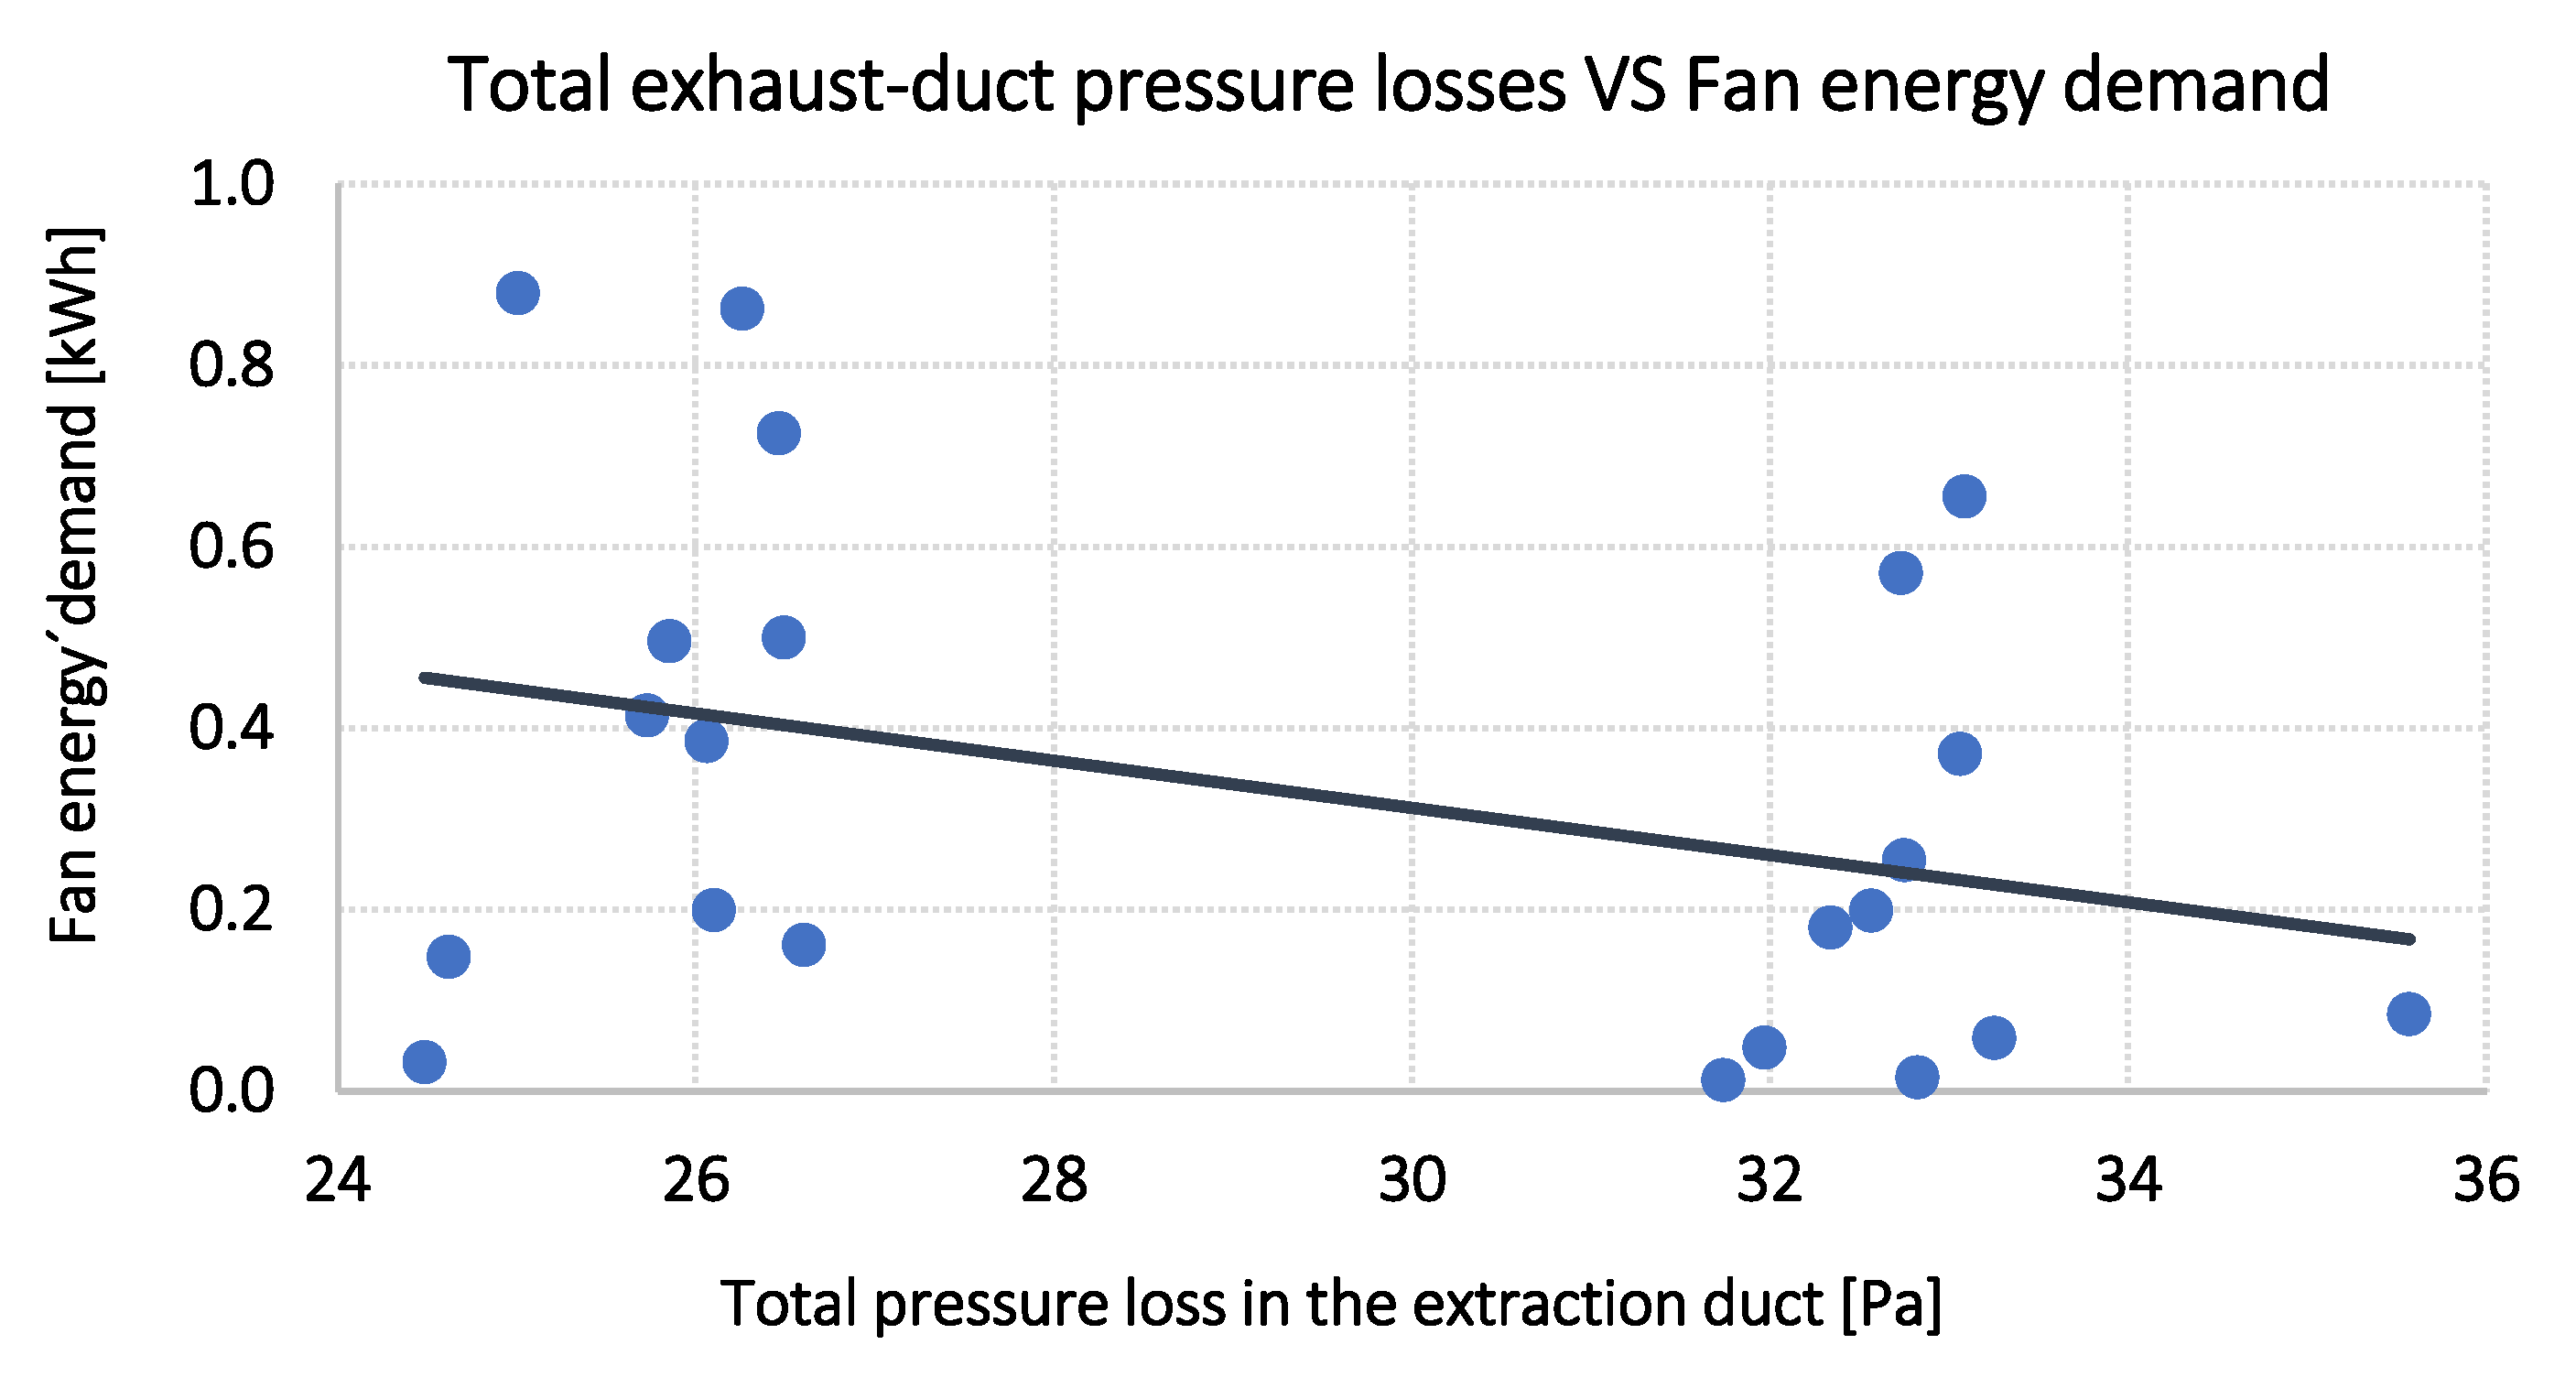
As depicted in
Figure 12, a positive correlation exists between total exhaust duct pressure losses and fan energy demand. The observed linear trend confirms the existence of a “hydraulic tax”, whereby an increase in resistance due to heritage-driven duct geometry directly corresponds to higher electrical consumption by the MVHR fans. This finding serves to reinforce the importance of optimising duct routing and implementing rigorous post-installation balancing procedures with a view to minimising energy penalties.
Collectively, these visualisations validate the quantitative findings and provide actionable insights for improving the performance of MVHR systems in heritage contexts. The necessity for system-level KPIs, spatially distributed sensing, and commissioning protocols tailored to the constraints of protected buildings is emphasised.
4.1. System Performance in Real Operating Conditions
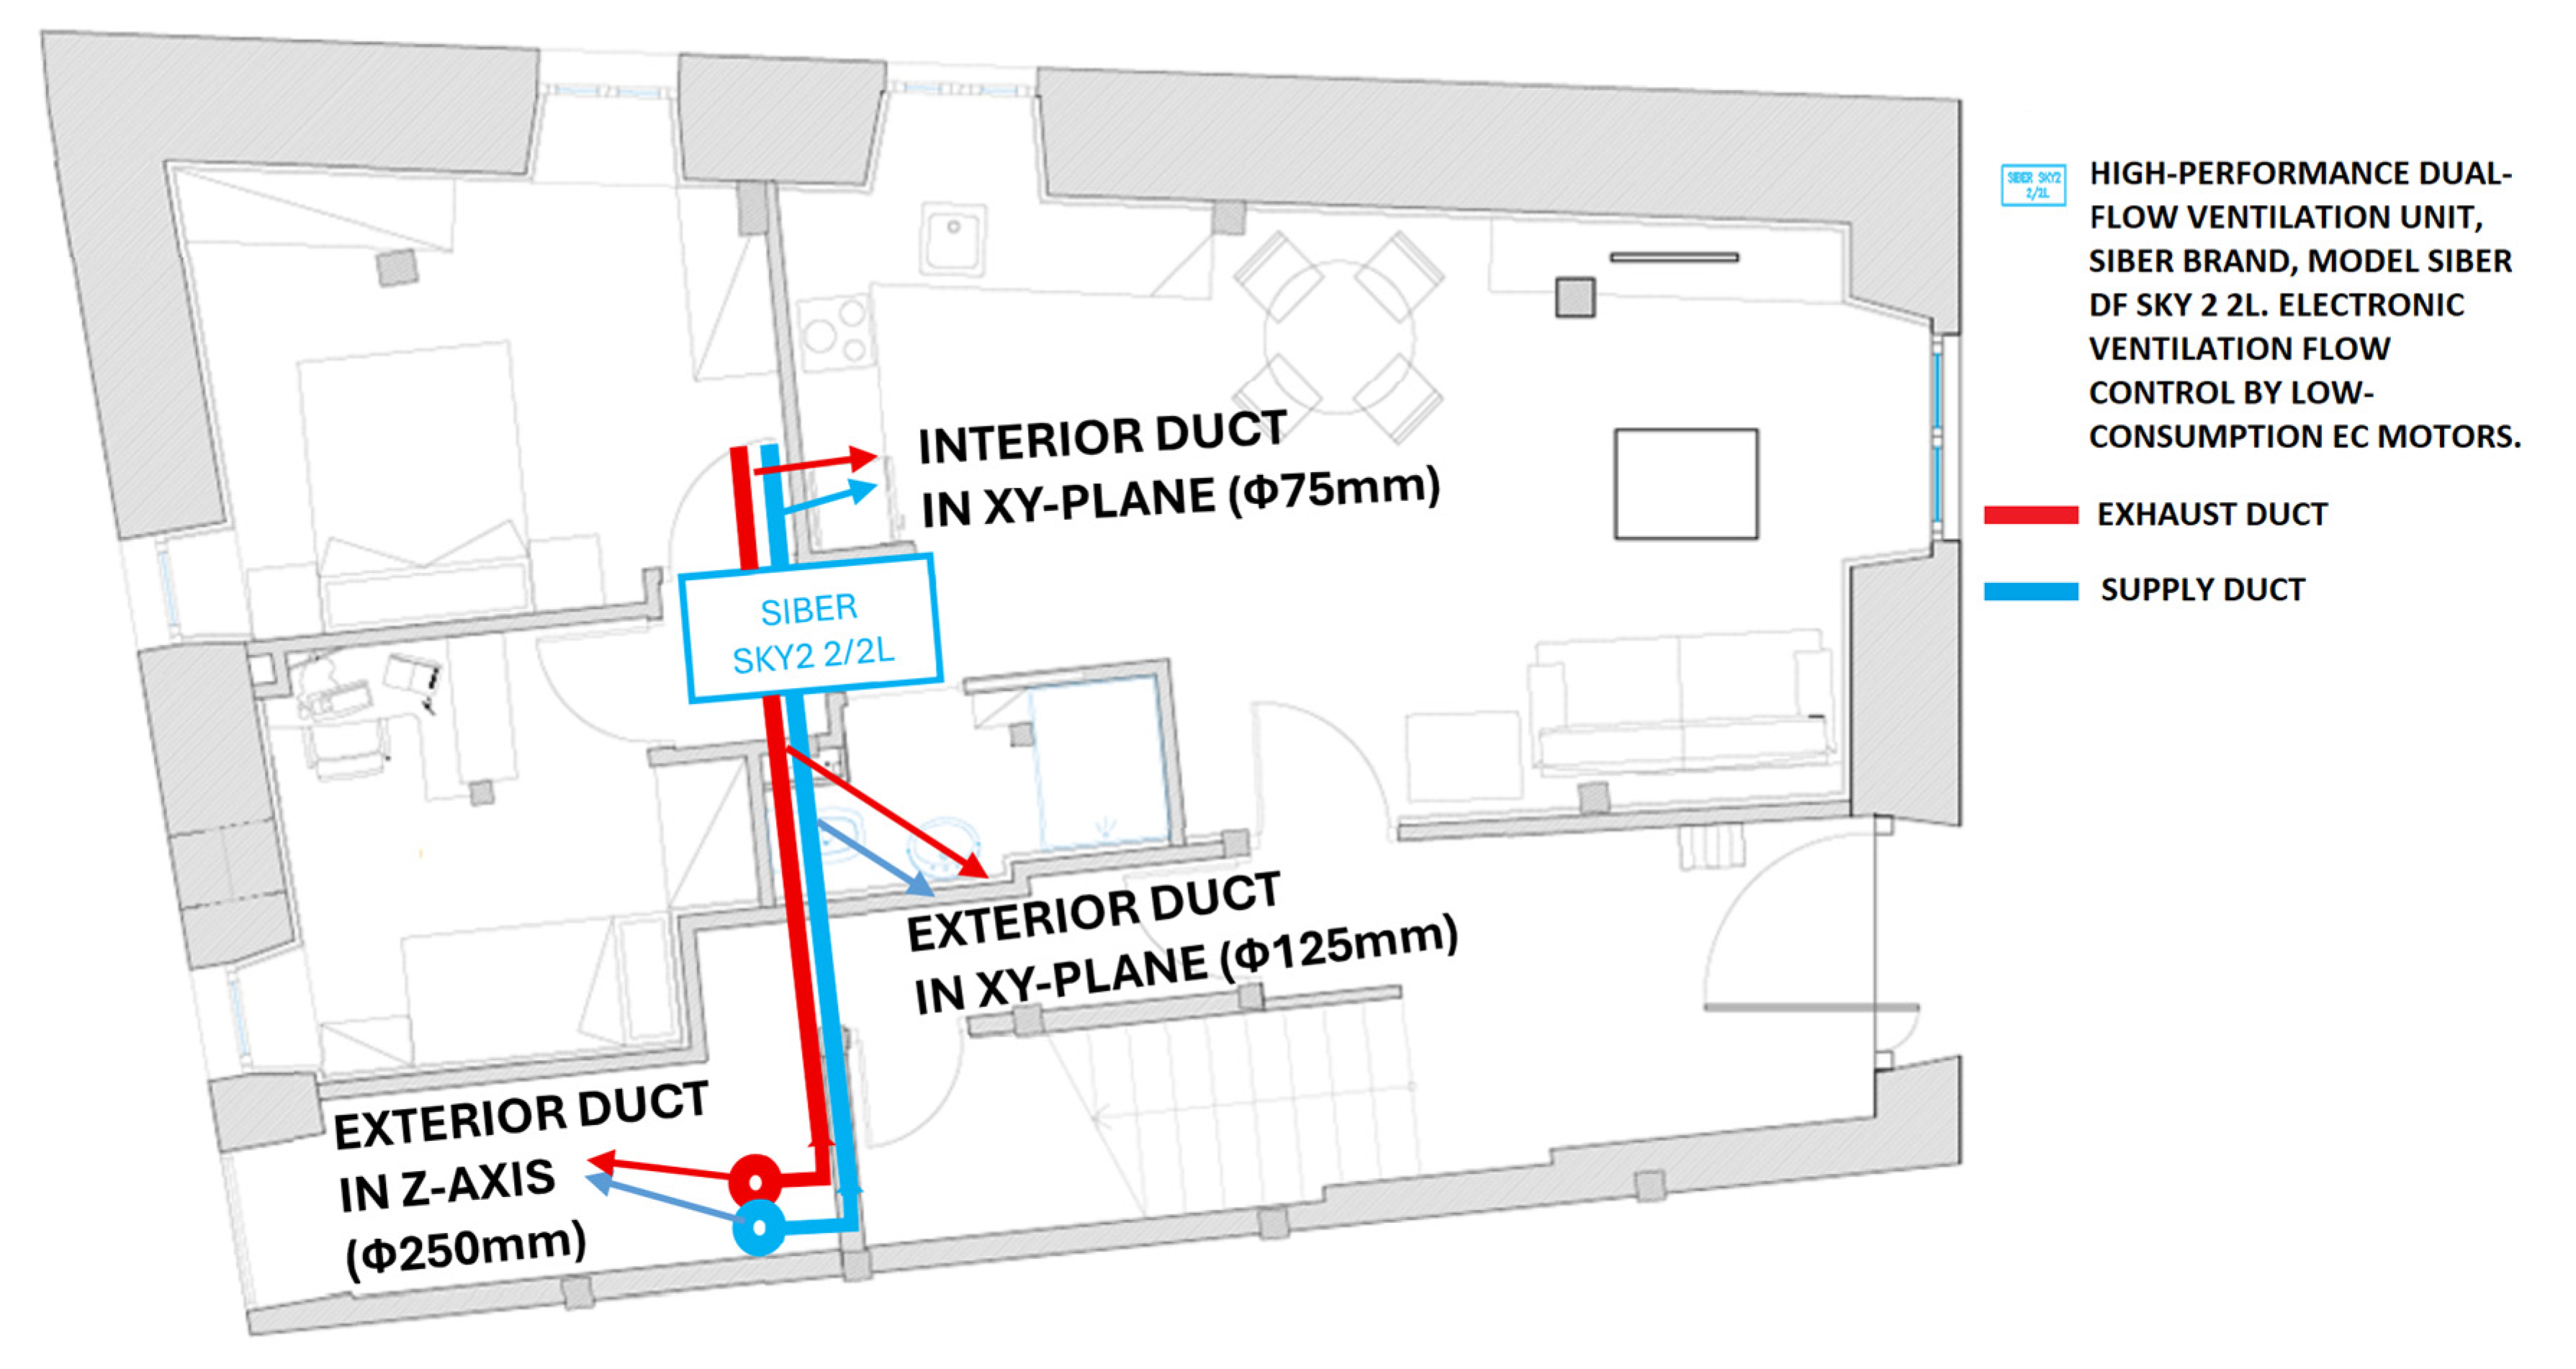
The monitored heat recovery ventilation installation exhibited a mean apparent thermal effectiveness (ξthermal,app) of 0.74 (10th–90th percentile: 0.59–0.88). Although values approaching 0.9 were observed, the central tendency lies well below the nominal performance commonly claimed for counter-flow residential exchangers. This discrepancy is explained by two structural features of the installation: (i) a very large flow imbalance between supply and exhaust streams (mean 92%, range 81–106%), and (ii) substantial hydraulic penalties arising from the heritage-constrained ductwork (a short-radius ninety-degree elbow, a horizontal branch of 8.6 m, a vertical riser of 9.6 m, and a distant outdoor terminal).
Under these conditions, ξthermal,app must be read as a system-level effectiveness: it aggregates exchanger behaviour, network losses, control interventions (for example, bypass or anti-frost), and measurement noise; it cannot be interpreted as an intrinsic exchanger effectiveness.
The total useful efficiency (ηtot)—defined as total sensible heat recovered divided by total electrical energy consumed—clustered around unity, with a mean of 0.96 and values spanning 0.39 to 1.70 (interquartile range 0.69–1.18). This indicates that, on average, the aerodynamic and control penalties offset much of the heat recovered; yet non-negligible periods exceeded unity, demonstrating that the system is intermittently capable of returning more sensible heat than the electrical energy it expends. The fact that this capability does not consolidate in the central tendency is fully consistent with the measured imbalance and pressure-loss burden.
Branch-wise useful efficiencies were lower and asymmetric:
These values quantify the differential aerodynamic and thermal penalties borne by each path under imbalance. They are diagnostically informative, but they should not be used as the headline energy metric, because they relate each branch’s useful heat to a shared electrical denominator while operating under very different hydraulic penalties and capacities. For energy decision-making, ηtot is the only coherent, system-integrating indicator.
4.2. Flow Imbalance as the First-Order Driver
The magnitude of the flow imbalance measured in this instance (
Table 6) significantly exceeds the recommended post-commissioning thresholds, indicating that the proper testing, adjusting, and balancing (TAB) procedures were either insufficient or not fully implemented. Three empirical facts follow directly: (1) the apparent thermal effectiveness departs from nominal exchanger values because the temperature-based numerator and denominator are referenced to streams with markedly unequal heat-capacity rates; (2) the total useful efficiency remains compressed around unity because the fans are forced to operate off-design to partially compensate for the network, increasing electrical work without a proportional gain in useful heat; and (3) the supply and exhaust branch efficiencies diverge, so they cannot be expected to reconcile with η
tot under the present definitions and operating conditions. In short, the imbalance is the structural cause that invalidates any attempt to back-calculate intrinsic exchanger performance from these operational data.
4.3. Indoor Air Quality: Measurable Gains, Limited Robustness
A key goal of MVHR systems in retrofitted dwellings is to ensure consistent IAQ. As demonstrated in
Table 4, the system successfully achieved a substantial reduction in indoor CO
2 concentrations, with a mean level of approximately 625 ppm. However, occasional peaks above 900–1000 ppm were observed, primarily during periods of extended occupancy or when DCV was either inactive or not spatially optimised. These fluctuations were attributed to the absence of zonal CO
2 sensors, which constrained the system’s capacity to adapt to varying occupancy patterns, particularly in rooms distant from the primary sensor.
To further elucidate the drivers of IAQ variability, a one-way ANOVA was performed on daily mean CO
2 concentrations across the monitored seasons (spring, autumn, winter) (
Figure 13). The analysis revealed no statistically significant differences between seasons (F(2,19) = 0.84;
p = 0.447), indicating that seasonal effects alone do not explain the observed variability. In contrast, an ANCOVA incorporating system operating time as a covariate demonstrated a strong negative association between ventilation duration and indoor CO
2 (F(1,18) = 12.07;
p = 0.0027), with an estimated slope of −0.416 ppm·min
−1 (≈−25 ppm·h
−1). See
Figure 10 for the relationship between CO
2 and operating time. This finding emphasises that operational behaviour, as opposed to seasonality, is the predominant factor influencing IAQ performance in the examined heritage dwelling. The absence of interaction between season and operating time (
p = 0.912) suggests that the effect of extended operation is consistent across climatic conditions.
Beyond statistical associations,
Table 5 confirms continuous airflow delivery during the specified periods, evidencing that both supply and exhaust fans operated consistently throughout the monitored intervals. However, the absence of adaptive control mechanisms and system imbalance resulted in constraints on the robustness of IAQ improvements. While the intervention evidently improved air quality in comparison with the baseline conditions, it did not consistently maintain recommended thresholds across all zones and timeframes. These findings emphasise the significance of incorporating spatially distributed, demand-controlled ventilation to enhance responsiveness and ensure more stable IAQ performance in subsequent retrofitting initiatives.
4.4. Pressure Losses and the “Hydraulic Tax” of Heritage Constraints
The duct layout, shaped by the need to comply with heritage preservation guidelines, introduced non-negligible aerodynamic penalties. As presented in
Table 8, the pressure losses resulting from friction and local resistances attained 24.5–35.6 Pa in the exhaust branch, in comparison to 2.4–5.3 Pa in the supply branch. This discrepancy arises due to the elongated duct runs and the multiple bends in the exhaust path, which necessitate the fans to overcome higher resistance. Consequently, this results in an increase in electrical consumption (see
Table 5) and a reduction in the system’s net efficiency, despite the satisfactory thermal recovery performance.
The findings of this study elucidate the “hydraulic tax” imposed by heritage constraints: a measurable energy overhead that reflects the broader challenge of integrating energy-efficient systems within protected architectural contexts. The measurement of pressure losses revealed an approximate value of 29 Pa (mean) in the exhaust–exterior path and 4 Pa in the supply–exterior path. This is accompanied by a mean electrical power of around 66 W, which collectively substantiates the observation that the system incurs a non-trivial penalty for compliance.
This imposes a direct burden on total efficiency (ηtot) necessitating additional electrical input to maintain target flow rates in a loss-heavy network. Absent mandatory testing, adjusting, and balancing procedures, such systems may achieve regulatory compliance in theory but demonstrate suboptimal performance in practice, both in terms of energy efficiency and hygiene. The findings emphasise the necessity of minimising pressure losses through the optimisation of duct routing and the implementation of rigorous post-installation verification procedures. Such measures are imperative to ensure the full realisation of sustainability objectives in the context of heritage retrofits. Beyond efficiency losses, reducing pressure drops also contributes to lower operational energy demand, thereby supporting climate mitigation goals and reducing the environmental footprint of ventilation systems in heritage buildings. Although the heating system was not directly monitored in this study, the reduction in infiltration and the recovery of sensible heat documented here are expected to decrease the overall space-heating demand of the dwelling. Extrapolation of the measured ηtot values, which clustered around unity, indicates that the sensible heat recovered by the MVHR system broadly offset the fan energy consumption. This suggests a net reduction in heating loads during operation. Nevertheless, no comprehensive integration with the total energy demand of the dwelling or an economic/payback analysis was performed. These aspects are beyond the scope of the present work and remain essential for future investigations on the cost-effectiveness of heritage retrofits.
4.5. Methodological Implication: No Algebraic Closure Should Be Enforced
A key methodological implication of this study is that no algebraic closure should be enforced between system-level and branch-level performance indicators. As outlined in
Section 3, the total system efficiency η
tot, defined as the ratio of total sensible heat recovered to electrical energy consumed, differs fundamentally from the branch-specific metrics (η
useful_Sup and η
useful_Exh) which are influenced by localized hydraulic penalties and airflow paths. The absence of mathematical closure between these indicators does not constitute a flaw in the data; rather, it is indicative of real-world system imbalances and dispersion losses that are inherent in heritage-constrained retrofits.
The approach of treating the installed, unbalanced ventilation system as if it were a laboratory-grade heat exchanger is methodologically unsound. The discrepancies observed in this study underscore the necessity for the refinement of commissioning protocols and data interpretation practices, with the objective of accounting for the intricacies inherent in in situ performance. In this context, it is imperative to prioritise system-level Key Performance Indicators (KPIs) such as ηtot and ξt,apparent for the evaluation of installed performance. These metrics are particularly salient as they more accurately reflect the operational realities of constrained retrofit environments. It is recommended that future research and commissioning standards incorporate this distinction to avoid misinterpretation and to support more robust, context-sensitive performance assessments.
4.6. Comparison with the Manufacturer’s Operating Ranges
The Siber DF SKY 2 MVHR unit has been specified to achieve thermal effectiveness levels of up to 95% under ideal conditions. These conditions include balanced flows, electronically commutated constant-flow fans, airtight Class D ductwork (Safe Click), and minimal hydraulic resistance. However, the monitored installation, constrained by heritage preservation requirements, deviated from these assumptions.
As demonstrated in
Table 6 and
Table 9, the system demonstrated a mean apparent thermal effectiveness (ξ
thermal,app) of 0.74 (P10–P90: 0.59–0.88), with maximum values not exceeding 0.93. The range of flow imbalance was from 81% to 106%, and pressure losses, particularly in the exhaust branch, were significant. These conditions resulted in CO
2 excursions beyond the 900–1000 ppm range, leading to a decline in overall system efficiency. The total efficiency (η
tot) exhibited a tendency to approximate unity, with sporadic periods exceeding 1.0, suggesting that energy recovery could, on occasion, counterbalance fan consumption, albeit not with any degree of consistency.
These findings confirm that catalogue specifications represent performance ceilings rather than guarantees, especially in heritage retrofits where duct geometry and routing are constrained. The observed deviations justify:
- (i)
the use of ηtot as a comprehensive performance metric;
- (ii)
interpreting ξthermal,app as a system-level indicator rather than an intrinsic exchanger property; and
- (iii)
the need for updated commissioning protocols, including mandatory testing, adjusting, and balancing, performance-based acceptance criteria (e.g., ηtot > 1.5), and airtight ductwork (Class D or equivalent).
Due to the absence of baseline monitoring, a direct comparison with pre-retrofit conditions or alternative ventilation strategies, such as natural ventilation or conventional MVHR systems, was not feasible. Nonetheless, existing literature consistently indicates that heritage dwellings lacking MVHR systems are prone to frequent CO
2 exceedances and elevated infiltration-related heat losses Trofimova et al. [
32] and Hesaraki & Holmberg [
33]. Post-occupancy evaluations further validate the reliability of campaign-based monitoring in assessing ventilation performance, even in the absence of pre-intervention data. In addition, the demonstrated effectiveness of demand-controlled ventilation in optimising both energy consumption and indoor air quality supports the observed improvements in this case.
Ultimately, attaining catalogue-level performance in real-world heritage contexts necessitates the utilisation of high-performance equipment and the implementation of rigorous design, installation, and verification practices, which are to be adapted in accordance with the constraints inherent to protected buildings.
4.7. Comparison with Previous Work
In relation to recent heritage-focused literature, our findings operationalise the design-stage insights reported by Bartolucci et al. by quantifying the mechanisms that depress realised performance: marked flow imbalance, equivalent-length penalties and the absence of room-level demand control. While catalogue exchanger effectiveness would suggest higher system-level ξ values, the measured imbalance and hydraulic burden explain the observed ξthermal,app distribution (median ≈ 0.74) and the compression of ηtot around unity. These empirical results therefore refine existing guidance by indicating that commissioning specifications in heritage retrofits should elevate post-installation TAB, pressure-drop limits and zonal sensing to mandatory acceptance criteria.
4.8. Limitations of the Study
A further limitation of this study is that, despite the availability of year-round monitoring, the system was not continuously operated by the occupants. The main reason reported was perceived noise, which discouraged prolonged use. Consequently, the analysis was restricted to 22 days in which the MVHR system remained fully active. This highlights a recurrent barrier in the adoption of MVHR systems in retrofitted heritage dwellings: beyond technical performance, acoustic comfort and user acceptance must be addressed to ensure sustained operation.
In addition, no baseline monitoring was available prior to the retrofit, nor were parallel measurements taken under natural ventilation or conventional MVHR strategies. As a result, this study cannot quantify the net benefits relative to pre-retrofit conditions or alternative ventilation approaches. Future studies should include baseline or counterfactual scenarios to strengthen comparative evaluation.
No integration with the total dwelling energy demand or retrofit payback analysis was performed. These aspects are left for future work.
