Article

A Study on Integrating Production Efficiency and Allocation Efficiency into Economic Efficiency Based on the Value Chain—A Case Study of the Dongting Lake Region

College of National Parks and Tourism, Central South University of Forestry and Technology, Changsha 410004, China
*
Author to whom correspondence should be addressed.
Sustainability 2025, 17(18), 8490; https://doi.org/10.3390/su17188490
Submission received: 14 August 2025 / Revised: 17 September 2025 / Accepted: 18 September 2025 / Published: 22 September 2025

Abstract

Economic efficiency plays a crucial role in both resource conservation and food security, which is why numerous scholars have expressed a keen interest in improving production stage efficiency. Nevertheless, only a few have studied allocation stage efficiency, and even fewer researchers have explored production stage efficiency in close conjunction with allocation stage efficiency. As a result, this paper constructs a two-stage dynamic network SBM model based on the value chain theory, taking 24 counties (cities and districts) in Dongting Lake Region, the most typical region in China, as a case study, and integrating the production and allocation stages. The conclusions are as follows: (1) Economic efficiency is heterogeneous in both time and space. (2) Production stage efficiency and allocation stage efficiency are always positively or negatively correlated, and the different correlations reflect the different situations in the production stage and allocation stage. (3) The production stage and allocation stage efficiency can help us to identify the weak links in the agricultural production process so as to realize the target. The research methodology in this paper can not only be applied to the analysis of multi-stage efficiency, but the production efficiency can also be expanded to multi-dimensional efficiency, which involves economic efficiency, ecological efficiency and social efficiency.

1. Introduction

Since the implementation of the reform and opening-up policies, China’s economy has experienced rapid growth and the population has steadily increased. This has led to a significant surge in the demand for food resources, which have gradually become scarce, severely constraining the living standards and food security of the nation’s people. Therefore, economic efficiency must be improved. Such efforts are not only connected to rural economic development and social progress but also have a significant influence on national macroeconomic adjustment and industrial structure. Consequently, the enhancement of economic efficiency to ensure food security has emerged as a pivotal strategic issue intertwined with the national economy and the well-being of the populace.
Economic efficiency refers to the ability of farmers or agribusinesses to maximize the output or production value of agricultural products with minimal resource inputs in the agricultural production process [1,2]. While agricultural productivity research is increasingly focused on refinement, few studies have specifically targeted the county scale [3,4,5]. In terms of research content, in addition to measuring efficiency, most studies analyze spatial and temporal characteristics and influential mechanisms to enhance the results’ presentation and determine the inherent effects of the mechanisms [4,6,7,8,9,10]. Various scholars have explored diverse aspects of agricultural production analysis. Abbas et al. [11] utilized data envelopment analysis (DEA) to assess the energy inputs and outputs of cotton production and its environmental impacts and identified low technical efficiency as a key contributor to inefficient energy usage. Grassauer et al. [12] employed a meta-frontier input-oriented slack-based measurement (SBM) model with variable returns to scale (VRS) to evaluate the eco-efficiency of Austrian farms, and their results underscored the importance of optimizing resource utilization in farm operations. Sarkhosh-Sara et al. [13] Kord et al. [14], and Kord et al. [15] employed a network DEA model to evaluate sustainable production across high-, middle-, and low-income countries, assess urban agricultural performance sustainability in southern Iran and Baluchistan Province, and investigate agricultural practices that sustainably utilize shared resources, respectively. In addition, Mavi et al. [16] analyzed the combined impacts of eco-efficiency and eco-innovation using a two-stage network DEA model, while Güney [17] assessed the eco-efficiency of wheat farm management using a two-stage DEA methodology. Ren et al. [18] used a two-stage dynamic DEA model to assess the total efficiency value of Chinese agriculture, two-stage efficiency rate values, energy consumption efficiency, CO2 emission efficiency, and crop affected area efficiency. Fang et al. [19] evaluated energy and natural disaster efficiency in China using a two-stage non-expected dynamic DDF model. Subsequently, two-stage dynamic network DEA models were predominantly employed to assess value chain efficiency in industrial and agricultural production [20] and mining production [21,22]. Liu et al. [23] used a two-stage dynamic network DEA model to evaluate the efficiency of cropland utilization across 21 counties (cities and districts) in the Dongting Lake Region (DLR) from 2017 to 2019. Li et al. [24] employed a two-stage dynamic SBM recycling model to assess the efficiency of mining production and mining land reclamation stages in various Chinese provinces.
In summary, previous studies have predominantly utilized static and one-stage DEA models for efficiency measurements. They discuss more about the single efficiency of production or allocation and rarely integrate the two in their studies. As a result, the methodology ignores the linkage between the two efficiencies and the complexity and integrative factors between them, which has a considerable impact on the accurate measurement of efficiency. Although Ren et al. [18] and Liu et al. [23] employed a two-stage DEA model to address the limitations of the previous model, challenges such as disconnected research stages and imprecise carry-over factor settings persist. Therefore, integrating the production and distribution stages into a unified analytical framework is expected to yield conclusions that are both more comprehensive and distinct from those of previous studies. These findings will offer more objective guidance for practical applications and hold deeper theoretical significance. Hence, this study adopts the two-stage dynamic network SBM model to evaluate the economic efficiency of 24 counties (cities and districts) in the Dongting Lake Region. The model is based on the theory of the agricultural production value chain and integrates production efficiency and allocation efficiency into economic efficiency in order to explore the changes in economic efficiency in Dongting Lake area. Moreover, it enables the targeted enhancement of efficiency across different stages, thereby offering a foundation for decision-making on enhancing the agricultural output value of the Dongting Lake Region.
The rest of this paper runs as follows: Section 2 presents the overview of the study area. Section 3 describes the applied method. Section 4 analyzes the empirical results. Section 5 offers a discussion. Section 6 provides conclusions.

2. Overview of the Study Area

The Dongting Lake Region, located south of the middle reaches of the Yangtze River, spans Hunan and Hubei provinces in China, with more than 85% of the area situated in Hunan Province. The geographic location of the study area, depicted in Figure 1, includes 24 counties (cities and districts) with geographic coordinates ranging from 28°30′ to 30°20′ N and 110°50′ to 113°45′ E. The region covers a land area of 7.35 Mha, with cropland covering 1.69 Mha, representing 44.2% of the total area. The total land area of Hunan Province is 211,829 km2, accounting for 2.21% of the total national land area. The cropland area of the province covers 4,148,800 ha, representing approximately 3.1% of the total nationwide cropland area. The Dongting Lake Region is known as the “land of fish and rice” in Hunan Province and the entire country because it is surrounded by abundant natural resources and supported by a robust agricultural production base and a substantial labor force. Enhancing the efficiency of agricultural production in this region is crucial to boosting food production and agricultural output value not only in Hunan Province but also nationwide.
Since the early stages of the reform and opening up, the Dongting Lake Region has been impacted by local production and construction activities, leading to an ecological retreat of croplands and a decline in the total cropland area. The proportion of croplands in the region has decreased from 29.67% in 1980 to 28.28% in 2020 [25]. In light of the current decline in cropland area, it is crucial to develop scientifically sound methods to assess economic efficiency and subsequently offer practical suggestions to enhance agricultural output value.

3. Methodology, Indicators and Data

DEA utilizes the concept of Pareto optimality and relies on the estimation of a production function by Farrell [26]. Charnes et al. [27] and Banker et al. [28] employed a traditional DEA to assess the relative efficiency of decision-making units (DMUs). Nonetheless, the traditional DEA can only evaluate the efficiency of a single multiple-input multiple-output system. The concept of a network DEA was initially introduced by Fáre et al. [29], and it enables a more in-depth examination of the impact of input configurations and intermediate products on the production process. Subsequently, a weighted SBM network DEA approach and dynamic network DEA model that utilizes weighted relaxation measures (SBM) were introduced by Tone and Tsutsui [30,31]. This dynamic network model allows for a comprehensive analysis of the various intrinsic factors impacting efficiency, addresses the issue of independence between research stages, and enhances the accuracy of efficiency measurement.

3.1. Two-Stage Dynamic Network SBM Model

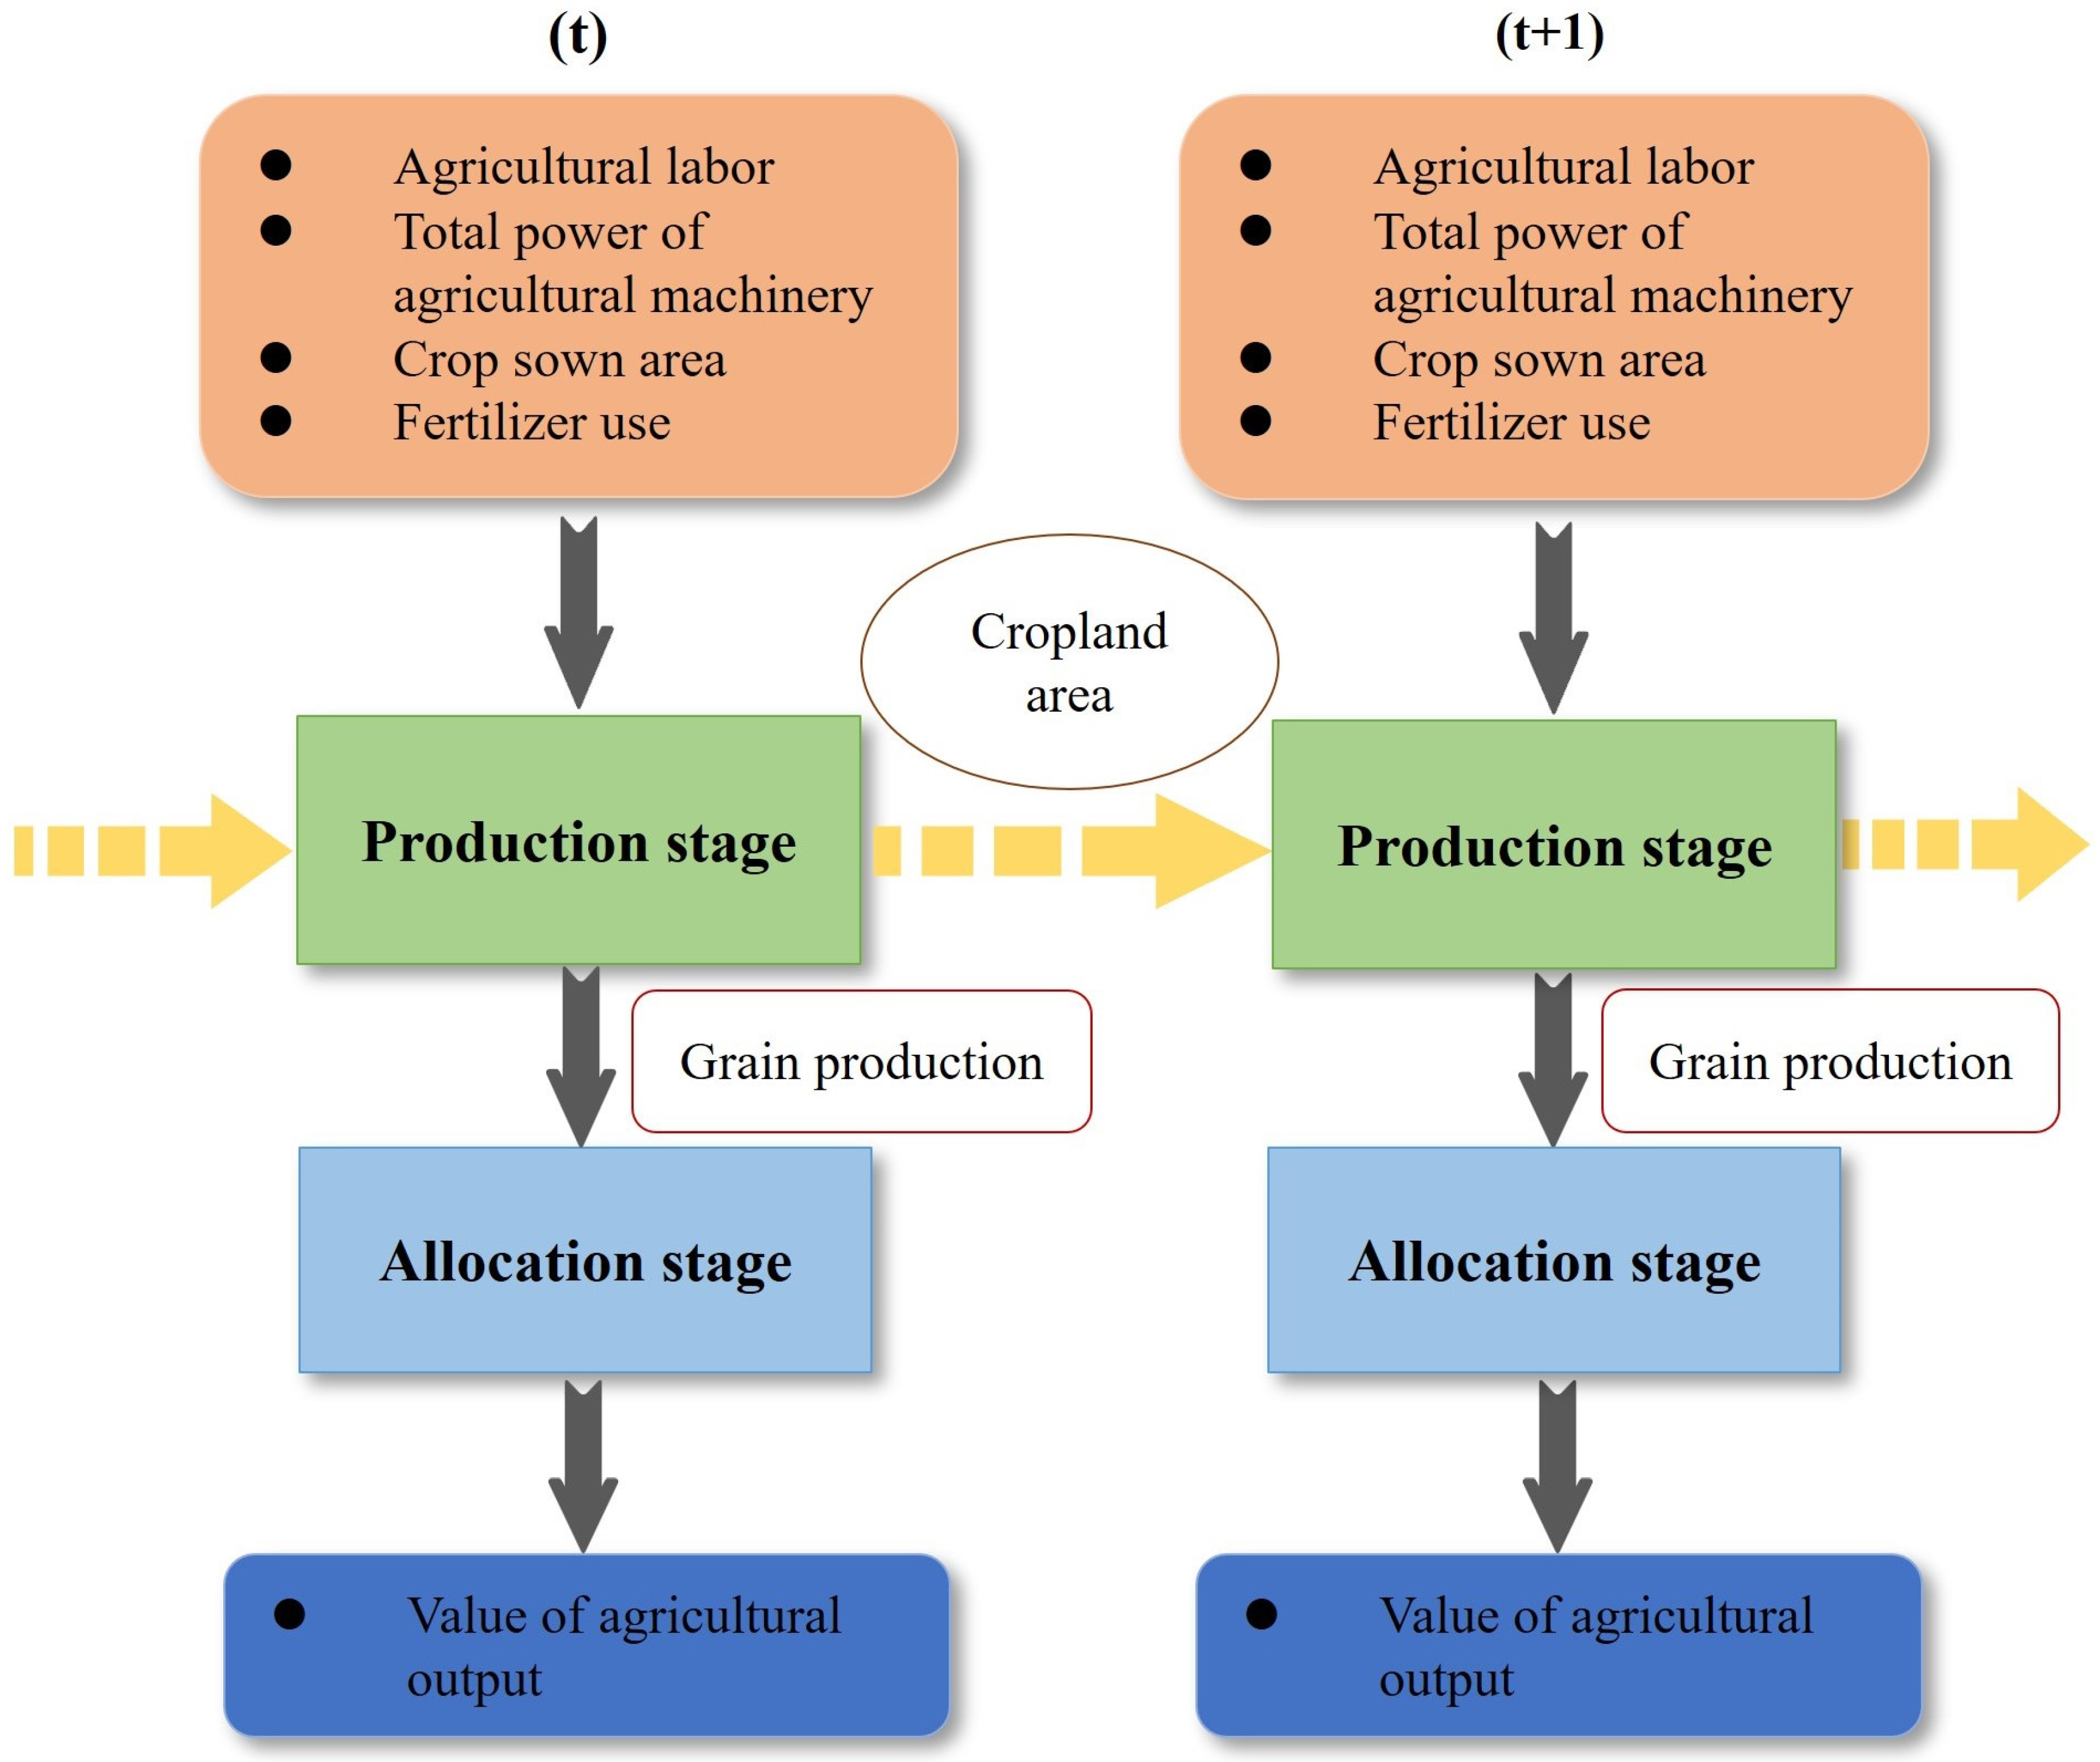
Building on the literature cited above, this study employs a two-stage dynamic SBM model to assess the economic efficiency in the Dongting Lake Region, which encompasses 24 counties (cities and districts). The complete agricultural production value chain consists of multiple stages, including production, distribution, transportation, and allocation. Owing to model constraints, this study focuses only on the production and allocation stages for research purposes. The evaluation utilizes Tone and Tsutsui’s [31] Dynamic Network SBM DEA (DN-SBM) with a network structure to evaluate the efficiency of the production stage in the first stage. The inputs considered at this stage were agricultural labor, total power of agricultural machinery, crop-sown area, and fertilizer use. Grain production serves as an intermediary variable linking the second stage. In the allocation stage, the output is represented by the value of agricultural output, with the cropland area designated as the carry-over variable.
Subsequently, a measurement model based on the dynamic network SBM was formulated (Figure 2). Assume that there are n DMUs (j = 1, …, n). Each DMU consists of K divisions (k = 1, …, K) composed of T time periods (t = 1, …, T). Every DMU has inputs (X) and outputs (Y) in period t and maintains a carry-over (C) link to the subsequent period t + 1. The inputs and outputs of stage q are represented by mq and rq, respectively. The link from stage q to stage g is denoted by (q,g)i, with Lqg indicating the set of links between stages q and g. The slack variable is represented by s, and W represents the weight.
We summarize the notation for data and variables in Table 1.
(1)
Production possibility set
P = X k t   , Y k t   , C ( q   g ) t   , C i q ( t , t + 1 )
Subject to:
X j q t = X q t λ q t + s q j t q , t
Y j q t = Y q t λ q t s q j t + q , t
e λ q t = 1 q , t
λ q t 0 ,   s q j t 0 ,   s q j t + 0 ,   q , t
(2)
Objective function
θ o * = min t = 1 T W t q = 1 Q W q 1 1 m q + l i n k i n q + n b a d q f = 1 m q S i j q t b i j q t + ( q g ) l = 1 l i n k i n x s j ( q g ) l i n t p j ( q g ) l i n t + q l = 1 n b a d q s j k l b a d ( t , ( t + 1 ) ) p j k l b a d ( t , ( t + 1 ) ) t = 1 T W t q = 1 Q W q 1 + 1 r q + l i n k o u t q + n g o o d q r = 1 r q S r j q t + c r j q t + ( q g ) l = 1 l i n k o u t x s j ( q g ) l o u t t p j ( q g ) l o u t t + q l = 1 n g o o d q s j k l g o o d ( t , ( t + 1 ) ) p j k l g o o d ( t , ( t + 1 ) )
Subject to:
X q t j = 1 n X j q t λ j q t q , t
Y q t j = 1 n Y j q t λ j q t q , t
e λ q t = 1 q , t
j = 1 n B j q 1 α ( t , ( t + 1 ) ) λ j q t = j = 1 n B j q 1 α ( t , ( t + 1 ) ) λ j q t + 1 q ; q 1 ; t = 1 , , T 1
s o k 1 g o o d ( t , ( t + 1 ) ) 0 , q ; t
(3)
Period efficiency
τ o t * = q = 1 Q W q 1 1 m q + l i n k i n q + n b a d q i = 1 m q S i j q t b i j q t + ( q g ) l = 1 l i n k i n q s j ( q g ) l i n t p j ( q g ) l i n t + q l = 1 n b a d q s j k l b a d ( t , ( t + 1 ) ) p j k l b a d ( t , ( t + 1 ) ) q = 1 Q W q 1 + 1 r q + l i n k o u t q + n g o o d q r = 1 r q S r j q t + c r j q t + ( q g ) l = 1 l i n k o u t q s j ( q g ) l o u t t p j ( q g ) l o u t t + q l = 1 n g o o d q s j k l g o o d ( t , ( t + 1 ) ) p j k l g o o d ( t , ( t + 1 ) )
(4)
Division efficiency
δ o q * = t = 1 T W t 1 1 m q + l i n k i n q + n b a d q i = 1 m q S i j q t b i j q t + ( q g ) l = 1 l i n k i n q s j ( q g ) l i n t p j ( q g ) l i n t + q l = 1 n b a d q s j k l b a d ( t , ( t + 1 ) ) p j k l b a d ( t , ( t + 1 ) ) t = 1 T W t 1 + 1 r q + l i n k o u t q + n g o o d q r = 1 r q S r j q t + c r j q t + ( q g ) l = 1 l i n k o u t q s j ( q g ) l o u t t p j ( q g ) l o u t t + q l = 1 n g o o d q s j k l g o o d ( t , ( t + 1 ) ) p j k l g o o d ( t , ( t + 1 ) )
The above formula can be used to calculate the comprehensive efficiency value, period efficiency value, and stage efficiency value. Although a unique solution exists for the comprehensive efficiency value, the period and stage efficiency values may not have unique solutions. Hence, network DEA and dynamic DEA seem more suitable than traditional DEA when comparing efficiencies across multiple stages or time periods.

3.2. Malmquist Productivity Index

Regarding the Malmquist productivity index, Malmquist [32] proposed the utilization of quantity indices in consumption theory to evaluate the share of frontier variation within an array of feasible utilities. Fáre et al. [33] adopted the index initially proposed by Caves et al. [34] and redefined it such that the Malmquist productivity change index was represented as a geometric mean. In addition, they addressed the bias that could arise from varying genetic selection. The Malmquist productivity index signifies an upward trend in the total factor productivity (TFP) of DMUs because it is capable of capturing efficiency and the advancement or decline in frontier technologies. In this study, a non-directional model was developed.
(1)
Divisional catch-up efficiency index (DCU)
DCU = γ o k t t + 1 = ρ o k t + 1 * ρ o k t * t = 1 , , T 1 ; k = 1 , , K ; o = 1 , , n
This equation represents the ratio of stage efficiency between periods t and t + 1, with DCU > 1, =1, and <1 representing progress, status quo, and regression in the catch-up effect, respectively.
(2)
Divisional frontier-shift effect index (DFS)
DFS = σ o k t t + 1 = σ o k t σ o k t + 1
Assuming no inputs or outputs in this phase, the DFS has a uniform value. σ o k t t + 1 indicates the frontier displacement effect of the partition.
(3)
Divisional Malmquist index (DMI)
DMI = DCU   ×   DFS = μ o k t t + 1 = γ o k t t + 1 σ o k t t + 1 t = 1 , , T 1 ; k = 1 , , K ; o = 1 , , n
The zonal Malmquist index value is the value obtained by multiplying the zonal catch-up efficiency index with the zonal frontier displacement effect index.
(4)
Dynamic Networks (DN)—Total Factor Productivity (TFP)
DN - TFP = μ o = k = 1 K ( μ o k ) w k o = 1 , , n
s . t .   w k 0   k = 1 k w k = 1
μ o k is the weighted geometric mean of μ o k t t + 1 t = 1 , , T 1 .

3.3. Indicators and Data

3.3.1. System of Indicators

Considering the comprehensiveness and availability of the collected data, four indicator categories were selected to depict the economic efficiency of agricultural production: inputs, outputs, linking variables, and carry-over variables (Table 1). In selecting the indicators, we first referred to a series of related literature for frequency statistics [17,23,35]. On this basis, we referred to the theory of factors of production, and also considered the principle of the adequacy and reliability of the indicators. The input indicators include agricultural labor, total power of agricultural machinery, crop sown area, and fertilizer use. The output is represented by the value of agricultural output, with grain production serving as the linking variable. In agricultural systems, the state of cropland (e.g., quality, area) directly affects the output efficiency of current and subsequent production. To preserve cropland, the Outline of the National Land Use General Plan (2006–2020) [36] was enacted by the CPC Central Committee and State Council. The primary objective of this plan was to maintain the 1.8 billion mu arable land red line, signifying the dynamic equilibrium in cropland areas. Therefore, we chose cropland area as the carry-over variable. The meanings of the variables are listed in Table 1. Hence, cropland area was selected as the carry-over variable. Detailed explanations of these variables are presented in Table 2. The hierarchical relationships among the variables are also shown in Figure 3.

3.3.2. Data and Sources

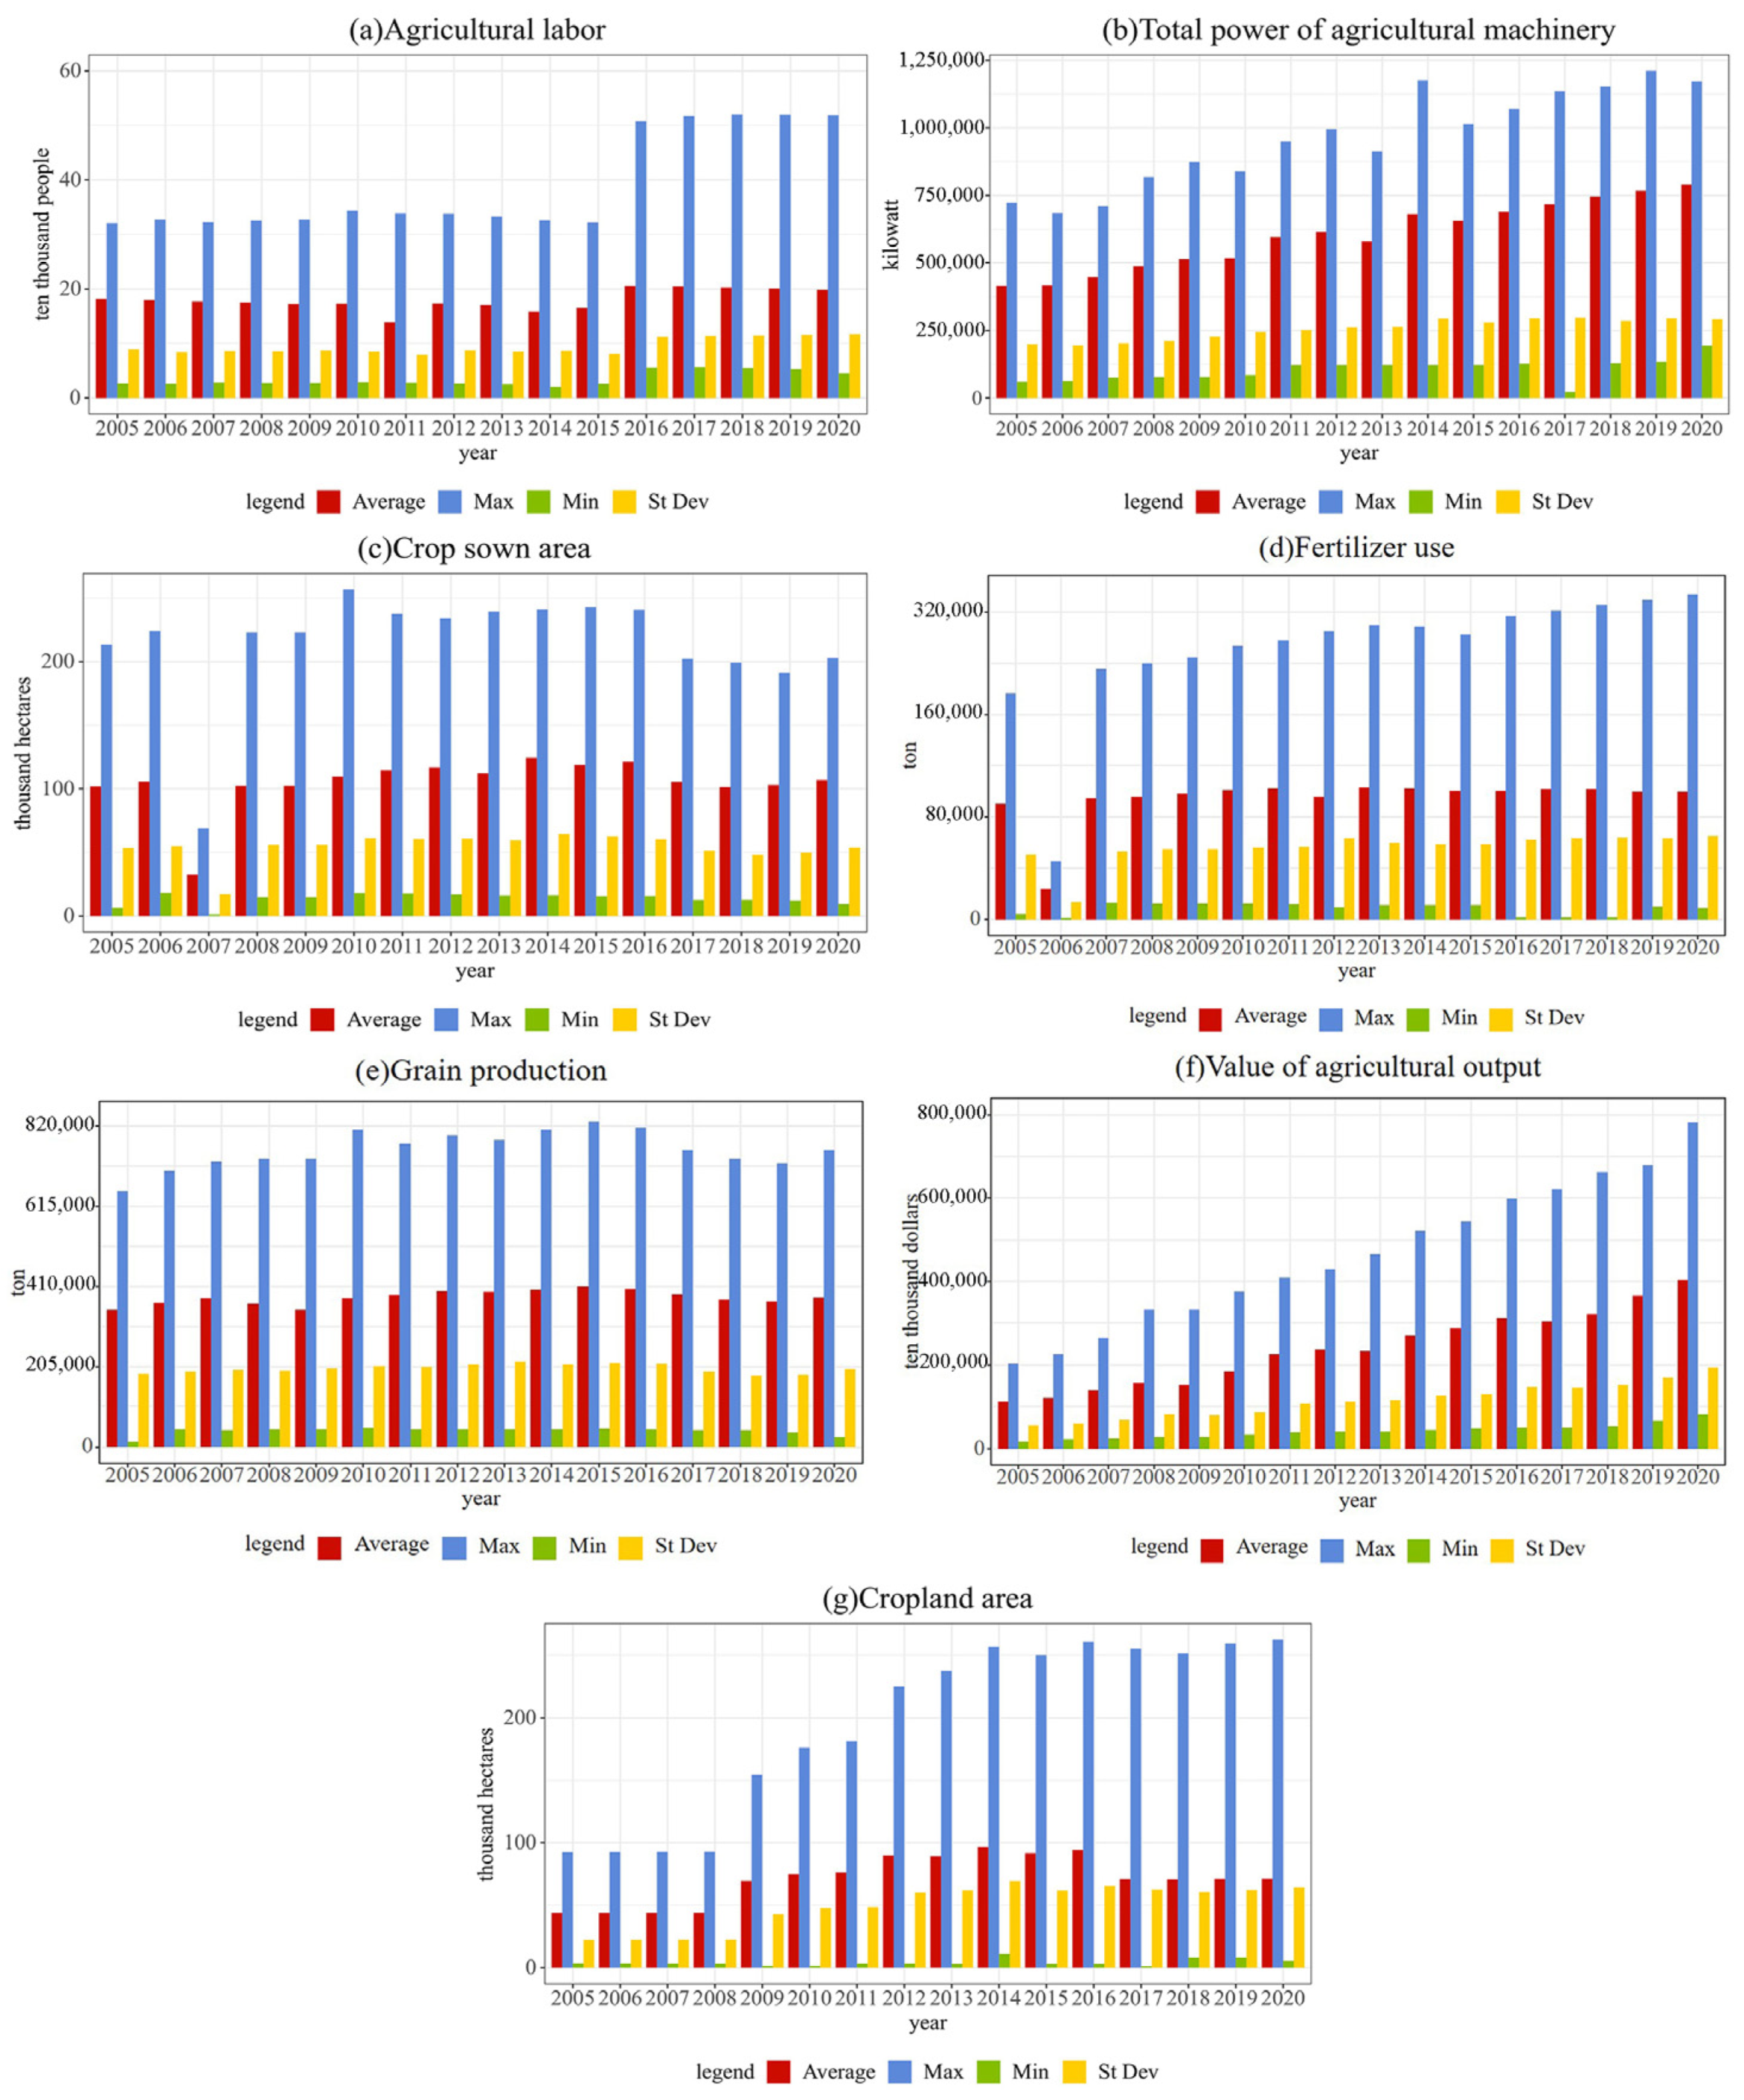
The data for this study were sourced from the Hunan Statistical Yearbook (2005–2020) [37] and statistical reports released by the Hunan Provincial Bureau of Statistics, Yueyang City Bureau of Statistics, Yiyang City Bureau of Statistics, and Changde City Bureau of Statistics (2005–2020). The outliers in the data were eliminated and the missing values were processed by interpolation method. All the above operations were performed in SPSS 25 software. Figure 4a–g shows the primary descriptive characteristics of the data.
The data are initially summarized in terms of years. Figure 4 illustrates the upward trend in the number of agricultural laborers from 2005 to 2020, which was particularly notable in 2016 based on an increase of almost 200,000 individuals. The total power of agricultural machinery consistently increased over the 16-year period, reflecting ongoing upgrades to agricultural infrastructure in recent years. Fertilizer use has gradually increased, notwithstanding a slight decrease in the area of crops sown. Grain production has experienced a slight upward trajectory, coinciding with a consistent increase in agricultural output. This indicates that the growth in agricultural output is correlated with a proportional increase in agricultural labor, machinery deployment, and fertilizer usage. Concurrently, the annual increase in the value of agricultural output reflects the advancing development of society, enhancement of socioeconomic conditions, improved transportation accessibility, enhanced infrastructure completeness, and maturation of the trading market. Owing to the continued enforcement of the arable land protection policy, the arable land area has progressively expanded and will eventually move towards equilibrium and stability.

4. Results and Analysis

4.1. DN-SBM Efficiency Analysis

4.1.1. Efficiency Analysis of the Production Stage

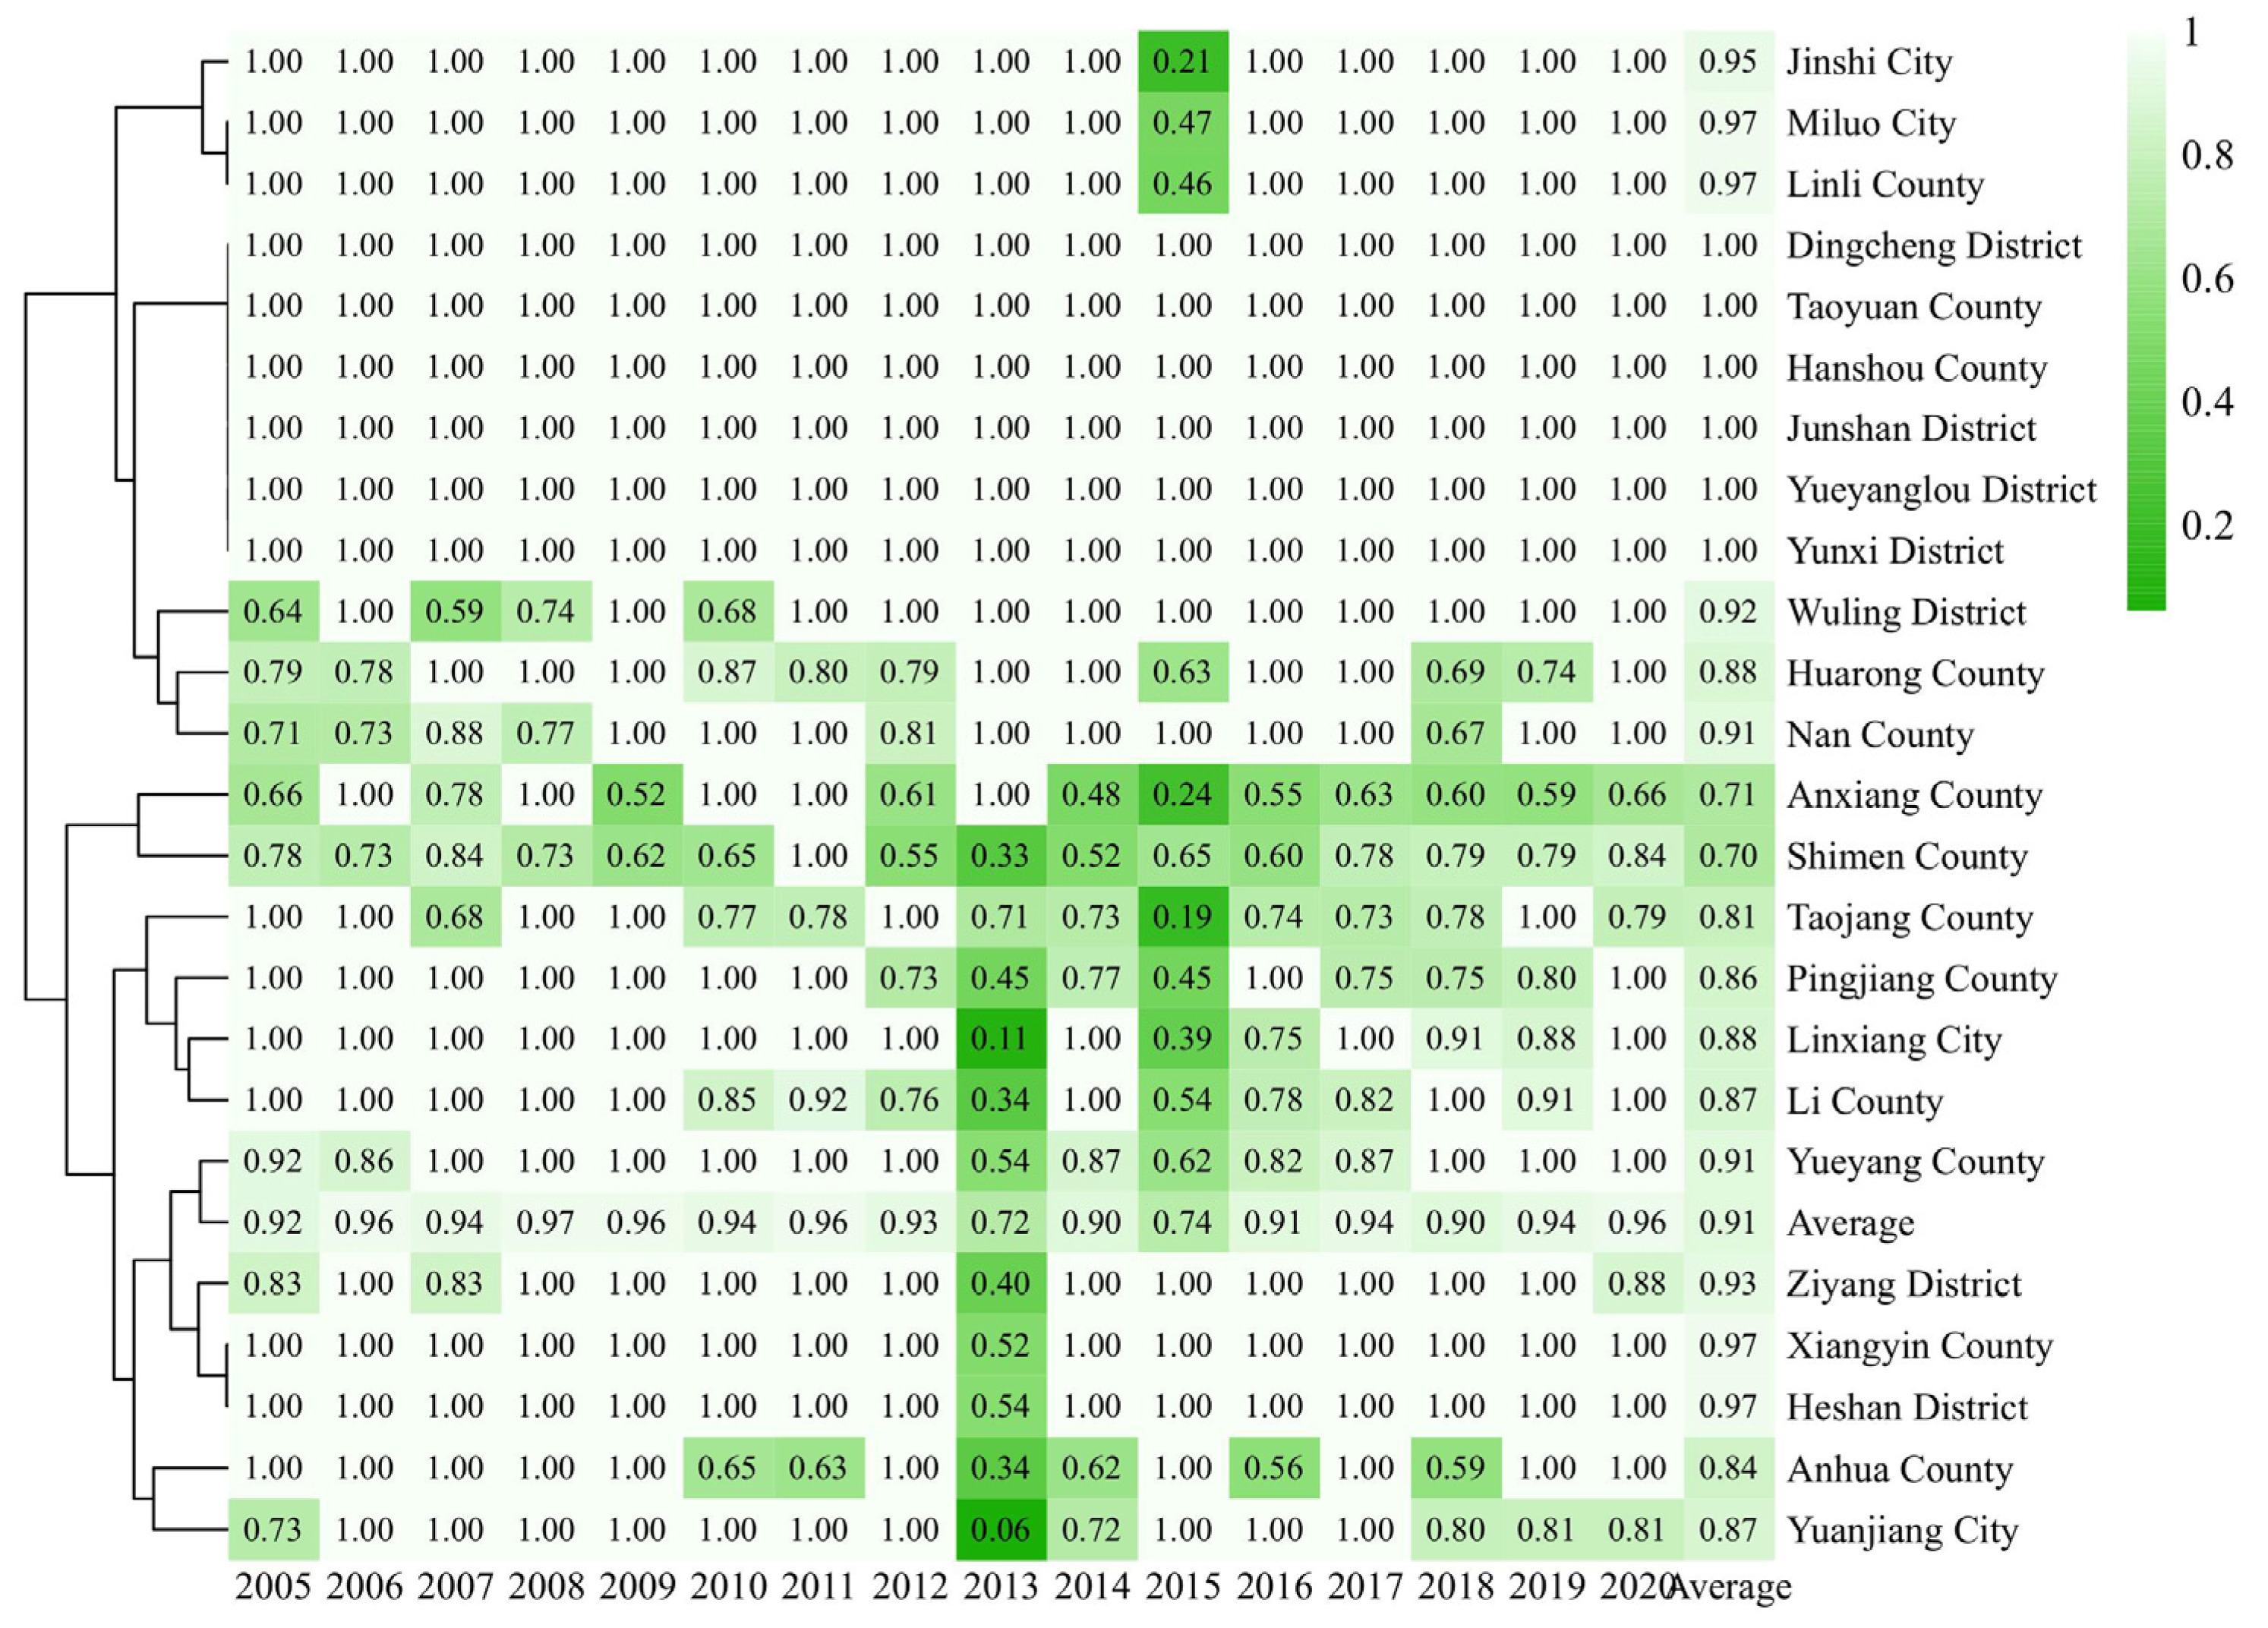
Based on the methodology described in Section 3.1, the production efficiencies for various periods and regions were computed, as depicted in Figure 5. Figure 5 presents a row-based cluster analysis that groups regions exhibiting similar efficiency changes during the production stage from 2005 to 2020, thereby facilitating a more straightforward comparison of regional efficiencies. Figure 5 shows that the majority of the 24 counties (cities and districts) in the Dongting Lake Region demonstrated commendable efficiency levels during the production stage, although Anxiang, Shimen, and Taojiang counties exhibited noticeable inefficiencies. The analysis indicates an average efficiency value of 0.91 for the production stage, with yearly efficiency values ranging from 0.72 to 0.97. The efficiency levels in 2013, 2014, 2015, 2016, and 2018 fell below the average. Yueyanglou, Yunxi, Junshan and Dingcheng districts and Hanshou and Taoyuan counties consistently achieved an efficiency value of 1 over 16 consecutive years, representing optimal dynamic efficiency. In contrast, Anxiang (0.71) and Shimen counties (0.70) emerged as the least efficient counties (cities and districts), which was primarily attributed to inadequate agricultural infrastructure and insufficient agricultural machinery resources.
An analysis of Figure 5 reveals that the efficiency of the production stage exhibited a general declining trend, followed by an upturn from 2005 to 2020. Starting in 2013, a downward trend in efficiency became apparent across most counties (cities and districts), with a progressive rebound observed in 2017. This trend suggests inefficiencies in agricultural production during the 2013–2017 period at the production stage. Notably, Shimen County displayed significant fluctuation in efficiency values from 2005 to 2020, dropping as low as 0.33 in 2013. Upon examining the raw data, a gradual decline in the agricultural labor force in Shimen County was identified, from 208,400 individuals in 2005 to 160,100 individuals in 2020, marking a 23% reduction. The agricultural labor force, serving as an input in the production stage, significantly influences the efficiency value of the production stage, thereby contributing to the observed overall decreasing trend.

4.1.2. Efficiency Analysis of the Allocation Stage

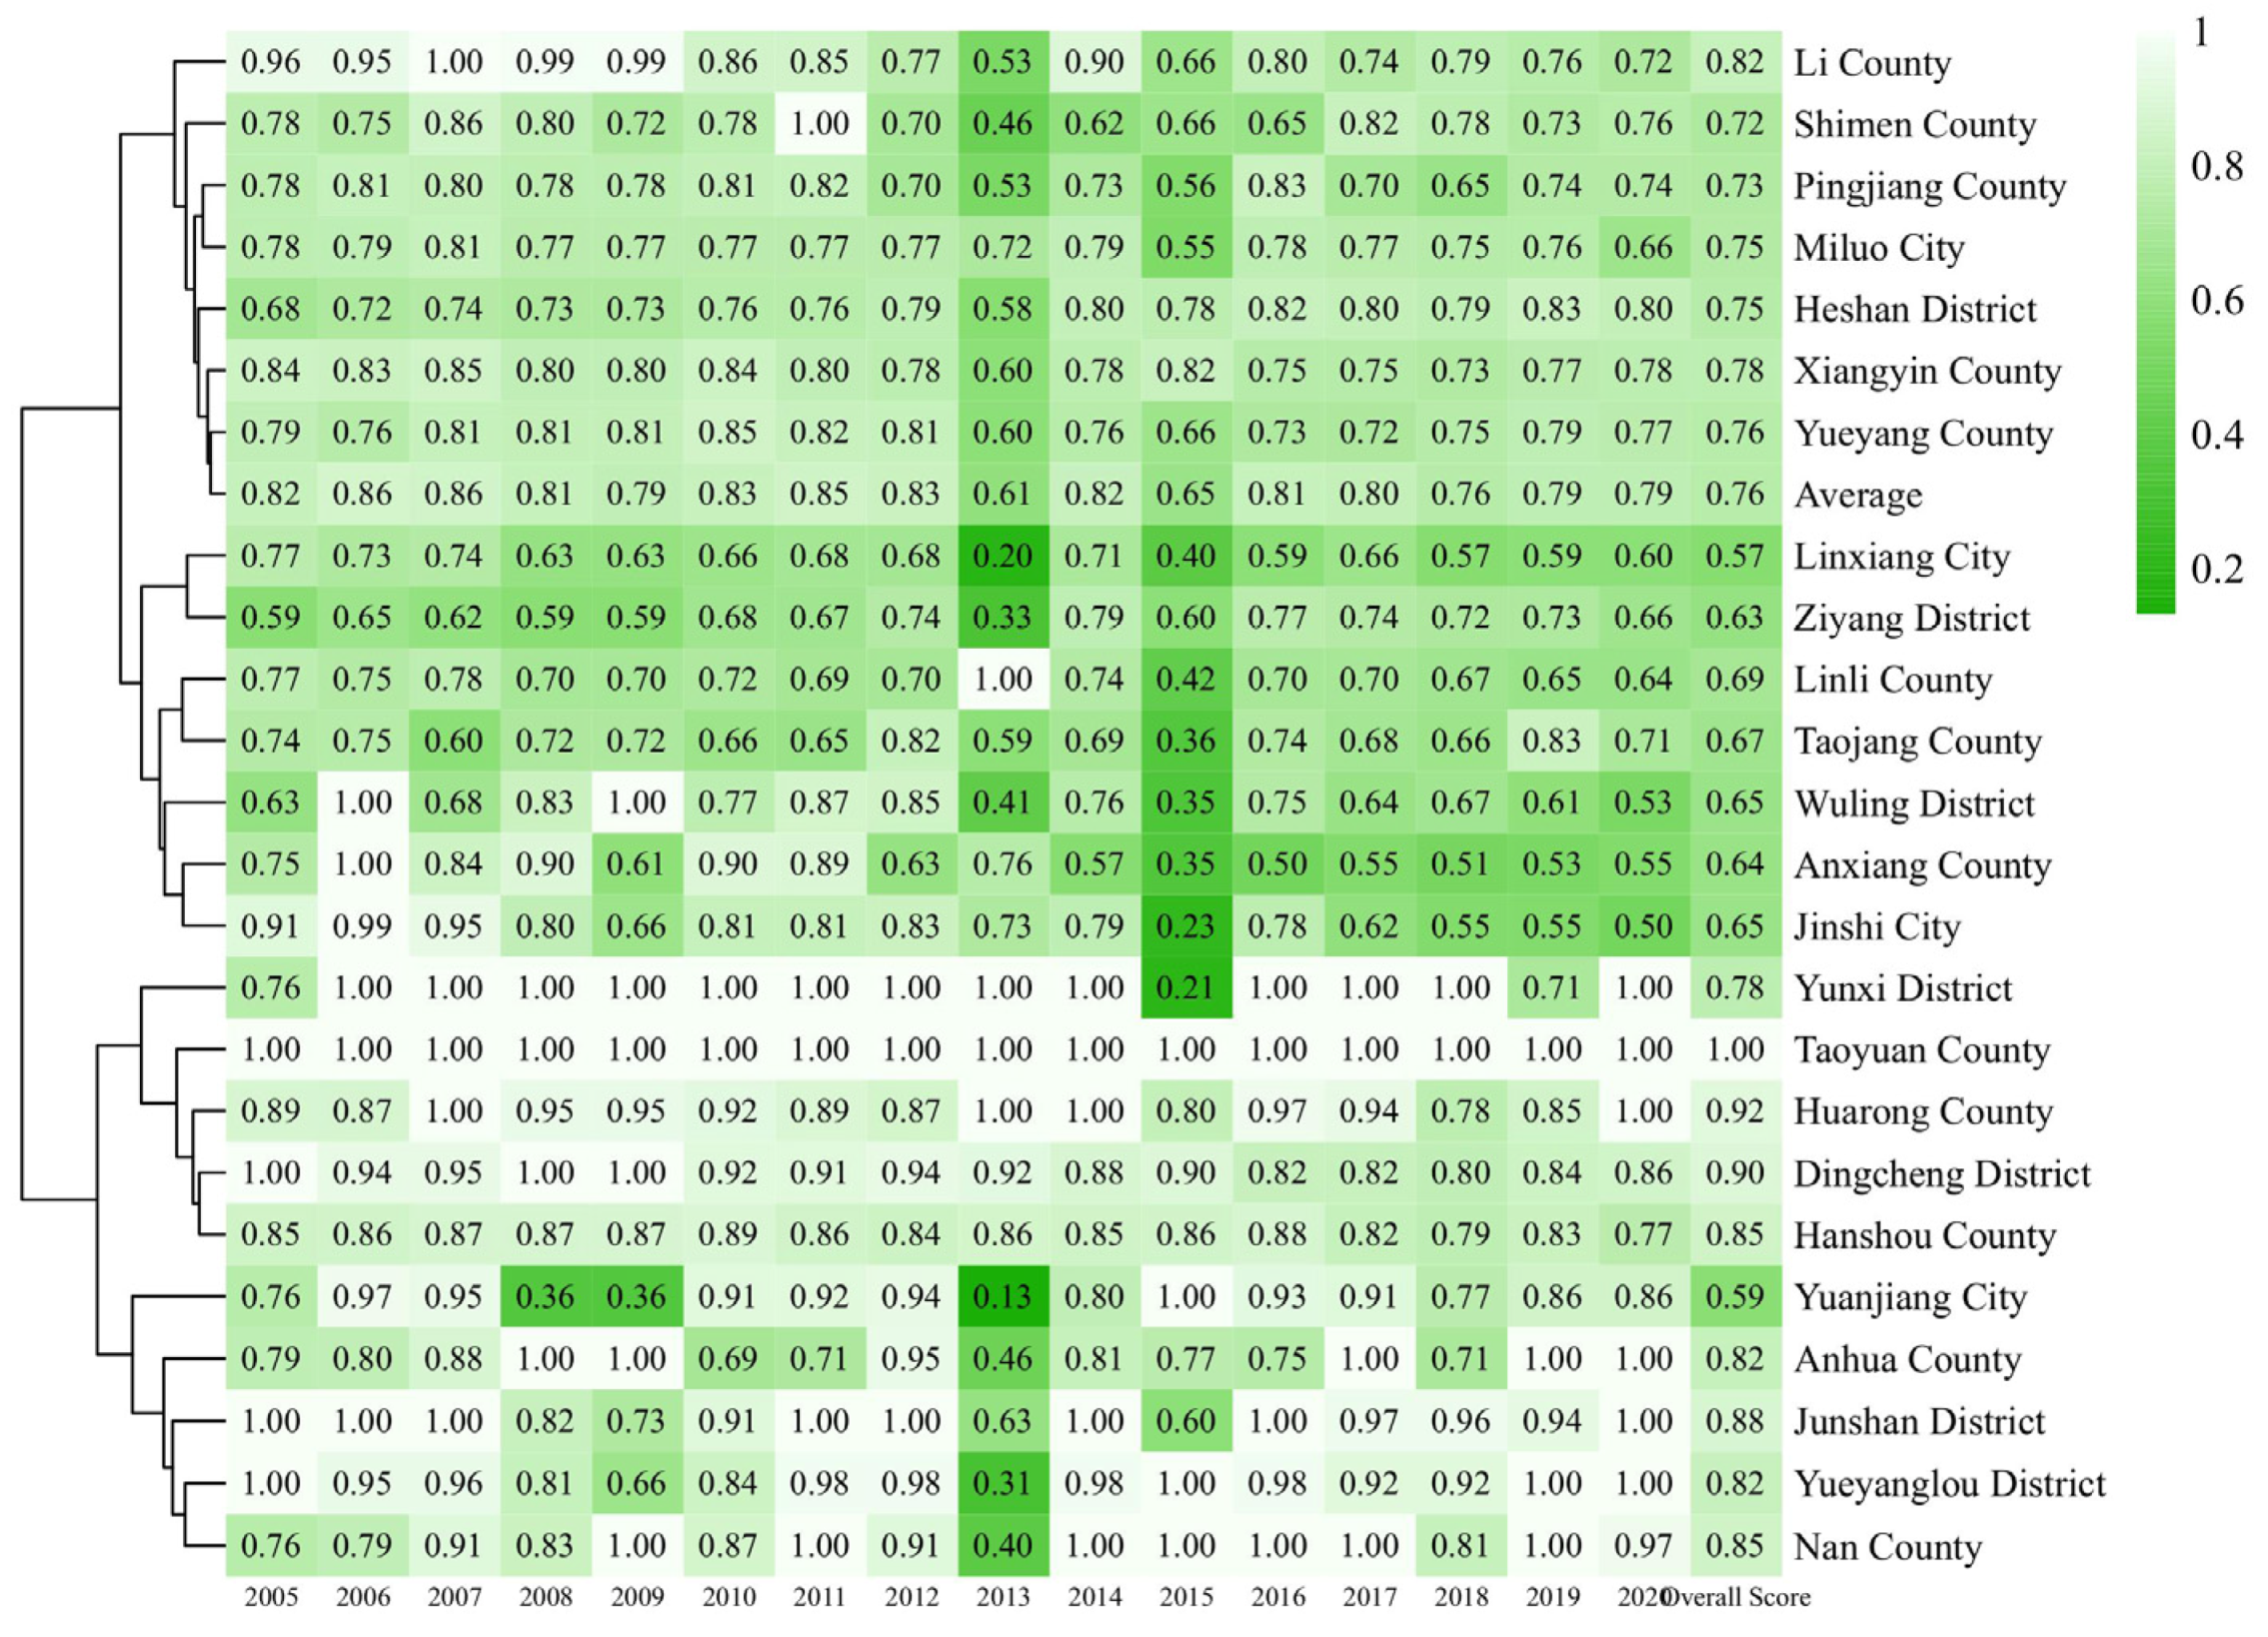
Using the methodology in Section 3.1, the allocation efficiency across various periods and regions was computed, as illustrated in Figure 6. The figure presents a row-based clustering analysis that groups districts exhibiting similar efficiency changes during the allocation stage from 2005 to 2020. Analysis of Figure 6 reveals that the efficiency performance in the allocation stage among the 24 counties (cities and districts) in the Dongting Lake Region lagged considerably behind the efficiency observed at the production stage. The analysis indicates an average efficiency value of 0.73 for the allocation stage, with annual efficiency values ranging from 0.63 to 0.80. The efficiency levels in 2005–2007 and 2010–2012 surpassed the average, signifying an enhancement in overall allocation efficiency. Taoyuan (1.00), Huarong (0.96), and Nan counties (0.90) emerged as the top-ranking counties (cities and districts) with the highest efficiency values in the allocation phase, whereas Linxiang City (0.49), Ziyang District (0.51), and Linli County (0.57) were the least efficient.
Figure 6 indicates an overall upward trend in the efficiency value of the allocation stage; however, the overall efficiency consistently hovered around 0.7, signifying a relatively low efficiency level. This implies that although regions are endeavoring to optimize their resource utilization and allocation during the allocation stage to enhance efficiency, the overall resource allocation during the allocation stage still exhibits inefficiencies characterized by the under- or overinvestment of resources. While certain units under evaluation may demonstrate relative optimization in the production or allocation stage, the overall system efficiency could be impacted if the efficiency of either the allocation or production stage falls short of the optimal value, potentially leading to a decrease in efficiency. Hence, the efficiency of the system is influenced by both the production and allocation stages, highlighting that optimal system efficiency is achieved only when both stages reach an efficiency level of 1.

4.1.3. Dynamic Economic Efficiency Analysis

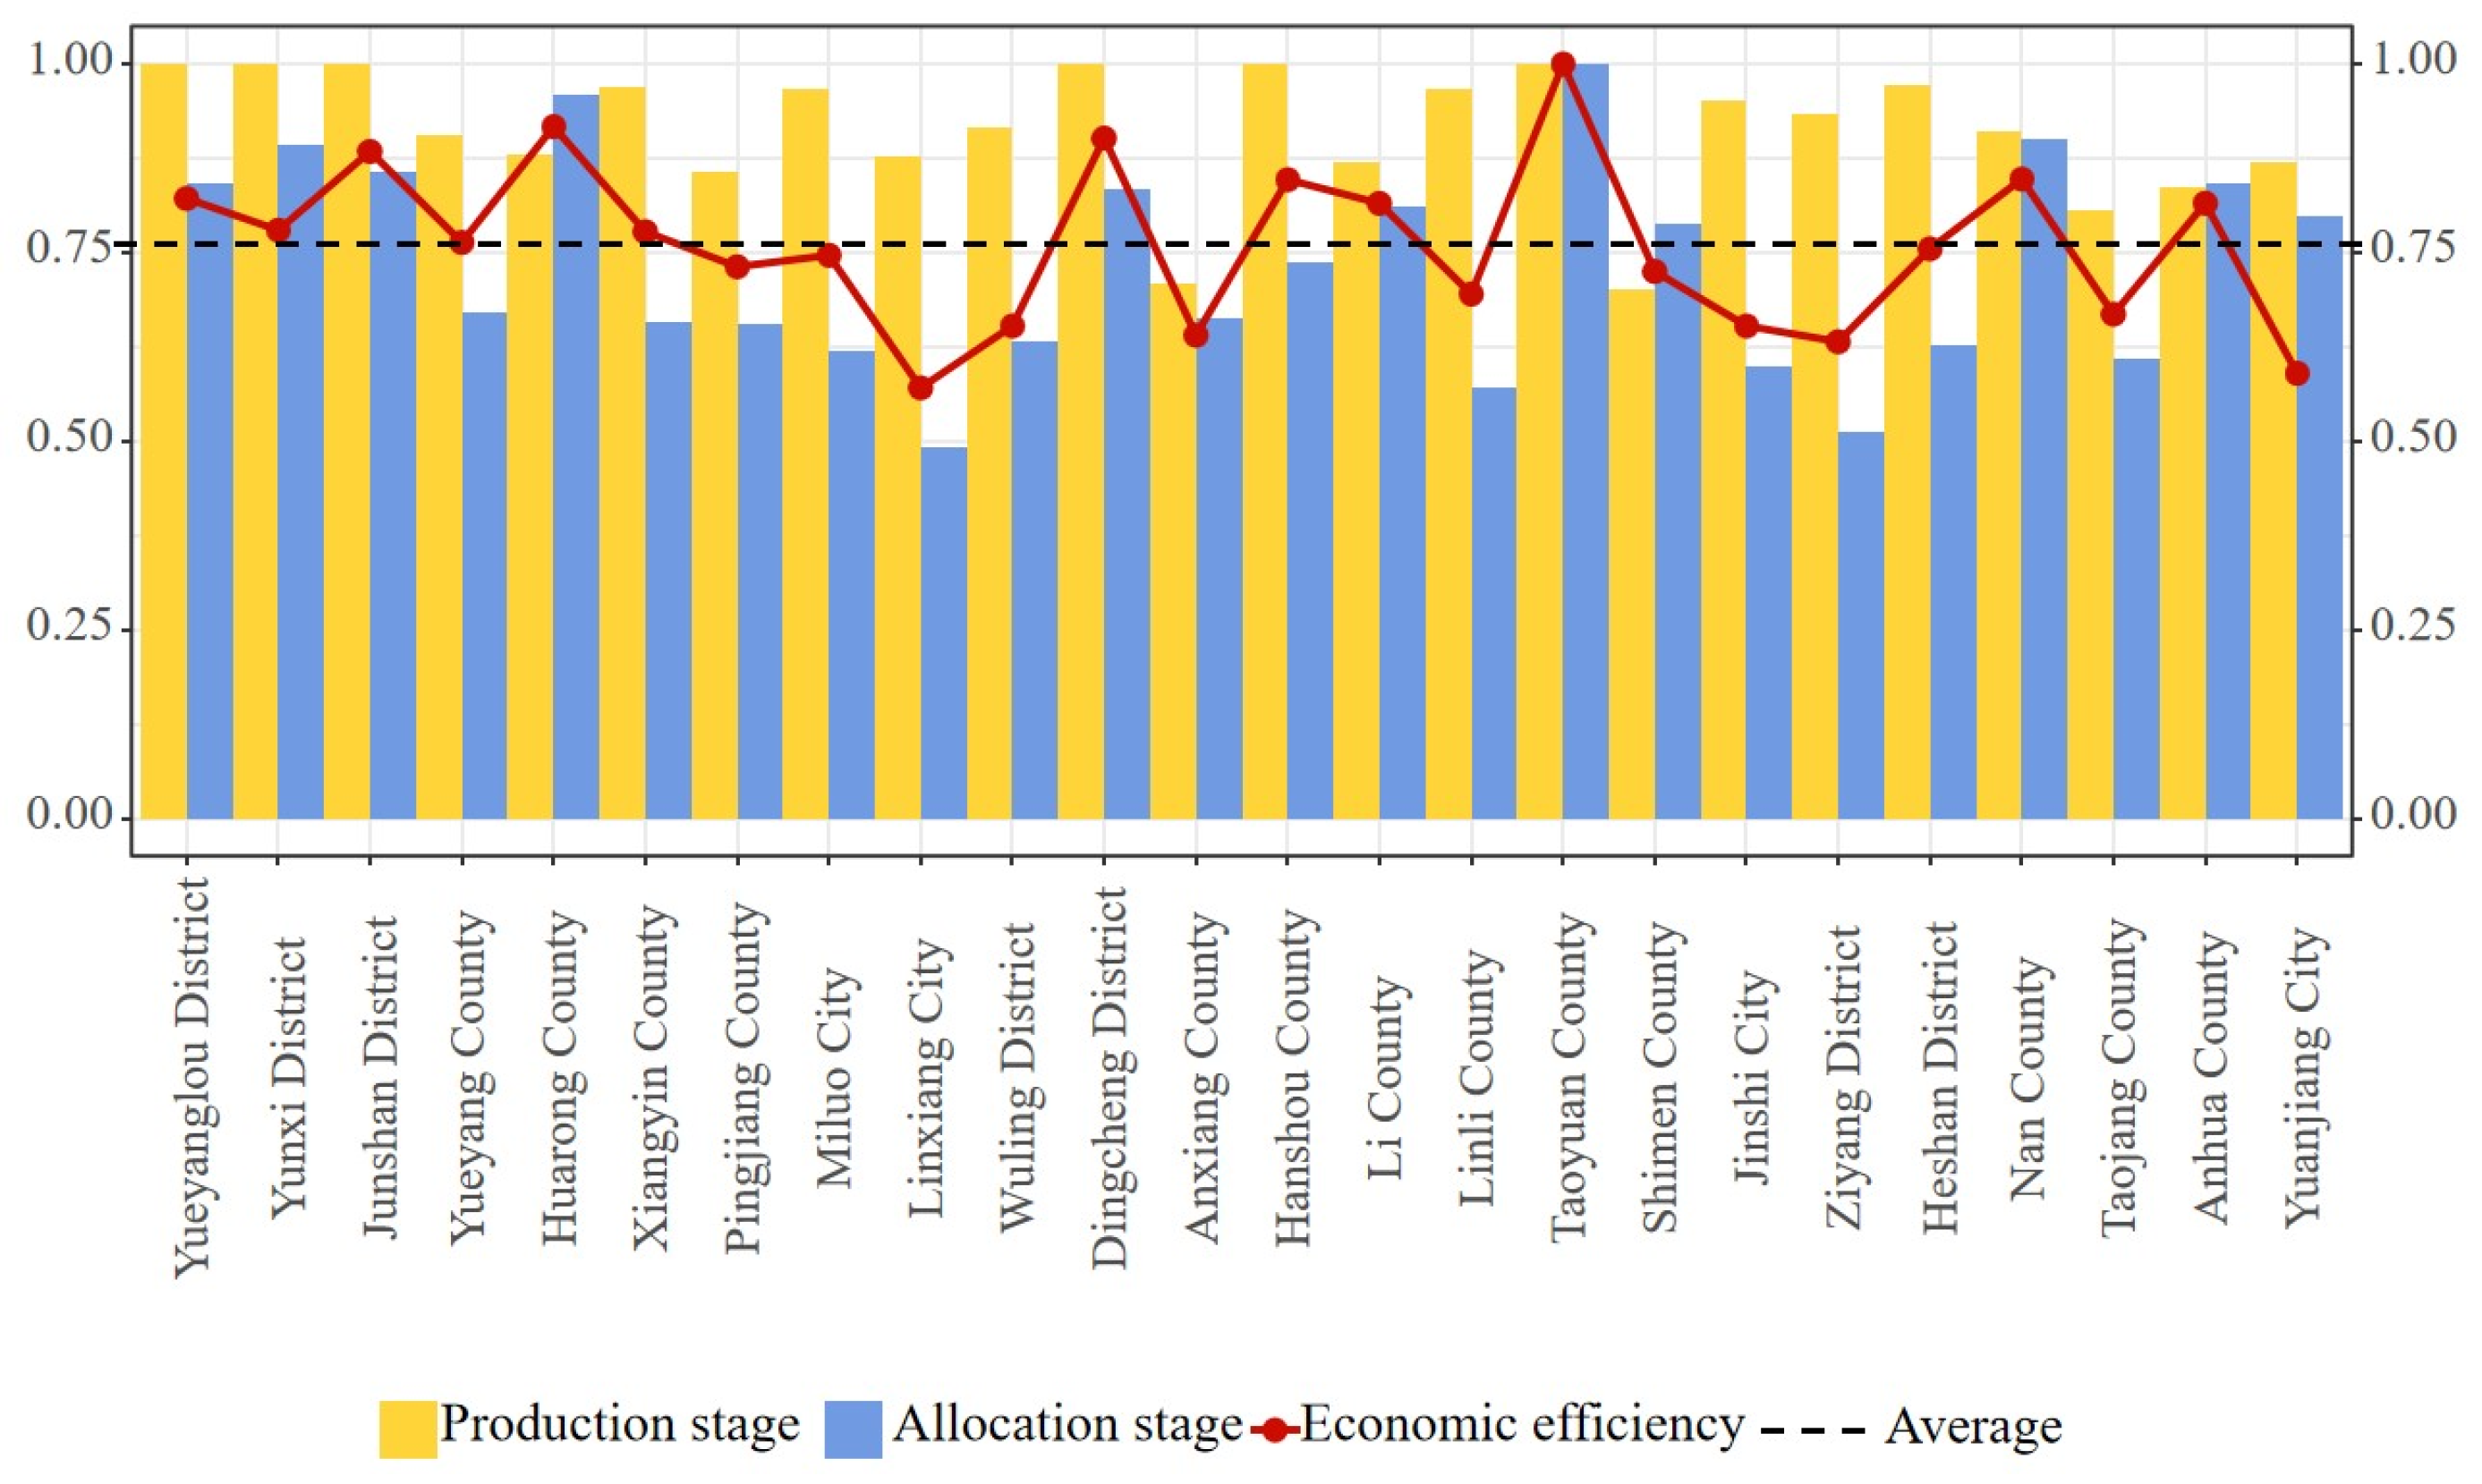
Figure 7 shows the dynamic comprehensive efficiencies for different periods and regions. The figure clearly shows that the dynamic economic efficiency of the 24 counties (cities and districts) in the Dongting Lake Region performed better than the efficiency of the allocation stage but still performed poorly. Figure 7 also shows the clustering analysis by rows. The clustered regions exhibited similar changes in economic efficiency between 2005 and 2020. Analysis of the figure indicates a fluctuating trend in dynamic economic efficiency, with values initially decreasing before rebounding, reaching a low point in 2013 and subsequently rising. The average economic efficiency over the 16-year period was 0.76, with annual values fluctuating between 0.61 and 0.86. Notably, the efficiency values only fell below the average in 2013 (0.61), 2015 (0.65), and 2018 (0.76). Taoyuan County emerged as the top-performing district, boasting a perfect economic efficiency score of 1 over 16 years. Following closely were Huarong County (0.92) and Dingcheng (0.90) and Junshan districts (0.89), which displayed relatively high economic efficiency values. Approximately half of the districts had above average economic efficiency, whereas the others still had relatively low efficiency values, with Yuanjiang City (0.59), Ziyang District (0.63), and Anxiang County (0.64) having the lowest economic efficiency.
To examine the fluctuations in stage efficiency and economic efficiency, as illustrated in Figure 8, districts that exceled in either the production or allocation stage may exhibit subpar performance. For instance, Linxiang City and Wuling District experienced a decline in economic efficiency owing to their below-average efficiency in the allocation stage. Yueyanglou, Yunxi, Junshan, and Dingcheng districts and Taoyuan County showed superior production stage performance, with efficiencies in the allocation stage surpassing the average, resulting in comprehensive efficiencies exceeding the average. Figure 8 illustrates that districts failing to surpass the average economic efficiency often have at least one stage where efficiency falls short of the average, with the exception of Yuanjiang City. Despite both its production and allocation stages exceeding the average efficiency, Yuanjiang City’s economic efficiency remained below average because of its relatively low individual stage efficiencies.

4.2. Dynamic Network Total Factor Productivity (DN-TFP) Analysis

To understand the growth of total factor productivity in the Dongting Lake Region, this study set 2005 as the base period to more intuitively visualize the changes in productivity in each period. During the 16-year period, the average values of the production and allocation stages in the Dongting Lake Region were 1.4162 and 0.9405, respectively, and the average dynamic total productivity was 1.1118.
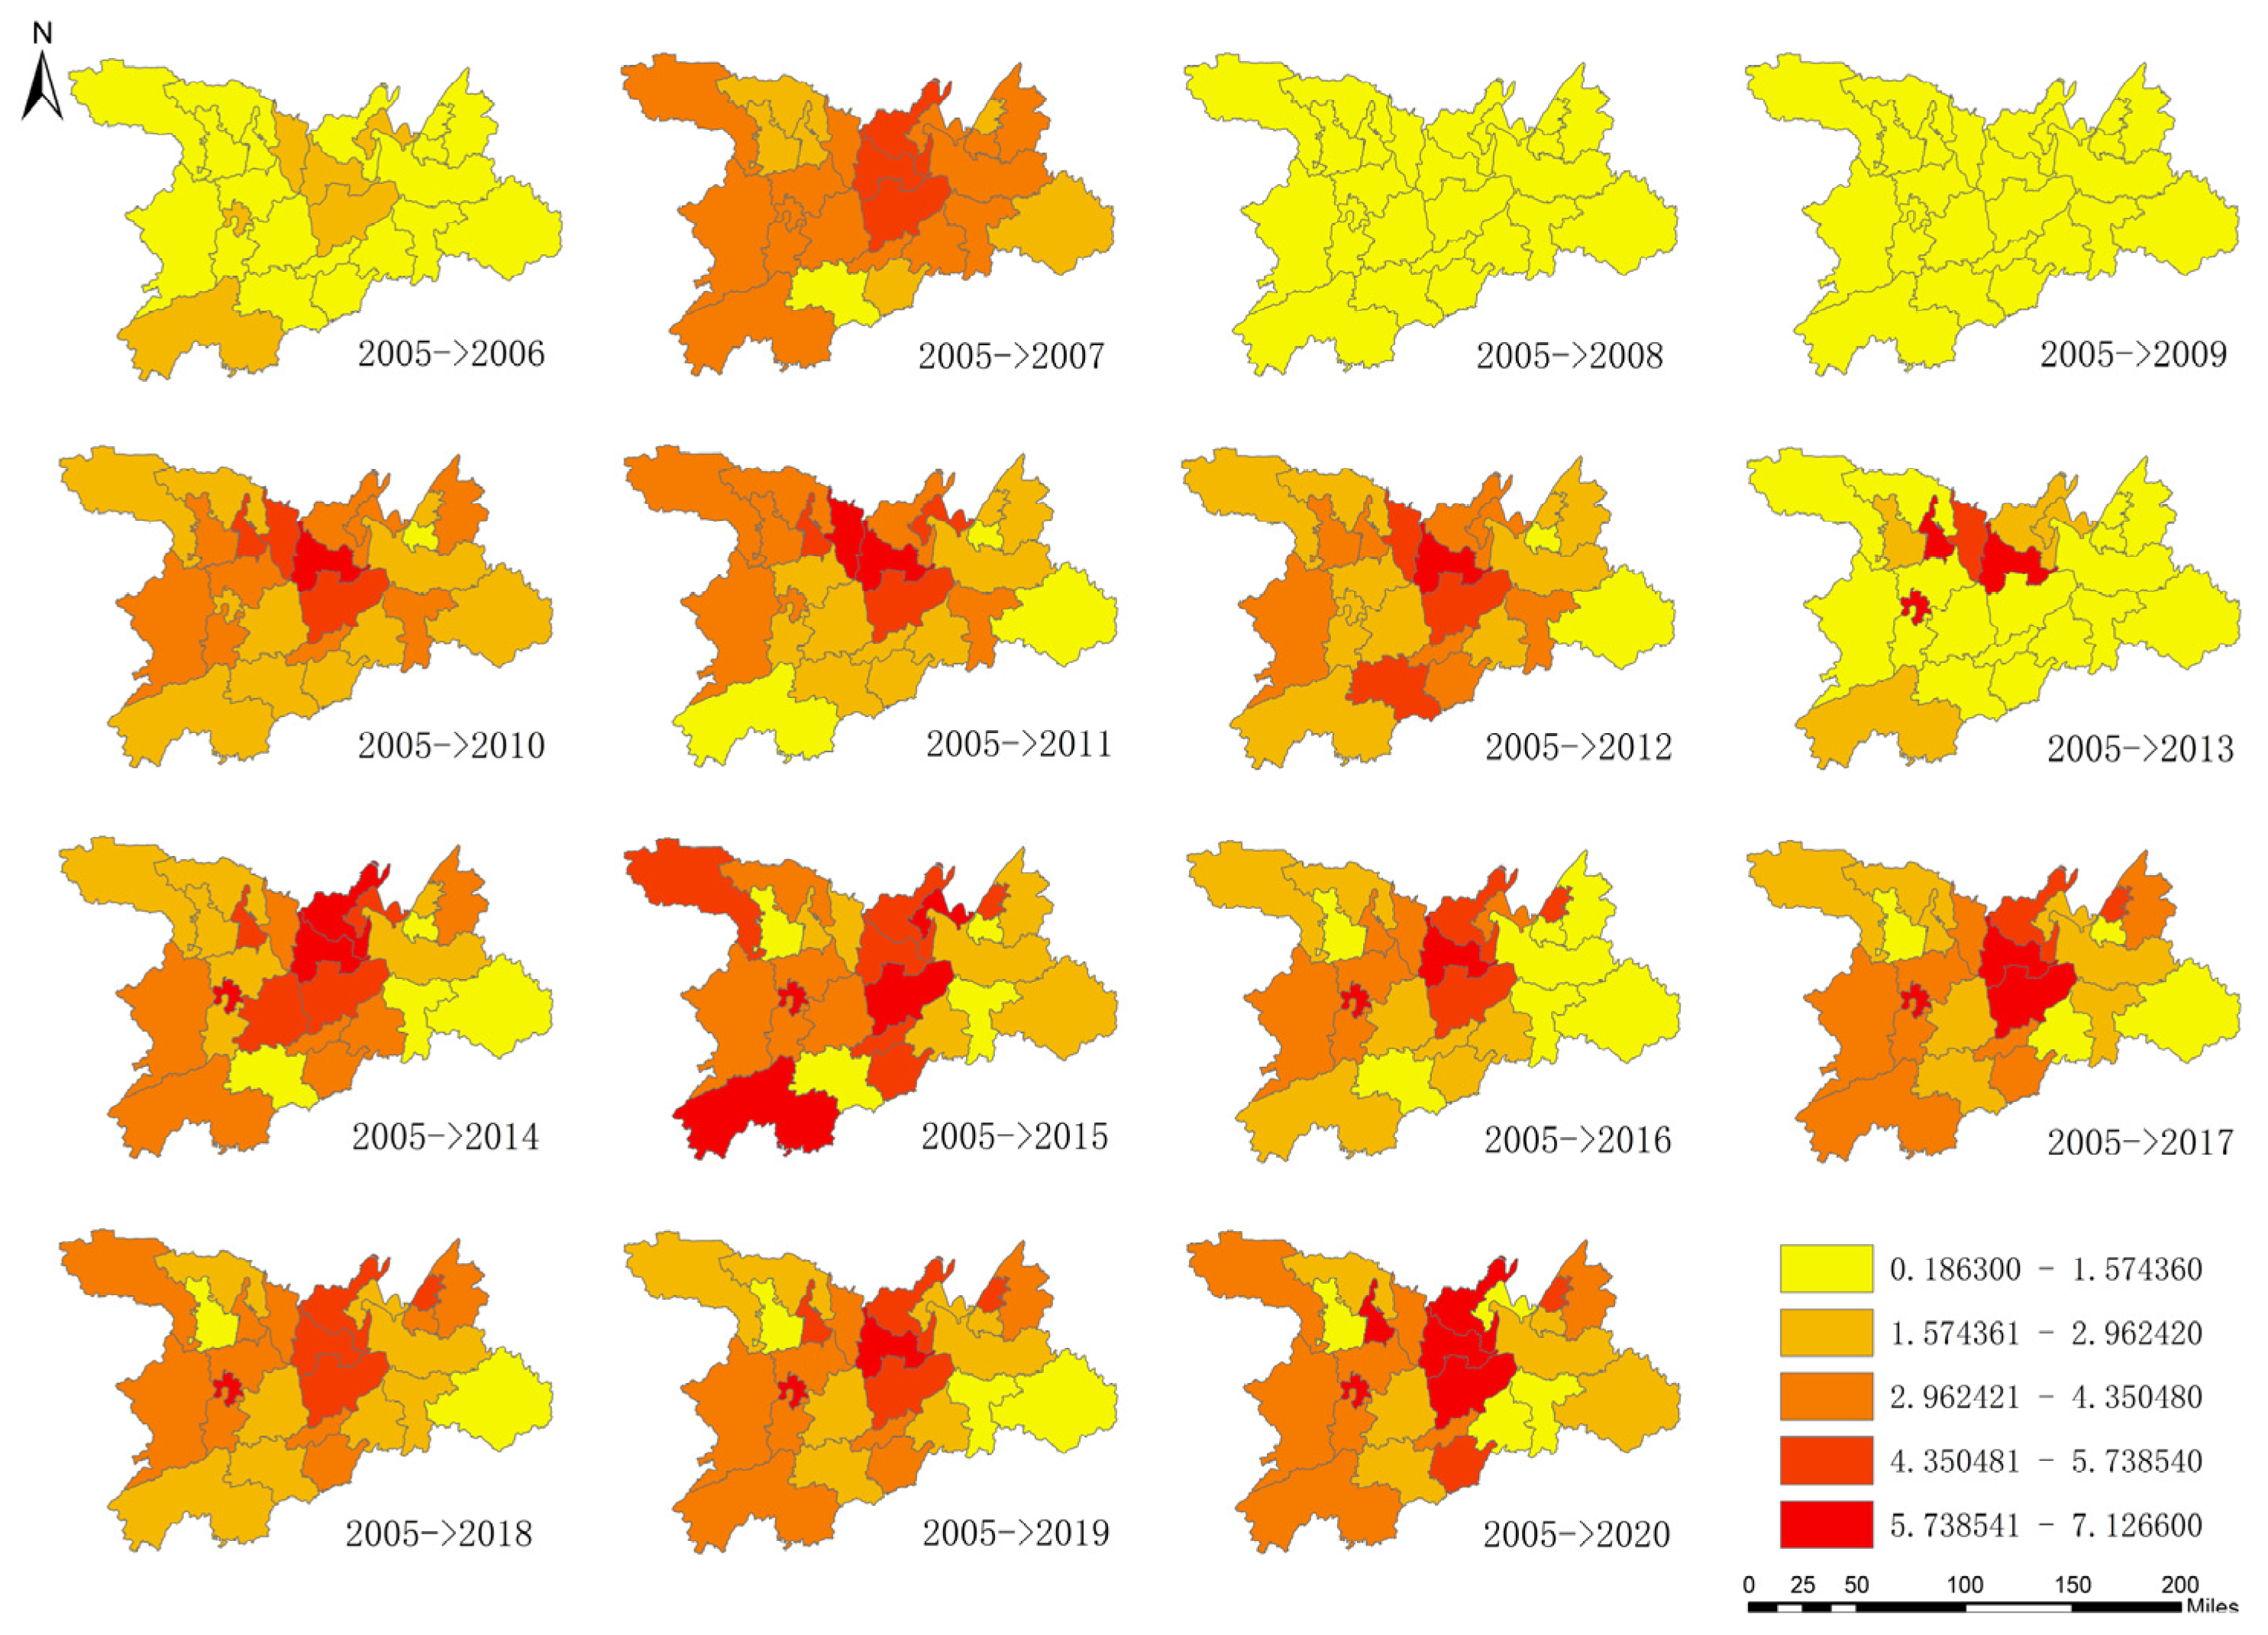
Fluctuations in productivity at the production stage across the 24 counties (cities and districts) in the Dongting Lake Region from 2005 to 2020 are shown in Figure 9. Over this 16-year period, the production stage showed a pattern of initial decline followed by an upswing in productivity. This was particularly notable in the central and northwestern Dongting Lake Region, which exhibited commendable productivity performance. The analysis revealed that productivity at the production stage increased in over 60% of the districts during the past 16 years. Notably, Yunxi District, Huarong County, Wuling District, Jin City, Heshan District, Nan County, and Yuanjiang City exceeded the average productivity at the production stage, with Wuling District (3.2062), Nan County (3.0273), and Yuanjiang City (2.4141) leading the way. Conversely, productivity at the production stage decreased in the following nine districts: Yueyanglou and Junshan districts, Miluo City, and Xiangyin, Pingjiang, Hanshou, Li, Linli, and Taogang counties. Of note, Linli County registered the most significant decline at 0.7356.
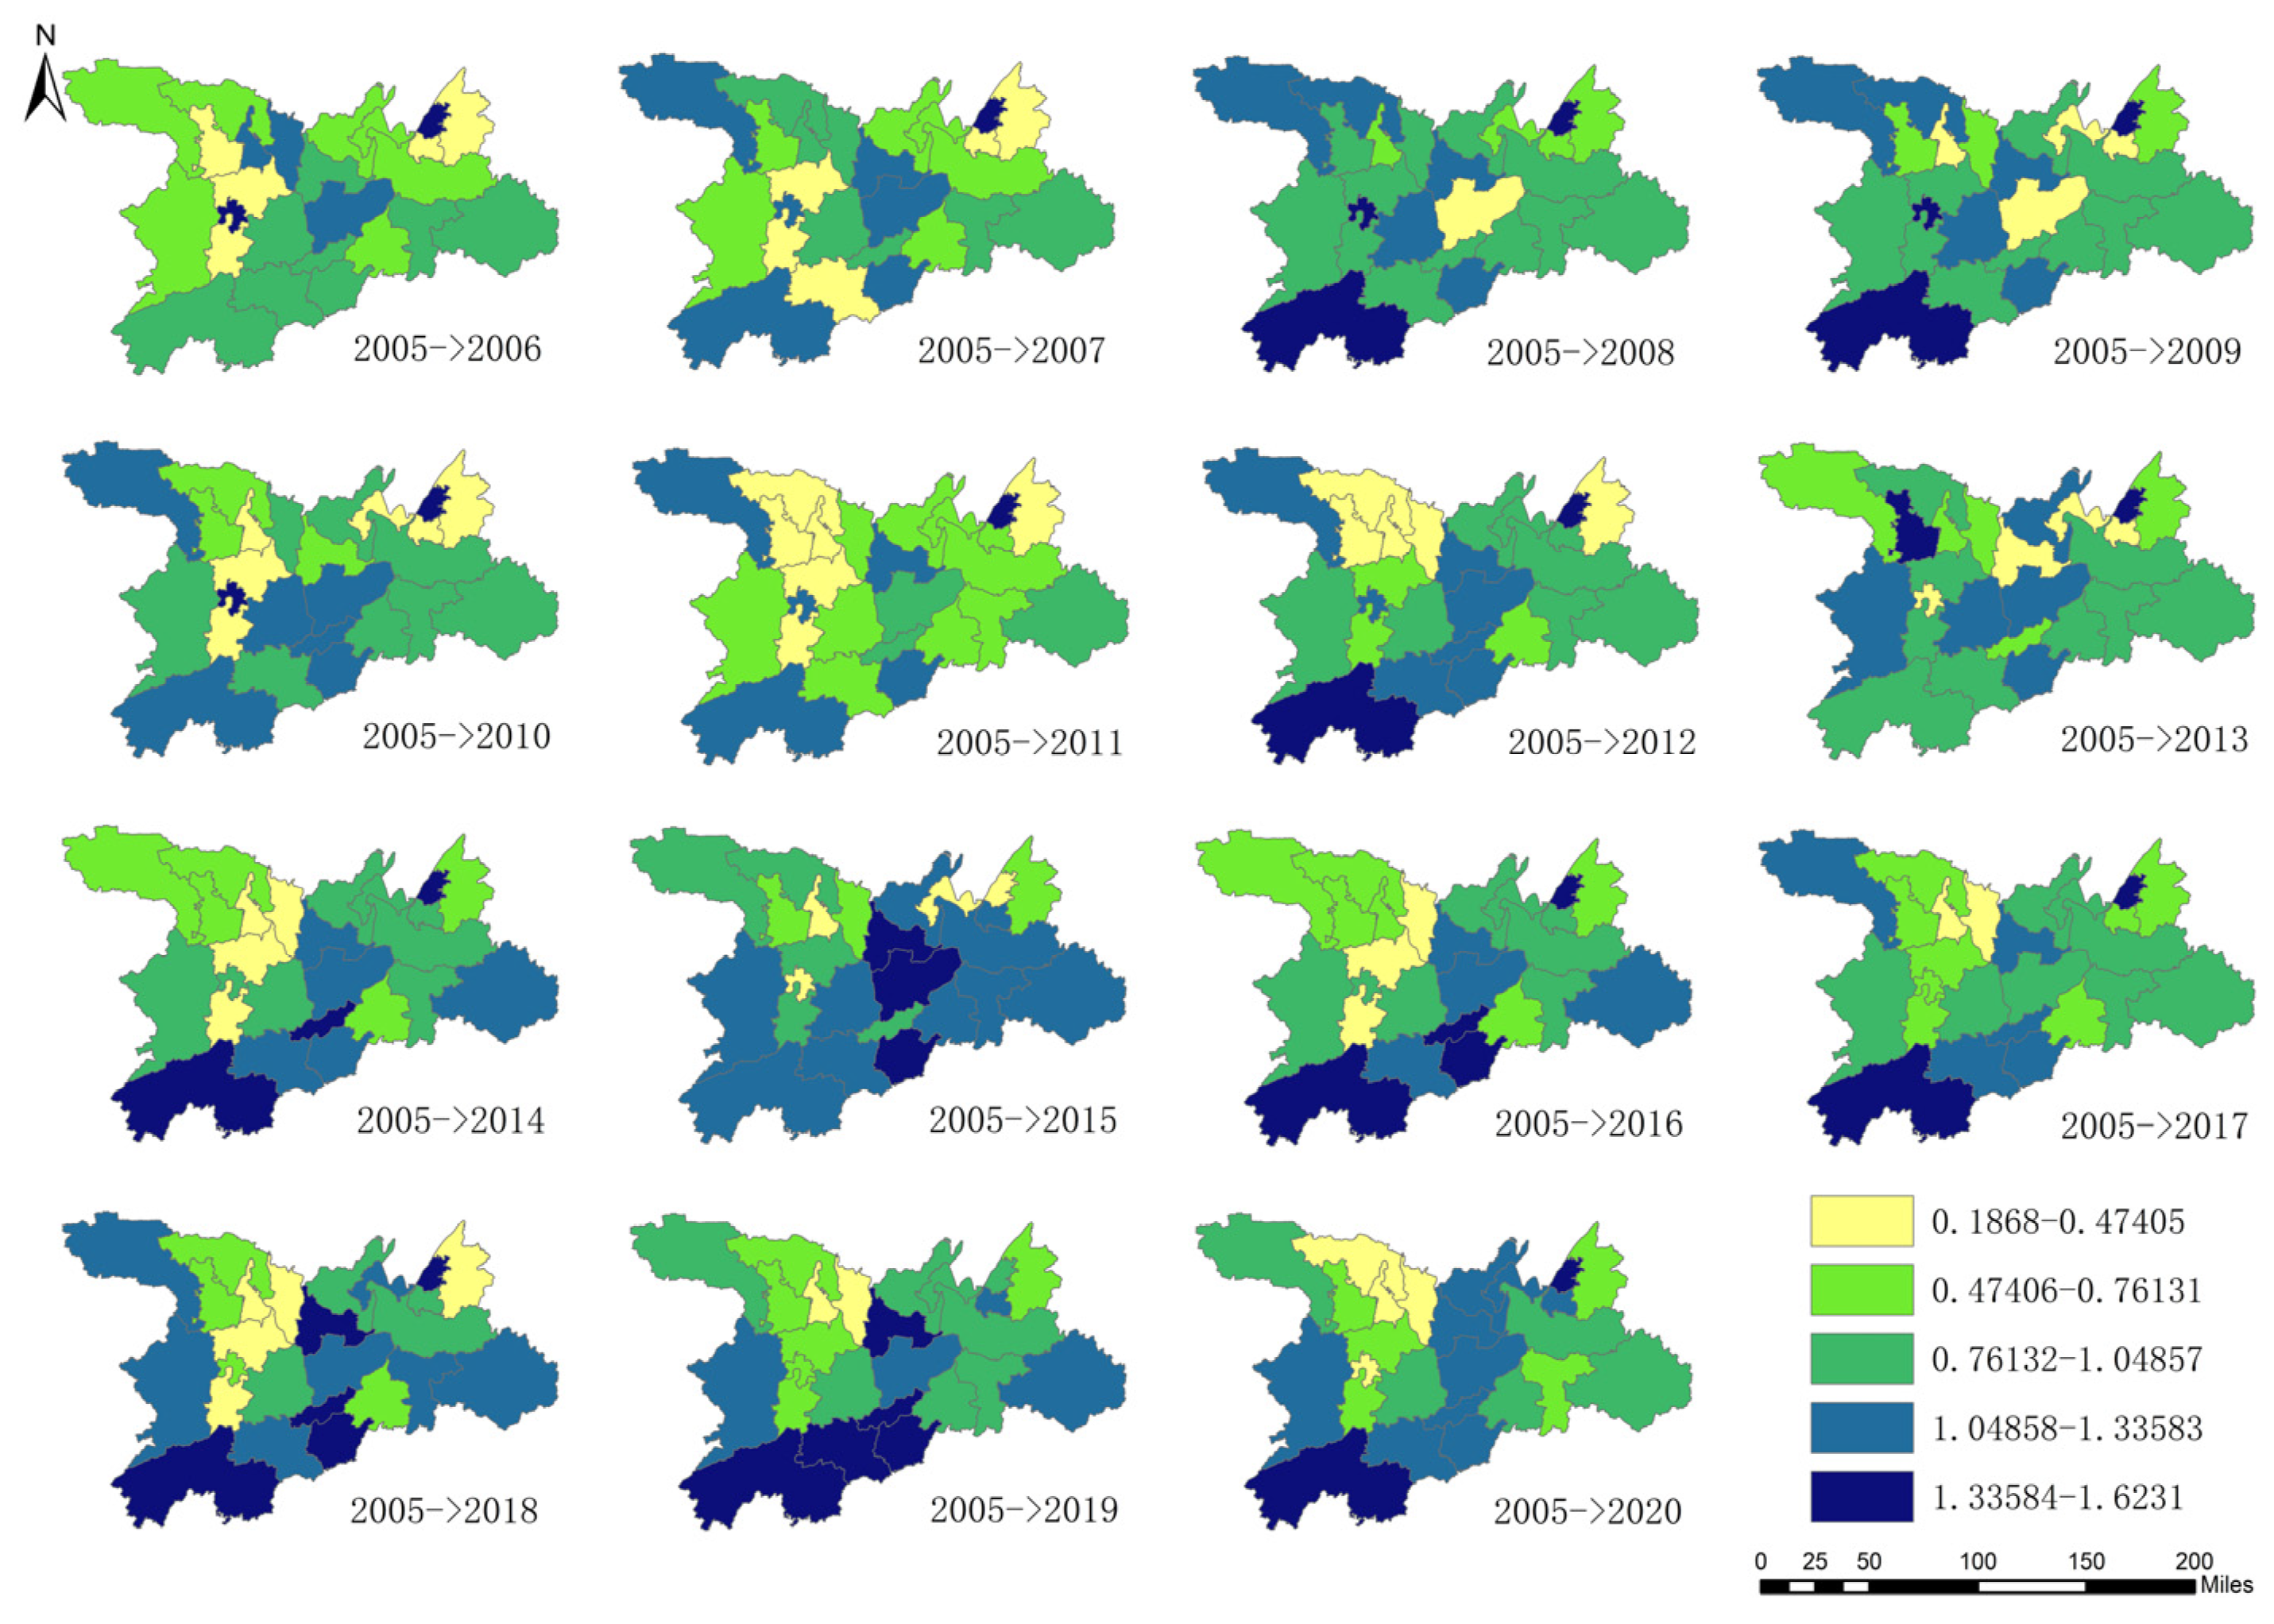
Figure 10 shows the variations in productivity at the allocation stage across the 24 counties (cities and districts) in the Dongting Lake Region from 2005 to 2020. The analysis in Figure 10 reveals superior productivity performance at the allocation stage in the southwestern Dongting Lake Region. The analysis indicated that approximately 41% of the districts experienced an increase in productivity at the allocation stage, which was primarily attributed to the decrease in grain production. Eleven regions, including Yueyanglou, Yunxi, and Junshan districts and Huarong County, exhibited above-average productivity at the allocation stage, with Yunxi District (1.623), Anhua County (1.5277), and Heshan District (1.291) having the highest levels of productivity. Conversely, productivity in the allocation stage decreased in 14 districts, including Junshan District, Yueyang County, Xiangyin County, and Pingjiang County, with Jinshi City experiencing the most significant decline at only 0.3991.
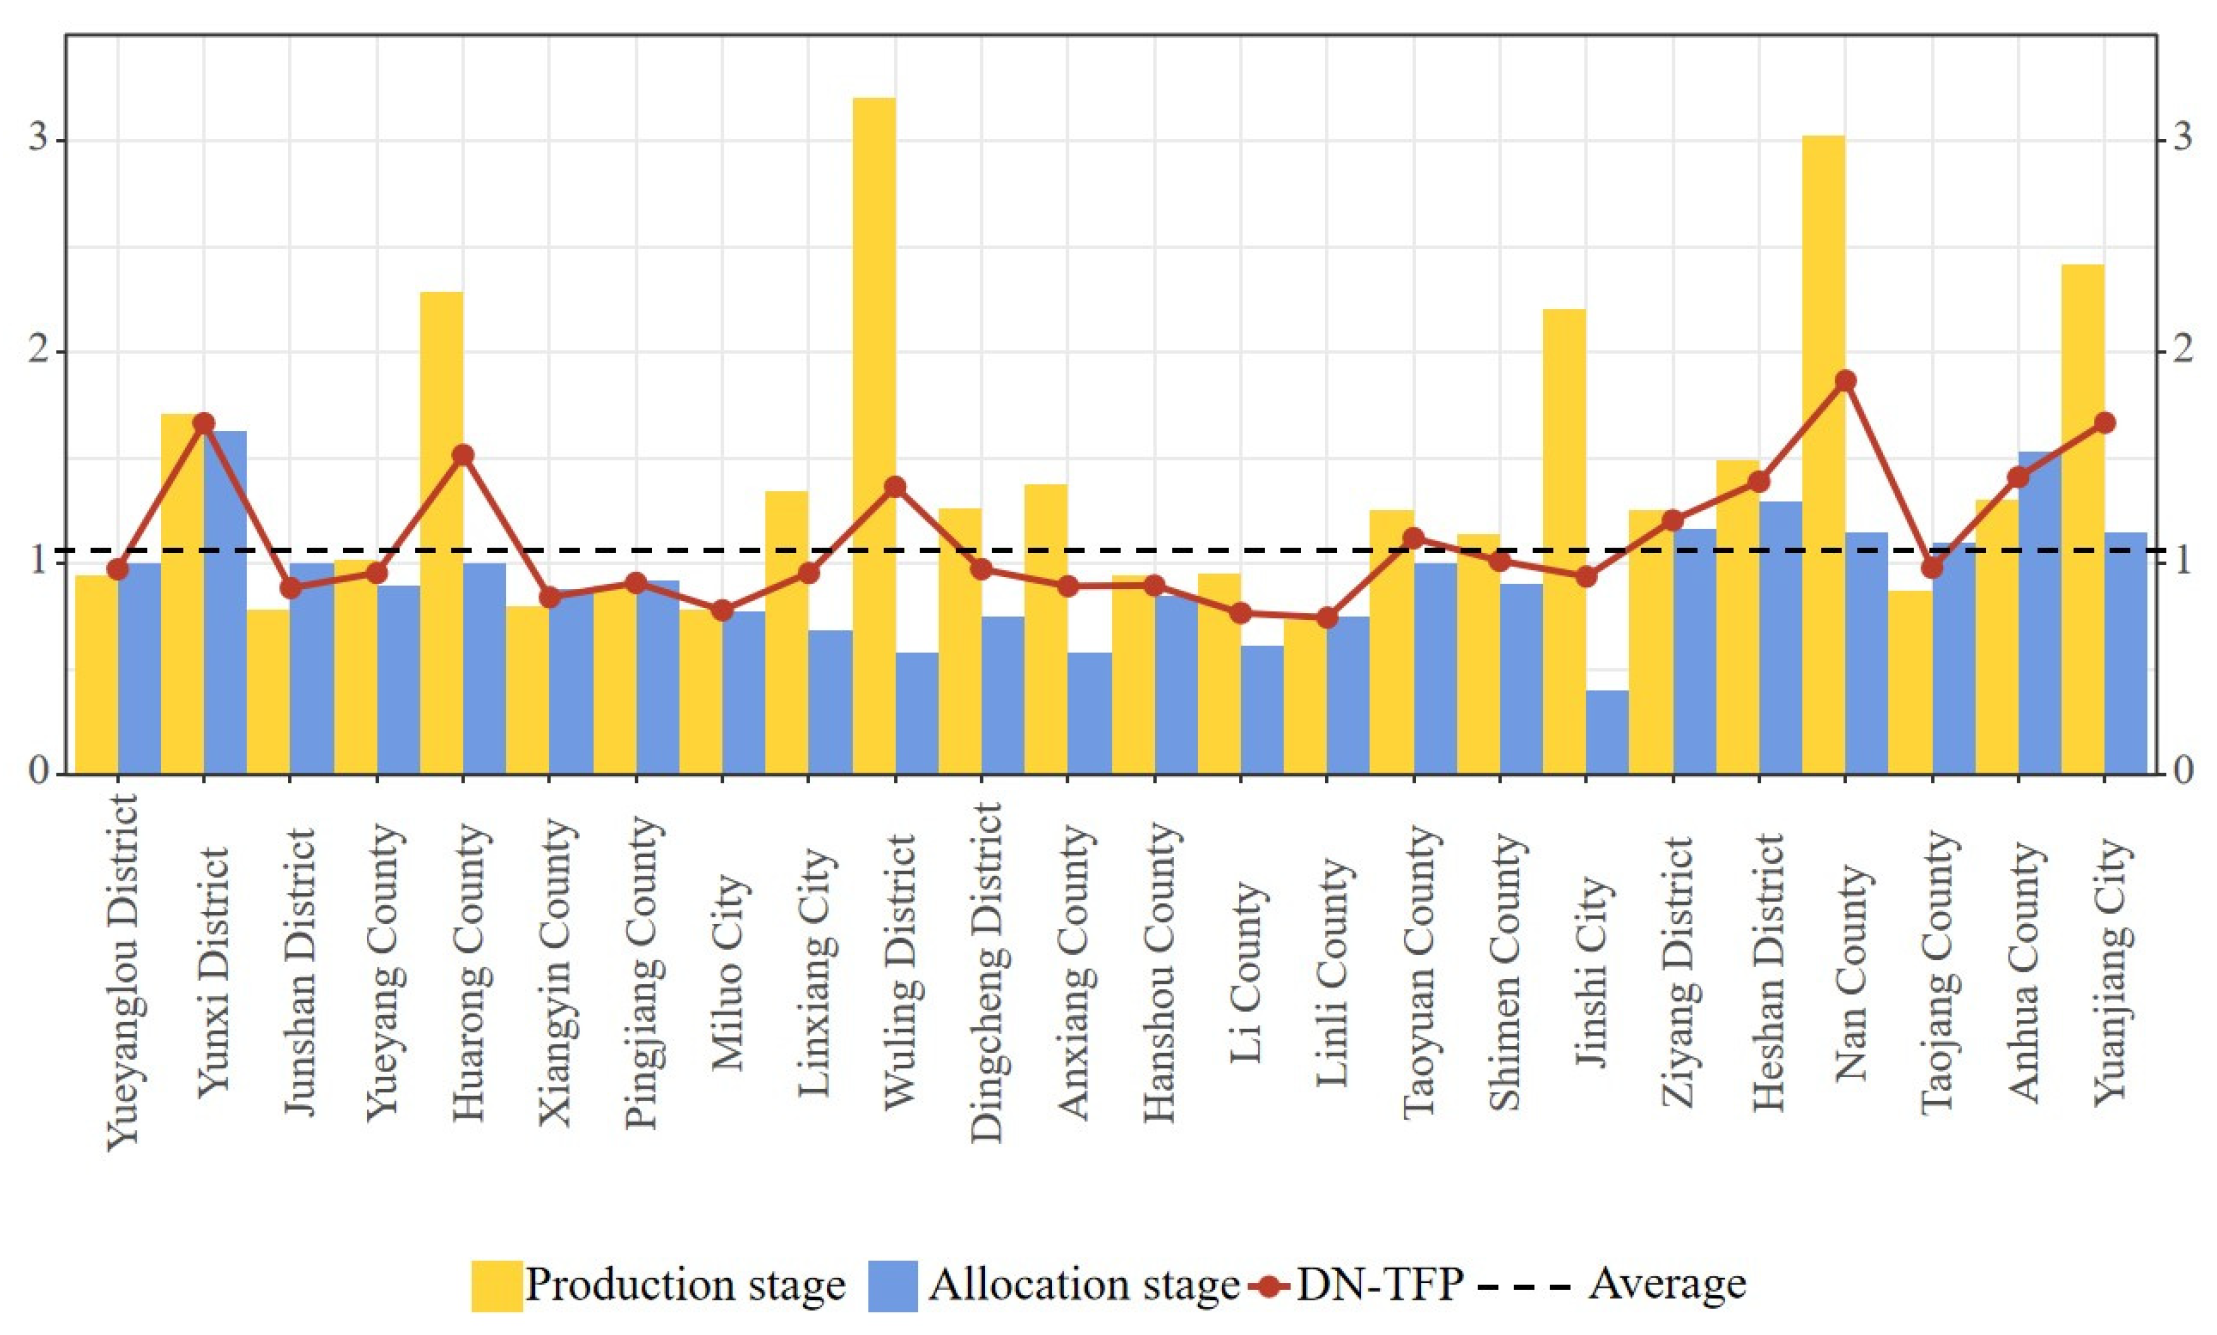
During the 16-year period, only 38% of the districts experienced an increase in total productivity, as shown in Figure 11. The most substantial productivity growth was noted in Nam District (1.8651), Nguyen Giang City (1.6657), and Yunxi District (1.6635). Notably, although productivity at the allocation stage has been declining in Nam County and Nguyen Duong City, the overall productivity has increased owing to a notable increase in productivity at the production stage. Figure 11 indicates that approximately 62% of the districts encountered a decrease in total productivity, primarily stemming from factors such as agricultural labor shortages and surplus input resources, which ultimately impact efficiency and total productivity. Several of these districts exhibited above-average productivity at the production stage but below-average productivity at the allocation stage, leading to reduced overall productivity. Linli (0.7438) and Li counties (0.7651) experienced the most significant decrease in total productivity. Conversely, Yunxi, Ziyang, and Heshan districts, Nanxian and Anhua counties, and Yuanjiang City demonstrated a consistent upward trajectory in productivity in both the production and allocation stages throughout the 16-year period, showcasing the balanced growth across these stages.

5. Discussion

5.1. Management Decision Matrix

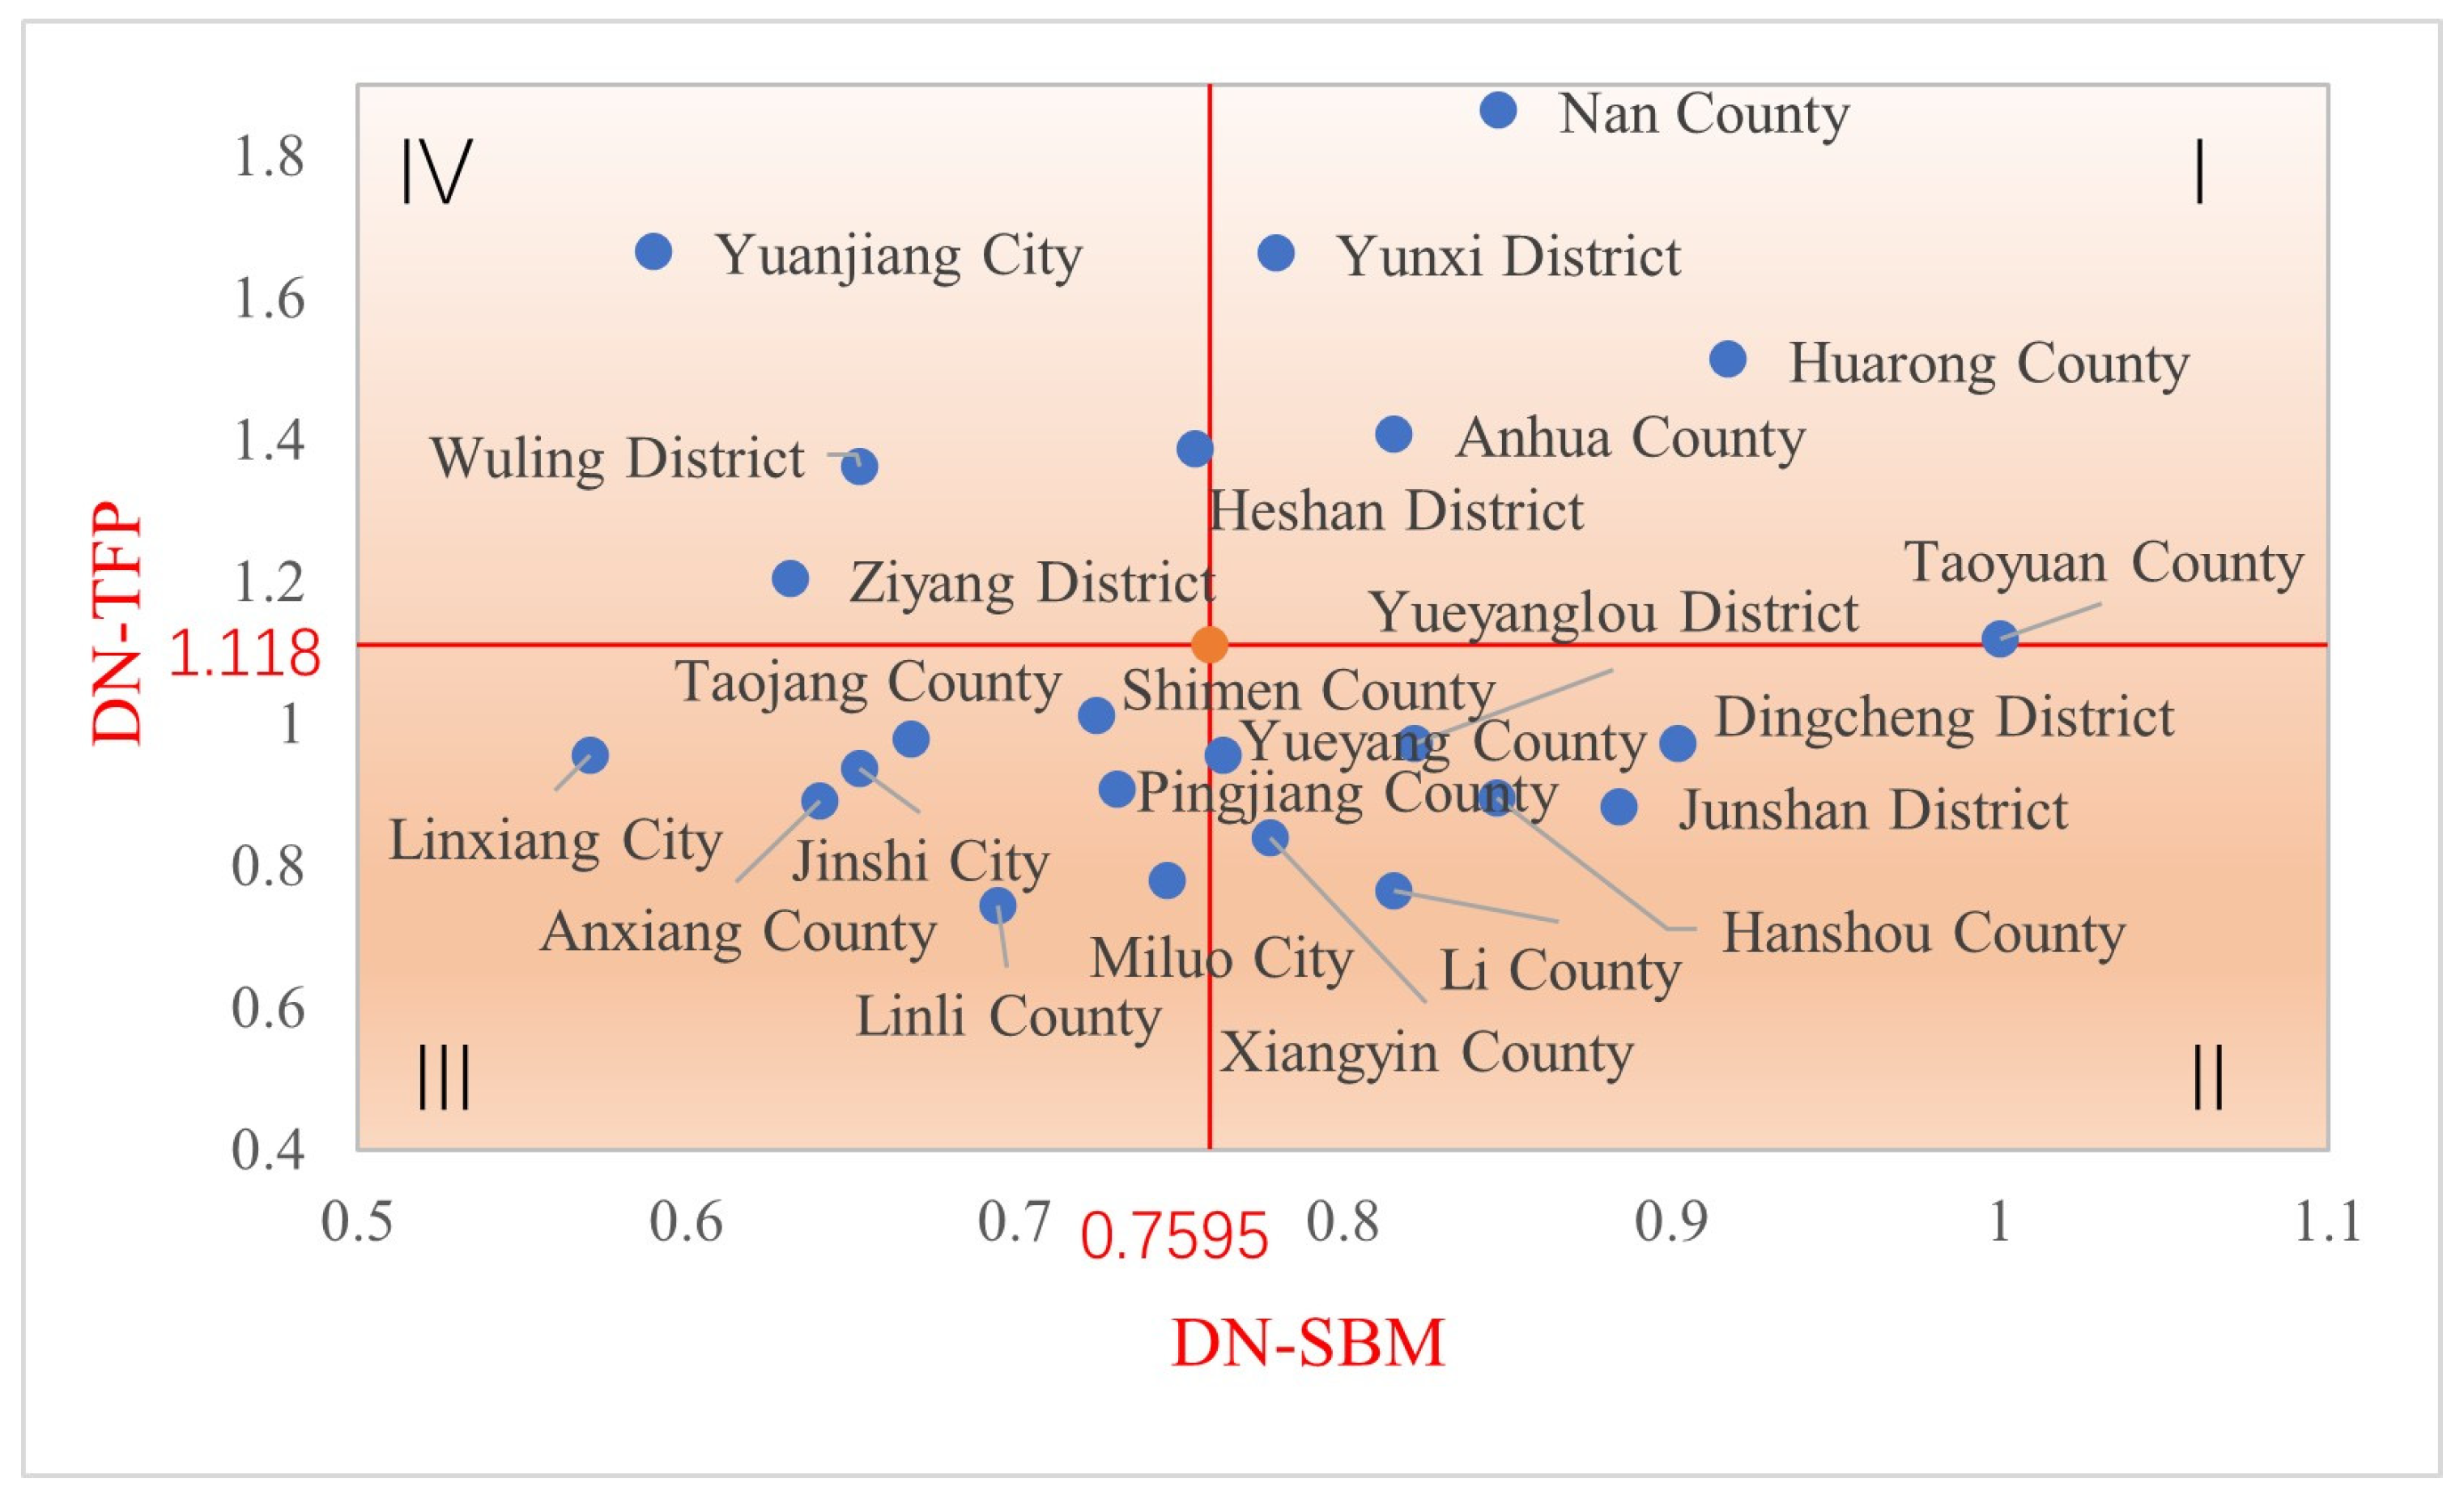
To visualize the efficiency performance and productivity in the production and allocation stages in the Dongting Lake Region, the average value of economic efficiency (0.7595) was used as the dividing line on the horizontal axis, and the average value of total factor productivity (1.1118) was used as the dividing line on the vertical axis. The graph is divided into four quadrants, as shown in Figure 12.
The first quadrant (I) includes five regions exhibiting notably high economic efficiency and total factor productivity, namely Nan County, Yunxi District, Huarong County, Anhua County, and Taoyuan County, positioning them as valuable benchmarks for study by other regions.
The second quadrant (II) includes seven districts, namely Yueyang County, Yueyanglou District, Dingcheng District, Junshan District, Hanshou County, Xiangyin County, and Li County. Although these districts showed improved efficiency, they also witnessed a decrease in total factor productivity. Consequently, these districts must reassess and restructure their production and allocation strategies to enhance productivity and efficiency.
The third quadrant (III) included eight regions, namely Linxiang City, Anxiang County, Jin City, Taojiang County, Shimen County, Pingjiang County, Linli County, and Miluo City. These regions exhibited low efficiency levels and diminishing trends in total factor productivity. Consequently, enhancing economic efficiency and implementing strategic adjustments are essential for bolstering the efficiency and productivity of agricultural production in these areas.
The fourth quadrant (IV) includes Yuanjiang City and its districts (Wuling, Ziyang, and Heshan). While these districts witnessed an improvement in total factor productivity, they show potential for further efficiency enhancement and resource allocation optimization.

5.2. Agricultural Production Value Chain

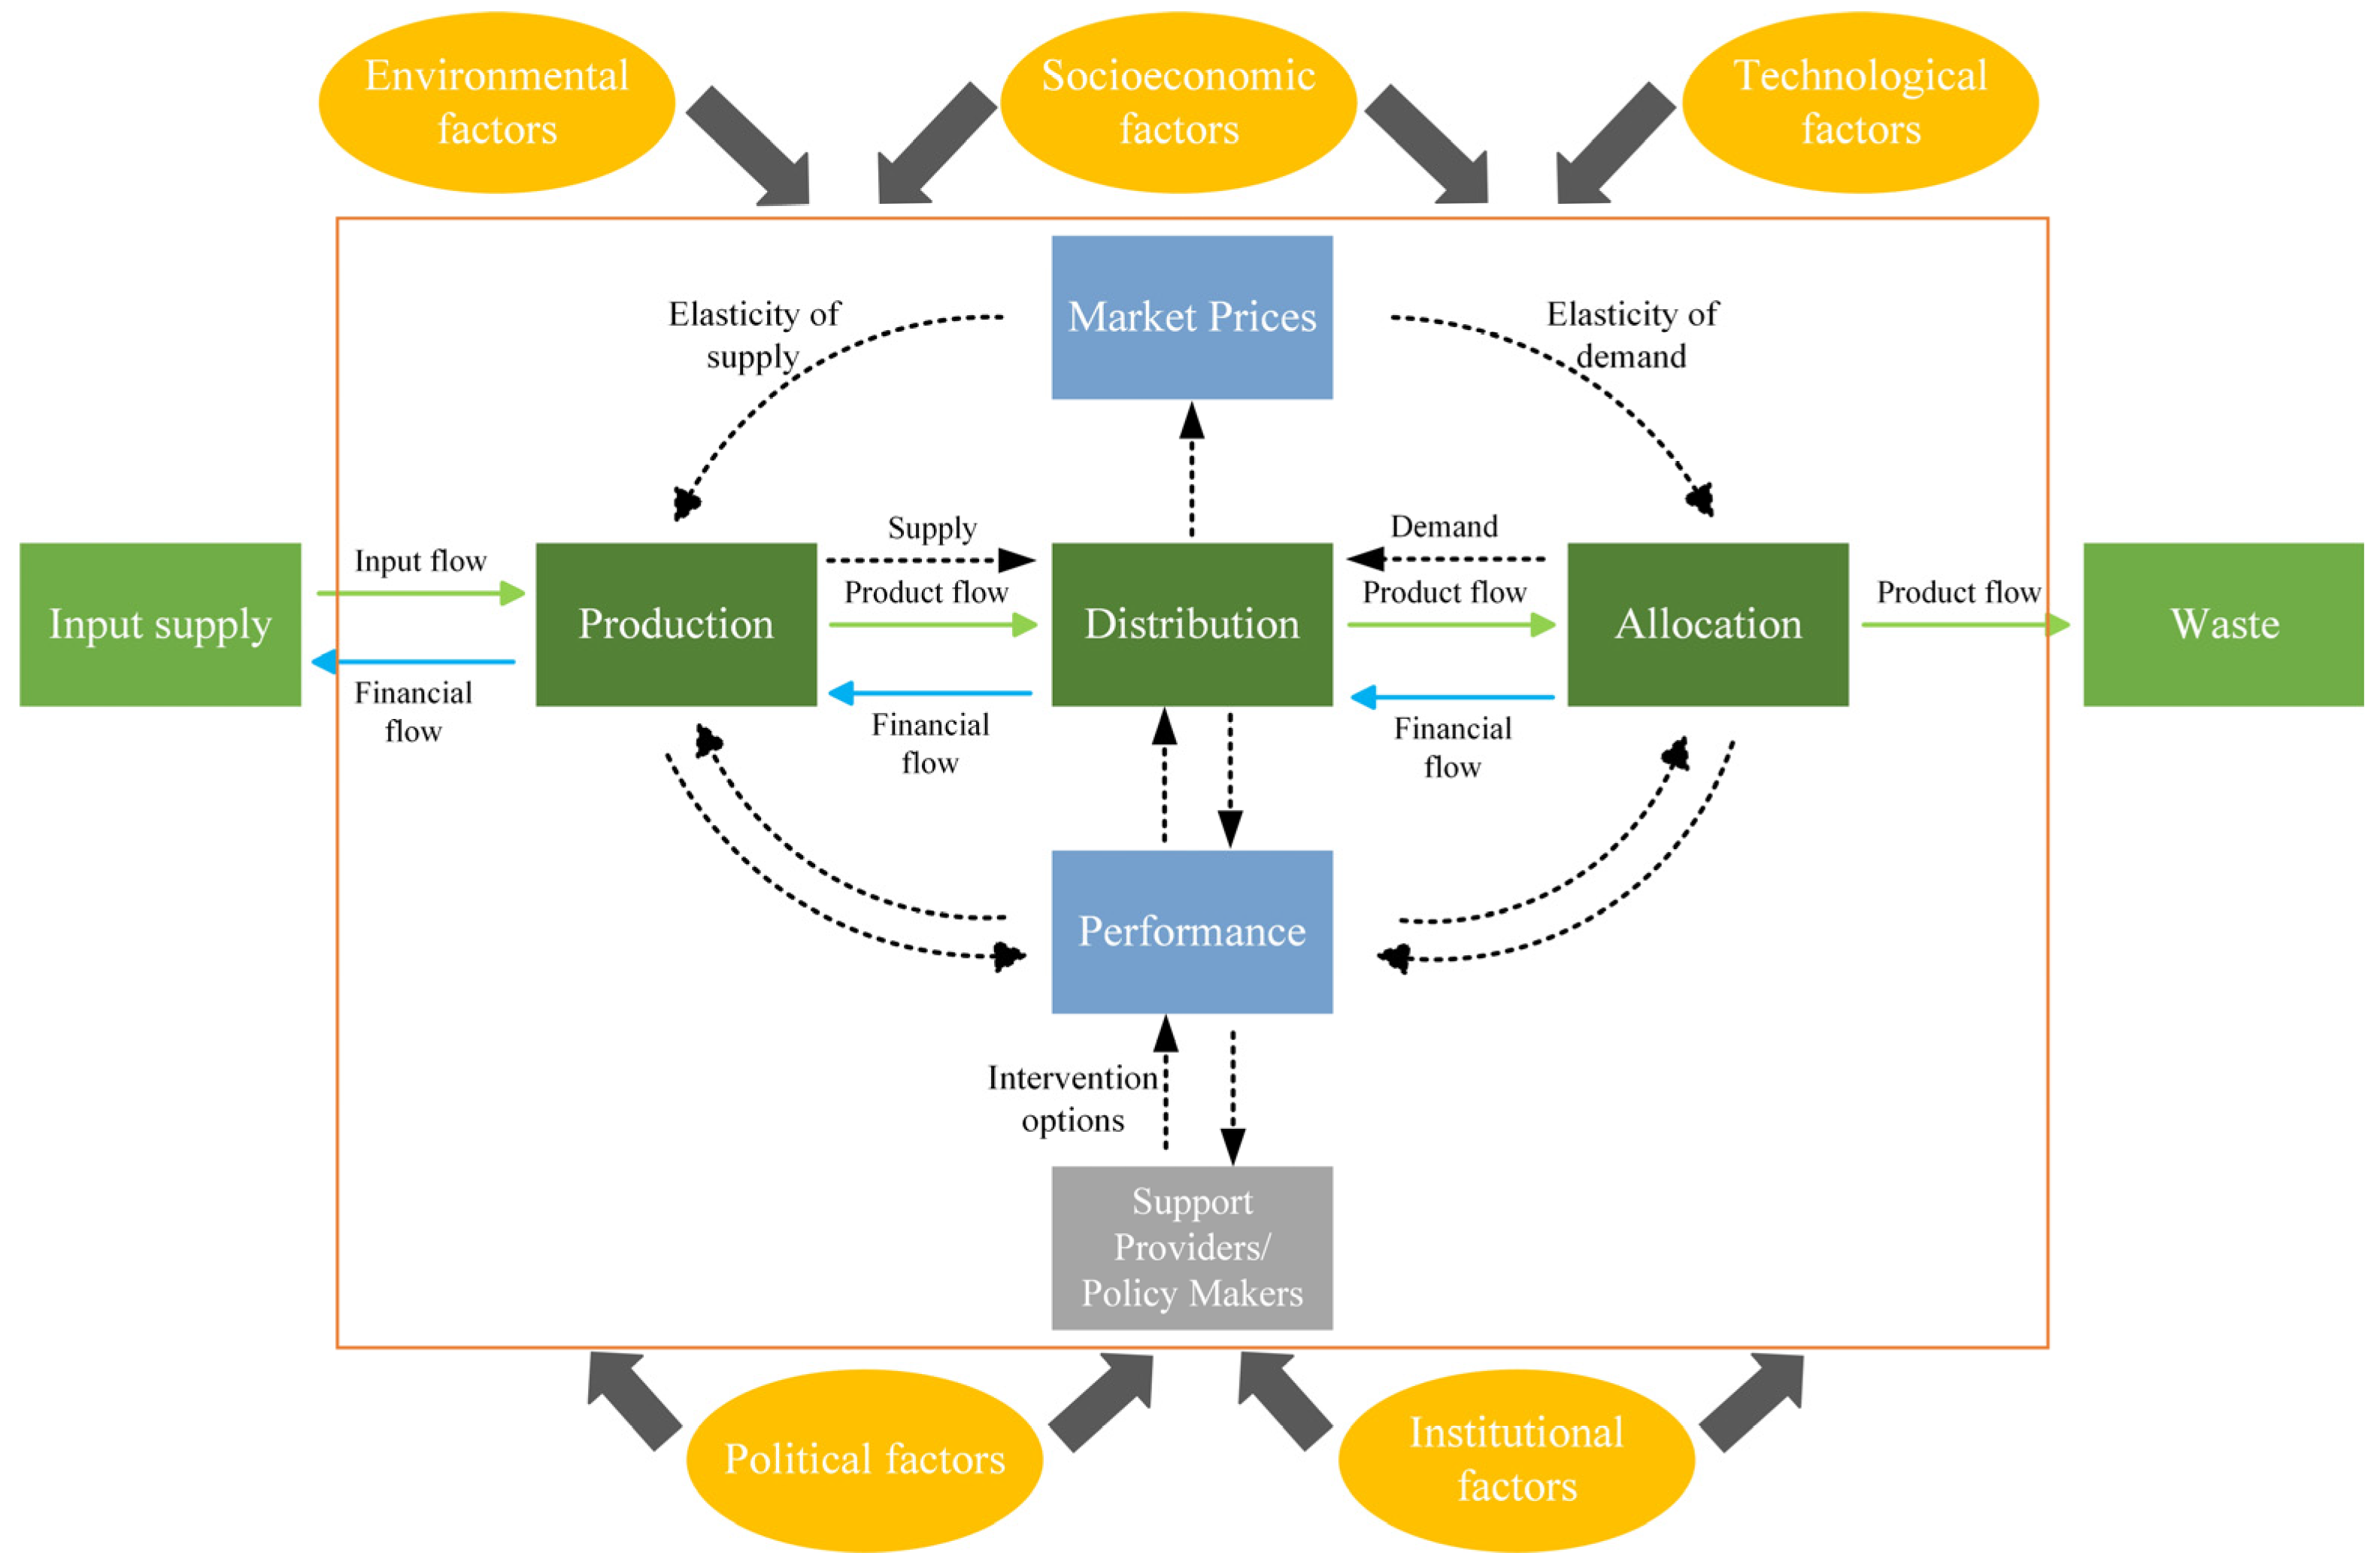
The two-stage dynamic network SBM model utilized in this study analyzes a two-stage value chain, with the potential for extension to analyze the agricultural production value chain (Figure 13). This value chain consists of multiple stages involving the production, distribution, and consumption of agricultural products. It reflects a value-added process encompassing activities such as resource utilization by agricultural enterprises, processing and handling of agricultural products, allocation, sales, and after-sales services. These activities aim to minimize intermediary circulation costs and enhance the value of agricultural products [38,39,40]. The value chain of agricultural production in Figure 13 contains three stages of value creation and value realization. Value creation consists of the production stage and value realization consists of the distribution and consumption stages [41]. Both the production and distribution stages influence the supply and demand dynamics within the distribution stage, thereby affecting market price fluctuations. Subsequently, market prices influence both the production and consumption stages, highlighting the role of an efficient market. Furthermore, policymakers adjust policies based on market dynamics to enhance political achievements, which significantly influence all facets of production, distribution, and allocation, thereby emphasizing the importance of an active government. To enhance economic efficiency, efficient markets and active governments are indispensable and should be complementary, mutually reinforcing, and mutually supplementary.
The research paradigm, which has the potential for expansion to analyze the influence of exogenous environmental variables on efficiency, enhances the practical application of the assessment [42]. As shown in Figure 13, the outer circle represents exogenous variables that cover environmental, socioeconomic, technological, political, and institutional aspects. Thus, from a macro perspective, the selection of indices to investigate the external influence mechanism can include the proportion of primary industry, urbanization rate, and income ratio of urban and rural residents. The proportion of primary industry directly correlates with the agricultural production experience and scale in a region, thus reflecting regional socioeconomic development to a certain extent. Meanwhile, the urbanization rate and income ratio of urban and rural residents serve as indicators that delineate urban-rural development disparities. Additionally, the Dongting Lake Region faces significant challenges related to “non-food” and “non-farming” issues. Hence, when choosing indicators to explore external influence mechanisms, factors related to “de-foodization” and “de-farming” could also be considered [43].
In addition to the limitations of variable selection, the DEA model itself suffers from potential statistical bias. As a non-parametric method, Data Envelopment Analysis (DEA) does not account for statistical noise or random errors, and results may be sensitive to extreme values or outliers. Complementary methods such as stochastic frontier analysis (SFA) could be integrated in future work to mitigate potential biases. Furthermore, efficiency gains are important. E-commerce is considered one of the most important ways to improve allocation efficiency. Future studies could explore how digital platforms can be leveraged to reduce resource waste, improve supply chain transparency, and promote environmentally responsible consumer behavior, thereby aligning economic growth with ecological sustainability.

5.3. Policy Implications

The results of the study suggest that economic efficiency should be improved by systematically balancing the two phases of “production increase” and “income increase” as an integrated whole. In the first stage, yield increases are achieved through technology and management optimization. In the second stage, the increase in production must be effectively transformed into an increase in farmers’ real income. The synergistic promotion of increased production and income can be an important driving force in the implementation of the rural revitalization strategy.
Particularly noteworthy is the fact that an increase in farmers’ incomes can significantly enhance their incentives to protect their land, thereby further contributing to improved and more sustainable agricultural production conditions. This creates a virtuous cycle of “increased income—protection—increased production”. This mechanism not only helps to ensure food security but also provides an internal impetus for the realization of high-quality agricultural development and the comprehensive revitalization of the countryside. Therefore, policy design needs to holistically integrate production efficiency and income enhancement in order to achieve long-term coordinated development of agriculture and the countryside.

6. Conclusions

The main conclusions of this study are as follows:
(1)
Economic efficiency has time heterogeneity. The overall trend of total economic efficiency from 2005 to 2020 showed a decline first and then an increase. The overall efficiency of the production stage showed a slight downward trend, and the efficiency value of the allocation stage showed a slight upward trend; however, the efficiency value of this stage was still low. The overall productivity of agricultural production demonstrated a decreasing trend, with approximately 62% of the region experiencing a decline in total productivity. The efficiency and productivity of the production stage surpassed those of the allocation stage.
(2)
Agricultural productivity is spatially heterogeneous. Taoyuan County had the highest economic efficiency, followed by Huarong County, Dingcheng District, and Junshan District. Conversely, Linxiang City, Yuanjiang City, and Ziyang District exhibited the lowest economic efficiency, which was attributed to inadequate agricultural labor, excessive agricultural machinery utilization, and fertilizer overuse.
(3)
Efficiency at the production stage and efficiency at the allocation stage are always positively or negatively correlated, and the different correlations reflect the different situations at the production and allocation stages. When there is a positive correlation between the efficiencies of the production and allocation stages, it is usually characterized by an increase in production with an increase in revenue or a decrease in production with a decrease in revenue; when there is a negative correlation between the efficiencies of the production and allocation stages, it is usually characterized by a decrease in production with an increase in revenue or an increase in production with a decrease in revenue.
(4)
The efficiency of the production and configuration stages facilitates our ability to identify weaknesses in the agricultural production process and to make targeted adjustments to different situations. For example, subsidies for arable land should be increased for regions that need to improve production efficiency to address the loss of large numbers of high-quality laborers, while agricultural product output, market demand, and waste avoidance should be improved. Moreover, infrastructure development must be accelerated in areas requiring enhanced allocation efficiency to upgrade farmland water conservancy facilities, urban and rural transportation, and cold chain logistics systems. Such efforts aim to advance the overall enhancement of rural electrification from quantity to quality.
(5)
To further enhance the depth and applicability of the research, future efforts should focus on the following aspects: First, it is recommended to incorporate both system variables (such as technological inputs and mechanization levels) and contextual variables (such as climatic conditions, policy environments, and market structures) into the model to construct a more comprehensive analytical framework. This will allow for a more accurate identification of the internal and external factors influencing economic efficiency performance. Second, the current two-stage model can be extended to a multi-stage structure to reveal the efficiency transmission mechanisms and coupling relationships across all stages of the agricultural production-distribution-allocation chain. Multi-stage modeling can not only provide more precise policy targets but also contribute to understanding the intrinsic logic of synergistic evolution within the system, thereby offering more systematic theoretical support and decision-making references for agricultural modernization and rural revitalization strategies.

Author Contributions

Conceptualization, Y.W. and C.L.; methodology, Y.W. and C.L.; formal analysis, Y.W.; data curation, Y.W.; writing—original draft preparation, Y.W.; writing—review and editing, J.W. and C.L.; visualization, J.T.; supervision, C.L.; funding acquisition, C.L. All authors have read and agreed to the published version of the manuscript.

Funding

This research was funded by the Open Topic of Hunan Key Laboratory of Land Resources Evaluation and Utilization, Dongting Lake Ecological and Economic Region Land Use Change Carbon Emission and Associated Effects [grant number SYS-ZX-202406].

Conflicts of Interest

The authors declare no conflicts of interest.

Abbreviation

The following abbreviation is used in this manuscript:
DLRDongting Lake Region

References

  1. Cui, H.Y.; Zhu, W.J.; Yu, H.; Long, J.; Liu, Y.F. Calculation of agricultural production efficiency based on a three-stage Data Envelopment Analysis model and analysis of the spatial-temporal characteristics: An example from the Yangtze River Economic Belt. Chin. J. Ecol. Agric. Engl. 2021, 29, 1243–1252. [Google Scholar] [CrossRef]
  2. Guo, J.H.; Ni, M.; Li, B.Y. Research on Agricultural Production Efficiency Based on Three-Stage DEA Model. Res. Quant. Tech. Econ. 2010, 27, 27–38. [Google Scholar] [CrossRef]
  3. Liu, J.W.; Li, X.F.; Gao, P.H.; Wang, F.S. Study on Agricultural Production Efficiency and Its Influencing Factors in Hebei Province Based on DEA Model. Northeast Agric. Sci. 2020, 45, 86–91+107. [Google Scholar] [CrossRef]
  4. Luo, H.P.; Ai, Z.H.; He, Z.W. An Empirical Study on the Spatial Differences and the Evolutionary Trends of the Guarantee Effectiveness of China’s Food Security. J. Yunnan Univ. Financ. Econ. 2020, 36, 3–14. [Google Scholar] [CrossRef]
  5. Zhang, X.Y.; Meng, J.J.; Wang, J.; Meng, Y. Study on moderate scale of grain management in agricultural area of central plain based on DEA model: A case of wheat-corn rotation in Henan province. J. Henan Norm. Univ. Nat. Sci. Ed. 2020, 48, 18–23+81. [Google Scholar] [CrossRef]
  6. Du, H.M.; Jiang, L. Research on the Spatial and Temporal Disparity of Agricultural Ecological Efficiency of Dongting Lake Area Based on SE-SBM Model. Ecol. Econ. 2020, 36, 100–106+121. [Google Scholar]
  7. Feng, Y.J.; Qi, Q.; Han, J.B. Spatiotemporal Evolution and Driving Factors of Agricultural Eco-efficiency in China. Bull. Soil Water Conserv. 2018, 38, 254–262. [Google Scholar] [CrossRef]
  8. Ye, H.; Pu, L.J. Study on the Cultivated Land Use Efficiency between Different Regions of China and Its Convergence. J. Nat. Resour. 2011, 26, 1467–1474. [Google Scholar]
  9. Guo, X.N.; Ruan, P. Evaluation and Convergence Analysis of Agricultural Production Efficiency in the Western Reforestation Area in China—Based on Zhijin County in Guizhou Province. Financ. Sci. 2014, 58, 114–124. [Google Scholar]
  10. Liu, M.B.; Zhang, A.L.; Wen, G.H. Regional differences and spatial convergence in the ecological efficiency of cultivated land use in the main grain producing areas in the Yangtze Region. J. Nat. Resour. 2022, 37, 377–493. [Google Scholar] [CrossRef]
  11. Abbas, A.; Zhao, C.; Waseem, M.; Ahmed Khan, K.; Ahmad, R. Analysis of energy input–output of farms and assessment of greenhouse gas emissions: A case study of cotton growers. Front. Environ. Sci. 2022, 9, 826838. [Google Scholar] [CrossRef]
  12. Grassauer, F.; Herndl, M.; Nemecek, T.; Guggenberger, T.; Fritz, C.; Steinwidder, A.; Zollitsch, W. Eco-efficiency of farms considering multiple functions of agriculture: Concept and results from Austrian farms. J. Clean. Prod. 2021, 297, 126662. [Google Scholar] [CrossRef]
  13. Sarkhosh-Sara, A.; Tavassoli, M.; Heshmati, A. Assessing the sustainability of high-, middle-, and low-income countries: A network DEA model in the presence of both zero data and undesirable outputs. Sustain. Prod. Consum. 2020, 21, 252–268. [Google Scholar] [CrossRef]
  14. Kord, A.; Payan, A.; Saati, S. Network DEA Models with stochastic data to assess the sustainability performance of agricultural practices: An application for Sistan and Baluchestan Province in Iran. J. Math. 2022, 2022, 1119630. [Google Scholar] [CrossRef]
  15. Kord, A.; Payan, A.; Saati, S. Sustainability and optimal allocation of human resource of agricultural practices in Sistan and Baluchestan Province based on network DEA. J. Math. Ext. 2021, 15, 1–44. [Google Scholar]
  16. Mavi, R.K.; Saen, R.F.; Goh, M. Joint analysis of eco-efficiency and eco-innovation with common weights in two-stage network DEA: A big data approach. Technol. Forecast. Soc. Change 2019, 144, 553–562. [Google Scholar] [CrossRef]
  17. Güney, O.İ. Eco-efficiency in farm management for sustainable agriculture: A two-stage data envelopment analysis in wheat production. Pol. J. Environ. Stud. 2021, 30, 5549–5557. [Google Scholar] [CrossRef]
  18. Ren, F.R.; Tian, Z.; Chen, H.S.; Shen, Y.T. Energy consumption, CO2 emissions, and agricultural disaster efficiency evaluation of China based on the two-stage dynamic DEA method. Environ. Sci. Pollut. Res. 2021, 28, 1901–1918. [Google Scholar] [CrossRef] [PubMed]
  19. Fang, Z.; Chiu, Y.H.; Lin, T.Y.; Chang, T.H.; Lin, Y.N. Analysis of natural disasters and energy efficiency in China. Environ. Dev. Sustain. 2024, 26, 10999–11026. [Google Scholar] [CrossRef]
  20. Lu, C.C.; Lin, I.F.; Lin, T.Y.; Chiu, Y.H. Two-stage dynamic data envelopment analysis measuring the overall efficiency and productivity changes of industry and agriculture in EU countries. J. Clean. Prod. 2023, 382, 135332. [Google Scholar] [CrossRef]
  21. Shi, Z.; Wu, Y.; Chiu, Y.H.; Wu, F.; Shi, C. Dynamic Linkages among Mining Production and Land Rehabilitation Efficiency in China. Land 2020, 9, 76. [Google Scholar] [CrossRef]
  22. Huang, K.Y.; Chang, T.H.; Chiu, Y.H.; Yang, C.Y.; Lin, T.Y. Considering climate change and regional differences: An efficiency assessment of coal mine use and land restoration. Nat. Resour. Forum 2023, 47, 578–601. [Google Scholar] [CrossRef]
  23. Liu, S.S.; Pu, J.F.; Zhang, B.B.; Wang, S. Cultivated land utilization efficiency in Dongting Lake area: Based on a dynamic network two-stage DEA model. J. China Agric. Univ. 2022, 27, 257–269. [Google Scholar]
  24. Li, Y.; Cen, H.; Lin, T.Y.; Lin, Y.N.; Chiu, Y.H. Sustainable coal mine and coal land development in China. Resour. Policy 2022, 79, 103092. [Google Scholar] [CrossRef]
  25. Zhou, H.; Xun, X.; Wang, Y.X.; Chen, L.L. Cultivated Land Use Induced Moisture Balance Effect in Dongting Lake Basin in Recent 40 Years. Yangtze River Basin Resour. Environ. 2024, 33, 822–832. [Google Scholar]
  26. Farrell, M.J. The measurement of productive efficiency. J. R. Stat. Soc. Ser. A Gen. 1957, 120, 253–281. [Google Scholar] [CrossRef]
  27. Charnes, A.; Cooper, W.W.; Rhodes, E. Measuring the efficiency of decision making units. Eur. J. Oper. Res. 1978, 2, 429–444. [Google Scholar] [CrossRef]
  28. Banker, R.D.; Charnes, A.; Cooper, W.W. Some models for estimating technical and scale inefficiencies in data envelopment analysis. Manag. Sci. 1984, 30, 1078–1092. [Google Scholar] [CrossRef]
  29. Färe, R.; Grosskopf, S.; Whittaker, G. Network DEA. Modeling data irregularities and structural complexities in data envelopment analysis. Science 2007, 6, 240. [Google Scholar]
  30. Tone, K.; Tsutsui, M. Dynamic DEA: A slacks-based measure approach. Omega 2010, 38, 145–156. [Google Scholar] [CrossRef]
  31. Tone, K.; Tsutsui, M. Dynamic DEA with network structure: A slacks-based measure approach. Omega 2014, 42, 124–131. [Google Scholar] [CrossRef]
  32. Malmquist, S. Index numbers and indifference surfaces. Trab. Estadística 1953, 4, 209–242. [Google Scholar] [CrossRef]
  33. Fáre, R.; Grosskopf, S.; Roos, P. The Malmquist Total Factor Productivity Index: Some Remarks; CESifo Working Paper Series 94; CESifo: Munich, Germany, 1995. [Google Scholar]
  34. Caves, D.W.; Christensen, L.R.; Diewert, W.E. The economic theory of index numbers and the measurement of input, output, and productivity. Econom. J. Econom. Soc. 1982, 50, 1393–1414. [Google Scholar] [CrossRef]
  35. Mehrabian, A.; Khalili-Damghani, K.; Amirkhan, M. A Dynamic Network Data Envelopment Analysis Model to Calculate the Efficiency of Wheat Farms. J. Appl. Dyn. Syst. Control. 2023, 6, 29–43. [Google Scholar]
  36. Xinhua News Agency. Outline of the National Land Use General Plan. 2008. Available online: https://www.gov.cn/guoqing/2008-10/24/content_2875234.htm (accessed on 23 May 2024).
  37. Hunan Provincial Bureau of Statistics. Hunan Provincial Statistical Yearbook (2005–2020); China Statistics Press: Beijing, China, 2020. [Google Scholar]
  38. Porter, M.E. Competitive Advantage: Creating and Sustaining Superior Performance; Simon Schuster: New York, NY, USA, 1985; Volume 24, pp. 32–37. [Google Scholar]
  39. Ghate, P.B. Interaction between the formal and informal financial sectors: The Asian experience. World Dev. 1992, 20, 859–872. [Google Scholar] [CrossRef]
  40. Muflikh, Y.N.; Smith, C.; Aziz, A.A. A systematic review of the contribution of system dynamics to value chain analysis in agricultural development. Agric. Syst. 2021, 189, 103044. [Google Scholar] [CrossRef]
  41. Liu, G.Y.; He, P.; Wang, Y.Y. Agro-ecological product and its value realization pathway. J. Appl. Ecol. 2021, 32, 737–749. [Google Scholar]
  42. Yu, M.M. Capacity efficiency measurement using a three-stage DEA approach: Evidence from domestic airports in Taiwan. Transp. Plan. Technol. 2010, 33, 221–235. [Google Scholar] [CrossRef]
  43. Xu, B.; Lu, Z.Y.; Yang, S.S.; Yin, P.; Yang, L.L.; Mo, J.L. Spatio-temporal Evolution Pattern and Influencing Factors of Agricultural Production Efficiency in Hunan Province. Econ. Geogr. 2022, 42, 141–149. [Google Scholar]
Figure 1. Overview of the Dongting Lake Region.
Sustainability 17 08490 g001
Figure 2. Structure of the two-stage dynamic network model.
Sustainability 17 08490 g002
Figure 3. Measurement of economic efficiency in the DLR.
Sustainability 17 08490 g003
Figure 4. Descriptive statistics for variables. (a) Agricultural labor. (b) Total power of agricultural machinery. (c) Crop sown area. (d) Fertilizer use. (e) Grain production. (f) Value of agricultural output. (g) Cropland area.
Sustainability 17 08490 g004
Figure 5. Efficiency for production stage in different periods and regions in the DLR.
Sustainability 17 08490 g005
Figure 6. Efficiency for allocation stage in different periods and regions in the DLR.
Sustainability 17 08490 g006
Figure 7. Economic efficiency in different periods and regions in the DLR.
Sustainability 17 08490 g007
Figure 8. Changes in the efficiency value of different periods and regions in the DLR.
Sustainability 17 08490 g008
Figure 9. Dynamics in production stage productivity in different periods and regions in the DLR.
Sustainability 17 08490 g009
Figure 10. Dynamics in allocation stage productivity in different periods and regions in the DLR.
Sustainability 17 08490 g010
Figure 11. Dynamics in Total Factor Productivity in different periods and regions in the DLR.
Sustainability 17 08490 g011
Figure 12. The efficiency performance and productivity matrix analysis.
Sustainability 17 08490 g012
Figure 13. Agricultural production value chain development framework.
Sustainability 17 08490 g013
Table 1. Data and variables.
DataVariable
Input X i j k t Input resource i to DMUj for division k at period tInput slack s i j k t Slack of input i of DMUj for division k at period t.
Output Y r j k t Output product r from DMUj for division k at period tOutput slack s r j k t + Slack of output r of DMUj for division k at period t.
Link C j q g l ( t , t + 1 ) DMUj from stage q to stage g at period tLink slack s j q g l α t Slack of link ( q g ) l of DMUj at period t. α stands for free, as-input, and as-output.
Carry-over C j q l ( t , t + 1 ) Carry-over of DMUj at stage q from period t to period t + 1Carry-over slack s j q l α ( t , t + 1 ) Slack of carry-over q l from period t to period t+1.
Intensity λ j q t Intensity of DMUj corresponding to stage q at period t
Table 2. Definition of indicators.
StageVariableUnitDescription
Production stage(I) Agricultural laborten thousand peopleThe working-age population engaged in the production of agricultural goods or services for remuneration or profit.
(I) Total power of agricultural machinerykilowatt (unit of electric power)Total power mainly used for agricultural power machinery.
(I) Crop sown areathousand hectaresThe area actually sown or transplanted with crops.
(I) Fertilizer usetonAmount of fertilizer actually used for agricultural production.
(L) Grain productiontonThe total amount of food produced by an agricultural producer during the calendar year.
Allocation stage(O) Value of agricultural outputten thousand dollarsThe value of the total product produced by the crop cultivation industry during the calendar year.
(C) Cropland areathousand hectaresThe area of a field that can be used for growing crops as well as for plowing.
Note: (I) is the input, (O) is the output, (L) is the linking variable, and (C) is the carry-over variable.
Disclaimer/Publisher’s Note: The statements, opinions and data contained in all publications are solely those of the individual author(s) and contributor(s) and not of MDPI and/or the editor(s). MDPI and/or the editor(s) disclaim responsibility for any injury to people or property resulting from any ideas, methods, instructions or products referred to in the content.