Article

Integrating InVEST and MaxEnt Models for Ecosystem Service Network Optimization in Island Cities: Evidence from Pingtan Island, China

by
Jinyan Liu
1,2,†,
Bowen Jin
1,†,
Jianwen Dong
1,* and
Guochang Ding
1,*
1
College of Landscape Architecture and Art, Fujian Agriculture and Forestry University, 63 Xiyuangong Rd., Fuzhou 350002, China
2
College of Resource and Environmental Sciences, Quanzhou Normal University, 398 Donghai Rd., Quanzhou 362000, China
*
Authors to whom correspondence should be addressed.
These authors contributed equally to this work.
Sustainability 2025, 17(18), 8470; https://doi.org/10.3390/su17188470
Submission received: 28 July 2025 / Revised: 17 September 2025 / Accepted: 18 September 2025 / Published: 21 September 2025

Abstract

As unique geographical entities, island cities boast abundant ecological resources and profound cultural values, serving as critical hubs for maintaining ecosystem services in coastal transition zones. Ensuring the stability of ecosystem services is strategically significant for sustainable urban development, while the construction of Ecosystem Service Networks (ESNs) has emerged as a core strategy to enhance ecological functionality and mitigate systemic risks. Based on current research gaps, this study focuses on three key questions: (1) How to construct a Composite Ecosystem Service Index (CESI) for island cities? (2) How to identify the Ecosystem Service Networks (ESNs) of island-type cities? (3) How to optimize the ecosystem service networks of island cities? This study selects Pingtan Island as a representative case, innovatively integrating the InVEST and MaxEnt models to conduct a comprehensive assessment of ecological and cultural services. By employing Principal Component Analysis (PCA), a Composite Ecosystem Service Index (CESI) was established. The research follows a systematic technical approach to construct and optimize the ESN: landscape connectivity indices were applied to identify ecological source areas based on CESI outcomes; multidimensional resistance factors were integrated into the Minimum Cumulative Resistance (MCR) model to develop the foundational ecological network; gradient buffer zone analysis and circuit theory were sequentially employed to refine the network structure and evaluate ecological efficacy. Key findings reveal: (1) Landscape connectivity analysis scientifically delineated 20 ecologically valuable source areas; (2) The coupled MCR model and circuit theory established a hierarchical ESN comprising 45 corridors (12 Level-1, 14 Level-2, and 19 Level-3), identifying 5.75 km2 of ecological pinch points, 7.17 km2 of ecological barriers, and 84 critical nodes—primarily concentrated in cultivated areas; (3) Buffer zone gradient analysis confirmed 30 m as the optimal corridor width for multi-scale planning; (4) Circuit theory optimization significantly enhanced network current density (1.653→8.224), demonstrating a leapfrog improvement in ecological service efficiency. The proposed “assessment–construction–optimization” integrated methodology establishes an innovative paradigm for deep integration of ecosystem services with urban spatial planning. These findings provide practical spatial guidance for island city planning, supporting corridor design, conservation prioritization, and targeted restoration, thereby enhancing ecosystem service efficiency, biodiversity protection, and resilience against coastal ecosystem fragmentation.

1. Introduction

Island cities are a unique urban type centered on islands, characterized by urban functions, population concentration, and socio-economic activities, exhibiting distinct features such as spatial isolation, limited resources, and ecological sensitivity [1]. Due to their surrounding waters, island cities face significant constraints in land use, resource allocation, and infrastructure development, yet they possess unique marine resources, ecological environments, and cultural tourism value, making them crucial strategic areas for advancing the marine economy, ecological civilization, and regional coordinated development. Compared to typical inland cities, island city ecosystems are more independent and fragile, highly vulnerable to disturbances from natural disasters, climate change, coastal erosion, and human activities [2]. Once damaged, ecosystem restoration is costly and time-consuming [3]. Therefore, the development of island cities requires a precise balance between ecological conservation and economic construction. Ecosystem services, as a vital foundation for maintaining urban ecological security and human well-being, underscore the importance of constructing an Ecosystem Service Network (ESN) centered on multifunctional ecological services. This network is essential for enhancing ecological connectivity, ensuring resource flows, and strengthening urban resilience. Particularly for island cities, scientifically identifying ecological source areas, rationally planning ecological corridors, and improving the quality of cultural ecosystem service spaces are key pathways to achieving sustainable development and enhancing overall carrying capacity.
However, current research predominantly focuses on inland cities, with relatively few case studies targeting island cities. This scarcity hinders the provision of robust support for ecological space optimization and sustainable development in such regions. To some extent, it constrains the full realization of ecosystem service potential and the scientific guidance for urban development in island cities. To address this gap, this study takes a typical island city as a case to systematically explore the construction of its ecological recreation service network, analyze its spatial characteristics, and propose optimization strategies. The research not only provides a theoretical foundation and practical pathways for enhancing ecosystem services and promoting high-quality development in island cities, but also integrates ecological and cultural ecosystem services into a comprehensive network framework, thereby enriching empirical understanding of ESNs in fragile island systems and offering insights for sustainable development of island cities worldwide.

2. Literature Review and Research Gaps

Ecosystem Services (ESs) represent the most basic type of well-being that humans derive from nature, ecosystem goods and functions that contribute to human survival and quality of life [4]. The United Nations’ Millennium Ecosystem Assessment (MA), which has the widest impact, categorizes ecosystem services into four categories: provisioning, regulating, supporting and cultural services [5]. Studies oriented to the functions of provisioning, regulating and supporting services are abundant. Mainly based on the ecosystem service function to assess a variety of material-type ecological functions in the region, the commonly used models include InVEST [6], ARIES [7], MIMES [8] and so on. Among them, the InVEST model can accurately portray the supply, requirement and flow characteristics of ecosystem services from a spatial scale perspective, and realize the quantification of ecosystem service functions such as support, regulation and supply, e.g., water production, soil retention, and habitat quality, etc., but it neglects the role of cultural ecosystem service functions [6]. Cultural Ecosystem Services (CESs) are non-material well-being and benefits that ecosystems bring to human societies, and are related to human aesthetic, educational and spiritual needs [9]. Unlike material ecosystem services that can be directly quantified through biophysical models, CES involve non-material resources such as human perception, social interaction and spiritual fulfillment, and their values are often obtained through subjective evaluation methods such as questionnaire surveys and selective experiments, making it difficult to quantify them through uniform standards. In the context of island cities, CES are particularly characterized by unique cultural heritages and tourism-driven service functions, such as fishing village culture, coastal recreation, marine beliefs, and traditional craftsmanship, which together constitute important components of local ecosystem services. Relevant studies have attempted to construct spatial distribution maps of CES through geographic information methods such as SolVES [10] and PPGIS [11], but their subjective defects cannot be avoided, and they also rely on a small range of questionnaire survey data, which has sampling bias and cognitive limitations. In addition, POI data combined with kernel density analysis has also been used, which can identify spatial agglomeration hotspots, but ignores the spatial dependence between POI points, and the actual cultural service provision often presents cross-regional linkage characteristics rather than isolated existence. With the depth of research, relevant scholars gradually incorporate social, economic, cultural and other elements into the construction of a comprehensive evaluation system of ecosystem services, such as ecosystem service provision, ecological resource protection, recreational function and other assessment indicators to improve the comprehensive study of ecosystem services [12]. There are also studies that utilize the ecosystem service function and ecological security coupling model, etc., to establish ecosystem service evaluation indicators for socio-economic-ecological composite systems [13]. Their further refinement is also limited by the ambiguity of the quantification of CES functions. However, the Maximum Entropy Model (MaxEnt) is a widely used ecological modeling approach for species distribution prediction [14]. It analyzes the relationship between known occurrence points and environmental variables to infer potential suitable habitats [15].Under the premise of requiring only species existence data, the model can realize high-precision spatial prediction with good scale adaptability, and the fitting effect and parameter rationality of the model can be assessed by cross-validation and other methods. In the quantitative study of CES, the maximum entropy model shows significant advantages by virtue of its sensitivity to spatial heterogeneity and environmental multi-factor response relationships. Its modeling results not only help to identify the key spatial areas of cultural service functions, such as ornamental, recreational or spiritual value-bearing sites, but also support spatial optimization and management decisions in a large scale [16]. The model is easy to operate, efficient in calculation, applicable to complex and diverse cultural ecosystem scenarios, and provides strong support for the quantitative assessment and visualization of CES. To complement this, InVEST excels in quantifying material ecosystem services (e.g., provisioning, regulating, supporting), while MaxEnt leverages POI data and environmental variables to model the spatial distribution of non-material Cultural Ecosystem Services (CESs). This synergy overcomes the limitations of subjective methods like PPGIS and SolVES, enabling a more comprehensive assessment of both tangible and intangible ecosystem services [15]. In the optimization research based on ecosystem service assessment, it is mainly carried out in terms of trade-offs and synergy [17], ecological network construction [18], and optimization of land use and functional zoning [19], in order to facilitate the enhancement of district ecosystem service.
Currently, the enhancement of ecosystem service functions through ecological networks, landscape patterns, and ecological security patterns is an important strategy to effectively mitigate regional ecological risks [20]. Among them, the ecological network has formed the research framework of “source- resistance surface-corridor-node”, based on which ecological networks have been developed, such as the ecological network for enhancing ecological functions [21], the ventilation corridor network for mitigating urban heat island [22], and the ecosystem service network for enhancing ES [18]. In ESN research, the source area is the core area to provide ecological services and enhance ecological connectivity. The identification of source areas is usually carried out from the perspective of landscape structure and ecological function. The landscape structure perspective is mainly through the landscape pattern in the region, analyzing its structure and connectivity characteristics to identify the source land, such as landscape pattern index [23], particle size backpropagation method [24], MSPA [25], etc. The advantage is to screen out the redundant patches that lack connectivity in terms of structure, but it neglects to consider the ecological function aspect. In terms of ecological function, sources are mainly identified from the habitat quality of patches through the assessment of ecosystem service function [6] and remote sensing ecological index (RSEI) [26]. RSEI, as a more objective ecological quality assessment method, is widely used for source identification, but the method is only applicable to urban areas and cannot assess water bodies. In contrast, the assessment method based on ecosystem service functions more comprehensively considers multiple ecological functions in the region [27]. The ecosystem service function-based assessment method considers multiple ecological functions in the region in a more comprehensive way. Resistance surface is a quantitative expression of the ability of landscape elements to impede the dispersal of species or the flow of ecological processes, which is an important basis for corridor extraction [28]. In recent years, methods for constructing resistance surfaces based on correlations between ecosystem services and ecological process flows have received increasing attention. Relevant studies show that ecosystem services are negatively correlated with ecological process flow resistance, which is an important basis for resistance surface construction [29]. Corridors are ecological functional spaces that provide species migration and dispersal, with connectivity in spatial structure, sustaining regional ecosystem service flows [30], and maintaining and optimizing ecosystem service provision by enhancing structural and functional connectivity between ecological patches. It is common to extract important ecological corridors by combining the minimum resistance model (MCR) [31], gravity model [32], circuit theory [33], etc., and analyze them by combining the key node identification and other methods, so as to construct an ESN with complete and stable functions. The insufficiency of comprehensive ecosystem service assessment methods has also led to the fact that simple spatial superposition of single-function ecological networks is usually involved in ESN studies [34]. The absence of a systematic assessment framework for ecological source selection, combined resistance surface construction, and ecological corridor planning has led to challenges such as functionally homogeneous sources, redundant corridors, excessive construction costs, and insufficient coordination among multiple ecosystem service objectives. Therefore, there is an urgent need to explore a comprehensive ecosystem service assessment method that integrates the four types of ecosystem service functions of provisioning, supporting, regulating and cultural, and to improve the framework for ecosystem service network construction and optimization, in order to comprehensively enhance the stability of regional ecosystem service functions.
Globally, there are over 500,000 islands, with approximately 50,000 larger ones partially inhabited. In 1981, islands with recorded populations covered approximately 6.97 million square kilometers—representing just 5.13% of the world’s land area—yet were home to 9.85% of the global population [35]. Clearly, island cities are vital hubs for human habitation and leisure. Unlike mainland cities, island cities face distinct challenges due to their unique topography and geography: high ecological vulnerability, poor resilience, and frequent ecological disasters. Rapid urbanization has further increased their populations, placing unprecedented pressure on these island cities. While studies such as Lin et al. [36] have explored urban expansion impacts on island ecosystems, and Deng et al. [37] assessed ecosystem service dynamics in coastal reclamation zones, few have focused on integrating multi-functional ecosystem service assessment and ecosystem service network (ESN) optimization specifically for island cities. Consequently, to ensure the sustainable development of island cities, there is an urgent need for research into the rational construction and optimization of ecosystem service networks.
Based on current research gaps, the study objectives will focus on the following three key issues: (1) How to construct a Composite Ecosystem Service Index (CESI) for island cities? (2) How to identify the Ecosystem Service Networks (ESNs) of island-type cities? (3) How to optimize the ecosystem service networks of island cities?

3. Methodology

3.1. Research Framework

As shown in Figure 1, this study primarily consists of three components to construct and optimize the ecosystem service network in island cities: (1) Evaluating integrated urban ecosystem service functions in island settings and identifying ecological source areas based on the Composite Ecosystem Service Index (CESI) and landscape connectivity analysis; (2) Developing ecological resistance surfaces and delineating the Ecosystem Service Network (ESN) corridors using the identified ecological sources and the MCR model, with key pinch points and barriers identified via Circuitscape; (3) Determining corridor thresholds, conducting optimization simulations, and proposing precise enhancement measures.

3.2. Study Area

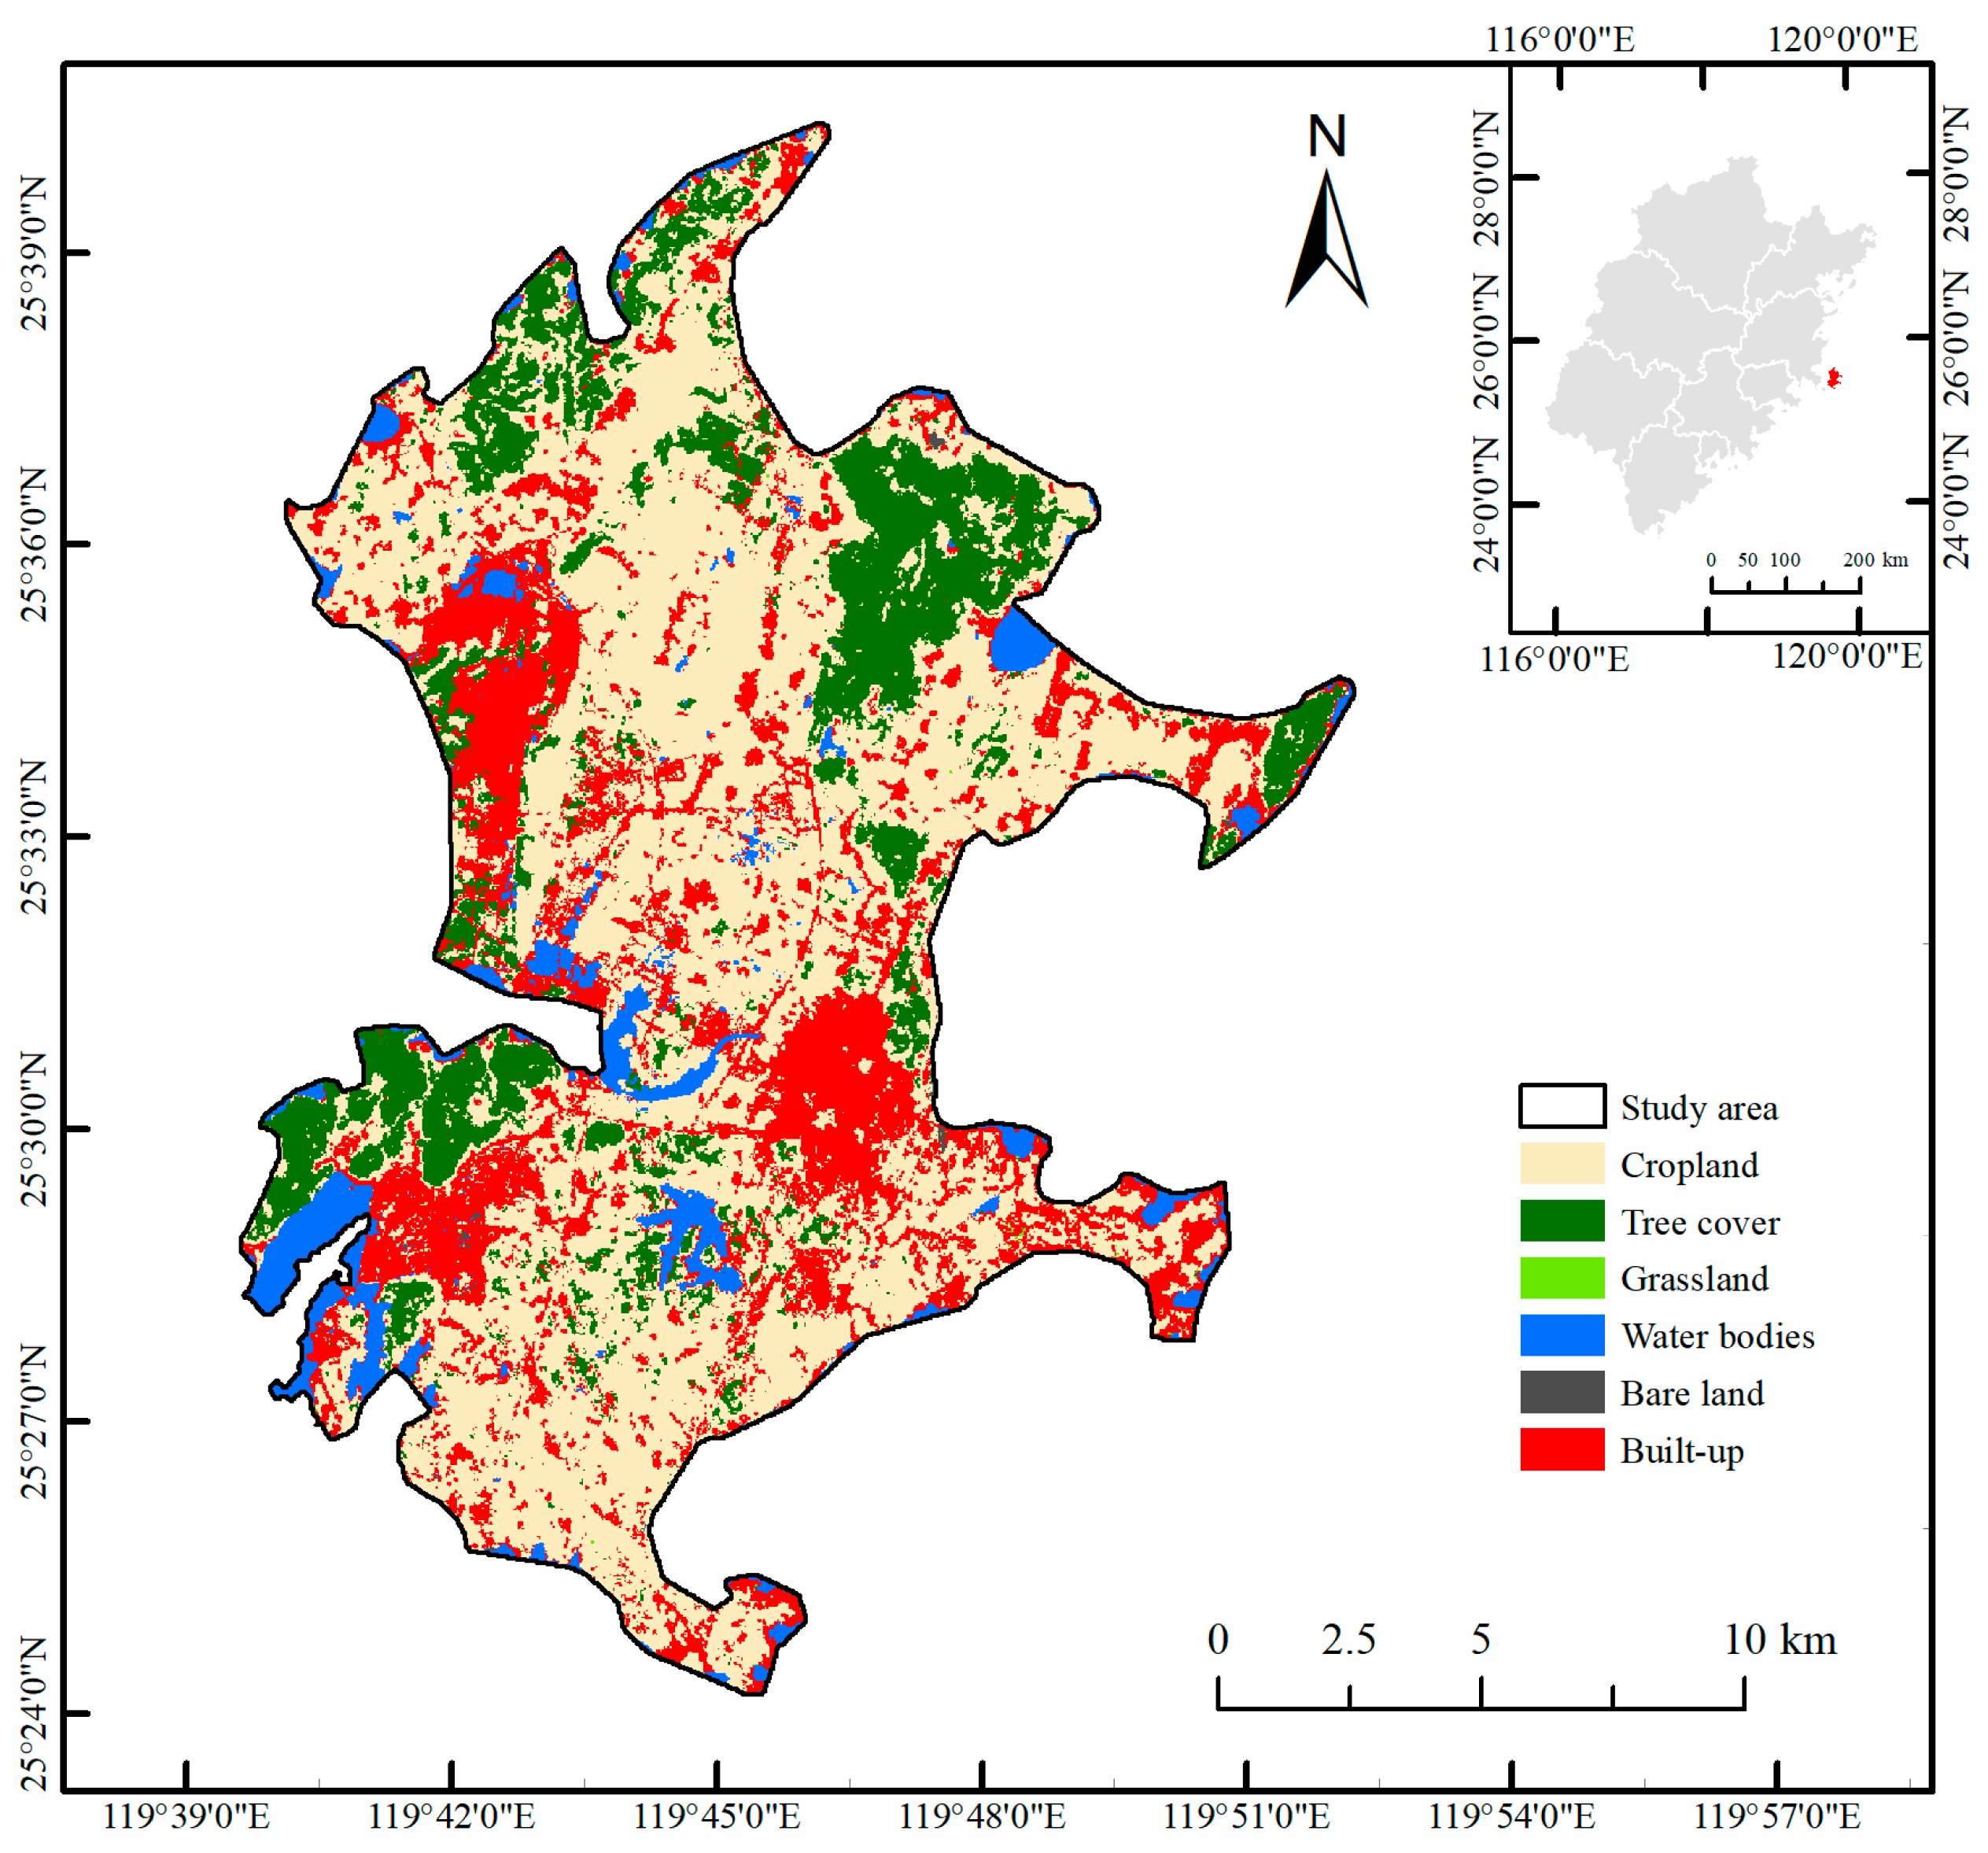
Pingtan Island is located in the southeastern part of Fuzhou City, China, bordering the Taiwan Strait in the east and the Haidan Strait in the west, and bordering Changle and Fuqing, with a length of about 30 km from north to south and a width of about 19 km from east to west, covering an area of 274. 33 square kilometers, and is located at a latitude of 25°15′–25°45′ N and a longitude of 119°32′–120°10′ E (Figure 2). With the establishment of the Pingtan Comprehensive Experimental Zone, the opening of the Pingtan Strait Bridge and the Public Railway Bridge, as well as the construction of the International Tourism Resort, the connection between Pingtan and the inland has been strengthened [36]. Nevertheless, anthropogenic interventions—including the exploitation of ecological and cultural tourism assets, infrastructure expansion, and urban real estate development—have persistently disrupted the equilibrium and provision of ecosystem services on Pingtan Island. These disturbances have resulted in a series of ecological and environmental challenges such as degradation of native habitats, shoreline retreat, increased coastal erosion, and deterioration of coastal shelterbelt systems [37].
The 2022 Land Use/Cover Change (LUCC) data were derived from the 30-m resolution annual land cover dataset and its dynamics in China (1985–2022), publicly released by Wuhan University. Six primary land use categories—cropland, tree cover, grassland, water bodies, bare land, and built-up areas—were extracted using spatial cropping tools. In addition, the study incorporated a range of auxiliary datasets, including DEM data, vector data for urban and highway road networks, points of interest (POIs), air temperature, potential evapotranspiration, mean annual precipitation, soil quality, and root depth [38,39]. Comprehensive metadata regarding these datasets are presented in Table 1.

3.3. Assessment of the Quantity of Ecosystem Service Functions

3.3.1. Habitat Quality Modeling

The InVEST Habitat Quality model assesses habitat quality based on land cover, habitat sensitivity, threat distance, and pressure type. Quality is primarily determined by the habitat’s ecological suitability and its distance from threat sources. Typically, lower surrounding land use intensity leads to higher habitat quality [40]. The model uses the following equations:
D x j = r = 1 R y = 1 Y r w r r = 1 R w r r y i r x y β x S j r
In this formulation, Yr represents the total number of raster units impacted by stressor r, while R is the count of all considered stressors. The term Wr denotes the normalized influence weight of each stressor. ry refers to the number of overlapping stressors acting on raster cell y, and βx quantifies the exposure magnitude at raster location x. The sensitivity of landscape type j to stressor r is expressed by Sjr, and irxy indicates the maximum effective distance over which stressor r affects raster x from source cell y. Dxj quantifies the cumulative impact on landscape type j at raster position x, accounting for the joint contributions of all stressors.
Q x j = H j 1 D x j z k z + D x j z
In this context, Qxj denotes the habitat quality of patch group x within landscape category j, while Hj indicates the habitat suitability score assigned to landscape type j. The parameter z serves as a scaling exponent, commonly set to 2.5, and k is the half-saturation constant, typically assigned a value of 0.5.

3.3.2. Soil Conservation Modeling

The Soil Conservation module in InVEST estimates annual soil erosion based on a simplified Universal Soil Loss Equation (USLE), linking rainfall, soil properties, and topography [41]. The actual soil loss is calculated as:
A a c t = R × K × L S × C × P
where Aact, R, K, LS, C, and P denote the actual soil loss, rainfall erosivity factor, soil erodibility factor, topographic factor (slope length and steepness), cover-management factor (vegetation and land-use effects), and support practice factor, respectively. In this study, P was assumed to be 1 due to data limitations.

3.3.3. Water Supply Model

The water supply model is used to simulate the amount of surface water supply in a certain area, and the more water supply means the stronger water supply service. The model is a simplified hydrological cycle model that ignores the influence of groundwater, and utilizes the principle of water balance to calculate the water supply based on the Budyko curve and regional annual rainfall, i.e., the rainfall minus the actual evapotranspiration of each grid is equal to the water supply of the grid [42]. The formula is as follows:
Y x = 1 A E T x P x × P x
A E T x P x = 1 + ω x R x 1 + ω x R x + ( 1 R x )
ω x = Z A W C x P x
R x = K x × E T 0 P x
where Yx is the annual water production (mm); PX denotes the annual precipitation of grid cell x; AETx (annual evapotranspiration) is the average annual evapotranspiration (mm) from grid cell x for different land use types; Rx is the Bydyko drying index; ω x is a non-physical parameter of natural climate–soil properties; Z is an empirical constant with values ranging from 1 to 10; AWCx (available water content) is the effective water content (mm) of the soil for grid cell x; Kx is the vegetation evapotranspiration coefficient for different land cover types in raster cell x; ET0 (evapotranspiration) is the reference crop evapotranspiration coefficient.

3.3.4. Carbon Stock Modeling

The InVEST model estimates ecosystem carbon storage by quantifying the contributions of four major carbon pools—aboveground biomass, belowground biomass, soil organic carbon, and litter. For each land cover category, carbon stock is computed as the product of the average carbon density associated with each pool and the corresponding land use area, as described by the following equation [43]:
C t o t a l = C a b o v e + C b e l o w + C s o i l + C d e a d
where Ctotal indicates total carbon, Cabove indicates above-ground carbon stock, Cbelow indicates below-ground carbon stock, Csoil indicates soil carbon stock, and Cdead indicates litter carbon stock.

3.3.5. Cultural Ecosystem Services (CESs)

Grounded in the maximum entropy principle, the MaxEnt model employs multiple environmental predictors alongside machine learning algorithms to estimate the probability distribution of species occurrences. When carrying out species distribution modeling, the model can predict the probability of species existence in unknown areas based on the distribution scale of the mastered species and the use of a variety of environmental factors, including land use type, altitude and slope, and so on [44]. The formula is as follows:
H X / Y = i n p X , Y l o g p ( X , Y )
X * = a r g m a x H ( X / Y )
In this formulation, X denotes the observed distribution of the target species or phenomenon, while Y represents the associated environmental variables. The parameter n refers to the number of training samples. The joint probability distribution is expressed as p X , Y , and H X / Y indicates the conditional entropy of the training dataset. The term X * corresponds to the distribution that maximizes entropy under the given constraints.
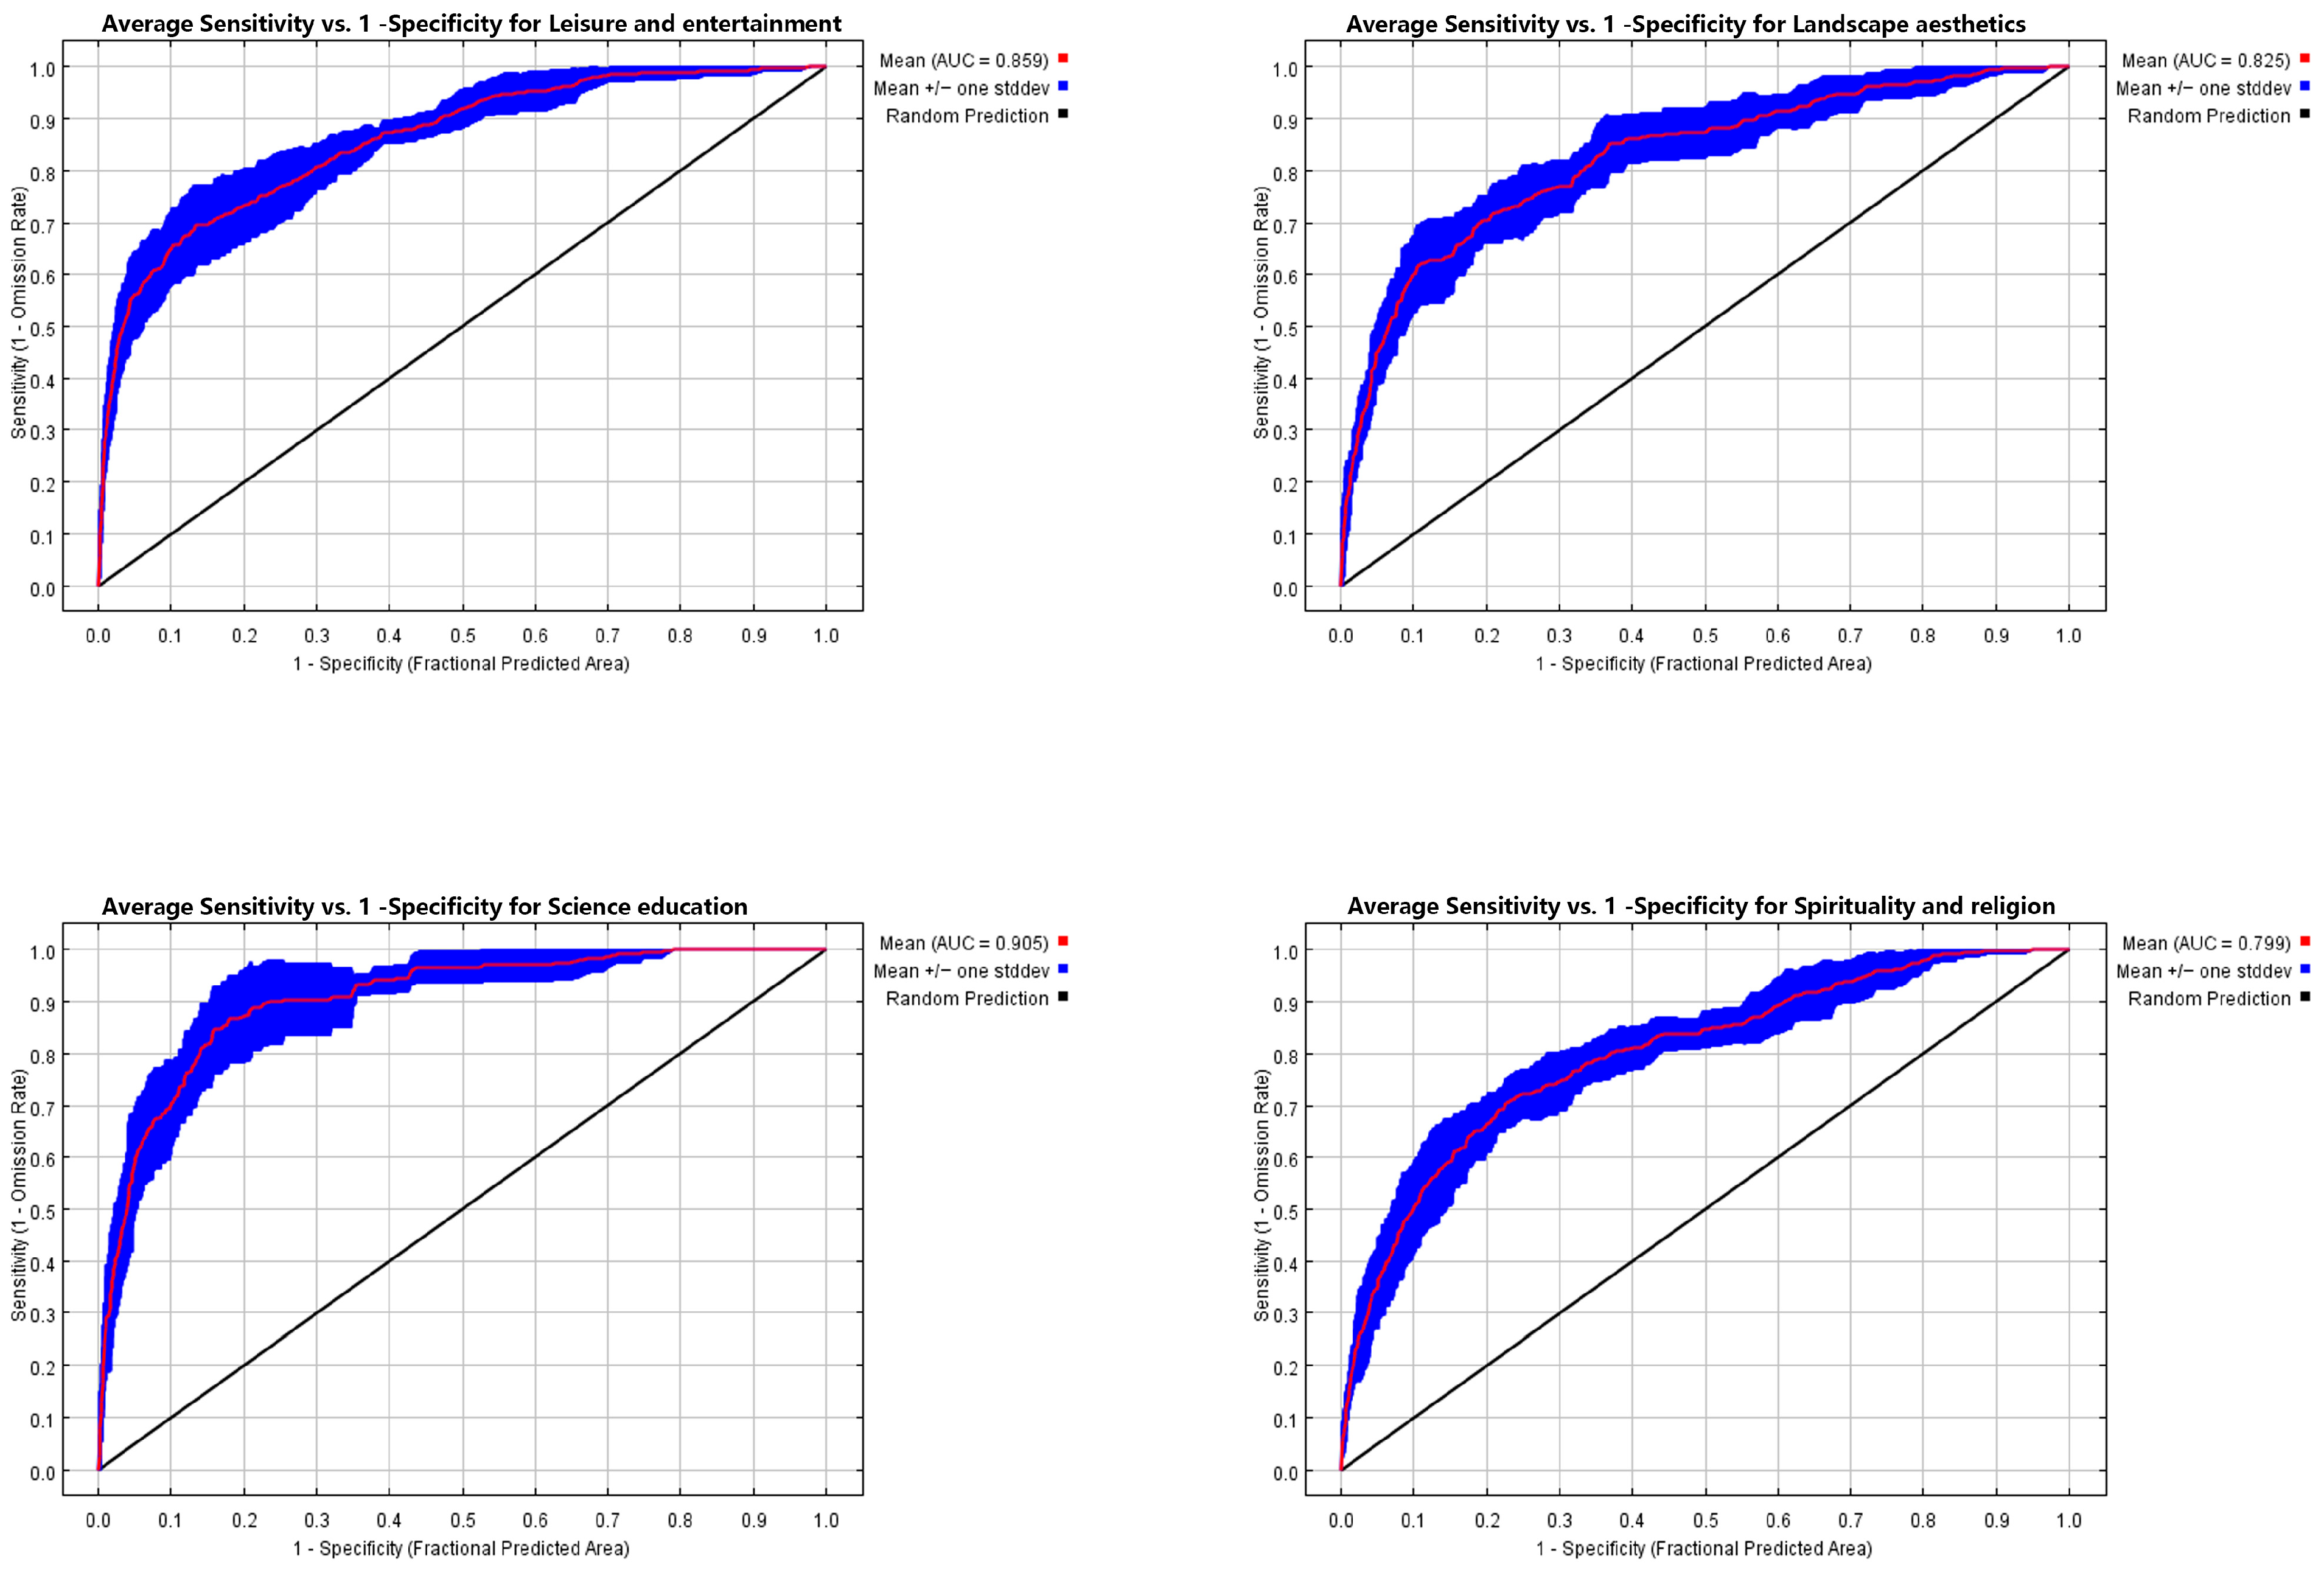
Following established methodologies [45,46], the cultural point data were randomly partitioned into a training set (75%) and a test set (25%). The MaxEnt model was executed 10 times using default parameter settings, and model performance was assessed based on the mean AUC value derived from the receiver operating characteristic (ROC) curves (Figure 2, Figure A1 and Figure A2). In selecting environmental predictors, we consulted prior studies and included land use type, DEM, slope, and distances to shoreline, roads, and water bodies [47]. All environmental layers were converted to ASCII format compatible with MaxEnt.

3.4. CESI Construction

A total of eight key indicators were selected for the study to construct substance-based ecological service functions (biophysical factors and ecological processes) and cultural service functions (CES). Four of the ecological service functions relate to the supply, support and regulation service key ES, including habitat quality, water conservation, carbon storage and soil conservation [48]. For cultural service functions, including science education, spirituality and religion, landscape aesthetics and leisure and entertainment [49], the InVEST model and POI point correction combined with the MaxEnt model were used to quantitatively assess the ecological and cultural service functions, respectively. The construction of the composite index can integrate these dispersed elements with different quantitative scales to form a unified measure and present the ecosystem service functions comprehensively. Principal Component Analysis (PCA) aims to use dimensionality reduction analysis to extract common factors and transform multiple indicators that were originally correlated into several new comprehensive indicators that are not correlated [50]. Therefore, in this study, principal component analysis was used to calculate the eight ecosystem service indicators corresponding to Pingtan Island, to evaluate their affiliation, to obtain the weights of the indicators, and to construct a composite index of ecological services, before which standardization was carried out in order to unify the sizes of ecological service factors.

3.5. Ecological Source Identification and Resistance Factor Selection

Ecological patch selection should emphasize areas with adequate size, high ecosystem service capacity, and strong landscape connectivity. To this end, the landscape connectivity index was integrated into the ecological source screening framework. Referencing relevant literature [27], two indices—the probable connectivity index (PC) and the patch importance index (dPC)—were adopted to assess regional landscape connectivity and the contribution of individual patches to connectivity, respectively, with their calculation formulas as follows:
P C = i = 1 n j = 1 n a i a j p i j * A L 2
d P C = P C P C r e m o v e P C × 100 %
In Equation (11), AL denotes the total landscape area; n is the total number of patches; ai and aj represent the areas of patches i and j, respectively; and pij indicates the possible connectivity index between patches i and j, with a range of 0 to 1. The larger the value of the PC value, the better the connectivity between patches.
In Equation (12), PCremove represents the overall connectivity of the landscape after a specific patch is removed. A higher dPC value indicates a greater contribution of the patch to maintaining landscape connectivity.
Species’ spatial distribution and migration pathways are influenced by a range of biophysical factors, including land cover type, elevation (DEM), and slope [29]. Among these, variations in land cover have a significant impact on the spatial layout of ecological corridors. Vegetation-covered areas—such as woodlands, shrublands, and grasslands—are generally more conducive to corridor expansion, whereas impervious surfaces present higher construction costs. In addition, proximity to urban roads and coastal zones imposes constraints on the reproduction and dispersal of flora and fauna [33]. Ecosystem service functions further reflect the fundamental ecological value of land [48]. Accordingly, drawing upon relevant literature [31], resistance surface construction in this study incorporated five key factors: land use type, elevation, slope, distance from the coastline, and the CESI. The weights of these resistance factors were determined using a combination of the Delphi method and Analytic Hierarchy Process (AHP), as detailed in Table 2. The consistency ratio (CR), calculated from a reconstructed pairwise comparison matrix, was 0.05 (<0.1), indicating acceptable matrix consistency.

3.6. Construction of Ecosystem Services Network (ESN) Based on MCR Modeling

Corridors are important linear landscape resources that effectively promote the exchange and diffusion of ecosystem services within a region [30], and the minimum cumulative resistance model (MCR) is widely used in the construction of ecological corridors [31]. Based on the combined resistance surface in the study area, the least-cost distances lost for species movement between sources were calculated, and least-cost paths were extracted between the sources to obtain the potential ESN. The formula for the MCR model is as follows:
M C R = f m i n i = m j = n D i j × R i
where M C R is the minimum cumulative resistance value; f is the positive functional relationship between the model and the variables; D i j is the spatial distance taken by the ecological flow from i to the landscape unit j , R i is the value of weighted resistance of landscape patch i to the migration of the species, and is the cumulative resistance of the ecological flow passing through the patches between i and landscape j .

3.7. Identification of Ecological Pinchpoints and Barriers

As a key position in the overall network structure, ecological nodes bear the important responsibility of connecting neighboring ecological sources, not only as a simple connection of regional ecological processes, but also play a crucial role in promoting or inhibiting ecological zones [29]. In this study, based on the preliminary construction of ESNs in the study area, the Pinchpoint Mapper and Barrier Mapper plug-ins were utilized to identify “pinchpoints” and barriers in ESNs [27]. Among them, “pinchpoints” are the areas in the ecological corridors where water flows converge most intensively, where the frequency of species information transfer and exchange between different ecological sources reaches a peak, and which play an irreplaceable and critical role in maintaining the integrity and functionality of the ecological corridors [51]. Barriers are areas in ecological corridors where species migration and exchange are blocked, and the implementation of effective ecological restoration measures can help to significantly improve the overall connectivity and functional efficiency of the corridors [52].
Related studies show that the corridor width setting in the Pinchpoint Mapper plug-in does not substantially affect the location determination of pinchpoints [53]. In order to facilitate the visualization of the results, the threshold value of corridor “width” was set to 500 m with reference to related studies [33]. Finally, the natural breakpoint method was used to categorize the data and classify the “pinchpoints” into three classes. In this study, the classification results of the highest level of “pinchpoints” were considered as representative key “pinchpoints”.
When calculating the ecological barriers, we set the relevant parameters to ensure the accuracy and reliability of the results [53]. The minimum search radius was set to 30 m, the maximum search radius was set to 90 m, the step size was set to 60 m, and the default “maximum” mode was used in the iteration process. The natural breakpoint method is also used to grade the calculation results, and the highest level is selected as the key obstacle point. The relevant calculation formula is shown in reference [27].

3.8. Determination of Optimal Width of ESN and Current Density Simulation

Relevant studies have shown that specific species conservation objectives, corridor structure, landscape connectivity, land-use type and vegetation characteristics are important drivers of corridor width [54,55]. Referring to different types of urban ecological corridor studies [29,33,56], there are differences and certain patterns in the setting of width thresholds due to the different functional attributes carried by each. Based on the species characteristics of the study area, we excluded the medium-sized and metamorphic mammals that rarely occur in island-type cities from the appropriate corridor width thresholds [57] (Table 3). As shown in Table 3, the width of the ecological corridor can be divided into 12 m, 200 m and 600 m thresholds, and since this study is limited by the land cover resolution of 30 m × 30 m, the corridor width of 30 m is used as the starting gradient [58].
Due to the varying cultural functions they serve, the widths of specialized cultural corridors—such as those for education and science popularization, recreation and entertainment, and landscape aesthetics—differ accordingly [13,59,60]. Relevant studies are summarized in Table 4. We can see that the width of cultural corridors can be divided into 5 m, 8 m, 30 m and 100 m thresholds. Based on this, we analyze the functional characteristics of different types of cultural and ecological corridors and simulate the mean level of integrated ecosystem services within the multi-width ESN. To support practical implementation, representative ESN widths of 30 m, 60 m, 90 m, 120 m, 150 m, and 180 m were selected based on the integration of similar values from previous studies. We also analyze the functional characteristics of different types of cultural and ecological corridors and simulate the mean level of integrated ecosystem services within the multi-width ESN. We optimized the ESN for multiple ecosystem services by establishing corridor buffers with different gradients, mask extracting and analyzing the relative changes of CESI and land cover types in each level of corridors, and thus determining the appropriate width thresholds. Finally, we used the circuitscape tool to simulate the average current densities before and after the construction of the corridors, to verify the effect of the optimization and enhancement [27,33].

4. Results

4.1. Results of the Quantification of Ecosystem Service Functions

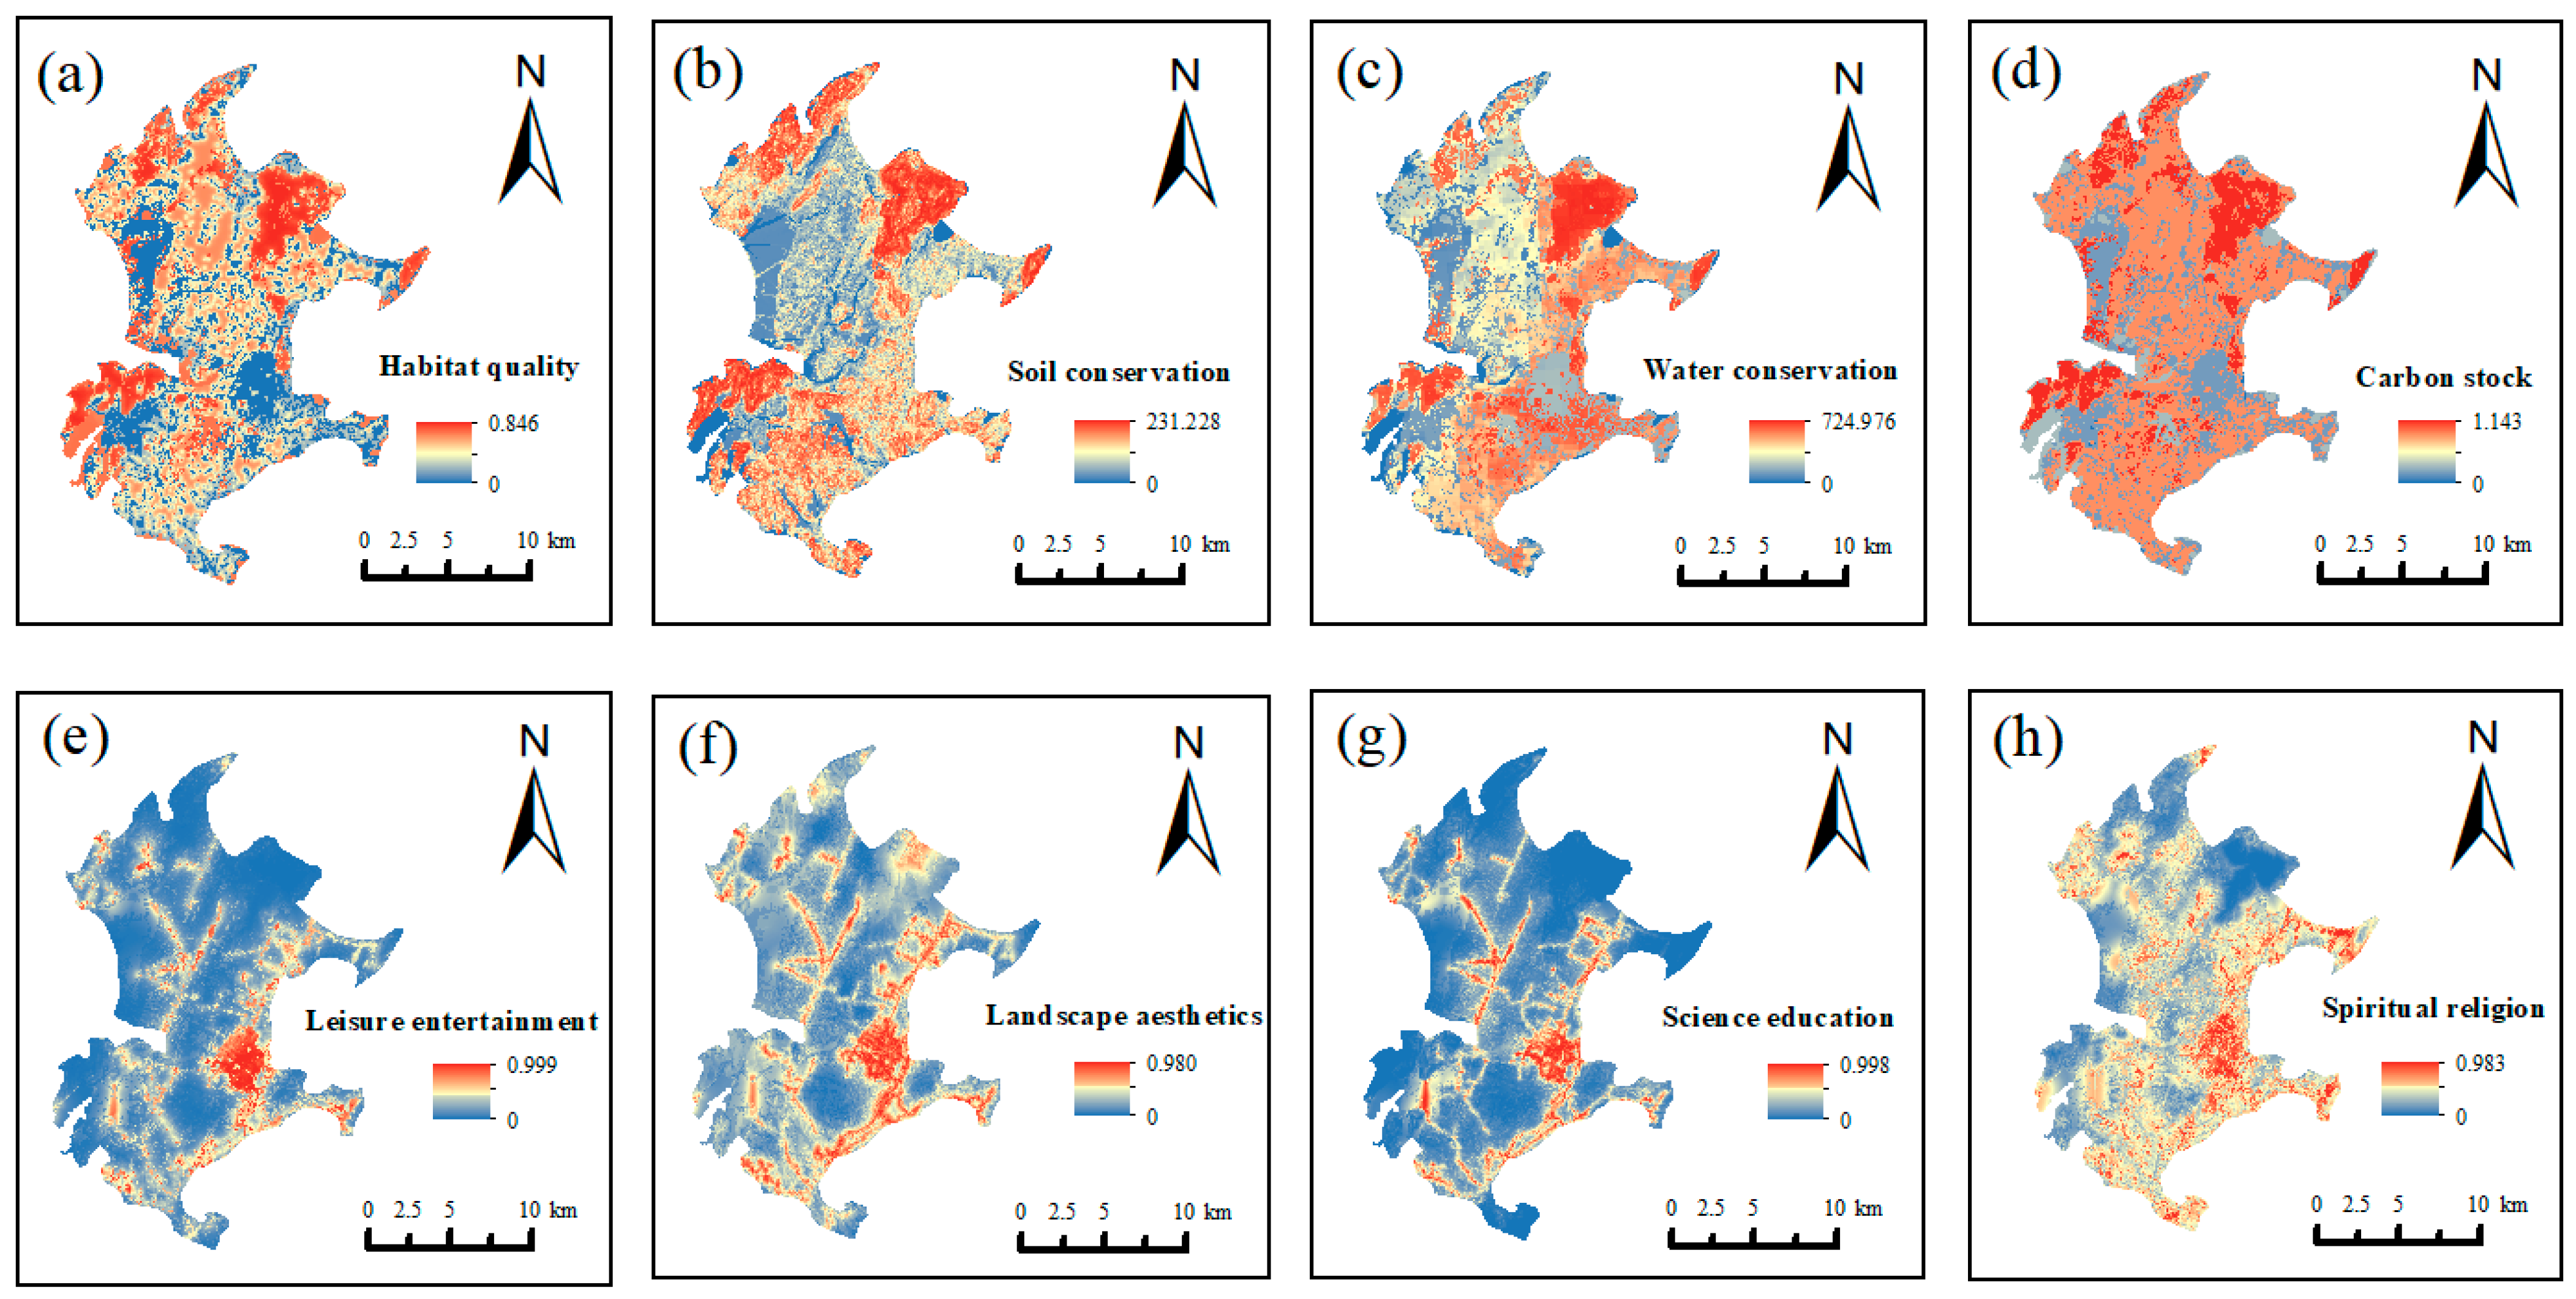
Figure 3 presents the spatial distribution of eight ecosystem service (ES) types on Pingtan Island in 2022, comprising ecological services (Figure 3a–d) and cultural services (Figure 3e–h). Both categories exhibit marked spatial heterogeneity, shaped by the combined effects of topography, vegetation cover, and human activity.
For ecological services, habitat quality had a mean value of 0.268, with high levels concentrated in the central and southeastern hilly areas where dense forests and minimal disturbance maintain ecological integrity. Soil conservation averaged 23.88 t/ha, with higher values in hilly and sloping regions, reflecting the stabilizing role of vegetation root systems in controlling erosion. Water yield reached a mean of 327.88 mm, with elevated levels in the central and northwestern hilly areas, where precipitation and vegetation jointly enhance hydrological regulation. Carbon storage had a mean of 0.428 t/ha, with hotspots in densely forested zones, underscoring the importance of forests in long-term carbon sequestration.
For cultural services, leisure and entertainment had a mean value of 0.209, concentrated in coastal tourist areas where infrastructure and accessibility support service provision. Landscape aesthetics averaged 0.328, with high values in coastal cliffs and hilly areas of high geomorphological heterogeneity, indicating the synergy between landform diversity and visual appeal. Science and education services showed a mean of 0.199, with hotspots around nature reserves, public facilities, and research institutions, highlighting the influence of spatial planning and institutional presence. Spiritual and religious services averaged 0.381, peaking in eastern urban centers and heritage sites, where historical accumulation and cultural traditions play a dominant role. Overall, ecological services are largely determined by natural conditions, whereas cultural services are more strongly influenced by accessibility, infrastructure, and socio-cultural drivers.

4.2. CESI Calculations

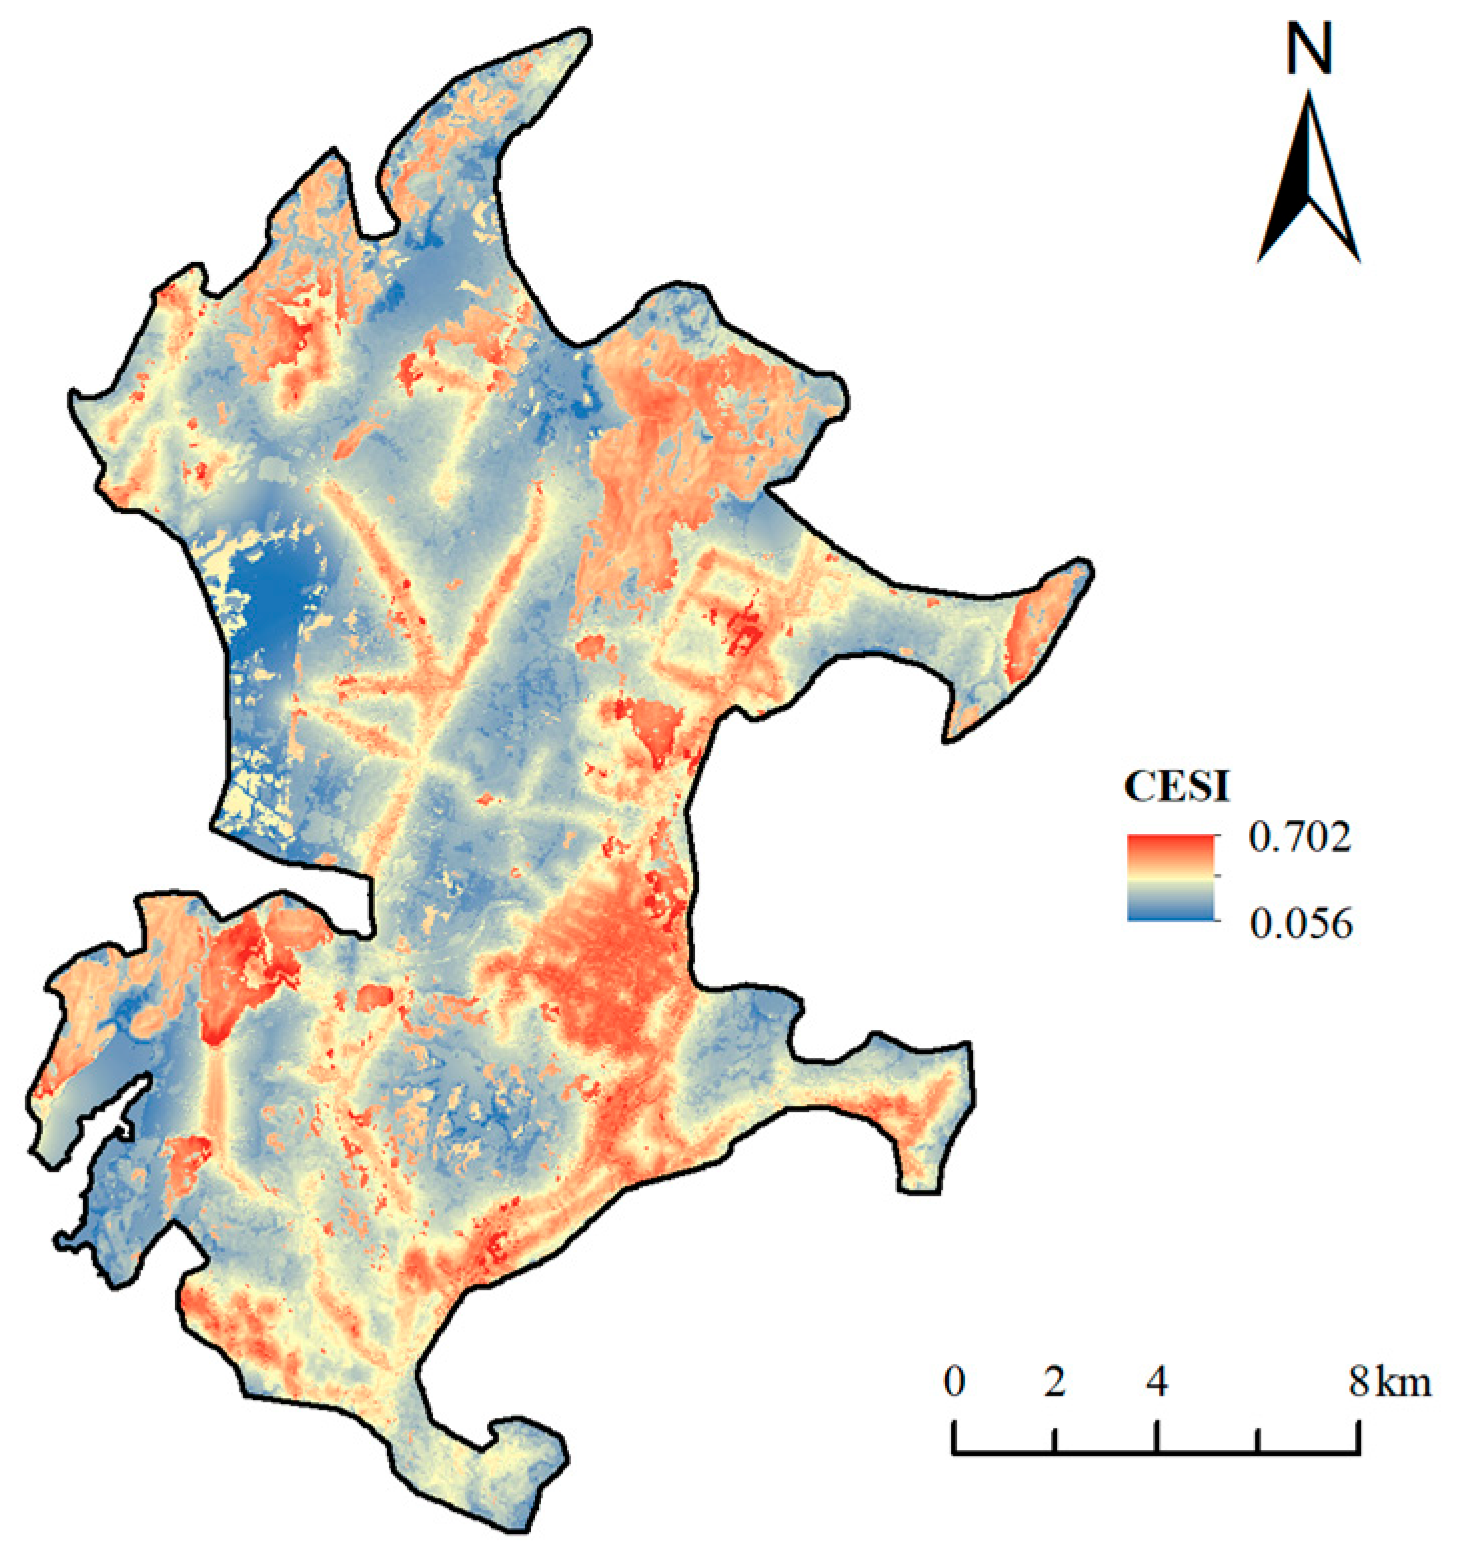
Principal component analysis (PCA) was conducted on the eight selected ecosystem service indicators. The eigenvalues and contribution rates of each principal component are presented in Table 5. PC2 exhibited a contribution rate of 74.012%, indicating that it captures the majority of information from the four core indicators. Therefore, the first two principal components were retained to construct the evaluation index system for integrated life-supporting services on Pingtan Island. The final integrated ecosystem service values were computed and visualized using the raster calculator in ArcGIS 10.8 (Figure 4). The mean value of CESI on Pingtan Island is 0.2966. The mean CESI value on Pingtan Island is 0.2966, representing a moderate level of ecosystem service provision. This pattern is consistent with coastal cities experiencing strong anthropogenic pressure [33], where ecological vulnerability and tourism-driven urban expansion constrain overall ecological performance. In terms of spatial distribution, the distribution of high-value zones of integrated ecosystem services on Pingtan Island is concentrated along the eastern coast and the structure is more complete, mainly in the built-up areas providing high CES. On the other hand, the high-value areas in the northwest are more scattered, mainly the mountains in the study area, and the comprehensive ecosystem service provision is more general.

4.3. Extraction of Ecological Sources and Results of Combined Resistance Surface Construction

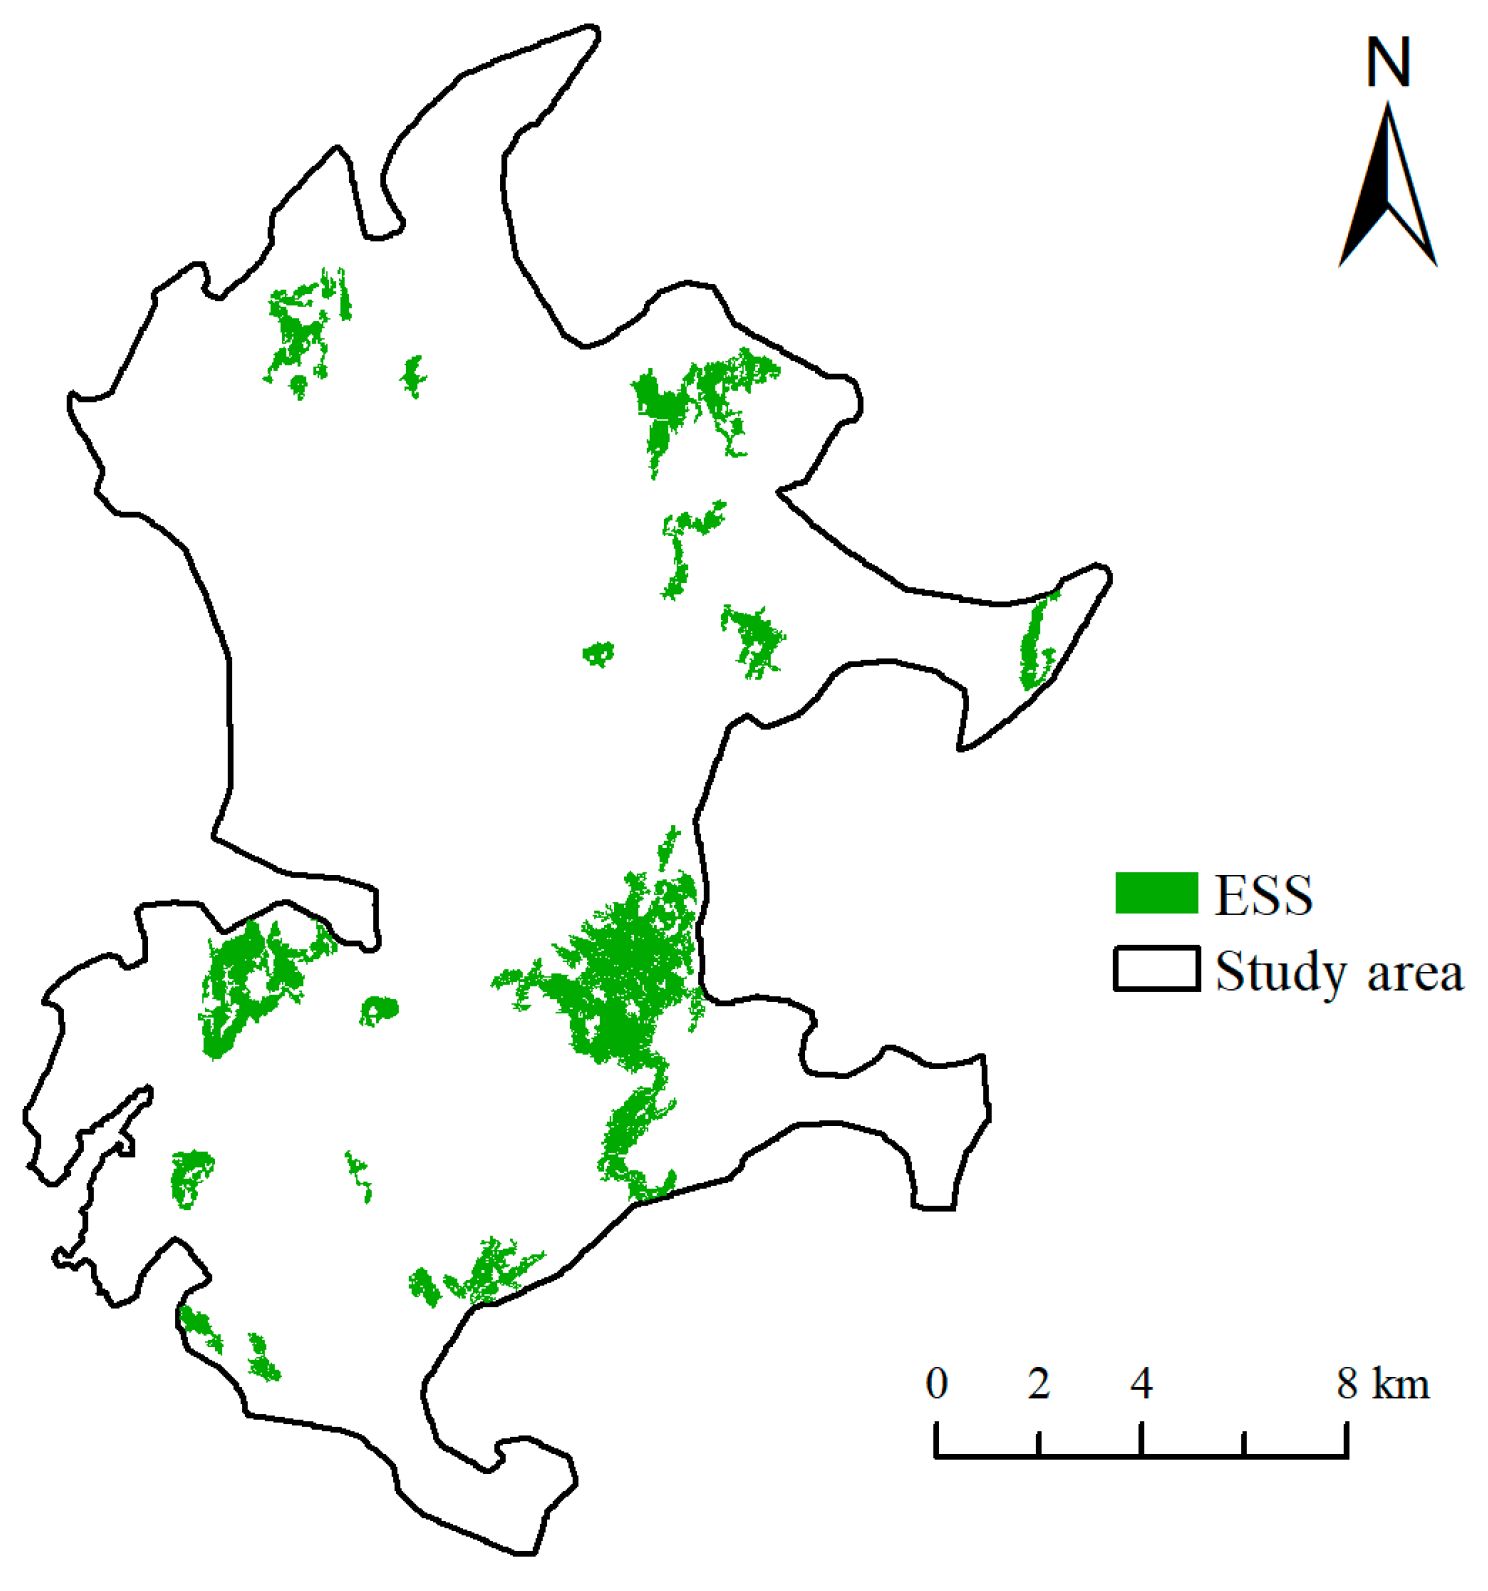
Based on the results of the CESI assessment, the ecological patches were categorized into five classes, and the patches with CESI values greater than 0.4383 were extracted. Further, we screened patches with an area greater than 0.05 km2 and a dPC greater than 0.5 as sources [27,46]. Based on the results of the above analysis, a total of 20 sources were extracted from Pingtan Island (Figure 5), accounting for 8.55% of the total area. In terms of spatial distribution, most of the large sources are close to the coastline of the study area, mainly distributed along the southern coast of the study area. In the central part of the study area, there are fewer large source lands limited by the large amount of arable land reserve in the study area, which mainly consists of green spaces supporting urban squares, urban parks, and economic forests. They play an important role in promoting overall ecosystem service connectivity and exchange.
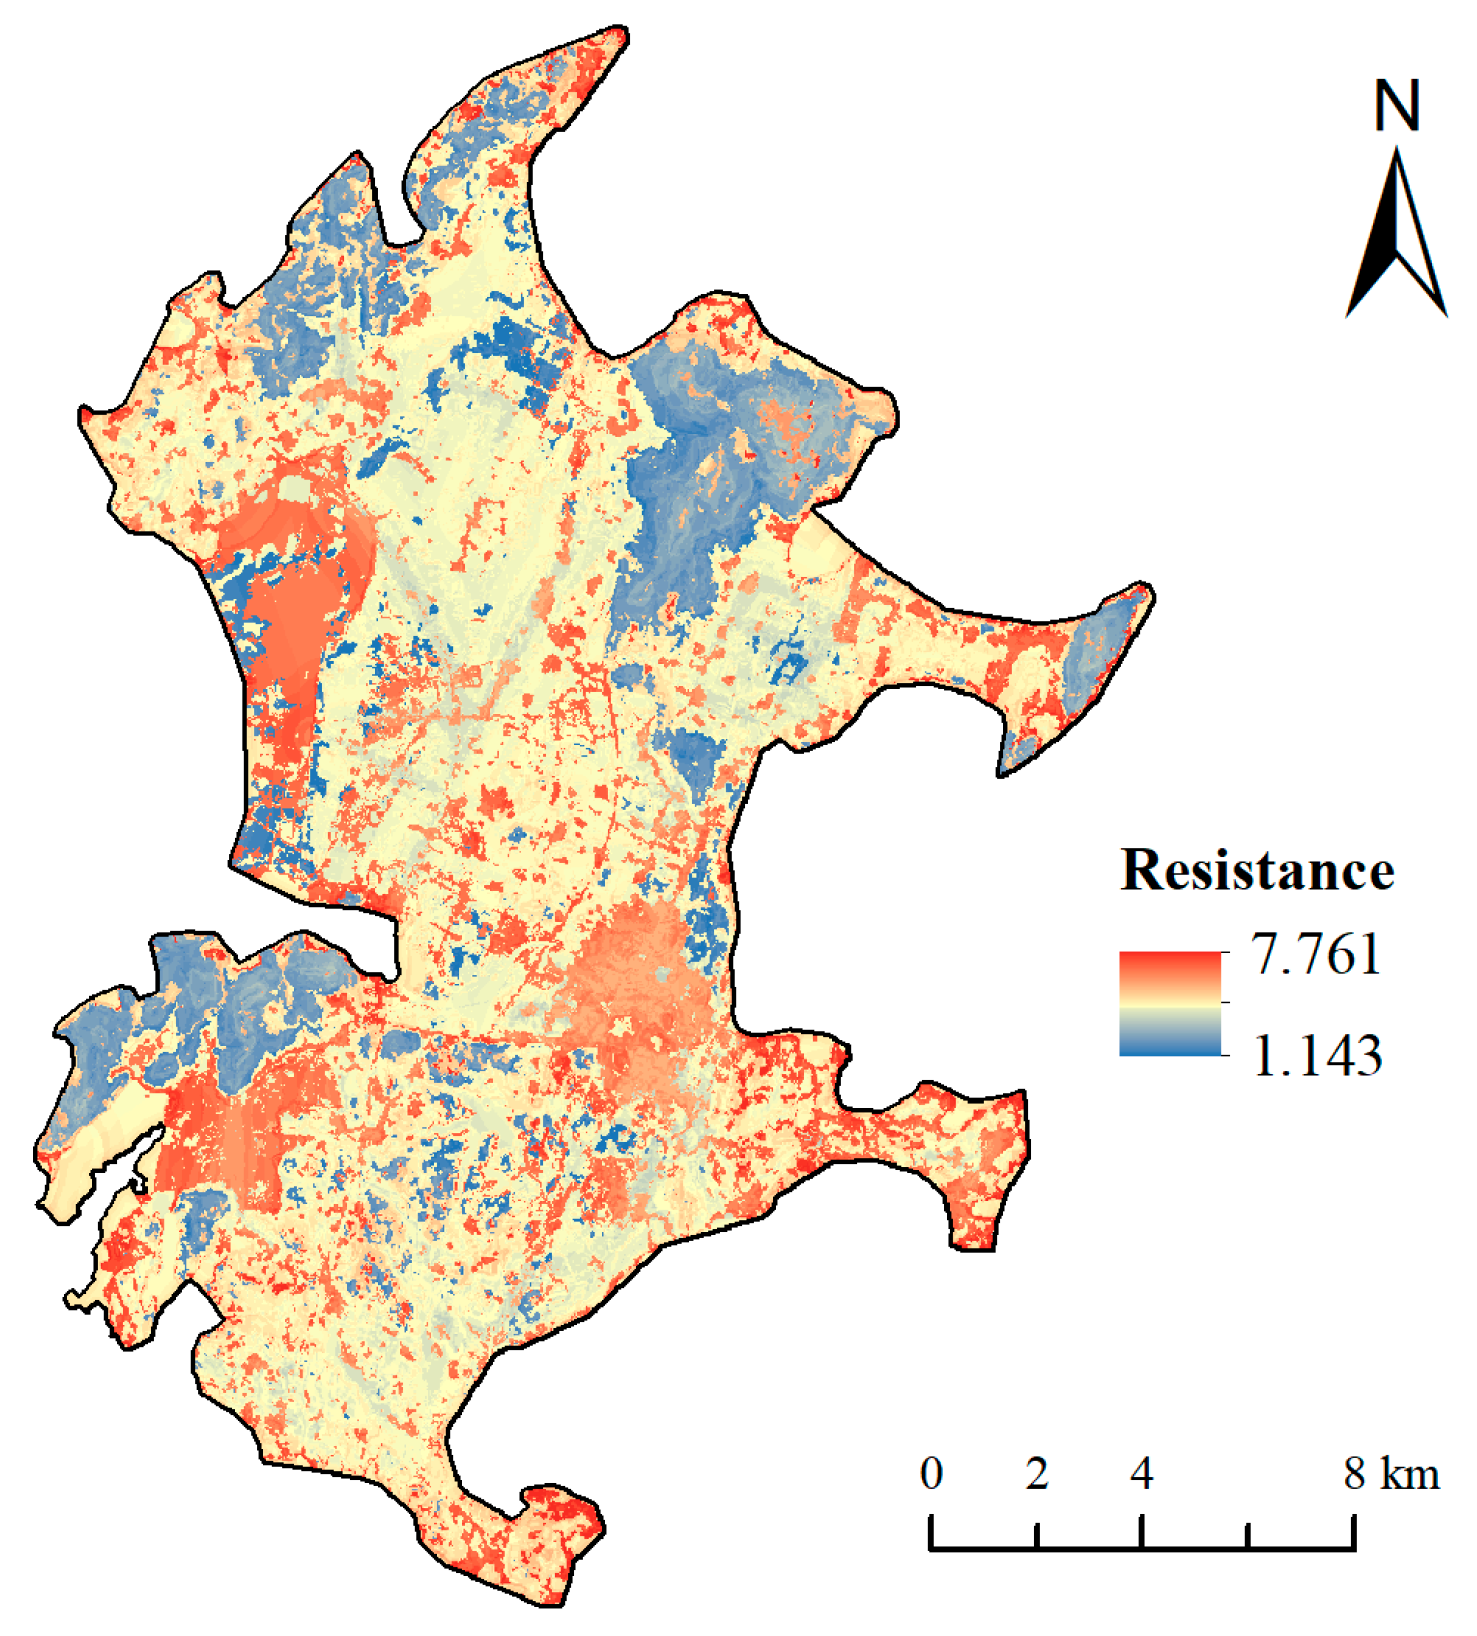
The combined resistance surface (Figure 6) is constructed by the weighted superposition of six resistance factors, with weights determined through the Delphi method and Analytic Hierarchy Process (AHP) [21]. Spatially, the low-resistance areas of Pingtan Island are predominantly situated in mountainous regions, coastal shelterbelts, and urban parks. Conversely, the high-resistance zones are mainly concentrated along the eastern and western coastlines. These high-resistance areas exhibit lower ecological quality compared to the central region, which can be attributed to the high density of construction land, intense population aggregation, and significant risk of coastal erosion.

4.4. Construction of an Ecosystem Service Network on Pingtan Island

The ESN of Pingtan Island, incorporating combined resistance factors, was constructed using the Linkage Mapper 2.0.0 (Figure 7). A total of 45 ecological corridors were identified, with an average length of 3.99 km, ranging from 0.09 km to 13.36 km. This variation indicates that ecological sources on the island are relatively dispersed and lack effective connectivity, highlighting the urgent need for ecological “stepping stones.” Spatially, corridors are relatively evenly distributed, with concentrations in the southern and central regions, where urban parks and natural scenic areas are more prevalent.
Centrality analysis was conducted using the Centrality Mapper to assess the importance of sources and corridors. Based on current flow centrality, 45 ecological sources and 20 corridors were classified into three levels: 8 Level-1, 10 Level-2, and 2 Level-3 sources; and 12 Level-1, 14 Level-2, and 19 Level-3 corridors.
Spatially, Level-1 sources are primarily located in the eastern, western, and central areas of the island, playing a key role in maintaining ecological connectivity. Level-2 sources are mainly distributed around the periphery, serving as ecological buffers for Level-1 sources. Level-3 sources are fewer in number and are situated in the northeastern and southwestern corners, providing auxiliary support for the ecological security of the adjacent coastal zones.
Regarding ecological corridors, Level-1 corridors mainly connect primary sources and some Level-2 sources, and are concentrated along the coastal edges, with an average length of 1.26 km. Level-2 corridors link large peripheral ecological sources with smaller urban sources and average 4.04 km in length. Level-3 corridors are essential for north–south ecological connectivity across the island, with an average length of 6.60 km. Due to Pingtan Island’s elongated north–south shape, these corridors are generally longer and intersect with major roads, green belts, and coastal zones in the island’s northern and southern regions.

4.5. Identification of “Pinchpoints” and Barriers in Ecosystem Services Networks

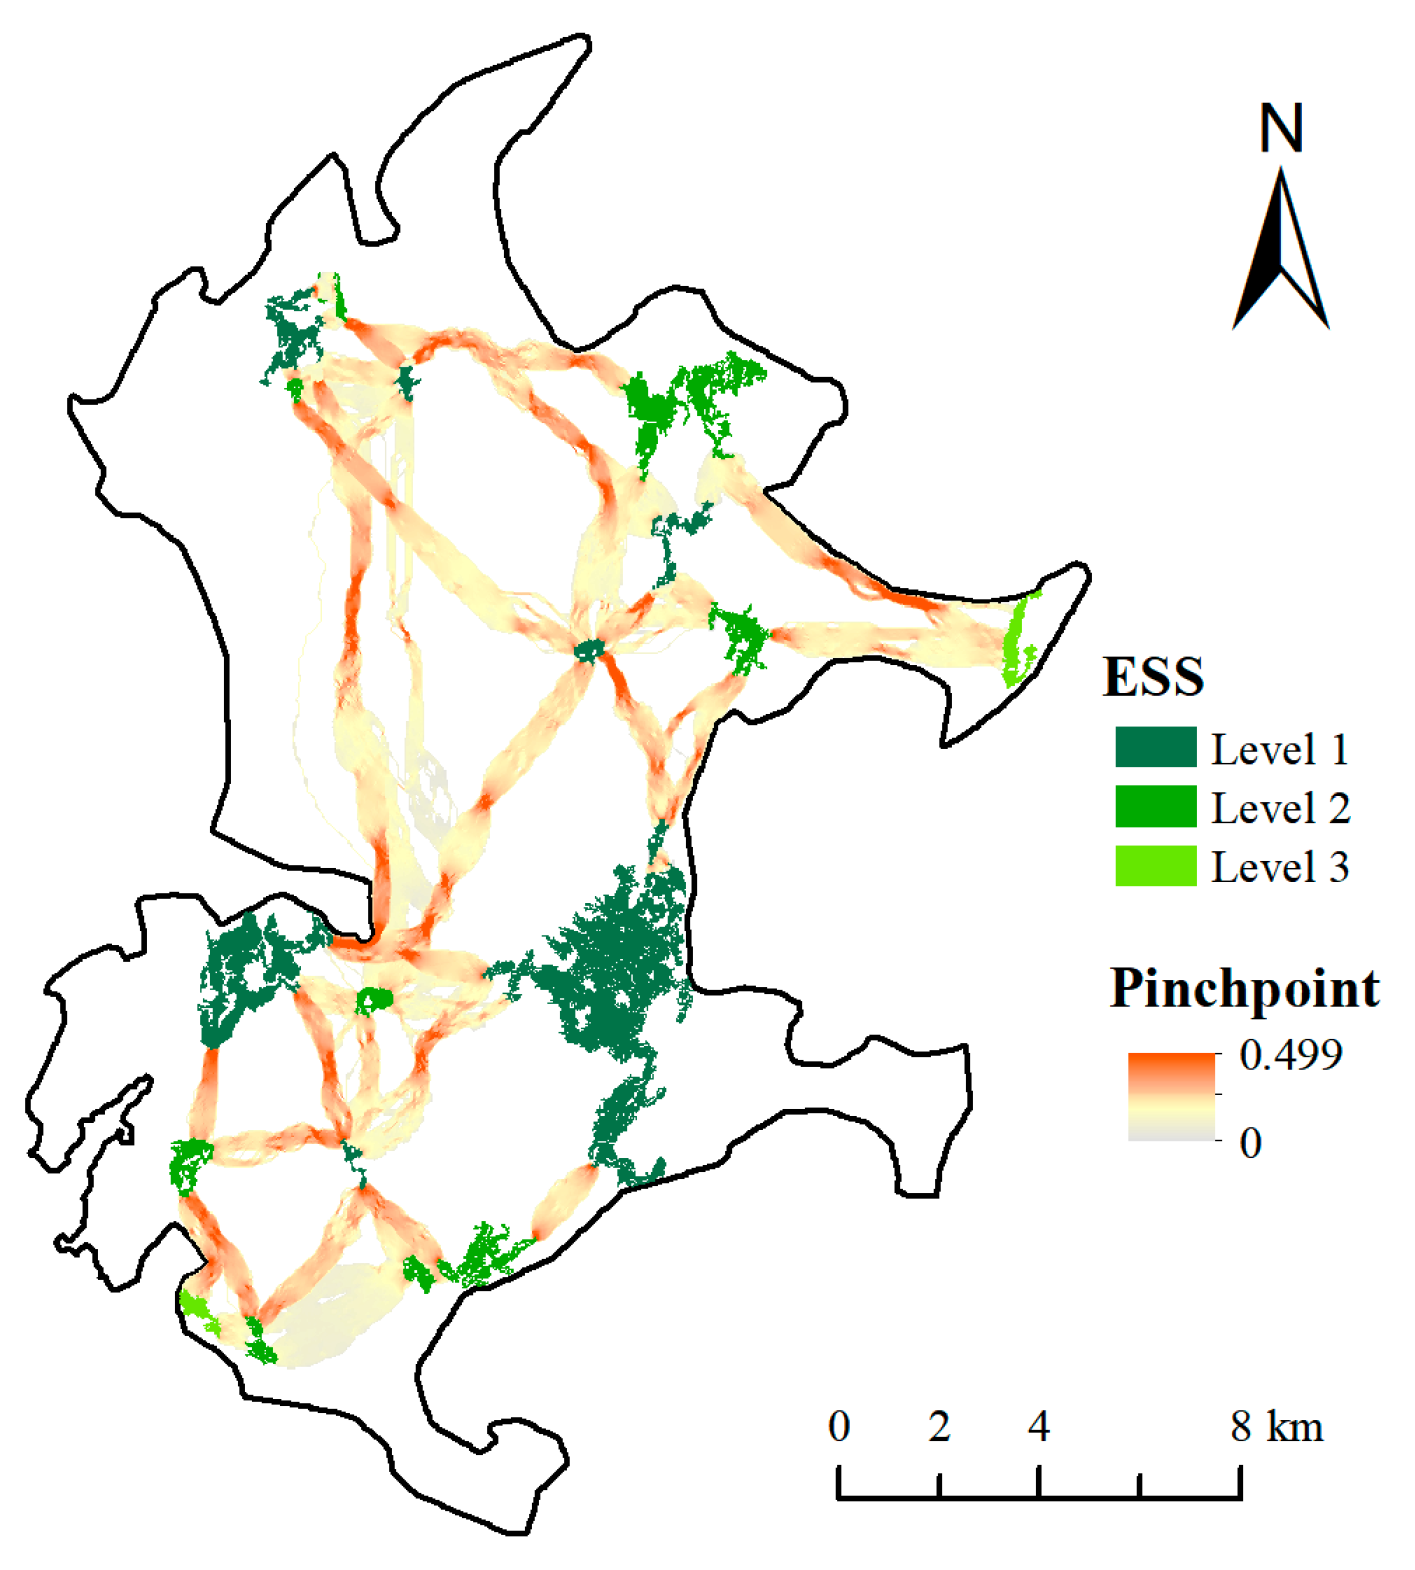
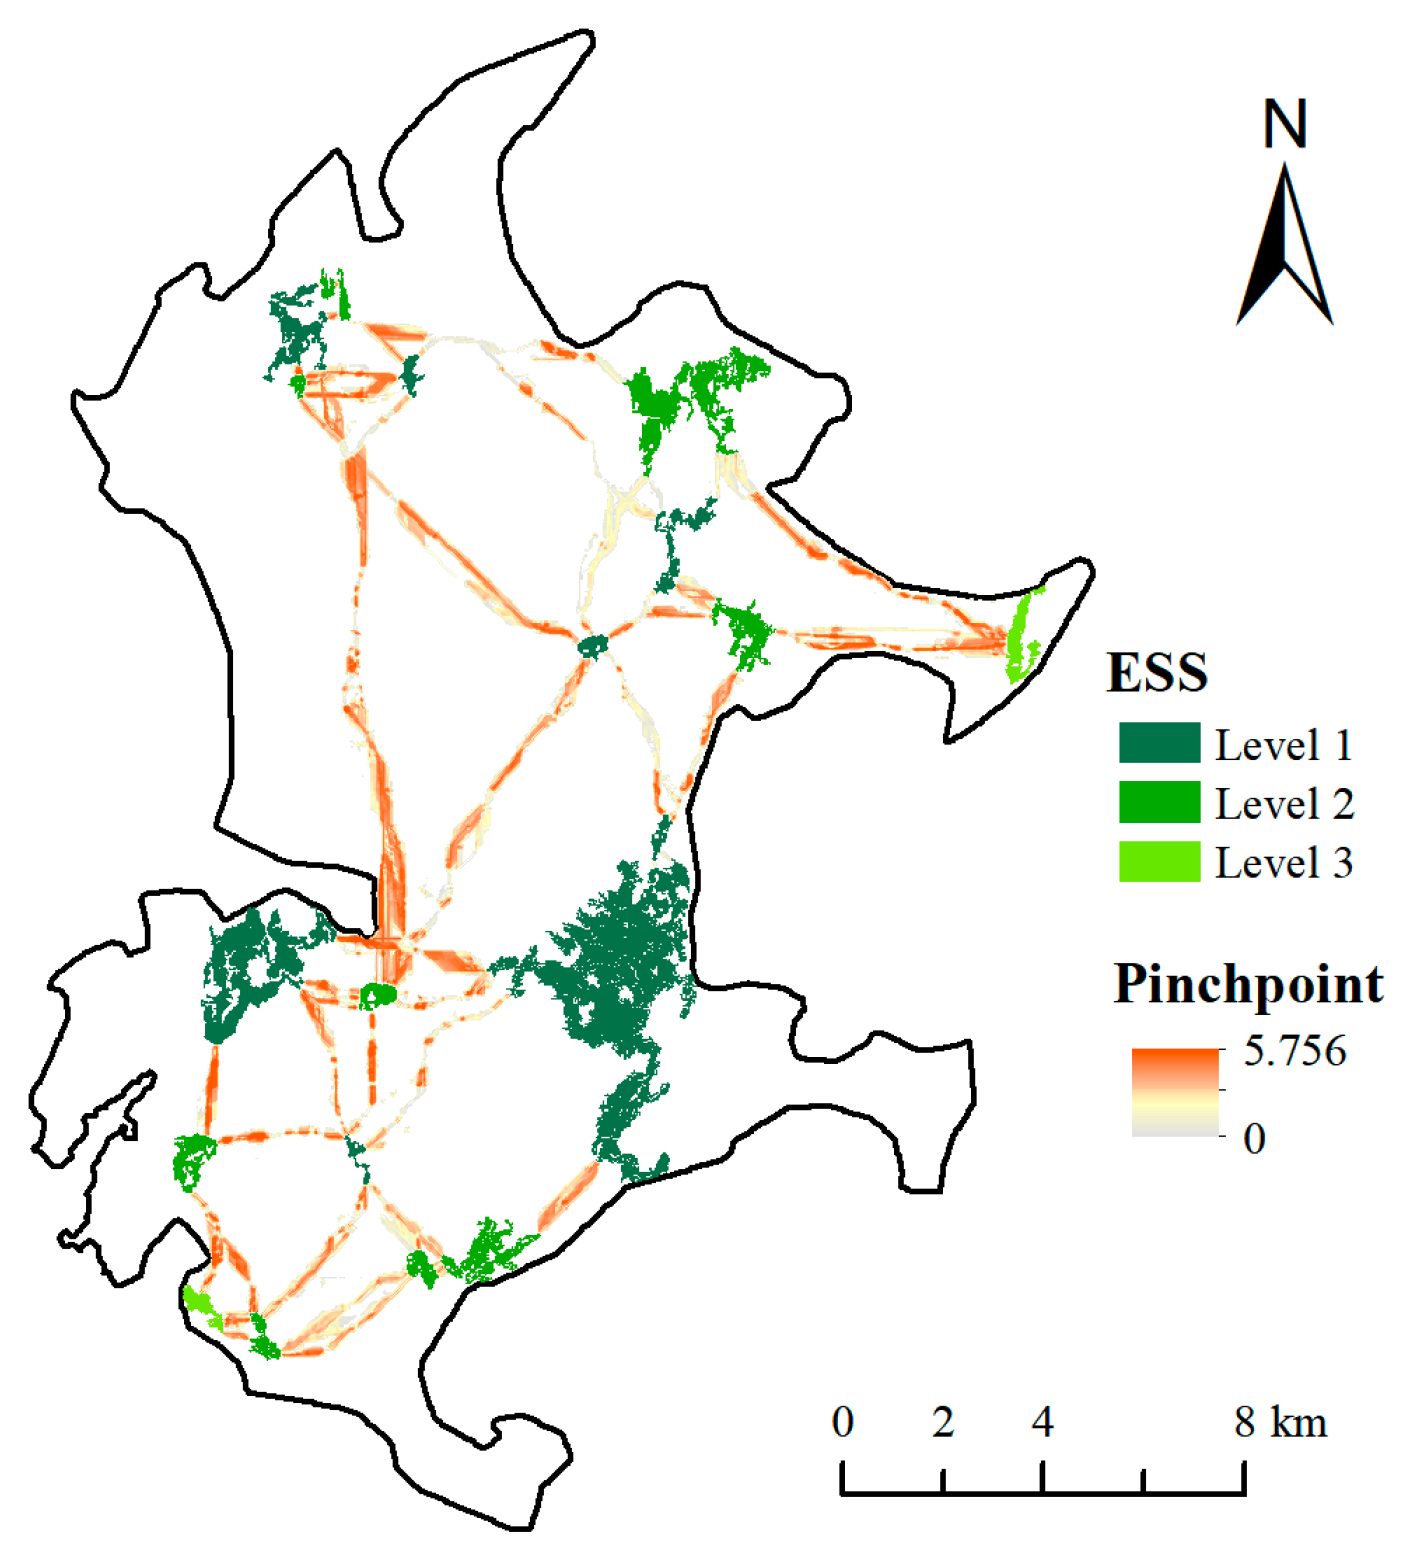
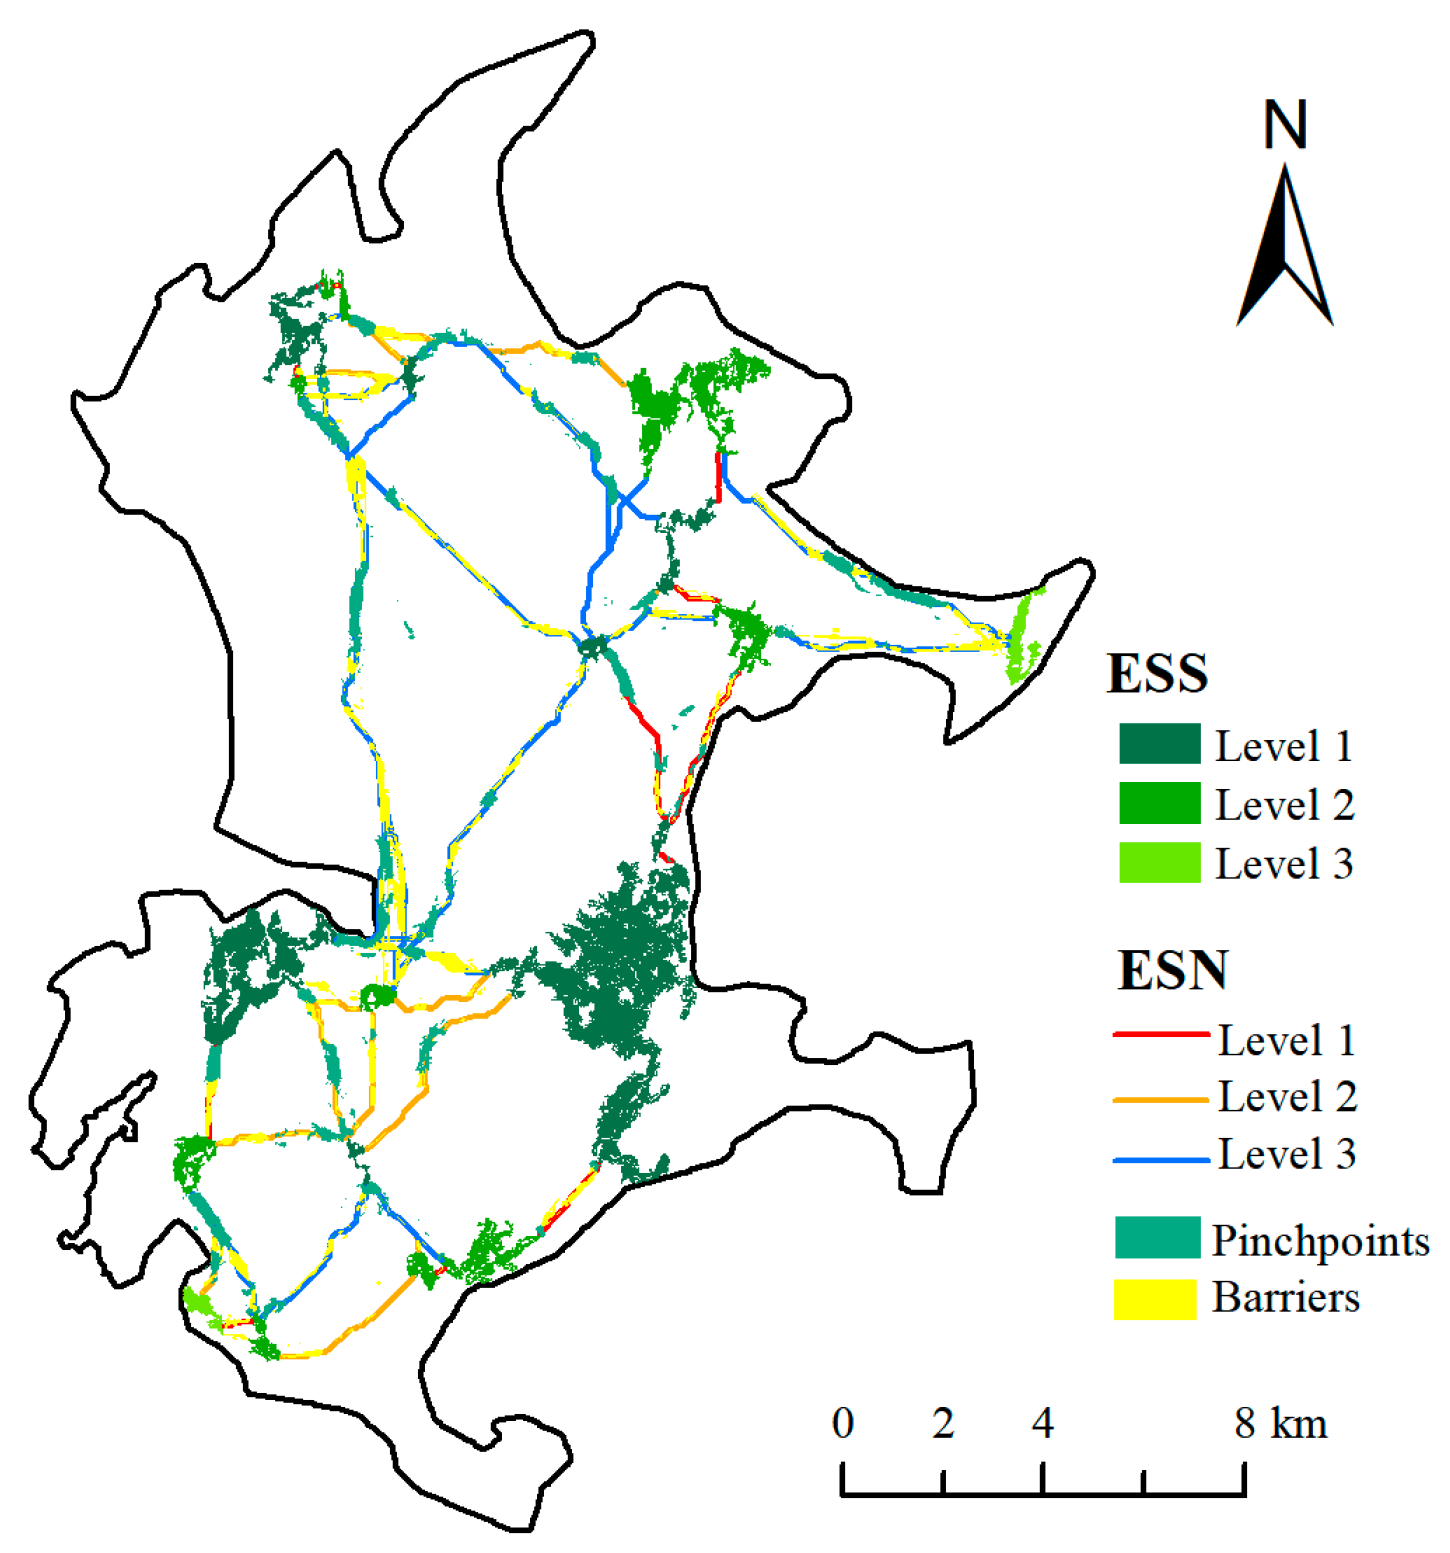
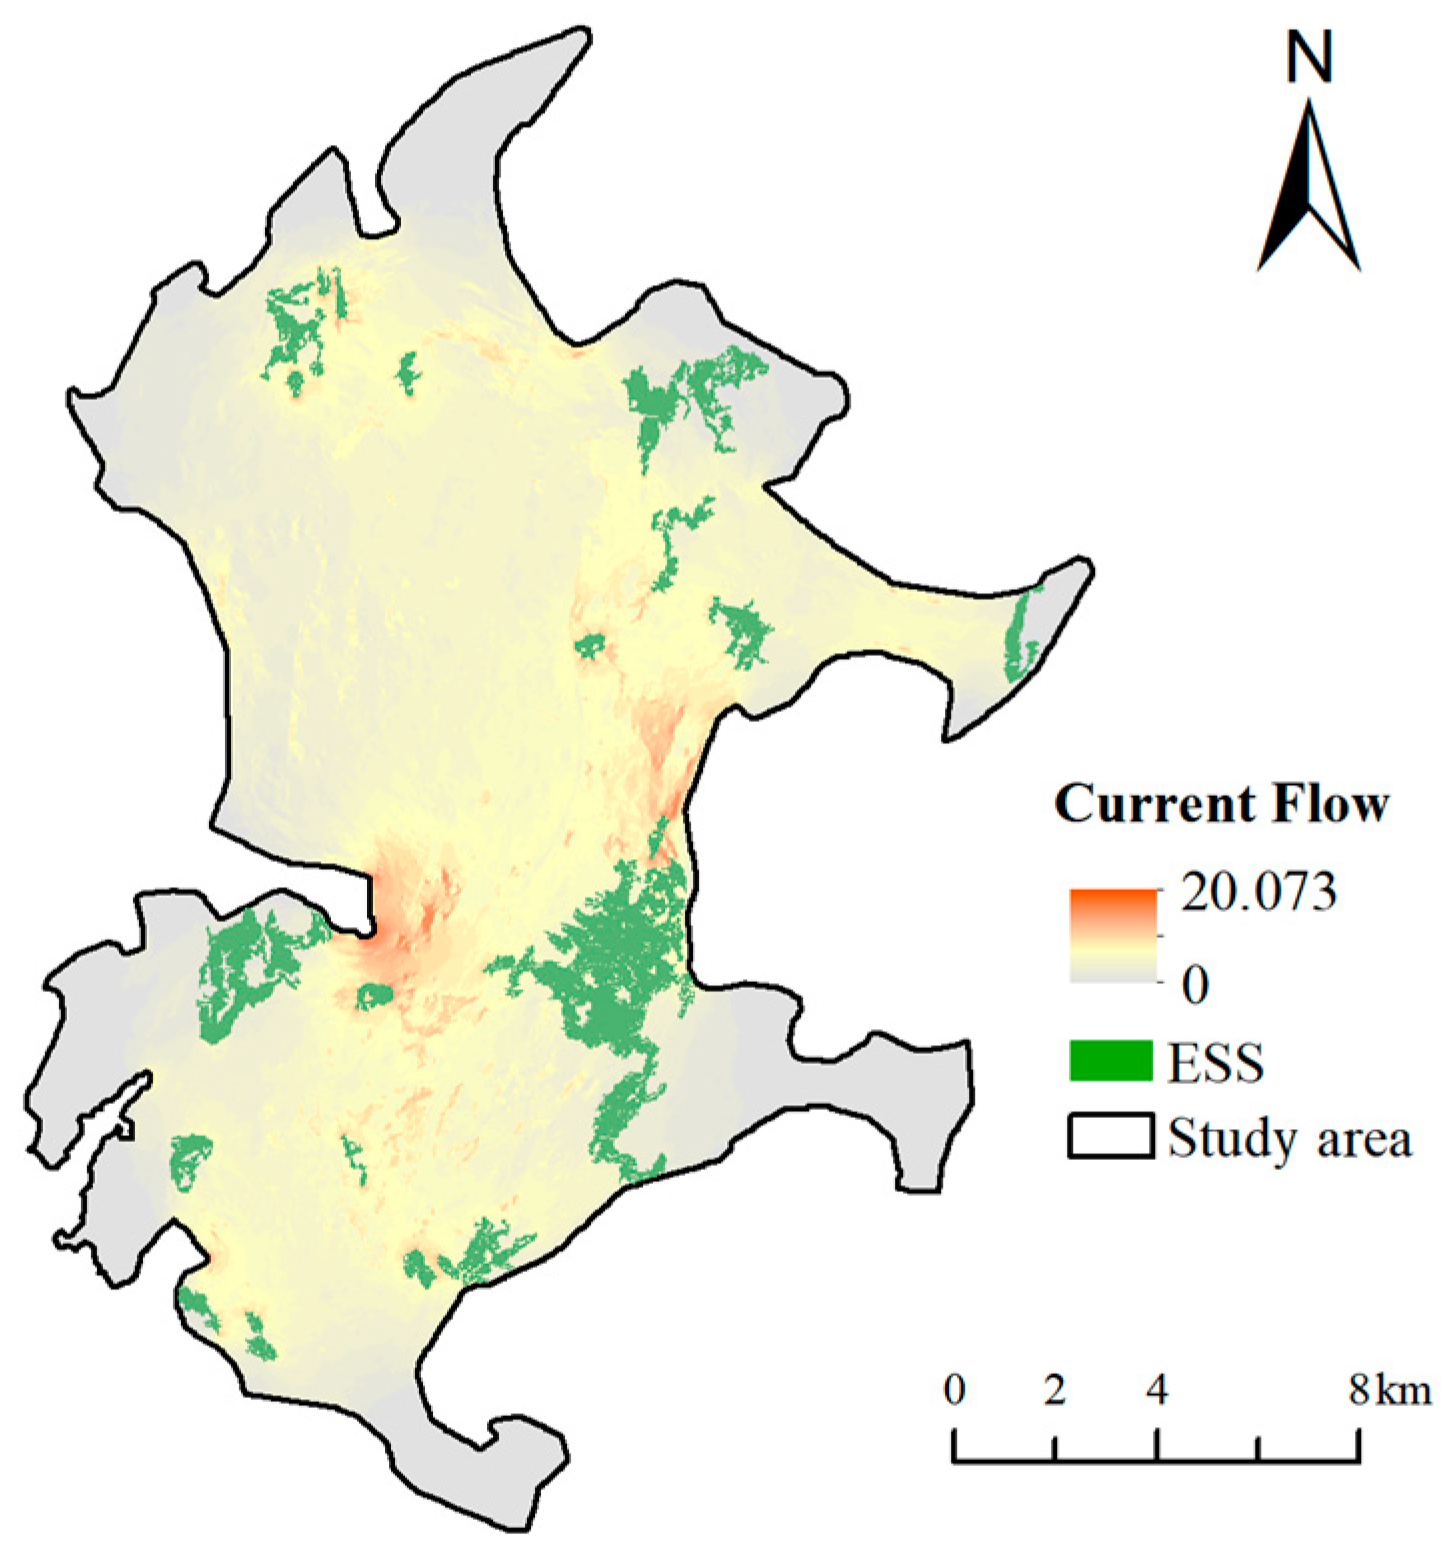
Using the Circuitscape program, we identified “pinch points” and barriers within the study area by employing the Pinchpoint Mapper and Barrier Mapper plug-ins (Figure 8 and Figure 9). A “pinchpoint” refers to an area with high current flow, which plays a critical role in maintaining overall network connectivity. Conversely, barriers indicate regions where resistance is high, suggesting the presence of obstacles that require restoration or mitigation.
We classified ecological “pinch points” and barriers into three levels using the natural breaks classification method, with the highest-level areas designated as ecological restoration priorities (Figure 10). Results reveal that Level-1 pinch points and barriers are predominantly distributed within first- and second-level corridors of the urban core. Specifically, the total area of pinch points reached 5.75 km2, while barriers covered 7.17 km2. Table 6 summarizes the land use composition of these areas: cultivated land and tree cover exhibit significant positive effects on ecological network connectivity, whereas built-up land and large continuous cultivated land patches act as major barriers. Furthermore, by overlaying the Ecological Service Network (ESN) with the urban road system, we identified 84 key barrier nodes (Figure 9), which are primarily concentrated in the central and southwestern parts of the study area. This spatial distribution indicates that ecological corridors in these regions are more vulnerable to landscape fragmentation induced by major transportation networks.

4.6. Optimization of Ecosystem Service Networks

Based on the ESN classification, Figure 11 illustrates the variation in land cover type proportions and the mean CESI values across different corridor widths. In the proportion of land cover types, with the increment of corridor width, the proportion of tree cover in the Level-1 corridor gradually decreases, on the contrary, the proportion of construction land shows a gradual upward trend, and the proportion of arable land and the proportion of water bodies fluctuates less. The proportion of tree cover and construction land in the Level-2 and Level-3 corridors showed the same trend, but the proportion of construction land was lower and the proportion of water bodies increased. Therefore, more attention should be paid to the conservation and protection of water bodies in the construction of Level-2 and Level-3 corridors, while the area of water bodies should be increased in Level-1 corridors. From the changes in the mean value of CESI of corridors at all levels, we obviously found that the CESI decreased most drastically when the width of the Level-1 and 3 corridors shifted from 30 m to 60 m, while the CESI in the width of the level-2 corridors plummeted when the width of the Level-2 corridors shifted from 90 m to 120 m. Previous studies have shown that a higher percentage of construction land tends to raise the construction cost of corridors, and that corridor widths that meet the basic habitat needs of small mammals, herbaceous plants, and most birds in coastal areas are more appropriate in the range of 30 m to 90 m [31,33,54]. In summary, considering the corridor construction needs and land use characteristics, the optimal width of ESNs at all levels on Pingtan Island should be set at 30 m. However, the downward trend of the CESI suggests that the width range of Level-1 and Level-3 corridors on Pingtan Island should be limited to 30–60 m, while the width of Level-2 corridors should be appropriately relaxed to 90 m or less.
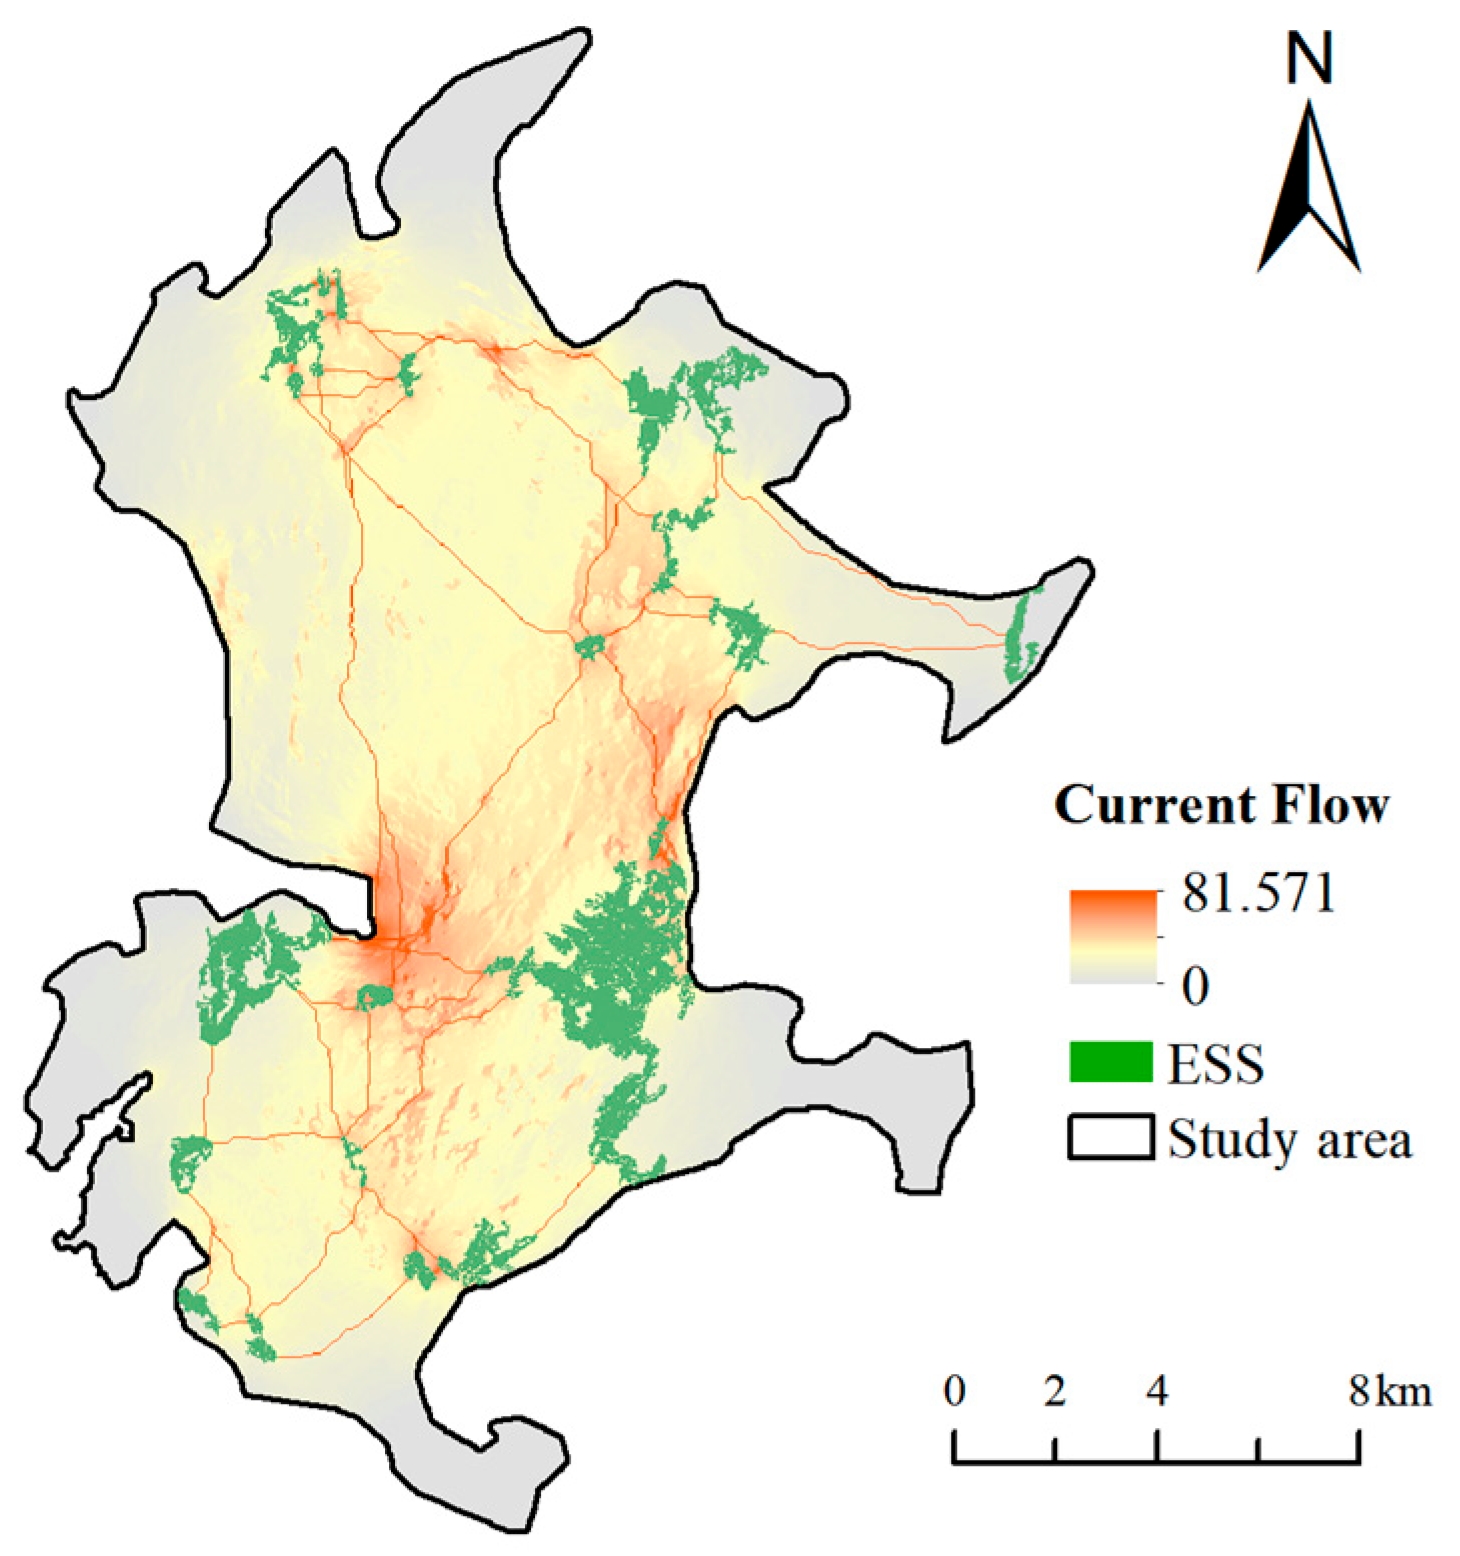
After specifying the width threshold of the ESN, this study used circuit theory to simulate the landscape connectivity of corridors and analyzed the differences before and after optimization (Figure 12 and Figure 13). Following optimization, the mean regional current density increased from 1.653 to 8.224, indicating a significant improvement in overall connectivity. Spatial analysis showed that connectivity was most markedly enhanced in the mid-northern sections of primary corridors, where fragmentation was severe and connectivity was low prior to optimization (Figure 13). In contrast, peripheral areas and secondary corridors exhibited smaller increases, as these regions already had moderate connectivity before optimization. These results suggest that corridor optimization can substantially enhance connectivity in key areas while providing moderate improvements in regions with relatively high connectivity, offering a basis for prioritizing management and conservation efforts.

5. Discussion

5.1. Rationalization of the Integrated Ecosystem Service Assessment Index

Conducting comprehensive ecosystem service assessment is an important foundation for constructing a sound ESN [18], such as the Shanghai Metropolitan Area [61], Poyang Lake City Cluster [62], and Shenmu City in Shaanxi Province [63], and other studies incorporate more indicators of ecological functions as well as comprehensive assessment methods across different regional scales, and also pay attention to the supply-demand relationship [63], trade-offs, [17] and synergies between ecological functions, but the protection of ecological resources and the unavoidable development of the cultural tourism industry have led to complex conflicts between ecology and human activities in island-type cities, with serious landscape fragmentation. Therefore, relying solely on the ecological service assessment in the InVEST model ignores the importance of CES. In this study, we conducted CES assessment in the study area using POI points combined with MaxEnt model, which can effectively complement the comprehensiveness of ecosystem service assessment. Meanwhile, our institute integrated eight categories of ecological and cultural services and constructed a CESI that can be used to quantify not only the ecological service functions of biophysical factors and ecological processes, but also the cultural service functions (CES) of non-biophysical factors, which promotes the balance and enhancement of the integrated service benefits of the island’s ecological function space.
In terms of specific CES quantitative assessment, the study selected 919 POIs on Pingtan Island as the research object and quantitatively analyzed four ecosystem cultural service functions on Pingtan Island based on MaxEnt model, which realized the combination of geographic information system (GIS) spatial measurement analysis method and ecosystem cultural service value assessment, and revealed the current level of CES on Pingtan Island to a certain extent. We found that related scholars applied PPGIS to the study of CES value assessment in small-scale areas such as urban comprehensive parks [64], wetland parks [65], and villages [66], which consumed more human resources and was limited by the subjectivity of the questionnaire and the breadth of public participation. The problem of too large research scope can be overcome in subsequent studies through POI combined with MaxEnt model and SolVES model. In addition, our study also found that MaxEnt modeled the distribution probability of POIs and could not take into account the weight differences of individuals. For example, the Pingtan Haidao National Forest Park, which is an important resource in the region with an area of 12.957 km2, is represented as only one POI, which is obviously unreasonable. Future research can combine the SolVES model, the number of network annotations, or coding screening to further determine the weights of POI points.

5.2. Methods for Building Ecosystem Service Networks

Constructing ESNs in island cities is one of the most important ways to enhance the function of urban ecosystem services and promote sustainable urban development [18]. However, the overexploitation of marine resources, coastal erosion and urbanization have led to complex landscape types and unavoidable human activities, resulting in more fragile and fragmented ecological landscapes [67]. Therefore, the identification of ecological sources through only the four ecological indicators of the InVEST model is not comprehensive enough [68]. We included important CES indicators, combined with principal component analysis (PCA) to construct a CESI, and conducted a comprehensive ecosystem services assessment of the study area, which can be more comprehensive for source identification. The observed clustering of cultural ecosystem services along the eastern coast is likely driven by accessibility, concentration of tourism facilities, and the presence of historical and cultural heritage sites, whereas regulatory services such as carbon storage and soil retention predominantly occur in mountainous regions due to dense vegetation cover and minimal human disturbance.
In the study of ecosystem service network construction, the selection and construction of resistance factors is an important step. However, related studies only considered factors such as MSPA landscape type, NDVI, distance from highway, etc., [29,48,51]. in the selection of resistance factors, and did not fully reflect the cultural service characteristics of the city. Some studies have shown that there is a negative correlation between cultural and ecological corridors in the city, and human activity paths conflict with biological migration routes, which not only complicates cultural corridors, but also hinders the flow of energy and materials between species, which may be a result of confusing the definitions of the city’s cultural service function and ecosystem service function, leading to a bias in the assessment and selection of POIs, such as botanical gardens, zoos, temples, parks, etc., have both good ecological and cultural service functions. Therefore, in our study, non-CES POIs such as schools, research institutes, restaurants, etc., were screened out, and the assessment data of CESI was improved and included in the construction of resistance surfaces. On the other hand, island cities face land–sea bidirectional pressures such as coastal zone erosion, storm surges, fishery fishing, and overdevelopment of cultural and tourism resources [36,69]. Therefore, the distance from the coastline is incorporated into the construction of the resistance surface, which makes the comprehensive resistance surface more consistent with the connotation of the island-type city.

5.3. Optimization Methods for Ecosystem Service Networks

Based on the framework of terrestrial landscape ecology, this study focuses on the optimisation of the ESN of island cities. However, ecosystem services from adjacent marine areas and affiliated islands should also be considered. Extending the research scope to urban sea areas highlights the need to explore how land-based ecological corridors can connect with marine ESN functions. In addition, island ecosystems are subject to unique natural stressors such as salt fog erosion and typhoon disturbance, which can significantly affect ecosystem service supply and stability [68,69]. Although previous studies have examined the possibility of land–sea network connectivity, the ocean’s physical mobility poses challenges for accurately assessing marine ecosystem services and for applying ESN in planning and design. Future studies should conduct refined vulnerability and functional importance assessments of coastlines and surrounding seas, identify key nodes at the land–sea interface, and propose targeted optimization measures. Our study focuses on the terrestrial portion of Pingtan Island, and future research could further explore coupling and articulation of ESNs between the island’s land and surrounding marine areas [70]. Moreover, research emphasizing the enhancement of urban-rural connectivity to optimize ecological security patterns provides valuable reference for island ESN construction and optimization, particularly in terms of method integration and spatial network optimization [69,70]. Integrating these approaches can help improve the stability and resilience of ecosystem service networks, supporting sustainable development in island cities.
At present, the construction of ESN has gradually matured, and the determination of corridor width can provide a clear range of guidance for ESN optimization, but the corridor width standard is not yet clear. Especially in island-type urban areas with both ecological and economic values, the ecological and cultural functions and construction costs of ESNs need to be considered comprehensively. Related studies have calculated the corridor width determined by species dispersal distance through circuit theory [71]. There are also scholars who determine the corridor width by investigating species habitats with the goal of species conservation [72]. Some scholars also used buffer and gradient analysis to compare the MSPA core area share, RSEI share, and land use share within different width thresholds to determine the optimal corridor width [33]. However, integrating the functions of each ecosystem service is the focus of sustainable development of ecological and cultural resources on Pingtan Island. Therefore, when delineating the corridor width, we should consider the internal land use composition of the city and the assessment of integrated ecosystem services, and be able to effectively differentiate the corridor width in terms of land cover type and ecosystem service functions, rather than a single ecological indicator, landscape structure, and species characteristics [54,56,57]. In this paper, the width of the suitable Pingtan Island corridor is delineated as 30 m, and combined with the clear adjustable range of the land cover percentage within the width, depending on the changes in the mean CESI and the land cover percentage in different buffer zones. In future studies, the relationship between land value, property value, and building density and ecosystem service value can be further explored based on the land cover within the width, the construction cost of different corridor widths can be clarified, and optimization strategies can be formulated based on the differences in corridor class, location, and length.

5.4. Recommendations and Measures

Based on the ESN of Pingtan Island constructed by this research, relevant optimization suggestions are made. The specific suggestions are as follows:
(1)
The Level-1 corridor and the Level-1 source area are the key areas for ecological function restoration and enhancement. Due to the overlap with the built-up area of the city, although the comprehensive ecosystem service function is good, it is very easy to be interfered by human activities, so the focus should be on the enhancement of ecological function.
(2)
Level-2 and Level-3 source areas should focus on improving CES, and develop richer eco-tourism venues, such as mangrove wetlands, science education bases, fishing villages and ancient towns, with the help of the characteristic coastal zone landscape resources, so as to improve CES. The Level-2 and Level-3 corridors, as barriers to protect the ecosystem service function of the source area, also need to form a network connection. In addition, the corridor connection in the northwestern part of the study area is relatively decentralized, and should be supplemented to strengthen the internal and external connections of the source area.
(3)
The “pinchpoints” are the most concentrated areas of energy flow or species migration between source areas, and natural restoration should be emphasized. The land use type in the “pinchpoints” at the study area level is mainly arable land, and the protection and management should be strengthened, and the occupation of construction land should be strictly prohibited. Ecological measures such as vegetation cultivation, mixed agriculture and forestry, and returning farmland to forests should be adopted, and at the same time, the cultivated land should be transformed into ecological, cultural and tourism-type cultivated land, such as picking gardens, nature education bases, and sightseeing farms, so as to activate the cultural and ecological system service function of cultivated land.
(4)
Barriers are areas that impede the spread of species in the region and need to be repaired and improved to enhance the overall ecological connectivity, with the key being artificial restoration. The results of the study show that large areas of cultivated land also exist in the barriers on Pingtan Island. Ecological engineering techniques, such as vegetation buffer zone construction and soil improvement, should be introduced to activate the function of “stepping stones” in species migration. Secondly, vegetation planting should be strengthened, and native plants with good wind and flood resistance should be selected, such as pioneer tree species like Tongva, Seaside Hibiscus, and Bitterroot, in order to improve the stability of the ecosystem. Subsequently, continuous monitoring and assessment of the ecological restoration effect is required so that the strategy can be adjusted in a timely manner. In addition, key nodes of urban roads should be equipped with ecological culverts, animal passages or green flyovers as far as possible to safeguard species migration and hydrological connectivity and reduce ecological fragmentation.
(5)
Determining appropriate corridor widths is essential for defining the spatial scope of corridor optimization. Based on the proportion and spatial distribution of land cover types within different corridor widths, targeted recommendations are proposed for each corridor level. As the core pathway for ecosystem service connectivity, Level-1 corridors are highly susceptible to the expansion of construction land and contain a limited proportion of water bodies; therefore, their width should be restricted to within 60 m. To maintain ecological integrity, disturbance sources must be strictly controlled, and the development of non-ecological facilities should be avoided. Marginal and unused lands should be prioritized for ecological restoration, including green replanting and the rehabilitation of urban water systems through dredging and expansion. Low-impact cultural and recreational features—such as forest trails, ecological boardwalks, and observation platforms—can be incorporated to enhance CES and public engagement, provided they do not compromise ecological connectivity. Level-2 corridors, functioning as supporting ecological links and mediators between natural and human-modified systems, are affected by both agricultural practices and construction land encroachment. Their width should be maintained within 90 m, with emphasis on promoting ecologically compatible land uses such as eco-agriculture, afforestation, and green leisure farming, in order to reduce the negative impact of large-scale monoculture or built-up land. Level-3 corridors, which serve as auxiliary ecosystem service corridors, are characterized by extensive arable land, limited water bodies, and high environmental heterogeneity. Their width should also be controlled within 60 m, with a focus on ensuring ecological continuity and promoting cost-effective enhancement measures. This includes utilizing existing green spaces and water systems, and encouraging the coordinated integration of village greenways, irrigation channels, roadside greenbelts, and ecological corridors to strengthen landscape-level ecological connectivity.

5.5. Limitations and Prospects

Although this study integrated InVEST and MaxEnt models to assess ecological and cultural services and optimize the ESN of Pingtan Island, several limitations remain. POIs did not fully reflect differences in cultural resource importance, resistance surfaces and corridor widths lacked economic considerations, and the analysis focused only on terrestrial areas without fully addressing marine ecosystems or land–sea interactions. Future research should refine POI weighting, incorporate socio-economic factors into ESN construction, and extend the scope to coastal and marine areas to enhance both scientific and practical support for sustainable island city development.

6. Conclusions

Considering the close connection between ESN construction and multiple ecosystem service functions in island-type urban areas, this study aimed to propose a CESI to refine the selection of sources, construction of resistance surfaces, and selection of suitable widths for ESNs, and simulated and verified its effect of improving the overall connectivity of the region. It also provides new ideas and methods for the construction and optimization of ESN in island-type cities, using Pingtan Island, China, as an example. The main conclusions are as follows:
I. The eight ecosystem service functions of Pingtan Island were quantified by InVEST and MaxEnt models, respectively, and were characterized by significant heterogeneity and aggregation in the overall space. II. The mean value of CESI on Pingtan Island was 0.2966, and the distribution of high CESI areas was concentrated in the built-up areas along the eastern coast and the mountains in the northwestern part of Pingtan Island, and the comprehensive ecosystem service functions were more general. III. A total of 20 ecological source areas were extracted through CESI-landscape connectivity and other methods, accounting for 7.20% of the total area of Pingtan Island, with a more even distribution overall and less in the northwest. IV. A total of 45 ecological corridors were identified using spatial analysis tools, with an average length of 6.60 km. The results indicate that, despite the close proximity of ecological patches, the connectivity of the corridor network remains weak, with significant spatial discontinuities. Additionally, 5.75 km2 of ecological pinch points and 7.17 km2 of ecological barriers were extracted, with the latter primarily distributed in agricultural areas and the former predominantly located within forested regions. V. Through the construction of buffer zones and gradient analysis to select the appropriate width of the corridor, the appropriate width of the corridor are 30 m, the width of the corridor of level-1 and level-3 should be controlled within 60 m, and the width of the corridor of level-2 is suitable for controlling within 90 m. VI. Corridor optimization increased the mean current density from 1.653 to 8.224, significantly improving ecosystem service connectivity. These results also provide practical guidance for the delineation of ecological red lines, the optimization of corridor layouts, and the evaluation of spatial planning in coastal and island cities, supporting the balance between urban development and ecological protection.

Author Contributions

Conceptualization, J.L.; methodology, J.L. and B.J.; software, J.L. and B.J.; validation, J.L. and B.J.; formal analysis, J.L. and B.J.; investigation, J.L. and B.J.; resources, J.L. and B.J.; data curation, G.D. and B.J.; writing—original draft preparation, J.L.; writing—review and editing, J.D. and G.D.; visualization, J.L. and B.J.; supervision, G.D. and J.D.; project administration, G.D. and J.D.; funding acquisition, G.D. All authors have read and agreed to the published version of the manuscript.

Funding

This research was supported by the Innovation Fund of Fujian Agriculture and Forestry University, grant number KFB23175A.

Institutional Review Board Statement

Not applicable.

Informed Consent Statement

Not applicable.

Data Availability Statement

All datasets generated during and/or analysed during the current study are available from the corresponding author on reasonable request.

Conflicts of Interest

The authors declare no conflicts of interest.

Appendix A

Figure A1. Validation curves for the distribution results of each cultural function.
Sustainability 17 08470 g0a1
Figure A2. Validation curves for cultural ecosystem service distributions.
Sustainability 17 08470 g0a2

References

  1. Gillespie, R.G.; Roderick, G.K. Arthropods on islands: Colonization, speciation, and conservation. Annu. Rev. Entomol. 2002, 47, 595–632. [Google Scholar] [CrossRef]
  2. Jordan, P.; Fröhle, P. Bridging the gap between coastal engineering and nature conservation? A review of coastal ecosystems as nature-based solutions for coastal protection. J. Coast. Conserv. 2022, 26, 4. [Google Scholar] [CrossRef]
  3. Ehrlich, P.; Ehrlich, A. Extinction: The Causes and Consequences of the Disappearance of Species; Random House: New York, NY, USA, 1981. [Google Scholar]
  4. Millennium Ecosystem Assessment. Millennium Ecosystem Assessment; Millennium Ecosystem Assessment: Washington, DC, USA, 2001; Volume 2. [Google Scholar]
  5. Fedele, G.; Locatelli, B.; Djoudi, H. Mechanisms mediating the contribution of ecosystem services to human well-being and resilience. Ecosyst. Serv. 2017, 28, 43–54. [Google Scholar] [CrossRef]
  6. Martínez-López, J.; Bagstad, K.J.; Balbi, S.; Magrach, A.; Voigt, B.; Athanasiadis, I.; Pascual, M.; Willcock, S.; Villa, F. Towards globally customizable ecosystem service models. Sci. Total Environ. 2019, 650, 2325–2336. [Google Scholar] [CrossRef] [PubMed]
  7. Boumans, R.; Roman, J.; Altman, I.; Kaufman, L. The Multiscale Integrated Model of Ecosystem Services (MIMES): Simulating the interactions of coupled human and natural systems. Ecosyst. Serv. 2015, 12, 30–41. [Google Scholar] [CrossRef]
  8. Fish, R.; Church, A.; Winter, M. Conceptualising cultural ecosystem services: A novel framework for research and critical engagement. Ecosyst. Serv. 2016, 21, 208–217. [Google Scholar] [CrossRef]
  9. Sherrouse, B.C.; Semmens, D.J.; Ancona, Z.H. Social Values for Ecosystem Services (SolVES): Open-source spatial modeling of cultural services. Environ. Model. Softw. 2022, 148, 105259. [Google Scholar] [CrossRef]
  10. Ball, J. Towards a methodology for mapping ‘regions for sustainability’using PPGIS. Prog. Plan. 2002, 58, 81–140. [Google Scholar] [CrossRef]
  11. Olander, L.P.; Johnston, R.J.; Tallis, H.; Kagan, J.; Maguire, L.A.; Polasky, S.; Urban, D.; Boyd, J.; Wainger, L.; Palmer, M. Benefit relevant indicators: Ecosystem services measures that link ecological and social outcomes. Ecol. Indic. 2018, 85, 1262–1272. [Google Scholar] [CrossRef]
  12. Liang, S.; Yang, F.; Zhang, J.; Xiong, S.; Xu, Z. Assessment and Management Zoning of Ecosystem Service Trade-Off/Synergy Based on the Social–Ecological Balance: A Case of the Chang-Zhu-Tan Metropolitan Area. Land 2024, 13, 127. [Google Scholar] [CrossRef]
  13. Phillips, S.J.; Anderson, R.P.; Schapire, R.E. Maximum entropy modeling of species geographic distributions. Ecol. Model. 2006, 190, 231–259. [Google Scholar] [CrossRef]
  14. Bradie, J.; Leung, B. A quantitative synthesis of the importance of variables used in MaxEnt species distribution models. J. Biogeogr. 2017, 44, 1344–1361. [Google Scholar] [CrossRef]
  15. Shi, Q.; Chen, H.; Liang, X.; Liu, D.; Geng, T.; Zhang, H. Combination of participatory mapping and Maxent model to visualize the cultural ecosystem services at county scale. Ecosyst. Serv. 2025, 72, 101710. [Google Scholar] [CrossRef]
  16. Wang, J.; Wu, W.; Yang, M.; Gao, Y.; Shao, J.; Yang, W.; Ma, G.; Yu, F.; Yao, N.; Jiang, H. Exploring the complex trade-offs and synergies of global ecosystem services. Environ. Sci. Ecotechnology 2024, 21, 100391. [Google Scholar] [CrossRef]
  17. Wang, Y.; Yu, Q.; Avirmed, B.; Zhao, J.; Sun, W.; Liu, Y.; Cui, H.; Khishigjargal, M.; Oyuntuya, S.; Dambadarjaa, N. The response of ecosystem services to ecological spatial network patterns in China’s arid and semi-arid regions. Ecol. Indic. 2025, 172, 113300. [Google Scholar] [CrossRef]
  18. Wu, X.; Wang, S.; Fu, B.; Liu, Y.; Zhu, Y. Land use optimization based on ecosystem service assessment: A case study in the Yanhe watershed. Land Use Policy 2018, 72, 303–312. [Google Scholar] [CrossRef]
  19. Jiang, H.; Peng, J.; Liu, M.; Dong, J.; Ma, C. Integrating patch stability and network connectivity to optimize ecological security pattern. Landsc. Ecol. 2024, 39, 54. [Google Scholar] [CrossRef]
  20. Xu, A.; Shi, J.; Zhao, L.; Ji, T.; Meng, X. Urban ventilation network identification to mitigate heat island effect. Sustain. Cities Soc. 2025, 125, 106364. [Google Scholar] [CrossRef]
  21. O’Neill, R.V.; Krummel, J.R.; Gardner, R.E.A.; Sugihara, G.; Jackson, B.; DeAngelis, D.L.; Milne, B.T.; Turner, M.G.; Zygmunt, B.; Christensen, S.W. Indices of landscape pattern. Landsc. Ecol. 1988, 1, 153–162. [Google Scholar] [CrossRef]
  22. Pani, A.K.; Mohanta, H.K. Online monitoring and control of particle size in the grinding process using least square support vector regression and resilient back propagation neural network. ISA Trans. 2015, 56, 206–221. [Google Scholar] [CrossRef]
  23. Lin, J.; Huang, C.; Wen, Y.; Liu, X. An assessment framework for improving protected areas based on morphological spatial pattern analysis and graph-based indicators. Ecol. Indic. 2021, 130, 108138. [Google Scholar] [CrossRef]
  24. Hu, X.; Xu, H. A new remote sensing index for assessing the spatial heterogeneity in urban ecological quality: A case from Fuzhou City, China. Ecol. Indic. 2018, 89, 11–21. [Google Scholar] [CrossRef]
  25. Geng, J.; Yu, K.; Sun, M.; Xie, Z.; Huang, R.; Wang, Y.; Zhao, Q.; Liu, J. Construction and optimisation of ecological networks in high-density central urban areas: The case of Fuzhou City, China. Remote Sens. 2023, 15, 5666. [Google Scholar] [CrossRef]
  26. Zeller, K.A.; McGarigal, K.; Whiteley, A.R. Estimating landscape resistance to movement: A review. Landsc. Ecol. 2012, 27, 777–797. [Google Scholar] [CrossRef]
  27. Peng, J.; Zhao, H.; Liu, Y. Urban ecological corridors construction: A review. Acta Ecol. Sin. 2017, 37, 23–30. [Google Scholar] [CrossRef]
  28. Tong, H.; Shi, P. Using ecosystem service supply and ecosystem sensitivity to identify landscape ecology security patterns in the Lanzhou-Xining urban agglomeration, China. J. Mt. Sci. 2020, 17, 2758–2773. [Google Scholar] [CrossRef]
  29. Zhang, L.; Peng, J.; Liu, Y.; Wu, J. Coupling ecosystem services supply and human ecological demand to identify landscape ecological security pattern: A case study in Beijing–Tianjin–Hebei region, China. Urban Ecosyst. 2017, 20, 701–714. [Google Scholar] [CrossRef]
  30. Ghasemi, A.; Miandoabchi, E.; Soroushnia, S. The attractiveness of seaport-based transport corridors: An integrated approach based on scenario planning and gravity models. Marit. Econ. Logist. 2021, 23, 522–547. [Google Scholar] [CrossRef]
  31. Jin, B.; Geng, J.; Ding, Z.; Guo, L.; Rui, Q.; Wu, J.; Peng, S.; Jin, R.; Fu, X.; Pan, H. Construction and optimization of ecological corridors in coastal cities based on the perspective of “structure-function”. Sci. Rep. 2024, 14, 27945. [Google Scholar] [CrossRef]
  32. Wei, H.; Fan, W.; Wang, X.; Lu, N.; Dong, X.; Zhao, Y.; Ya, X.; Zhao, Y. Integrating supply and social demand in ecosystem services assessment: A review. Ecosyst. Serv. 2017, 25, 15–27. [Google Scholar] [CrossRef]
  33. Shifaw, E.; Sha, J.; Li, X.; Bao, Z.; Zhou, Z. An insight into land-cover changes and their impacts on ecosystem services before and after the implementation of a comprehensive experimental zone plan in Pingtan island, China. Land Use Policy 2019, 82, 631–642. [Google Scholar] [CrossRef]
  34. Yu, F.; Cai, F.; Ren, J.; Liu, J. Island beach management strategy in China with different urbanization level–Take examples of Xiamen Island and Pingtan Island. Ocean Coast. Manag. 2016, 130, 328–339. [Google Scholar] [CrossRef]
  35. Lin, T.; Xue, X.; Shi, L.; Gao, L. Urban spatial expansion and its impacts on island ecosystem services and landscape pattern: A case study of the island city of Xiamen, Southeast China. Ocean Coast. Manag. 2013, 81, 90–96. [Google Scholar] [CrossRef]
  36. Zanaga, D.; Van De Kerchove, R.; Daems, D.; De Keersmaecker, W.; Brockmann, C.; Kirches, G.; Wevers, J.; Cartus, O.; Santoro, M.; Fritz, S. ESA WorldCover 10 m 2021 v200. 2022. Available online: https://zenodo.org/records/7254221 (accessed on 27 July 2025).
  37. Gupta, S.; Borrelli, P.; Panagos, P.; Alewell, C. An advanced global soil erodibility (K) assessment including the effects of saturated hydraulic conductivity. Sci. Total Environ. 2024, 908, 168249. [Google Scholar] [CrossRef]
  38. Wang, B.; Cheng, W. Effects of land use/cover on regional habitat quality under different geomorphic types based on InVEST model. Remote Sens. 2022, 14, 1279. [Google Scholar] [CrossRef]
  39. Gashaw, T.; Bantider, A.; Zeleke, G.; Alamirew, T.; Jemberu, W.; Worqlul, A.W.; Dile, Y.T.; Bewket, W.; Meshesha, D.T.; Adem, A.A. Evaluating InVEST model for estimating soil loss and sediment export in data scarce regions of the Abbay (Upper Blue Nile) Basin: Implications for land managers. Environ. Chall. 2021, 5, 100381. [Google Scholar] [CrossRef]
  40. Du, C.; Sun, F.; Yu, J.; Liu, X.; Chen, Y. New interpretation of the role of water balance in an extended Budyko hypothesis in arid regions. Hydrol. Earth Syst. Sci. 2016, 20, 393–409. [Google Scholar] [CrossRef]
  41. Stockmann, U.; Adams, M.A.; Crawford, J.W.; Field, D.J.; Henakaarchchi, N.; Jenkins, M.; Minasny, B.; McBratney, A.B.; De Courcelles, V.D.R.; Singh, K. The knowns, known unknowns and unknowns of sequestration of soil organic carbon. Agric. Ecosyst. Environ. 2013, 164, 80–99. [Google Scholar] [CrossRef]
  42. Chen, W.; Pourghasemi, H.R.; Kornejady, A.; Zhang, N. Landslide spatial modeling: Introducing new ensembles of ANN, MaxEnt, and SVM machine learning techniques. Geoderma 2017, 305, 314–327. [Google Scholar] [CrossRef]
  43. Murata, C.; Mantel, S.; de Wet, C.; Palmer, A.R. Lay knowledge of ecosystem services in rural Eastern Cape Province, South Africa: Implications for intervention program planning. Water Econ. Policy 2019, 5, 1940001. [Google Scholar] [CrossRef]
  44. Wang, P.; Li, N.; He, Y.; He, Y. Evaluation of Cultural Ecosystem Service Functions in National Parks from the Perspective of Benefits of Community Residents. Land 2022, 11, 1566. [Google Scholar] [CrossRef]
  45. Mazziotta, M.; Pareto, A. Principal component analysis for constructing socio-economic composite indicators: Theoretical and empirical considerations. SN Soc. Sci. 2024, 4, 114. [Google Scholar] [CrossRef]
  46. Qi, K.; Fan, Z.; Xie, Y. The influences of habitat proportion and patch-level structural factors in the spatial habitat importance ranking for connectivity and implications for habitat conservation. Urban For. Urban Green. 2021, 64, 127239. [Google Scholar] [CrossRef]
  47. Tian, M.; Gao, J.; Song, G.; Feng, C. Prioritizing ecological conservation strategies to enhance national ecological connectivity in China. Ecol. Indic. 2023, 150, 110273. [Google Scholar] [CrossRef]
  48. Xu, J.; Wang, J.; Xiong, N.; Chen, Y.; Sun, L.; Wang, Y.; An, L. Analysis of ecological blockage pattern in Beijing important ecological function area, China. Remote Sens. 2022, 14, 1151. [Google Scholar] [CrossRef]
  49. Liu, C.; Newell, G.; White, M.; Bennett, A.F. Identifying wildlife corridors for the restoration of regional habitat connectivity: A multispecies approach and comparison of resistance surfaces. PLoS ONE 2018, 13, e206071. [Google Scholar] [CrossRef]
  50. Liang, G.; Niu, H.; Li, Y. A multi-species approach for protected areas ecological network construction based on landscape connectivity. Glob. Ecol. Conserv. 2023, 46, e2569. [Google Scholar] [CrossRef]
  51. Hou, W.; Zhou, W.; Li, J.; Li, C. Simulation of the potential impact of urban expansion on regional ecological corridors: A case study of Taiyuan, China. Sustain. Cities Soc. 2022, 83, 103933. [Google Scholar] [CrossRef]
  52. Chen, C.; Xu, A.; Ding, P.; Wang, Y. The small-island effect and nestedness in assemblages of medium-and large-bodied mammals on Chinese reservoir land-bridge islands. Basic Appl. Ecol. 2019, 38, 47–57. [Google Scholar] [CrossRef]
  53. Rusinko, A.; Druga, M. Barrier and corridor effects in cost-distance-based accessibility approximation for LUCC modelling: A case study of Slovakia from 2000 to 2018. Landsc. Res. 2022, 47, 316–332. [Google Scholar] [CrossRef]
  54. Shishmanova, M.V. Cultural tourism in cultural corridors, itineraries, areas and cores networked. Procedia-Soc. Behav. Sci. 2015, 188, 246–254. [Google Scholar] [CrossRef]
  55. Xu, H.; Zhao, G.; Fagerholm, N.; Primdahl, J.; Plieninger, T. Participatory mapping of cultural ecosystem services for landscape corridor planning: A case study of the Silk Roads corridor in Zhangye, China. J. Environ. Manag. 2020, 264, 110458. [Google Scholar] [CrossRef]
  56. Chen, H.; Yan, W.; Li, Z.; Wende, W.; Xiao, S. A framework for integrating ecosystem service provision and connectivity in ecological spatial networks: A case study of the Shanghai metropolitan area. Sustain. Cities Soc. 2024, 100, 105018. [Google Scholar] [CrossRef]
  57. Dai, L.; Liu, Y.; Luo, X. Integrating the MCR and DOI models to construct an ecological security network for the urban agglomeration around Poyang Lake, China. Sci. Total Environ. 2021, 754, 141868. [Google Scholar] [CrossRef] [PubMed]
  58. Sun, W.; Yu, Q.; Xu, C.; Zhao, J.; Wang, Y.; Miao, Y. Construction and optimization of ecological spatial network in typical mining cities of the Yellow River Basin: The case study of Shenmu City, Shaanxi. Ecol. Process 2024, 13, 60. [Google Scholar] [CrossRef]
  59. Rall, E.; Hansen, R.; Pauleit, S. The added value of public participation GIS (PPGIS) for urban green infrastructure planning. Urban For. Urban Green. 2019, 40, 264–274. [Google Scholar] [CrossRef]
  60. Guo, R.; Lin, L.; Xu, J.; Dai, W.; Song, Y.; Dong, M. Spatio-temporal characteristics of cultural ecosystem services and their relations to landscape factors in Hangzhou Xixi National Wetland Park, China. Ecol. Indic. 2023, 154, 110910. [Google Scholar] [CrossRef]
  61. Zuo, Y.; Zhang, L. Research on Local Ecosystem Cultural Services in the Jiangnan Water Network Rural Areas: A Case Study of the Ecological Green Integration Demonstration Zone in the Yangtze River Delta, China. Land 2023, 12, 1373. [Google Scholar] [CrossRef]
  62. Sahavacharin, A.; Sompongchaiyakul, P.; Thaitakoo, D. The effects of land-based change on coastal ecosystems. Landsc. Ecol. Eng. 2022, 18, 351–366. [Google Scholar] [CrossRef]
  63. Fang, J.; Liu, Y.; Wu, M.; Liu, Q.; Xu, M. New practices of land-sea coordination in coastal zone ecological security integration: A case study of Nantong. Ecol. Eng. 2024, 202, 107238. [Google Scholar] [CrossRef]
  64. Woodroffe, C.D.; Evelpidou, N.; Delgado-Fernandez, I.; Green, D.R.; Karkani, A.; Ciavola, P. Coastal Systems: The Dynamic Interface Between Land and Sea. In Research Directions, Challenges and Achievements of Modern Geography; Springer: Berlin/Heidelberg, Germany, 2023; pp. 207–229. [Google Scholar]
  65. Ke, L.; Zhao, Y.; Wang, Q.; Yin, S.; Liu, W. Construction of coastal zone ecological network based on the perspective of land-sea integration: A case study of Jinzhou City, China. Ocean Coast. Manag. 2024, 254, 107204. [Google Scholar] [CrossRef]
  66. Thiele, J.; Buchholz, S.; Schirmel, J. Using resistance distance from circuit theory to model dispersal through habitat corridors. J. Plant Ecol. 2018, 11, 385–393. [Google Scholar] [CrossRef]
  67. Tischendorf, L.; Wissel, C. Corridors as conduits for small animals: Attainable distances depending on movement pattern, boundary reaction and corridor width. Oikos 1997, 79, 603–611. [Google Scholar] [CrossRef]
  68. Balzan, M.V.; Potschin-Young, M.; Haines-Young, R. Island ecosystem services: Insights from a literature review on case-study island ecosystem services and future prospects. Int. J. Biodivers. Sci. Ecosyst. Serv. Manag. 2018, 14, 71–90. [Google Scholar] [CrossRef]
  69. Zhang, L.; Wan, Y.; Sun, Y.; He, G.; Lei, X.; Wei, X.; Jin, G. Optimizing ecological security patterns in a megacity by enhancing urban–rural connectivity: Insights from Wuhan, China. Appl. Geogr. 2025, 176, 103535. [Google Scholar] [CrossRef]
  70. Du, R.; Liu, B.; Xu, M. Current status and trends in island ecosystem services research: A bibliometric analysis from 2000 to 2023. Mar. Policy 2024, 163, 106098. [Google Scholar] [CrossRef]
  71. Deng, J.; Lin, Y.; Zhou, M.; Wu, C.; Chen, B.; Xiao, G.; Cai, J. Ecosystem services dynamics response to tremendous reclamation in a coastal island city. Ecosyst. Health Sustain. 2019, 5, 155–168. [Google Scholar] [CrossRef]
  72. Wilson, A.M.W.; Forsyth, C. Restoring near-shore marine ecosystems to enhance climate security for island ocean states: Aligning international processes and local practices. Mar. Policy 2018, 93, 284–294. [Google Scholar] [CrossRef]
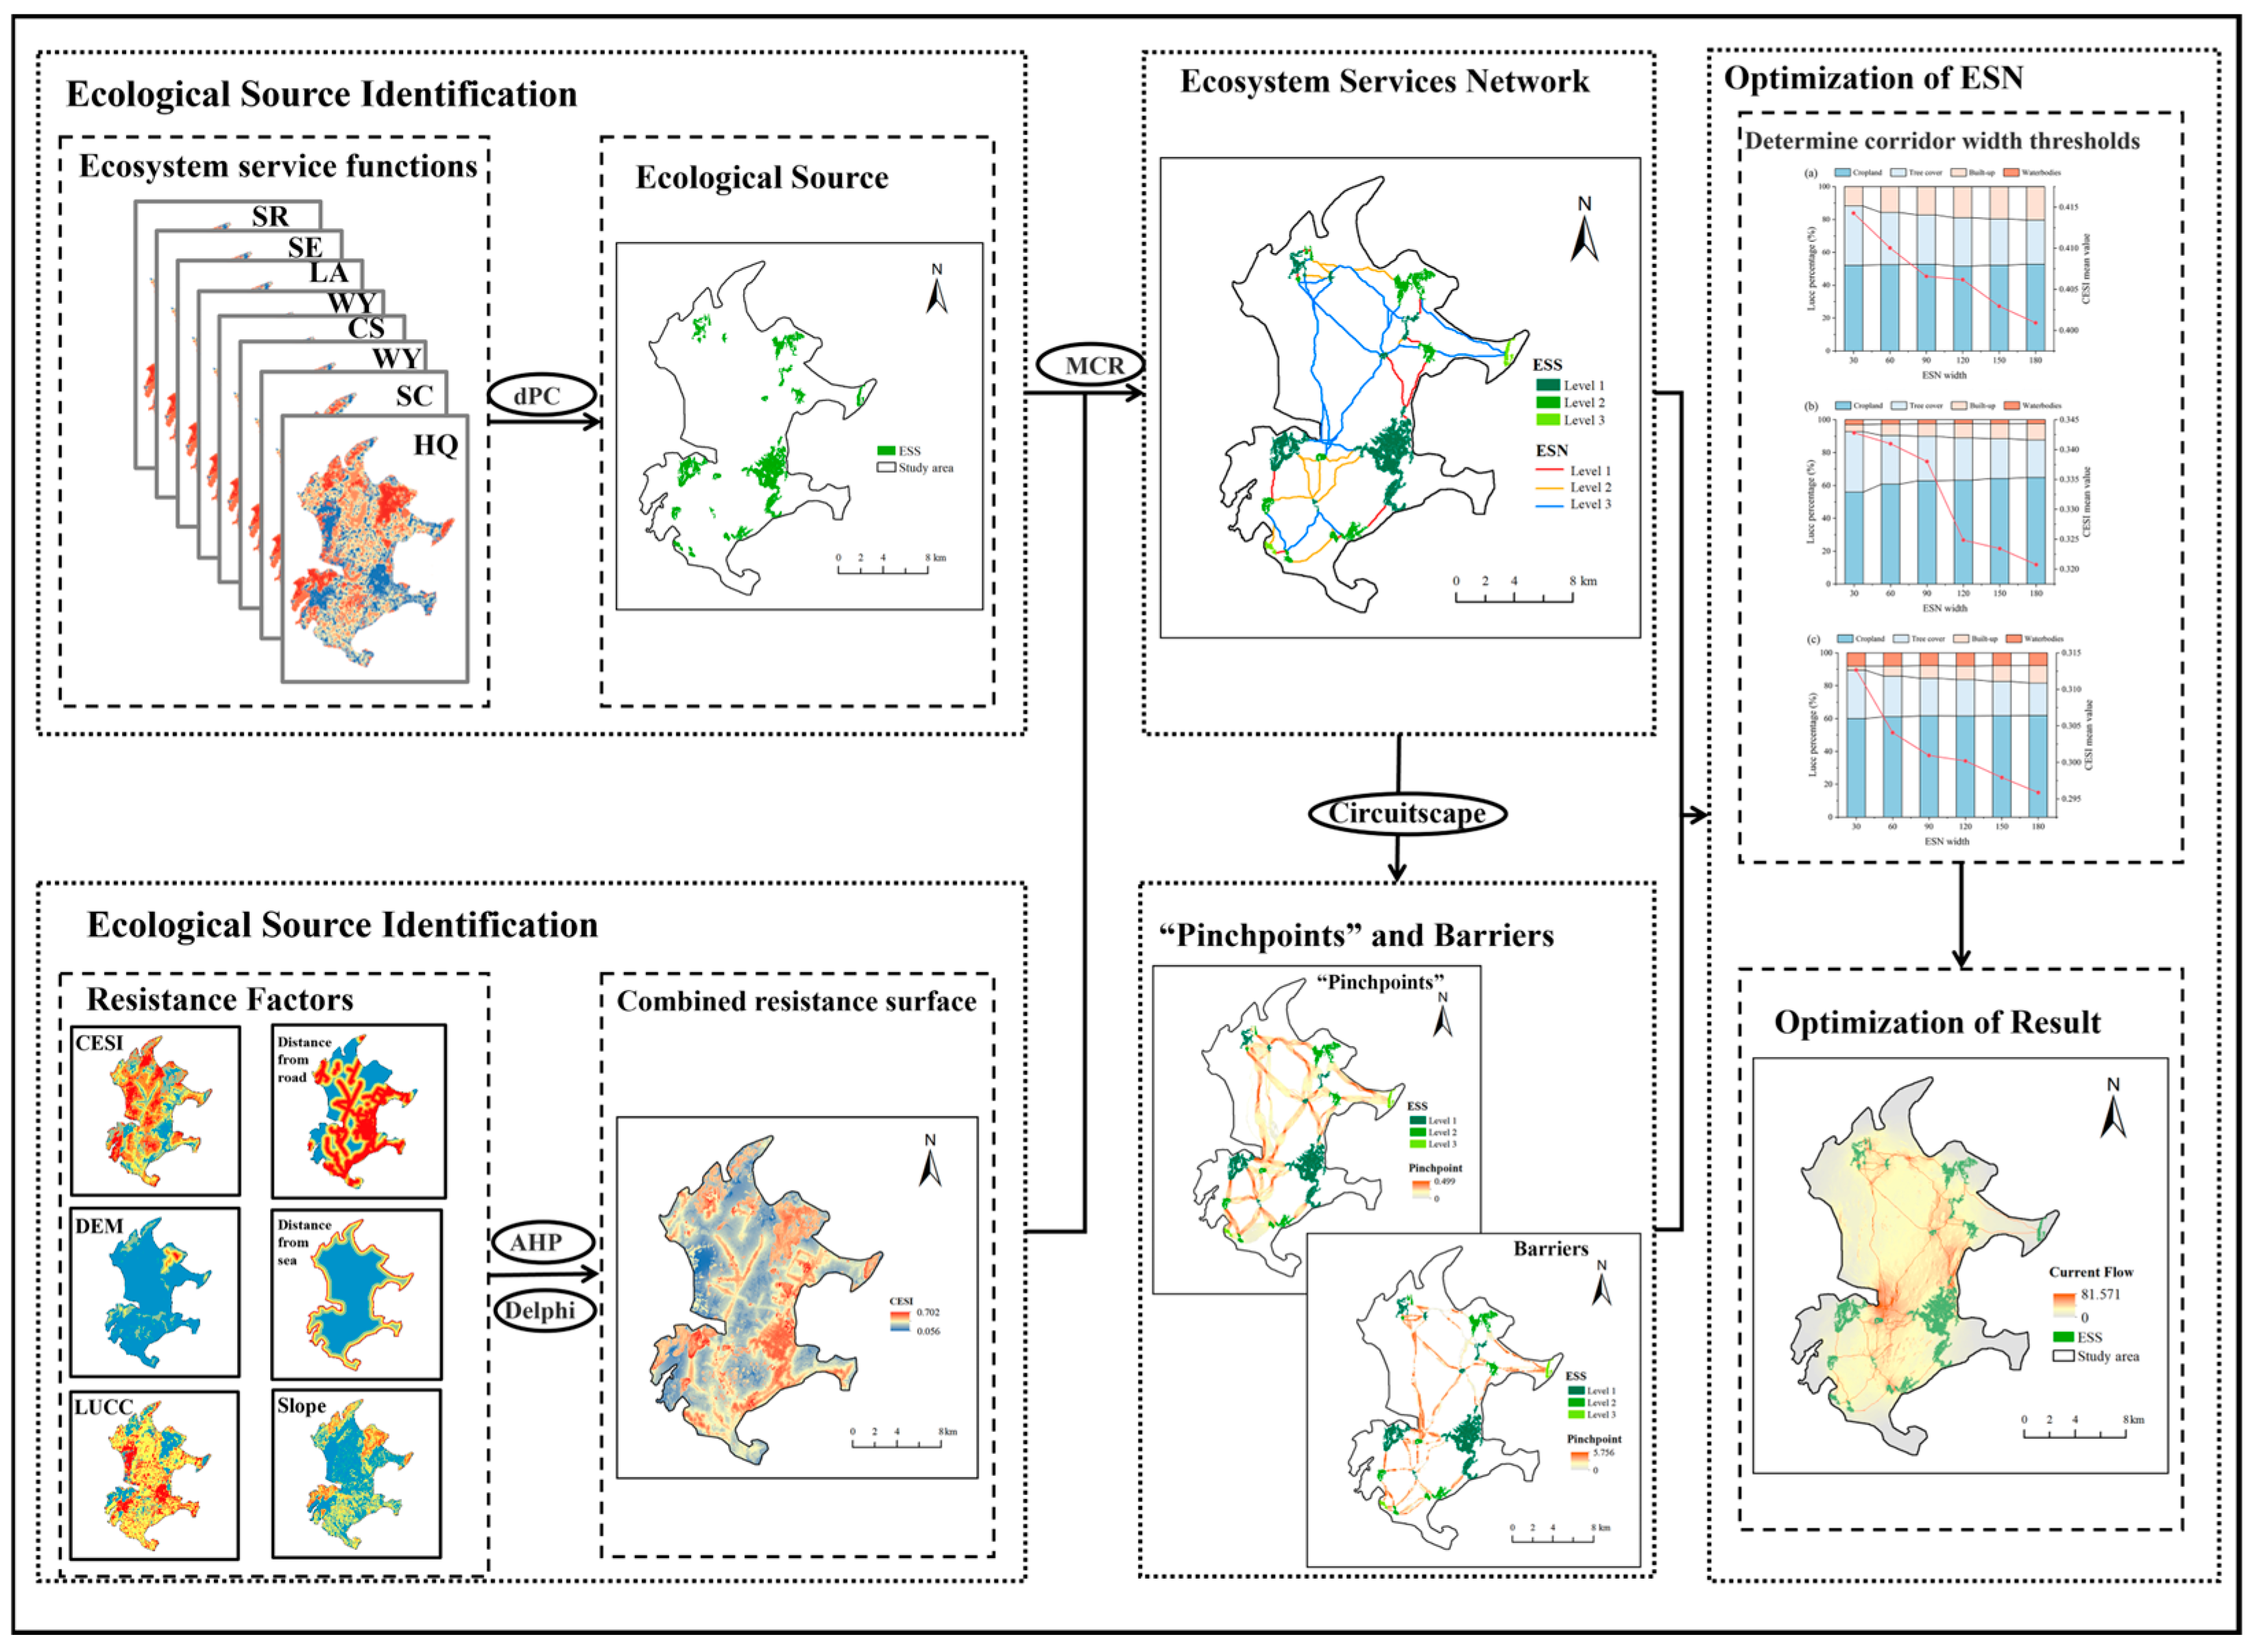
Figure 1. Research framework.
Sustainability 17 08470 g001
Figure 2. Location of the study area and LUCC.
Sustainability 17 08470 g002
Figure 3. Spatial distribution of ecosystem services in Pingtan Island (2022) ((a). Habitat Quality (0–1); (b). Soil Conservation (ton/ha); (c). Water Yield (mm); (d). Carbon Storage (ton/ha); (e). Leisure & Entertainment (MaxEnt probability); (f). Landscape Aesthetics; (g). Science Education; (h). Spirituality and Religion; Data derived from InVEST (ad) and MaxEnt (eh)).
Sustainability 17 08470 g003
Figure 4. CESI-based integrated ecosystem service function evaluation results.
Sustainability 17 08470 g004
Figure 5. Spatial Distribution of Ecological Sources on Pingtan Island.
Sustainability 17 08470 g005
Figure 6. Combined resistance surfaces.
Sustainability 17 08470 g006
Figure 7. Pingtan Island Ecosystem Service Network.
Sustainability 17 08470 g007
Figure 8. Pinchpoint Mapper-based “pinch point” recognition.
Sustainability 17 08470 g008
Figure 9. Barrier Mapper based barrier recognition.
Sustainability 17 08470 g009
Figure 10. Spatial distribution of ecosystem service networks, barriers and “pinch points” on Pingtan Island.
Sustainability 17 08470 g010
Figure 11. Percentage of Lucc and mean value of CESI for different corridor widths ((a). Level-1 corridors; (b). Level-2 corridors; (c). Level-3 corridors).
Sustainability 17 08470 g011
Figure 12. Initial current density.
Sustainability 17 08470 g012
Figure 13. Optimized current density.
Sustainability 17 08470 g013
Table 1. Data sources.
Data TypeFile Format SpecificationResolutionSource
2022 Land use dataraster30 mThe 30 m annual land cover datasets and its dynamics in China from 2022 (https://zenodo.org/records/8176941, accessed on 27 July 2025)
Pingtan Island Boundaryshp/Fuzhou Natural Resources Planning Bureau (http://zygh.fuzhou.gov.cn/, accessed on 27 July 2025)
DEMraster12.5 mDistributed Activity Archive Centre for Satellite Equipment, Alaska, United States (https://asf.alaska.edu/, accessed on 27 July 2025)
POI, urban roads, motorways, etc.shp/OpenStreetMap (https://www.openstreetmap.org/, accessed on 27 July 2025)
Average annual rainfallraster1000 mNational Centre for Earth System Data Science (http://www.geodata.cn/, accessed on 27 July 2025)
Average annual potential evapotranspirationraster1000 mNational Tibetan Plateau Science Data Centre
(https://www.tpdc.ac.cn/, accessed on 27 July 2025)
Soil qualityraster250 mSoilGirds250m2.0 database
(https://soilgrids.org, accessed on 27 July 2025)
Root depthraster250 mhttps://doi.org/10.1016/j.scitotenv.2023.168249, accessed on 27 July 2025
Table 2. Resistance magnitudes and weighting factors for each resistance component.
Category of ResistanceWeight ValueBarrier Effect FactorResistance ValueCategory of ResistanceWeight ValueBarrier Effect FactorResistance Value
LUCC0.4545Tree cover1DEM0.1675≤50 m1
Grassland3(50, 150] m3
Cropland5(150, 250] m5
Bareland7(250, 350] m7
Built-up9>350 m9
Water bodies5
Slope0.0985(0°, 3°]1CESI0.1526(0, 0.195]9
(3°, 5°]3(0.195, 0.268]7
(5°, 15°]5(0.268, 0.352]5
(15°, 25°]7(0.352, 0.438]3
>25°9(0.438, 1.000]1
Distance from road0.0715≤300 m9Distance from sea0.0554>1000 m1
(300, 600] m7(500, 1000] m3
(600, 900] m5(200, 500] m5
(900, 1200] m3(100, 200] m7
>1200 m1≤100 m9
Table 3. Studies related to appropriate width thresholds with species conservation as the goal.
CategoryFunctionTotal Width Setting (m)Buffer Width Setting (m)
Ecological corridorsinvertebrate population(3, 12](1, 1] (≈1)
Migratory needs of birds; largely meets migration and dispersal of plants and animals; Safeguards fish, small mammals, reptiles, and amphibians by preserving their habitats(12, 200](1, 10]
Facilitate the migration and dispersal of flora and fauna; the minimum width required for the survival of tree populations(200, 600](10, 50]
Medium and variable temperature mammals(600, 1200](50, 100]
Table 4. Studies related to thresholds of appropriate breadth values targeting cultural services.
CategoryFunctionTotal Width Setting (m)Buffer Width Setting (m)
Recreation corridorsWalking, short trips, sightseeing, leisure and entertainment(2, 5](0, 1]
Cycling, jogging and dog walking(5, 8](0, 1]
Functions of campsites, recreation, party and catering activities that provide appropriate staging space and recreational facilities(8, 30](1, 8]
Science education, cultural heritage sources, nature education trails, etc.(30, 100](0, 10]
Table 5. Outcomes of CESI Principal Component Analysis.
IngredientPC-1PC-2PC-3PC-4
HQ−0.7410.422−0.2630.401
SC−0.5000.584−0.266−0.503
WY−0.5640.4360.642−0.176
CS−0.7240.595−0.0720.223
LE0.8460.477−0.0160.033
LA0.7070.6060.0450.002
SE0.8140.3440.1920.275
SR0.7580.222−0.254−0.191
Eigenvalue4.0941.8270.6600.608
Characteristic contribution/%51.16922.8438.2567.598
Cumulative contribution/%51.16974.01282.26889.866
Table 6. Land-use composition of “pinch points” and barriers.
Pinch PointsBarriers
Area/km2Proportion/%Area/km2Proportion/%
Tree cover1.781030.95%0.00180.02%
Grassland0.00000.000%0.00000.00%
Cropland3.124254.29%5.100371.11%
Built-up0.49838.66%1.301418.15%
Bare land0.00170.03%0.00270.04%
Water bodies0.34936.07%0.765910.68%
Disclaimer/Publisher’s Note: The statements, opinions and data contained in all publications are solely those of the individual author(s) and contributor(s) and not of MDPI and/or the editor(s). MDPI and/or the editor(s) disclaim responsibility for any injury to people or property resulting from any ideas, methods, instructions or products referred to in the content.