Article

Towards Sustainable Hydrocarbon Extraction: A Study of Atmospheric Pollutant Dynamics (CO, CH4, SO2, HCHO) via Remote Sensing and Meteorological Data

by
Viviana N. Fernández Maldonado
1,2,†,
Ana Laura Navas
1,†,
Germán Mazza
3,
Paula Fabani
1,4 and
Rosa Rodriguez
1,*
1
Grupo Vinculado al PROBIEN (CONICET-UNCo), Instituto de Ingeniería Química, Facultad de Ingeniería, Universidad Nacional de San Juan, Av. Libertador San Martín (Oeste) 1109, San Juan 5400, Argentina
2
Observatorio de Cambio Climático de San Juan, Secretaria de Ambiente y Desarrollo Sustentable, Gobierno de la Provincia de San Juan, Calle 5 y Pelegrini, Al Pie del Cerro Parkison, San Juan 5400, Argentina
3
Instituto de Investigación y Desarrollo en Ingeniería de Procesos, Biotecnología y Energías Alternativas (PROBIEN), CONICET–Universidad Nacional del Comahue, Buenos Aires 1400, Neuquén 8300, Argentina
4
Instituto de Biotecnología, Facultad de Ingeniería, Universidad Nacional de San Juan, Av. Libertador Gral San Martín 1109 (Oeste), San Juan 5400, Argentina
*
Author to whom correspondence should be addressed.
These authors contributed equally to this work.
Sustainability 2025, 17(18), 8443; https://doi.org/10.3390/su17188443
Submission received: 22 August 2025 / Revised: 15 September 2025 / Accepted: 16 September 2025 / Published: 20 September 2025

Abstract

Hydrocarbon exploitation in Argentina is a strategic sector for the national economy, but also a significant source of atmospheric emissions. In the context of climate change, energy transition, and increasing health risks, robust evidence is needed to characterize pollutant dynamics in hydrocarbon basins. This study modeled the atmospheric dispersion of CO (carbon monoxide), CH4 (methane), SO2 (sulfur dioxide), and HCHO (formaldehyde) around oil wells by integrating satellite imagery with meteorological data. The study covered Argentina’s main hydrocarbon basins, applying generalized additive mixed models (GAMM) to assess relationships between pollutants, climatic variables, and basin locations. Results showed that CO and SO2 peaked in the Cuyana basin, influenced by outdated infrastructure, flaring, and atmospheric stability, reaching maxima in spring (CO > 30,000 µmol·m−2) and winter (SO2 = 2760 µmol·m−2). HCHO levels were elevated in Cuyana and Neuquina, during warmer months (> 170 µmol·m−2). CH4 displayed a more uniform distribution (~1800 ppb), with slightly higher values in Cuyana due to temperature and pressure. By combining high-resolution satellite observations with climate data, this study makes a novel and outstanding contribution by providing the first integrated assessment of pollutant dynamics across Argentina’s oil basins, offering actionable benchmarks for emission reduction, infrastructure modernization, and alignment with sustainability commitments.

1. Introduction

The extraction, processing, and transportation of hydrocarbons represent one of the most significant anthropogenic sources of atmospheric pollution worldwide. According to the International Energy Agency, flaring and venting from oil and gas operations contribute substantially to the release of greenhouse gases (GHGs) and hazardous air pollutants (HAPs), with flaring alone estimated to emit more than 400 million tonnes of CO2-equivalent annually, alongside a complex mixture of trace gases and aerosols [1]. In some oil-producing regions, gas flaring accounts for approximately 82% of the total air pollutants released by the petroleum industry, generating emissions rich in unburned hydrocarbons (HC), nitrogen oxides (NOₓ), SO2, CO, hydrogen sulfide (H2S), and particulate matter (PM) [2]. These compounds not only degrade air quality but also contribute to climate change and the formation of acid rain, which have adverse consequences for human health and ecosystems [3].
In Argentina, 22 sedimentary basins have been identified, covering a total area of approximately 1.75 million km2. However, current hydrocarbon production is concentrated in four main basins: Cuyana, Neuquén, San Jorge Gulf, and Austral [4]. The Neuquén Basin dominates national production due to the development of unconventional reservoirs in the Vaca Muerta formation, accounting for over 40% of oil and 55% of natural gas output [5]. Conversely, the Cuyana basin, despite contributing less than 3% of production, often reports elevated atmospheric pollutant concentrations, which may be linked to aging infrastructure and limited emission control measures [6]. This regional heterogeneity in emission sources and operational practices, combined with distinct climatic and topographic conditions, creates unique spatial and temporal patterns in pollutant dynamics.
Among the trace gases of concern in hydrocarbon extraction areas, CO, CH4, SO2, and formaldehyde (HCHO) are particularly relevant due to their combined environmental and health impacts. The atmospheric behavior of these gases is strongly modulated by meteorological variables such as temperature, wind speed and direction, atmospheric pressure, humidity, and precipitation. Seasonal variations in these meteorological drivers, combined with operational cycles in oil production (e.g., well maintenance, flaring intensity), can result in pronounced spatiotemporal variability in pollutant concentrations [5].
Over the last decade, satellite-based remote sensing has emerged as a powerful tool for monitoring air quality in remote or industrially sensitive regions. Instruments such as the Tropospheric Monitoring Instrument (TROPOMI) onboard Sentinel-5P provide high-resolution global coverage of atmospheric gases, including CO, CH4, SO2, and HCHO, enabling the detection of emission hotspots and the assessment of long-range transport phenomena [6,7]. Generalized additive models (GAMs) can be used to model the relationship between pollutant gas concentrations and meteorological factors [8], offering valuable insights for environmental management. Despite the growing global literature on atmospheric pollution from oil and gas activities, there is limited research focused on South American hydrocarbon basins, particularly those in Argentina, where diverse climatic regimes, from arid highlands to subpolar coasts, interact with industrial emissions in ways not fully understood. The lack of integrated analyses combining satellite observations with climate data hampers the development of targeted mitigation policies.
While numerous studies have utilized satellite remote sensing to monitor atmospheric pollutants in major hydrocarbon-producing regions such as North America [9], the Middle East, and Asia [10], the application of these advanced techniques to South American basins—particularly those in Argentina—remains limited. Existing global literature often focuses on single pollutants, short-term analyses, or regions with homogenous climatic conditions, thereby overlooking the complex interplay between diverse meteorological regimes, varied extraction technologies, and basin-specific operational practices [11]. This study fills this critical gap by providing the first comprehensive, multi-pollutant (CO, CH4, SO2, HCHO) analysis across Argentina’s principal hydrocarbon basins (Cuyana, Neuquén, San Jorge Gulf, Austral) using high-resolution Sentinel-5P TROPOMI data integrated with meteorological variables over a full annual cycle (2024). By employing GAMM, we capture both linear and nonlinear relationships between pollutant concentrations and climatic drivers [12], offering novel insights into how regional atmospheric stability, seasonal variability, and infrastructure conditions influence emission dynamics. This approach not only advances the methodological application of remote sensing in understudied South American contexts but also delivers basin-specific, actionable intelligence for mitigating emissions in regions characterized by aging infrastructure, intense unconventional extraction, and contrasting climatic zones—from arid intermontane valleys to windy subpolar coasts. Our findings thus contribute a unique empirical and analytical framework to the global literature, supporting tailored regulatory strategies and sustainable resource management in emerging economies.
The main objective of this study is to model the atmospheric dispersion of CO, CH4, SO2, and HCHO in Argentina’s principal hydrocarbon extraction areas, integrating Sentinel-5P TROPOMI satellite data with meteorological variables. Specifically, this work aims to: (a) determine spatial and temporal patterns of these polluting gases in relation to oil production basins; (b) evaluate the influence of meteorological variables on the concentrations of different pollutants at oil extraction sites; and (c) provide science-based evidence to inform sustainable management strategies in the petroleum sector. By addressing these aims, this study contributes to the global effort to monitor and mitigate the environmental impacts of hydrocarbon exploitation, aligning with the United Nations Sustainable Development Goals (SDGs), particularly Goals 3 (Good Health and Well-being), 7 (Affordable and Clean Energy), and 13 (Climate Action).

2. Materials and Methods

2.1. Study Area

In Argentina, 22 sedimentary basins have been identified, with a total area of approximately 1,750,000 km2. Although all of them have been explored, only four currently concentrate on actual hydrocarbon production: the Cuyana, Neuquén, San Jorge Gulf, and Austral basins. These regions constitute the strategic core of national energy development, both due to their production volume and the level of proven reserves and installed infrastructure [12].
The Cuyana basin is located between the south of San Juan province and central Mendoza. This basin primarily produces oil, and the average drilling depth of typical wells is between 3000 and 3500 m. Although its production has historically been significant, it currently represents a minor portion of the national total [13].
The Neuquén basin is the most important region in terms of hydrocarbon reserves and production in the country. It covers more than 120,000 km2 and encompasses parts of the provinces of Neuquén, Mendoza, Río Negro, and La Pampa [14]. Drilling depths vary between 700 and over 4000 m, depending on the type of reservoir. Currently, this basin contributes approximately 42% of the country’s oil production and 55% of its natural gas, consolidating its position as one of the main hydrocarbon-producing regions in South America.
Its importance has increased significantly in the last decade due to the development of unconventional deposits, mainly associated with the Vaca Muerta formation. This formation has been key in the transformation of the national energy landscape, attracting significant technological and infrastructure investments [5]. As of October 2023, the Neuquén basin had 151 hydrocarbon exploitation concessions, mostly operated by YPF. According to official data (Resolution No. 319/1993), a total of 31,709 wells has been reported, of which more than 8500—more than 25%—were drilled between 2010 and the present.
The San Jorge Golfo basin is located in central Patagonia, encompassing southern Chubut, northern Santa Cruz, and part of the Argentine continental shelf. It is a mixed basin, with both onshore and offshore reservoirs [14]. It was in this region that oil was first discovered in the country, in 1907, at a depth of 537 m. Currently, drilling reaches depths between 500 and over 3500 m, with maximum records near 5160 m without reaching the basement. This basin contains nearly two-thirds of the country’s proven oil reserves.
The Austral basin extends across the southern tip of the continent, encompassing a large part of the province of Santa Cruz, the Chilean region of Magallanes, the eastern sector of the Strait of Magellan, Tierra del Fuego, and a portion of the Argentine continental shelf. The wells drilled in this basin, both for oil and gas, have depths ranging from 1500 to 4000 m [6]. The Austral Basin is strategically important due to its high gas potential, and together with the Neuquén basin, it contains more than three-quarters of the country’s proven natural gas reserves [7].
In terms of reserves, natural gas is located primarily in the Neuquén and Austral basins. Together, they account for more than 75% of available proven reserves. Regarding oil, approximately two-thirds of the reserves are located in the San Jorge Gulf basin. If the Neuquén basin is included, both account for nearly 90% of Argentina’s total oil reserves.

2.2. Data Acquisition and Preprocessing

Satellite Data on Polluting Gases

Atmospheric gas data were obtained from products from the TROPOMI (Tropospheric Monitoring Instrument) sensor onboard the Sentinel-5P satellite, accessed using the Google Earth Engine (GEE) platform. The first stage of the study used the offline column density product (µmol m−2) for CO, SO2, formaldehyde (HCHO), and dry air column CH4, the latter expressed in ppb.
Direct validation of TROPOMI retrievals against ground-based measurements was not feasible due to the sparse air quality monitoring network in Argentina’s remote hydrocarbon basins. However, the satellite products used are well-validated in the literature and are considered robust for identifying emission hotspots and analyzing spatiotemporal patterns, which is the focus of this study [15,16]. For example, TROPOMI CO data shows a typical bias of ± 5–10%, and CH4 products have biases often below 0.5% when compared to reference networks. While SO2 and HCHO retrievals are more sensitive to atmospheric conditions, they remain reliable for qualitative and semi-quantitative analysis [17,18]. Therefore, our analysis emphasizes relative spatial patterns and temporal trends rather than absolute concentrations. Limitations include potential dilution of point-source peaks and uncertainties from clouds, albedo, and aerosols.
The analysis period spanned from January 1, 2024, to January 5, 2025. Data for each gas were filtered by region, focusing on the south-central region of Argentina, corresponding to the main hydrocarbon basins. From this selection, weekly averages were calculated for both gases and climate variables in each basin. For climate variables, data from the ERA5-Land ensemble of the European Centre for Medium-Range Weather Forecasts (ECMWF) were used, obtaining weekly average images for the same study period. The original spatial resolution of 0.1° (~9 km) was rescaled to 1000 m, without validation using in situ measurements. The variables considered were: wind speed (m s−1), wind direction (°), air temperature at 2 m (°C), atmospheric pressure (hPa), dewpoint temperature at 2 m (°C), and total accumulated precipitation (mm). In addition, the vector layer of Argentina’s oil basins was used, from which only those currently active were selected. To evaluate the influence of climatic variables on the various pollutants, at least 35 oil extraction sites (sampling points) were randomly selected in each basin, ensuring a minimum distance of 1300 m between them (Figure 1). A buffer zone with a radius of 1000 m was then delimited around each well to ensure the spatial independence of the samples. A distance of 1000 m was selected to minimize potential overlaps between influence areas and to reduce spatial autocorrelation. All data processing and extraction were conducted in QGIS version 3.22.

2.3. Spatial and Statistical Analysis

To determine the spatial distribution of the different gases during 2024, concentration maps were generated, and statistical parameters such as mean, maximum, minimum, and standard deviation values were calculated for each month. In addition, weekly averages from randomly selected oil wells (previously described sampling points) were extracted to analyze the temporal variation throughout 2024.
To understand the variations in the concentrations of different gases in relation to climatic and spatial variables, GAMM were fitted. The values used were the averages extracted from randomly sampled oil wells (sampling points). This modeling approach was selected because GAMM is particularly well-suited for analyzing complex atmospheric data, as it allows the identification of both linear and nonlinear relationships between pollutants, meteorological variables, and geographic factors. In this way, it provides a flexible and robust framework to disentangle interactions that cannot be captured by traditional linear models, improving the reliability of pollutant dynamics assessment. To evaluate the model fit, the normalized residuals, their autocorrelation (ACF), and the smoothed functions were analyzed, observing whether the relationships were linear or not (edf values > 1). For climatic variables (wind speed, wind direction, air temperature at 2 m, pressure, dew point temperature at 2 m, total accumulated precipitation), smoothed functions were incorporated to model nonlinear relationships. The basin variable was included as a fixed factor, and the week variable was included as a random effect to model the temporal dependence. For each complete model, a backward elimination procedure was used to eliminate non-significant variables without losing important information (a p-value of significance level > 0.05 can be eliminated) and obtain the minimum adequate model [19]. The fit was evaluated using the Akaike information criterion (AIC). Before model fitting, we assessed potential multicollinearity among the continuous climatic predictors by calculating a Pearson correlation matrix. A conservative threshold of |r| > 0.7 was used to identify strongly collinear variables [20]. No variable pairs exceeded this threshold, indicating that multicollinearity was not severe enough to necessitate the removal of any predictors from the initial model. To compare CO, SO2, and CH4 concentrations among the different oil basins, a linear mixed model was fitted using the lme function from the nlme package, considering basin as a fixed effect and time (weeks) as a random intercept to capture the temporal structure of the data. Multiple comparisons between the levels of the basin factor were then performed using the Tukey HSD test to identify statistically significant differences in the adjusted means of the pollutant gases. All statistical analyses were conducted in R [19].

3. Results

These findings reveal spatial and temporal patterns in the concentrations of atmospheric pollutants in Argentina’s main oil basins during 2024. The Cuyana basin consistently presented the highest concentrations of CO, SO2, HCHO, and CH4, followed by the Neuquén basin. While the lowest concentrations of CO and HCHO were recorded in the Austral Marina Basin, and SO2 and CH4 in the Golfo San Jorge Basin, located in the south of the country. Furthermore, the models showed that air temperature and atmospheric pressure were the most influential climate variables on CO, HCHO, and CH4 concentrations. In the case of SO2, the most influential variables were air temperature and wind direction, particularly winds from the northwest.
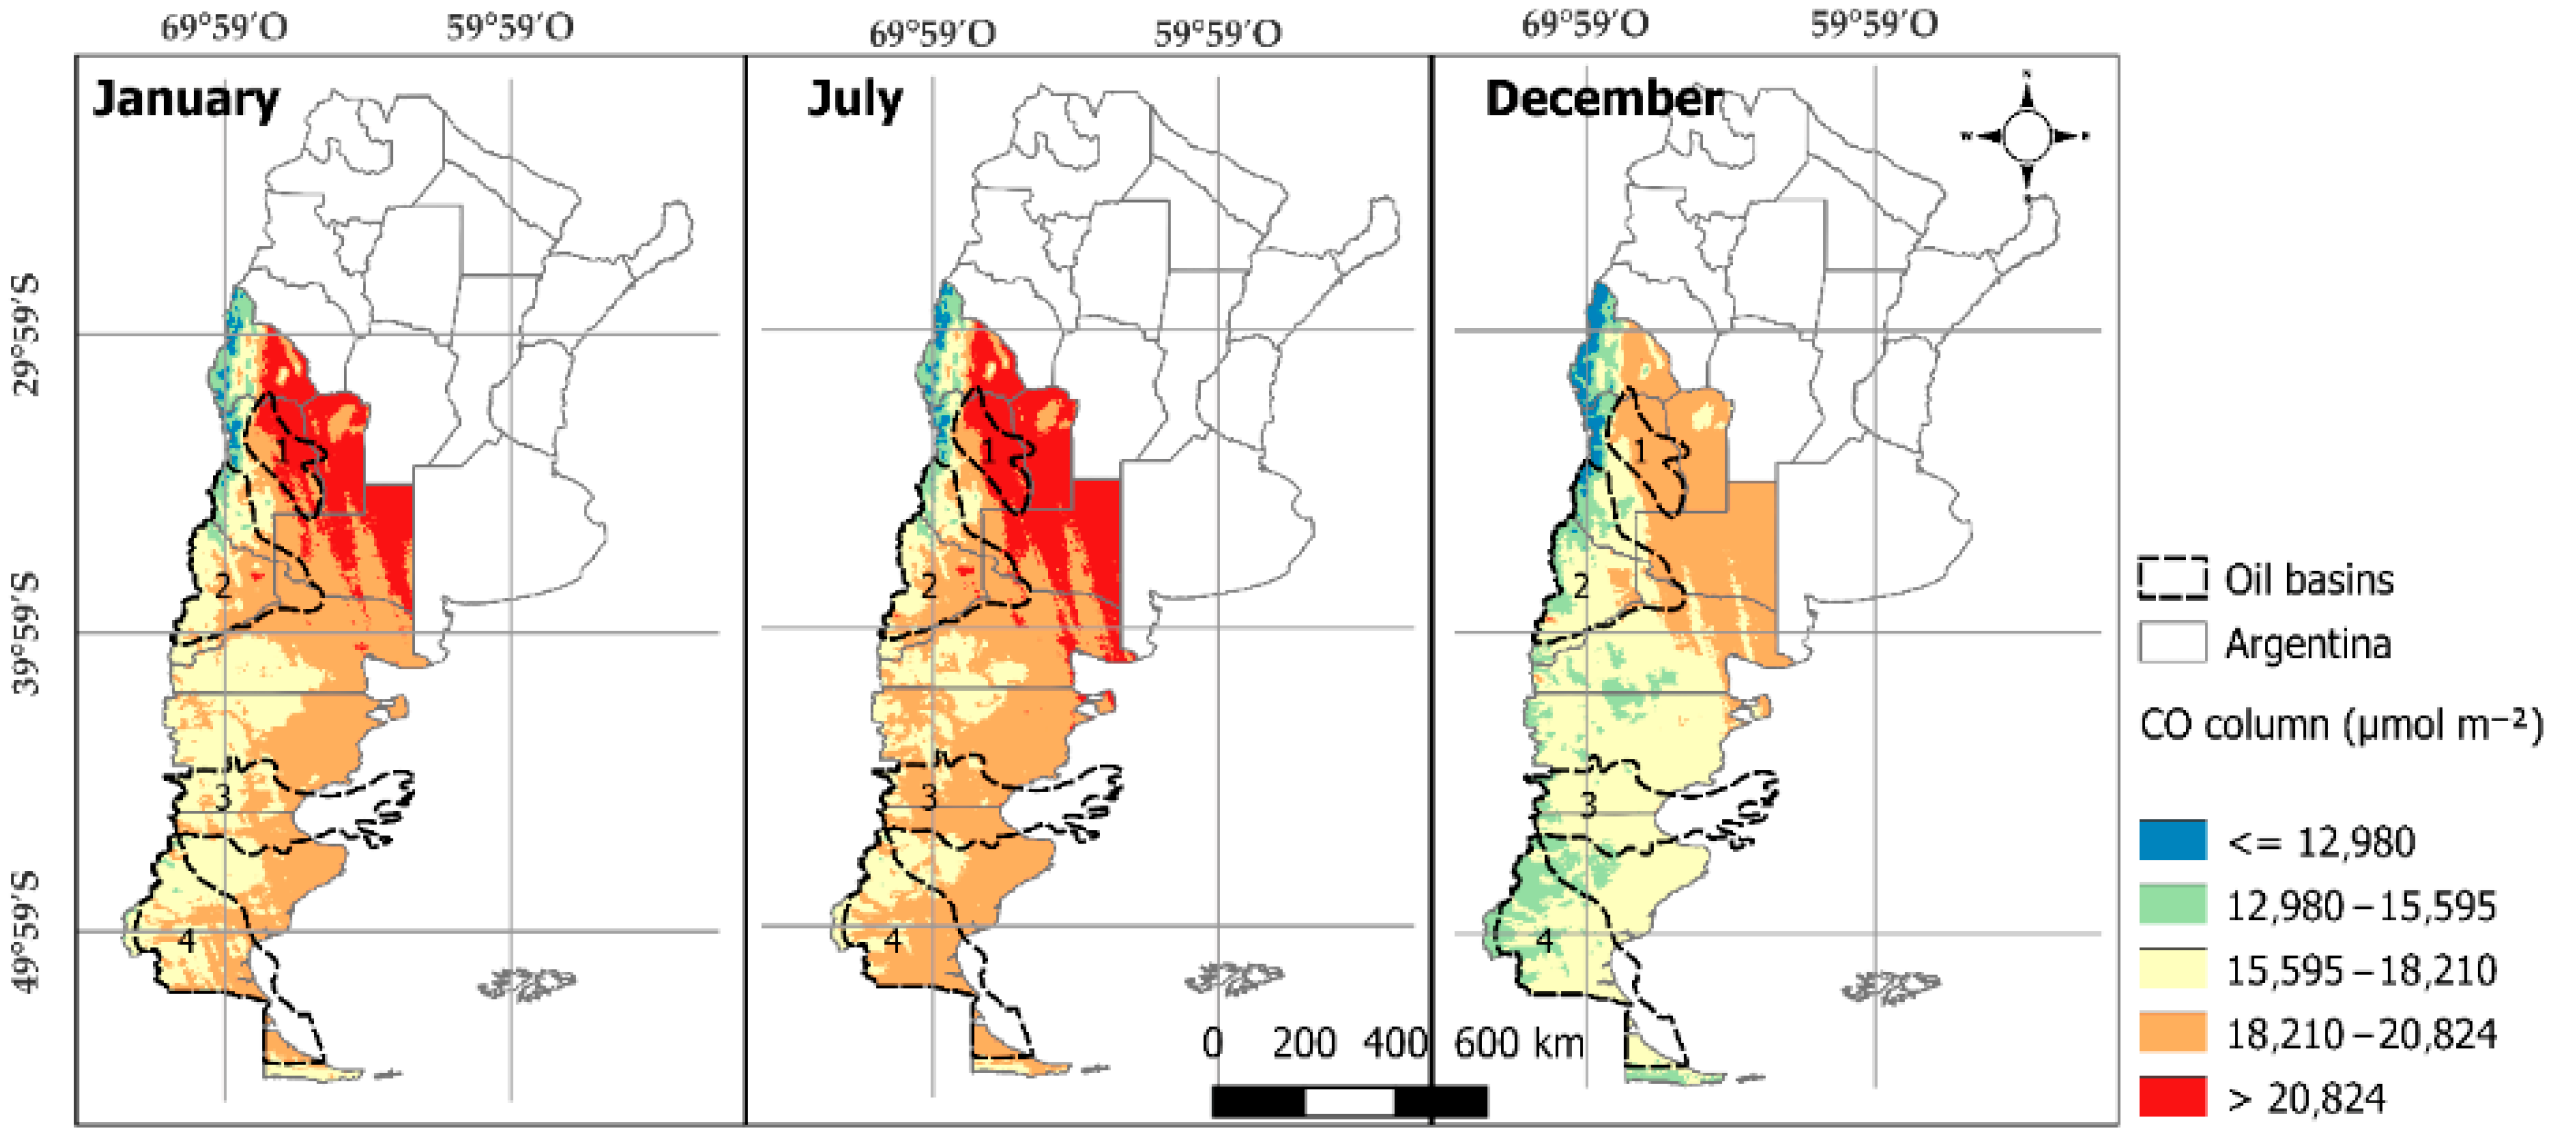
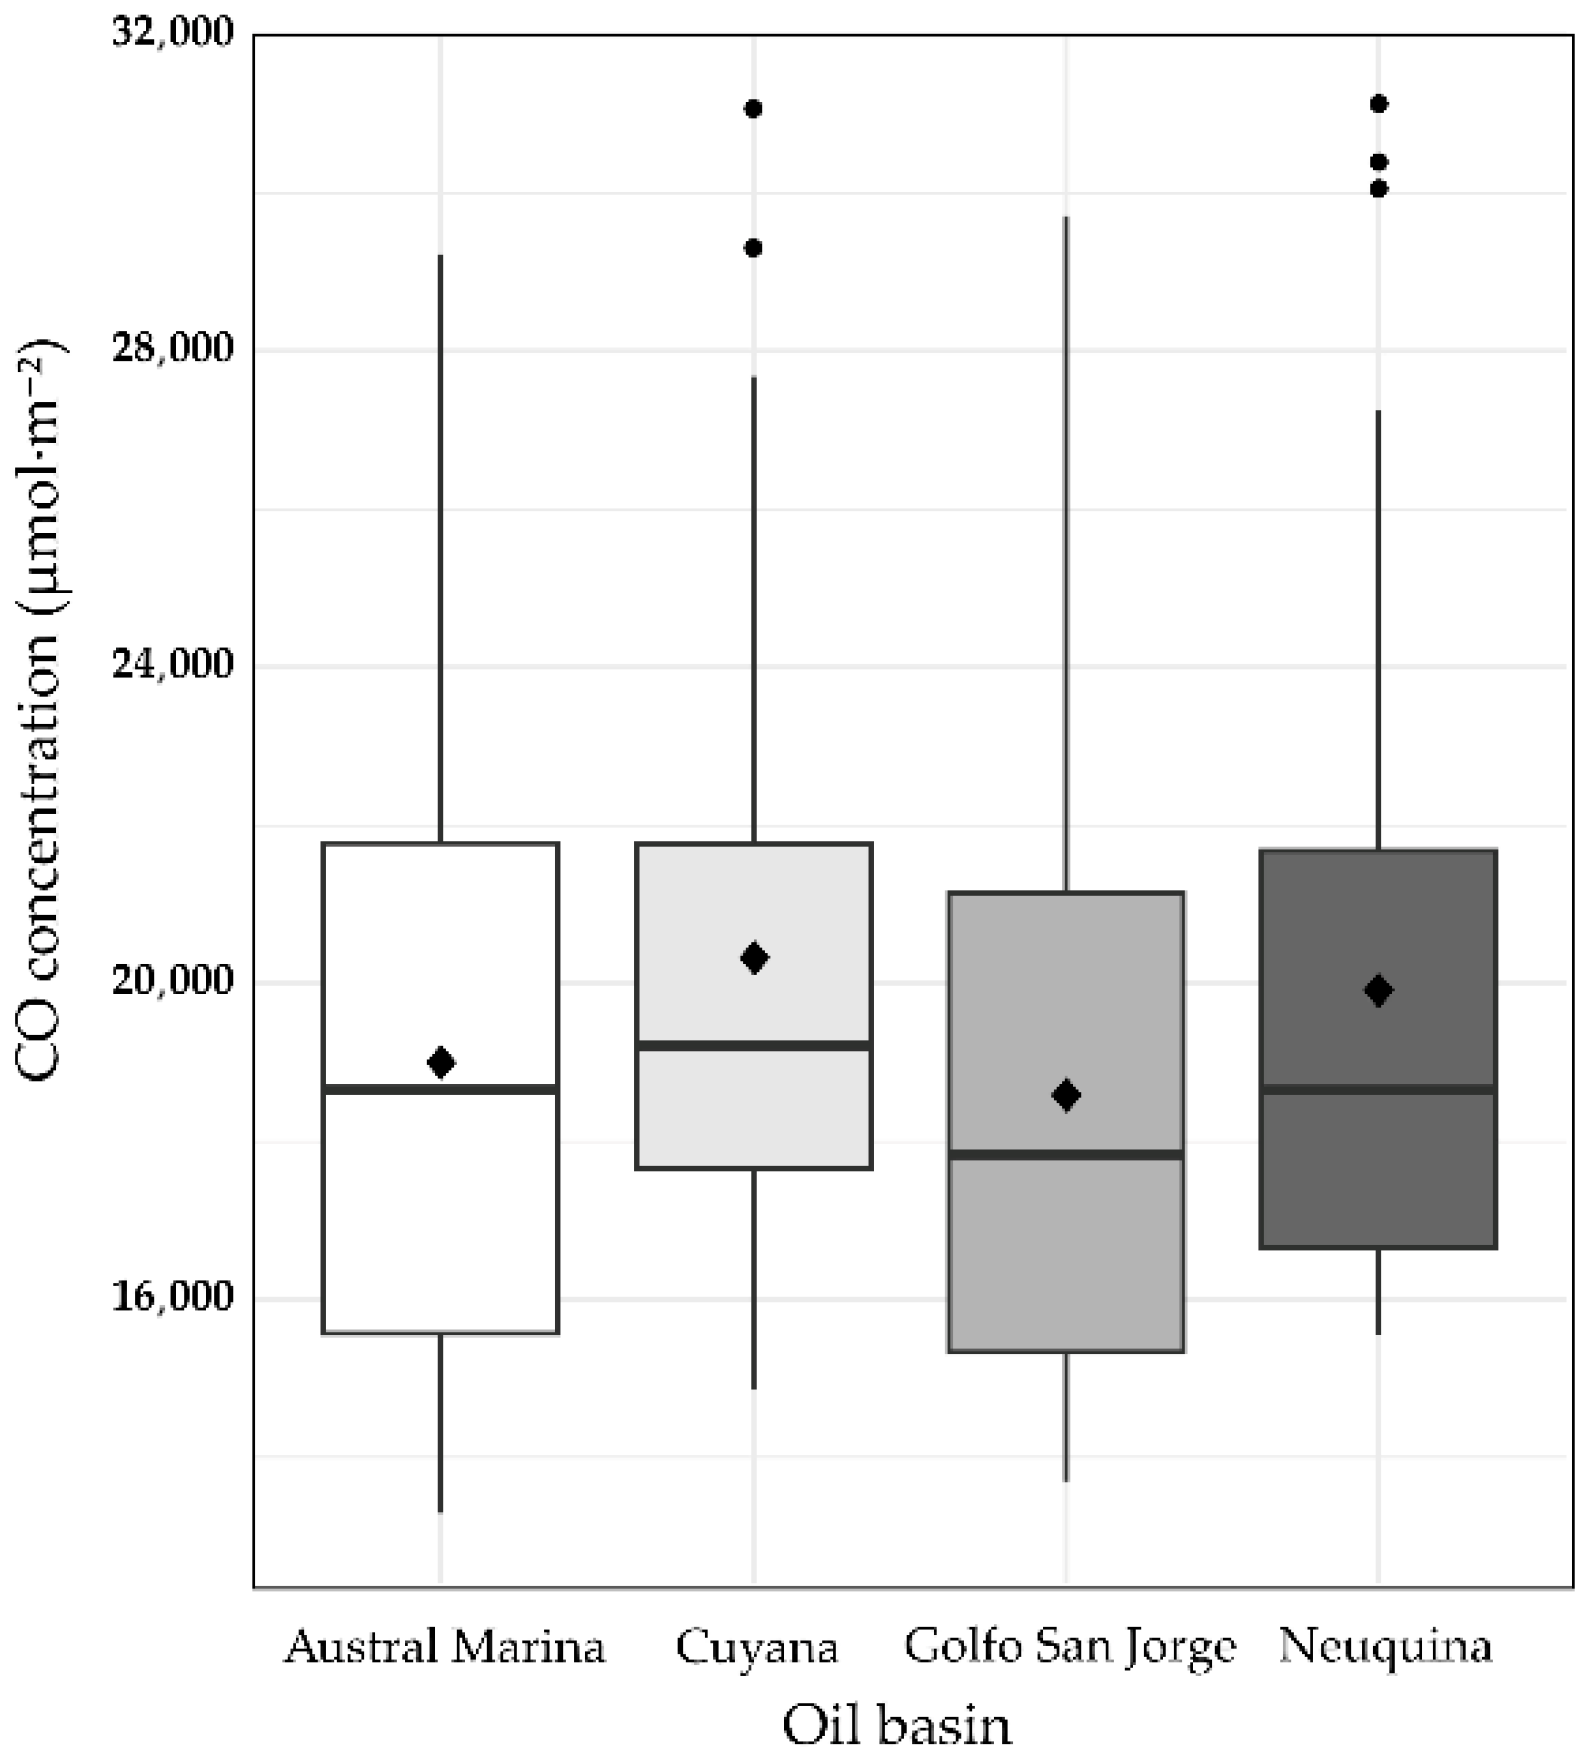
Overall, the spatial distribution of CO showed a clear concentration gradient from the oil-producing regions of the central west to the southern and northeastern parts of Argentina (Figure 2). The highest concentrations were recorded in the central-western region of the country, particularly in the Cuyana basin (mean = 20,177.30 ± 3719.18 µmol m−2), especially in January and July (Figure 2 and Figure 3). Levels were moderate in the Neuquén and Austral Marina basins (mean 19,834.72 ± 4102.86 µmol m−2 and mean 19,075.30 ± 4100.18 µmol m−2, respectively), while the lowest values were detected in the Golfo San Jorge basin, with a mean concentration of 18,731.88 ± 4149.52 µmol m−2 (Figure 3).
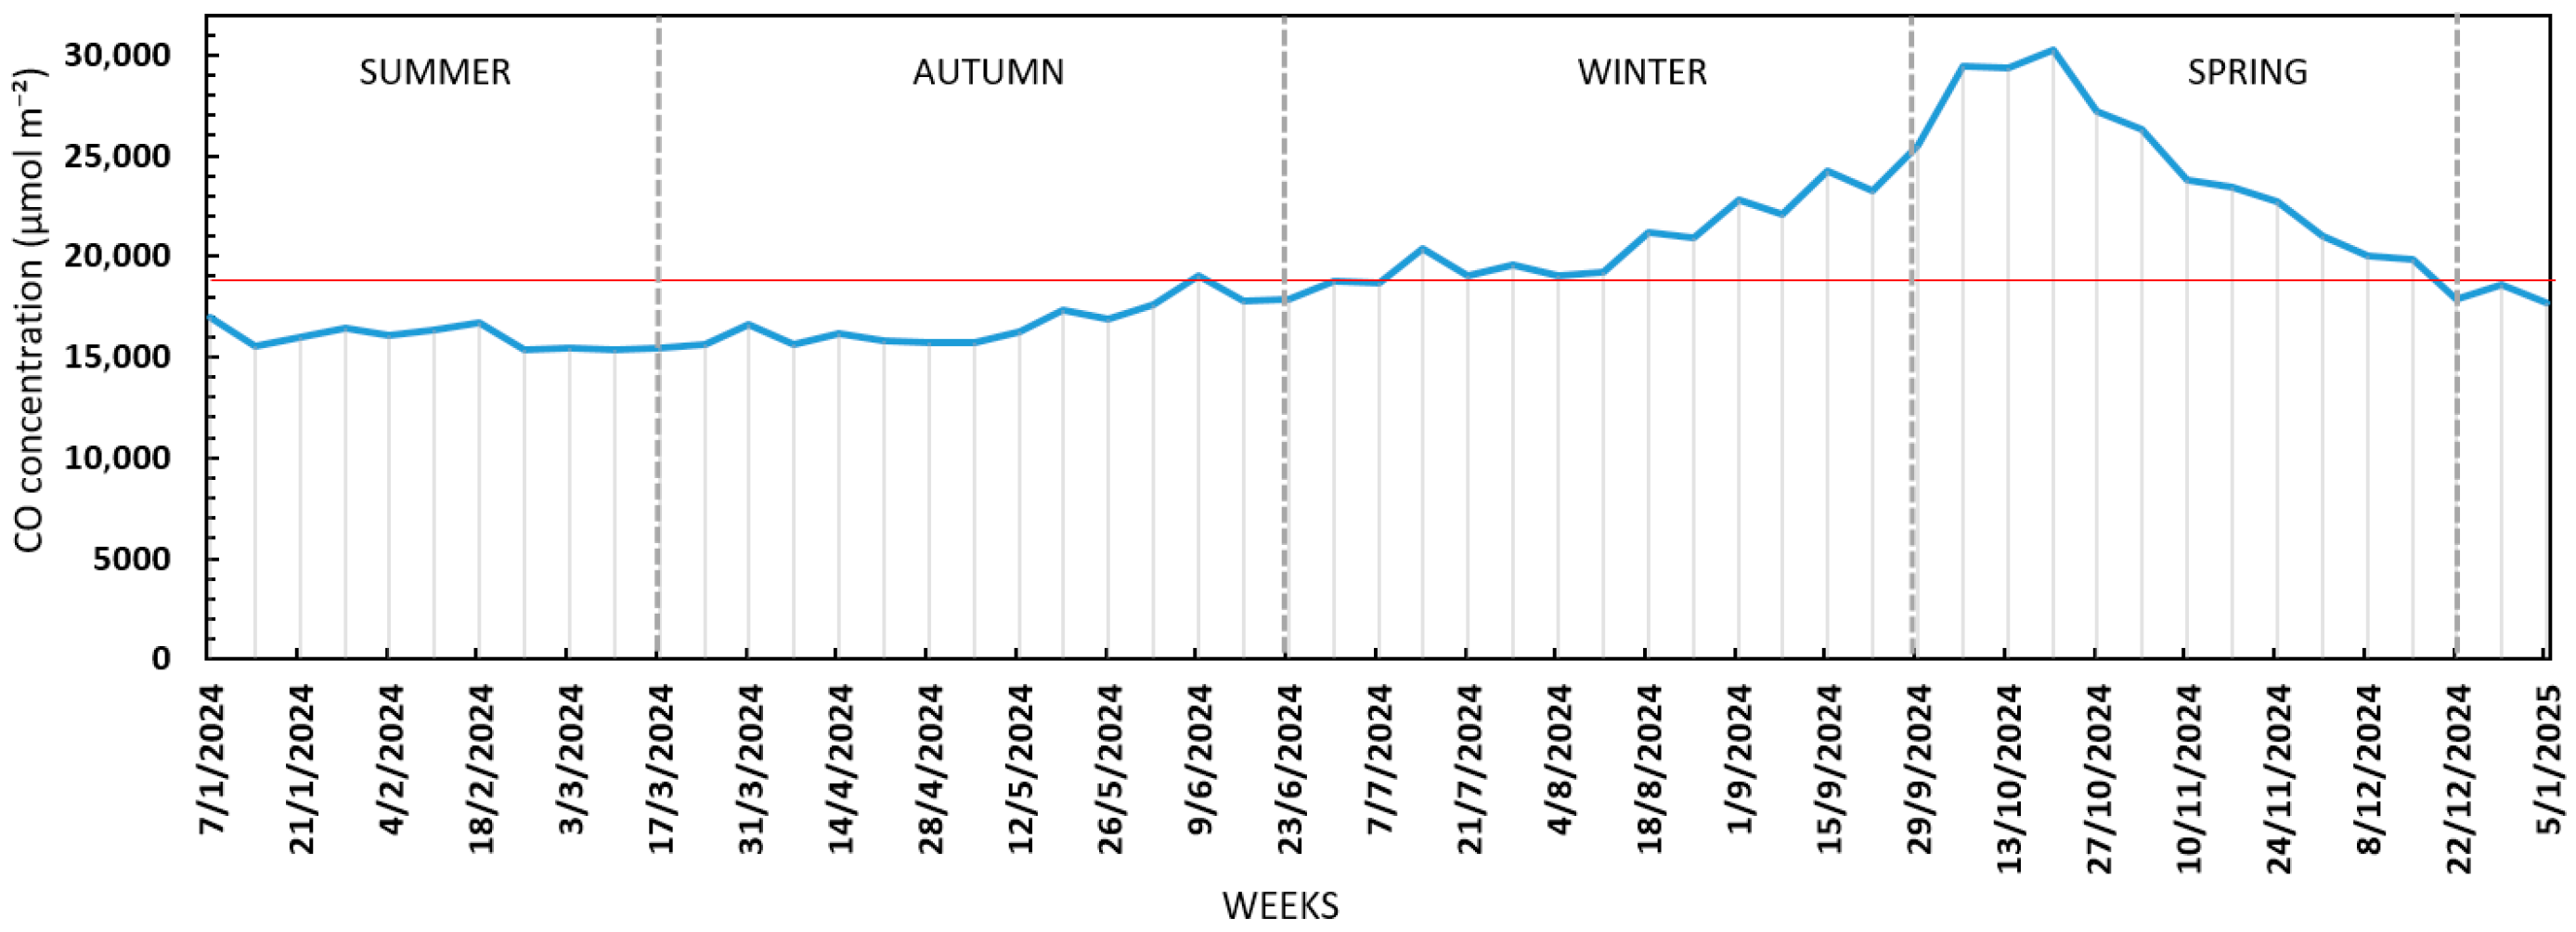
Figure 4 shows the average weekly CO concentration (expressed in µmol·m−2) over the entire year 2024 for the sampling points, from week 1 (early January) to week 53 (late December). During the first weeks of the year (summer), CO levels remained relatively low and stable, around 15,000 µmol·m−2–16,000 µmol·m−2. Between summer and autumn (January–June), concentrations increased by approximately 15–20%, reaching values close to the mean (19,470.21 µmol·m−2). The annual maximum was recorded around week 42 (October), when concentrations exceeded 30,000 µmol·m−2 (Figure 3). Subsequently, between weeks 43 and 52 (November–December), concentrations gradually decreased, although without returning to the minimum values observed at the beginning of the year (values greater than 17,000 µmol·m−2).
From autumn to winter (June–September), a sharper rise of about 25–30% was observed, with levels surpassing 24,000 µmol·m−2 in September. The annual maximum was recorded around week 42 (mid-October), when concentrations exceeded 30,000 µmol·m−2, representing an increase of almost 100% relative to the summer minimum. Subsequently, between spring and early summer (November–December), concentrations gradually decreased by about 35–40%, although without returning to the minimum values observed at the beginning of the year (remaining above 17,000 µmol·m−2; Figure 4).
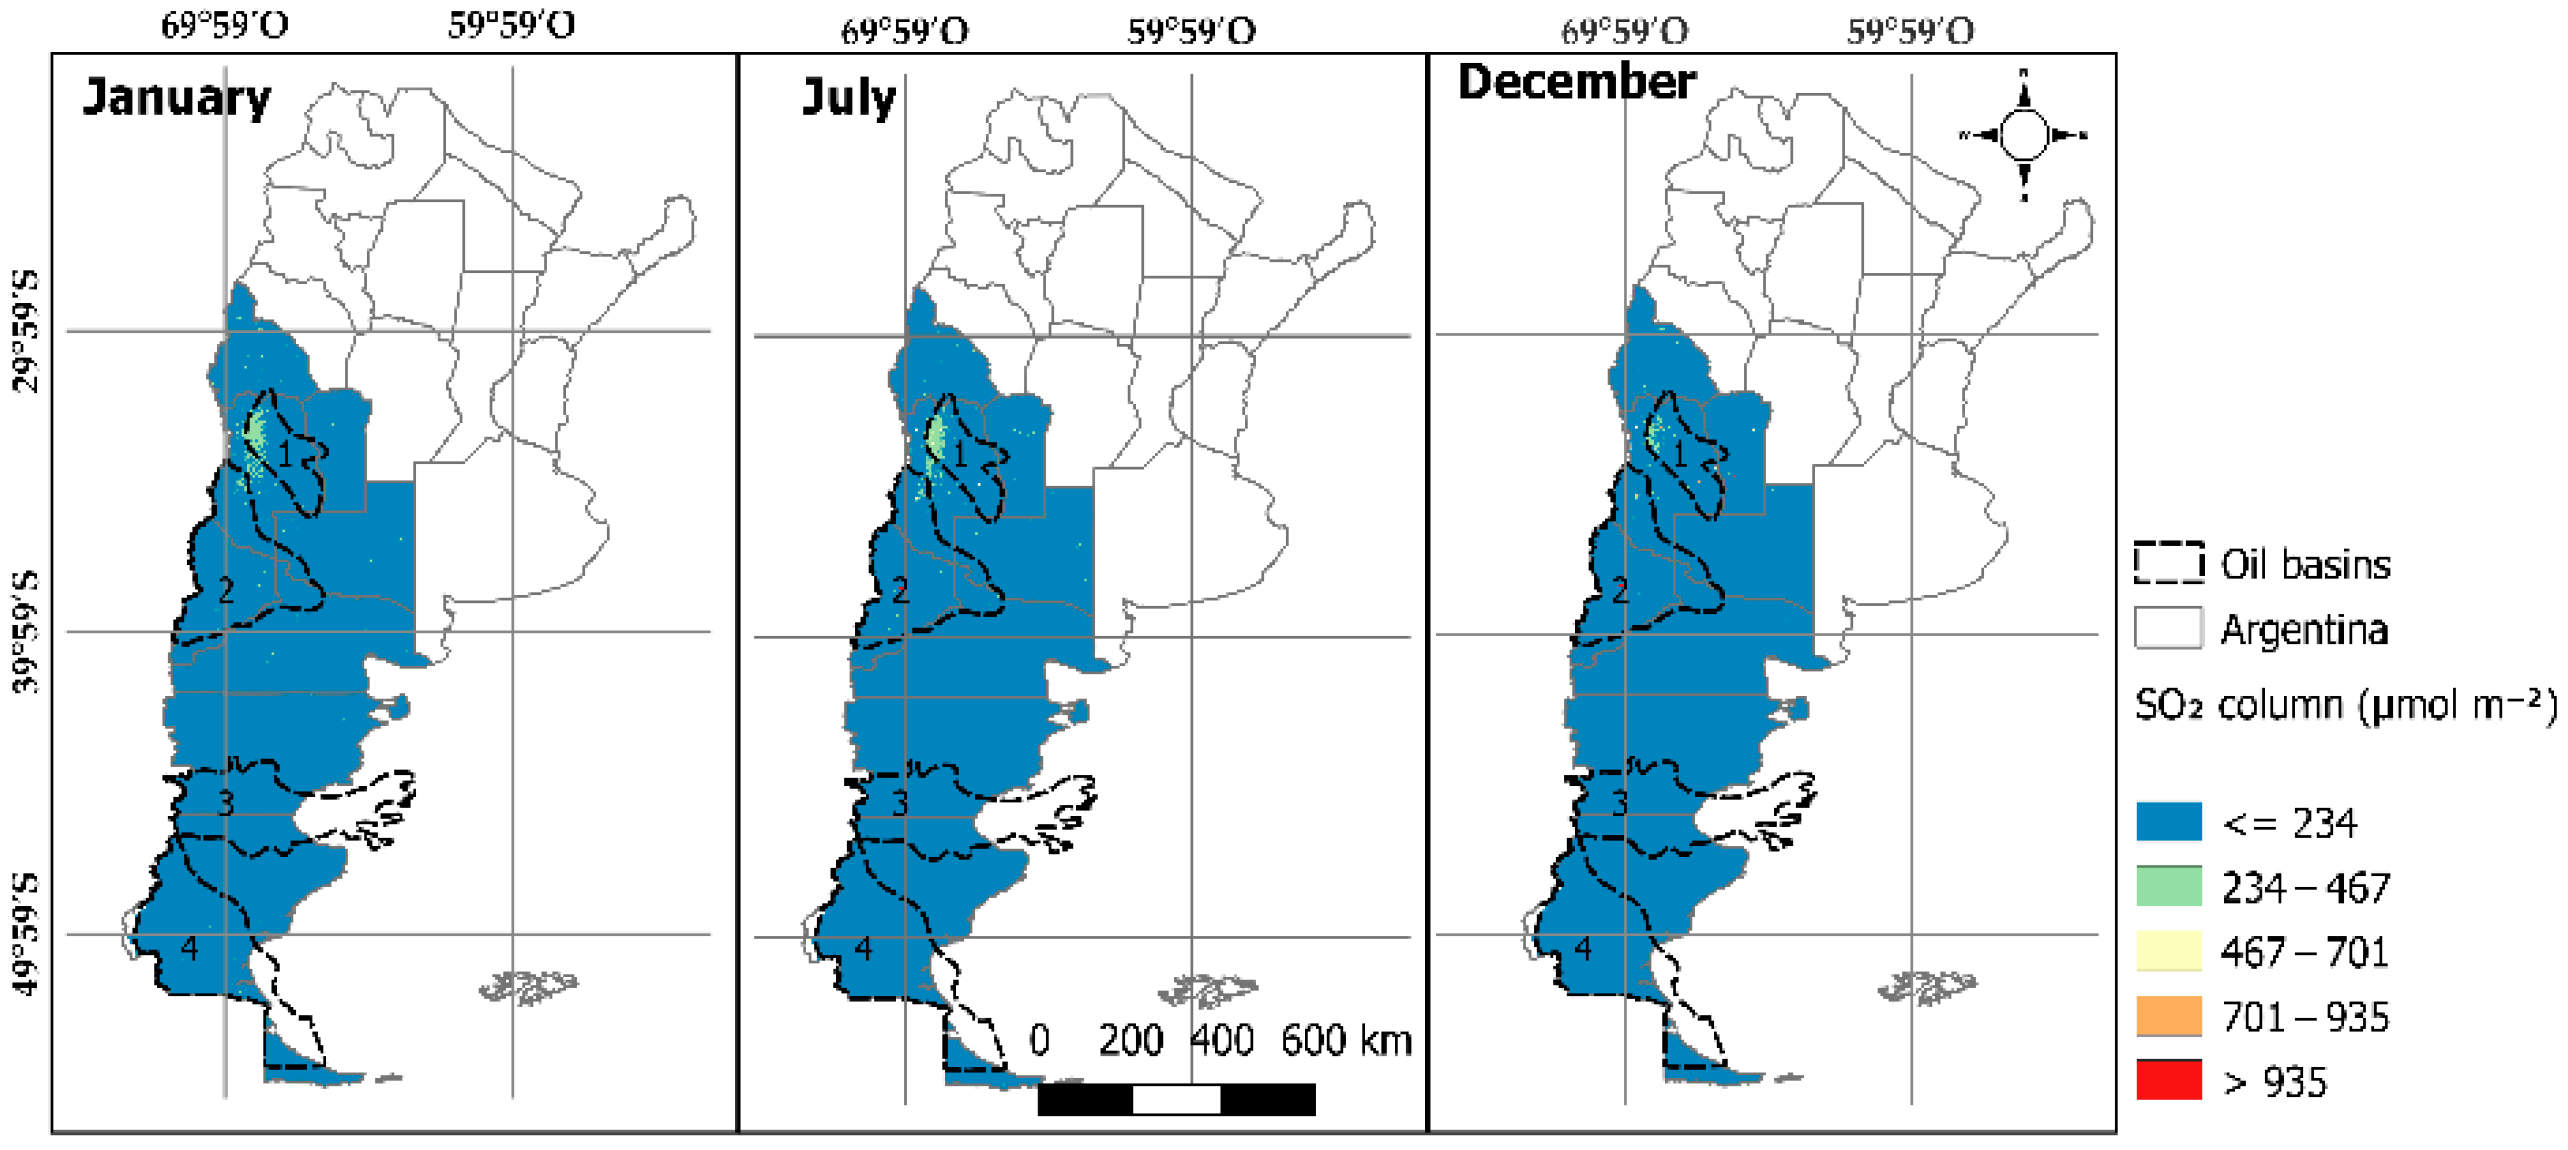
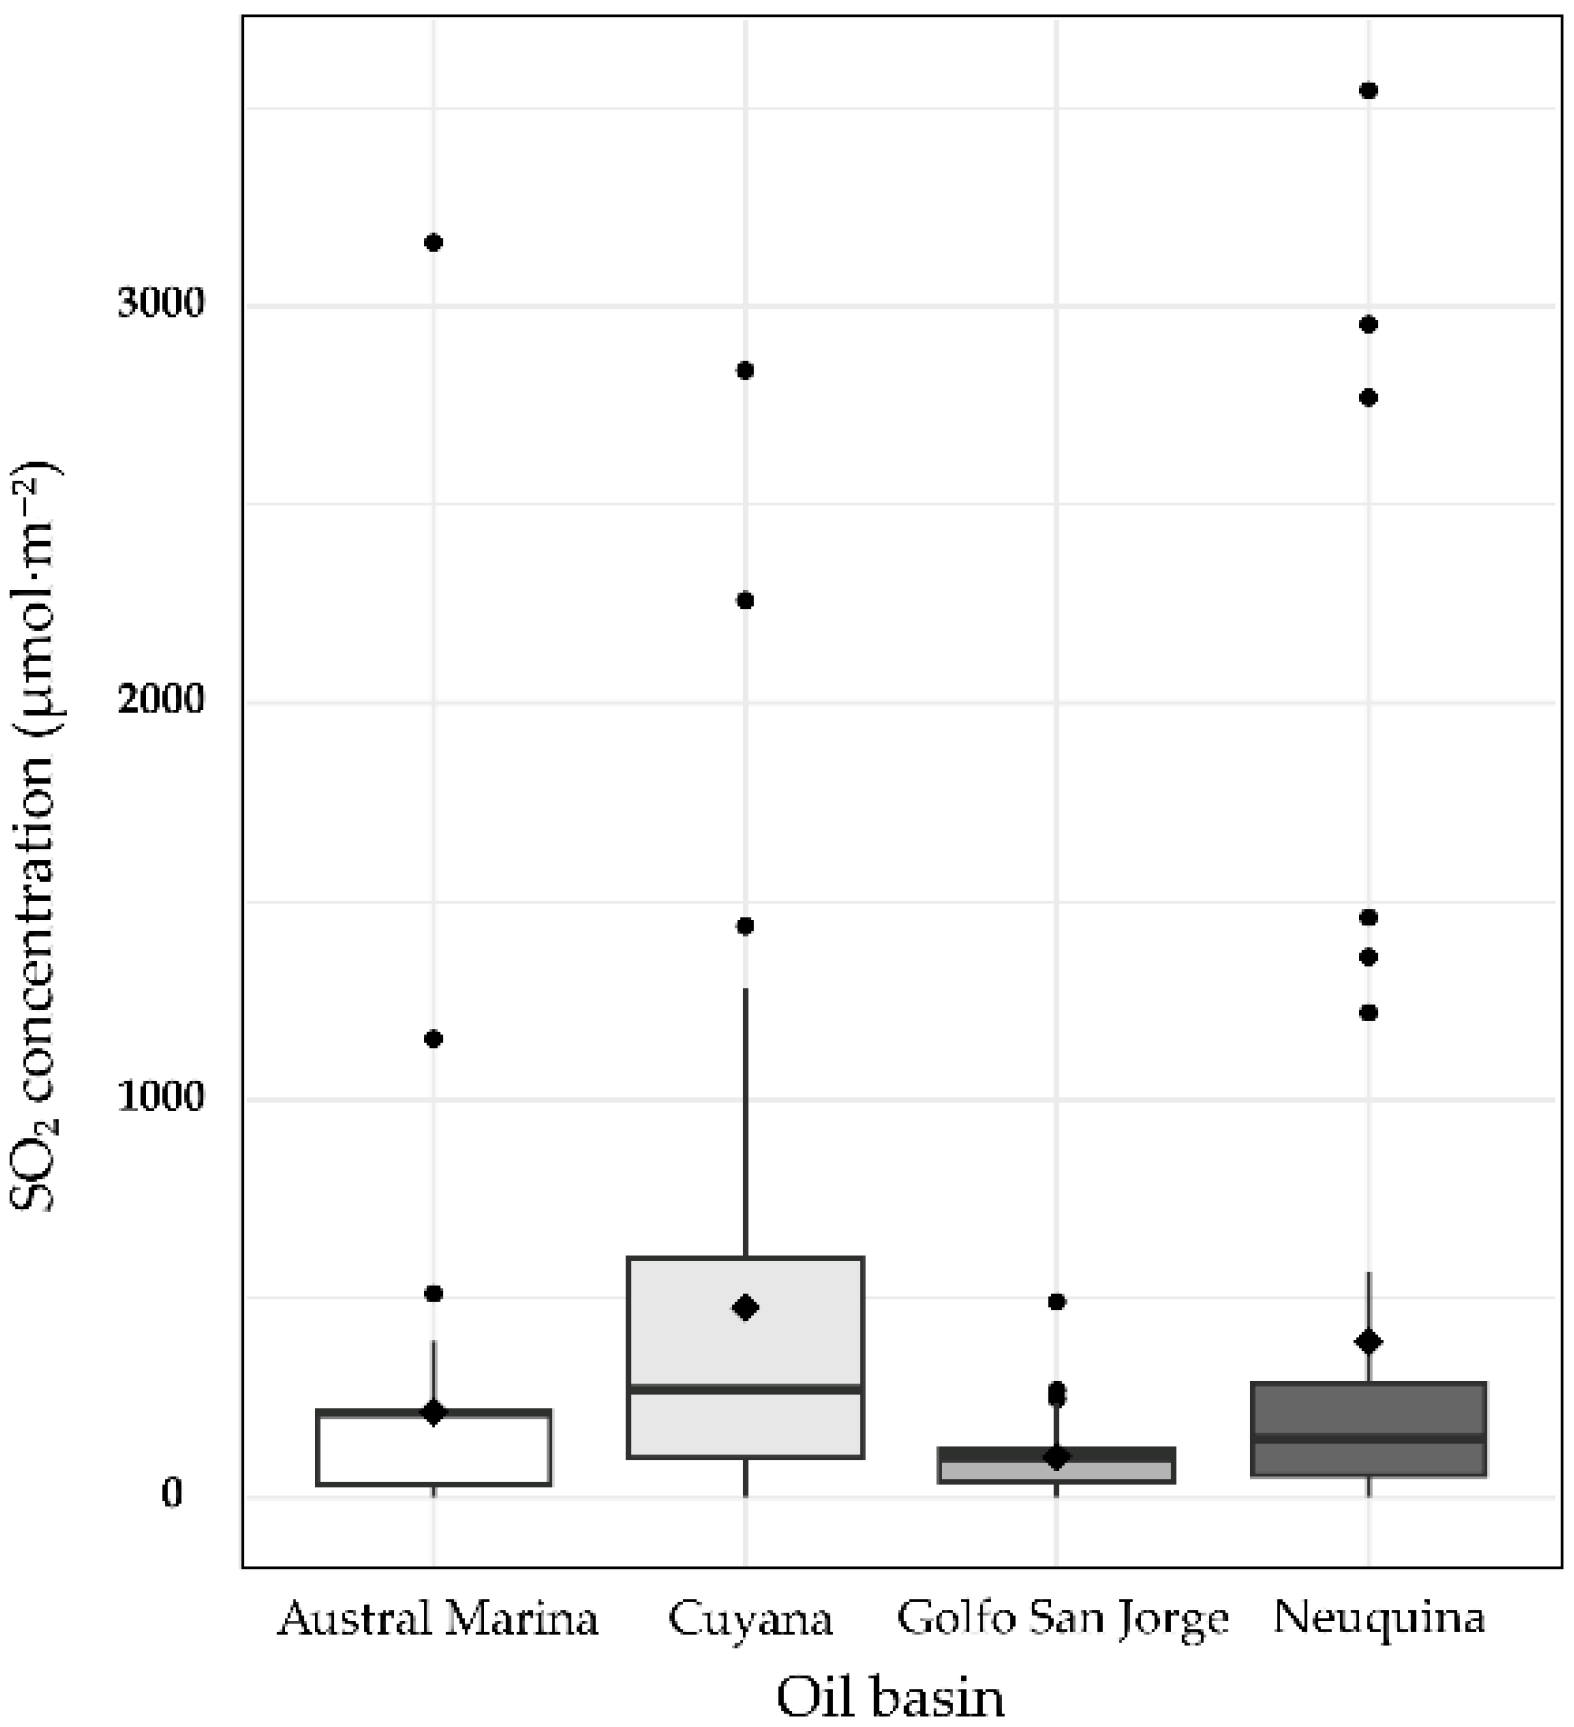
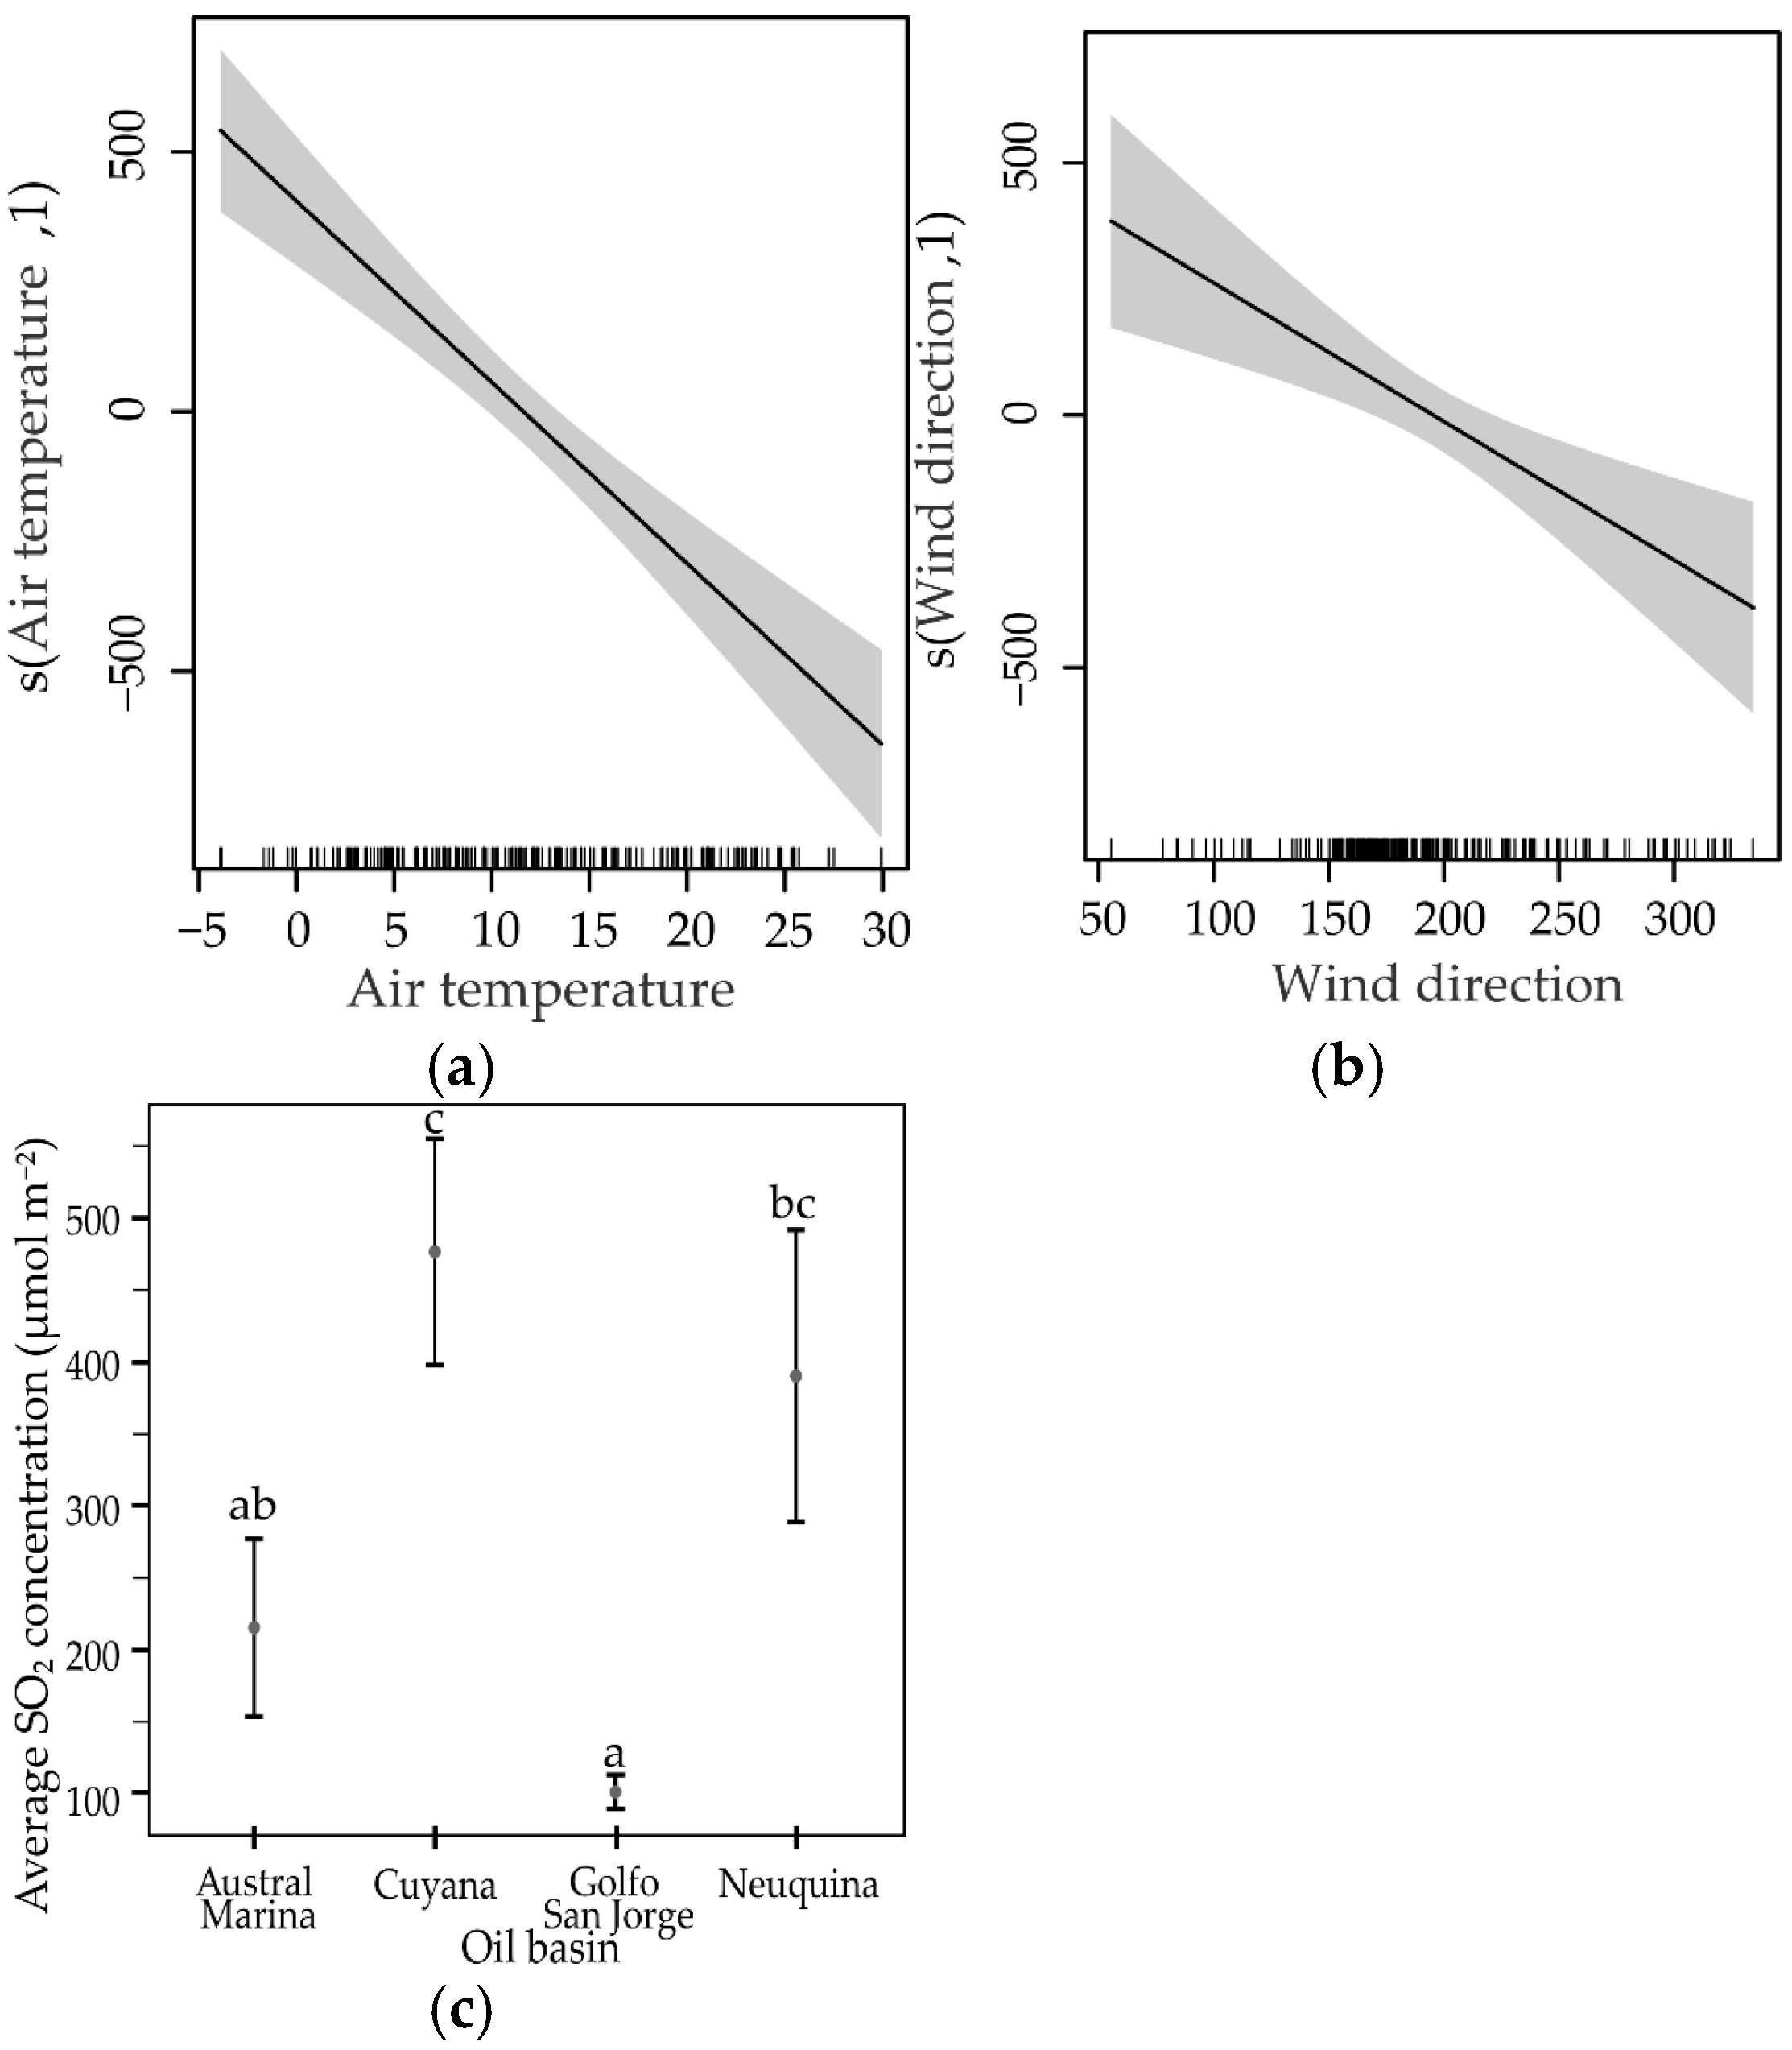
The average spatial distribution of SO2 across Argentina showed the highest concentrations in the Cuyana basin (476.67 ± 572.31 µmol·m−2), partially extending into the Neuquina basin (390.27 ± 738.92 µmol·m−2; Figure 5 and Figure 6). The Austral Marina and Golfo San Jorge basins showed considerably lower average values (215.31 ± 449.25 and 101.10 ± 86.38 µmol·m−2, respectively).
The weekly distribution of SO2 showed an increase in concentrations during May, June, and July, in contrast to the more stable values recorded during the rest of the study period. Between weeks 1 and 13 (summer), concentrations remained below 86 µmol m−2, representing a 68% decrease relative to the annual mean. From week 14 (early April), a progressive increase was observed, reaching an abrupt peak in week 25 (late June) with a maximum of 2762 µmol m−2, equivalent to a 923% increase compared to the mean. Subsequently, from week 27 onwards, concentrations decreased progressively, stabilizing again around or slightly below the mean during spring and summer (values between 150 and 250 µmol m−2, i.e., 7–44% below the mean) (Figure 7).
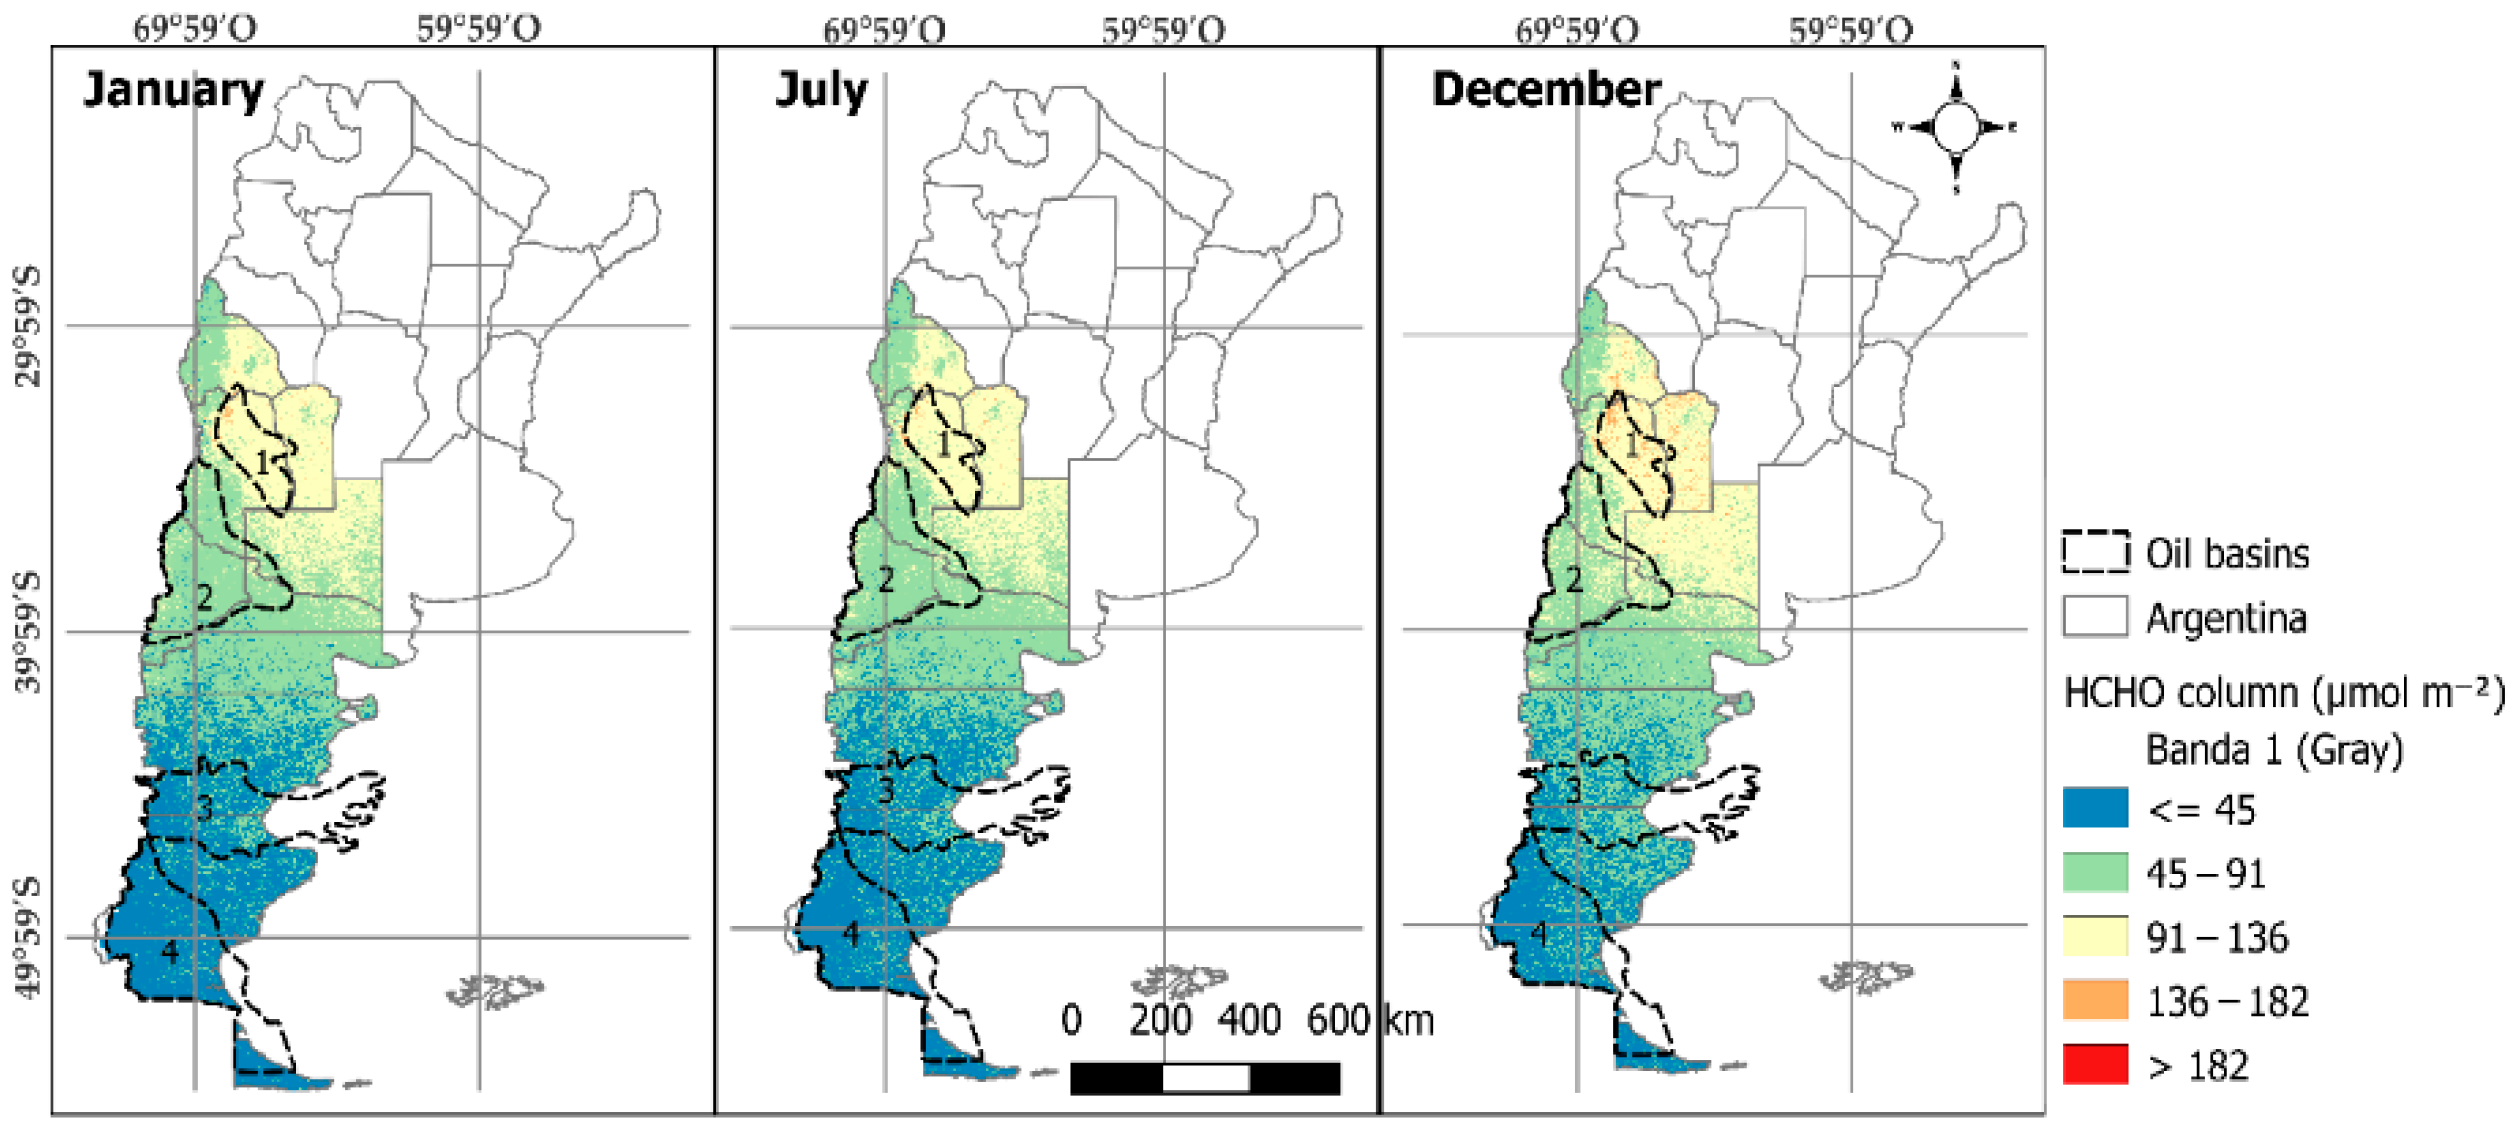
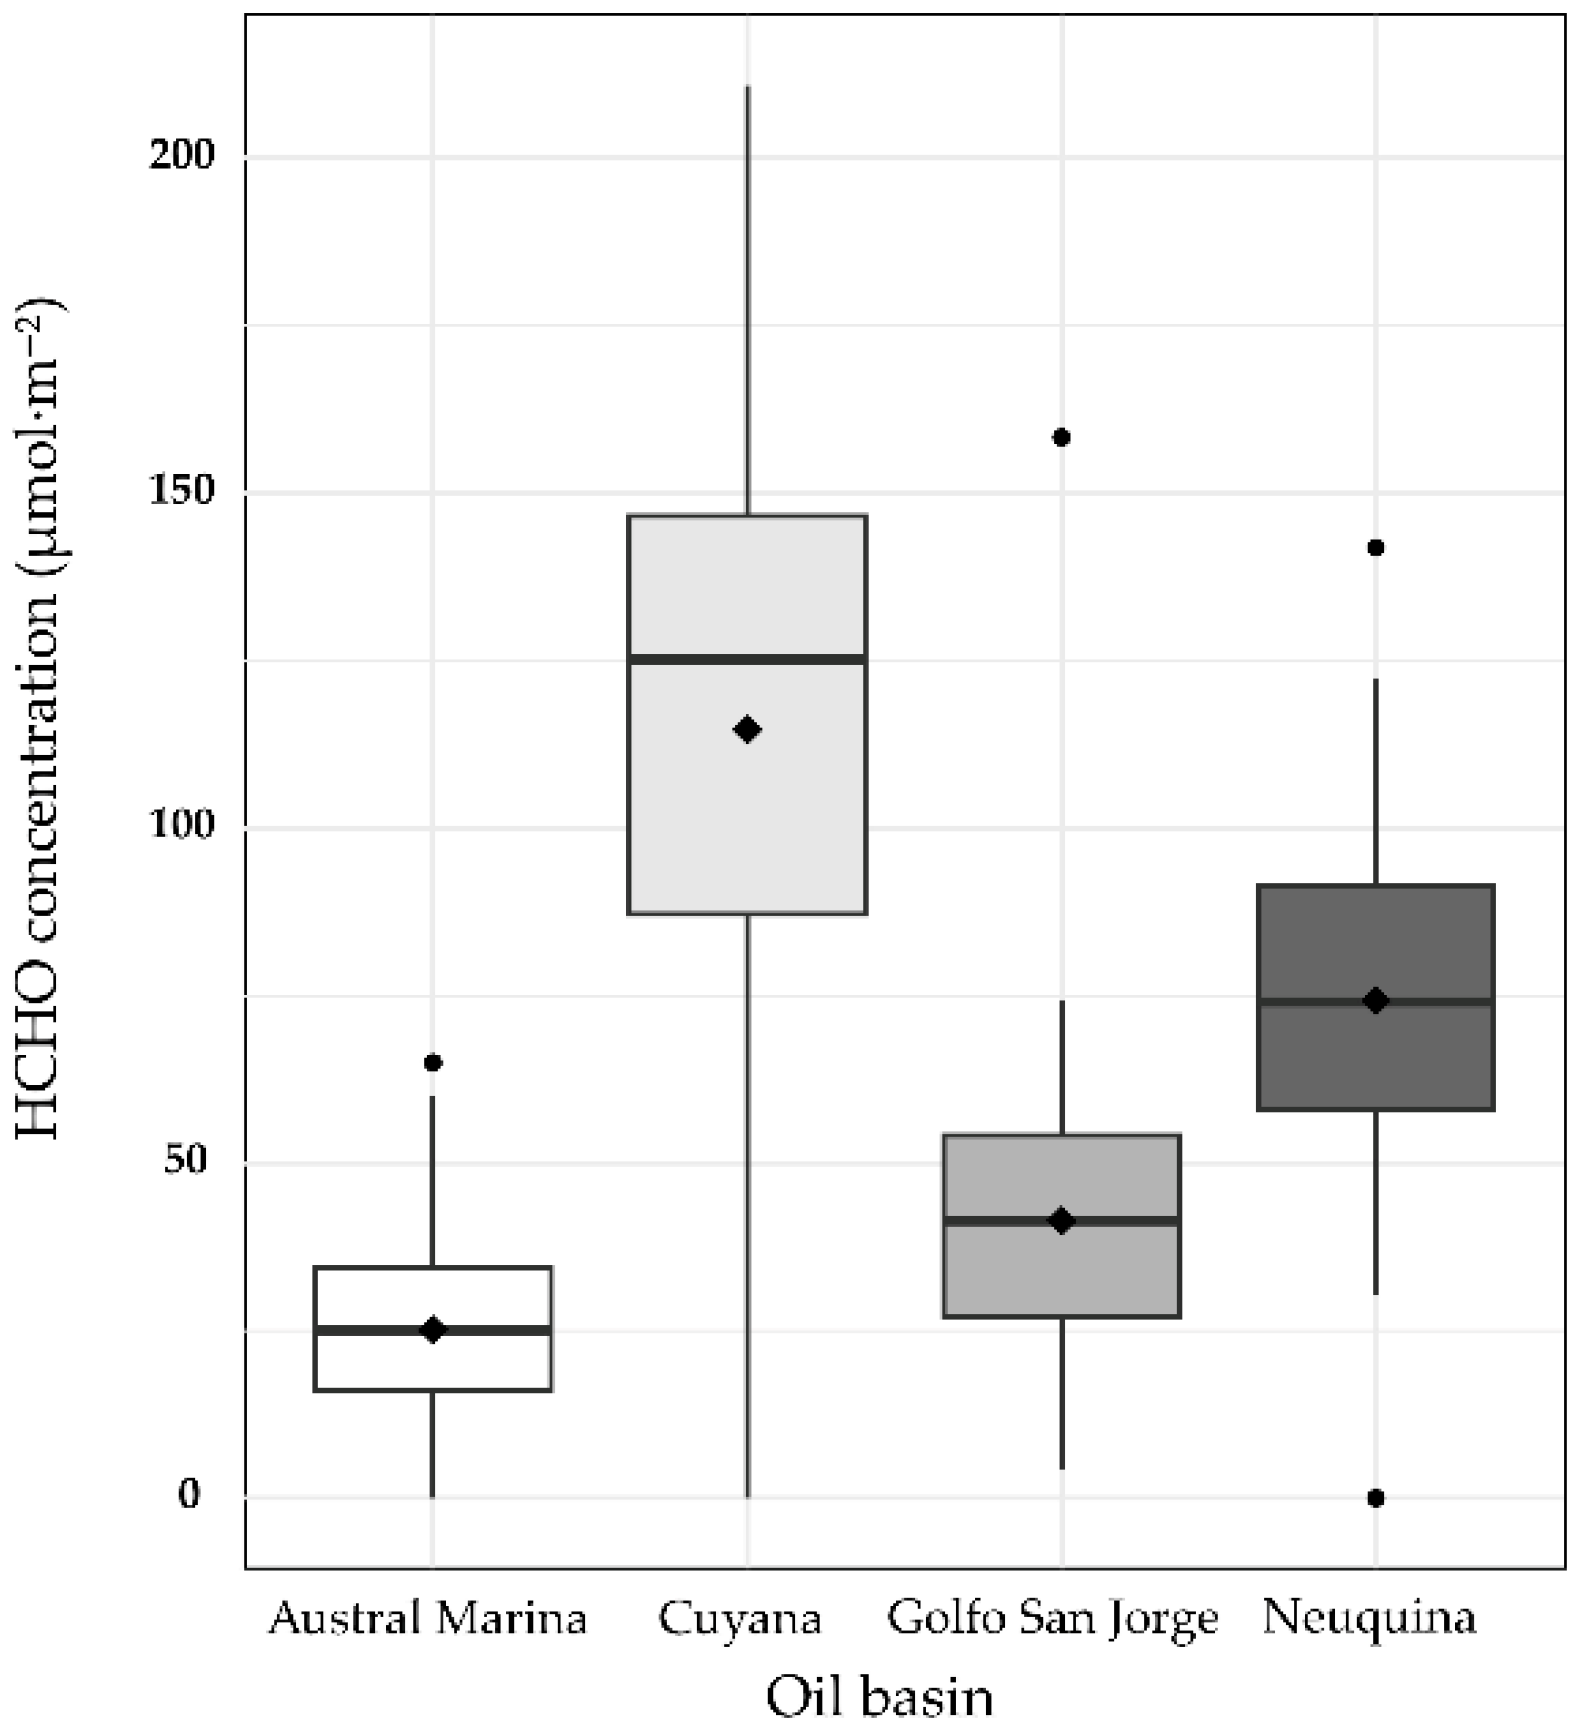
The spatial distribution of HCHO concentrations (µmol m−2) in Argentina during 2024 shows a defined pattern, with higher values in Cuyana and Neuquina basins (mean 114.66 ± 44.31 and mean 74.23 ± 26.71 µmol m−2, respectively; Figure 8 and Figure 9). The moderate to low values are found in the southern regions, especially in the Golfo San Jorge and Austral Marina basins (mean 41.42 ± 24.30 and mean 25.12 ± 17.00, respectively; Figure 8 and Figure 9).
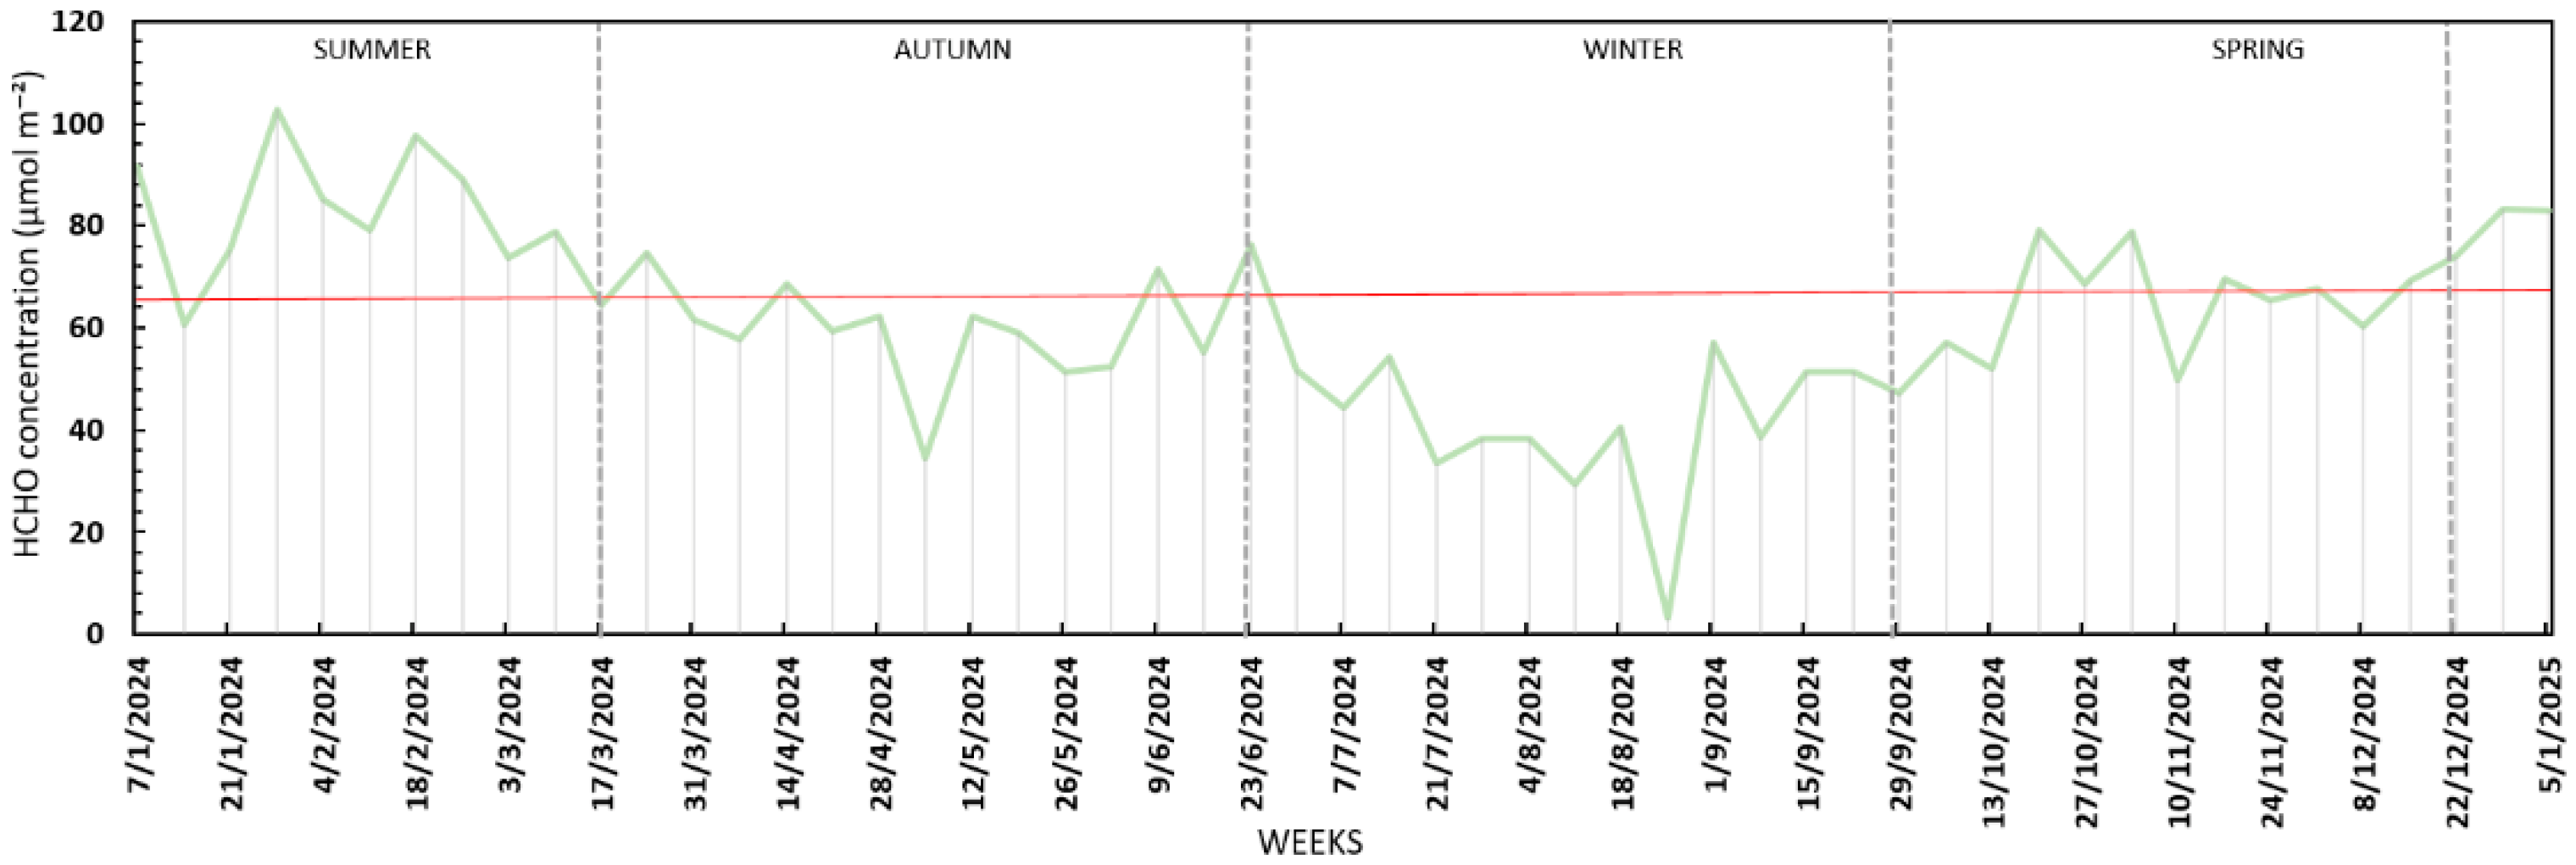
Throughout the year, concentrations varied notably across sampling points, with peaks during the warmer months (summer–spring) and minima in winter. Relative to the annual mean (61.92 µmol m−2), summer concentrations ranged from 5% and 67%, while autumn values decreased progressively up to 35%. Winter exhibited the strongest reduction, with concentrations up to 95% below the mean. After this minimum, levels increased again during spring (37% relative to the mean), reaching values comparable to those observed at the beginning of the year (Figure 10).
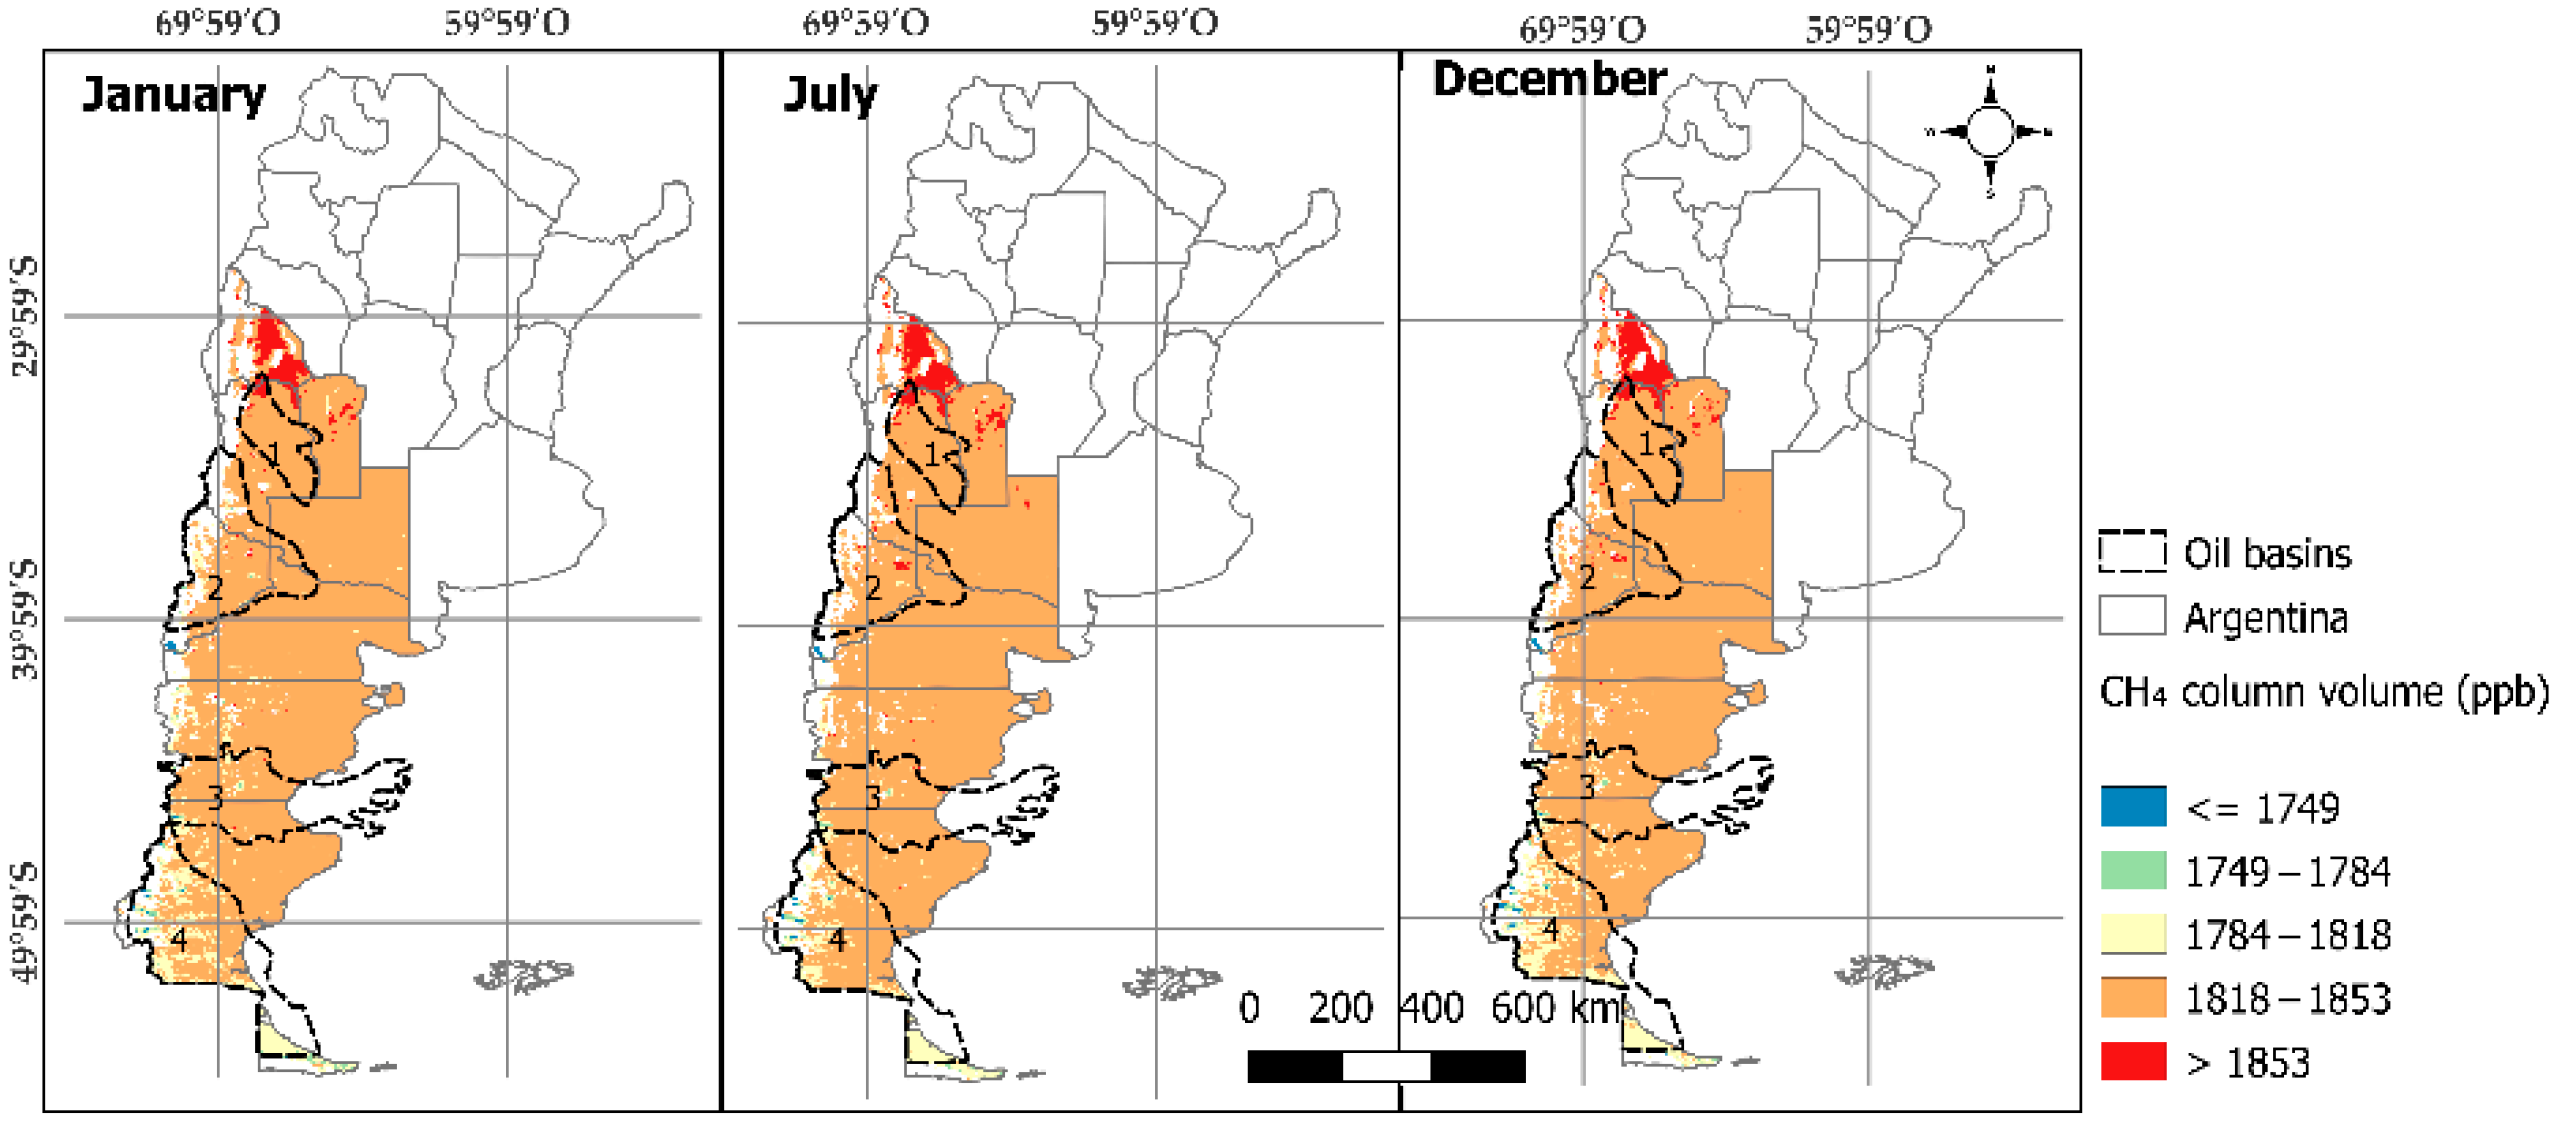
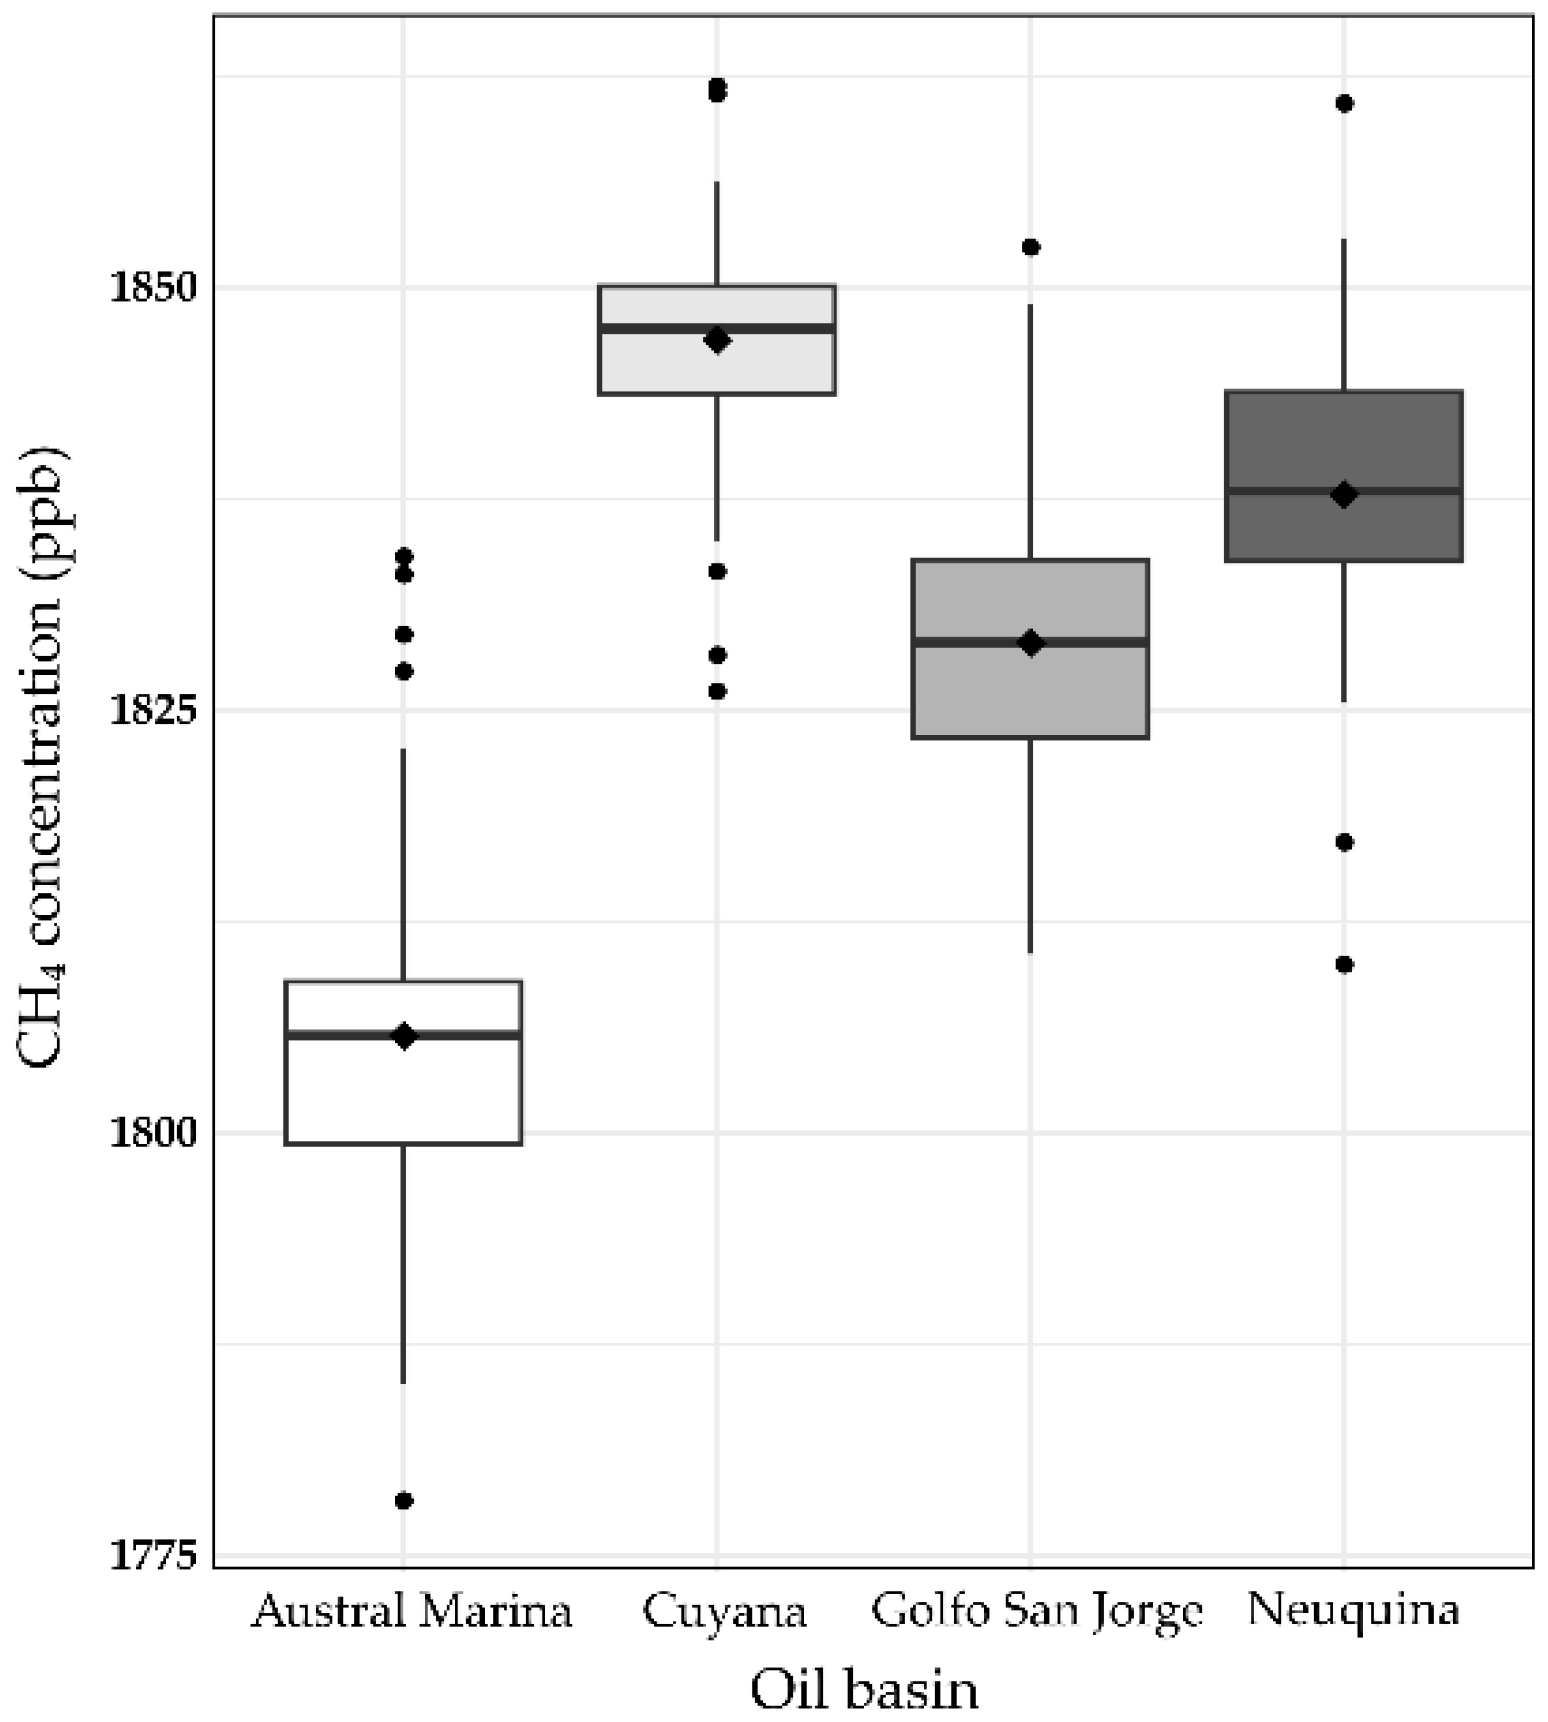
The spatial distribution of CH4 concentrations (ppb) in Argentina shows a relatively homogeneous pattern across most of the country, with intermediate values close to 1800 ppb (Figure 11). However, higher concentrations are recorded in the northwest and center-west regions, especially in the Cuyana basin (mean 1846.87 ± 7.08 ppb) and Neuquina basin (mean 1837.73 ± 8.80 ppb; Figure 12). In contrast, the lowest CH4 concentrations were observed in the extreme south of the country, particularly in the Austral Marina basin (mean 1805.73 ± 11.57 ppb) and most markedly in Tierra del Fuego province (Figure 12).
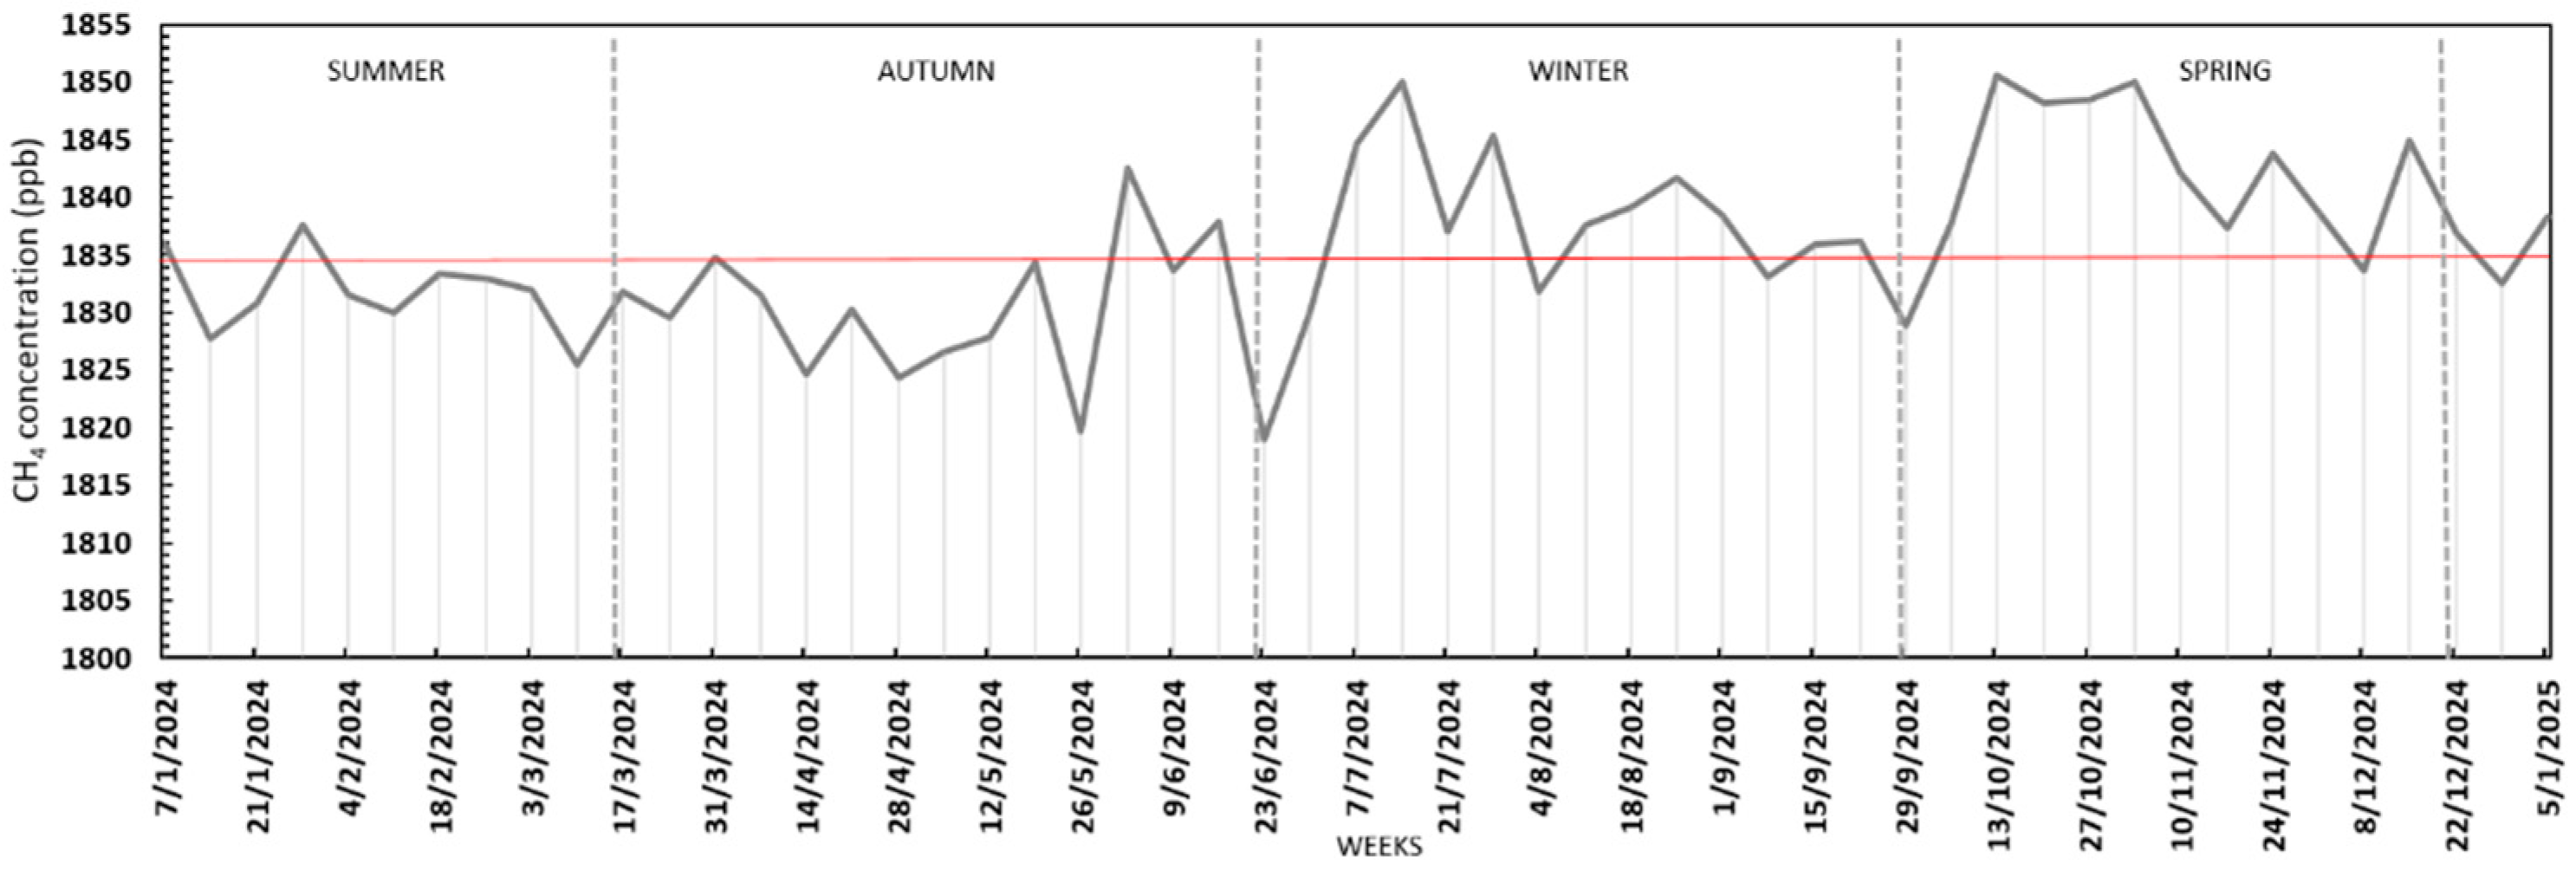
The evolution of average weekly CH4 concentrations recorded during 2024 shows great variability throughout the year, with frequent fluctuations that reflect an oscillating pattern. In other words, no sustained extreme peaks are identified; several relative maxima are distinguished towards the middle and last third of the year, interspersed with notable declines. Concentrations generally ranged from 1.7% below to 1.0% above the annual mean (1835.45 ppb), maintaining a relatively stable overall range (Figure 13).
The GAMM model applied to CO concentrations in the different Argentine oil basins (Figure 14a–d) shows significant differences between basins (p < 0.05), with the Cuyana basin presenting the highest concentrations, followed by the Neuquén basin (Figure 14d). No differences were found between them. Air temperature and atmospheric pressure showed positive and significant linear relationships with CO concentrations (p < 0.01; Figure 14a,b), while dewpoint presented a more complex nonlinear relationship (edf = 2.88, p < 0.01; Figure 14c).
In particular, a progressive increase in estimated CO concentrations was observed with increasing temperature, with a more pronounced effect above 20 °C. Similarly, atmospheric pressure exhibited an increasing pattern, associating higher CO concentrations with higher pressure values. In contrast, the dew point did not show a clear relationship with CO, remaining relatively stable throughout its range of variation. These results suggest that thermal and pressure variations exert a greater influence on CO dynamics than the humidity associated with the dew point.
The GAMM model for SO2 concentrations (Figure 15a–c) showed significant differences between the oil basins (p < 0.001). The highest concentrations were recorded in the Cuyana and Neuquina basins, which did not differ significantly from each other. The Cuyana basin presented the highest levels, while the Golfo San Jorge basin showed the lowest concentrations. The Austral Marina and Golfo San Jorge basins also did not present significant differences (Figure 15c). Air temperature and wind direction presented a significant linear relationship with SO2 (edf = 1, p < 0.001; Figure 15a,b). That is, as air temperature increased, SO2 concentration decreased. The smoothed effect of wind direction also showed a negative trend, although milder than that of temperature. Southwesterly winds were the most frequent in the study area. These included the Pampero (cold and dry) and the Sudestada (cold and humid), whose presence was associated with a decrease in SO2 concentrations. The adjusted R2 of the model was 0.306, which implies that it explains approximately 30% of the variability observed in the data.
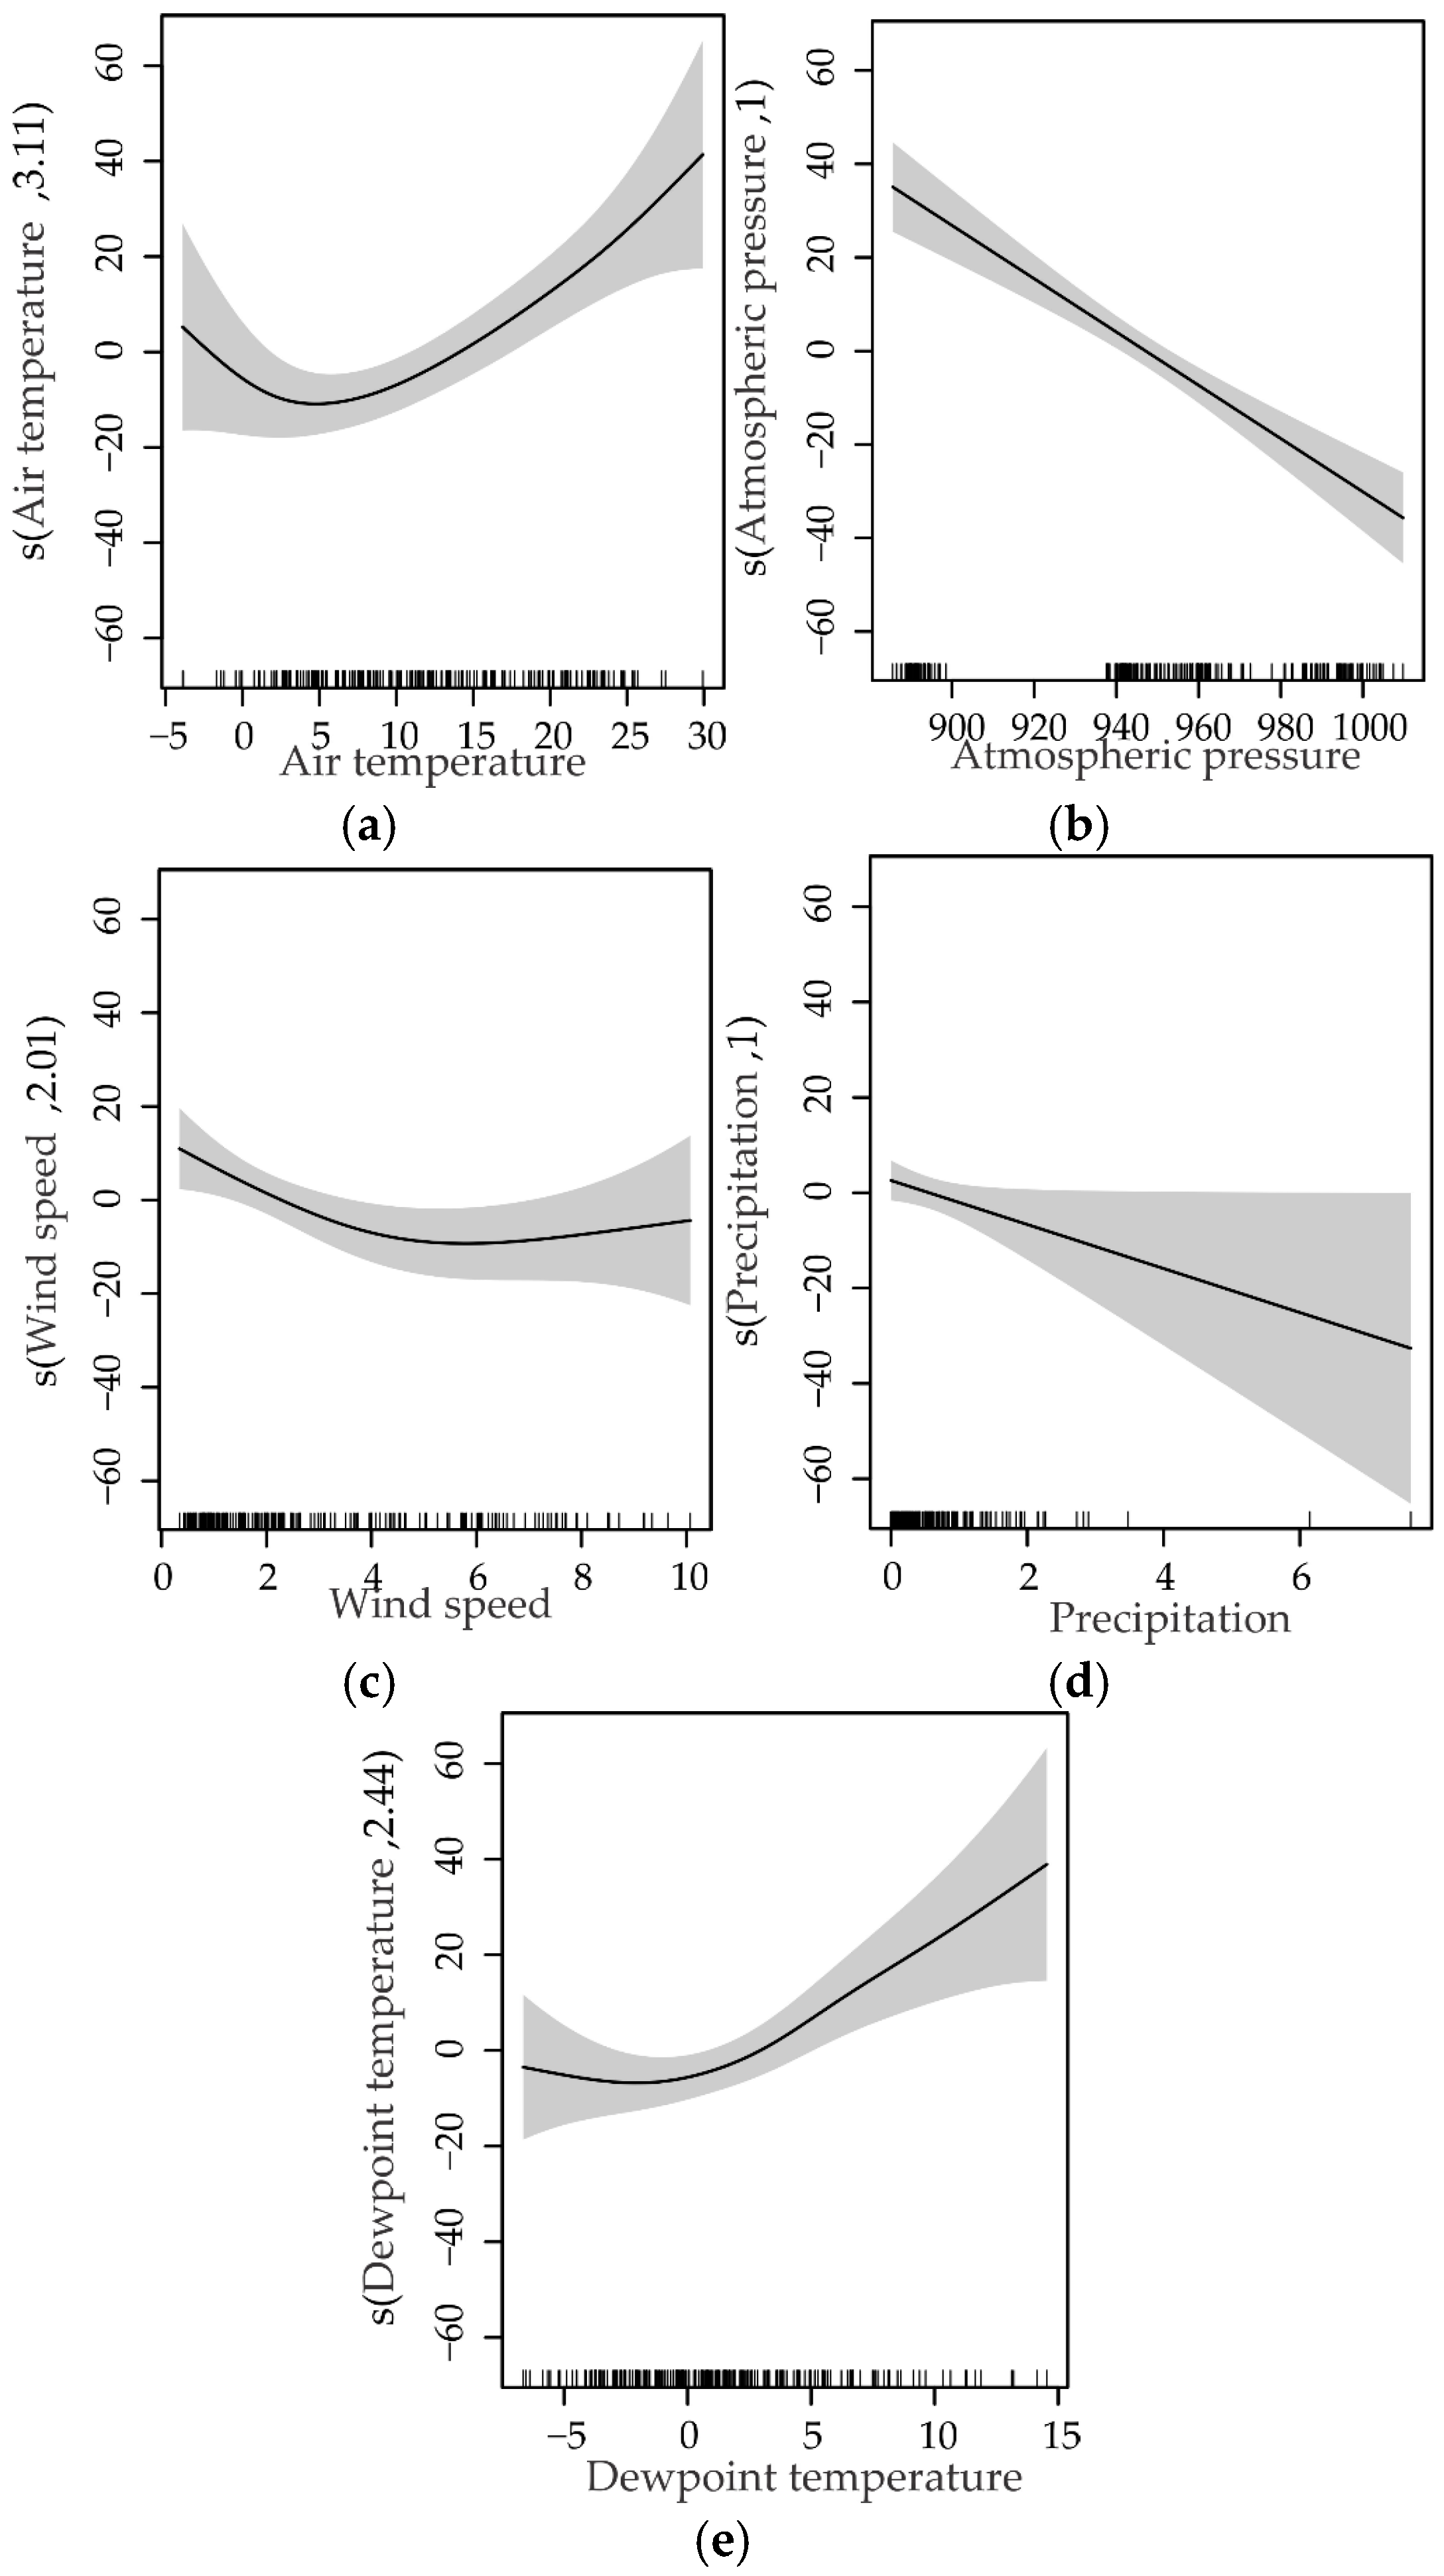
The GAMM model adjusted for HCHO concentration indicated that all climatic variables considered had a significant effect on pollutant concentrations (Figure 16a–e). Atmospheric pressure was the variable with the greatest effect (F = 60.96, p < 2 × 10⁻¹⁶; Figure 16b), followed by air temperature (F = 8.67, p = 2.15 × 10⁻⁵; Figure 16a). The model explained approximately 72% of the observed variability (adjusted R2 = 0.722), and all included predictors were statistically significant (p < 0.05). The relationships with air temperature (edf = 3.11), wind speed (edf = 2.01), and dewpoint (edf = 2.44) were nonlinear and complex (Figure 16a,c,e), while atmospheric pressure and precipitation showed negative linear relationships (edf = 1; Figure 16a,d). Both air temperature and dewpoint temperature exhibited a U-shaped pattern. That is, at moderate temperatures (~10–15 °C), the effect on HCHO concentrations is minimal or slightly negative (curve close to or below average). In contrast, at high temperatures (> 20 °C), the effect is positive, indicating an increase in pollutant concentrations. The dewpoint showed a similar behavior, since as the dewpoint temperature increased (especially above 5 °C), an increasing positive effect of HCHO contraction was observed. In contrast, wind speed presents a nonlinear effect, where a slight decrease in HCHO was observed as wind speed increases. Atmospheric pressure and precipitation show negative linear effects, suggesting that increases in these variables are associated with a decrease in pollutant concentrations (Figure 16a,d).
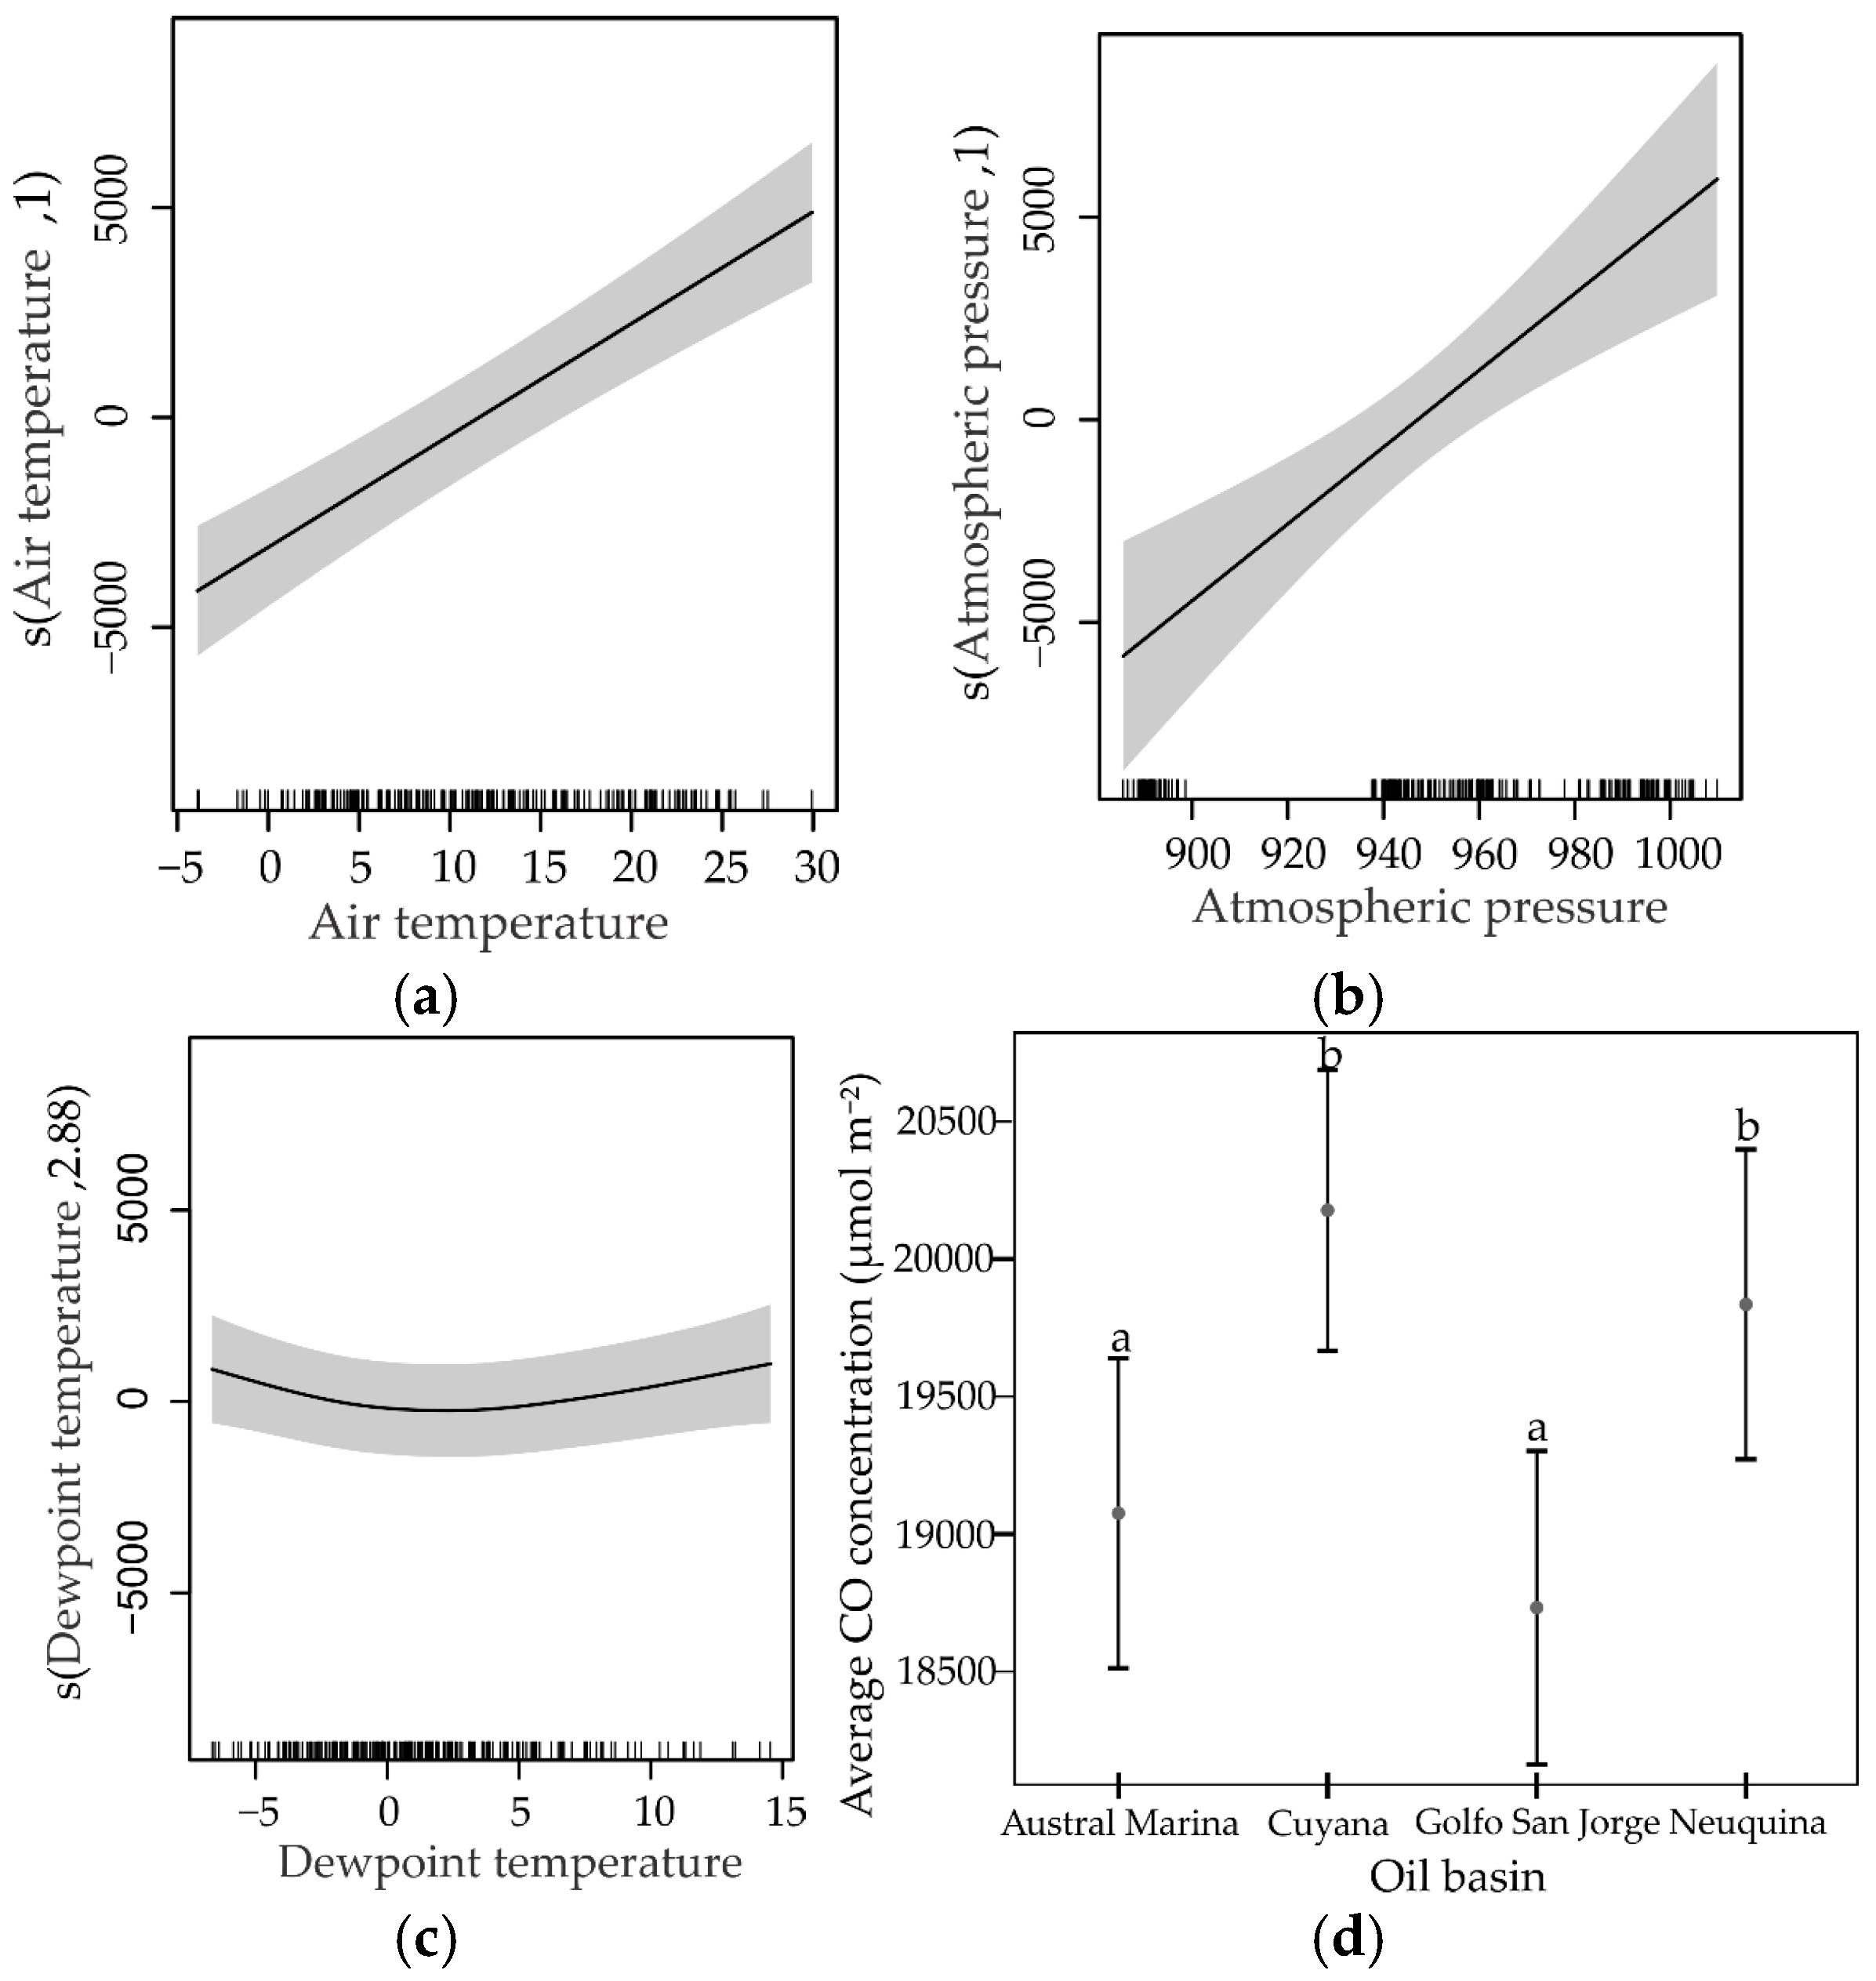
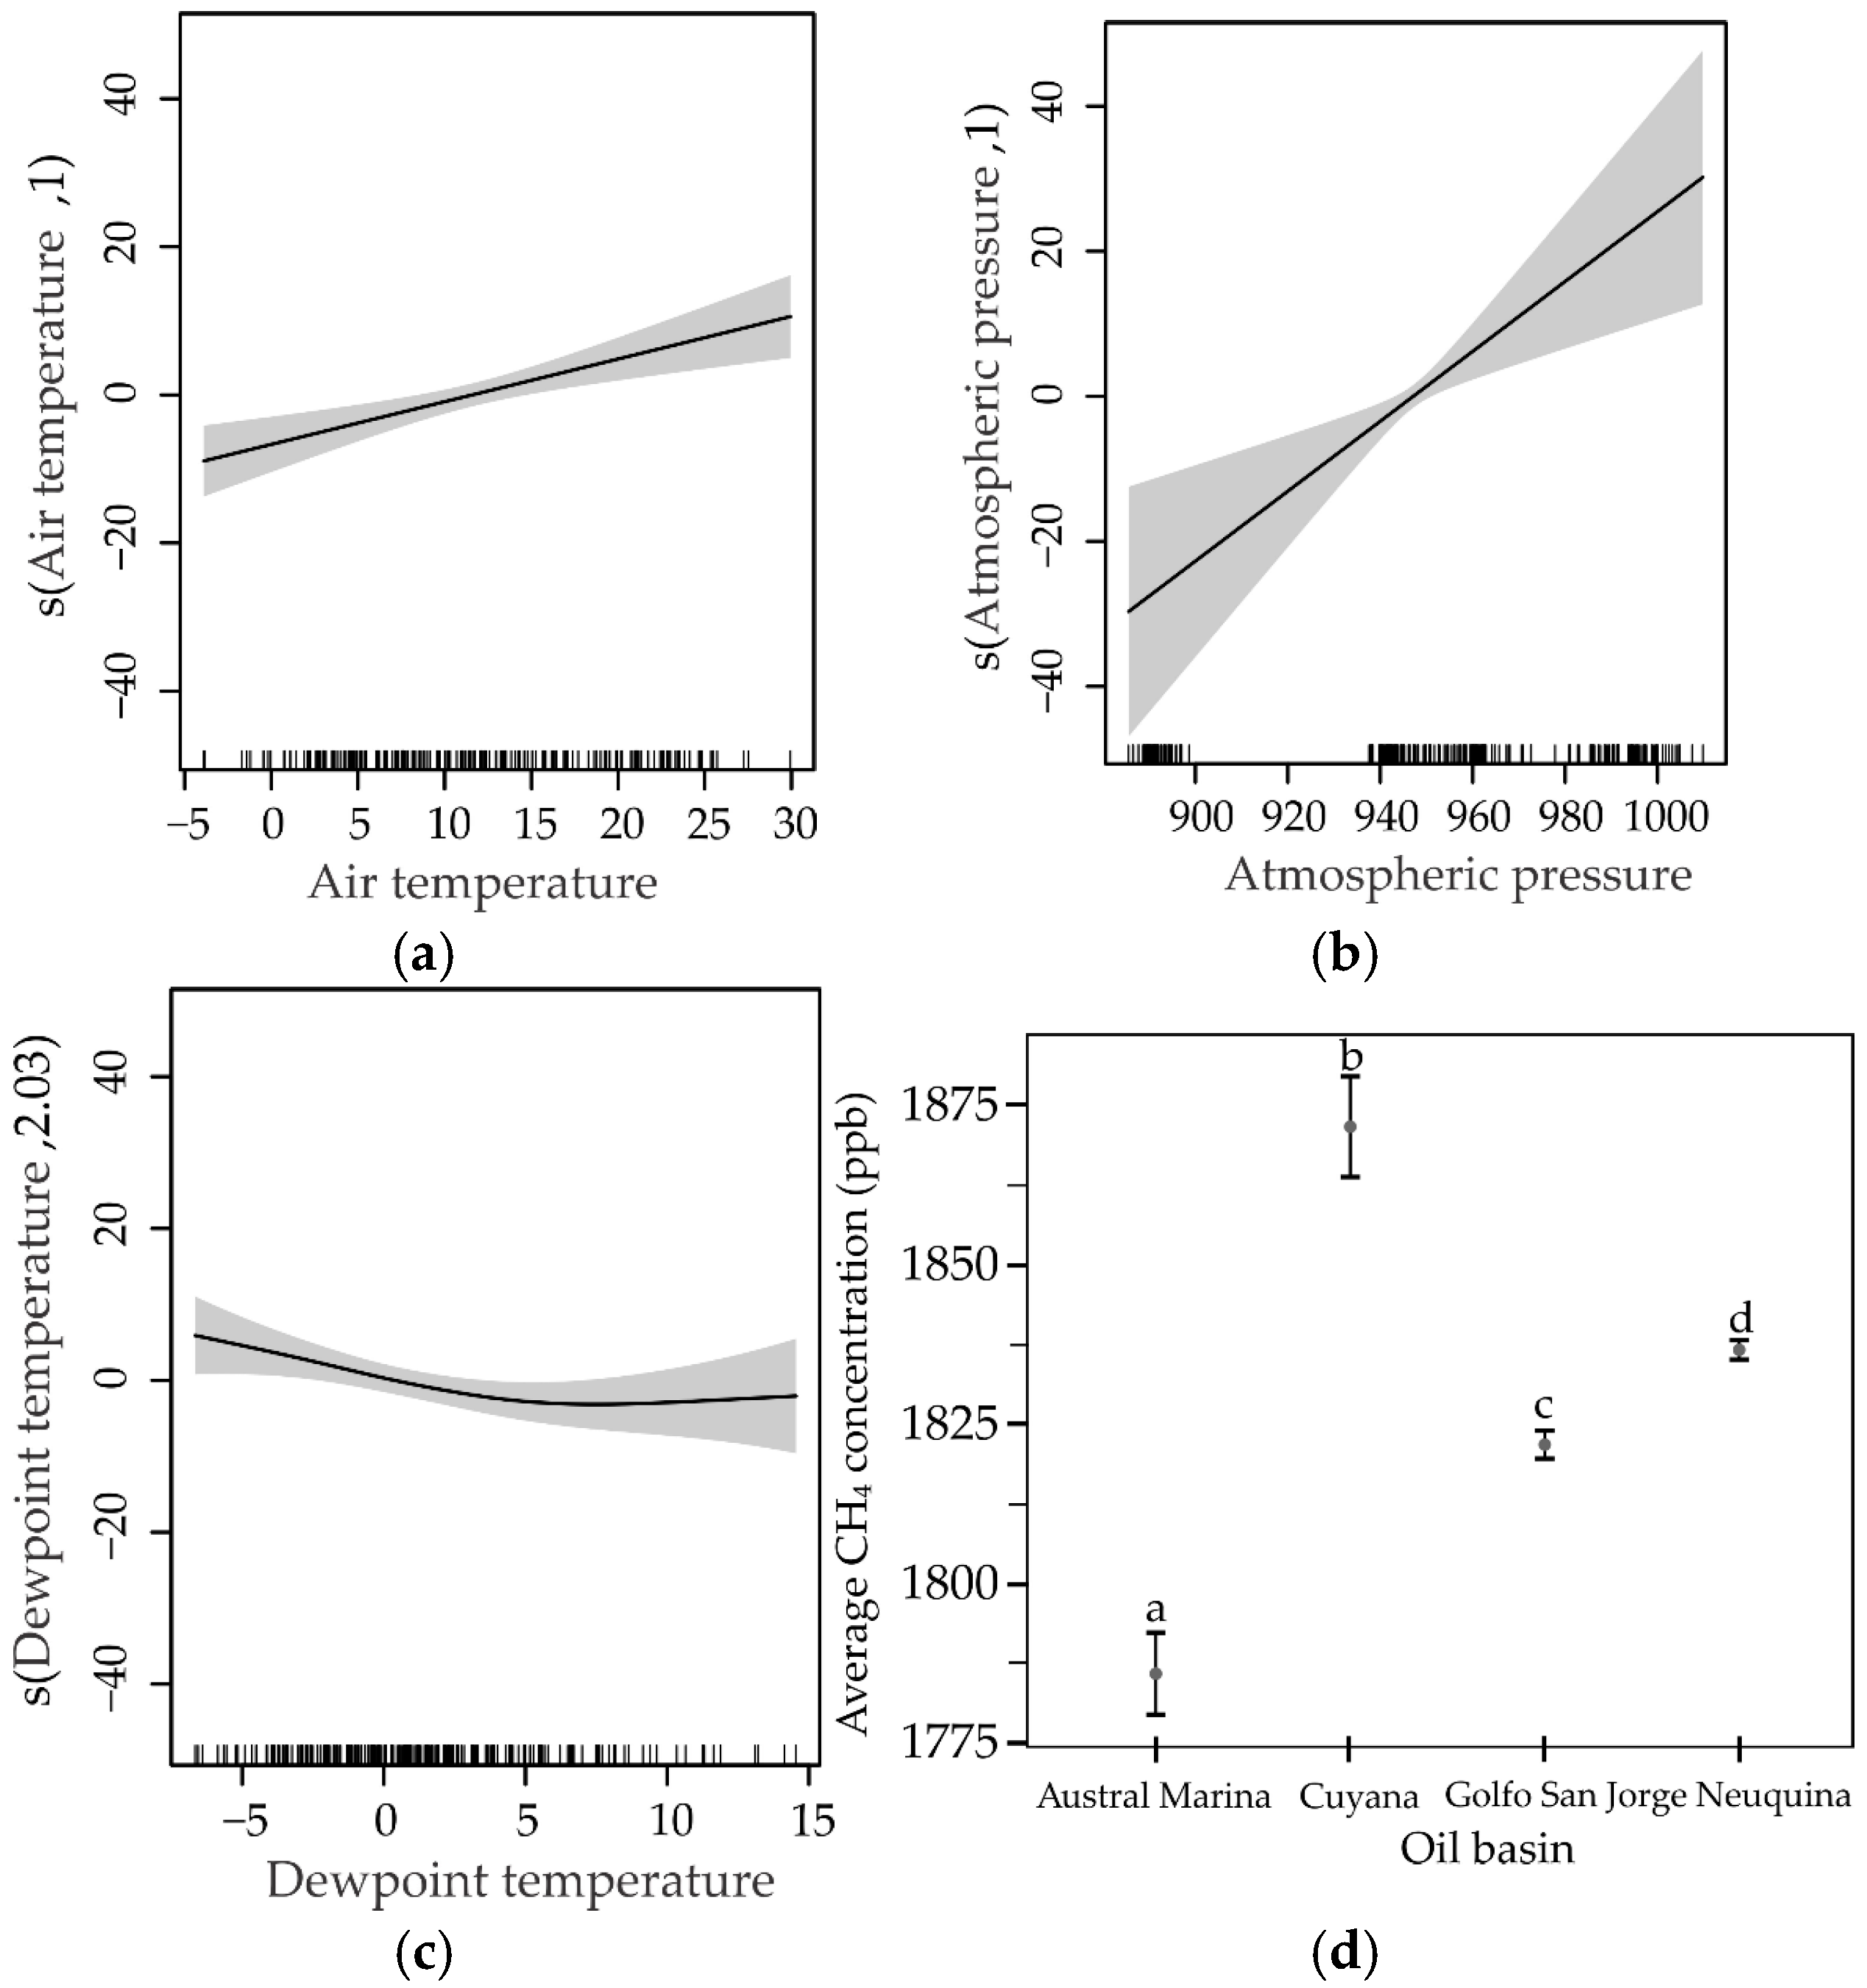
Figure 17a–d shows the results of the GAMM model applied to evaluate the effects of climatic variables on CH4 concentrations in different oil basins. Air temperature and atmospheric pressure exhibited significant and linear effects on CH4 (Figure 17a,b). In particular, air temperature showed a positive relationship, indicating that higher temperatures indicate higher CH4 concentrations. Similarly, atmospheric pressure showed a positive relationship with a steep slope, suggesting a marked increase in CH4 concentrations with increasing pressure. Dewpoint was also significant (edf = 2.034, p = 0.015; Figure 17c), but its relationship was nonlinear and showed a smoothed, low-amplitude curve, indicating a weaker or more variable effect. Regarding regional differences, the Cuyana basin had the highest CH4 concentrations, significantly higher than the rest, while the Austral Marina basin showed the lowest values (Figure 17d).

4. Discussion

The results obtained reveal clear spatial and temporal patterns in the concentrations of trace gases CO, CH4, SO2, and HCHO in Argentina’s main oil basins for the year 2024. The integration of satellite data with meteorological variables allowed for a better understanding of the dynamics of these pollutants in a complex environment influenced by oil activity and regional climatic conditions. A summary table showing the main variables that influence the high concentrations of the different pollutant gases and their effects on the environment and human health is presented below (Table 1).
The results showed that the concentrations of CO, SO2, and HCHO reached the highest values in the Cuyana and Neuquina oil basins. In particular, CO and HCHO presented a marked spatial gradient from north to south (Figure 2 and Figure 8), while SO2 showed higher levels in the Cuyana basin and part of the Neuquina basin (Figure 5). The spatial distribution of CH4 was relatively homogeneous in much of the territory, with values close to 1800 ppb (Figure 8). This homogeneity can be explained by the atmospheric lifetime of methane, of approximately 12 years, which favors its large-scale transport and mixing [21]. In contrast, the lowest concentrations of all pollutants were recorded in the Austral Marina and Golfo San Jorge basins (Figure 3, Figure 6, Figure 9 and Figure 12). The Neuquén basin is home to intense hydrocarbon exploitation and processing, with oil (~66%) and gas (~71%) being the main sources of national production. The presence of multiple industrial facilities, refineries, gas separation plants, and power generation units, along with routine gas flaring, constitutes a persistent and high-intensity source of pollutants [3]. The Cuyana Basin, on the other hand, contributes only ~2.4% of the national oil and ~0.1% of the national gas, suggesting that factors other than extraction volume explain its high pollutant levels. Among these factors, the age of the Mendoza infrastructure stands out, with deteriorated facilities that increase the risk of leaks during hydrocarbon production, transportation, and storage [22]. Areas such as San Rafael and General Alvear, with a history of oil activity and poor maintenance, could constitute emission hotspots [23]. Consequently, the lack of technological modernization and environmental control contributes to the increase in pollutant concentrations observed in these basins.
Regarding the temporal evolution of gases during the year 2024, it was observed that most of the gases studied presented concentration peaks. CO showed a sustained increase from autumn to spring, reaching a maximum in October that exceeded 30,000 µmol m−2 (Figure 4). For its part, SO2 showed a marked increase during autumn and winter, with a peak in June of 2761 µmol m−2 (Figure 7). HCHO concentrations were higher in the warmer months (spring-summer), registering values above 100 µmol m−2 (Figure 10, Table 1), results that coincide with those reported in Australia by Mayer et al. [24]. Finally, CH4 showed seasonal oscillations in the middle and end of the year, with peaks above 1850 ppb, although without extreme episodes (Figure 13). These seasonal peaks could be associated with periodic operations, such as well maintenance or controlled burns [25,26], leading to the need to monitor these areas separately. Recognizing these temporal patterns is key to designing more precise environmental management strategies and assessing the local and regional impact of the petroleum industry on air quality.
Furthermore, the spatial distribution of these pollutants could also respond to the north–south climate gradient and regional topography. In the Cuyana and Neuquén basins, the presence of intermontane valleys and orographic barriers favors atmospheric stability and pollutant retention, especially during winter temperature inversions [27,28]. In contrast, in the southern basins (Golfo San Jorge and Marina Austral), the cold, humid, and windy climate favors dispersion over the ocean and reduces the local accumulation of CO, SO2, and CH4 [29,30,31,32]. These regional differences also influence the formation of secondary pollutants: in the north, higher solar radiation and temperature drive the production of HCHO through the photooxidation of biogenic and anthropogenic VOCs [10,33,34], a process intensified in summer and amplified by vegetation emissions, as documented in South America and tropical regions [24,35]. In contrast, in the south, lower solar radiation and low temperatures limit photochemical activity, which reduces the formation of secondary pollutants such as HCHO. These natural conditions are compounded by anthropogenic factors, given that the southern basins have lower industrial and population densities, which contribute to lower pollution levels [36].
GAMMs showed that meteorological variables played a key role in modulating atmospheric pollutants in Argentine oil basins. For CO, air temperature and atmospheric pressure exhibited positive and linear effects (Figure 14a,b), reflecting that warm and stable conditions hinder dispersion and favor surface accumulation, sometimes enhanced by thermal inversions, as occurs in the Cuyana basin [37,38]. For SO2, temperature showed a negative relationship associated with greater dispersion and photochemical transformation in summer (Figure 15a), while wind direction reduced its concentrations, suggesting that dominant southwesterly flows contribute to its dispersion (Figure 15b). Its seasonal variability was expressed in winter peaks, linked to lower boundary layers, frequent thermal inversions, and higher fuel consumption, coinciding with observations in other oil regions such as the Tarim Basin and the Persian Gulf [39,40,41,42]. Regarding HCHO, atmospheric pressure and precipitation showed negative relationships (Figure 16a,b), while temperature, wind speed, and dew point presented nonlinear effects (Figure 16c–e). This suggests that extreme values of temperature and humidity increased their concentrations, in line with photochemical processes dependent on solar radiation and humidity, while precipitation and more intense winds favored their reduction [35,43,44]. Finally, for CH4, temperature and atmospheric pressure also exhibited positive and linear relationships (Figure 17a,b), indicating that warm and stable conditions not only hinder dispersion, but also intensify natural processes such as methanogenesis in soils and wetlands, consistent with what has been reported on a global scale [31,45,46].
Finally, the studied concentrations of CO, SO2, HCHO, and CH4 have relevant implications for both health and climate. CO, as a persistent tropospheric pollutant, impairs blood oxygenation and is associated with increased cardiovascular risks and hospitalizations for heart failure and angina [47]. SO2, due to its short lifetime (hours to days) and rapid chemical transformation, is primarily dependent on local sources and contributes indirectly to PM2.5 loads, a pattern documented in oil-producing regions such as the Tarim Basin, the Arabian Gulf, and eastern India [33,40,48]. HCHO, in addition to being a solar and humidity-sensitive secondary pollutant, is a Group 1 human carcinogen [49], linked to nasopharyngeal cancer, leukemia, and respiratory diseases [50,51,52], and its presence in oil basins represents a direct threat to public health; additionally, it can intensify chemical reactions that produce tropospheric ozone, another pollutant harmful to health and the environment [24]. In the case of CH4, its relevance focuses on the climatic sphere: as a short-lived pollutant with a global warming potential (GWP-20) 84 times greater than CO2 [53], even moderate increases in Argentine basins contribute significantly to radiative forcing, linking local emissions with international commitments such as the Global Methane Pledge [54]. Its intra-annual variability can be related to emissions of organic waste, agricultural practices in rural and peri-urban areas, wetlands, and fires, in accordance with South American studies [31,55]. Overall, the high concentrations observed in Cuyana and Neuquina basin, especially, indicate critical points where natural, anthropogenic, and topographical factors converge, posing a dual challenge: reducing emissions to mitigate their climatic effects (particularly CH4- and SO2-derived sulfates) and protecting the health of local populations from toxic pollutants such as CO and HCHO.

5. Conclusions

The results of this study reveal that the spatial and temporal dynamics of atmospheric pollutants in Argentina’s main oil basins are strongly modulated by both hydrocarbon activity and meteorological conditions. The four pollutants (CO, SO2, HCHO, CH4) presented different spatial and temporal behaviors, which were consistently higher in Cuyana and Neuquén basins and lower in the austral. These patterns reflect the combined effect of outdated infrastructure, maintenance deficiencies, and climatic modulation beyond extraction volume. The positive associations of CO and CH4 with temperature and pressure indicate that atmospheric stability plays a central role in pollutant accumulation, whereas SO2 displayed an inverse relationship with temperature, reflecting its rapid conversion to sulfates under photochemically active conditions. HCHO, as a secondary pollutant, showed nonlinear responses to climatic variables, consistent with its dependence on VOC oxidation and biogenic emissions enhanced under warm, humid conditions.
These results provide detailed, basin-specific data demonstrating that CO and CH4 concentrations were higher in Cuyana and Neuquina compared to southern basins, while SO2 and HCHO showed more complex patterns influenced by local meteorology.
These findings underscore the importance of considering both spatial and climatic factors to understand the dynamics of pollutant gases in oil environments. In contrast, southern basins, such as the Marina Austral and Golfo San Jorge, showed lower concentrations, likely due to their cooler and windier climates that favor dispersion processes. Temporarily, most pollutants peaked during 2024, highlighting the need for specific operations such as well maintenance or controlled flaring. These findings confirm that the industry’s challenge is not limited to producing energy, but also ensuring that such production is compatible with air quality and the health of the population.
The application of GAMMs was essential for this study, as it allowed the identification of both linear and nonlinear relationships between meteorological variables and pollutant concentrations that would not be detectable through conventional statistical approaches. By capturing complex interactions, the GAMM framework provided a robust, high-resolution understanding of pollutant behavior, revealing that atmospheric variables, particularly temperature, pressure, and wind patterns, are key drivers of dispersion and accumulation. Specifically, GAMMs demonstrated that atmospheric stability under high-pressure systems and elevated temperatures promotes the accumulation of CO and CH4, whereas SO2 and HCHO exhibit more complex behaviors shaped by photochemical reactions and atmospheric dispersion processes. This detailed, model-based understanding is necessary for designing targeted environmental management strategies, prioritizing mitigation measures, and integrating climate-sensitive operational planning in hydrocarbon basins.
A key limitation of this work is the lack of ground-based validation for the satellite data within the study area. Although TROPOMI products are globally validated, local biases from surface properties or atmospheric conditions remain unquantified, particularly for SO2 and HCHO. Thus, reported values indicate relative spatial patterns and trends rather than absolute concentrations. Future studies should establish ground-monitoring campaigns in these critical regions to locally validate satellite retrievals and reduce uncertainty.
From a sustainability perspective, these results highlight the urgent need to align hydrocarbon extraction with environmental and social responsibility. Achieving sustainable development in the energy sector requires not only reducing direct emissions through modernized infrastructure and flare reduction but also implementing basin-specific management strategies that account for local meteorological and geographical conditions. The integration of high-resolution satellite monitoring with climate data provides a transparent, science-based pathway toward decarbonizing operations, safeguarding community health, and ensuring that resource exploitation does not compromise ecological integrity or climate goals.
In particular, the study contributes new knowledge by quantifying how atmospheric stability under high-pressure systems and elevated temperatures promotes CO and CH4 accumulation, while SO2 and HCHO behave differently due to photochemical reactions and atmospheric dispersion. This contributes to a more nuanced understanding of pollutant behavior in oil basins, which is essential for evidence-based policy and operational decision-making.
In summary, these findings emphasize that the environmental impact of the oil industry depends not only on extraction volumes but also on infrastructure condition, geography, and meteorological factors. Recognizing these drivers is essential to designing environmental management strategies that combine GAMM-based modeling, satellite monitoring, climate data, and in situ measurements to reduce air pollution risks effectively.
Implementation policies include various actions that can be structured as a roadmap, which organizes priority actions in the short, medium, and long term. Its purpose is to guide policymakers and the productive sector towards a management model that combines technological modernization, emissions reduction, and alignment with international commitments, while ensuring the protection of community health and environmental integrity.
Short term (1–3 years). The following is proposed: A) Basic modernization of critical infrastructure, e.g., repair and maintenance of wells and pipelines with a higher risk of leaks; implementation of routine emissions and safety controls in facilities with obsolete infrastructure; and reduction in gas flaring. B) Monitoring and transparency, e.g., implementation of initial MRV systems with satellite sensors and in situ stations, regular publication of emissions data to promote transparency and public confidence, and incentives for companies to adopt these policies.
Medium term (4–7 years). Expected: A) Comprehensive implementation of clean technologies, for example, by installing CH4 capture, compression, and reinjection systems, replacing obsolete equipment and technologies with energy-efficient systems. B) Differentiated environmental management by basin, through the design of mitigation plans according to the climatic and geographical conditions of each basin (e.g., Neuquén vs. Austral) and the integration of atmospheric model and GAMM data into operational planning. It also proposes strengthening institutional capacities through training, inspection teams, and the creation of a national observatory for emissions in hydrocarbon basins.
Long term (8–15 years). Expected outcomes: (A) Structural transformation towards low emissions, such as zero burning in all basins and the use of renewable energies for auxiliary operations in the fields. (B) Long-term socio-environmental sustainability, seeking to ensure that the benefits of exploitation translate into improvements in public health and quality of life for local communities, as well as implementing environmental compensation and ecological restoration mechanisms in impacted areas.
In a global context where the energy transition is increasingly urgent, these results reinforce that sustainability is not a limit to development but a necessary condition to ensure that oil wealth translates into long-term environmental, social, and public health benefits, particularly when guided by robust tools such as GAMMs for informed decision-making. Importantly, the application of GAMMs in this study represents a methodological contribution, providing the analytical rigor necessary to support evidence-based strategies for pollutant management and sustainable hydrocarbon operations.

Author Contributions

Conceptualization, V.N.F.M., A.L.N. and P.F.; methodology, V.N.F.M., A.L.N. and R.R.; software, V.N.F.M.; formal analysis, V.N.F.M.; investigation, V.N.F.M. and A.L.N.; resources, V.N.F.M., G.M. and R.R.; writing—original draft preparation, V.N.F.M. and A.L.N.; writing—review and editing, A.L.N., P.F. and R.R.; visualization, R.R.; supervision, R.R.; funding acquisition, V.N.F.M., G.M., P.F. and R.R. All authors have read and agreed to the published version of the manuscript.

Funding

The authors wish to express thanks for support from the following Argentine institutions: FONCYT-PICT RESOL-2023-31-APN-DANPIDTYI#ANPIDTYI (PICT-2021-I-INVI-00839, PICT-2021-INVI-00803, PICT-2021-A-0169, Agencia Nacional de Promoción de la Investigación, el Desarrollo Tecnológico y la Innovación, Gobierno de la Nación Argentina). Williams Foundation. Complementary Funds Competition for Research Projects with Impact on the Argentine Territory 2024.

Institutional Review Board Statement

Not applicable.

Informed Consent Statement

Not applicable.

Data Availability Statement

The raw data supporting the conclusions of this article will be made available by the authors on request.

Acknowledgments

We thank the National Scientific and Technical Research Council of Argentina (CONICET) and the National University of San Juan for providing us with their support and physical space to carry out the research.

Conflicts of Interest

The authors declare no conflicts of interest.

References

  1. Omobolanle, O.C.; Ikiensikimama, S.S. Gas flaring: Technicalities, challenges, and the economic potentials. Environ. Sci. Pollut. Res. 2024, 31, 40838–40850. [Google Scholar] [CrossRef] [PubMed]
  2. Fawole, O.G.; Cai, X.M.; MacKenzie, A.R. Gas flaring and resultant air pollution: A review focusing on black carbon. Environ. Pollut. 2016, 216, 182–197. [Google Scholar] [CrossRef]
  3. Puliafito, S.E.; Bolaño-Ortiz, T.R.; Fernandez, R.P.; Berná, L.L.; Pascual-Flores, R.M.; Urquiza, J.; Tames, M.F. High Resolution Seasonal and Decadal Inventory of Anthropic Gas-Phase and Particle Emissions for Argentina. Earth Syst. Sci. Data Discuss. 2021, 13, 5027–5069. [Google Scholar] [CrossRef]
  4. IAE Mosconi. Informe anual de hidrocarburos—Año 2023; Lic. Julián Rojo (dir. área técnica); Instituto Argentino de Energía “General Mosconi”: Buenos Aires, Argentina, 2023; Available online: https://www.iae.org.ar/wp-content/uploads/2024/03/Informe-anual-de-hidrocarburos-2023.pdf (accessed on 15 August 2025).
  5. Lu, X.; Li, S.; Han, R.; Jia, B.; Xian, C.; Ding, F.; Zuo, X. An overview of recent developments and understandings of unconventionals in the Vaca Muerta formation, Argentina. Appl. Sci. 2024, 14, 1366. [Google Scholar] [CrossRef]
  6. Belotti, H.; Pagan, F.; Mazas, A.P.; Agüera, M.; Rodriguez, J.; Porras, J.; Cagnolatti, M. Geologic interpretation and assessment of Early Cretaceous shale oil and gas potential in Austral Basin, Santa Cruz, Argentina. In Proceedings of the Unconventional Resources Technology Conference, Denver, CO, USA, 12–14 August 2013; SEG Global Meeting. 2013; pp. 926–935, ISSN 2159-6832 Published in electronic format with permission by the Society of Exploration Geophysicists, American Association of Petroleum Geologists, and Society of Petroleum Engineers. [Google Scholar] [CrossRef]
  7. Sachse, V.F.; Strozyk, F.; Anka, Z.; Rodriguez, J.F.; di Primio, R. The tectono-stratigraphic evolution of the Austral Basin and adjacent areas against the background of Andean tectonics, southern Argentina, South America. Basin Res. 2016, 28, 462–482. [Google Scholar] [CrossRef]
  8. Gao, Z.; Ivey, C.E.; Blanchard, C.L.; Do, K.; Lee, S.M.; Russell, A.G. Emissions and meteorological impacts on PM2.5 species concentrations in Southern California using generalized additive modeling. Sci. Total Environ. 2023, 891, 164464. [Google Scholar] [CrossRef]
  9. Alvarez, R.A.; Zavala-Araiza, D.; Lyon, D.R.; Allen, D.T.; Barkley, Z.R.; Brandt, A.R.; Davis, K.J.; Herndon, S.C.; Jacob, D.J.; Karion, A.; et al. Assessment of methane emissions from the US oil and gas supply chain. Science 2018, 361, 186–188. [Google Scholar] [CrossRef]
  10. Kuttippurath, J.; Abbhishek, K.; Gopikrishnan, G.S. Investigation of long-term trends and major sources of atmospheric HCHO over India. Environ. Chall. 2022, 7, 100477. [Google Scholar] [CrossRef]
  11. Lopez, P.; Casallas, A.; Zhou, G.; Zhang, K.; Jing, G.; Ali, A.; Lopez-Barrera, E.; Belalcazar, L.; Rojas, N.; Jiang, H. High-resolution anthropogenic emission inventories with deep learning in northern South America. Remote Sens. Environ. 2025, 324, 114761. [Google Scholar] [CrossRef]
  12. Radovich, V.S. Hydrocarbons in Argentine Republic. In Marine Exploration and Exploitation of Hydrocarbons; Palgrave Studies in Maritime Politics and Security; Palgrave Macmillan: Cham, Switzerland, 2025; pp. 149–202. [Google Scholar] [CrossRef]
  13. Báez, M.; Stinco, L.P.; Barredo, S.P.; Merlino, H.D. Data Science Applied to Oil Wells’ Behavior Prediction in the Estructura Cruz de Piedra–Lunlunta Oil Field, Cuyana Basin, Argentina. In ICAI Workshops (Joint Proceedings of the ICAI 2021 Workshops WAAI 2021, AIESD 2021, WDEA 2021, WKMIT 2021, WSSC 2021); Florez, H., Galpin, I., Grévisse, C., Eds.; CEUR Workshop Proceedings; CEUR-WS.org: Buenos Aires, Argentina, 2021; Volume 2992, pp. 1–15. [Google Scholar]
  14. Schenk, C.J.; Klett, T.R.; Tennyson, M.E.; Mercier, T.J.; Pitman, J.K.; Gaswirth, S.B.; Finn, T.M.; Brownfield, M.E.; Le, P.A.; Leathers-Miller, H.M.; et al. Assessment of Continuous Oil and Gas Resources in the Neuquén Basin Province, Argentina, 2016; Report No. 2017–3025; US Geological Survey: Reston, VA, USA, 2017. [CrossRef]
  15. Borsdorff, T.; aan de Brugh, J.; Hu, H.; Hasekamp, O.; Sussmann, R.; Rettinger, M.; Hase, F.; Gross, J.; Schneider, M.; Garcia, O.; et al. Mapping carbon monoxide pollution from space down to city scales with daily global coverage. Atmos. Meas. Tech. 2018, 11, 5507–5518. [Google Scholar] [CrossRef]
  16. Lorente, A.; Borsdorff, T.; Butz, A.; Hasekamp, O.; de Brugh, J.; Schneider, A.; Wu, L.; Hase, F.; Kivi, R.; Wunch, D.; et al. Methane retrieved from TROPOMI: Improvement of the data product and validation of the first 2 years of measurements. Atmos. Meas. Tech. 2021, 14, 665–684. [Google Scholar] [CrossRef]
  17. Theys, N.; Hedelt, P.; De Smedt, I.; Lerot, C.; Yu, H.; Vlietinck, J.; Pedergnana, M.; Arellano, S.; Galle, B.; Fernandez, D.; et al. Global monitoring of volcanic SO2 degassing with unprecedented resolution from TROPOMI onboard Sentinel-5 Precursor. Sci. Rep. 2019, 9, 2643. [Google Scholar] [CrossRef]
  18. De Smedt, I.; Theys, N.; Yu, H.; Danckaert, T.; Lerot, C.; Compernolle, S.; Van Roozendael, M.; Richter, A.; Hilboll, A.; Peters, E.; et al. Algorithm theoretical baseline for formaldehyde retrievals from S5P TROPOMI and from the QA4ECV project. Atmos. Meas. Tech. 2018, 11, 2395–2426. [Google Scholar] [CrossRef]
  19. Crawley, M.J. The R Book, 2nd ed.; John Wiley & Sons, Ltd.: Sussex, EEUU, 2013; pp. 388–448. ISBN 9781118448908. [Google Scholar] [CrossRef]
  20. Zar, J. Biostatistical Analysis, 5th ed.; Pearson Prentice Hall: Upper Saddle River, NJ, USA, 1999. [Google Scholar]
  21. Jackson, R.B.; Saunois, M.; Bousquet, P.; Canadell, J.G.; Poulter, B.; Stavert, A.R.; Tsuruta, A. Increasing anthropogenic methane emissions arise equally from agricultural and fossil fuel sources. Environ. Res. Lett. 2020, 15, 071002. [Google Scholar] [CrossRef]
  22. Cooper, J.; Dubey, L.; Hawkes, A. Methane detection and quantification in the upstream oil and gas sector: The role of satellites in emissions detection, reconciling and reporting. Environ. Sci. Atmos. 2022, 2, 9–23. [Google Scholar] [CrossRef]
  23. Gobierno de Mendoza, Argentina. Petróleo en Mendoza: Política Petrolera 2006–2007; Ministerio de Economía, Subsecretaría de Promoción Económica e Inversiones: 2006. Available online: https://www.energia.gob.ar/contenidos/verpagina.php?idpagina=2357 (accessed on 15 June 2025).
  24. Mayer, M.; Schreier, S.F.; Spangl, W.; Staehle, C.; Trimmel, H.; Rieder, H.E. An analysis of 30 years of surface ozone concentrations in Austria: Temporal evolution, changes in precursor emissions and chemical regimes, temperature dependence, and lessons for the future. Environ. Sci. Atmos. 2022, 2, 601–615. [Google Scholar] [CrossRef]
  25. Tran, H.; Polka, E.; Buonocore, J.J.; Roy, A.; Trask, B.; Hull, H.; Arunachalam, S. Air quality and health impacts of onshore oil and gas flaring and venting activities estimated using refined satellite-based emissions. GeoHealth 2024, 8, e2023GH000938. [Google Scholar] [CrossRef] [PubMed]
  26. Fernández-Maldonado, V.; Navas, A.L.; Fabani, M.P.; Mazza, G.; Rodríguez, R. A multi-temporal analysis on the dynamics of the impact of land use and land cover on NO2 and CO emissions in Argentina for sustainable environmental management. Sustainability 2024, 16, 4400. [Google Scholar] [CrossRef]
  27. Liu, P.; Song, H.; Wang, T.; Wang, F.; Li, X.; Miao, C.; Zhao, H. Effects of meteorological conditions and anthropogenic precursors on ground-level ozone concentrations in Chinese cities. Environ. Pollut. 2020, 262, 114366. [Google Scholar] [CrossRef] [PubMed]
  28. Akyuz, E.; Kaynak, B. Use of dispersion model and satellite SO2 retrievals for environmental impact assessment of coal-fired power plants. Sci. Total Environ. 2019, 689, 808–819. [Google Scholar] [CrossRef]
  29. Benites Morales, O.F.; Pacsi Valdivia, S.A. Análisis temporal de los contaminantes atmosféricos (NO2, O3 troposférico y CO) y su relación con la temperatura del aire y la radiación solar en Lima Metropolitana. Ecol. Apl. 2023, 22, 17–25. [Google Scholar] [CrossRef]
  30. Calkins, C.; Ge, C.; Wang, J.; Anderson, M.; Yang, K. Effects of meteorological conditions on sulfur dioxide air pollution in the North China Plain during winters of 2006–2015. Atmos. Environ. 2016, 147, 296–309. [Google Scholar] [CrossRef]
  31. Nisbet, E.G.; Manning, M.R.; Dlugokencky, E.J.; Michel, S.E.; Lan, X.; Röckmann, T.; Denier van der Gon, H.A.C.; Schmitt, J.; Palmer, P.I.; Dyonisius, M.N.; et al. Atmospheric methane: Comparison between methane’s record in 2006–2022 and during glacial terminations. Glob. Biogeochem. Cycles 2023, 37, e2023GB007875. [Google Scholar] [CrossRef]
  32. Bussmann, I.; Achterberg, E.P.; Brix, H.; Brüggemann, N.; Flöser, G.; Schütze, C.; Fischer, P. Influence of wind strength and direction on diffusive methane fluxes and atmospheric methane concentrations above the North Sea. Biogeosciences 2024, 21, 3819–3838. [Google Scholar] [CrossRef]
  33. Yin, Q.; Ma, Q.; Lin, W.; Xu, X.; Yao, J. Measurement report: Long-term variations in surface NO2 and SO2 mixing ratios from 2006 to 2016 at a background site in the Yangtze River Delta region, China. Atmos. Chem. Phys. 2022, 22, 1015–1033. [Google Scholar] [CrossRef]
  34. Chauhan, B.V.; Smallbone, K.L.; Berg, M.; Wyche, K.P. The temporal evolution of HCHO and changes in atmospheric composition in the southeast of the United Kingdom. Case Stud. Chem. Environ. Eng. 2025, 11, 101092. [Google Scholar] [CrossRef]
  35. Niu, X.; Ju, T.; Li, B.; Huang, C.; Zhang, J.; Lei, S. Characteristics, future trends, and transport path analysis of atmospheric formaldehyde pollution: A case study of Argentina. Acad. J. Environ. Earth Sci. 2024, 6, 43–53. [Google Scholar] [CrossRef]
  36. Oomen, G.M.; Müller, J.F.; Stavrakou, T.; De Smedt, I.; Blumenstock, T.; Kivi, R.; Makarova, M.; Palm, M.; Röhling, A.; Té, Y.; et al. Weekly derived top-down volatile-organic-compound fluxes over Europe from TROPOMI HCHO data from 2018 to 2021. Atmos. Chem. Phys. 2024, 24, 449–474. [Google Scholar] [CrossRef]
  37. Hu, M.; Wang, Y.; Wang, S.; Jiao, M.; Huang, G.; Xia, B. Spatial–Temporal Heterogeneity of Air Pollution and Its Relationship with Meteorological Factors in the Pearl River Delta, China. Atmos. Environ. 2021, 254, 118415. [Google Scholar] [CrossRef]
  38. Chen, Z.H.; Cheng, S.Y.; Li, J.B.; Guo, X.R.; Wang, W.H.; Chen, D.S. Relationship between atmospheric pollution processes and synoptic pressure patterns in Northern China. Atmos. Environ. 2008, 42, 6078–6087. [Google Scholar] [CrossRef]
  39. Cao, J.; Qiu, X.; Gao, J.; Wang, F.; Wang, J.; Wu, J.; Peng, L. Significant decrease in SO2 emission and enhanced atmospheric oxidation trigger changes in sulfate formation pathways in China during 2008–2016. J. Clean. Prod. 2021, 326, 129396. [Google Scholar] [CrossRef]
  40. Hong, Q.; Liu, C.; Hu, Q.; Xing, C.; Tan, W.; Liu, T.; Liu, J. Vertical distributions of tropospheric SO2 based on MAX-DOAS observations: Investigating the impacts of regional transport at different heights in the boundary layer. J. Environ. Sci. 2021, 103, 119–134. [Google Scholar] [CrossRef] [PubMed]
  41. Alam, M.J.; Karim, I.; Zaman, S.U. Seasonal dynamics and trends in air pollutants: A comprehensive analysis of PM2.5, NO2, CO, SO2, and O3 in Houston, USA. Air Qual. Atmos. Health 2025, 1–18. [Google Scholar] [CrossRef]
  42. Martins, L.D.; Hallak, R.; Alves, R.C.; de Almeida, D.S.; Squizzato, R.; Moreira, C.A.; Martins, J.A. Long-range transport of aerosols from biomass burning over southeastern South America and their implications on air quality. Aerosol Air Qual. Res. 2018, 18, 1734–1745. [Google Scholar] [CrossRef]
  43. Meišutovič-Akhtarieva, M.; Pinto, L.V.; Inácio, M.; Pereira, P. Assessing influential variables affecting outdoor levels of formaldehyde (HCHO). Environ. Process. 2025, 12, 31. [Google Scholar] [CrossRef]
  44. Zhang, Y.; Ju, T.; Shi, Y.; Wang, Q.; Li, F.; Zhang, G. Analysis of spatiotemporal variation of formaldehyde column concentration in Qinghai–Tibet Plateau and its influencing factors. Environ. Sci. Pollut. Res. 2021, 28, 55233–55251. [Google Scholar] [CrossRef]
  45. Huertas, J.I.; Martinez, D.S.; Prato, D.F. Numerical approximation to the effects of the atmospheric stability conditions on the dispersion of pollutants over flat areas. Sci. Rep. 2021, 11, 11566. [Google Scholar] [CrossRef]
  46. Saunois, M.; Martinez, A.; Poulter, B.; Zhang, Z.; Raymond, P.A.; Regnier, P.; Canadell, J.G.; Jackson, R.B.; Patra, P.K.; Bousquet, P.; et al. Global methane budget 2000–2020. Earth Syst. Sci. Data 2025, 17, 1873–1958. [Google Scholar] [CrossRef]
  47. Du, W.; Tian, Z.; Lv, B.; Wang, P.; Wang, H.; Ding, S.; Tian, Z.; Zhou, J.; Jiao, W.; Zhang, X.; et al. Association of carbon monoxide poisoning with cardiovascular disease risk: A systematic review and meta-analysis. Heliyon 2024, 10, e34062. [Google Scholar] [CrossRef]
  48. Kuttippurath, J.; Patel, V.K.; Pathak, M.; Singh, A. Improvements in SO2 pollution in India: Role of technology and environmental regulations. Environ. Sci. Pollut. Res. 2022, 29, 78637–78649. [Google Scholar] [CrossRef]
  49. IARC Working Group on the Evaluation of Carcinogenic Risks to Humans. Formaldehyde. In IARC Monographs on the Evaluation of Carcinogenic Risks to Humans; International Agency for Research on Cancer: Lyon, France, 2006; Volume 88. [Google Scholar]
  50. World Health Organization. Air Quality and Health—Types of Pollutants; World Health Organization: Geneva, Switzerland, 2021; Available online: https://www.who.int/teams/environment-climate-change-and-health/air-quality-and-health/health-impacts/types-of-pollutants (accessed on 21 August 2025).
  51. Elliott, E.G.; Trinh, P.; Ma, X.; Leaderer, B.P.; Ward, M.H.; Deziel, N.C. Unconventional oil and gas development and risk of childhood leukemia: Assessing the evidence. Sci. Total Environ. 2017, 576, 138–147. [Google Scholar] [CrossRef] [PubMed]
  52. McKenzie, L.M.; Witter, R.Z.; Newman, L.S.; Adgate, J.L. Human health risk assessment of air emissions from development of unconventional natural gas resources. Sci. Total Environ. 2012, 424, 79–87. [Google Scholar] [CrossRef] [PubMed]
  53. IEA. Global Warming Potential (GWP20 for Methane ≈ 84–87). In Methane Tracker 2021; International Energy Agency: Paris, France, 2023; Available online: https://www.iea.org/reports/methane-tracker-2021/methane-and-climate-change (accessed on 20 August 2025).
  54. UNEP. Global Methane Assessment 2030: Baseline Report—Launching the Global Methane Pledge at COP26 in 2021; United Nations Environment Programme: Nairobi, Kenya, 2022; Available online: https://www.unep.org/resources/report/global-methane-assessment-2030-baseline-report (accessed on 20 August 2025).
  55. Núñez-Delgado, A. Frontier Studies in Soil Science; Springer: Cham, Switzerland, 2024. [Google Scholar] [CrossRef]
Figure 1. Main sedimentary basins in Argentina that produce the country’s gas and oil.
Sustainability 17 08443 g001
Figure 2. Spatial distribution of column CO concentrations (µmol m−2) in Argentina averaged for the selected months of the 12-month study period: January, July, and December 2024. 1: Cuyana basin, 2: Neuquén basin, 3: San Jorge Golfo basin, 4: Austral Marina basin.
Sustainability 17 08443 g002
Figure 3. Boxplot of weekly average CO concentrations (µmol m−2) recorded during 2024 by oil basin. The ◆ represents the mean. The boxplot colors represent each oil basin: white (Austral Marina), very light gray (Cuyana), medium gray (Golfo San Jorge), and dark gray (Neuquina). The black line within each box represents the median CO concentration. The vertical lines (whiskers) show the dispersion of the data up to the minimum and maximum values. The black dots are outliers. The black diamond represents the mean CO concentration.
Sustainability 17 08443 g003
Figure 4. Weekly average CO concentrations recorded during 2024. The red line represents the annual mean.
Sustainability 17 08443 g004
Figure 5. Spatial distribution of column SO2 concentrations (µmol m−2) in Argentina averaged for the selected months of the 12-month study period: January, July, and December 2024.
Sustainability 17 08443 g005
Figure 6. Boxplot of weekly average SO2 concentrations (µmol m−2) recorded during 2024 by oil basin. The ◆ represents the mean. The boxplot colors represent each oil basin: white (Austral Marina), very light gray (Cuyana), medium gray (Golfo San Jorge), and dark gray (Neuquina). The black line within each box represents the median SO2 concentration. The vertical lines (whiskers) show the dispersion of the data up to the minimum and maximum values. The black dots are outliers. The black diamond represents the mean SO2 concentration.
Sustainability 17 08443 g006
Figure 7. Weekly average SO2 concentrations recorded during 2024. The red line represents the annual mean.
Sustainability 17 08443 g007
Figure 8. Spatial distribution of column HCHO concentrations (µmol m−2) in Argentina averaged for the selected months of the 12-month study period: January, July, and December 2024. 1: Cuyana basin, 2: Neuquén basin, 3: San Jorge Golfo basin, 4: Austral Marina basin.
Sustainability 17 08443 g008
Figure 9. Boxplot of weekly average HCHO concentrations (µmol m−2) recorded during 2024 by oil basin. The rhombus symbol represents the mean. The boxplot colors represent each oil basin: white (Austral Marina), very light gray (Cuyana), medium gray (Golfo San Jorge), and dark gray (Neuquina). The black line within each box represents the median HCHO concentration. The vertical lines (whiskers) show the dispersion of the data up to the minimum and maximum values. The black dots are outliers.
Sustainability 17 08443 g009
Figure 10. Weekly average HCHO concentrations recorded during 2024. The red line represents the annual mean.
Sustainability 17 08443 g010
Figure 11. Spatial distribution of column CH4 concentrations (ppb) in Argentina averaged for the selected months of the 12-month study period: January, July, and December 2024. 1: Cuyana basin, 2: Neuquén basin, 3: San Jorge Golfo basin, 4: Austral Marina basin.
Sustainability 17 08443 g011
Figure 12. Boxplot of weekly average CH4 concentrations (ppb) recorded during 2024 by oil basin. The rhombus symbol represents the mean. The boxplot colors represent each oil basin: white (Austral Marina), very light gray (Cuyana), medium gray (Golfo San Jorge), and dark gray (Neuquina). The black line within each box represents the median CH4 concentration. The vertical lines (whiskers) show the dispersion of the data up to the minimum and maximum values. The black dots are outliers.
Sustainability 17 08443 g012
Figure 13. Weekly average CH4 concentrations recorded during 2024. The red line represents the annual mean.
Sustainability 17 08443 g013
Figure 14. GAMM model of CO concentration response to changes in climate and oil basin variables in 2024. (a) Smoothed effect of air temperature on CO concentration; (b) Smoothed effect of atmospheric pressure on CO concentration; (c) Smoothed effect of dewpoint temperature on CO concentration; (d) Comparison of mean CO concentrations across oil basins; bars indicate standard error. The black line represents the trend estimated by the GAMM model, and the gray band represents the 95% confidence interval.
Sustainability 17 08443 g014
Figure 15. GAMM model of SO2 concentration response to changes in climate and oil basin variables in 2024. (a) Smoothed effect of air temperature on SO2 concentration; (b) Smoothed effect of wind direction on SO2 concentration; (c) Comparison of mean SO2 concentrations across oil basins; bars indicate standard errors. The black line represents the trend estimated by the GAMM model, and the gray band represents the 95% confidence interval.
Sustainability 17 08443 g015
Figure 16. GAMM model of HCHO concentration response to climate change in 2024. (a) Smoothed effect of air temperature; (b) Smoothed effect of atmospheric pressure; (c) Smoothed effect of wind speed; (d) Smoothed effect of precipitation; (e) Smoothed effect of dewpoint temperature. The black line represents the trend estimated by the GAMM model, and the gray band represents the 95% confidence interval.
Sustainability 17 08443 g016
Figure 17. GAMM model of the response of CH4 concentration to changes in climate and oil basin variables in 2024. (a) Smoothed effect of air temperature on CH4 concentration; (b) Smoothed effect of atmospheric pressure on CH4 concentration; (c) Smoothed effect of dewpoint temperature on CH4 concentration; (d) Comparison of mean CH4 concentrations across oil basins; bars indicate standard error. The black line represents the trend estimated by the GAMM model, and the gray band represents the 95% confidence interval.
Sustainability 17 08443 g017
Table 1. Summary of the results obtained on the effect of climatic and spatial variables on the different pollutants released by oil basins.
Gas PollutantMaximum Observed Value During 2024Effect of Major Meteorological VariablesMain Risks to Health and the Environment
CO>30,000 µmol m−2 in October (Neuquina basin)
-
↑ Air temperature
-
↑ Atmospheric pressure
  • Hypoxia (decreased blood oxygenation), risk of angina, heart failure, and cardiovascular events.
  • Persistent pollutant in the troposphere contributes to the transport and reactions of secondary pollutants.
SO2>2000 µmol m−2 in June (Cuyana and Neuquina basins)
-
↓ Air temperature
-
Wind direction (Southwest)
  • Respiratory tract irritation, exacerbation of asthma and lung disease, and hospitalizations in vulnerable populations.
  • Short-lived → dependent on local sources; precursor to sulfates and PM2.5, affects air quality and climate.
HCHO>100 µmol m−2 in January (Cuyana basin)
-
↓ Atmospheric pressure
-
↓ Precipitation
-
↑ Air temperature
-
↑ Dewpoint temperature (especially above 5 °C)
  • Human carcinogen (Group 1, IARC); associated with nasopharyngeal cancer, leukemia, and respiratory diseases.
  • Secondary pollutant sensitive to radiation and humidity; it intensifies the formation of tropospheric ozone, which is harmful to health and ecosystems.
CH4>1850 ppb in July and October (Cuyana basin)
-
↑ Air temperature
-
↑ Atmospheric pressure
  • It primarily affects human health indirectly by increasing O3 production.
  • A potent greenhouse gas (GWP-20 ≈ 84 × CO2); it is a key precursor in the formation of O3 and contributes to global warming. It is associated with agricultural emissions, waste, wetlands, and fires.
Disclaimer/Publisher’s Note: The statements, opinions and data contained in all publications are solely those of the individual author(s) and contributor(s) and not of MDPI and/or the editor(s). MDPI and/or the editor(s) disclaim responsibility for any injury to people or property resulting from any ideas, methods, instructions or products referred to in the content.