Abstract
Urban blue-green infrastructure (UBGI) has been recognized as an effective nature-based solution (NbS) for mitigating urban overheating through temperature reduction. However, there is a paucity of research examining whether UBGI spatial configurations align with the geographical distribution of the heat exposure risks of urban residents. This study focuses on this research gap, employing a population-weighted algorithm to conduct a refined assessment of the blue-green spaces exposure and heat exposure risks of urban residents. Then, the heat exposure risk was conceptualized as the demand for cooling services, with exposure to blue-green spaces serving as the supply. A comprehensive assessment was finally conducted of the supply–demand relationship and coupling coordination level for cooling services in central Wuhan. The following findings were revealed: (1) Both heat exposure risks and blue-green exposure demonstrate distinct “west high–east low” spatial gradients. It is evident that extreme high/high-risk zones, which encompass 17.1% of the study area, house 74.49% of the permanent population; (2) A substantial and pervasive positive correlation exists between UGBI exposure and the heat exposure risk. “High-demand–high-supply” areas (14.90% coverage) concentrate in urban cores, overlapping with 61.25% high-risk populations, while 0.29% of zones show “high-demand–low-supply” mismatches, revealing concentrated but ineffective UGBI distribution; (3) A pervasive supply–demand imbalance is evident, with 90.64% of regions exhibiting an unacceptable coupling type range (0 < D ≤ 0.4) and a mere 1.39% attaining an acceptable range (0.6 < D ≤ 1). These findings underscore the inadequacy of prevailing urban blue-green infrastructure configurations in addressing heat exposure risks. The construction of cities with greater heat resilience necessitates the implementation of multidimensional strategies aimed at risk mitigation.
1. Introduction
With the acceleration of urbanization, the climate challenges faced by cities have become increasingly severe [1,2,3]. Under the dual effects of population surge and impervious surface expansion, the urban heat island effect has significantly intensified [4,5,6], compounded by global climate change, leading to an increase in the frequency, intensity, and duration of extreme heat events in cities [7,8]. This climatic anomaly not only subjects urban infrastructure to excessive stress [9,10] but also triggers physical and mental health crises among urban residents [11,12,13]. Global data from multiple countries show that heat-related excess mortality has surpassed total mortality from other natural disasters [14]. It can be said that extreme heatwaves have become a significant threat to urban sustainable development [15]. In this context, building climate-resilient urban systems urgently requires establishing effective cooling intervention mechanisms and public service networks to address urban overheating challenges.
Urban blue-green infrastructure (UBGI), represented by lakes, rivers, and green spaces, is recognized as a nature-based solution (NbS) that plays a vital role in mitigating urban extreme heat phenomena [16,17]. By enhancing surface albedo, providing tree canopy shading, and facilitating evapotranspiration from water bodies and vegetation, this infrastructure can significantly reduce temperatures in its coverage area and surrounding environments [18,19]. Not only does this combined cooling effect curb the expansion of urban heat islands, but exposure to blue-green spaces can significantly enhance thermal comfort by improving human perception of outdoor thermal environments [20,21]. Consequently, blue-green spaces have emerged as a pivotal source of urban cooling services, offering effective measures to enhance urban microclimates and public health.
However, UBGI systems commonly exhibit spatial inequity and supply–demand mismatches, resulting in significant disparities in exposure, accessibility, and availability across different regions, communities, ethnic groups, and income levels [22,23,24,25]. Gao et al. [26] revealed that the blue-green space exposure level of Chinese urban residents remains generally low (0.067), displaying a spatial pattern of “higher in southern and western regions compared to northern and eastern areas”. From 2001 to 2020, exposure levels declined by 23% while inequality increased by 3%; this was particularly pronounced in eastern cities. Zhu et al. [27] quantified spatiotemporal changes in green space exposure within the core area of Beijing (2010–2020), finding that elderly populations experienced slight exposure decreases with stable equity levels, while the exposure of children increased with worsening inequality. It should be noted that these widespread blue-green space mismatches and supply–demand imbalances often interact with significant cooling service provision disparities, creating dual dilemmas of environmental justice under extreme heat threats [28,29,30]. Yang et al. [31] investigated 18 parks in the core area of Hangzhou, finding 77.80% exhibited low accessibility and 72.20% lacked sufficient cooling service attractiveness, highlighting service distribution inequities. Chen et al. [32] revealed that, in Wuhan, 83.6% of core urban residents could access park cooling services within a 30-min walk, compared to only 25.6% in suburban areas. Moreover, the segregation in thermal comfort resource access exacerbates societal heat vulnerability—areas and populations with low UBGI exposure and accessibility suffer both cooling service deficits and heightened heat exposure risks. This coupling effect perpetuates environmental inequality mechanisms [33,34], forming systemic cooling poverty [35]. Dong et al. [36] demonstrated in Zhengzhou that, despite the UGS expansion over the past decade, the spatial interaction effects of heat exposure risks in residential clusters may intensify. Some areas with adequate cooling services still present high heat exposure risks to residents. Chen et al. [37] analyzed temperature data and cooling strategies (e.g., AC ownership and canopy coverage) across 10 Connecticut cities, finding that minority populations endure higher and intensifying heat exposure over time. Their lower adaptive capacity (reduced shade coverage) heightens urban heat vulnerability. These findings underscore that establishing spatially equitable UBGI configurations is a crucial scientific imperative for enhancing urban climate resilience.
The prevailing approaches frequently operationalize population density or size as a unilateral proxy for BGI exposure assessment and cooling service demand quantification [32,38]. However, this paradigm fails to consider the dual heterogeneity of demographic patterns and thermal landscapes. In high-density zones with moderate thermal conditions, the urgency of the cooling demand is not as pronounced, yet population-centric metrics systematically overestimate their prioritization in the hierarchy, constituting a critical evaluation bias. In recent research endeavors, the regional heat health risk has been adopted as a metric to assess cooling demand [39]. However, this approach is limited in its application due to the multifaceted nature of heat health risks, which are determined by a complex exposure–hazard–vulnerability interplay. In instances where a high-risk zone is primarily attributable to socio-economic vulnerability factors as opposed to thermal exposure, the urgency of the need for cooling measures is deemed to be inadequate. Consequently, the heat exposure risk assessment emerges as a strategically superior metric, explicitly capturing population–extreme heat spatial coincidence dynamics [40]. The quantification of cooling demand in terms of population presence and heat intensity parameters establishes an operational framework with clear causal relationships, thereby enhancing the effectiveness of planning-related demand assessments [41].
This study overcomes the limitations of previous methods in the quantification of cooling service demand, which were limited to unidimensional analysis. The integration of population distribution raster data with land surface temperature datasets facilitates the assessment of the heat exposure risk experienced by urban residents. This risk assessment serves as a key indicator of cooling service demand. Also, we employed population distribution rasters and land use data to assess the exposure of residents to blue-green space, which served as a proxy for the availability of cooling services. Consequently, we conducted a bivariate spatial autocorrelation analysis to characterize supply–demand spatial matching patterns. We then employed coupling coordination degree modeling to determine the regional disparities and systemic coordination between blue-green space exposure and heat exposure risk. This research aims to identify dual-pressure zones (high-demand/low-supply) and multi-service demand areas (high-demand/high-supply), establishing priority intervention spaces for heat-resilient urban planning to transition climate adaptation strategies from homogeneous coverage to precision allocation.
2. Materials and Methods
2.1. Study Area
Wuhan City (Figure 1), situated in central China, serves as the capital of Hubei Province and a major urban center in the middle reaches of the Yangtze River. Its geographical coordinates range from 113°41′ E to 115°05′ E longitude and 29°58′ N to 31°22′ N latitude, encompassing a total administrative area of approximately 8494 km2. Influenced by a subtropical monsoon climate, Wuhan experiences intense summer heat. According to meteorological data from the National Climate Center, Wuhan has been consistently recognized as one of China’s most extreme “furnace cities”. The numerous water bodies in Wuhan have earned it the designation “City of a Hundred Lakes”, with aquatic areas constituting approximately 25% of its total surface area. The built-up area has a 42.07% greening coverage rate with a 37.05% green space ratio. This combination of thermal extremity and abundant natural resources makes Wuhan’s urban core an ideal location for this investigation.
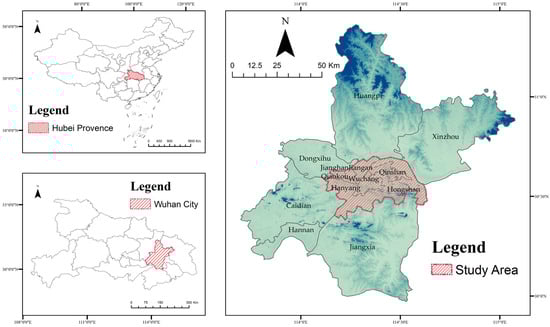
Figure 1.
Geographical location of the study area.
2.2. Data Source
The study employs three primary datasets: (1) Population data: The 100-m resolution population raster data generated by Chen et al. [42], using township-level statistics from the Seventh National Population Census of China, as visualized in Figure 2; (2) Land use data: The SinoLC-1 dataset [43], with 1-m resolution, categorizes terrain into 11 classes, including woodland, shrubland, grassland, and cropland, achieving an overall accuracy of 73.61% and Kappa coefficient of 0.6595. Four UBGI representative classes—forest, grassland, cropland, and water bodies—were extracted to characterize blue-green spaces; (3) Land Surface Temperature (LST): Derived from Landsat 8 Collection 2 Surface Temperature products processed via Google Earth Engine (GEE), calculating the average LST from June to September 2020 in Wuhan. The LST retrieval utilized the Single-Channel Algorithm co-developed by Rochester Institute of Technology (RIT) and NASA’s Jet Propulsion Laboratory (JPL), embedded in Landsat 8 Collection 2 products [10]. After excluding heavily clouded dates and selecting optimal imagery, maximum LST values were computed to map extreme thermal patterns during summer (June–September) in Wuhan in 2020, as presented in Figure 3.
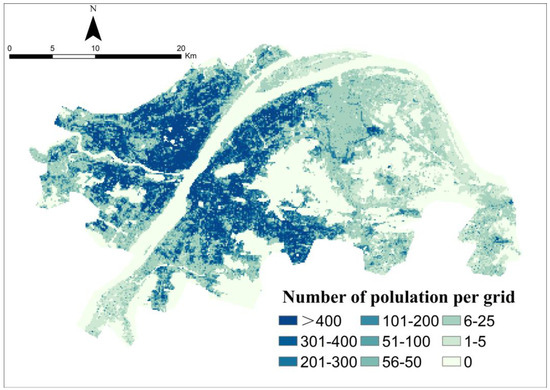
Figure 2.
The spatial distribution of population within the research area.
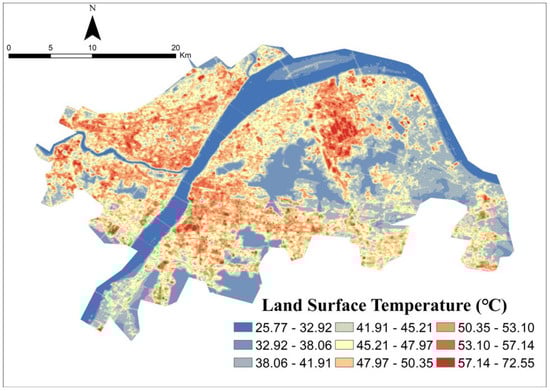
Figure 3.
The spatial distribution of LST within the research area.
As illustrated in Figure 2, there is a notable concentration of the population in the central–western regions and along the Yangtze River in the study area. This stands in contrast to the sparse distribution of populations in the western regions. It is noteworthy that Hongshan District, despite encompassing extensive western territories with a low population density, exhibits the highest population magnitude (27.09%) due to intensive agglomeration in its eastern sector. Subsequently, substantial populations are also present in older urban centers and districts along the Yangtze River, including Wuchang District (16.97%), Jiang’an District (15.09%), and Hanyang District (13.19%).
The land surface temperature measurements (Figure 3) indicate that high-temperature zones are primarily concentrated in the northeast of the study area. This area is home to the Wuhan Iron and Steel Group’s steelmaking industrial facilities, and as a result, elevated surface temperatures are observed in this area. The distribution of other sub-high-temperature zones is predominantly concentrated in the southwest of the study region. The majority of these zones are situated within industrial facilities, such as workshops or warehouses. In contrast, urban areas, including residential and commercial districts, exhibit relatively low temperatures.
2.3. Method
2.3.1. Heat Exposure Risk Assessment
To accurately identify urban heat hazards, previous studies have assessed urban heat health risks and vulnerability by integrating remote sensing–socio-ecological data [44,45]. However, the majority of these studies operate at coarser scales (e.g., city or community levels), thereby limiting their capacity to capture the fine-grained spatial heterogeneity of intra-urban heat risks. Conversely, the population-weighted relative heat exposure risk assessment model meticulously quantifies the potential incidence of extreme heat exposure among populations by integrating high-resolution population distribution and temperature data. This approach provides a clear indication of the degree to which urban populations are affected or disrupted by high temperatures [46,47]. Consequently, this study utilizes the population-weighted relative heat exposure risk assessment model. First, a 100-m fishnet grid was created in ArcGIS 10.8, followed by the spatial alignment of the population and LST data within these 100 m grid cells. Finally, the heat exposure risk for urban residents was calculated using Equation (1):
where denotes the relative heat exposure risk in grid cell , represents the normalized average LST value within grid , indicates the normalized population count in grid , and n equals the total number of grid cells. Ultimately, referring to previous studies [41,48], the population heat exposure relative risk was classified into five distinct grades, as detailed in Table 1.

Table 1.
Risk level division of heat exposure risk in the population.
2.3.2. Blue-Green Space Exposure Assessment
This population-weighted green exposure model, developed by Song et al. [49], integrates the spatial dependencies of population density and green space allocation, thereby providing an objective bottom-up representation of realistic human–green space interaction scenarios. The primary function of the formula is to calculate the population-weighted mean green space coverage within a specified area at urban or regional scales. The calculation is performed as delineated in Equation (2):
In the formula, represents the green space exposure level of the population. denotes the population size of grid . refers to the green space coverage of the buffer zone for grid .
Furthermore, other scholars have evaluated green space exposure using street-view imagery methods [50]. Building upon the seminal work of Song et al., Zuo et al. [51] advanced the model into a grid-specific urban green exposure construct. Given the focus of this paper on 100-m grid blue-green space exposure, the computational approach of Zuo et al. [51] was employed. The calculation was performed as delineated in Equation (3):
In this equation, represents the blue-green space exposure level at grid . denotes the population size of grid . is defined as the mean population size across all grids within the study area. indicates the blue-green space coverage ratio of grid .
2.3.3. Bivariate Spatial Autocorrelation Analysis
This study conceptualizes heat exposure risk as a function of demand for cooling services and blue-green space exposure as a function of supply of cooling services. Employing bivariate spatial autocorrelation analysis, the study examines the dynamics of their supply–demand relationship. Bivariate spatial autocorrelation analysis was employed to quantify attribute spatial dependence patterns and inter-variable clustering structures [22]. The global Moran’s I index, as implemented in GeoDa 1.22 software [52], was used to evaluate the spatial co-dependence between heat exposure risk and blue-green infrastructure (BGI) exposure metrics. This approach enabled the establishment of a global characterization of spatial agglomeration patterns for both risk and environmental variables. The calculation was performed as delineated in Equation (4) [53]:
In this equation, the term is used to denote fishnet grid count, while is employed to represent the spatial weight matrix element between grid and . The term is used to measure the deviation of variable a in grid from its mean, and is used to quantify the deviation of variable b in grid from its mean.
Local spatial autocorrelation analysis is a useful metric for detecting the similarity and dependency characteristics between spatial units and their surroundings. This method identifies spatial clustering and isolation phenomena while assessing the unevenness of the spatial distribution [36,54]. Consequently, a spatial distribution map of the local supply–demand relationship between cold service provision and heat stress demand can be generated through bivariate LISA clustering analysis. The calculation is performed as delineated in Equation (5):
In this equation, the variable denotes the fishnet grid count, signifies the spatial weight matrix value from grid to , measures the deviation of variable in grid from its mean, and and are the standard deviations of variables and . The spatial clustering patterns were subsequently categorized as follows: HH (high supply–high demand), LL (low supply–low demand), LH (low supply–high demand), HL (high supply–low demand), and statistically non-significant (p ≥ 0.05).
2.3.4. Coupling Coordination Degree Model
Coupling coordination analysis is a method of evaluating the balance between the “supply” of cooling services and the “demand” for population exposure, thereby revealing their spatial coordination. This provides a foundation for the refinement of governance strategies and the enhancement of governance efficiency [39]. Therefore, this study employs a coupling coordination degree model to analyze the supply–demand coordination relationship between exposure to blue-green spaces and heat exposure risk, thereby revealing their level of synergistic interaction. The calculation is performed as delineated in Equations (6)–(8):
In this equation, denotes coupling intensity, signifies a comprehensive assessment index, and and correspond to normalized values for supply and demand, respectively. The coefficients α and β are undetermined parameters that are used to measure the level of importance of each system [55]. In this paper, the importance of demand for cooling services and supply are considered to be of equal significance. Therefore, α = 0.5 and β = 0.5 are set to assign equal weight to both. represents the coupling coordination degree. In accordance with the classification system developed by preceding scholars in this field, the data is subsequently discretized into ten levels and three categories through equal-interval classification [55,56], as shown in Table 2.
Table 2.
Degree of coupling coordination classification.
3. Results
3.1. Results of Heat Exposure Risk Evaluation
The results of the population-based relative risk assessment model demonstrate significant spatial heterogeneity in the heat exposure risk of urban residents (Figure 4a,c). The presence of medium-, high-, and extreme high-risk zones is notably concentrated along the Yangtze River in western sectors, exhibiting a pronounced clustering pattern. This aggregation of high-risk areas forms distinct hotspots within the region (Moran’s I = 0.654, z-score = 143.297, p < 0.001). These areas coincide with urban cores where synergistic amplification arises from high population density, intensive built environments, and elevated LST. Conversely, low-risk/risk-free areas prevail in the eastern sectors despite localized extreme heat (Figure 2). This phenomenon is attributable to limited development intensity and sparse populations, which collectively suppress risk manifestation.
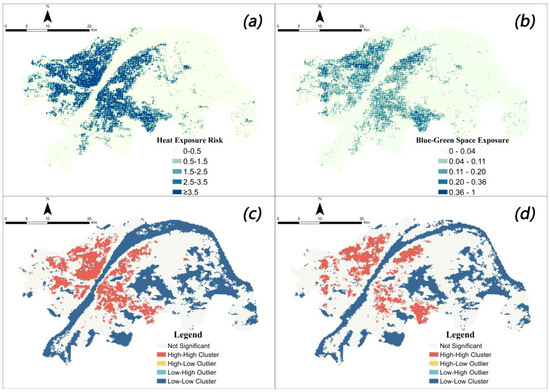
Figure 4.
The spatial distribution characteristics of heat exposure and blue-green space exposure. (a) heat exposure risk classification, (b) blue-green space exposure classification, (c) the local LISA clustering of heat exposure risk, and (d) the local LISA clustering of blue-green space exposure.
Quantitatively, the distribution of risk zones is as follows (Figure 5): risk-free (69.35%) > extreme high-risk (10.39%) > low-risk (9.08%) > medium-risk (6.58%) > high-risk (4.60%). The low-risk/risk-free categories collectively constitute 78.43% of the area, which is spatially aligned with eastern districts that feature superior blue-green infrastructure endowments and intact ecological foundations. It is imperative to note that the high-/extreme-risk zones, which encompass 14.66% of the area, house a disproportionate proportion of the residential population within core urban districts, accounting for 71.76% of the total. This observation underscores the phenomenon of spatial-demographic superposition, wherein extreme heat and dense settlement patterns coexist. This finding indicates that central Wuhan residents are facing significant thermal stress challenges, necessitating targeted cooling interventions.
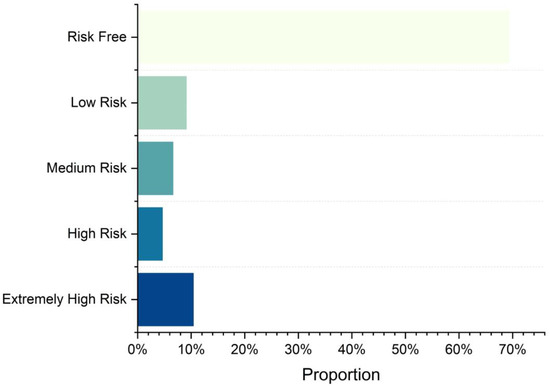
Figure 5.
Percentage of areas with different heat exposure risk classifications.
3.2. Result of Blue-Green Space Exposure Calculations
The population-weighted blue-green space exposure model (Figure 4b,d) reveals significant east–west spatial differentiation in the exposure levels experienced by urban residents in central Wuhan, mirroring the distribution patterns of heat exposure risk. Specifically, high blue-green space exposure areas are found along both Yangtze River banks in western sectors, forming a statistically significant spatial cluster, as evidenced by Moran’s I value of 0.629 and a z value of 137.903, with a p-value less than 0.001. Conversely, low-exposure areas predominate in the eastern region, where despite the higher vegetation coverage and the presence of major water bodies such as East Lake, the sparse population density results in reduced population-adjusted exposure after weighting.
Notably, the western region exhibits spatial mismatches between blue-green exposure configurations and heat exposure risk distribution. In the western sector, elevated levels of blue-green exposure are primarily concentrated in the northern reaches of the west bank of Yangtze River, the east bank exhibits clusters in the northern and eastern subsectors. In comparison, sectors located at mid-river that experience a severe heat exposure risk demonstrate a disproportionately low level of blue-green accessibility metrics.
3.3. Spatial Matching of the Supply–Demand Relationships Between Heat Exposure Risk and Blue-Green Exposure
By conceptualizing heat exposure risk as cooling demand and blue-green space exposure as supply, the spatial alignment of supply and demand was quantified through the utilization of the GeoDa analytical platform. Global bivariate Moran’s I analysis confirmed positive spatial dependence (Moran’s I = 0.478, z = 161.580, p < 0.001), thereby demonstrating the significant colocation of high-heat-exposure zones with high-blue-green-space-exposure clusters. Local LISA clustering further characterized supply–demand spatial relationships and heterogeneity patterns, as illustrated in Figure 6. The “LL” category (Low BGE–Low HE) exhibited a predominant presence, with 43.58% coverage, primarily situated in eastern and central regions that are distinguished by an abundance of green spaces, rivers, and lakes. Despite their limited exposure to blue-green space, these regions exhibit inherent thermal adaptability due to their lower risk of heat-related stress and reduced cooling demand. The “HL” zones (High BGE–Low HE) exhibited optimal adaptation, comprising a mere 3.55% of the total area, and were sporadically distributed along urban peripheries. Despite the minimal spatial coverage of the zones classified as “LH” category (Low BGE–High HE) and considered to be at the highest risk, the “HH” pattern (High HE–High BGE) exhibited in the results is also a cause for concern. The areas in question precisely correspond with the central built-up districts of the urban core, comprising 61.25% of the permanent residential population. This outcome underscores the present inadequacy of UBGI in mitigating heat exposure risk effectively in critical domains. These findings necessitate the immediate implementation of targeted mitigation infrastructure to alleviate urban thermal conditions and ensure public health and thermal comfort.
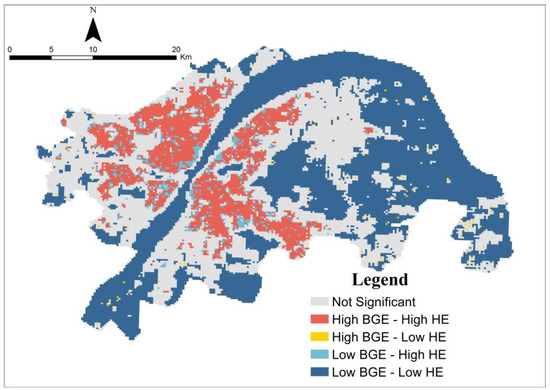
Figure 6.
The spatial relationship between heat exposure and blue-green space exposure.
The establishment of urban planning intervention priorities necessitated the classification of cooling service mismatches across the study area, as illustrated in Table 3. Mismatch categories encompass both “HH” and “LH” categories, which are assigned a higher level of planning urgency. The “LL” and “HL” categories, which have lower priority, are considered matched conditions. The “HH” category has been identified as a primary concern due to its convergence of substantial BGI provision and elevated heat risk, accompanied by a considerable spatial extent. The underlying cause of this phenomenon is likely attributable to the fact that the population density in these areas has surpassed the capacity of the blue-green spaces within their boundaries. This suggests the necessity for the implementation of additional cooling measures. The category designated as “LH” follows as the second priority. These areas are characterized by a deficiency in adequate UGBI, which is likely to result in elevated heat risk. Consequently, increasing UBGI has the potential to ameliorate cooling deficiencies. In the majority of studies, this category of area is generally regarded as the primary target for urban planning interventions. However, given the limited number of such areas within the study scope, their priority was downgraded in this study. The category designated as “LL” is ranked third. Despite its lower heat risk, UGBI offers substantial benefits to both psychological and physiological health. Consequently, these regions must continue to develop their UBGI. Given the capacity of these areas to meet the diverse needs of urban residents to a certain extent, the “HL” category was assigned the lowest priority.
Table 3.
Matching results of cooling service supply and demand with planning intervention priorities.
3.4. Coupling Coordination Between Heat Exposure and Blue-Green Exposure
The supply–demand synergies were evaluated through the use of a coupling coordination metric, as illustrated in Figure 7. The result revealed an overall imbalance between the heat exposure risk and the allocation of blue-green space exposure across the study area. Specifically, a mere 1.39% of the examined areas attained “acceptable range” status (D > 0.6), a status that was found to be sparsely distributed in central urban zones. “Transition zones” (0.4 < D ≤ 0.6) constituted 7.97% of the total area, with a marginal presence observed in the vicinity of acceptable range areas in urban centers. Across 90.64% of the region, unacceptable range zones (0 < D ≤ 0.4) were observed, encompassing the eastern and southern peripheries, as well as critical sections of central urban areas. Despite the prevalence of co-located “High–High” and “Low–Low” pairings in the spatial configuration, the presence of severe supply–demand spatial mismatches remains evident. These mismatches have a profound impact on over 90% of the territory, leading to systemic maladaptation. Although coordination levels show a slight improvement in urban cores vulnerable to heat, existing UNGI are inadequately calibrated to resident heat exposure profiles. This necessitates supplementary cooling interventions to establish precision-adjusted risk mitigation capabilities to reduce urban heat burdens.
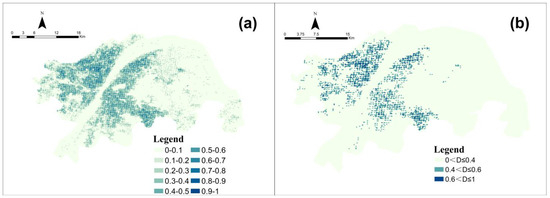
Figure 7.
Results of the coupling coordination degree between heat exposure risk and blue-green space exposure: (a) coupled coordination degree; (b) coupling type.
4. Discussion
UBGI has demonstrated significant efficacy in reducing land surface temperatures and mitigating urban heat islands [57,58]. Accordingly, scholars have identified UBGI as instrumental in augmenting urban heat resilience and population thermal adaptability [59,60,61]. In a previous study conducted by Yin et al. [33] in Los Angeles, significant intra-urban LST variations were identified, exhibiting a strong correlation with the distribution of green space. Subsequent studies formalized hazard–exposure–vulnerability frameworks to quantify spatially divergent cooling demand. In addition, Tieskens et al. [62] and Wang et al. [39] assessed cooling supply via evapotranspiration modeling and green space accessibility metrics. These studies revealed substantial mismatches between high heat risk and low cooling supply. However, such approaches may conflate socioeconomic vulnerability with pure thermal exposure, potentially skewing results. Wu et al. [34] implemented a population-weighted method to assess heat exposure, thereby addressing this shortcoming in the field. Wu et al. [34] conducted a comprehensive study that evaluated the disparities in thermal and green space exposure across 398 U.S. cities. This study identified the existence of overlapping inequalities in green access and thermal comfort. The present study focuses on the urban core of Wuhan, identifying the “high heat–high cooling supply” pattern as the predominant one, encompassing 61.25% of the population and 14.9% of the total area. This finding contrasts with previous research. Nevertheless, a multi-temporal Zhengzhou study conducted by Dong et al. similarly identified adequate supply coexisting with high risk, where high-risk areas persisted despite sufficient cooling services, thereby supporting our conclusions.
The findings of this study demonstrate that, in the context of escalating heatwaves and intensifying heat exposure risks, merely expanding the distribution of blue-green spaces is inadequate. The spatial heterogeneity inherent in urban thermal environments and population distribution engenders a predicament wherein conventional cooling strategies are effective in addressing “aggregate targets met, spatial distribution failed”. The establishment of heat-resilient cities necessitates a more diversified array of urban planning interventions. These intervention zones are highlighted in Table 3, and the mismatch zones are identified as areas in which co-governance between municipal authorities and communities is urgently necessary. The following planning instruments are of particular relevance:
- (1)
- Primary spatial strategies must integrate active cooling with passive design principles [19,63,64]. ① The enhancement of gray infrastructure can be achieved through retrofitting. In order to optimize microclimatic regulation, it is necessary to implement the multidimensional greening of roofs, pavements, and under-bridge spaces. In addition, shallow-circulation water features, such as misting systems, should be developed, and drainage channels should be converted into ecological cooling corridors in order to elevate outdoor thermal comfort. ② The implementation of high-albedo materials and innovative street geometry is imperative. In order to minimize thermal absorption, it is imperative to promote cool roofs and reflective pavements. To optimize shading, it is essential to adopt “narrow street–dense grid” morphologies. In order to maximize shading, it is also necessary to implement continuous tree canopy corridors and install orientation-responsive shading devices on east–west axes.
- (2)
- Secondly, the implementation of dynamic mechanisms necessitates the establishment of operational early-warning systems [65,66]. The deployment of cost-effective micro-weather stations is imperative for hyperlocal thermal monitoring. The establishment of real-time heat warning systems, capable of activating tiered responses such as localized water spraying and the opening of cooling centers, is essential for effective response. The dissemination of alerts via SMS and social media platforms is crucial for optimizing population movements and minimizing unnecessary exposure.
- (3)
- Ultimately, interventions must be directed towards the equitable allocation of resources [67,68]. ① It is imperative to implement a spatial rebalancing of cooling infrastructure. The reduction in “cooling desert” zones is of the utmost importance. Furthermore, there is a necessity to repurpose libraries and community centers into multifunctional cooling stations. ② It is imperative to ensure the protection of vulnerable groups. The implementation of community heat-health literacy programs is essential for enhancing public health and well-being during periods of extreme heat waves. The establishment of thermal health registries for isolated elders and chronic patients is crucial for ensuring the effective management of health concerns in these vulnerable populations. Moreover, the mobilization of neighborhood liaisons during heat events is critical for facilitating access to resources and services, thereby contributing to the mitigation of health risks and the promotion of public safety.
However, the shortcomings of this paper must be acknowledged. Firstly, it must be acknowledged that population exposure estimates derived from Seventh Census raster data (R2 = 0.89) contain inherent accuracy constraints. Subsequent studies should consider incorporating real-time mobility data (e.g., mobile signaling) to enhance spatial precision and capture dynamic exposure patterns. Furthermore, while population-weighting genuinely reflects residents’ experiential exposure, subsequent research should be conducted using accessibility-based approaches to evaluate methodological impacts on supply–demand interpretations.
5. Conclusions
The present study developed a supply–demand matching framework to quantify the relationship between blue-green space exposure and heat exposure risk in central Wuhan. The following key findings were derived from the analysis:
- (1)
- The risk of exposure to heat demonstrates a marked “west–high/east–low” spatial polarization. While 78.43% of territories are classified as low-/no-risk zones in sparsely populated eastern sectors, high-/extreme high-risk zones, which encompass a mere 14.66% of the total area, account for 71.76% of the population. This observation signifies a pronounced risk–population density coupling.
- (2)
- The presence of blue-green space exposure has been observed to coincide with disparities that are oriented in an east–west direction. High-exposure hotspots emerge in western and riverside central districts. Eastern sectors, despite possessing substantial blue-green spaces like the East Lake, experience reduced population-weighted exposure due to sparse habitation.
- (3)
- A substantial global positive correlation exists between blue-green space exposure and heat exposure risk (Moran’s I = 0.478). The “Low Demand–Low Supply” category, constituting 43.58% of the area, demonstrates a low intervention priority. Conversely, “High Demand–High Supply” zones, constituting 14.90% of the area, coincide precisely with urban cores, encompassing 61.25% of the population at high heat exposure risk. This observation lends further credence to the hypothesis that cooling efficacy remains inadequate despite infrastructure concentration.
- (4)
- The supply–demand dynamics of cooling services reveal a structural imbalance. The acceptable range zones, which encompass a mere 1.39% of the total area, are sparsely distributed in the downtown area. The transition zones, which account for 7.97% of the total area, form fragmented buffers. The unacceptable range zones, which occupy more than 90% of the area, span the eastern and southern peripheries and central districts.
Author Contributions
Conceptualization, L.Z. and Y.Z.; methodology, T.X., L.Z. and Y.Z.; investigation, T.X.; resources, L.Z.; data curation, T.X. and L.Z.; writing—original draft preparation, T.X.; writing—review and editing, L.Z. and Y.Z.; visualization, T.X.; supervision, L.Z.; project administration, L.Z. and Y.Z. All authors have read and agreed to the published version of the manuscript.
Funding
This research received no external funding.
Institutional Review Board Statement
Not applicable.
Informed Consent Statement
Not applicable.
Data Availability Statement
Data will be available on reasonable request.
Conflicts of Interest
The authors declare no conflicts of interest.
References
- Carter, J.G.; Cavan, G.; Connelly, A.; Guy, S.; Handley, J.; Kazmierczak, A. Climate Change and the City: Building Capacity for Urban Adaptation. Prog. Plan. 2015, 95, 1–66. [Google Scholar] [CrossRef]
- Araos, M.; Berrang-Ford, L.; Ford, J.D.; Austin, S.E.; Biesbroek, R.; Lesnikowski, A. Climate Change Adaptation Planning in Large Cities: A Systematic Global Assessment. Environ. Sci. Policy 2016, 66, 375–382. [Google Scholar] [CrossRef]
- Wang, Y.; Zhao, N.; Yin, X.; Wu, C.; Chen, M.; Jiao, Y.; Yue, T. Global Future Population Exposure to Heatwaves. Environ. Int. 2023, 178, 108049. [Google Scholar] [CrossRef]
- Li, Y.; Schubert, S.; Kropp, J.P.; Rybski, D. On the Influence of Density and Morphology on the Urban Heat Island Intensity. Nat. Commun. 2020, 11, 2647. [Google Scholar] [CrossRef]
- Aslani, A.; Sereshti, M.; Sharifi, A. Urban Heat Island Mitigation in Tehran: District-Based Mapping and Analysis of Key Drivers. Sustain. Cities Soc. 2025, 125, 106338. [Google Scholar] [CrossRef]
- Qiao, X.; Li, Y.; Wang, Y.; Liu, L.; Zhao, S. The Influence of Climate and Human Factors on a Regional Heat Island in the Zhengzhou Metropolitan Area, China. Environ. Res. 2024, 249, 118331. [Google Scholar] [CrossRef] [PubMed]
- Perkins-Kirkpatrick, S.E.; Lewis, S.C. Increasing Trends in Regional Heatwaves. Nat. Commun. 2020, 11, 3357. [Google Scholar] [CrossRef]
- Zou, Y.; Chen, J.; Zong, H. Is Shading a Better Way to Cool down? Evaluation and Comparison of the Cooling Capacity of Blue-Green Spaces and Urban Shade. Ecol. Indic. 2024, 167, 112688. [Google Scholar] [CrossRef]
- Dwivedi, A.; Soni, R. Impacts of Urban Heat Island Effect on Critical Urban Infrastructure: A Review of Studies Published between 2012 and 2022. Environ. Rev. 2024, 32, 457–469. [Google Scholar] [CrossRef]
- Zou, Y.; Chen, J.; Yu, Y. Heat Exposure Risk Assessment of Street Canyons around Urban Rail Transit Station Areas: A Case Study of Shanghai. Int. J. Disaster Risk Reduct. 2025, 123, 105522. [Google Scholar] [CrossRef]
- Xiang, R.; Hou, X.; Li, R. Health Risks from Extreme Heat in China: Evidence from Health Insurance. J. Environ. Manag. 2024, 354, 120300. [Google Scholar] [CrossRef]
- Bell, M.L.; Gasparrini, A.; Benjamin, G.C. Climate Change, Extreme Heat, and Health. N. Engl. J. Med. 2024, 390, 1793–1801. [Google Scholar] [CrossRef]
- Zhang, X.; Lin, Y.; Bai, Y.; Wang, Z.; Wang, C. Health Undermined in Extreme Temperatures: Empirical Evidence from China. Int. J. Disaster Risk Reduct. 2025, 116, 105127. [Google Scholar] [CrossRef]
- Ebi, K.L.; Capon, A.; Berry, P.; Broderick, C.; De Dear, R.; Havenith, G.; Honda, Y.; Kovats, R.S.; Ma, W.; Malik, A.; et al. Hot Weather and Heat Extremes: Health Risks. Lancet 2021, 398, 698–708. [Google Scholar] [CrossRef] [PubMed]
- Cui, Y.; Yin, M.; Cheng, X.; Tang, J.; He, B.-J. Towards Cool Cities and Communities: Preparing for an Increasingly Hot Future by the Development of Heat-Resilient Infrastructure and Urban Heat Management Plan. Environ. Technol. Innov. 2024, 34, 103568. [Google Scholar] [CrossRef]
- Wang, C.; Ren, Z.; Dong, Y.; Zhang, P.; Guo, Y.; Wang, W.; Bao, G. Efficient Cooling of Cities at Global Scale Using Urban Green Space to Mitigate Urban Heat Island Effects in Different Climatic Regions. Urban For. Urban Green. 2022, 74, 127635. [Google Scholar] [CrossRef]
- Guan, Z.; Zhang, H. A Quantitative Analysis of the Complex Response Relationship between Urban Green Infrastructure (UGI) Structure/Spatial Pattern and Urban Thermal Environment in Shanghai. Sustainability 2024, 16, 6886. [Google Scholar] [CrossRef]
- Shah, A.; Garg, A.; Mishra, V. Quantifying the Local Cooling Effects of Urban Green Spaces: Evidence from Bengaluru, India. Landsc. Urban Plan. 2021, 209, 104043. [Google Scholar] [CrossRef]
- Zeng, W.; Yang, K.; Zhang, S.; Bi, C.; Liu, J.; Yang, X.; Rao, Y.; Ma, Y. Configuration of Green–Blue–Grey Spaces for Efficient Cooling of Urban Physical and Perceptual Thermal Environments. Land 2025, 14, 645. [Google Scholar] [CrossRef]
- Zhang, D.; Xie, X.; Zhou, C. Spatial Influence of Exposure to Green Spaces on the Climate Comfort of Urban Habitats in China. Urban Clim. 2023, 51, 101657. [Google Scholar] [CrossRef]
- Xin, B.; Zhu, C.; Geng, J.; Liu, Y. Emotional Perceptions of Thermal Comfort for People Exposed to Green Spaces Characterized Using Streetscapes in Urban Parks. Land 2024, 13, 1515. [Google Scholar] [CrossRef]
- Chen, Y.; Yue, W.; La Rosa, D. Which Communities Have Better Accessibility to Green Space? An Investigation into Environmental Inequality Using Big Data. Landsc. Urban Plan. 2020, 204, 103919. [Google Scholar] [CrossRef]
- Zou, Y.; Zhang, L.; Huang, W.; Chen, J. The Potential of Informal Green Space (IGS) in Enhancing Urban Green Space Accessibility and Optimization Strategies: A Case Study of Chengdu. Land 2025, 14, 1313. [Google Scholar] [CrossRef]
- Yang, W.; Yang, R.; Zhou, S. The Spatial Heterogeneity of Urban Green Space Inequity from a Perspective of the Vulnerable: A Case Study of Guangzhou, China. Cities 2022, 130, 103855. [Google Scholar] [CrossRef]
- Xia, G.; He, G.; Zhang, X. Assessing the Spatial Equity of Urban Park Green Space Layout from the Perspective of Resident Heterogeneity. Sustainability 2024, 16, 5631. [Google Scholar] [CrossRef]
- Gao, H.; Chen, Y.; Li, K.; Gao, S. People’s Exposure to Blue-Green Spaces Decreased but Inequality Increased during 2001–2020 across Major Chinese Cities. Ecol. Indic. 2024, 166, 112571. [Google Scholar] [CrossRef]
- Zhu, C.; Zheng, S.; Yang, S.; Dong, J.; Ma, M.; Zhang, S.; Liu, S.; Liu, X.; Yao, Y.; Han, B. Towards a Green Equal City: Measuring and Matching the Supply-Demand of Green Exposure in Urban Center. J. Environ. Manag. 2024, 365, 121510. [Google Scholar] [CrossRef]
- Shi, M.; Chen, M.; Jia, W.; Du, C.; Wang, Y. Cooling Effect and Cooling Accessibility of Urban Parks during Hot Summers in China’s Largest Sustainability Experiment. Sustain. Cities Soc. 2023, 93, 104519. [Google Scholar] [CrossRef]
- Li, Y.; Svenning, J.-C.; Zhou, W.; Zhu, K.; Abrams, J.F.; Lenton, T.M.; Ripple, W.J.; Yu, Z.; Teng, S.N.; Dunn, R.R.; et al. Green Spaces Provide Substantial but Unequal Urban Cooling Globally. Nat. Commun. 2024, 15, 7108. [Google Scholar] [CrossRef] [PubMed]
- Rocha, A.D.; Vulova, S.; Förster, M.; Gioli, B.; Matthews, B.; Helfter, C.; Meier, F.; Steeneveld, G.-J.; Barlow, J.F.; Järvi, L.; et al. Unprivileged Groups Are Less Served by Green Cooling Services in Major European Urban Areas. Nat. Cities 2024, 1, 424–435. [Google Scholar] [CrossRef]
- Yang, M.; Nie, W.; Wu, R.; Yan, H.; Tian, S.; Wang, K.; Shi, L.; Cheng, X.; Ji, T.; Bao, Z. Towards More Equitable Cooling Services of Urban Parks: Linking Cooling Effect, Accessibility and Attractiveness. J. Environ. Manag. 2024, 370, 122475. [Google Scholar] [CrossRef]
- Chen, M.; Jia, W.; Yan, L.; Du, C.; Wang, K. Quantification and Mapping Cooling Effect and Its Accessibility of Urban Parks in an Extreme Heat Event in a Megacity. J. Clean. Prod. 2022, 334, 130252. [Google Scholar] [CrossRef]
- Yin, Y.; He, L.; Wennberg, P.O.; Frankenberg, C. Unequal Exposure to Heatwaves in Los Angeles: Impact of Uneven Green Spaces. Sci. Adv. 2023, 9, eade8501. [Google Scholar] [CrossRef]
- Wu, S.; Yu, W.; Chen, B. Observed Inequality in Thermal Comfort Exposure and Its Multifaceted Associations with Greenspace in United States Cities. Landsc. Urban Plan. 2023, 233, 104701. [Google Scholar] [CrossRef]
- Mazzone, A.; De Cian, E.; Falchetta, G.; Jani, A.; Mistry, M.; Khosla, R. Understanding Systemic Cooling Poverty. Nat. Sustain. 2023, 6, 1533–1541. [Google Scholar] [CrossRef]
- Dong, X.; Li, X.; Ye, Y.; Su, D.; Yang, R.; Lausch, A. Measuring Urban Thermal Environment from Accessibility-Based Perspective: A Case Study in a Populous City. Geogr. Sustain. 2024, 5, 329–342. [Google Scholar] [CrossRef]
- Chen, S.; Lund, K.; Murphy-Dunning, C.; Seto, K.C. More Extremely Hot Days, More Heat Exposure and Fewer Cooling Options for People of Color in Connecticut, U.S. npj Urban Sustain. 2024, 4, 47. [Google Scholar] [CrossRef] [PubMed]
- Xiao, Y.; Piao, Y.; Wei, W.; Pan, C.; Lee, D.; Zhao, B. A Comprehensive Framework of Cooling Effect-Accessibility-Urban Development to Assessing and Planning Park Cooling Services. Sustain. Cities Soc. 2023, 98, 104817. [Google Scholar] [CrossRef]
- Wang, Z.; Liu, Y.; Wang, T.; Tang, S.; Wu, X. Supply and Demand Analysis of Urban Thermal Environments Regulation Services from an Accessibility Perspective: A Coupled Thermal Risk and Green Space Cooling Assessment Model. Urban Clim. 2025, 60, 102356. [Google Scholar] [CrossRef]
- Li, J.; Guo, P.; Sun, Y.; Liu, Z.; Zhang, X.; Pei, X. Population Exposure Changes to One Heat Wave and the Influencing Factors Using Mobile Phone Data—A Case Study of Zhuhai City, China. Sustainability 2022, 14, 997. [Google Scholar] [CrossRef]
- Liu, D.; Zhou, R.; Ma, Q.; He, T.; Fang, X.; Xiao, L.; Hu, Y.; Li, J.; Shao, L.; Gao, J. Spatio-Temporal Patterns and Population Exposure Risks of Urban Heat Island in Megacity Shanghai, China. Sustain. Cities Soc. 2024, 108, 105500. [Google Scholar] [CrossRef]
- Chen, Y.; Xu, C.; Ge, Y.; Zhang, X.; Zhou, Y. A 100 m Gridded Population Dataset of China’s Seventh Census Using Ensemble Learning and Big Geospatial Data. Earth Syst. Sci. Data 2024, 16, 3705–3718. [Google Scholar] [CrossRef]
- Li, Z.; He, W.; Cheng, M.; Hu, J.; Yang, G.; Zhang, H. SinoLC-1: The First 1 m Resolution National-Scale Land-Cover Map of China Created with a Deep Learning Framework and Open-Access Data. Earth Syst. Sci. Data 2023, 15, 4749–4780. [Google Scholar] [CrossRef]
- Zha, F.; Lu, L.; Wang, R.; Zhang, S.; Cao, S.; Baqa, M.F.; Li, Q.; Chen, F. Understanding Fine-Scale Heat Health Risks and the Role of Green Infrastructure Based on Remote Sensing and Socioeconomic Data in the Megacity of Beijing, China. Ecol. Indic. 2024, 160, 111847. [Google Scholar] [CrossRef]
- Huang, J.; Shen, S.; Cheng, C.; Song, C. Prefecture-Level Health Risk Assessment for Hot Extremes in China. Int. J. Disaster Risk Reduct. 2024, 108, 104561. [Google Scholar] [CrossRef]
- Cheng, Q.; Sha, S. Resisting the Heat Wave: Revealing Inequalities in Matching between Heat Exposure Risk and Healthcare Services in a Megacity. Appl. Geogr. 2024, 167, 103291. [Google Scholar] [CrossRef]
- Zhang, J.; Yao, X.; Chen, Y.; Lin, M.; Lin, T.; Zheng, Y.; Geng, H.; Zheng, Y.; Wu, X.; Zhang, G.; et al. Spatiotemporal Dynamic Mapping of Heat Exposure Risk for Different Populations in City Based on Hourly Multi-Source Data. Sustain. Cities Soc. 2024, 107, 105454. [Google Scholar] [CrossRef]
- Zhao, X.; Zhao, K.; Huang, X. Population Exposure Risk to Urban Extreme Heat Environment Based on ECOSTRESS Land Surface Temperature and Mobile Phone Signaling Data: A Case Study of Xi’an City. Prog. Geogr. 2022, 11, 2061–2072. [Google Scholar] [CrossRef]
- Song, Y.; Huang, B.; Cai, J.; Chen, B. Dynamic Assessments of Population Exposure to Urban Greenspace Using Multi-Source Big Data. Sci. Total Environ. 2018, 634, 1315–1325. [Google Scholar] [CrossRef]
- Zhang, T.; Wang, L.; Hu, Y.; Zhang, W.; Liu, Y. Measuring Urban Green Space Exposure Based on Street View Images and Machine Learning. Forests 2024, 15, 655. [Google Scholar] [CrossRef]
- Zuo, W.; Song, Y.; He, W. Analysis of Inequity in Urban Greenspace Exposure: A Comparative Study between Growing and Shrinking Cities. Acta Ecol. Sin. 2024, 44, 11109–11120. [Google Scholar] [CrossRef]
- Anselin, L.; Syabri, I.; Kho, Y. GeoDa: An Introduction to Spatial Data Analysis. Geogr. Anal. 2006, 38, 5–22. [Google Scholar] [CrossRef]
- Zhong, M. The Interactive Coercive Relationship Between Urbanization and Eco-Environmental Quality in China. Sustainability 2025, 17, 6019. [Google Scholar] [CrossRef]
- Wang, Y.; Ouyang, W.; Zhang, J. Matching Supply and Demand of Cooling Service Provided by Urban Green and Blue Space. Urban For. Urban Green. 2024, 96, 128338. [Google Scholar] [CrossRef]
- Cheng, M.; Li, Q.; Wen, Z. Coupling Coordination Degree Analysis and Driving Factors of Innovation Network and Eco-Efficiency in China. Environ. Impact Assess. Rev. 2023, 99, 107008. [Google Scholar] [CrossRef]
- Sui, G.; Wang, H.; Cai, S.; Cui, W. Coupling Coordination Analysis of Resources, Economy, and Ecology in the Yellow River Basin. Ecol. Indic. 2023, 156, 111133. [Google Scholar] [CrossRef]
- Zhou, W.; Yu, W.; Wu, T. An Alternative Method of Developing Landscape Strategies for Urban Cooling: A Threshold-Based Perspective. Landsc. Urban Plan. 2022, 225, 104449. [Google Scholar] [CrossRef]
- Massaro, E.; Schifanella, R.; Piccardo, M.; Caporaso, L.; Taubenböck, H.; Cescatti, A.; Duveiller, G. Spatially-Optimized Urban Greening for Reduction of Population Exposure to Land Surface Temperature Extremes. Nat. Commun. 2023, 14, 2903. [Google Scholar] [CrossRef]
- Vasconcelos, L.; Langemeyer, J.; Cole, H.V.S.; Baró, F. Nature-Based Climate Shelters? Exploring Urban Green Spaces as Cooling Solutions for Older Adults in a Warming City. Urban For. Urban Green. 2024, 98, 128408. [Google Scholar] [CrossRef]
- Jiang, L.; Liu, S.; Liu, C. The Contributions of Blue-Green Infrastructure to Building Urban Climatic Resilience—Bibliometric Analysis Based on Co-Citation Networks. Landsc. Archit. Front. 2021, 9, 8–23. [Google Scholar] [CrossRef]
- García Sánchez, F.; Govindarajulu, D. Integrating Blue-Green Infrastructure in Urban Planning for Climate Adaptation: Lessons from Chennai and Kochi, India. Land Use Policy 2023, 124, 106455. [Google Scholar] [CrossRef]
- Tieskens, K.F.; Smith, I.A.; Jimenez, R.B.; Hutyra, L.R.; Fabian, M.P. Mapping the Gaps between Cooling Benefits of Urban Greenspace and Population Heat Vulnerability. Sci. Total Environ. 2022, 845, 157283. [Google Scholar] [CrossRef]
- Jay, O.; Capon, A.; Berry, P.; Broderick, C.; de Dear, R.; Havenith, G.; Honda, Y.; Kovats, R.S.; Ma, W.; Malik, A.; et al. Reducing the Health Effects of Hot Weather and Heat Extremes: From Personal Cooling Strategies to Green Cities. Lancet 2021, 398, 709–724. [Google Scholar] [CrossRef]
- Fang, Y.; Du, X.; Zhao, H.; Hu, M.; Xu, X. Assessment of Green Roofs’ Potential to Improve the Urban Thermal Environment: The Case of Beijing. Environ. Res. 2023, 237, 116857. [Google Scholar] [CrossRef]
- Li, R.; Chester, M.V.; Middel, A.; Vanos, J.K.; Hernandez-Cortes, D.; Buo, I.; Hondula, D.M. Effectiveness of Travel Behavior and Infrastructure Change to Mitigate Heat Exposure. Front. Sustain. Cities 2023, 5, 1129388. [Google Scholar] [CrossRef]
- Chen, X.; He, B.-J. Planning for Heat-Resilient 15 Min-Cities: Opportunities, Measurement, Mechanism, and Pathways. Environ. Impact Assess. Rev. 2024, 105, 107406. [Google Scholar] [CrossRef]
- Gilligan, C. Cooling Effects of Urban Trees Are Strongest in Under-Resourced Neighbourhoods. Nat. Rev. Earth Env. 2023, 4, 517. [Google Scholar] [CrossRef]
- Zuo, J.; Shi, M.; Jia, W.; Yan, Y.; Song, X.; Shen, R.; He, J. Reducing Heat Exposure from Personal Cooling Strategies to Green City Construction in China’s Tropical City. Sci. Total Environ. 2024, 927, 171955. [Google Scholar] [CrossRef] [PubMed]
Disclaimer/Publisher’s Note: The statements, opinions and data contained in all publications are solely those of the individual author(s) and contributor(s) and not of MDPI and/or the editor(s). MDPI and/or the editor(s) disclaim responsibility for any injury to people or property resulting from any ideas, methods, instructions or products referred to in the content. |
© 2025 by the authors. Licensee MDPI, Basel, Switzerland. This article is an open access article distributed under the terms and conditions of the Creative Commons Attribution (CC BY) license (https://creativecommons.org/licenses/by/4.0/).