Temporal Evolution of Multi-Dimensional Built Environment Perceptions and Street Vitality: A Longitudinal Analysis in Rapidly Urbanizing Cities
Abstract
1. Introduction
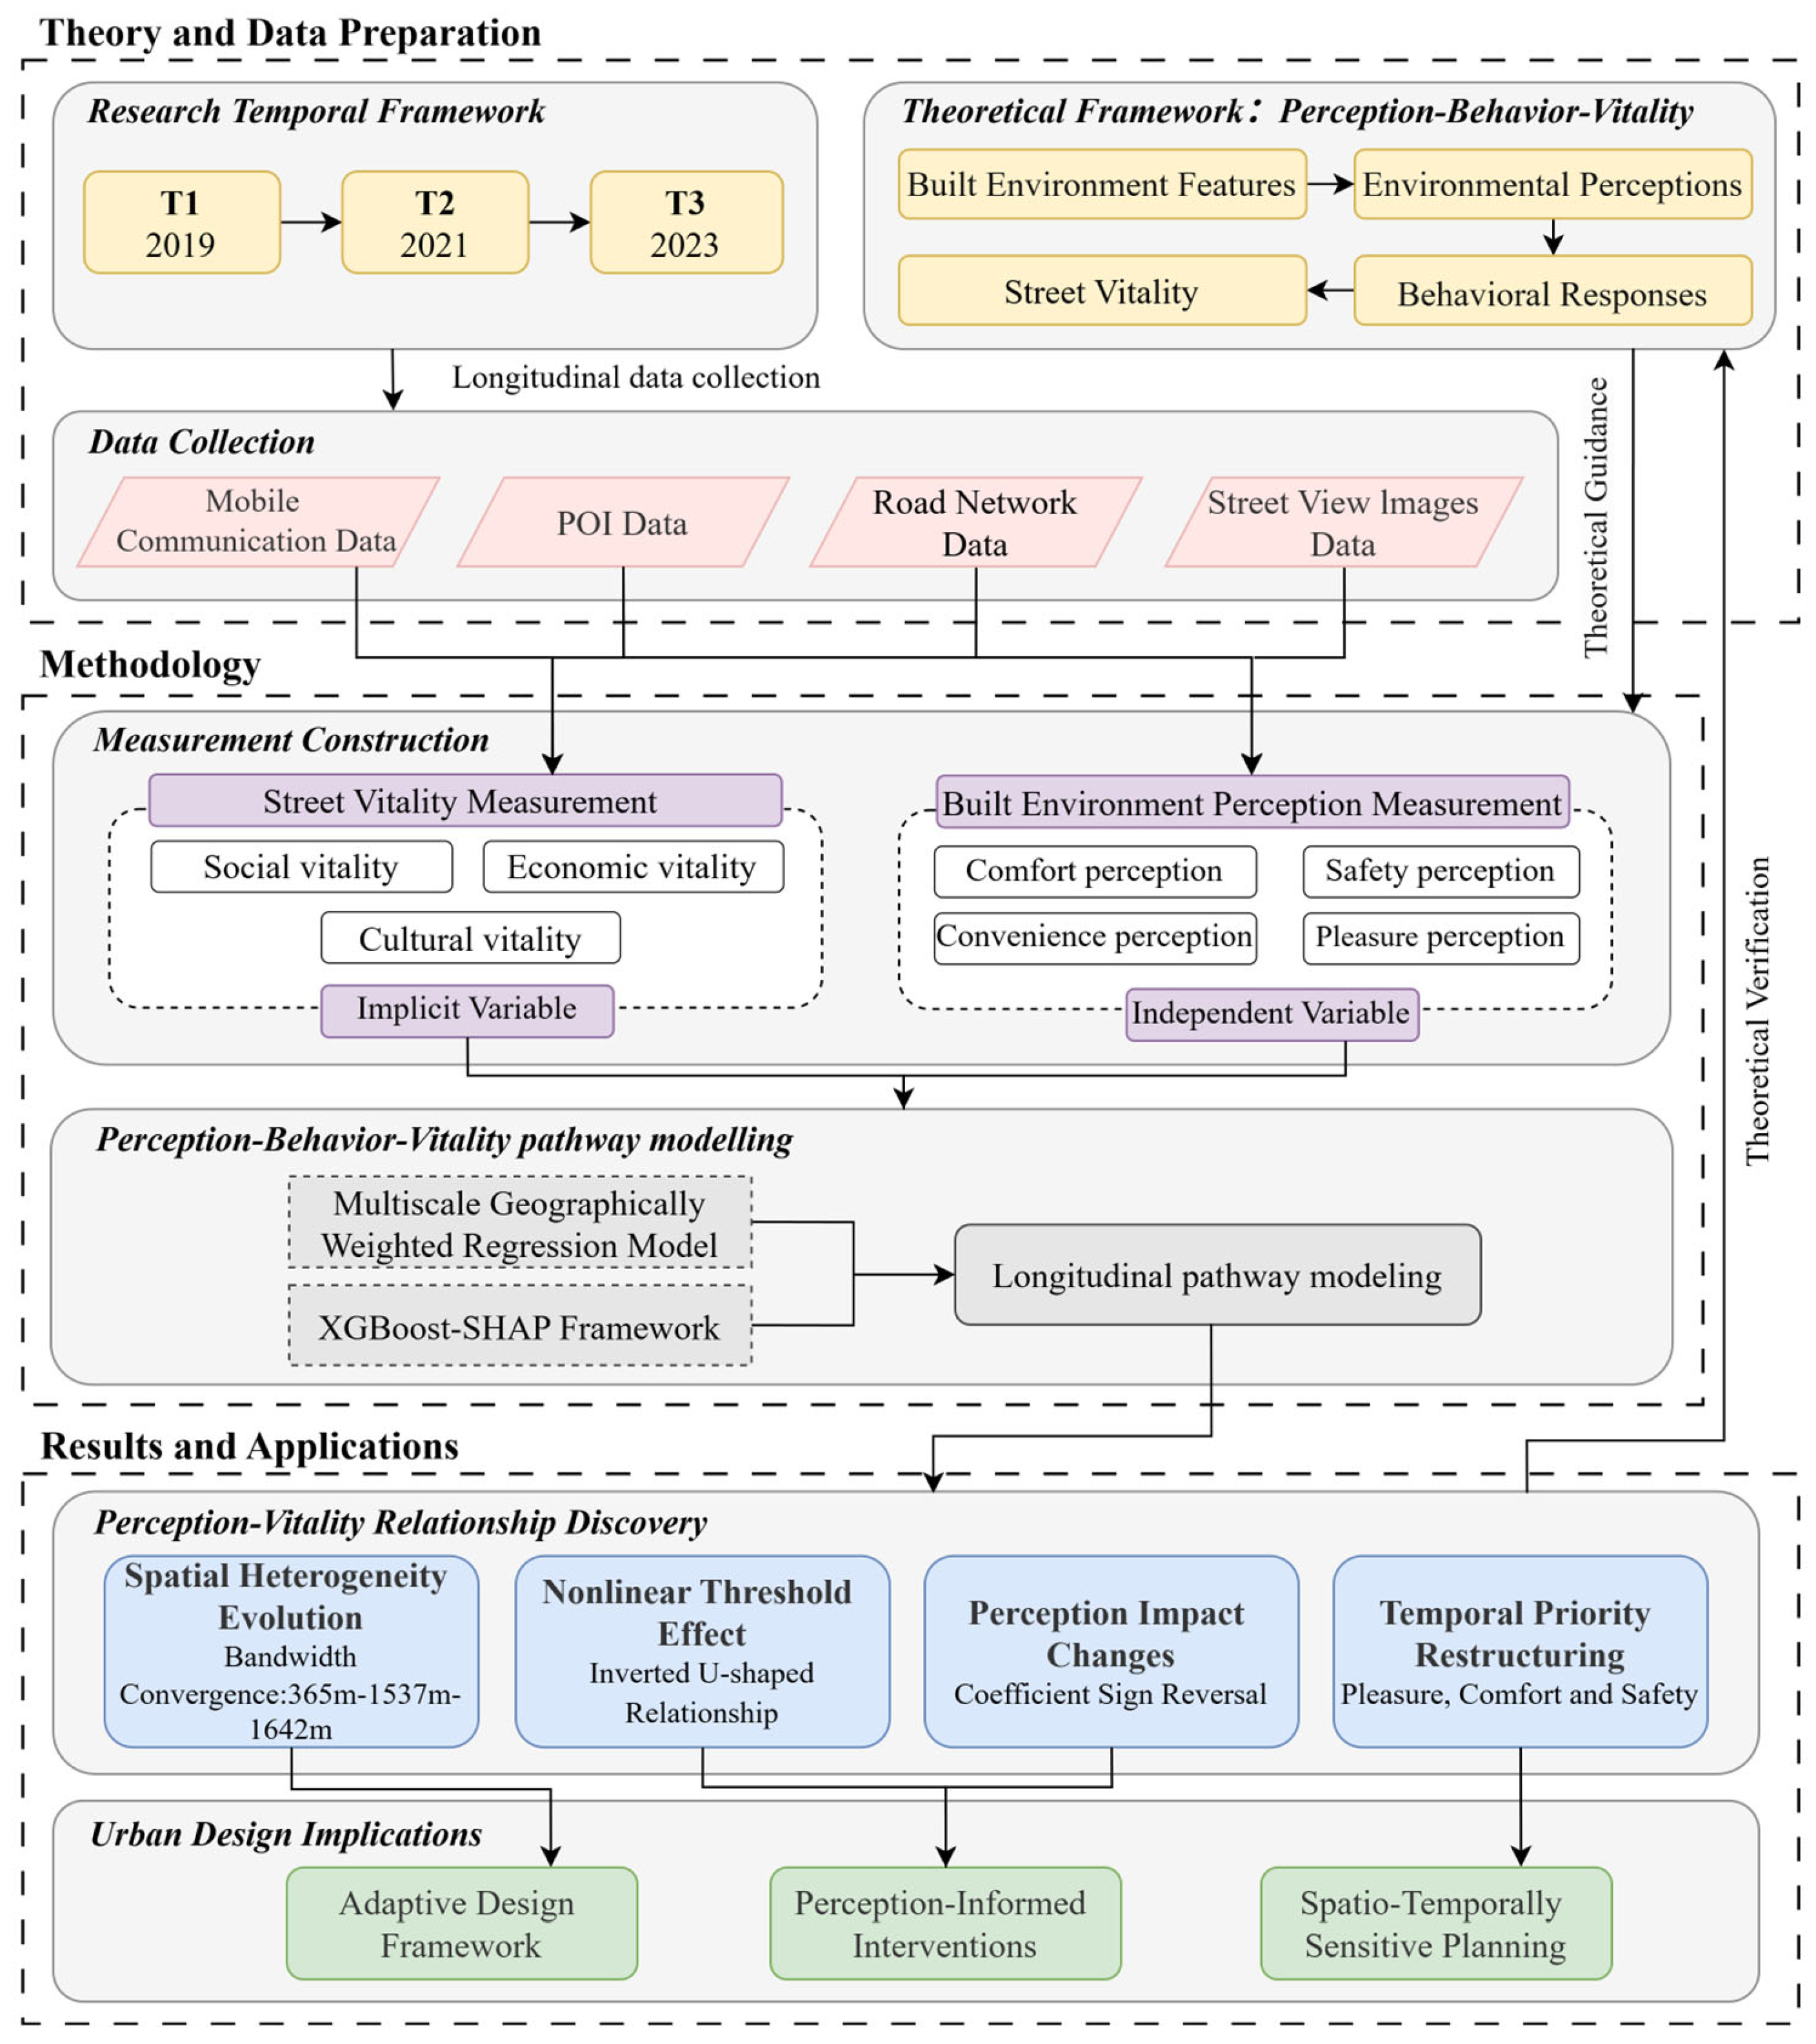
2. Data and Methods
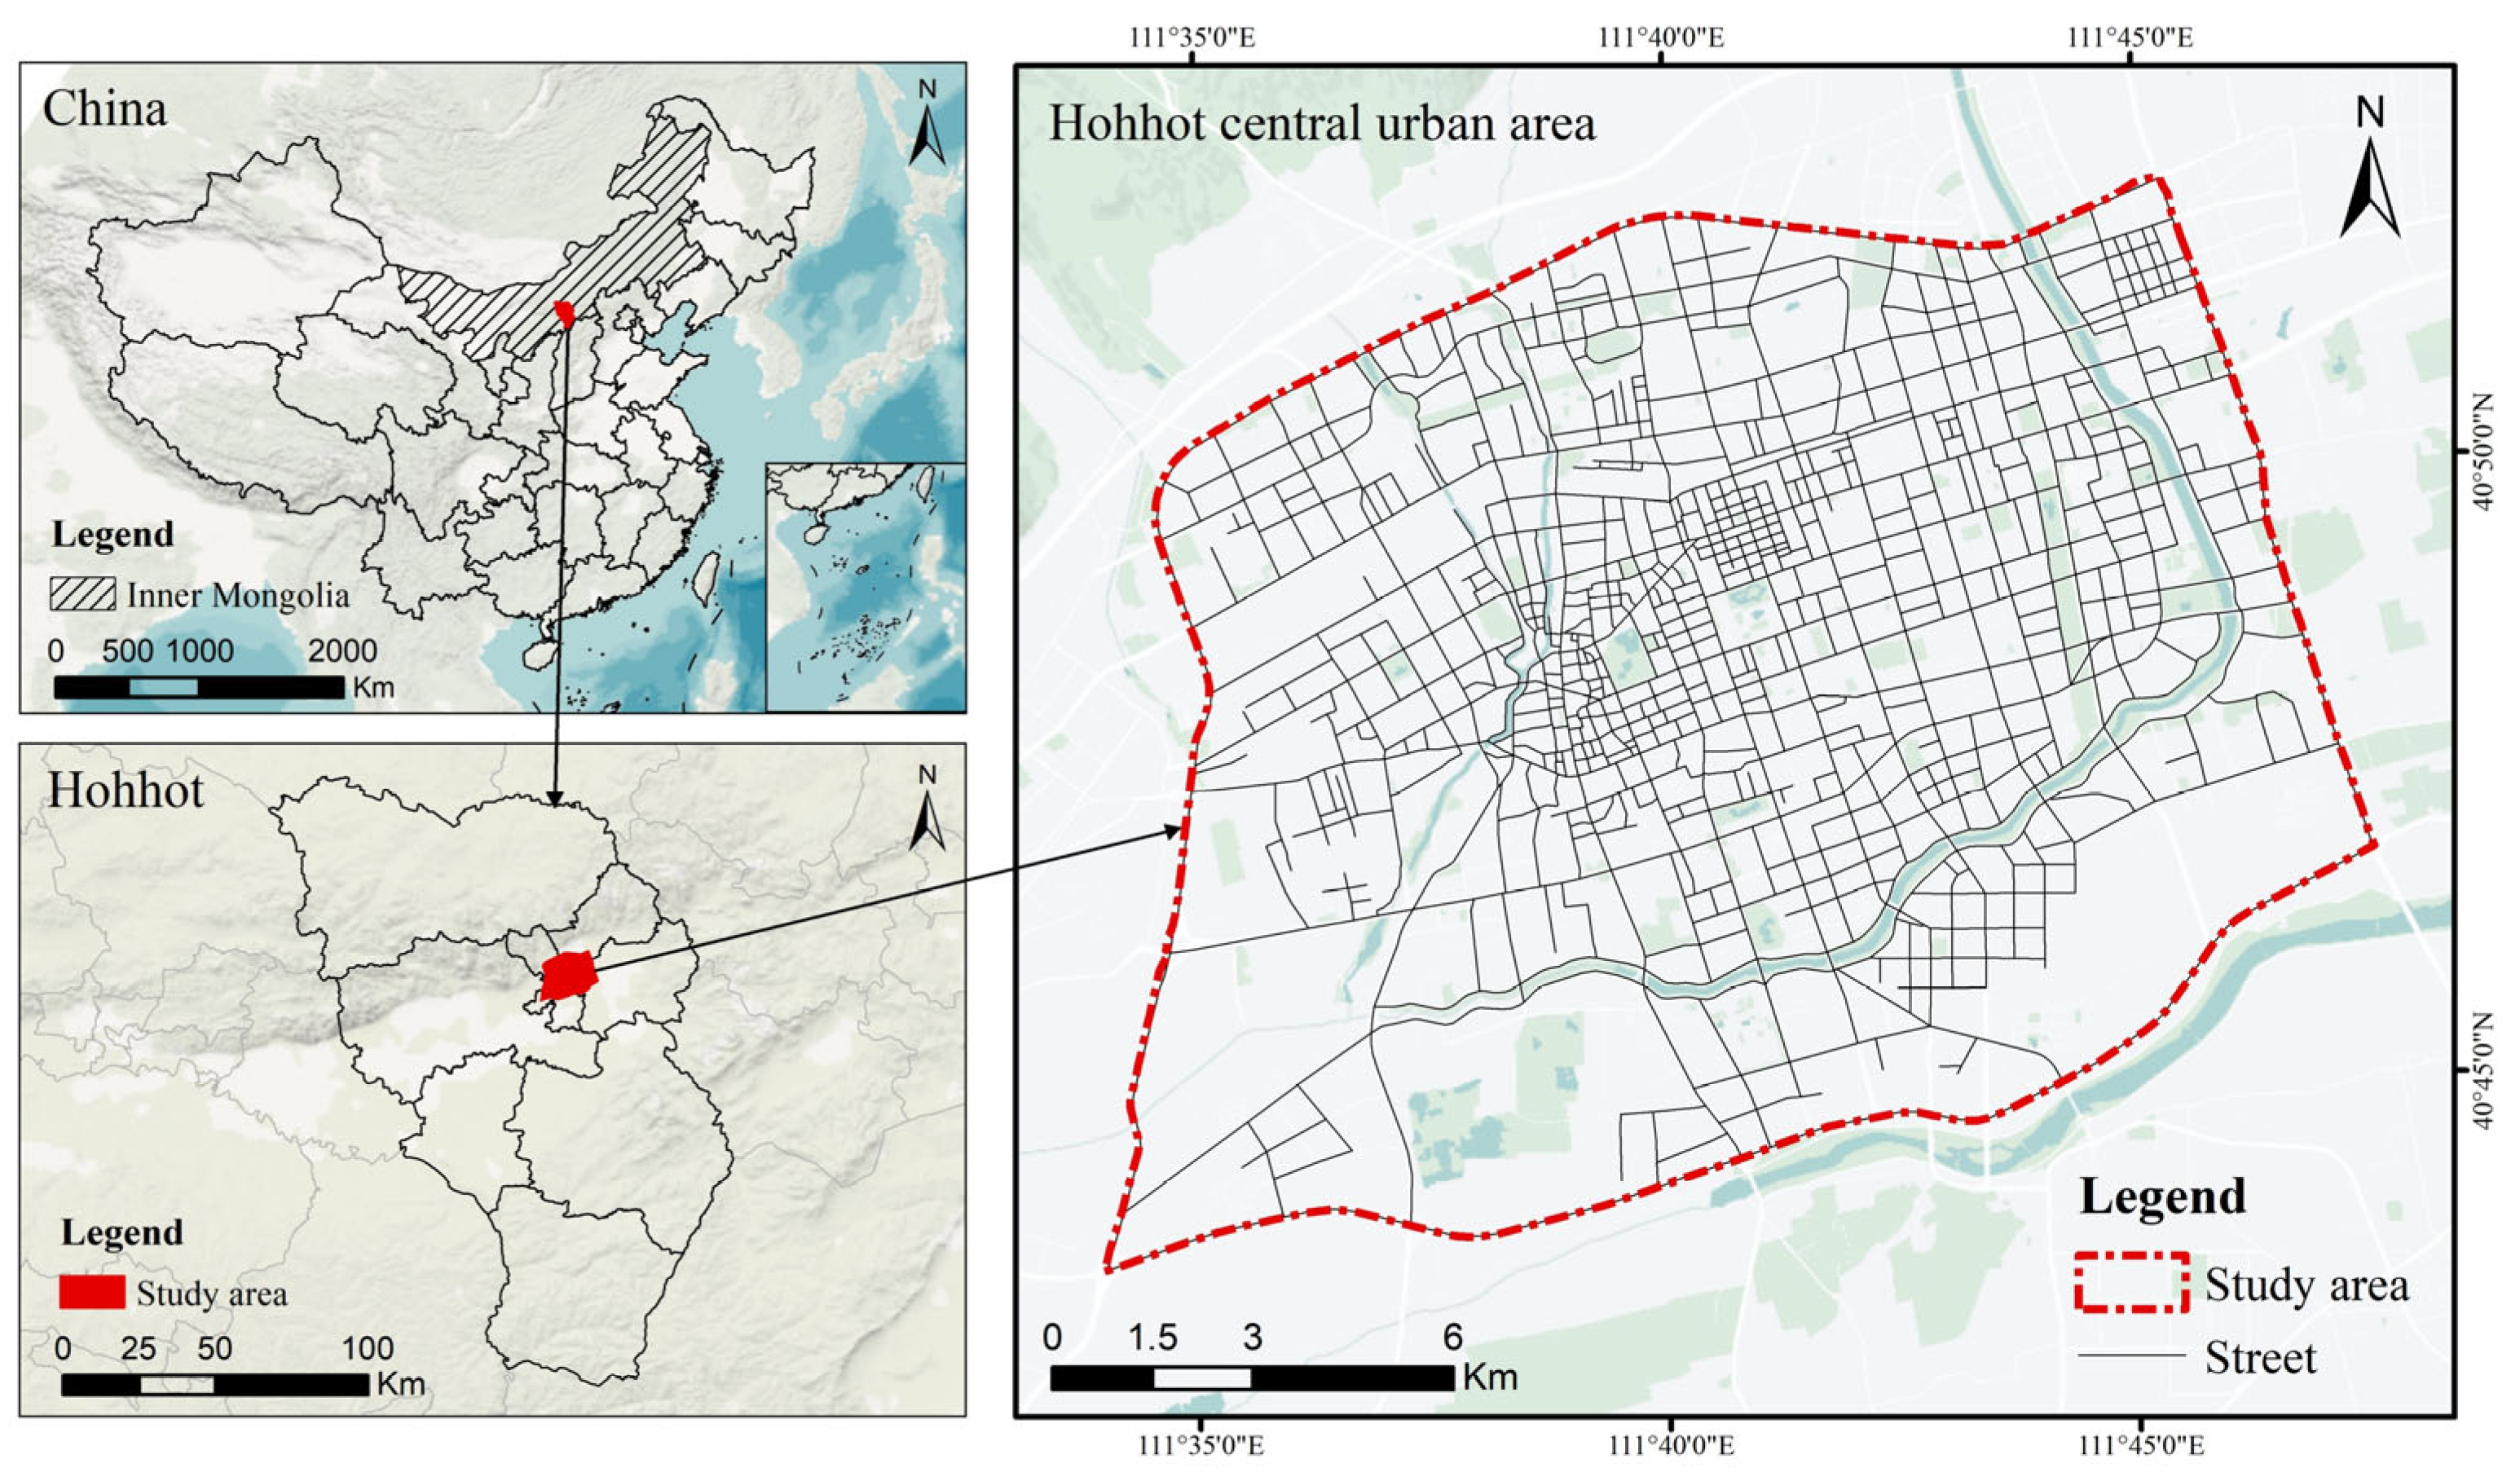
2.1. Study Area
2.2. Data Sources and Processing
2.2.1. Road Network Data
2.2.2. Mobile Phone Signaling Data
2.2.3. POI Data
2.2.4. Street View Imagery
2.3. Methodology
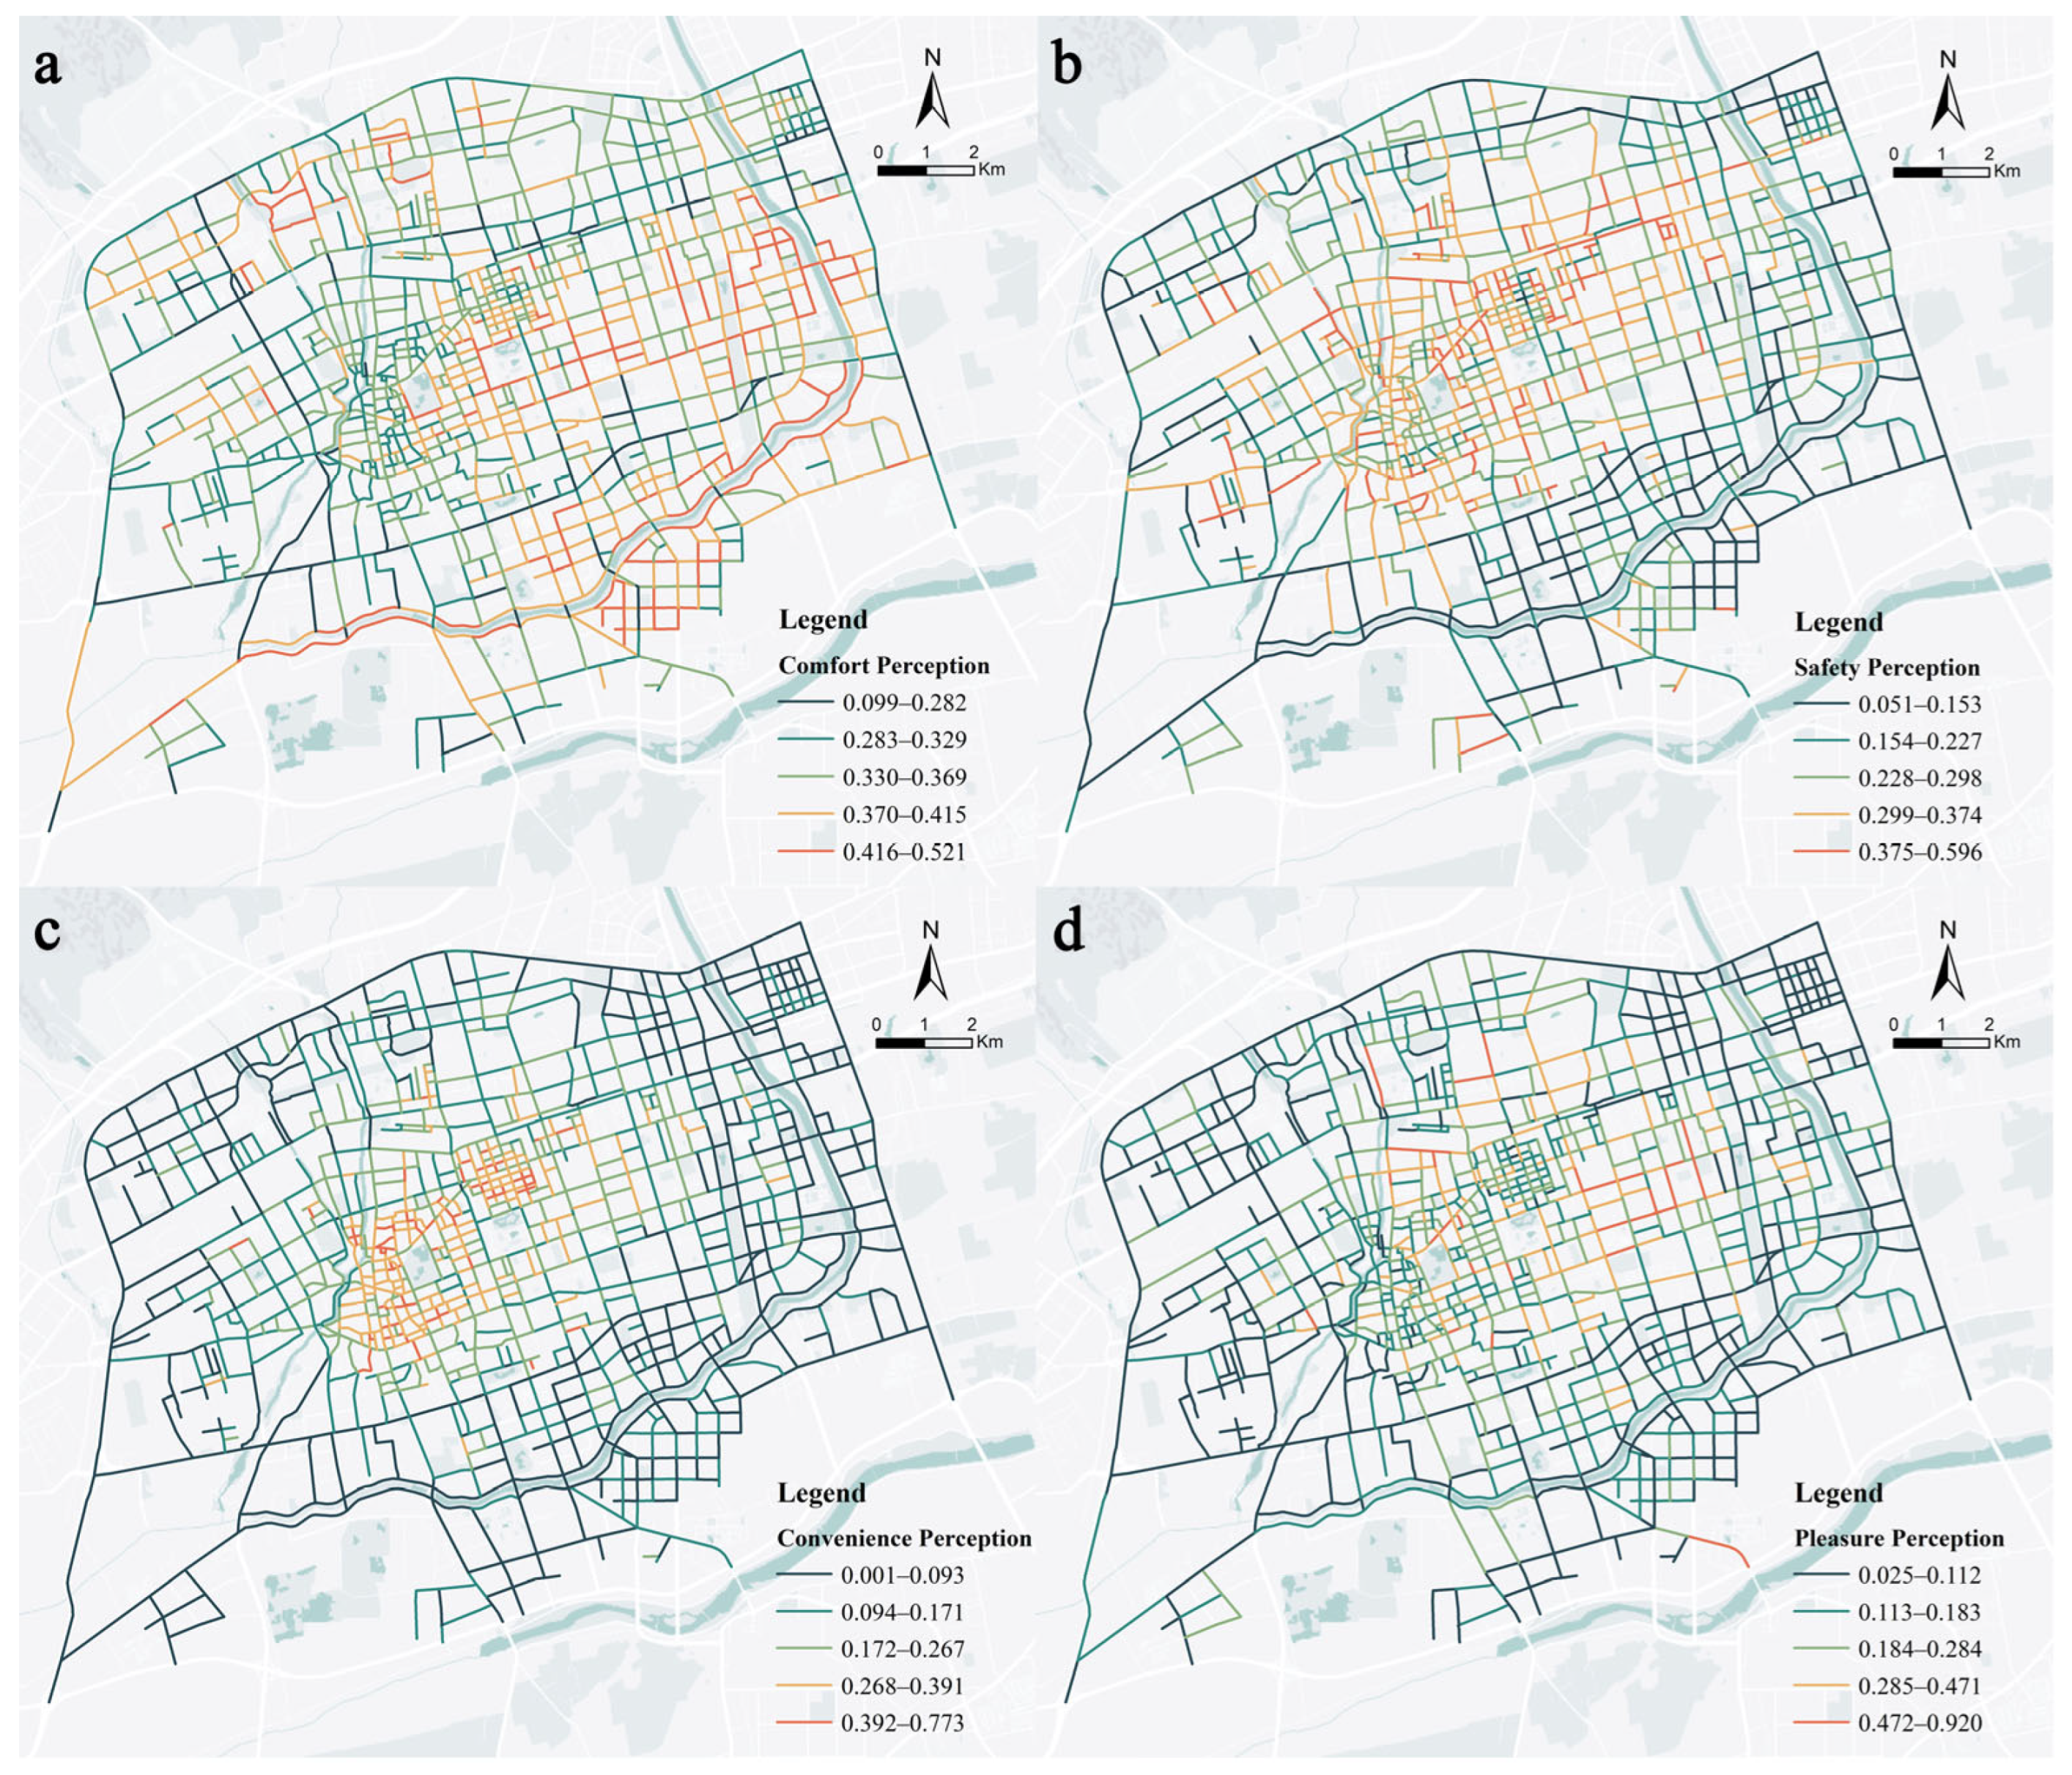
2.3.1. Street Vitality and Built Environment Perception Measurement
| Category | Variable | Sub-Variable | Formula | Description |
|---|---|---|---|---|
| Street Vitality | Social Vitality | Population Density Index (PDI) | : number of users at time ; : street area | |
| Vitality Stability Index (VSI) [52,53] | : vitality at time ; : number of time periods | |||
| Economic Vitality | Commercial Facility Density (CFD) | : number of commercial facilities; : street length | ||
| Cultural Vitality | Cultural Facility Density (CuFD) [54,55] | : different types of cultural facilities | ||
| Built Environment Perception | Comfort Perception | Green View Index (GVI) | : green pixels; : total pixels | |
| Sky View Index (SVI) [26] | : sky pixels | |||
| Interface Enclosure Index (IEI) [59] | : building/wall pixels | |||
| Street Cleanliness Index (SCI) [60] | Machine Learning Score | Based on street view image analysis | ||
| Safety Perception | Sidewalk Visibility Index (SwVI) [61] | : sidewalk pixels | ||
| Traffic Safety Facility Index (TSFI) [62] | : safety facility pixels | |||
| Vehicle Impact Index (VII) [61] | : vehicle pixels | |||
| Pedestrian Safety Index (PSI) [63] | Machine Learning Score | Based on street view image analysis | ||
| Built Environment Perception | Convenience Perception | Function Density Index (FDI) | : number of POIs | |
| Land Use Diversity Index (LDI) [64] | : number of type POIs | |||
| Public Transit Index (PTI) [61] | : number of transit POIs | |||
| Facility Convenience Index (FCI) [65] | : facility pixels | |||
| Pleasure Perception | Color Richness Index (CRI) [66] | : area of color ; : total analyzed area | ||
| Feature Business Index (FBI) [65] | : number of featured businesses | |||
| Landscape Aesthetic Index (LAI) [63] | Machine Learning Score | Based on street view image analysis | ||
| Cultural Atmosphere Index (CAI) [67] | Machine Learning Score | Based on street view image analysis |
2.3.2. MGWR Analysis
2.3.3. XGBoost-SHAP Framework
3. Results
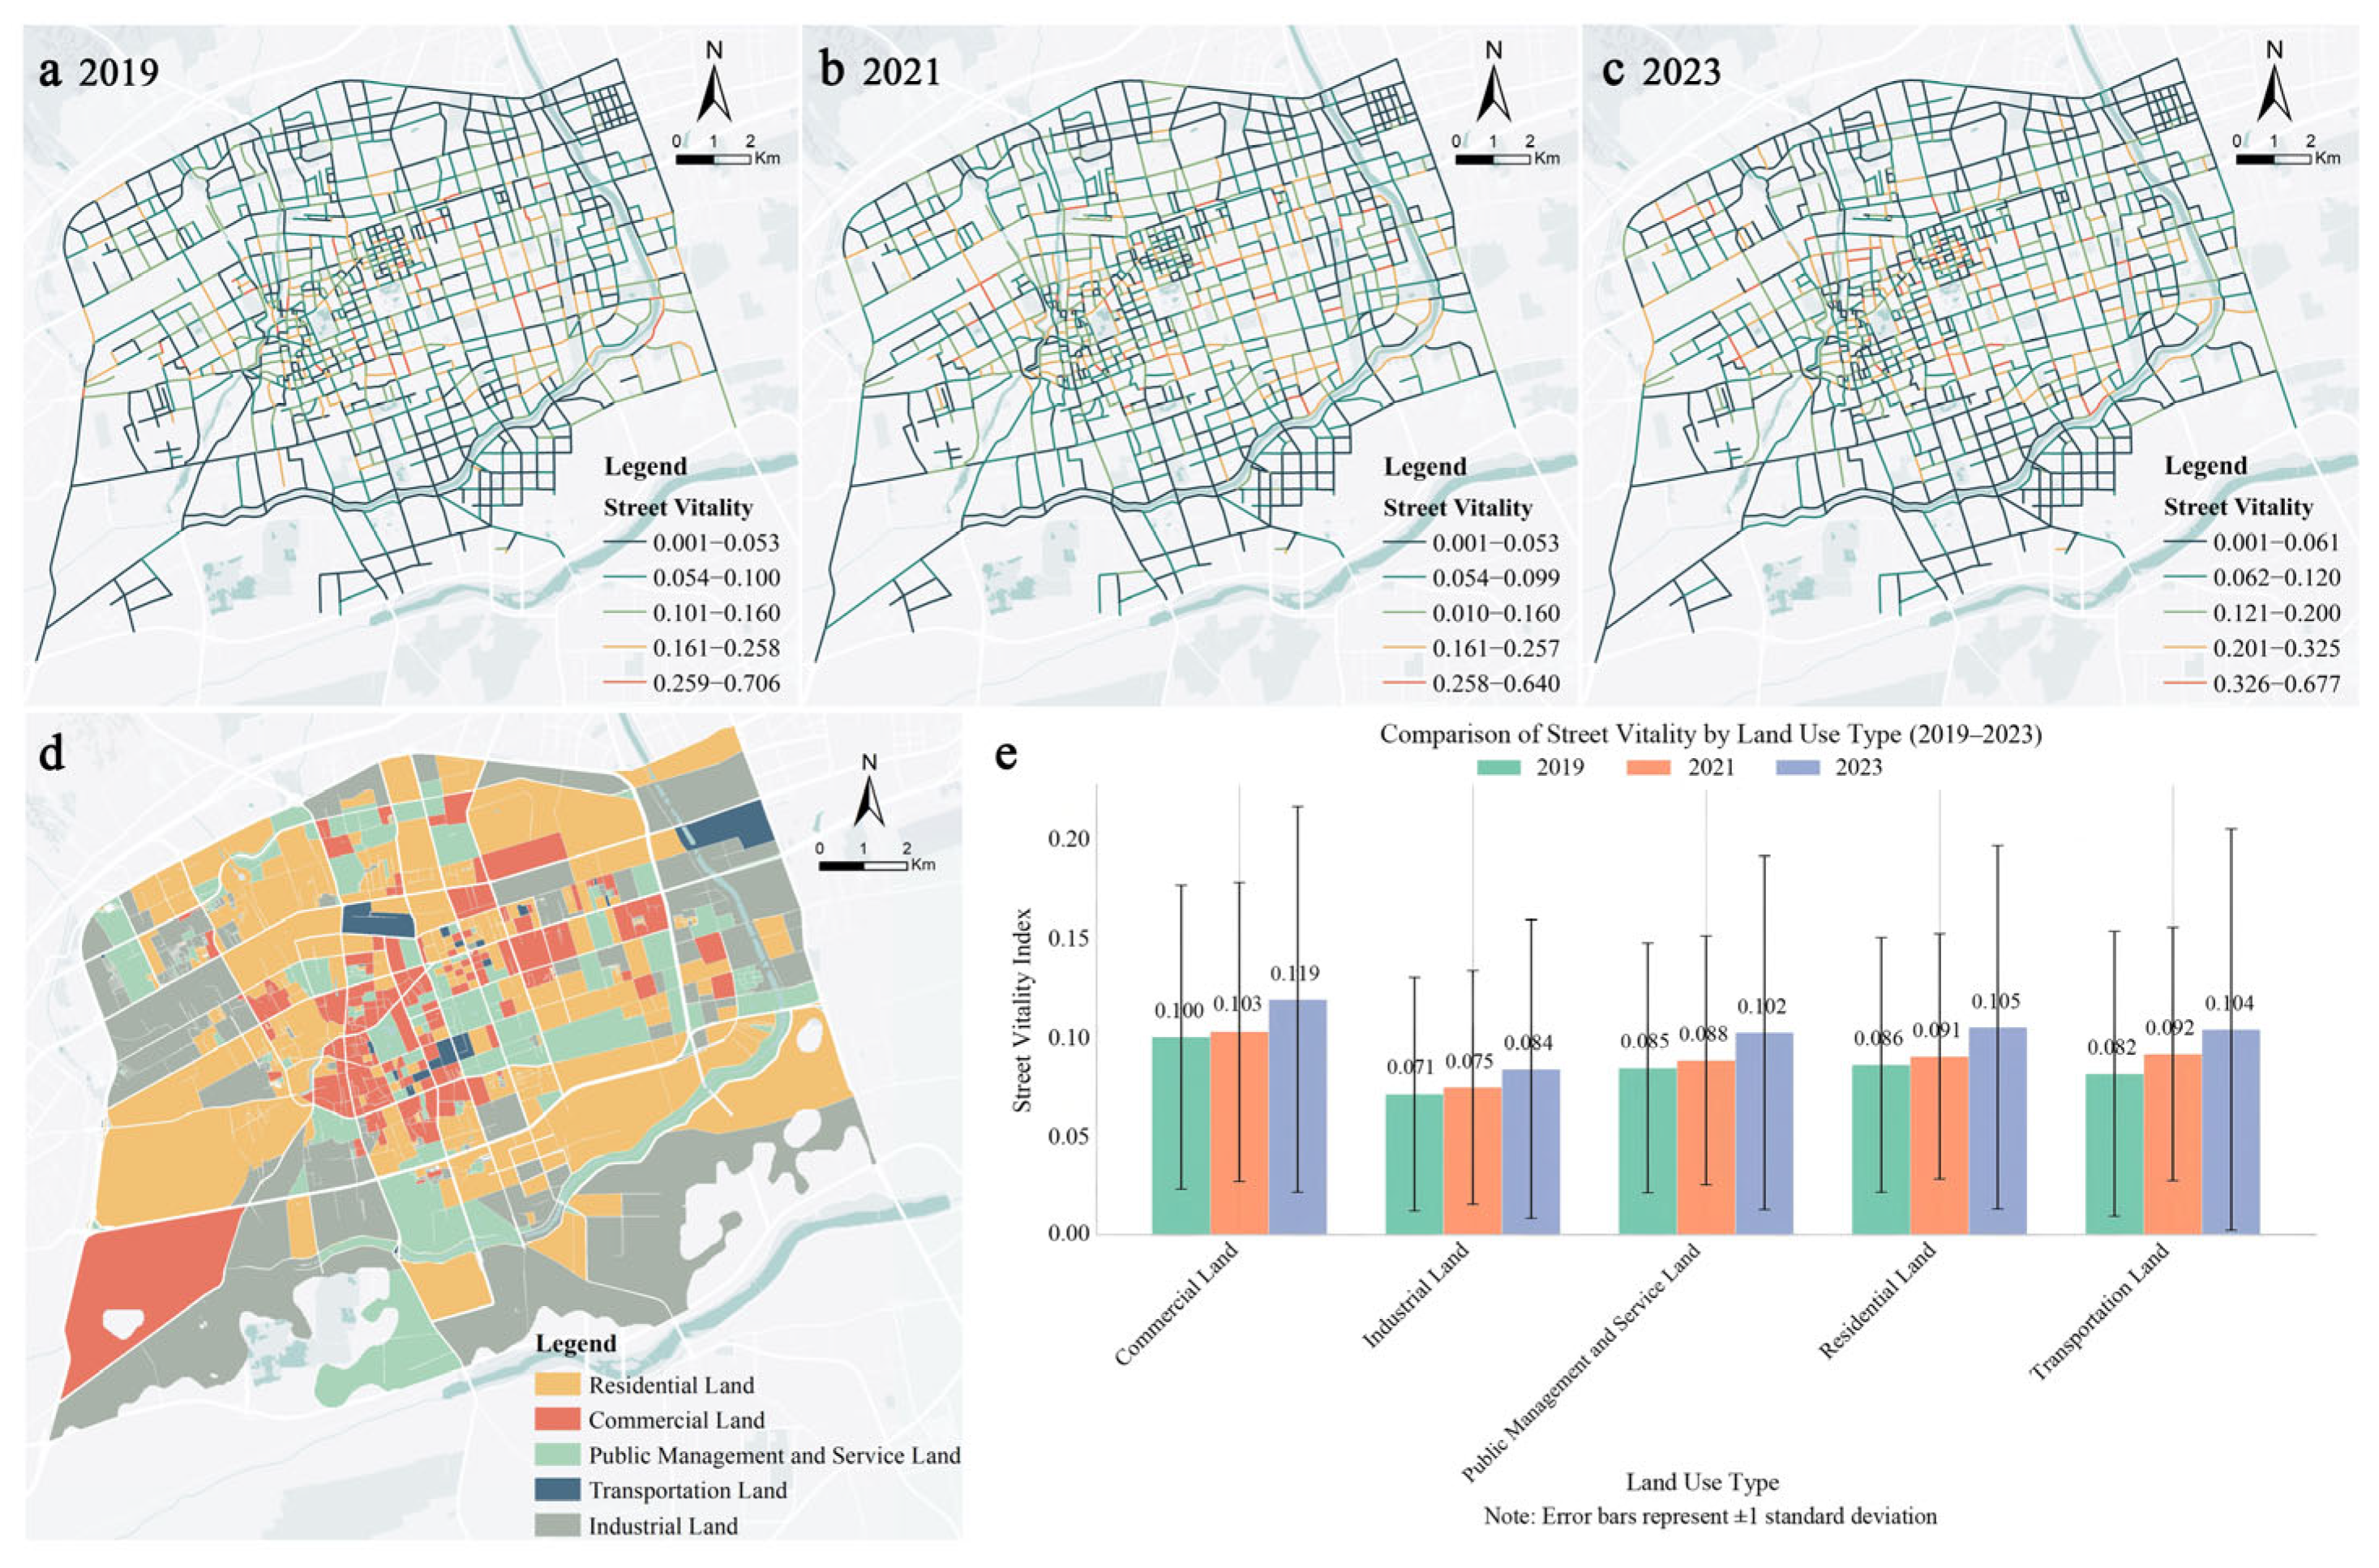
3.1. Temporal Evolution and Spatial Distribution Patterns Across Land Use Types
3.2. MGWR Analysis Results: Temporal Evolution of Spatial Heterogeneity (2019–2023)
3.2.1. Temporal Shifts in Bandwidth and Model Structure
3.2.2. Temporal Evolution of Coefficient Magnitudes and Signs
3.2.3. Spatial Patterns and Their Temporal Evolution
3.2.4. Synthesis of Temporal and Spatial Patterns
3.3. Machine-Learning-Based Nonlinear Analysis
4. Discussion
4.1. Addressing Urban Form Optimization Through Spatial Heterogeneity Insights
4.2. Enhancing Public Space Design Through Nonlinear Threshold Understanding
4.3. Informing Socio-Spatial Equity Through Temporal Priority Understanding
4.4. Differentiated Policy Framework Based on Perceptual Thresholds
4.5. Critical Reflections and Theoretical Contributions
5. Conclusions
Supplementary Materials
Author Contributions
Funding
Institutional Review Board Statement
Informed Consent Statement
Data Availability Statement
Acknowledgments
Conflicts of Interest
References
- Jiang, Y.; Han, Y.; Liu, M.; Ye, Y. Street vitality and built environment features: A data-informed approach from fourteen Chinese cities. Sustain. Cities Soc. 2022, 79, 103724. [Google Scholar] [CrossRef]
- Barrington-Leigh, C.; Millard-Ball, A. Global trends toward urban street-network sprawl. Proc. Natl. Acad. Sci. USA 2020, 117, 1941–1950. [Google Scholar] [CrossRef] [PubMed]
- Wu, C.; Ye, X.; Ren, F.; Du, Q. Check-in behaviour and spatio-temporal vibrancy: An exploratory analysis in Shenzhen, China. Cities 2018, 77, 104–116. [Google Scholar] [CrossRef]
- Li, X.; Zhang, C.; Li, W. Does the visibility of greenery increase perceived safety in urban areas? Evidence from the place pulse 1.0 dataset. ISPRS Int. J. Geo-Inf. 2015, 4, 1166–1183. [Google Scholar] [CrossRef]
- Bai, X.; Zhou, M.; Li, W. Analysis of the influencing factors of vitality and built environment of shopping centers based on mobile-phone signaling data. PLoS ONE 2024, 19, e0296261. [Google Scholar] [CrossRef]
- De Groot, J.I. Environmental Psychology: An Introduction; John Wiley & Sons: Hoboken, NJ, USA, 2019. [Google Scholar]
- Lundberg, S. A unified approach to interpreting model predictions. arXiv 2017, arXiv:1705.07874. [Google Scholar] [CrossRef]
- Wen, W.; Imamizu, H. The sense of agency in perception, behaviour and human–machine interactions. Nat. Rev. Psychol. 2022, 1, 211–222. [Google Scholar] [CrossRef]
- Wangbao, L. Spatial impact of the built environment on street vitality: A case study of the Tianhe District, Guangzhou. Front. Environ. Sci. 2022, 10, 966562. [Google Scholar] [CrossRef]
- Wu, W.; Niu, X. Influence of built environment on urban vitality: Case study of Shanghai using mobile phone location data. J. Urban Plan. Dev. 2019, 145, 04019007. [Google Scholar] [CrossRef]
- Cranshaw, J.; Schwartz, R.; Hong, J.; Sadeh, N. The livehoods project: Utilizing social media to understand the dynamics of a city. In Proceedings of the International AAAI Conference on Web and Social Media, Dublin, Ireland, 4–7 June 2012; pp. 58–65. [Google Scholar]
- Li, Z.; Zhao, G. Revealing the Spatio-Temporal Heterogeneity of the Association between the Built Environment and Urban Vitality in Shenzhen. ISPRS Int. J. Geo-Inf. 2023, 12, 433. [Google Scholar] [CrossRef]
- Liu, Z.; Fang, C.; Li, H.; Wu, J.; Zhou, L.; Werner, M. Efficiency and equality of the multimodal travel between public transit and bike-sharing accounting for multiscale. Sustain. Cities Soc. 2024, 101, 105096. [Google Scholar] [CrossRef]
- Zhang, L.; Ye, Y.; Zeng, W.; Chiaradia, A. A systematic measurement of street quality through multi-sourced urban data: A human-oriented analysis. Int. J. Environ. Res. Public Health 2019, 16, 1782. [Google Scholar] [CrossRef] [PubMed]
- Long, Y.; Huang, C. Does block size matter? The impact of urban design on economic vitality for Chinese cities. Environ. Plan. B Urban Anal. City Sci. 2019, 46, 406–422. [Google Scholar] [CrossRef]
- Liu, X.; He, J.; Yao, Y.; Zhang, J.; Liang, H.; Wang, H.; Hong, Y. Classifying urban land use by integrating remote sensing and social media data. Int. J. Geogr. Inf. Sci. 2017, 31, 1675–1696. [Google Scholar] [CrossRef]
- Ye, Y.; Li, D.; Liu, X. How block density and typology affect urban vitality: An exploratory analysis in Shenzhen, China. Urban Geogr. 2018, 39, 631–652. [Google Scholar] [CrossRef]
- Deng, J.S.; Wang, K.; Hong, Y.; Qi, J.G. Spatio-temporal dynamics and evolution of land use change and landscape pattern in response to rapid urbanization. Landsc. Urban Plan. 2009, 92, 187–198. [Google Scholar] [CrossRef]
- Chen, L.; Yao, X.; Liu, Y.; Zhu, Y.; Chen, W.; Zhao, X.; Chi, T. Measuring impacts of urban environmental elements on housing prices based on multisource data—A case study of Shanghai, China. ISPRS Int. J. Geo-Inf. 2020, 9, 106. [Google Scholar] [CrossRef]
- Moser, G.; Uzzell, D. Environmental psychology. Compr. Handb. Psychol. 2003, 5, 419–445. [Google Scholar]
- Naik, N.; Philipoom, J.; Raskar, R.; Hidalgo, C. Streetscore-predicting the perceived safety of one million streetscapes. In Proceedings of the IEEE Conference on Computer Vision and Pattern Recognition Workshops, Columbus, OH, USA, 23–28 June 2014; pp. 779–785. [Google Scholar]
- Yao, Y.; Li, X.; Liu, X.; Liu, P.; Liang, Z.; Zhang, J.; Mai, K. Sensing spatial distribution of urban land use by integrating points-of-interest and Google Word2Vec model. Int. J. Geogr. Inf. Sci. 2017, 31, 825–848. [Google Scholar] [CrossRef]
- Angel, A.; Cohen, A.; Nelson, T.; Plaut, P. Evaluating the relationship between walking and street characteristics based on big data and machine learning analysis. Cities 2024, 151, 105111. [Google Scholar] [CrossRef]
- Kalaycı Önaç, A.; Birişçi, T. Transformation of urban landscape value perception over time: A Delphi technique application. Environ. Monit. Assess. 2019, 191, 741. [Google Scholar] [CrossRef] [PubMed]
- Oshan, T.M.; Li, Z.; Kang, W.; Wolf, L.J.; Fotheringham, A.S. mgwr: A Python implementation of multiscale geographically weighted regression for investigating process spatial heterogeneity and scale. ISPRS Int. J. Geo-Inf. 2019, 8, 269. [Google Scholar] [CrossRef]
- Wu, C.; Ye, Y.; Gao, F.; Ye, X. Using street view images to examine the association between human perceptions of locale and urban vitality in Shenzhen, China. Sustain. Cities Soc. 2023, 88, 104291. [Google Scholar] [CrossRef]
- Shi, Y.; Zheng, J.; Pei, X. Measurement method and influencing mechanism of urban subdistrict vitality in shanghai based on multisource data. Remote Sens. 2023, 15, 932. [Google Scholar] [CrossRef]
- Wang, H.; Tang, J.; Xu, P.; Chen, R.; Yao, H. Research on the influence mechanism of Street vitality in mountainous cities based on a bayesian network: A case study of the Main Urban Area of Chongqing. Land 2022, 11, 728. [Google Scholar] [CrossRef]
- Li, J.; Lin, S.; Kong, N.; Ke, Y.; Zeng, J.; Chen, J. Nonlinear and Synergistic Effects of Built Environment Indicators on Street Vitality: A Case Study of Humid and Hot Urban Cities. Sustainability 2024, 16, 1731. [Google Scholar] [CrossRef]
- Zou, H.; Liu, R.; Cheng, W.; Lei, J.; Ge, J. The association between street built environment and street vitality based on quantitative analysis in historic areas: A case study of wuhan, china. Sustainability 2023, 15, 1732. [Google Scholar] [CrossRef]
- Gehl, J. Cities for People; Island Press: Washington, DC, USA, 2013. [Google Scholar]
- Wu, F. Planning for Growth: Urban and Regional Planning in China; Routledge: London, UK, 2015. [Google Scholar]
- Zhao, K.; Guo, J.; Ma, Z.; Wu, W. Exploring the spatiotemporal heterogeneity and stationarity in the relationship between street vitality and built environment. SAGE Open 2023, 13, 21582440231152226. [Google Scholar] [CrossRef]
- Li, M.; Pan, J. Assessment of Influence Mechanisms of Built Environment on Street Vitality Using Multisource Spatial Data: A Case Study in Qingdao, China. Sustainability 2023, 15, 1518. [Google Scholar] [CrossRef]
- Chen, D.; Zhang, F.; Jim, C.Y.; Bahtebay, J. Spatio-temporal evolution of landscape patterns in an oasis city. Environ. Sci. Pollut. Res. 2023, 30, 3872–3886. [Google Scholar] [CrossRef]
- Li, Z. Extracting spatial effects from machine learning model using local interpretation method: An example of SHAP and XGBoost. Comput. Environ. Urban Syst. 2022, 96, 101845. [Google Scholar] [CrossRef]
- Fotheringham, A.S.; Yang, W.; Kang, W. Multiscale geographically weighted regression (MGWR). Ann. Am. Assoc. Geogr. 2017, 107, 1247–1265. [Google Scholar] [CrossRef]
- Wu, S.; Wang, Z.; Du, Z.; Huang, B.; Zhang, F.; Liu, R. Geographically and temporally neural network weighted regression for modeling spatiotemporal non-stationary relationships. Int. J. Geogr. Inf. Sci. 2021, 35, 582–608. [Google Scholar] [CrossRef]
- Ministry of Construction of the People’s Republic of China. National Standard of the People’s Republic of China: Code for Transport Planning on Urban Road; China Planning Press: Beijing, China, 1995.
- Tu, W.; Cao, J.; Yue, Y.; Shaw, S.-L.; Zhou, M.; Wang, Z.; Chang, X.; Xu, Y.; Li, Q. Coupling mobile phone and social media data: A new approach to understanding urban functions and diurnal patterns. Int. J. Geogr. Inf. Sci. 2017, 31, 2331–2358. [Google Scholar] [CrossRef]
- Yue, Y.; Zhuang, Y.; Yeh, A.G.; Xie, J.-Y.; Ma, C.-L.; Li, Q.-Q. Measurements of POI-based mixed use and their relationships with neighbourhood vibrancy. Int. J. Geogr. Inf. Sci. 2017, 31, 658–675. [Google Scholar] [CrossRef]
- Kang, Y.; Zhang, F.; Gao, S.; Peng, W.; Ratti, C. Human settlement value assessment from a place perspective: Considering human dynamics and perceptions in house price modeling. Cities 2021, 118, 103333. [Google Scholar] [CrossRef]
- Qiu, W.; Zhang, Z.; Liu, X.; Li, W.; Li, X.; Xu, X.; Huang, X. Subjective or objective measures of street environment, which are more effective in explaining housing prices? Landsc. Urban Plan. 2022, 221, 104358. [Google Scholar] [CrossRef]
- Cheng, B.; Misra, I.; Schwing, A.G.; Kirillov, A.; Girdhar, R. Masked-attention mask transformer for universal image segmentation. In Proceedings of the IEEE/CVF Conference on Computer Vision and Pattern Recognition, New Orleans, LA, USA, 18–24 June 2022; pp. 1290–1299. [Google Scholar]
- Wu, W.; Ma, Z.; Guo, J.; Niu, X.; Zhao, K. Evaluating the effects of built environment on street vitality at the city level: An empirical research based on spatial panel Durbin model. Int. J. Environ. Res. Public Health 2022, 19, 1664. [Google Scholar] [CrossRef]
- McMillen, D.P. Geographically weighted regression: The analysis of spatially varying relationships. Am. J. Agric. Econ. 2004, 8, 554–556. [Google Scholar] [CrossRef]
- Meng, Y.; Yang, N.; Qian, Z.; Zhang, G. What makes an online review more helpful: An interpretation framework using XGBoost and SHAP values. J. Theor. Appl. Electron. Commer. Res. 2020, 16, 466–490. [Google Scholar] [CrossRef]
- Farzipour, A.; Elmi, R.; Nasiri, H. Detection of Monkeypox cases based on symptoms using XGBoost and Shapley additive explanations methods. Diagnostics 2023, 13, 2391. [Google Scholar] [CrossRef]
- Jiang, D. On the Vitality of Urban Form; Southeast University Press: Nanjing, China, 2007. [Google Scholar]
- Xia, C.; Yeh, A.G.-O.; Zhang, A. Analyzing spatial relationships between urban land use intensity and urban vitality at street block level: A case study of five Chinese megacities. Landsc. Urban Plan. 2020, 193, 103669. [Google Scholar] [CrossRef]
- Jacobs, J. The Death and Life of Great American Cities; Book Unpublished resources; Randoms House: New York, NY, USA, 1961. [Google Scholar]
- Guo, X.; Chen, H.; Yang, X. An evaluation of street dynamic vitality and its influential factors based on multi-source big data. ISPRS Int. J. Geo-Inf. 2021, 10, 143. [Google Scholar] [CrossRef]
- Wu, W.; Niu, X.; Li, M. Influence of built environment on street vitality: A case study of West Nanjing Road in Shanghai based on mobile location data. Sustainability 2021, 13, 1840. [Google Scholar] [CrossRef]
- Jin, A.; Ge, Y.; Zhang, S. Spatial Characteristics of Multidimensional Urban Vitality and Its Impact Mechanisms by the Built Environment. Land 2024, 13, 991. [Google Scholar] [CrossRef]
- Li, Q.; Cui, C.; Liu, F.; Wu, Q.; Run, Y.; Han, Z. Multidimensional urban vitality on streets: Spatial patterns and influence factor identification using multisource urban data. ISPRS Int. J. Geo-Inf. 2021, 11, 2. [Google Scholar] [CrossRef]
- Hillier, B. The Social Logic of Space; Cambridge University: Cambridge, UK, 1984. [Google Scholar]
- Ewing, R.; Handy, S. Measuring the unmeasurable: Urban design qualities related to walkability. J. Urban Des. 2009, 14, 65–84. [Google Scholar] [CrossRef]
- Lynch, K. The image of the environment. Image City 1960, 11, 1–13. [Google Scholar]
- Harvey, C. Measuring Streetscape Design for Livability Using Spatial Data and Methods; The University of Vermont and State Agricultural College: Burlington, VT, USA, 2014. [Google Scholar]
- Tang, J.; Long, Y. Measuring visual quality of street space and its temporal variation: Methodology and its application in the Hutong area in Beijing. Landsc. Urban Plan. 2019, 191, 103436. [Google Scholar] [CrossRef]
- Wang, M.; He, Y.; Meng, H.; Zhang, Y.; Zhu, B.; Mango, J.; Li, X. Assessing street space quality using street view imagery and function-driven method: The case of Xiamen, China. ISPRS Int. J. Geo-Inf. 2022, 11, 282. [Google Scholar] [CrossRef]
- Koo, B.W.; Guhathakurta, S.; Botchwey, N.; Hipp, A. Can good microscale pedestrian streetscapes enhance the benefits of macroscale accessible urban form? An automated audit approach using Google street view images. Landsc. Urban Plan. 2023, 237, 104816. [Google Scholar] [CrossRef]
- Wang, Y.; Qiu, W.; Jiang, Q.; Li, W.; Ji, T.; Dong, L. Drivers or pedestrians, whose dynamic perceptions are more effective to explain street vitality? A case study in Guangzhou. Remote Sens. 2023, 15, 568. [Google Scholar] [CrossRef]
- Im, H.N.; Choi, C.G. The hidden side of the entropy-based land-use mix index: Clarifying the relationship between pedestrian volume and land-use mix. Urban Stud. 2019, 56, 1865–1881. [Google Scholar] [CrossRef]
- Ma, X.; Ma, C.; Wu, C.; Xi, Y.; Yang, R.; Peng, N.; Zhang, C.; Ren, F. Measuring human perceptions of streetscapes to better inform urban renewal: A perspective of scene semantic parsing. Cities 2021, 110, 103086. [Google Scholar] [CrossRef]
- Ding, M. Quantitative contrast of urban agglomeration colors based on image clustering algorithm: Case study of the Xia-Zhang-Quan metropolitan area. Front. Archit. Res. 2021, 10, 692–700. [Google Scholar] [CrossRef]
- Ewing, R.H.; Clemente, O.; Neckerman, K.M.; Purciel-Hill, M.; Quinn, J.W.; Rundle, A. Measuring Urban Design: Metrics for Livable Places; Island Press: Washington, DC, USA, 2013; Volume 200. [Google Scholar]
- Zhang, X.; Wang, C.; Li, E.; Xu, C. Assessment model of ecoenvironmental vulnerability based on improved entropy weight method. Sci. World J. 2014, 2014, 797814. [Google Scholar] [CrossRef]
- Zhu, Y.; Tian, D.; Yan, F. Effectiveness of entropy weight method in decision-making. Math. Probl. Eng. 2020, 2020, 3564835. [Google Scholar] [CrossRef]
- Chen, T.; Guestrin, C. Xgboost: A scalable tree boosting system. In Proceedings of the 22nd Acm Sigkdd International Conference on Knowledge Discovery and Data Mining, San Francisco, CA, USA, 13–17 August 2016; pp. 785–794. [Google Scholar]
- Zhou, S.; Liu, Z.; Wang, M.; Gan, W.; Zhao, Z.; Wu, Z. Impacts of building configurations on urban stormwater management at a block scale using XGBoost. Sustain. Cities Soc. 2022, 87, 104235. [Google Scholar] [CrossRef]
- Chen, Y.; Zhang, X.; Grekousis, G.; Huang, Y.; Hua, F.; Pan, Z.; Liu, Y. Examining the importance of built and natural environment factors in predicting self-rated health in older adults: An extreme gradient boosting (XGBoost) approach. J. Clean. Prod. 2023, 413, 137432. [Google Scholar] [CrossRef]

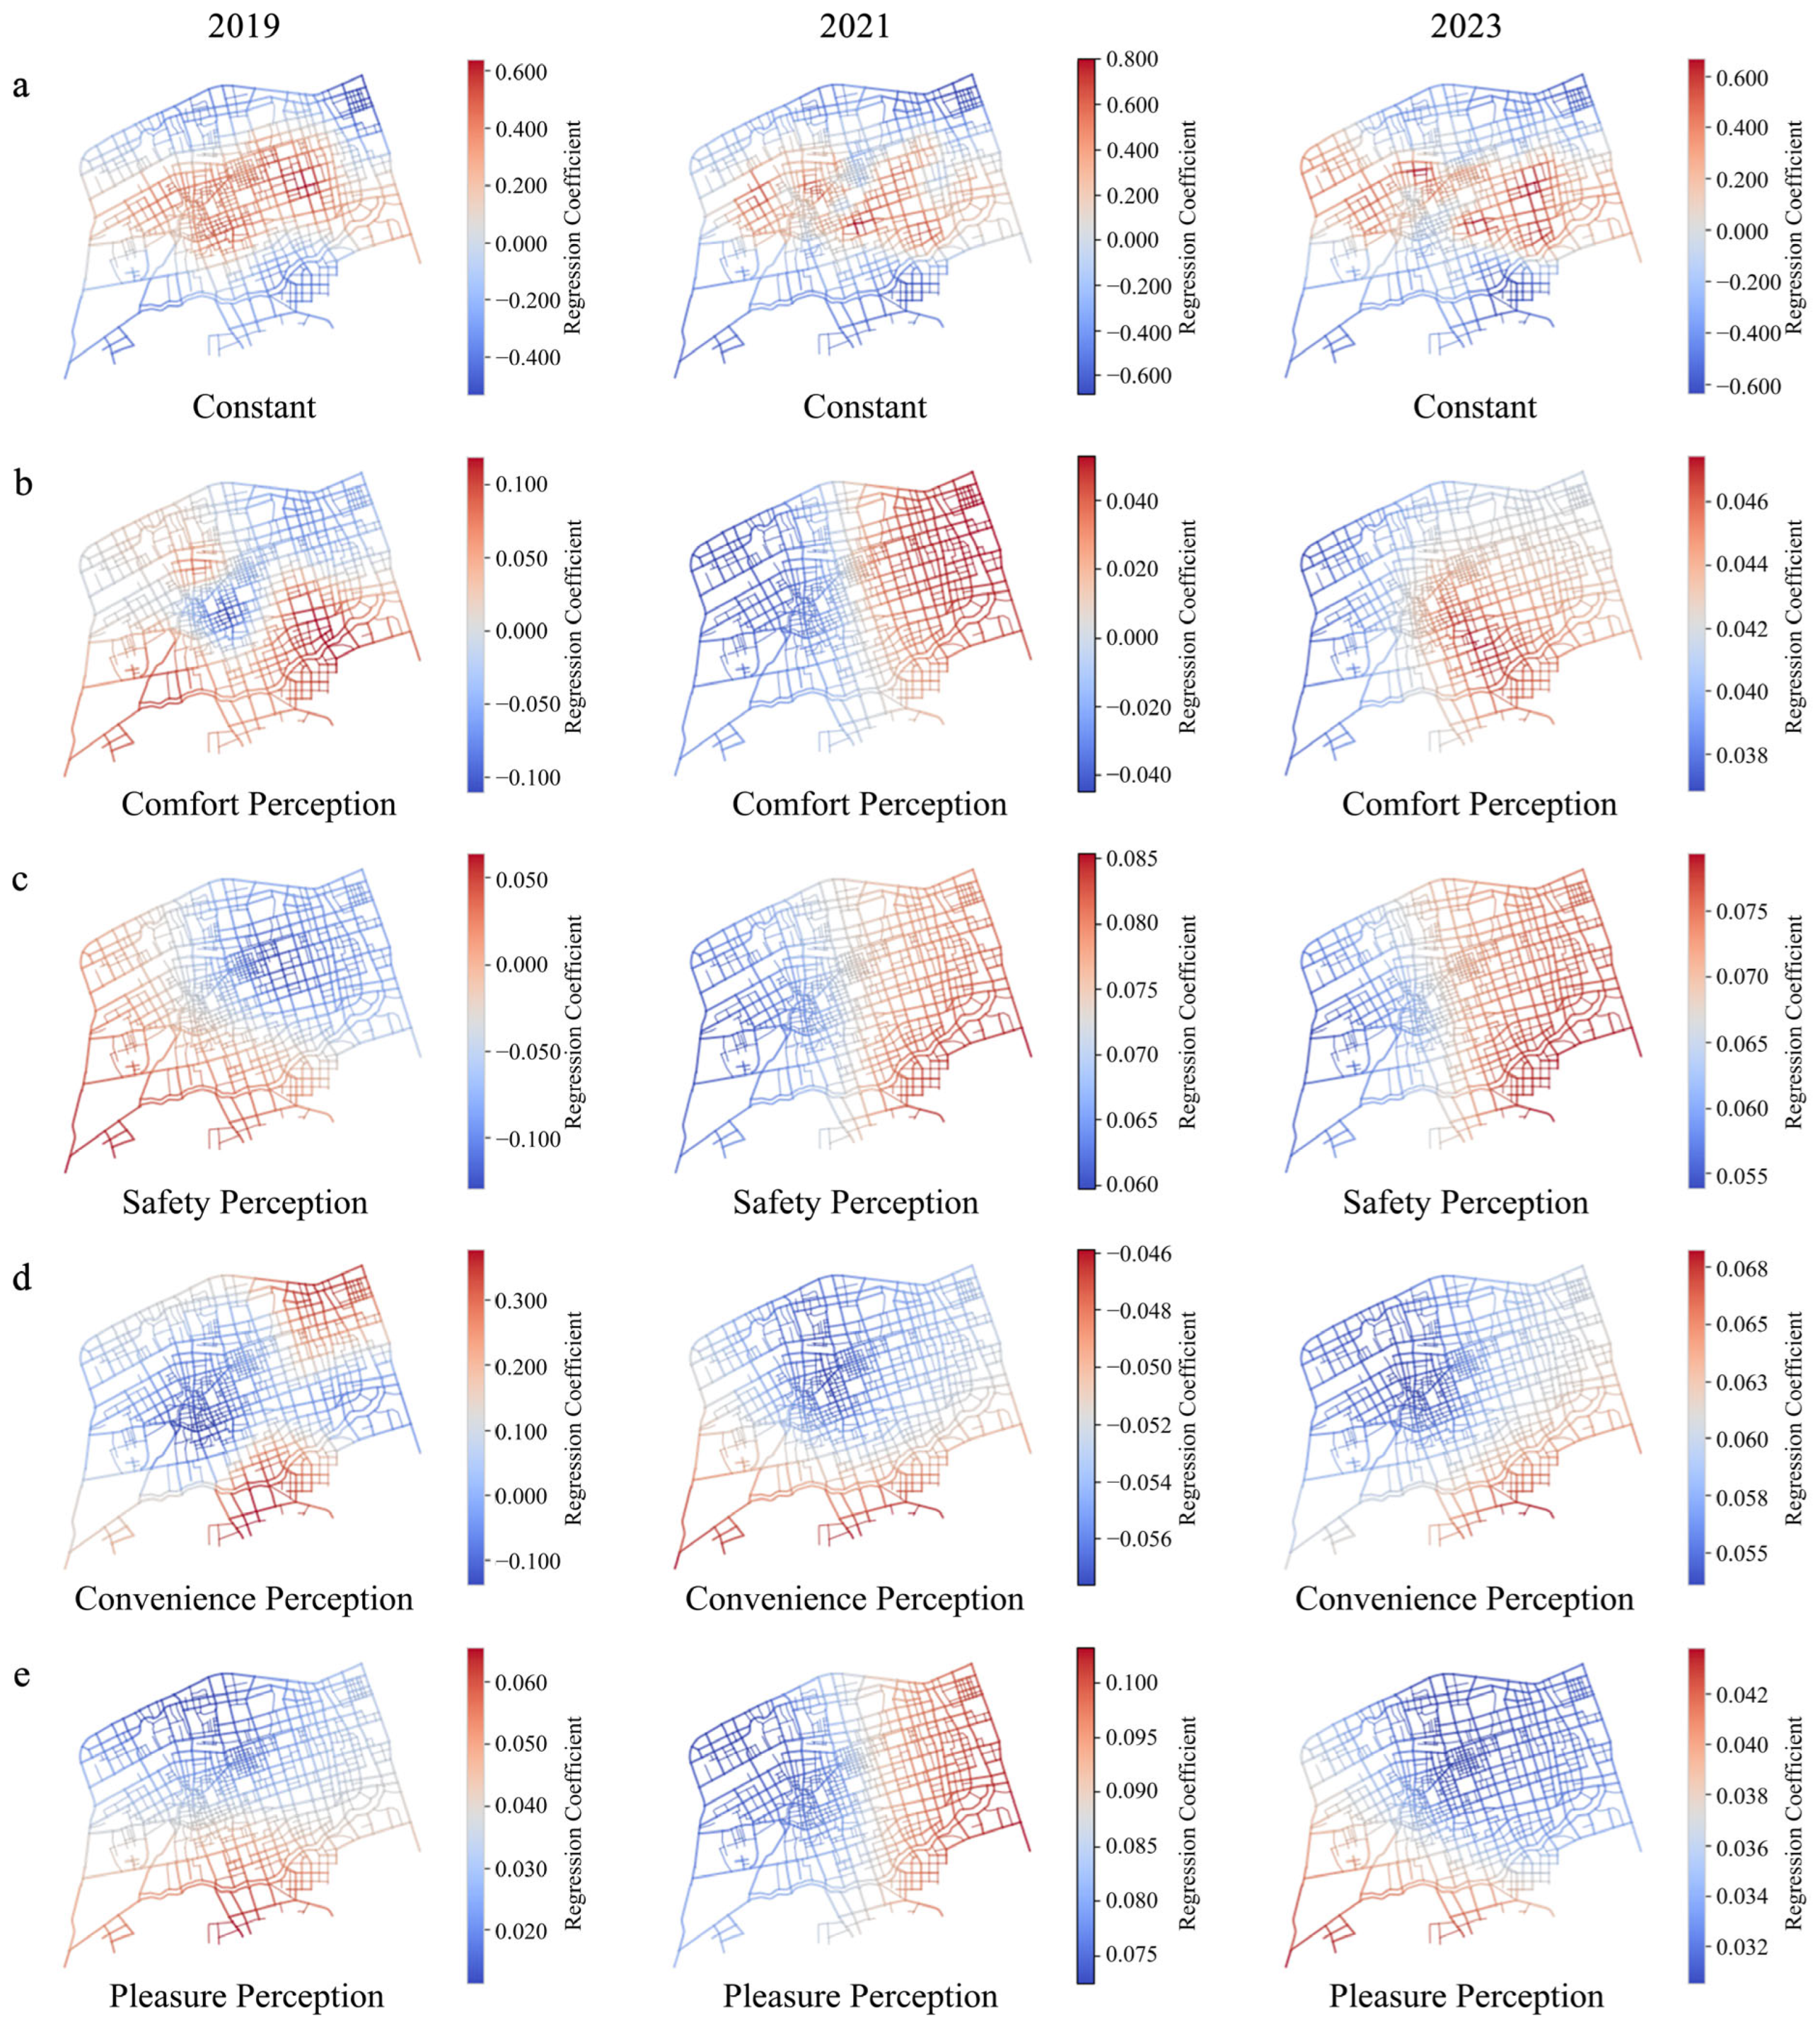
| Year | Variable | Bandwidth | ENP_j | Adj t-val (95%) | Adj Alpha (95%) | Mean | STD | Min | Median | Max |
|---|---|---|---|---|---|---|---|---|---|---|
| 2019 | Constant | 178.000 | 24.802 | 3.093 | 0.002 ** | 0.111 | 0.288 | −0.533 | 0.198 | 0.639 |
| Comfort Perception | 565.000 | 7.956 | 2.736 | 0.006 ** | 0.006 | 0.053 | −0.111 | 0.001 | 0.119 | |
| Safety Perception | 1096.000 | 3.190 | 2.419 | 0.016 * | −0.050 | 0.045 | −0.13 | −0.053 | 0.064 | |
| Convenience Perception | 386.000 | 8.459 | 2.756 | 0.006 ** | 0.054 | 0.141 | −0.138 | 0.011 | 0.377 | |
| Pleasure Perception | 1537.000 | 1.549 | 2.143 | 0.032 * | 0.032 | 0.012 | 0.011 | 0.031 | 0.065 | |
| 2021 | Constant | 79.000 | 60.906 | 3.352 | 0.001 *** | 0.003 | 0.326 | −0.683 | 0.047 | 0.802 |
| Comfort Perception | 1477.000 | 2.219 | 2.283 | 0.023 * | 0.003 | 0.032 | −0.045 | 0.000 | 0.053 | |
| Safety Perception | 1642.000 | 1.409 | 2.105 | 0.035 * | 0.073 | 0.007 | 0.060 | 0.073 | 0.085 | |
| Convenience Perception | 1642.000 | 1.145 | 2.019 | 0.044 * | −0.054 | 0.003 | −0.058 | −0.054 | −0.046 | |
| Pleasure Perception | 1619.000 | 1.408 | 2.104 | 0.036 * | 0.086 | 0.009 | 0.072 | 0.084 | 0.103 | |
| 2023 | Constant | 93.000 | 51.762 | 3.306 | 0.001 *** | 0.006 | 0.301 | −0.637 | 0.016 | 0.668 |
| Comfort Perception | 1642.000 | 1.534 | 2.139 | 0.033 * | 0.043 | 0.002 | 0.037 | 0.043 | 0.047 | |
| Safety Perception | 1642.000 | 1.421 | 2.108 | 0.035 * | 0.069 | 0.007 | 0.054 | 0.070 | 0.079 | |
| Convenience Perception | 1642.000 | 1.151 | 2.021 | 0.043 * | 0.058 | 0.003 | 0.054 | 0.057 | 0.068 | |
| Pleasure Perception | 1642.000 | 1.285 | 2.067 | 0.039 * | 0.033 | 0.003 | 0.031 | 0.032 | 0.044 |
Disclaimer/Publisher’s Note: The statements, opinions and data contained in all publications are solely those of the individual author(s) and contributor(s) and not of MDPI and/or the editor(s). MDPI and/or the editor(s) disclaim responsibility for any injury to people or property resulting from any ideas, methods, instructions or products referred to in the content. |
© 2025 by the authors. Licensee MDPI, Basel, Switzerland. This article is an open access article distributed under the terms and conditions of the Creative Commons Attribution (CC BY) license (https://creativecommons.org/licenses/by/4.0/).
Share and Cite
Li, X.; Li, B.; Su, Y. Temporal Evolution of Multi-Dimensional Built Environment Perceptions and Street Vitality: A Longitudinal Analysis in Rapidly Urbanizing Cities. Sustainability 2025, 17, 8428. https://doi.org/10.3390/su17188428
Li X, Li B, Su Y. Temporal Evolution of Multi-Dimensional Built Environment Perceptions and Street Vitality: A Longitudinal Analysis in Rapidly Urbanizing Cities. Sustainability. 2025; 17(18):8428. https://doi.org/10.3390/su17188428
Chicago/Turabian StyleLi, Xuemei, Baisui Li, and Ye Su. 2025. "Temporal Evolution of Multi-Dimensional Built Environment Perceptions and Street Vitality: A Longitudinal Analysis in Rapidly Urbanizing Cities" Sustainability 17, no. 18: 8428. https://doi.org/10.3390/su17188428
APA StyleLi, X., Li, B., & Su, Y. (2025). Temporal Evolution of Multi-Dimensional Built Environment Perceptions and Street Vitality: A Longitudinal Analysis in Rapidly Urbanizing Cities. Sustainability, 17(18), 8428. https://doi.org/10.3390/su17188428


