Article

Environmental Safety and Self-Perceived Quality of Life and Health: The Example of the European Union

1
Department of Economics and Marketing, Faculty of Management, Bydgoszcz University of Science and Technology, al. Prof. S. Kaliskiego 7, 85-796 Bydgoszcz, Poland
2
Department of Management of Organizational Innovation, Faculty of Management, Bydgoszcz University of Science and Technology, al. Prof. S. Kaliskiego 7, 85-796 Bydgoszcz, Poland
3
Department of Corporate Finance, Institute of Accounting and Finance Management, Poznań University of Economics and Business, al. Niepodległości 10, 61-875 Poznań, Poland
*
Authors to whom correspondence should be addressed.
Sustainability 2025, 17(18), 8412; https://doi.org/10.3390/su17188412
Submission received: 7 August 2025 / Revised: 9 September 2025 / Accepted: 16 September 2025 / Published: 19 September 2025
(This article belongs to the Special Issue Quality of Life in the Context of Sustainable Development)

Abstract

Increasing environmental threats and accelerating effects of climate change serve to reinforce the perception of environmental safety not only as an ecological concern but also as a social and economic one. The extant research suggests that environmental factors have a significant impact on health and quality of life. However, the literature still lacks comprehensive analysis integrating objective environmental indicators with subjective measures of quality of life in a comparative and dynamic framework, particularly in European Union (EU) countries. The primary objective of this paper is to evaluate the environmental safety within European Union countries and its impact on self-perceived quality of life and health. The analysis integrates the multidimensional environmental indicators with subjective assessments of quality of life. To this end, the TOPSIS method is employed to construct a synthetic index for environmental safety (ES_Score). Moreover, pooled cross-sectional time-series regressions are utilised for formal analyses. The study encompasses data from 27 EU countries from 2018 to 2023. The findings of the study suggest that environmental safety exhibits considerable variation among EU countries yet remains relatively stable over time. This underscores the enduring nature of environmental advantages and deficits. Countries with superior environmental safety are also those which have been shown to exhibit a higher quality of life and better health. Proactive environmental investments and activities aimed at sustainable growth have the capacity to improve the quality of life of the population. However, some factors, such as high air emission intensity or excessive water abstraction may be challenging. The findings of this study demonstrate a significant relationship between environmental protection initiatives and social prosperity within European nations, thus offering valuable insights that can inform the development of public policy.

1. Introduction

A contemporary understanding of quality of life is incomplete without accounting for the influence of both natural and urbanised environments on the daily functioning of individuals and communities. Quality of life is a complex, multidimensional construct that encompasses not only economic and social indicators but also health status, social relationships, and subjective well-being [1,2,3,4,5]. An increasing body of research highlights the critical role of environmental factors—such as air quality, access to green spaces, housing conditions, and pollution levels—as key determinants of residents’ health and overall quality of life [6,7,8]. In parallel with this perspective, the concept of environmental safety has emerged, which fundamentally integrates the protection of natural resources with the objective of safeguarding the well-being of current and future generations [9,10,11]. In the context of climate change, accelerating urbanisation, and mounting socio-economic pressures, analysing the interconnections between quality of life and environmental conditions has become not only a pressing research imperative but also a policy priority for sustainable development. The objective of this study is to evaluate the state of environmental safety in European Union (EU) countries and examine their relationship with the subjective perception of quality of life and health. The following research question is formulated: How does an integrated, multidimensional approach to environmental safety, as measured by a synthetic indicator (ES_Score), affect the subjective assessments of the quality of life and health in European Union countries? The overarching aim is addressed through the following specific objectives:
  • To construct a synthetic indicator of environmental safety (ES_Score) for EU27 countries using the TOPSIS method;
  • To perform a comparative assessment and classification of EU27 countries through ranking and clustering;
  • To compare the positioning of EU countries in terms of environmental safety with selected indicators of quality of life and health by analysing the distribution of these variables across quartile intervals;
  • To assess the influence of environmental safety on subjective perceptions of quality of life and health.
To achieve the study’s aims, the following research questions were formulated:
(1)
What are the spatial and temporal patterns in the variation of environmental safety across European Union countries?
(2)
How do residents of countries with varying levels of environmental safety perceive their quality of life and health?
(3)
Which environmental safety factors are most strongly associated with subjectively perceived quality of life and health?
The achievement of the study’s objectives enables the verification of the testable hypotheses developed in the study. These hypotheses were formulated as follows:
H1. 
The environmental safety of European Union countries demonstrates considerable spatial variation that remains relatively stable over time, indicating the persistent nature of regional environmental advantages and disadvantages.
H2. 
The level of environmental safety in EU countries is significantly associated with selected dimensions of residents’ quality of life and health.
H3. 
The quality of the environment, a multifaceted concept encompassing factors such as pollution levels, investments in environmental protection, and water and sanitation infrastructure, exerts a significant influence on life satisfaction and public health within the European Union. However, these relationships may be subject to partial contradiction and mediation by broader socioeconomic conditions.
The impact of environmental safety on quality of life is a significant area of contemporary research, particularly in relation to the interplay between environmental health and human well-being. The concept of environmental safety is predicated on the protection of ecosystems and natural resources as integral components of human safety and social stability. This concept encompasses the mitigation of risks such as pollution, environmental degradation, and climate change, all of which have the potential to exert a negative influence on quality of life on a global scale. Notwithstanding the proliferation of literature investigating the determinants of health and well-being, there persists a paucity of comprehensive models that systematically integrate these elements. It has been emphasised by scholars [12,13,14,15,16] that enhancements in environmental conditions—including, but not limited to, improved air quality [17,18], access to green spaces [19,20,21,22,23] and reduced noise pollution [24,25]—demonstrate a close correlation with the well-being and health outcomes of residents. However, many of these studies adopt a cross-sectional design or focus narrowly on specific environmental variables, thereby neglecting a dynamic and holistic perspective on environmental security as a multifaceted construct. Overall, research in this area lacks an integrated approach that combines objective environmental indicators with subjective assessments of quality of life. This research gap relates to the lack of an integrated, multidimensional, dynamic approach to analysing the relationship between environmental safety and societal well-being in the EU countries. By constructing a synthetic environmental safety indicator (ES_Score) based on the TOPSIS method and conducting a comprehensive analysis of its relationship with the self-assessed quality of life and health, this study fills this significant gap.
To address the abovementioned shortcomings, the present article addresses the identified research gap by introducing several novel contributions to the extant literature. Firstly, an innovative analytical framework is applied, integrating the TOPSIS multi-criteria comparative analysis method with panel data econometric modelling. The Technique for Order Preference by Similarity to Ideal Solution (TOPSIS) was employed to construct a synthetic Environmental Safety Index (ES_Score) for EU countries, thereby enabling a linear ranking based on their multidimensional environmental performance. Subsequently, utilising a panel data set spanning the years 2018–2023, a fixed-effects econometric model was estimated to evaluate the influence of this index—and its individual components—on residents’ self-reported quality of life and health.
Secondly, the article introduces a novel set of variables comprising eleven objective environmental indicators and six subjective indicators related to quality of life and health, supplemented by control variables reflecting the economic context, including inflation, GDP growth, and the age dependency ratio. This extensive, multidisciplinary dataset, sourced from Eurostat [26,27,28] and the World Bank Group [29]—integrates objective assessments of environmental conditions with subjective evaluations of well-being, thus representing an innovative approach within the field of quality of life research. In addition to conventional indicators such as emissions and noise levels, the dataset encompasses variables that measure the health impacts of environmental degradation (e.g., premature deaths due to air pollution) and proactive environmental policy initiatives, including climate protection expenditures.
Thirdly, the study integrates both subjective and objective perspectives on environmental safety, corresponding to two dimensions identified in the extant literature. The article demonstrates how challenging environmental data can be to interpret, and how this can create a discrepancy between measurable indicators and human perceptions of risks and benefits.
Fourthly, the present study provides contemporary empirical findings for EU countries from a cross-sectional temporal perspective. The analysis covers the most recent period (2018–2023), accounting for dynamic changes and external shocks. This approach has facilitated the identification of trends and non-obvious relationships. Consequently, this article makes a significant contribution to the scientific understanding of the complex relationship between the environment and well-being, offering novel insights for public policy and sustainable development initiatives.
The remainder of the paper is structured as follows: Section 2 presents a literature review on environmental safety, and quality of life and health. Section 3 outlines the methodology of the study, and the results are presented in Section 4. Section 5 discusses the results with the extant literature, and Section 6 concludes.

2. Literature Review

2.1. Environmental Safety

The concepts of safety or security are multifaceted and can be defined in various ways, reflecting their intricate nature and the diverse contexts in which it is applied. Security and safety, in their broadest sense, can be defined as a condition of being free from danger, threat, or harm, thereby offering protection to individuals, communities, and nations. A range of theoretical frameworks exists that offer different ways of conceptualising security, with different aspects being emphasised. These aspects include traditional military security [30], human security [31] and environmental security [32]. Etymologically, the term derives from the Latin securitas, meaning “freedom from care,” with the root cura referring to fear and worry, thus highlighting its psychological and emotional dimensions [33].
The growing scale of consumption and pollution, particularly in modern societies characterised by extensive energy usage, has led to environmental issues becoming critical political concerns. This has resulted in a range of ecological threats, both global (e.g., greenhouse effect, air pollution, biodiversity loss, food and water insecurity, deforestation, ocean and soil degradation, chemical contamination, waste, and population growth) and local ones [34,35].
Environmental safety is defined as the absence of threats to the environment and is characterised by a response to existing risks. However, it is increasingly recognised that environmental safety also encompasses preventative measures aimed at minimising the risks of future hazards. One such example of a future hazard is the impacts of progressing climate change [36]. In this context, political and institutional initiatives are being undertaken to strengthen societal and infrastructural resilience against phenomena such as extreme weather events, droughts, floods, or climate-induced migration. As Butts observes, acknowledging the repercussions of environmental pressures, including the consequences of climate change, is a pivotal element in the contemporary discourse on national security [37]. This perspective is in alignment with the concept of human security, as articulated by Lonergan, which broadens the traditional understanding of security by encompassing the protection of individuals and their existential foundations from environmental threats [38]. Consequently, ecological safety emerges as an integral component of comprehensive strategies for sustainable development and the safeguarding of quality of life. It is imperative to comprehend this as a condition under which natural resources are to be safeguarded and managed responsibly, with a view to ensuring the well-being of both current and future generations [39].
A comprehensive understanding of security through the lens of sustainable development requires recognition of the necessity to integrate economic policy, environmental protection, and social development efforts. The relationship between environmental safety and sustainable development is characterised by mutual reinforcement. Initiatives that are focused on enhancing environmental safety aim to protect ecosystems and the services they provide, which are vital for supporting sustainable development [40]. Addressing environmental challenges through sustainability strategies has been demonstrated to mitigate potential resource-based conflicts, thereby promoting social stability and contributing to the development of stronger economies, particularly in urban settings [41].
It is therefore possible to define environmental (or ecological) safety as a concept referring to the protection and sustainable management of ecosystems and natural resources that are essential for human survival, health, and well-being. It encompasses two distinct yet interconnected strands of action. Firstly, it includes measures designed to mitigate the risks arising from environmental degradation, climate change, and natural disasters. Secondly, it involves the proactive promotion of behaviours that are conducive to the environment, heightened environmental awareness, and the implementation of sustainable development principles. From this standpoint, environmental safety is defined as a perpetual state of ecological equilibrium that guarantees the sustained progression of the environment, in conjunction with a perception of social protection. Its object is the natural environment, while its subject is the human being—thereby highlighting its interdisciplinary, socio-ecological nature [34,42,43]. As Chaudhry et al. assert [44], environmental safety, “in an objective sense, measures the absence of threats to acquired values, whereas in a subjective sense, it refers to the absence of fear that such values will be attacked”.
The implications of environmental safety extend beyond the confines of the conventional ecological or agricultural frameworks, encompassing substantial economic dimensions. The judicious and coordinated administration of natural resources has been demonstrated to have the capacity to exert a pivotal role in the establishment of economic resilience, particularly in circumstances where there is an increase in the number of threats arising from the degradation of resources, the excessive extraction of resources, and climate change. The implementation of effective environmental protection mechanisms has been demonstrated to play a pivotal role in mitigating the risk of economic destabilisation, a process that is facilitated by the prevention of long-term environmental costs. These costs have been shown to exert a detrimental effect on productivity, public health, and resource availability. The notion of sustainable industrial activity, founded upon the principles of ecological responsibility, is predicated on two key tenets. Firstly, it is instrumental in the protection of ecosystems; secondly, it is conducive to the development of local economies by virtue of the provision of stable sources of income and employment. Consequently, environmental stewardship becomes an integral part of socio-economic development strategies, enhancing community well-being while maintaining ecological balance [45].
Environmental safety constitutes a fundamental component of national security. The level of environmental protection in a given country is a direct reflection of its capacity to safeguard its citizens against threats arising from ecosystem degradation, natural disasters, and climate change [46]. From this standpoint, the state is responsible not only for border defence and political stability, but also for preventing environmental risks that may impact public health, resource accessibility, and the overall quality of life. Achieving effective environmental safety requires systemic national actions, including the monitoring of environmental conditions, the management of ecological risks, investment in climate-resilient infrastructure, and the development of sustainable development policies [47,48]. This approach has been demonstrated to offer a multifaceted benefit, encompassing the preservation of the natural environment, whilst concurrently fortifying the social, economic and health stability of society. This, in turn, establishes the cornerstone for the attainment of long-term national security [49]. In order to enhance environmental safety, it is necessary to move beyond national interests and engage in collective action based on cross-border cooperation and the resolution of transnational environmental challenges [35,50].

2.2. The Concept of Quality of Life and Its Environmental Conditions

Quality of life (QoL) is a multifaceted concept widely recognised as a key indicator of individual and community well-being. The definition of QoL encompasses not only economic and social factors but also personal perceptions of health, happiness, and life satisfaction [51]. The notion of quality of life originates from philosophical inquiry dating back to antiquity. Aristotle, in his works—particularly in Nicomachean Ethics (4th century BCE)—explored the idea of eudaimonia, or “the good life” and “human flourishing,” as the highest aim of human existence [52]. From this standpoint, the concept of a satisfactory life is not predicated exclusively on the pursuit of pleasure or the accumulation of wealth. Instead, it is understood to be defined by a rational, ethical, and fulfilling existence that enables individuals to actualise their potential. This classical perspective established the foundation for subsequent interpretations of quality of life, including its modern applications in medical and psychological contexts. Contemporary literature, particularly the medical literature, frequently references these philosophical foundations in order to provide a more profound understanding of the quality of life construct [53].
As the fields of social sciences and medicine have evolved, it has become increasingly evident that quality of life (QoL) is neither a universal nor an easily defined category. Healthcare professionals, researchers, and policymakers are progressively acknowledging the ambiguity of the concept, emphasising the need for a clearer, human-centred definition. Such an approach necessitates consideration of the individual perspective—how a particular person perceives their own life, what constitutes value, satisfaction, and well-being for them. In this particular context, Bradley [54] proposes a definition in which quality of life is essentially determined by the individual’s perception of it. This suggests that personal experiences, needs, expectations, and self-assessments become pivotal components in analysing and evaluating QoL. Bergland and Narum [55] further develop this concept, asserting that quality of life is inherently linked to subjective interpretations that vary from person to person. The findings of their study suggest that individuals are both aware of and able to articulate their views on quality of life, which further reinforces the idea that the concept is deeply personal and context-dependent.
In healthcare, the definition of quality of life (QoL) is frequently operationalised as health-related quality of life (HRQoL), with the emphasis placed on the manner in which an individual’s health status influences their overall quality of life. This comprehensive perspective encompasses multiple dimensions, including psychological, physical, social and spiritual aspects. Integration of these various aspects of a person’s life is therefore indicated as a prerequisite for achieving a comprehensive understanding of QoL. It is important to note that this approach aligns with the definition of health proposed by the World Health Organization (WHO), which defines health as a state of complete physical, mental, and social well-being, not merely the absence of disease [56].
Contemporary research increasingly highlights the significant relationship between quality of life and the environment. This relationship indicates that a wide range of environmental factors exerts a substantial impact on individuals’ physical, mental, and social well-being. The concept of quality of life is understood to extend beyond the assessment of economic conditions, representing a complex and multidimensional category that integrates health, psychosocial, and environmental dimensions, thereby shaping everyday human experience [57]. The quality of housing, the quality of the atmosphere, access to green spaces, and the existence of health and recreational infrastructure are all significant factors in determining life satisfaction. A study by Çelik and Jaiyeoba [58] highlights that green areas in residential environments positively contribute to urban quality of life, offering social, economic, and psychological benefits. The extant literature highlights the dual nature of the physical environment, which is capable of both promoting health and social engagement and engendering stress and exclusion. Furthermore, exposure to adverse environmental conditions, including but not limited to noise, pollution, and overcrowding, has been demonstrated to result in a decline in mental health and an overall reduction in well-being [59]. Consequently, it is imperative to incorporate the environmental dimension into quality of life analyses to facilitate the development of efficacious health interventions and social policies that are designed to enhance living conditions within local communities.

3. Materials and Methods

The selection of the variables is informed by Eurostat [26] indicators and their alignment with the EU analytical framework for sustainable development, quality of life, and environmental safety. Eurostat is a key authority responsible for monitoring the social situation in the European Union countries. Following the recommendations set out in the strategic documents of the EU and OECD strategic documents [28,60,61,62], Eurostat has developed a European set of quality of life indicators based on the “8 + 1” model. This encompasses eight key areas, the so-called capabilities, such as material living conditions, leisure and social interactions, economic security and physical safety, governance and basic rights, and natural and living environment. Each of these capabilities is analysed in both objective and subjective dimensions. The model is supplemented by the ninth component, which is the overall self-perceived assessment of quality of life. This is considered to be essential for capturing the overall experience of life. The study employs the entirety of the aforementioned indicators, the full details of which are presented in Table 1.
The primary variables of interest (Y1–Y6) are mainly disaggregated as they reflect the percentage of people with high (Y1), medium (Y2) and low (Y3) self-perceived life satisfaction. Therefore, in order to construct an overall index of life satisfaction (Y1–3), we assigned linear weights to these variables (3 for Y1, 2 for Y2, 1 for Y3) and computed a weighted average. This weighting reflects the assumed incremental contribution of each category to overall life satisfaction. Y1–Y3 are thus aggregated into a single metric as outlined below:
Y 1 3 = 3 · Y 1 + 2 · Y 2 + 1 · Y 3 6
In a similar manner, Y4 comprises five distinct levels of self-perceived health. Each level, designated from “a” to “e”, corresponds to the share of people who perceive their health as being very good, good, fair, bad and very bad, respectively. To aggregate them into a single metric, each self-perceived health category from very good to very bad (Y4a–Y4e) was weighted from 5 to 1, respectively, to capture the gradation of health perception. Hence, five dimensions of Y4 were aggregated into a single metric using a weighted average as follows:
Y 4 = 5 · Y 4 a + 4 · Y 4 b + 3 · Y 4 c + 2 · Y 4 d + 1 · Y 4 e 15
As environmental safety is a multifaceted concept, a range of measures is employed to gauge it, as illustrated in Table 1. In the main analysis, the objective is to aggregate these dimensions into a single metric, employing the TOPSIS method [63]. TOPSIS (Technique for Order Preference by Similarity to Ideal Solution) is a Multiple Attribute Decision Making (MADM) method that facilitates the linear ordering of various alternatives based on specific attributes. It is particularly useful for comparative analyses of multifaceted solutions. TOPSIS can be considered as falling within a broader category of multivariate comparative analysis methods, namely, linear ordering methods. The latter are of particular use in the context of multicriteria decision-making (MCDM) and in measuring concepts that are not directly measurable. TOPSIS is analogous to other multivariate comparative analysis methods in that it aggregates several directly measurable features into a single value, thereby ranking the alternatives, solutions or objects relative to the intensity of the immeasurable characteristic.
In this study, the objective is to aggregate a number of variables related to environmental safety (X1–X11) in order to rank the EU countries ( n = 27 ) according to environmental safety. Consequently, the set of variables X1–X11 is designed as the set of diagnostic variables, i.e., k = 11 . These variables are then utilised to construct an observation matrix, denoted by S = s i j n × k , which is subsequently normalised using the standard z-normalisation technique. The process of normalisation results in the creation of a matrix R = r i j n × k , with the normalised values calculated as follows:
r i j = s i j i = 1 n s i j s j ¯ 2 n
In the next step, the matrix T = t i j n × k of normalised weighted observations is calculated:
t i j = w j · r i j
The TOPSIS method can use numerous weighting schemes. Vavrek [64] evaluated these schemes and recommends weights based on the variables’ standard deviation. However, since the variables (X1–X11) are of different orders of magnitude, this approach would give greater weight to variables with higher means. To avoid this bias, the weights w j for each variable j are determined based on the variables’ coefficients of variation before normalisation ( V j ):
w j = V j j = 1 k V j
This approach ensures that for each j w j 0,1 and that j = 1 k w j = 1 , and it provides a more dispersed value for the final outcome. In addition, the results of this method closely resemble those of the standard deviation method when the means of the variables are comparable [64]. Due to the sensitivity of TOPSIS ranks to assigned weights [65], we also consider using equal weights for the variables. The results, which are available upon request but not tabulated, are qualitatively and quantitatively similar to those of our baseline approach. The correlation between ranks among these weighing schemes is roughly 0.9. The final weights w j assigned to individual indicators (X1–X11) in each year are presented in Table 2. As depicted, the highest weights are assigned to variables reflecting outlay on climate change mitigation (X5), premature deaths caused by air pollution (X2), recycling (X7), and water abstraction (X11). On the contrary, connection to the public water supply and wastewater treatment systems (X8 and X9) is of lesser importance for environmental safety.
In the subsequent step, two benchmark object matrices are considered: A + = v j + 1 × k = max t i j j J , min t i j j J matrix of positive benchmark object and A = v j 1 × k = min t i j j J , max t i j j J matrix of negative benchmark object. A variable j J if it is a benefit attribute (X5–X11) and variable j J if it is a cost attribute (X1–X4). Subsequently, a Euclidean distance is calculated from the ideal positive ( D i + ) and negative ( D i ) benchmark object for each country, respectively:
D i + = j = 1 k t i j v j + 2
D i = j = 1 k t i j v j 2
The overall score for the environmental safety in the country i is calculated as a relative closeness to a positive benchmark object as calculated as follows:
E S _ S c o r e i = D i D i + + D i
Higher values of E S _ S c o r e i are indicative of enhanced environmental safety within country i. In light of the utilisation of panel data in the analyses, in order to avoid bias from multiple observations of a given country, the calculations of ES_Score are repeated for each year separately. Consequently, ES_Score enables only cross-sectional comparisons, without analysing temporal variations in environmental safety. Nevertheless, this finding provides a satisfactory response to the question of whether environmental safety is associated with self-perceived quality of life and health. Furthermore, in our analyses, we also consider X1–X11 separately, thereby mitigating the shortcomings of ES_Score.
To assess the relationship between environmental safety and the self-perceived quality of life and health, the following model is estimated:
Y i t = α i + α t + β E S _ S c o r e i t + γ j C o n t r o l j i t + ε i t
where Y i t denotes one of our variables for self-perceived quality of life or health for country i in year t; E S _ S c o r e i t is either the aggregated measure of environmental safety as defined earlier or a set of eleven variables (X1–X11), being a diagnostic variable for ES_Score; and Control represents the control variables, comprising Inflation, GDPgrowth and AgeDependency, which are sourced from the World Bank Database [29]. Given the utilisation of panel data, the Breusch–Pagan [66] and Hausman [67] tests are employed to select the most suitable estimator for the model. As indicated by the Breusch–Pagan test, the heteroskedasticity of residuals is evident. Furthermore, the Hausman test indicates an inconsistency of the GLS estimator with random effects. Consequently, the fixed effects (FE) estimator is utilised for the model. This choice is not only supported by the statistics, but also has an economic rationale, as both environmental safety and self-perceived well-being are likely driven by some time-invariant regional environmental advantages and disadvantages. In the considered models, time fixed effects are also included with a view to accounting for common events that have the potential to alter self-perceived health or quality of life, such as the COVID-19 pandemic or the 2022 Russian aggression against Ukraine.
This approach enables not only the identification of the overall trends and dependencies, but also the assessment of the relationship between individual dimensions of environmental safety and the self-perceived quality of life of EU countries’ inhabitants, both in the cross-section and the time series.

4. Results

4.1. Descriptive Statistics of Environmental and Quality of Life and Health Variables

Table 3 presents the basic descriptive statistics of environmental, quality of life and health variables, alongside the economic control variables in European Union countries. Analysis of the environmental variables reveals significant differences among EU countries in several areas. Indicators such as premature deaths due to exposure to fine particulate matter (X2) and air emissions intensity (X3) tend to have elevated standard deviation and are right-skewed. This suggests that although the majority of the EU(27) countries perform moderately well, some regions have very unfavourable parameters (Bulgaria, Croatia, Greece, Hungary, Poland, and Romania), although there is a noticeable tendency for these parameters to decrease over time. Similarly, investments in climate change mitigation (X5) vary considerably, with several countries investing much (Denmark, Lithuania, Latvia, Sweden, but also Hungary), while the majority of the EU(27) countries tend to have low climate-related expenditure. Conversely, the populations connected to the public water supplies (X8) and wastewater treatment plants (X9) have relatively high means, suggesting that the majority of EU(27) countries, with some exceptions (Latvia, Lithuania, Hungary, and Romania), provide widespread access to these utilities. The recycling of municipal waste (X6) and circular material use (X7) have moderate mean values, but vary significantly, suggesting that, despite positive trends, some EU(27) countries have a lot of catching up to do (X6: Bulgaria, Greece, Malta, and Romania; X7: Bulgaria, Finland, Ireland, Latvia, Lithuania, Portugal, and Romania). It is also worth noting that the noise levels (X1) vary significantly but are quite symmetrically distributed.
Considering the quality of life in the EU(27) countries, the data presented reveal a somewhat optimistic picture. A high percentage of EU(27) inhabitants rate their health as good or very good (Y5 = 67.34%), and their overall experience of life (Y1–Y3) is relatively even, with several countries reporting higher levels of satisfaction (Austria, Denmark, Finland, and Sweden). However, in some countries, a significant percentage of people have long-standing illnesses or health problems (Y6), with Finland (51%), Estonia (46%), and Portugal (43%) having particularly high figures, and the mean value for all EU(27) countries equalling 34.08%.

4.2. A Comparison of Environmental Safety Among EU(27) Countries Using the TOPSIS-Based Synthetic Index (ES_Score)

The synthetic index, ES_Score, reflects the multidimensional environmental safety. The higher the value of ES_Score, the better the country’s environmental safety relative to other countries in the sample (i.e., the closer it is to the ideal solution). Based on the values of ES_Score, as presented in Table 4, countries that are leaders and laggards in terms of environmental safety were identified.
The distribution of the ES_Score among the EU countries suggests significant variation in environmental safety. As shown in Table 4, the ES_Score values varied significantly between countries between 2018 and 2023, with the highest values being 0.72–0.77 and the lowest values being 0.26–0.29. For instance, in 2018, France had the highest ES_Score value (0.73), while Romania had the lowest (0.26), translating into a difference of 0.47 (the range is between 0 and 1).
Analysis of the distribution of the ES_Score shows that the majority of the EU(27) countries perform moderately in terms of environmental safety, with only a few being outliers. It is noticeable that the distribution of the ES_Score remains stable over time, despite overall improvement during certain periods. A glaring example of this is 2020, when a number of countries experienced a one-off improvement in their environmental safety. However, the general distribution (range and symmetry) was not permanently altered. 2020 was a specific year as several EU(27) countries recorded the highest index values (e.g., Bulgaria, Cyprus, and Poland), possibly due to a short-term improvement in certain environmental factors in that year. In the following years, ES_Score values reverted to pre-2020 levels, suggesting that the positive changes observed in 2020 were temporary and did not result in a sustained reduction in the disparity between countries.
In general, the countries’ rankings in terms of environmental safety did not alter significantly from one year to the next. Leading countries tend to remain at the top of the rankings, while those at the bottom tend to remain there. Nevertheless, some countries exhibited significant variations in their rankings over the analysed period, thus suggesting changes in their environmental safety. Those with the biggest improvements include Poland and Italy. This may indicate that they implemented effective environmental improvement measures or other beneficial structural changes. Similar advancements are noticeable in Bulgaria and Slovenia. An example of the opposite tendency is Finland. A slight fall in Finland’s ranking suggests a relative deterioration in certain aspects of environmental safety, or that other countries have overtaken it in terms of environmental safety improvements. Similarly, Croatia also saw a marked decline in its ranking: it slipped from 5th position in 2018 (ES_Score ~0.46) to 8th position in 2023.
It is worth noting that some countries maintained stable rankings throughout the period under scrutiny. France, Cyprus, Denmark, Latvia and Romania, for example, were consistently ranked 1st, 2nd, 12th, 13th and 27th, respectively, throughout the period from 2018 to 2023. Spain was consistently ranked in the top ten or second. Similarly, Slovakia has shown a relatively stable ranking over time, as it was consistently ranked in the middle of the pack. This suggests a relatively constant environmental safety in these countries, with no sudden changes in their internal situation, as compared to other countries.
In summary, based on the ES_Score values, France and Cyprus consistently led in terms of environmental safety throughout the entire study period, maintaining a permanent advantage over other EU countries. France and Cyprus were ranked 1st and 2nd, respectively, over the entire study period. Sweden followed closely behind in third place, except in 2018 when it was ranked sixth. Greece was also consistently ranked in the top five, making it a leader in environmental safety. The next countries that frequently appear at the bottom of the ranking are Austria, Malta, and the Czech Republic. The worst-performing countries in terms of environmental safety were Romania, Belgium, Italy, Ireland, and Hungary for most of the study period. Throughout the entire study period, Romania was consistently ranked last in environmental safety.

4.3. Which Countries Are Similar in Terms of Environmental Safety?

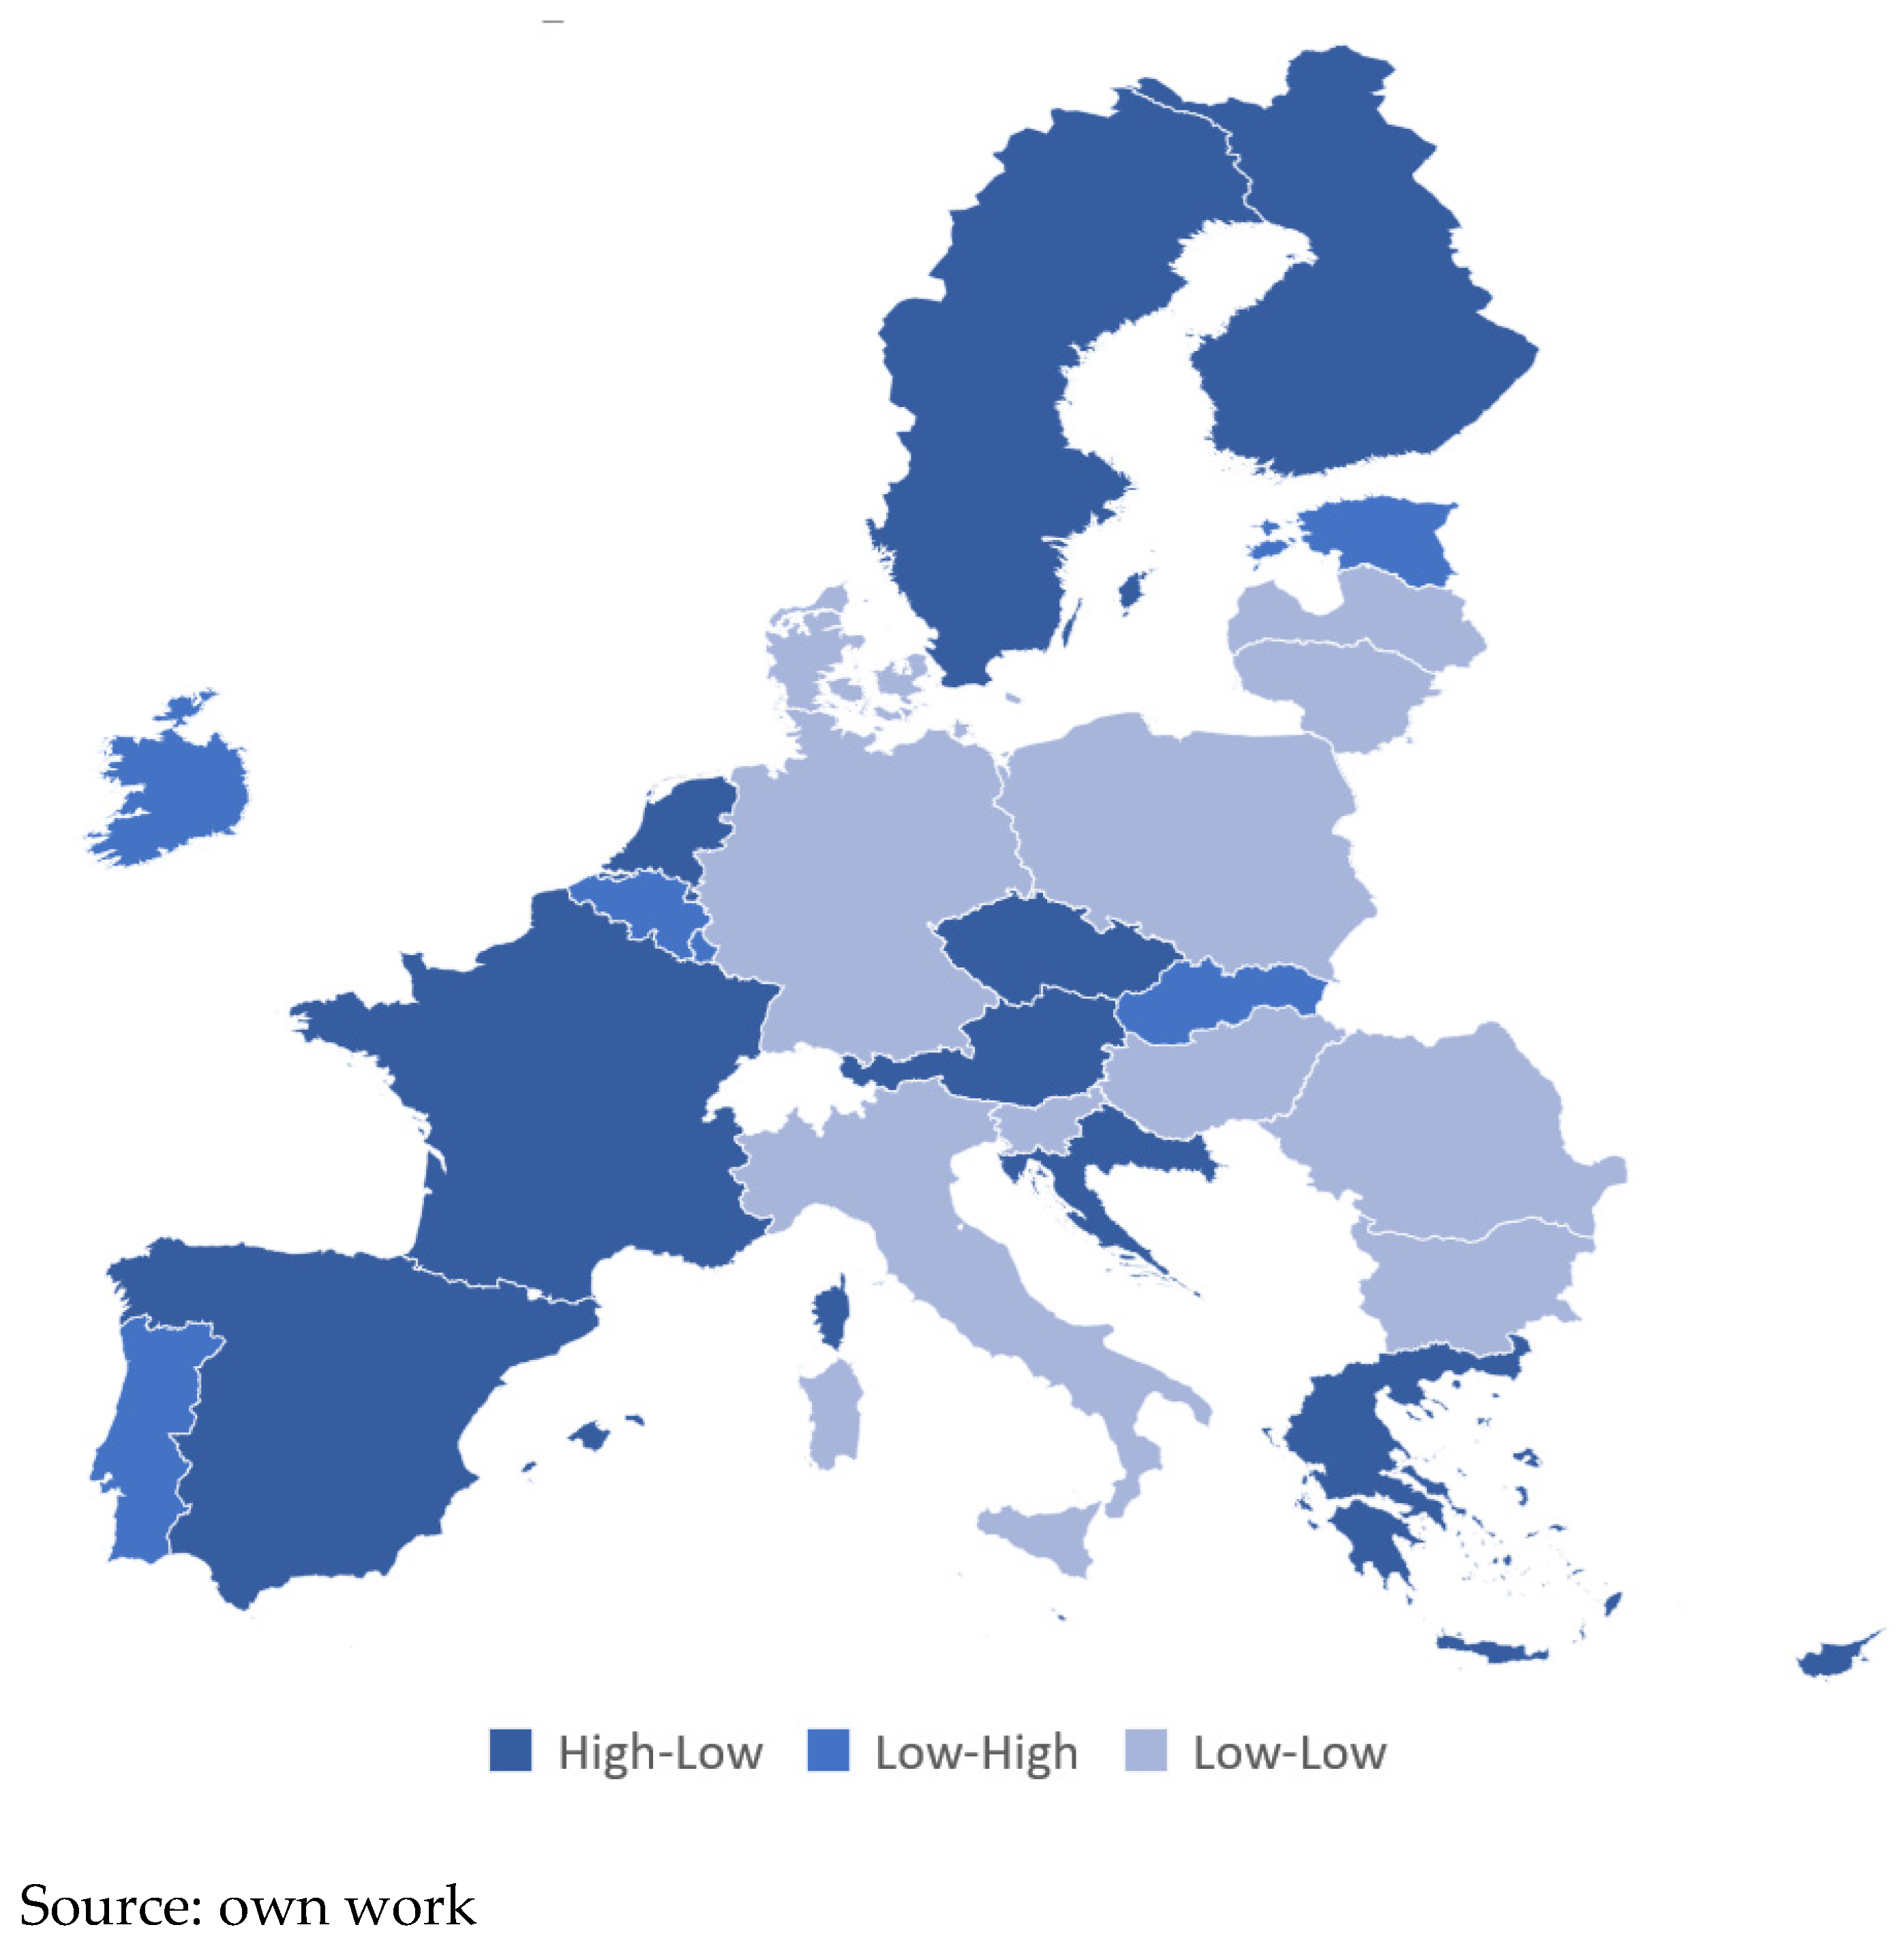
The map presented in Figure 1 is intended to illustrate the spatial variation in environmental safety among European Union countries and is based on a ranking that is calculated using the ES_Score. The map illustrates the countries that attain the highest ES_Score values, indicating that they possess superior environmental conditions, and the countries that are positioned at the lower echelons of the ranking. The colour differentiation facilitates the identification of areas with relatively high and low levels of environmental safety, providing a starting point for further analysis. The colour green is used to denote the EU(27) countries that achieve the highest ranking in environmental safety, while dark orange indicates those with the lowest ranking.
As demonstrated in the preceding section, France consistently achieved an average ranking of 1, indicating that it consistently maintained the highest environmental safety standards during the study period (2018–2023). Notably, France is the sole country to consistently demonstrate such commendable outcomes. The second is Cyprus, with an average ranking of 2, and the permanent position of vice-leader. Sweden consistently achieved a third-place ranking, thereby confirming its position in the average standings. The following countries were also identified as the best-ranked: Greece, Austria, Malta, Finland, and Czechia. The aforementioned countries constitute the group that was consistently ranked in the top ten over the entire period. Consequently, it can be deduced that the composition of environmental leadership remained relatively stable, thereby indicating a sustained competitive advantage for these nations over their counterparts.
Conversely, the following countries were identified as demonstrating the poorest performance in terms of environmental safety: Romania (ranked 27th on average), Belgium (ranked 26th), Italy (ranked 25th), Ireland (ranked 24th), Hungary (ranked 23rd), and Luxembourg (ranked ~22nd). Germany is positioned slightly higher in the rankings, with an average position of 21. This finding indicates that the aforementioned countries consistently occupied the lowest ranking positions throughout the entire period. The mean average rank of approximately 24–25 for Italy and Ireland indicates the persistence of challenges pertaining to environmental safety. Notwithstanding the isolated instance of improvement observed in Italy in 2023, the prevailing downward trend that emerged between 2018 and 2022 remains evident.
Furthermore, an analysis of average positions in environmental safety rankings facilitates elucidating certain subtleties. For instance, the average ranking of Estonia, Lithuania and Bulgaria was 17–19, a position that places them below the mean. Despite Bulgaria’s initial 22nd ranking in 2018, the country demonstrated a consistent and gradual enhancement in its environmental safety performance. This development indicates that Bulgaria is no longer regarded as the most underperforming country. Portugal, with its average position, is positioned in the median range of the rankings, thereby confirming stability; this is evidenced by Portugal’s consistent ranking of 15th over a period of four consecutive years.
Notwithstanding the aforementioned results, there is no clear spatial dependence in environmental safety among the EU(27) countries. This means that a country’s environmental safety is not contingent upon its geographical location; rather, it remains influenced by a multitude of other factors. This is evidenced by both Global and Local Moran’s I statistics [68,69] presented in Table 5. In all spatial calculations, a weighting matrix is used, which assigns values equal to the inverse of the distance between capital cities. The expected value of I in the absence of spatial correlation is—0.0385, which means that, globally, there is a slight negative spatial correlation between countries’ environmental safety. This assertion is further substantiated by predominantly negative local spatial correlation coefficients, with the majority exhibiting a negative value, and only a few displaying a positive value, although not exceeding 0.06. In contrast, nations such as France, Cyprus and Belgium demonstrate remarkably negative (−0.966, −0.341 and −0.174, respectively) local Moran’s I statistics, indicating they are adjacent to countries that exhibit significantly poorer environmental safety performance. Nevertheless, the findings indicate an absence of substantial spatial correlation in environmental safety between the analysed countries.
In order to provide a more comprehensive analysis, Local Indicators of Spatial Association (LISA) [69] are utilised to illustrate local patterns. Figure 2 presents the map with identified spatial regimes in environmental safety. From this figure, it can be observed that several countries, predominantly located in Central and Eastern Europe, fall within a Low–Low cluster. This finding indicates that these countries have low environmental safety ratings, and their neighbouring countries demonstrate similarly low environmental safety. This spatial concentration of low environmental safety in the Eastern part of the EU may be indicative of the persistent environmental disadvantages experienced by post-communist states (with Italy and Denmark being exceptions). The remaining countries fall into either the High–Low or Low–High clusters, indicating a lack of spatial concentration of environmental safety in the Western part of the EU.
Table 6 presents the comprehensive classification of 27 European Union countries and their allocation to four distinct groups, based on varying levels of environmental safety. The countries were sorted according to their average ES_Score ranks and subsequently divided into quartile groups. The following countries were identified as those demonstrating the highest levels of environmental safety: France, Cyprus, Sweden, Greece, Austria, Malta, and Finland. Conversely, the group of countries demonstrating the poorest performance comprises Luxembourg, Hungary, Ireland, Italy, Belgium, and Romania. This classification facilitates the comparison of EU countries with regard to their environmental conditions, thereby establishing a foundation for subsequent analyses of the relationship between environmental safety and the self-perceived quality of life and health of individuals residing in EU(27) countries.

4.4. Self-Perceived Quality of Life and Health in EU(27) Countries—A Comparative Analysis

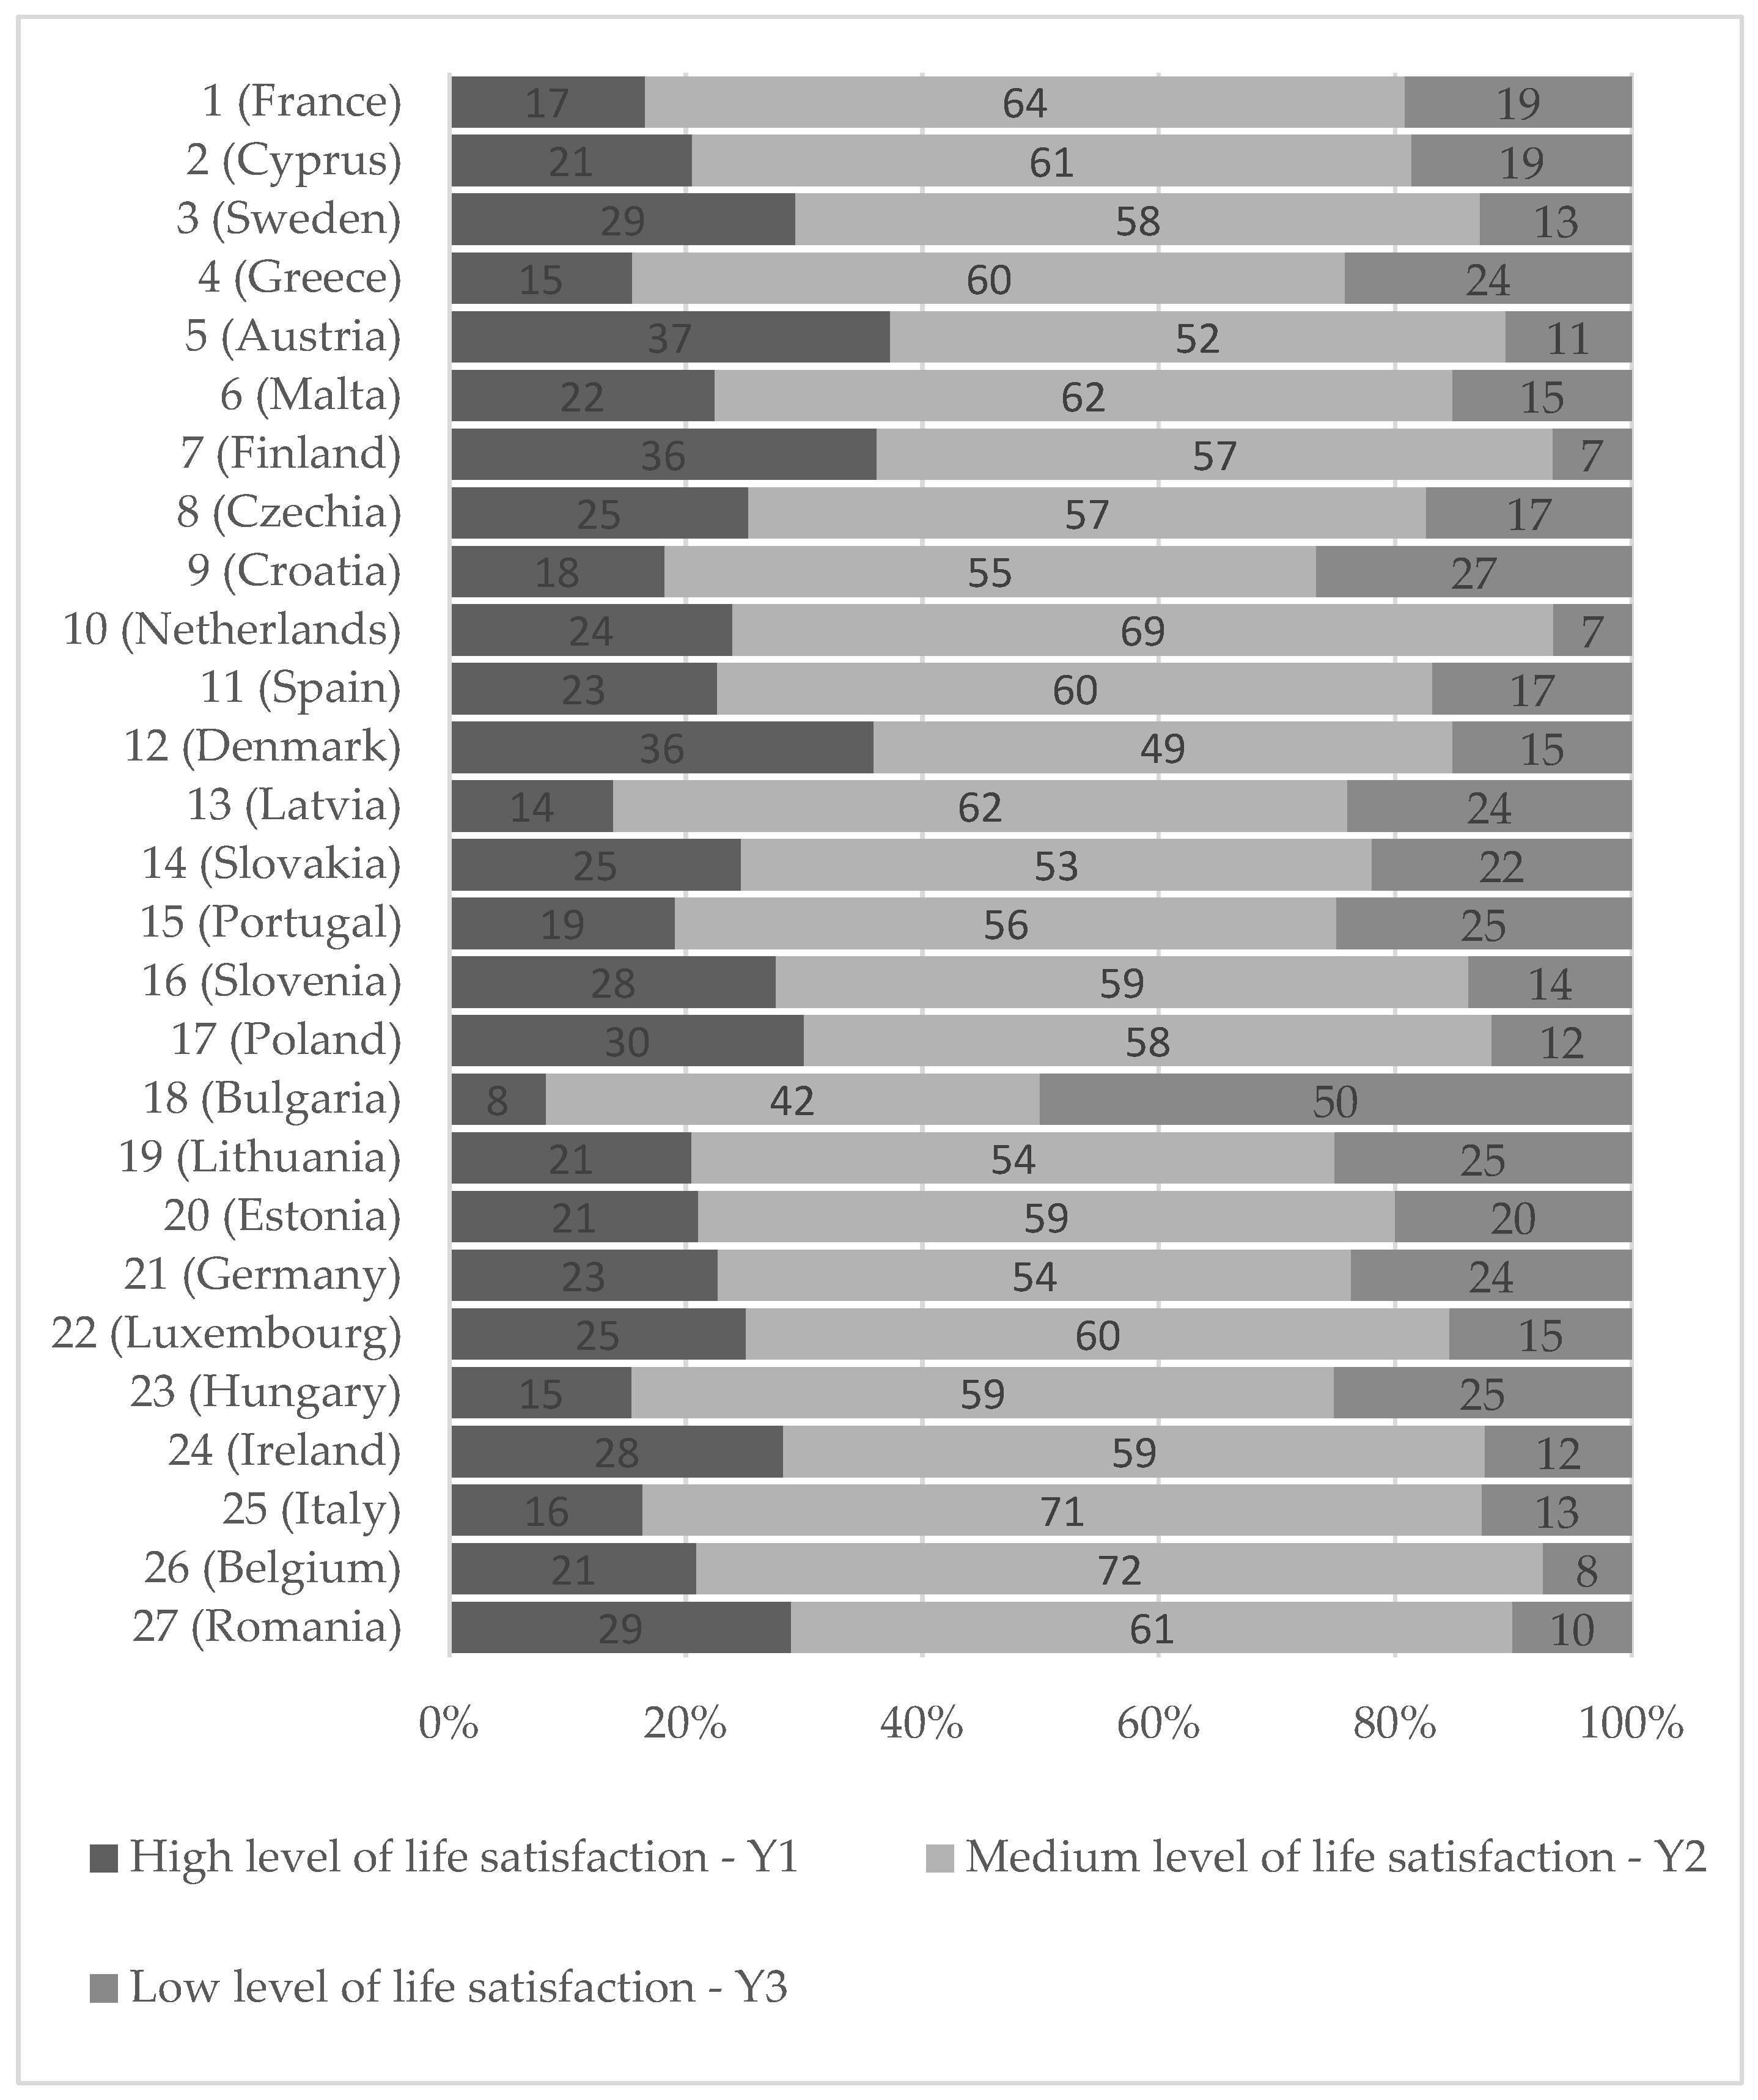
Figure 3 displays the fraction of respondents from the 27 European Union countries who evaluated their life satisfaction as high (Y1), moderate (Y2), or low (Y3) concerning the environmental safety of their country of residence. In the majority of countries, moderate life satisfaction (Y2) dominates. The highest percentages of respondents who expressed a high level of life satisfaction (Y1) were observed in Austria, Finland and Denmark. It is noteworthy that the percentage of people rating their life satisfaction as low (Y3) is observed to be the lowest in the Netherlands and Finland. Conversely, Bulgaria is identified as a nation where half of the population indicated a low level of life satisfaction, which is the highest figure recorded among all analysed countries. However, these results do not indicate a definitive relationship between the environmental safety of a specific EU(27) country and the self-perceived quality of life of its inhabitants.
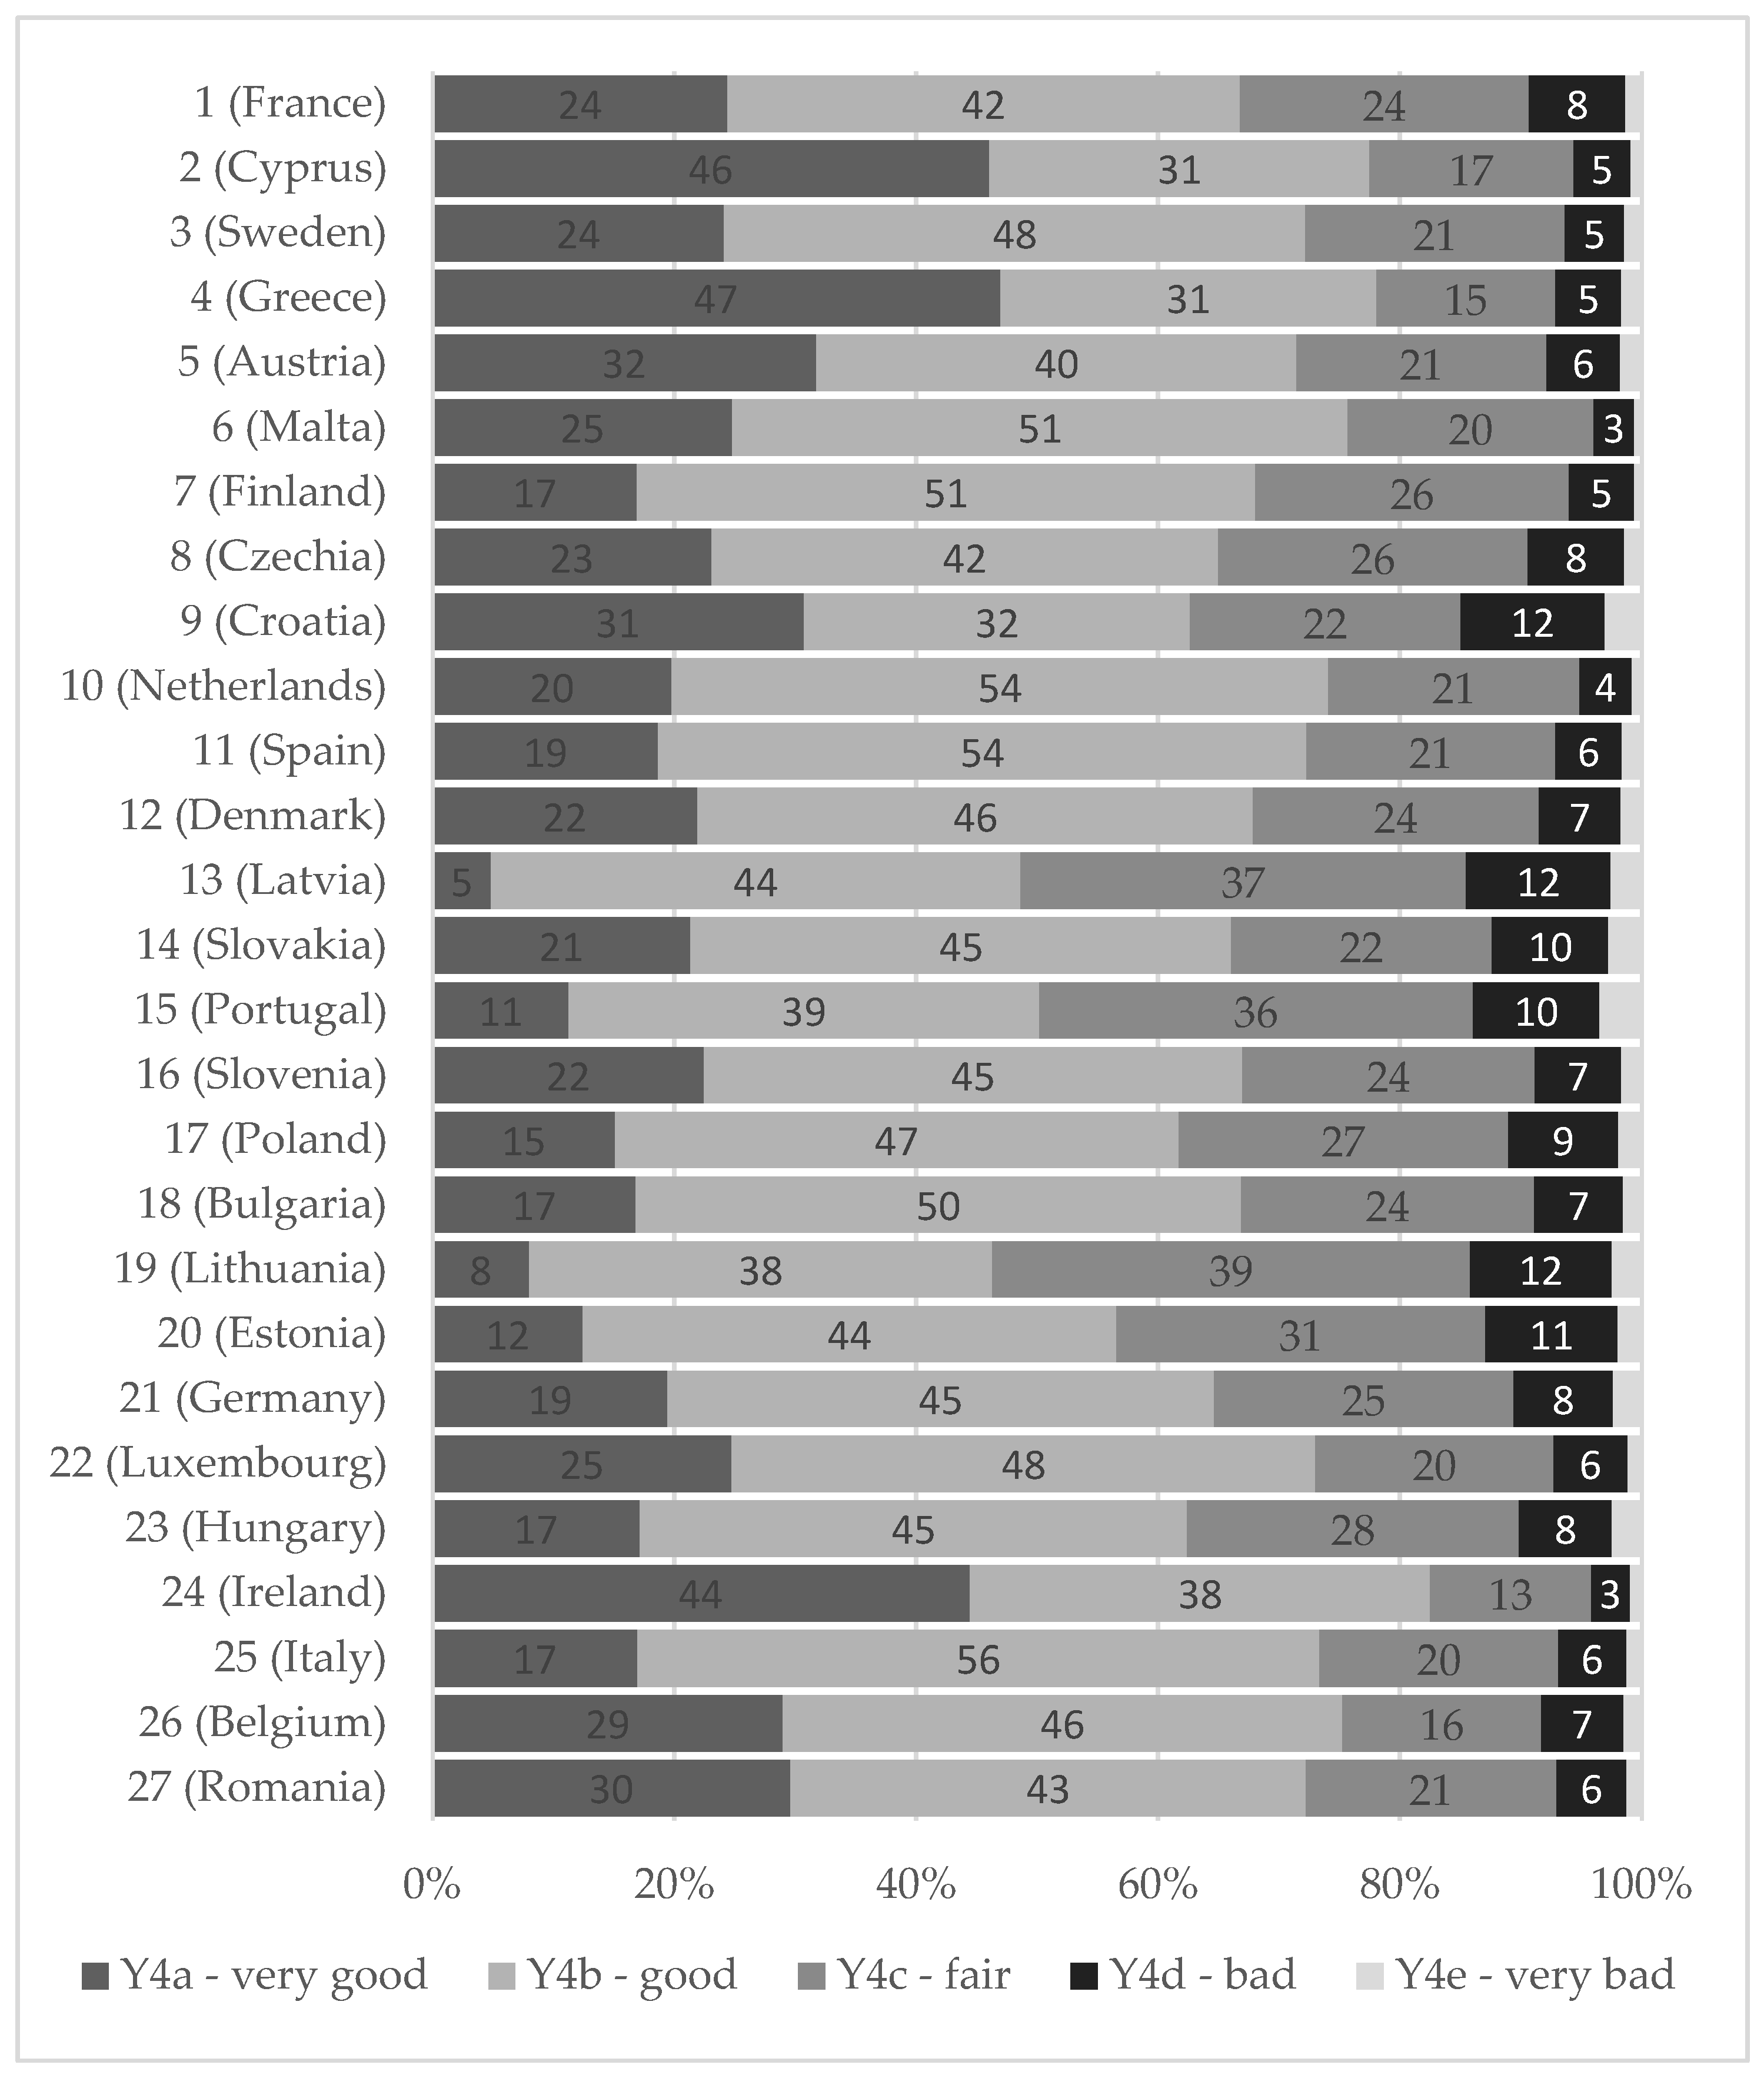
Figure 4 presents the distribution of self-perceived health (Y4) in 27 EU countries for five categories: from “very good” (Y4a) to “very bad” (Y4e). The highest percentages of respondents who rate their health as very good or good (Y4a and Y4b) are observed in Greece, Cyprus, and Ireland. In countries such as Latvia, Lithuania, Portugal and Croatia, however, the high percentage of people rating their health as bad or very bad (Y4d and Y4e) is noteworthy. The data presented herein indicate significant variations in the self-perceived quality of health among the population of EU countries, which may be attributable to a combination of environmental and social factors.

4.5. Self-Perceived Quality of Life and Health in Groups of Countries with Similar Environmental Safety Levels

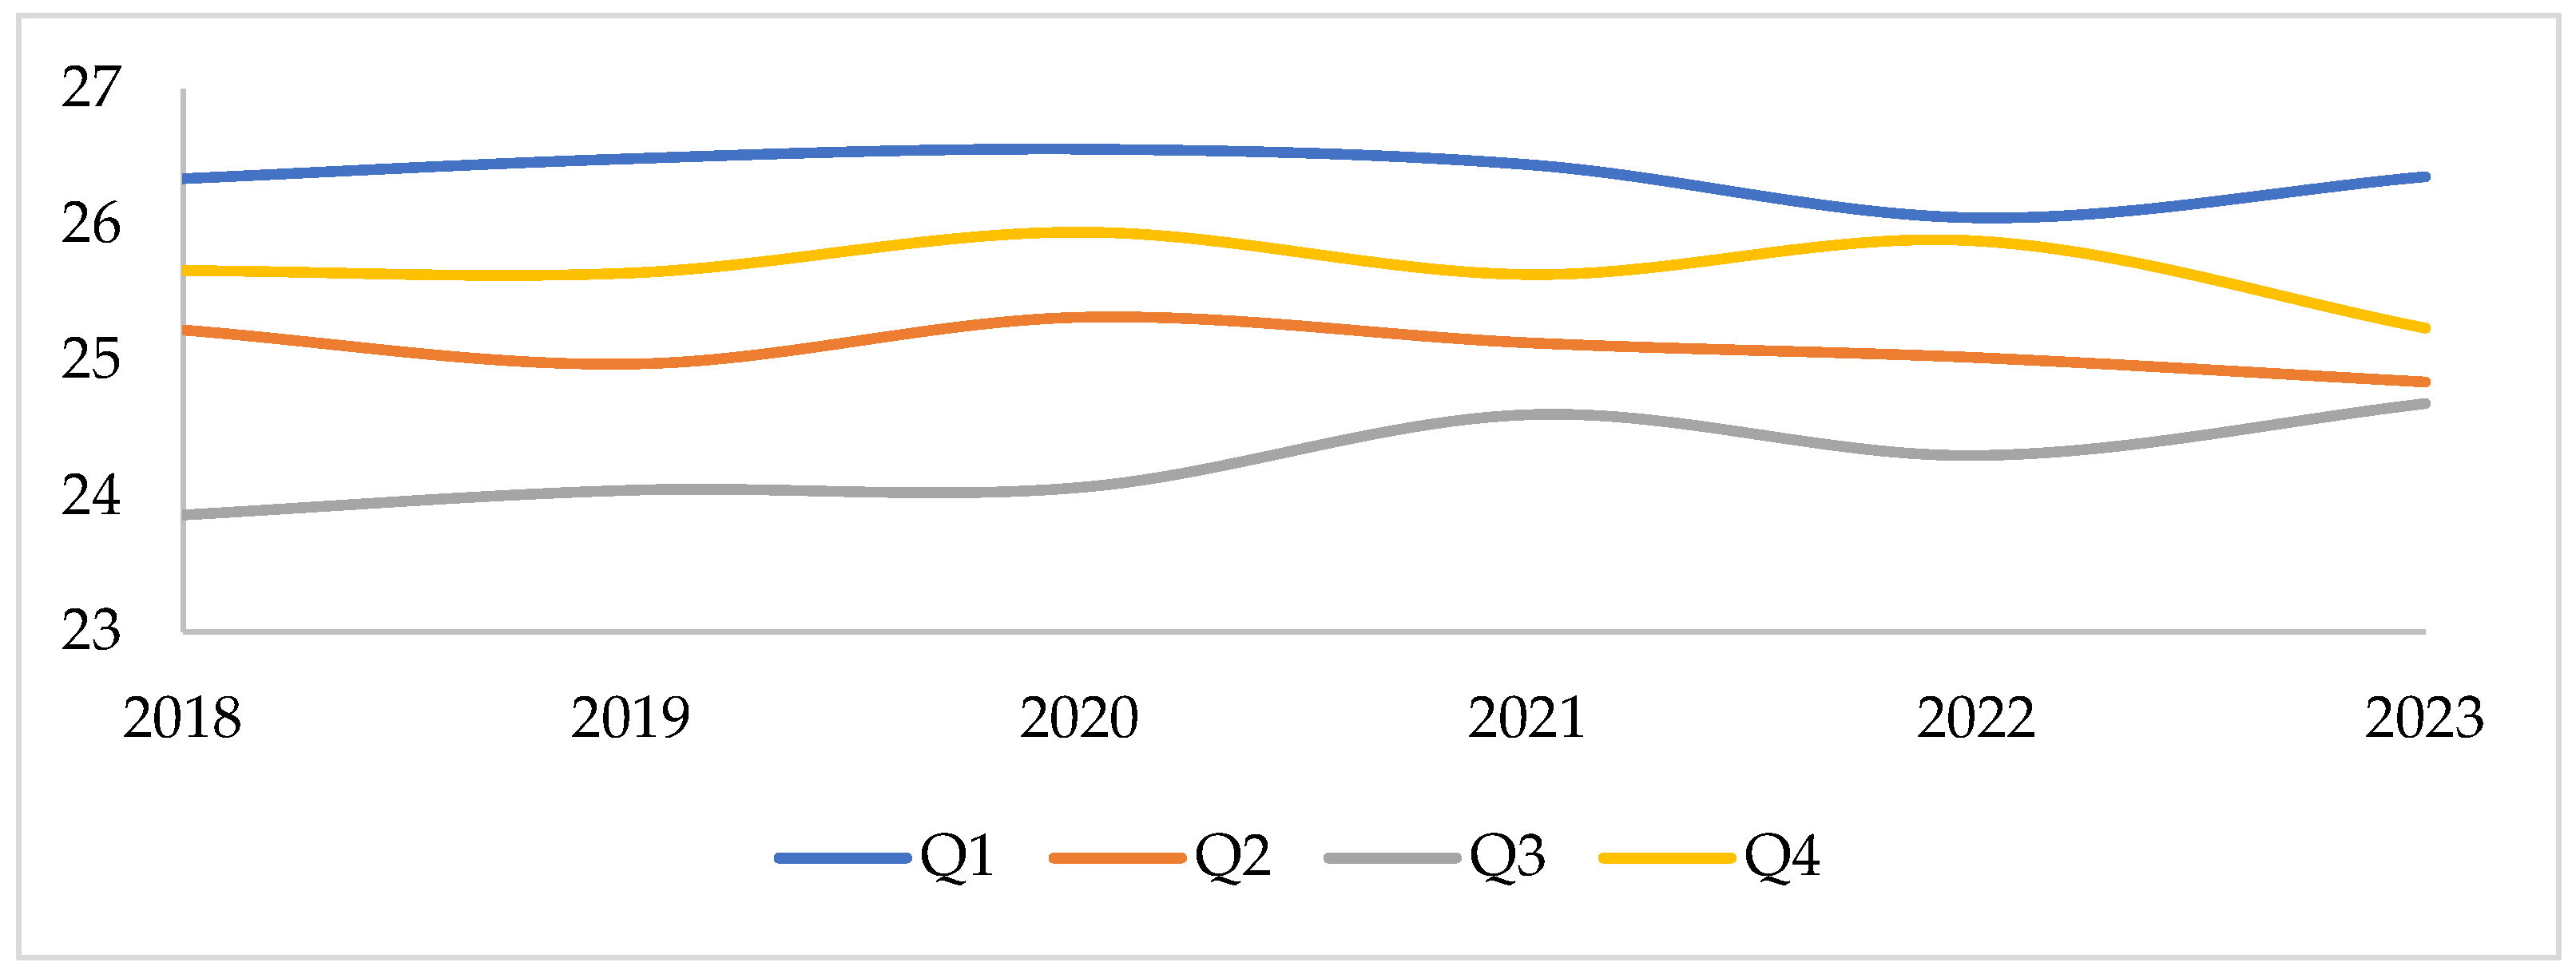
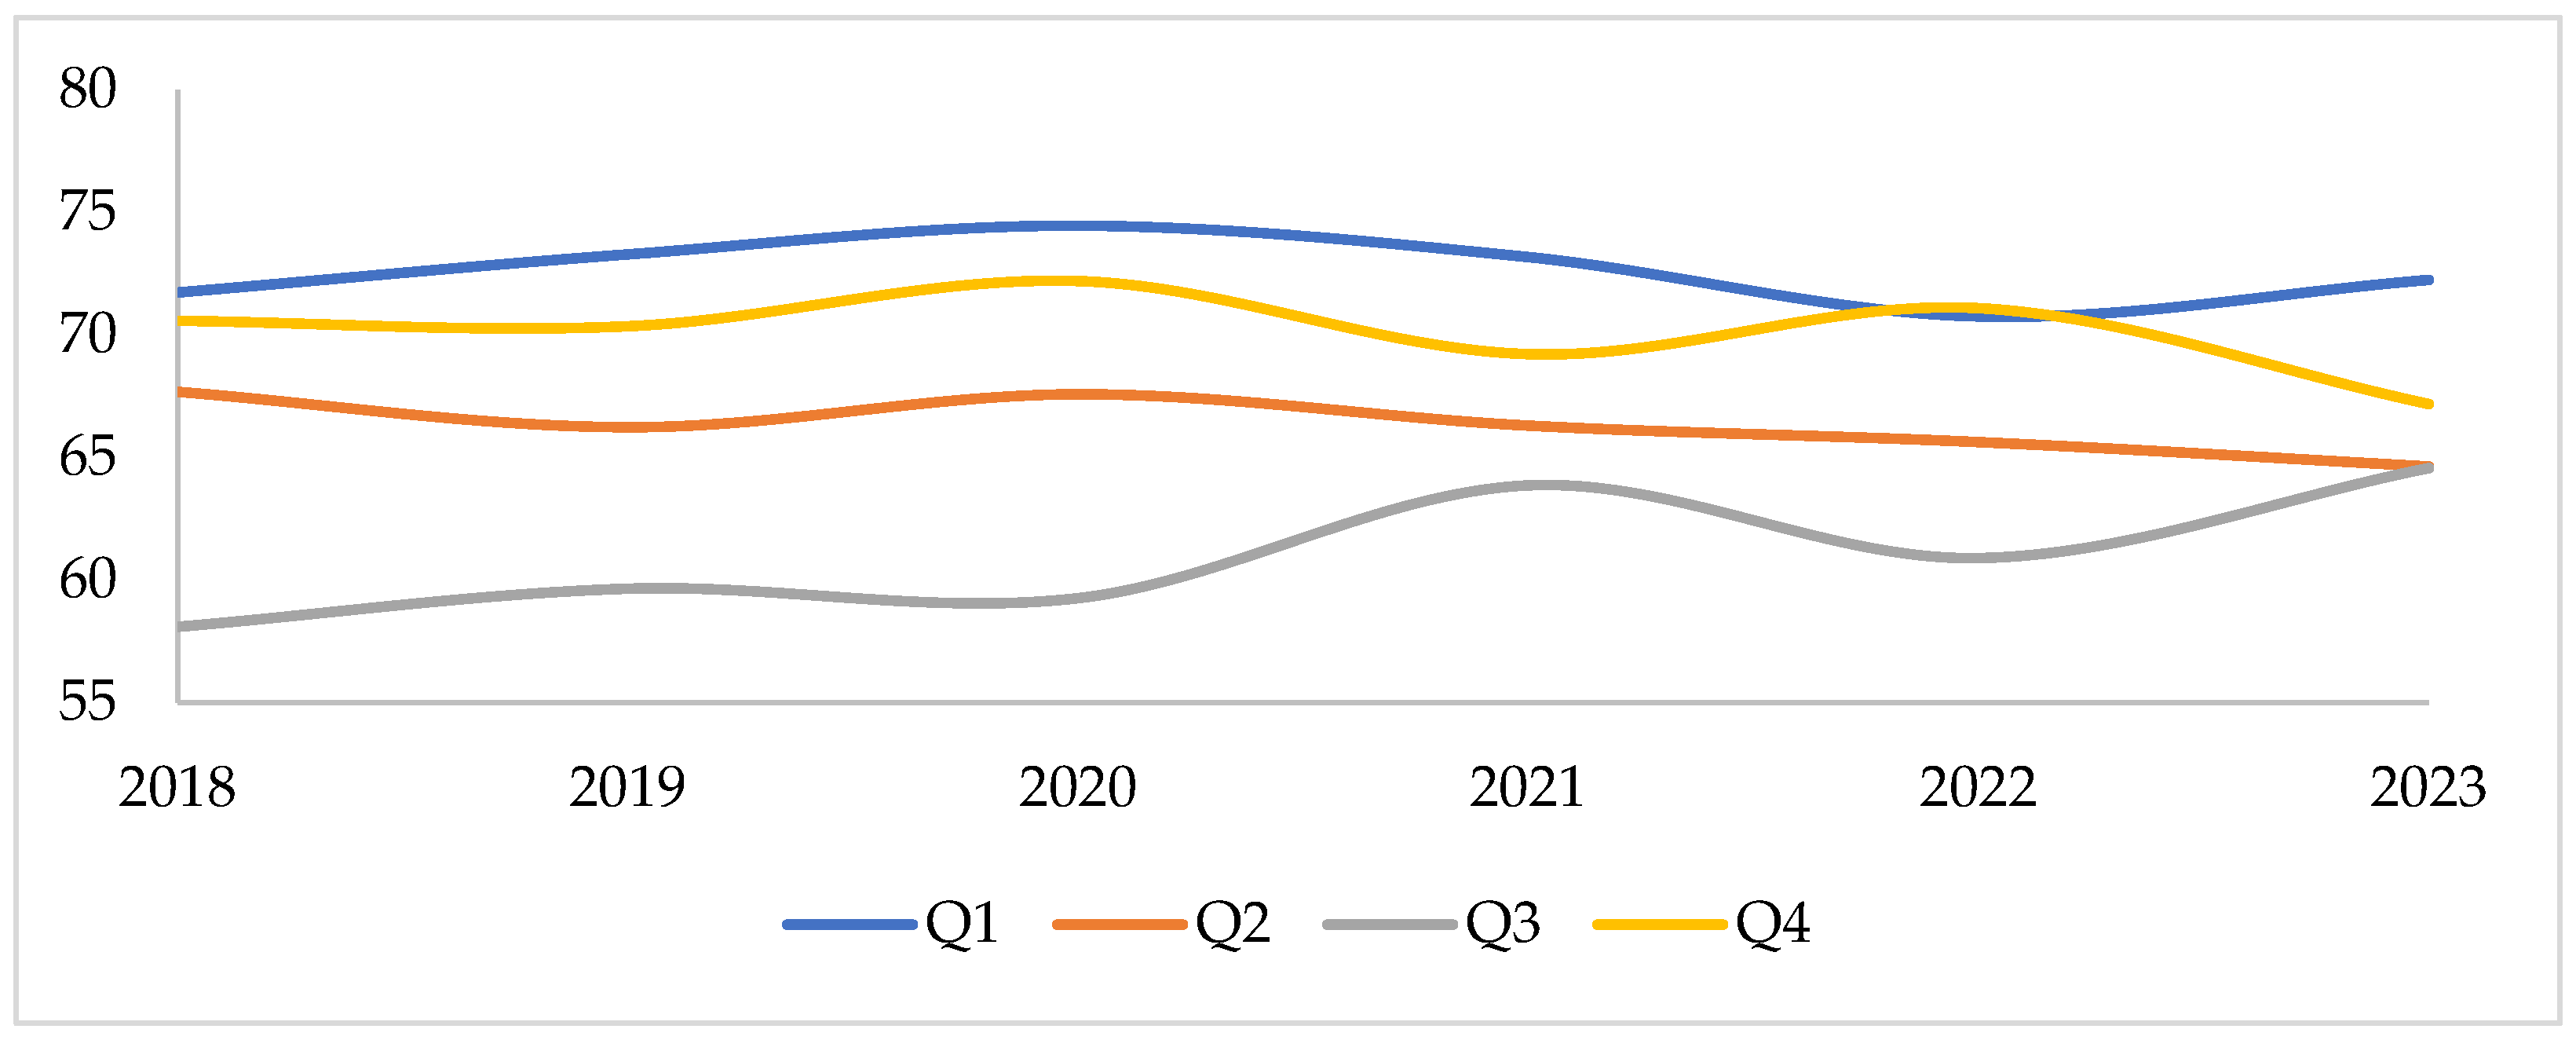
In this section, an analysis is conducted of the dynamics of self-perceived quality of life and health among groups of countries with varying levels of environmental safety, as identified in Table 6. Figure 5 presents the values of satisfaction with life (Y1–3) in years 2018–2023, averaged across EU(27) countries, sorted into quartiles of environmental safety. The highest levels of life satisfaction are presented by the inhabitants of countries classified within Q1 and Q2 (the highest environmental safety). However, it should be noted that, in certain years, countries within Q2 demonstrated superior performance in comparison to those in Q1. It is a surprising finding that the lowest self-perceived quality of life is observed in countries from Q3 (moderately low environmental safety). Moreover, in a somewhat unexpected turn of events, countries from the fourth quarter (Q4) exhibited an average life satisfaction level comparable to that of countries from the first three quarters (Q1, Q2 and Q3). This phenomenon could be indicative of the presence of independent social factors that exert an influence on the outcomes.
The self-assessment of health by EU residents is the highest and most stable across countries that are rated best in terms of environmental safety, based on the ES_Score (Q1). Conversely, the lowest self-perceived quality of health is, once more, evident in countries classified into Q3. It is interesting to note that countries categorised in Q4, despite having the worst environmental safety rankings, exhibit slightly better self-perceived health than countries categorised in Q2. This finding indicates that the objective indicators of environmental safety do not necessarily align with subjective health perceptions. The stability observed in the years 2018–2023 indicates that the health perception in the EU remained relatively unchanged during this period (Figure 6).
Figure 7 presents the percentage of people declaring good or very good health (Y5) over the period 2018–2023, averaged across the quartiles of environmental safety ranking based on ES_Score. A noticeable trend emerges when analysing the data: inhabitants of countries classified in Q1 tend to assign the highest ratings of their health, while those residing in countries classified in Q3 tend to rate their health the lowest. Noticeably, in 2023, the values of Y5 in countries classified within Q4 almost reached those observed in the higher quartiles.
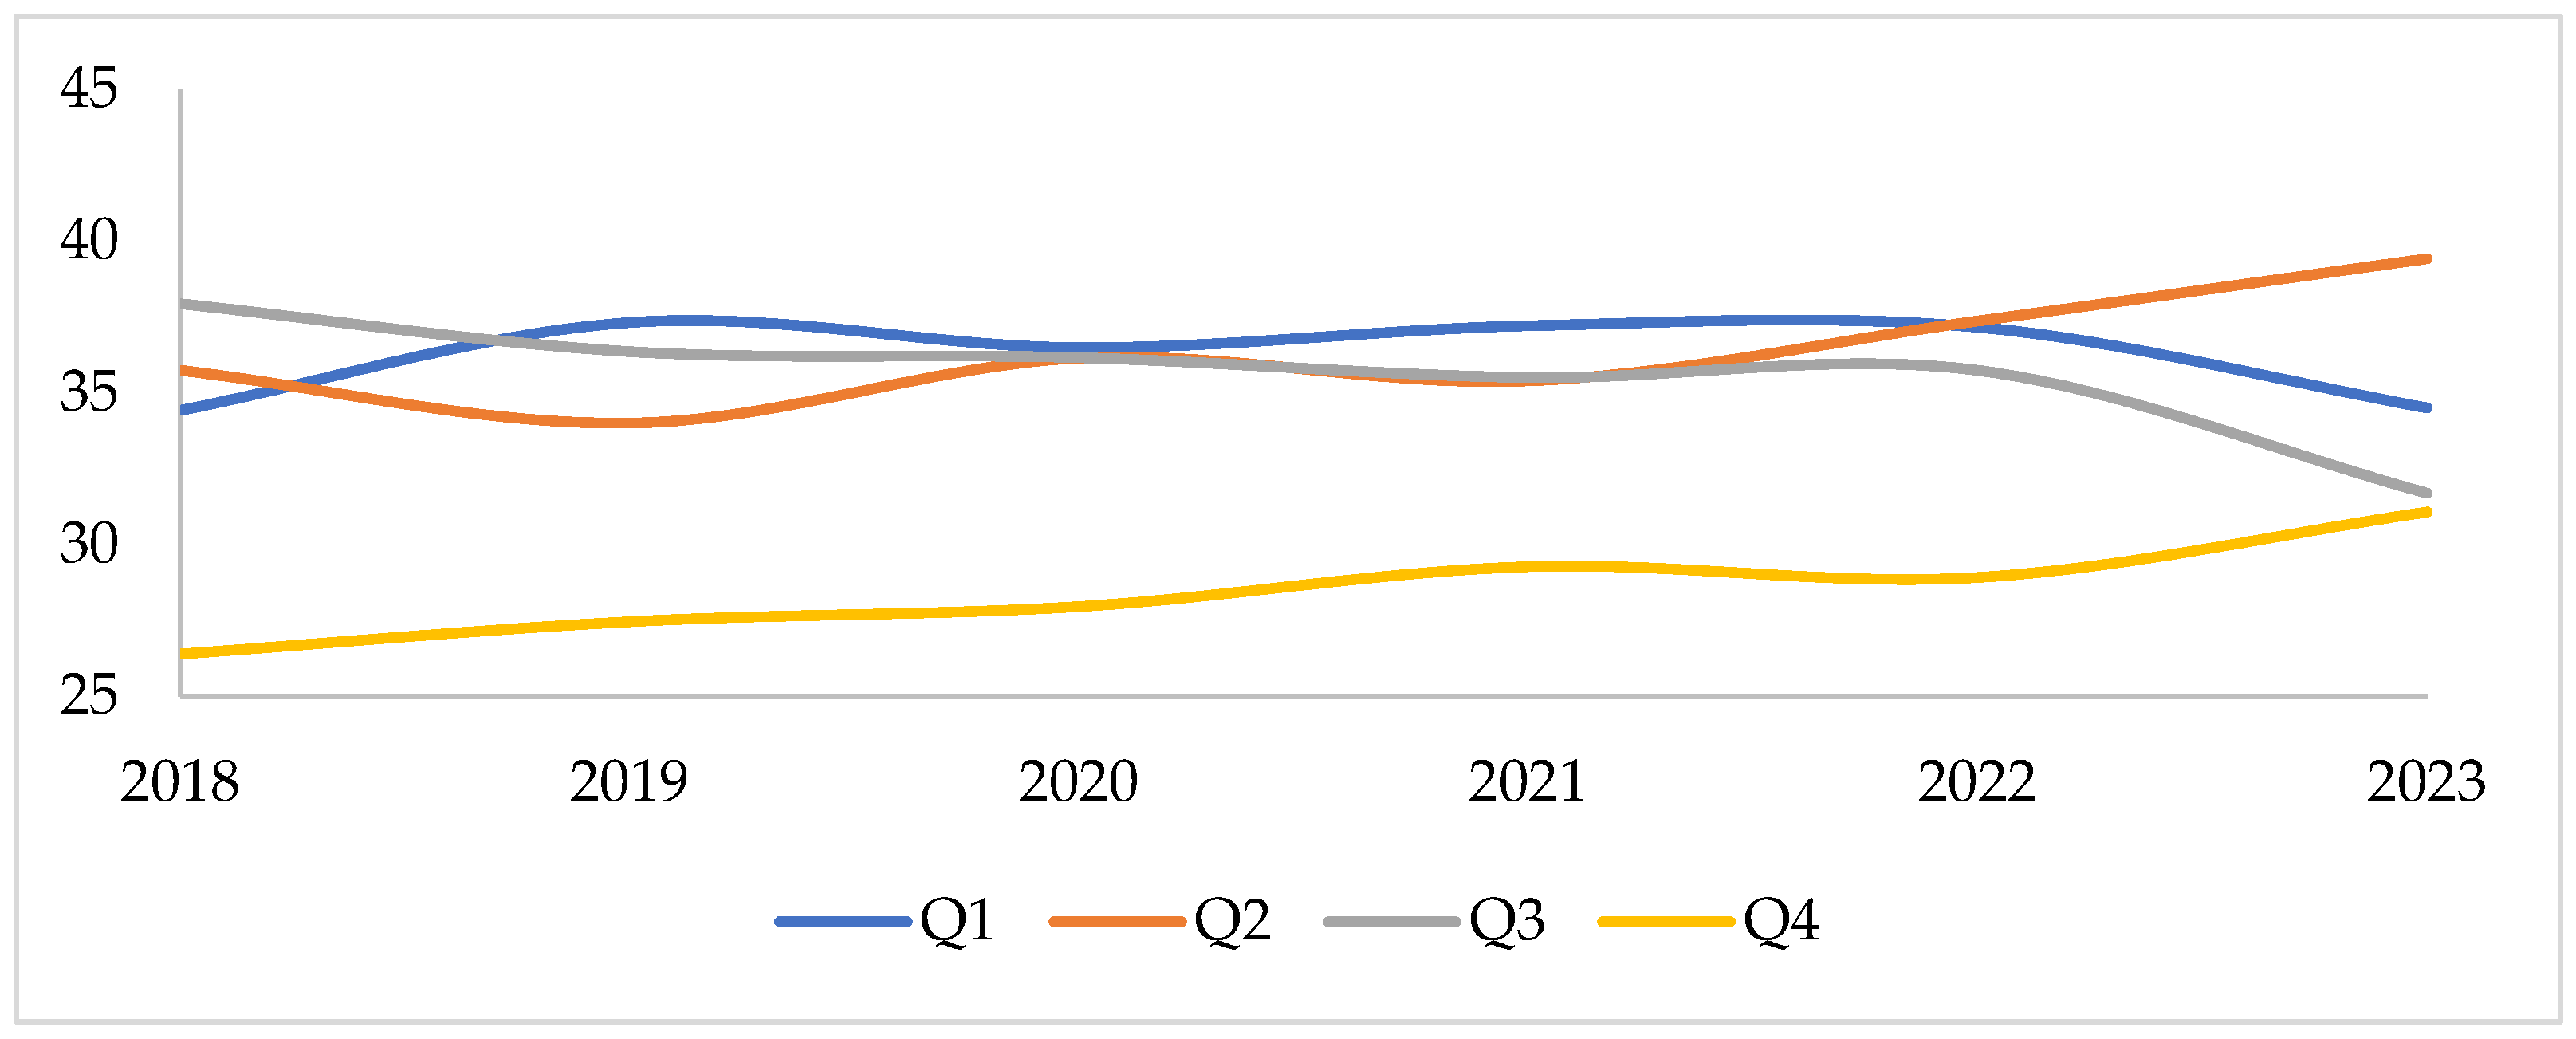
Figure 8 presents the percentage of EU(27) countries’ inhabitants having a long-standing illness or health problems over the period 2018–2023. Until 2022, countries demonstrating high, moderate and low environmental safety exhibited comparable Y6 values, ranging from 34 to 37%. Subsequently, the percentage of people having a long-standing illness or health problem diminished in countries classified into Q1 and Q3, while it increased in countries categorised as Q2. It is a surprising finding that countries classified in Q4 (which demonstrate a very low environmental safety) exhibited the lowest percentage of people having a long-standing illness or health problems. The phenomenon may be attributable to a number of factors, including, but not limited to, underestimation, restricted access to healthcare services, and reduced disease detection rates. It is also possible that other socio-economic factors play a role. However, recent years are characterised by an increase in Y6 in Q4 countries, which may be indicative of an increase in disease detection or higher social awareness (Figure 8).

4.6. Univariate Analysis of the Relationship Between Environmental Safety and Self-Perceived Quality of Life and Health

Pairwise correlations among the environmental variables (circular economy, access to water, and forestry) and the self-perceived quality of life and health (see Table 7) provide some intriguing insights into the relationships between these variables.
Subjective life satisfaction (Y1–3) tends to be moderately negatively correlated with air pollution: X2 (r = −0.57) and X3 (r = −0.54), which suggests a significantly negative effect of air pollution on well-being. A weak positive relationship exists between Y1–3 and X6 (r = 0.27) and X9 (r = 0.25), suggesting that higher recycling rates and a higher share of people connected to wastewater treatment plants may improve well-being slightly. It is also interesting to note that X1 (noise perception) is weakly positively correlated (r = 0.19) with Y1–3, which may reflect the benefits of an urban lifestyle, despite the noise nuisance.
The self-rating of health (Y4) and the share of people with good or very good perceived health (Y5) are very closely correlated (r = 0.96), confirming the consistency of these measures. The findings indicate a moderately positive correlation between Y4 and X8 (access to water, r = 0.37) and between Y5 and X8 (r = 0.41), suggesting a potential impact of water supply infrastructure on health perception. The findings indicate a moderately negative correlation between Y6 (long-standing illness) and X9 (access to wastewater treatment plants, r = −0.35). This suggests that improvements in sanitation infrastructure may have a beneficial effect on public health, potentially through enhanced hygiene practices.
The weak correlation between ES_Score and life satisfaction (r = 0.03) indicates that the factors incorporated into ES_Score construction collectively exert a negligible influence on subjective quality of life. Furthermore, a positive correlation between ES_Score and Y6 (r = 0.28) is counterintuitive, given that it suggests that the share of people with long-standing illnesses increases with the ES_Score values (environmental safety). Additionally, the ageing population in these regions has also likely contributed to this trend.

4.7. Multivariate Analysis of the Relationship Between Environmental Safety and Self-Perceived Quality of Life and Health

In order to identify the relationships between environmental safety variables and self-perceived quality of life and health more comprehensively, the estimation of a panel model as presented in Section 3 is now being turned to. In view of the outcomes of the Breusch–Pagan and Hausman tests, the country fixed effects (FE) estimator is employed to identify within-country relationships between environmental safety factors and the self-perceived quality of life and health. In the subsequent step of the analysis, an estimation of the between-effects model is conducted to facilitate an analysis of the cross-country variations in these relationships. The model under consideration comprises subjective ratings of life and health (Y1–Y6) as dependent variables, environmental variables (X1–X11) as explanatory variables, and economic factors (such as inflation, GDP growth and age dependency ratio) as control variables. The results of the estimations are presented in Table 8 and reveal the complexities of the relationships between environmental factors and quality of life and health.
In the fixed effects models presented, the statistically significant coefficients pertain to the air emissions intensity (X3) and the outlays on climate-related investments (X5) in models with a self-perceived quality of life (Y1–3) as a dependent variable. Both coefficients are significantly negative, indicating that higher values of these variables are associated with lower life satisfaction. The coefficient on X5 may be indicative of the perception among society that the intensification of climate-related investments is costly and cumbersome, at least in the short term. The contrary effect is evident for environmental issues (X4) and freshwater abstraction (X11), which demonstrate a positive correlation with life satisfaction. This phenomenon may be indicative of the paradox of perception, whereby elevated values of these variables may be associated with advanced infrastructure or substantial urbanisation, which, despite existing environmental concerns, leads to an enhancement in quality of life.
In a model with Y5 (self-perceived quality of health) as the dependent variable, a negative effect of the outlay on climate-related investments (X5) and freshwater abstraction (X11) is once more evident. It is important to note that, once the time-dummies are incorporated, the coefficients on these variables are no longer statistically significant. This finding suggests that the observed relationship may be attributable to the common time variation. It is plausible that well-being and investments/water abstraction exhibited a co-movement in the analysed period.
In line with prevailing expectations, an elevated share of people who self-report long-standing illnesses (Y6) is observed in instances of pronounced pollution and other environmental concerns (X4). This finding serves to substantiate the adverse health implications that are associated with the degradation of the environment. A comparable relationship, i.e., a positive impact on Y6, is observed for X11 (freshwater abstraction). This may be attributable to its correlation with urbanisation or environmental pressures in more developed regions.
The findings further imply the presence of a positive, albeit modest (in terms of statistical significance), association between the recycling of municipal waste (X6) and self-perceived health (Y4). Despite the absence of a robust correlation between the variables in question, the direction of the relationship lends support to the hypothesis that pro-environmental activities, including the implementation of appropriate waste management systems, have the potential to exert a favourable influence on the subjective health and well-being of individuals.
The between-effects model estimation (Table 9) yields further intriguing insights. In line with the prevailing expectations, an increase in premature deaths due to exposure to fine particulate matter (X2) is associated with a concomitant increase in the share of the population afflicted by long-standing illness (Y6). This relationship serves to substantiate the adverse health effects engendered by long-term exposure to particulate matter and deteriorating air quality. Concurrently, the findings of the estimation process reveal a paradox concerning the X3 (air emission intensity). In countries exhibiting elevated air emission intensities, a heightened self-perceived health (Y4) is observed. This may be an effect of the subjective assessment in more industrialised societies, where access to healthcare utilities and health awareness are higher. Nevertheless, the coefficient on the same factor (X3) in the model with the share of people declaring good or very good health (Y5) as the dependent variable is also negative. This finding may indicate that, despite an individual’s positive self-assessment of physical health, environmental factors can exert an adverse influence on overall well-being.

5. Discussion

The research findings indicate several regional and structural tendencies. The highest levels of environmental safety, as indicated by the ES_Score index, are observed in a combination of countries from diverse regions of the European Union, with a predominance of Northern and Western nations—often smaller states with specific economic profiles (e.g., island economies or those reliant on tourism). The lowest scores are concentrated in Eastern and Southern Europe. However, the inclusion of countries such as Belgium and Italy in this group suggests that environmental challenges transcend regional boundaries. The findings indicate that institutional, political and economic variations between nations are pivotal factors influencing the attained level of environmental safety, as previously highlighted by other researchers [70,71,72]. The region provides a general framework, with countries exhibiting similar historical backgrounds and geographic locations often achieving comparable levels of environmental safety. However, individual national actions have the capacity to elevate a country above its regional average or, conversely, result in its lagging behind [73,74,75,76]. This observation highlights the necessity for further individualised studies to ascertain which internal factors (e.g., environmental policy, energy structure, public awareness) account for the successes of leading countries and the delays of laggards in the field of environmental safety.
The alterations in ranking positions were principally evolutionary in nature, as opposed to being revolutionary. Nevertheless, several cases—such as the upward movement of Poland, Italy and Slovenia, and the decline of Finland and Croatia—demonstrate that partial rankings can respond to significant shifts in environmental or economic policies, as well as to external events. However, the overall structure of the environmental safety ranking remained relatively stable, confirming that achieving a lasting improvement in position requires consistent enhancement of environmental indicators over multiple years.
In summary, Romania was identified as the poorest performer in terms of environmental safety. Belgium, Italy, Ireland, and, on occasion, Hungary consistently occupied the lowest positions in the ranking, achieving results that were significantly below the EU average. It is noteworthy that several Western European countries with advanced economies also demonstrated surprisingly low rankings. The consistent position of Belgium as an environmental safety laggard is particularly surprising, as are the underwhelming results of Germany and Luxembourg. While these figures do not represent the most deficient performances, both countries exhibited below-average results when benchmarked against the EU average. Germany was consistently positioned in the bottom third of the ranking, with an average rank of 21 over the entire period (e.g., 19th in 2018, 24th in 2020, and 18th in 2023). Luxembourg, despite its diminutive size and elevated GDP per capita, was also placed in the third decile (averaging approximately 22nd, and ranking 25th in 2023). This finding suggests that a high level of economic development does not necessarily guarantee a high level of environmental safety. The impact of structural factors or specific issues on a country’s position is significant. For instance, high transport emissions in Belgium, or intensive agriculture and industry in Germany, can have a substantial impact on a nation’s standing due to its high emission values. It is noteworthy that in 2024, Germany attained a commendable Environmental Performance Index (EPI) score of 74.5, placing it third in the rankings. Similarly, Belgium’s EPI score of 66.8 positioned it 15th in the index. These observations suggest that the environmental performance of these countries remains consistently high, with other environmental indicators potentially offering a buffer against any fluctuations in the EPI score [77].
The analysis of data from 2018 to 2023 reveals that countries in the highest environmental safety quartile (Q1) consistently exhibited the highest percentage of individuals who reported good or very good health status (Y5) throughout the entire study period. A slight upward trend in this indicator was observed across all quartiles until 2020, suggesting a general improvement in health perception during that time. However, following 2020, a gradual decline was observed, which may be attributed to external factors such as the pandemic caused by the severe acute respiratory syndrome (SARS-CoV-2) virus. Furthermore, the data indicates that countries in the second quartile experienced the most significant increase in the proportion of individuals with long-standing illnesses following 2021. This trend may be indicative of a deterioration in health within this demographic, or alternatively, it may signify an enhancement in diagnostic methodologies and an augmented illness detection.
The level of subjective life satisfaction (Y1–3) from 2018 to 2023 does not show a consistent correlation with countries’ rankings in the ES_Score index. The lowest levels of life satisfaction were recorded in countries within the third quartile (Q3), potentially indicating that nations occupying medium-low positions in the environmental safety ranking face more pronounced social or economic challenges. It is interesting to note that the fourth quartile (Q4), despite achieving the lowest ES_Score index score, attained a level of life satisfaction in 2023 that was comparable to Q2 and close to Q1. This is an atypical result for this group. This finding may be indicative of an elevated level of adaptability or resilience exhibited by residents of these regions in the face of adversity, thereby enhancing their subjective sense of well-being. The influence of cultural traditions and a strong sense of community on life satisfaction has been demonstrated to be more significant than that of objective environmental indicators in certain cases.
In her study, Streimikiene [57] included 27 European Union countries and emphasised the significant influence of both the natural and urbanized environment on residents’ quality of life. The findings of the data analysis indicated that enhancements in the physical environment—characterised by improved air quality, augmented availability of green spaces, and diminished noise and pollution levels—were associated with an elevated quality of life. It is important to note that these positive changes became evident only after the 2008 economic crisis, during which a decline in emissions and waste generation was observed. The author also attributed considerable importance to housing conditions, which have improved since 2008, including greater residential comfort, increased living space, and enhanced quality of surroundings—cleaner, safer neighbourhoods with better access to services. The impact of these changes on the quality of life of residents has been demonstrated to be positive. The fundamental interconnection between environmental safety and public health is well-established, with a healthy environment being a prerequisite for overall well-being. Poor air and water quality, in conjunction with exposure to hazardous materials, have been demonstrated to exert a direct influence on physical health, contributing to the development of long-standing illnesses and elevated mortality rates. Access to uncontaminated water is imperative for minimising health risks, supporting hygiene, and ensuring food safety, all of which directly enhance quality of life. The quantity and quality of water resources have been demonstrated to have a significant influence on human well-being, especially among vulnerable populations [78].
The psychological ramifications of environmental degradation have been demonstrated to be intrinsically linked to the quality of life experienced by individuals. Communities facing environmental threats may experience heightened anxiety, stress, and a sense of vulnerability, all of which have been demonstrated to have a negative impact on mental health [79]. Vulnerable populations, especially those residing in marginalised urban areas or regions prone to environmental hazards, are disproportionately affected by environmental degradation. Research indicates that long-term migrants often settle in disaster-prone areas, increasing their exposure to environmental stressors and reducing their overall human security. This state of insecurity has been demonstrated to have deleterious effects on mental health, community displacement, and the erosion of social cohesion, which in turn adversely affects quality of life. Consequently, enhancing environmental safety through sustainable practices has the potential to strengthen resilience among vulnerable communities, thereby improving their overall quality of life [80].
Sustainable environmental management has been demonstrated to directly contribute to economic stability, a fundamental component of quality of life. It is imperative that political and economic stability are aligned with environmental considerations in order to facilitate inclusive growth that benefits all sectors of society. The implementation of sustainable practices has been demonstrated to have a multifaceted impact, including the protection of ecosystems, the generation of employment opportunities, and the promotion of economic development. This, in turn, has the potential to elevate living standards and enhance social well-being [81]. The findings of the present study indicated a substantial positive correlation (0.49) between the extent of investment in climate change mitigation initiatives across EU-27 nations and the demographic dependency ratio.
Furthermore, a moderate positive correlation (r = 0.34) was observed between the demographic dependency ratio and the Environmental Safety Index (ES_Score). This finding suggests that EU(27) countries with a higher proportion of non-working-age individuals are more likely to engage in climate transition initiatives. Such actions may be motivated by a desire to ensure long-term socio-economic stability and to protect the health and quality of life of future generations.
One serious limitation of our study is the granularity of the data, which is aggregated at the country level. Given that both environmental safety and self-perceived quality of life and health may vary within each country (e.g., heavily industrialised vs. touristic regions), future research should address this limitation. In particular, by studying more granular data, e.g., on NUTS, NUTS-2 or even NUTS-3 level, future research could potentially reveal more realistic patterns between local environmental safety and self-perceived quality of life.

6. Conclusions

This study aimed to evaluate the environmental safety in EU countries and examine its relationship with the subjective perception of quality of life and health. The results of the analyses fill a significant gap in research on sustainable development and quality of life. The integration of objective environmental safety indicators with subjective assessments of quality of life and health provides new and more in-depth insights. The results suggest that environmental safety, measured multidimensionally, is a significant driver of the self-assessment of quality of life and health among EU countries. The contribution of this paper emerges from combining a multicriteria methodology (TOPSIS) with panel analysis, which enabled us not only to classify countries according to environmental safety but also to capture the persistence and heterogeneity of these relationships over time. Therefore, the study provides a novel perspective and adds to the discussion on the sustainable growth policy by indicating that the improvement in environmental safety should be considered a key instrument for increasing society’s quality of life.
It is evident that environmental safety is of paramount importance in determining quality of life and public health. This concept is a multifaceted domain that integrates ecosystem protection, the rational management of natural resources, and the promotion of social well-being. The contemporary approach is predicated on the assumption that ensuring unpolluted air, water, and soil, as well as reducing exposure to environmental hazards, is essential for maintaining public health.
The analyses conducted in this study revealed significant disparities in the level of environmental safety among European Union countries, with this distribution remaining relatively stable over time. It is evident that certain countries have a tendency to either maintain or alternate between positions of leadership and laggard in the environmental safety rankings. The level of environmental safety across the EU is significantly associated with selected dimensions of quality of life and health among residents.
The article emphasises the pivotal role of investments in climate protection and waste management for comprehensive environmental safety assessments, thus exerting discernible implications for the formulation of sustainable development policy. The adverse effect of air pollution on life satisfaction highlights the pressing need for urgent action to enhance air quality. It is therefore vital that efforts are made to enhance living environments through targeted policies and urban planning, in order to improve quality of life and mitigate adverse health effects, particularly among vulnerable populations. The interconnections between environmental conditions and quality of life are multifaceted and essential for public health and urban development discussions. Interventions designed to enhance natural and semi-urban environments have been demonstrated to engender significant improvements in the well-being of individuals and communities.
It is recommended that future research continues to explore the potential of specific environmental interventions to effectively mitigate risks and foster environments that support an enhanced quality of life for all. By mitigating the discord between economic activities and environmental imperatives, the implementation of participatory management models, and the integration of environmental protection policies with food and energy security strategies, states have the opportunity not only to safeguard natural resources but also to substantively enhance the daily living conditions of their citizens. This approach is conducive to the development of resilient, healthy, and sustainable communities.

Author Contributions

Conceptualization, A.M., P.S. and S.S.; methodology, P.S. and S.S.; formal analysis, A.M., P.S. and S.S.; investigation, A.M., P.S. and S.S.; resources, A.M. and P.S.; data curation, P.S. and S.S.; writing—original draft preparation, A.M., P.S. and S.S.; writing—review and editing, A.M., P.S. and S.S.; visualization, S.S.; supervision, A.M. All authors have read and agreed to the published version of the manuscript.

Funding

This research received no external funding.

Institutional Review Board Statement

Not applicable.

Informed Consent Statement

Not applicable.

Data Availability Statement

The data used in the study are publicly available from Eurostat and World Bank.

Conflicts of Interest

The authors declare no conflicts of interest.

References

  1. Belau, M.H.; Jung, L.; Maurer, T.; Obi, N.; Behrens, S.; Seibold, P.; Becher, H.; Chang-Claude, J. Social Relationships and Their Impact on Health-Related Quality of Life in a Long-Term Breast Cancer Survivor Cohort. Cancer 2024, 130, 3210–3218. [Google Scholar] [CrossRef] [PubMed]
  2. Faka, A. Assessing Quality of Life Inequalities. A Geographical Approach. ISPRS Int. J. Geo-Inf. 2020, 9, 600. [Google Scholar] [CrossRef]
  3. Felce, D.; Perry, J. Quality of Life: Its Definition and Measurement. Res. Dev. Disabil. 1995, 16, 51–74. [Google Scholar] [CrossRef]
  4. Fernandez-Portero, C.; Amian, J.G.; Alarcón, D.; Arenilla Villalba, M.J.; Sánchez-Medina, J.A. The Effect of Social Relationships on the Well-Being and Happiness of Older Adults Living Alone or with Relatives. Healthcare 2023, 11, 222. [Google Scholar] [CrossRef]
  5. Gaweł-Luty, E. Wybrane Konteksty Jakości Życia. Colloquium 2022, 14, 163–173. [Google Scholar]
  6. Chang, K.K.P.; Wong, F.K.Y.; Chan, K.L.; Wong, F.; Ho, H.C.; Wong, M.S.; Ho, Y.S.; Yuen, J.W.M.; Siu, J.Y.; Yang, L. The Impact of the Environment on the Quality of Life and the Mediating Effects of Sleep and Stress. Int. J. Environ. Res. Public. Health 2020, 17, 8529. [Google Scholar] [CrossRef]
  7. Pacione, M. Urban Environmental Quality and Human Wellbeing—A Social Geographical Perspective. Landsc. Urban Plan. 2003, 65, 19–30. [Google Scholar] [CrossRef]
  8. Riedlova, P.; Tomaskova, H.; Slachtova, H.; Babjakova, J.; Jirik, V. The Impact of Environmental Conditions on Lifestyle Quality in Industrial and Non-Industrial Region in the Czech Republic. Front. Public Health 2025, 13, 1505170. [Google Scholar] [CrossRef]
  9. EEA. Chapter 5: Environment, Health and Quality of Life. In The European Environment; Publications Office of the European Union: Luxembourg, 2010. [Google Scholar] [CrossRef]
  10. Levett, R. Sustainability Indicators—Integrating Quality of Life and Environmental Protection. J. R. Stat. Soc. Ser. A Stat. Soc. 1998, 161, 291–302. [Google Scholar] [CrossRef]
  11. Lochan Behera, K.; Taneja, M.; Faiz, A.; Hanumanthayya, M.; Sharma, V.K.; Kore, N.; Antony, M. Environmental Health Interventions and Their Impact on Quality of Life. Health Leadersh. Qual. Life 2024, 3, 383. [Google Scholar]
  12. Brusseau, M.L.; Ramirez-Andreotta, M.; Pepper, I.L.; Maximillian, J. Chapter 26—Environmental Impacts on Human Health and Well-Being. In Environmental and Pollution Science, 3rd ed.; Brusseau, M.L., Pepper, I.L., Gerba, C.P., Eds.; Academic Press: Cambridge, MA, USA, 2019; pp. 477–499. ISBN 978-0-12-814719-1. [Google Scholar]
  13. EEA. Environmental Health Impacts. Available online: https://www.eea.europa.eu/en/topics/in-depth/environmental-health-impacts (accessed on 4 July 2025).
  14. Ferreira, S.; Akay, A.; Brereton, F.; Cuñado, J.; Martinsson, P.; Moro, M.; Ningal, T.F. Life Satisfaction and Air Quality in Europe. Ecol. Econ. 2013, 88, 1–10. [Google Scholar] [CrossRef]
  15. Panagopoulos, T.; González Duque, J.A.; Bostenaru Dan, M. Urban Planning with Respect to Environmental Quality and Human Well-Being. Environ. Pollut. 2016, 208, 137–144. [Google Scholar] [CrossRef]
  16. Zhang, L.; Yang, Y.; Lin, Y.; Chen, H. Human Health, Environmental Quality and Governance Quality: Novel Findings and Implications from Human Health Perspective. Front. Public Health 2022, 10, 890741. [Google Scholar] [CrossRef] [PubMed]
  17. Chukkali, S.; Rastogi, K.; Agrawal, A.; Nayar, S.; Raj, P. Air Quality Index, Personality Traits and Their Impact on the Residential Satisfaction and Quality of Life: An Exploratory Path Analysis Model. Asian J. Water Environ. Pollut. 2024, 21, 39–46. [Google Scholar] [CrossRef]
  18. Du, Y.; You, S.; Zhang, M.; Song, Z.; Liu, W.; Li, D. Analysis of Correlation between Quality of Life and Subjective Evaluation of Air Quality—Empirical Research Based on CHARLS 2018 Data. Atmosphere 2021, 12, 1551. [Google Scholar] [CrossRef]
  19. Krekel, C.; Kolbe, J.; Wüstemann, H. The Greener, the Happier? The Effect of Urban Land Use on Residential Well-Being. Ecol. Econ. 2016, 121, 117–127. [Google Scholar] [CrossRef]
  20. McEachan, R.R.C.; Yang, T.C.; Roberts, H.; Pickett, K.E.; Arseneau-Powell, D.; Gidlow, C.J.; Wright, J.; Nieuwenhuijsen, M. Availability, Use of, and Satisfaction with Green Space, and Children’s Mental Wellbeing at Age 4 Years in a Multicultural, Deprived, Urban Area: Results from the Born in Bradford Cohort Study. Lancet Planet. Health 2018, 2, e244–e254. [Google Scholar] [CrossRef]
  21. Mukherjee, D.; Safraj, S.; Tayyab, M.; Shivashankar, R.; Patel, S.A.; Narayanan, G.; Ajay, V.S.; Ali, M.K.; Narayan, K.V.; Tandon, N.; et al. Park Availability and Major Depression in Individuals with Chronic Conditions: Is There an Association in Urban India? Health Place 2017, 47, 54–62. [Google Scholar] [CrossRef]
  22. Qiao, Y.; Chen, Z.; Chen, Y.; Zheng, T. Deciphering the Link Between Mental Health and Green Space in Shenzhen, China: The Mediating Impact of Residents’ Satisfaction. Front. Public Health 2021, 9, 561809. [Google Scholar] [CrossRef]
  23. Stigsdotter, U.K.; Ekholm, O.; Schipperijn, J.; Toftager, M.; Kamper-Jørgensen, F.; Randrup, T.B. Health Promoting Outdoor Environments—Associations between Green Space, and Health, Health-Related Quality of Life and Stress Based on a Danish National Representative Survey. Scand. J. Public Health 2010, 38, 411–417. [Google Scholar] [CrossRef]
  24. Braubach, M.; Tobollik, M.; Mudu, P.; Hiscock, R.; Chapizanis, D.; Sarigiannis, D.A.; Keuken, M.; Perez, L.; Martuzzi, M. Development of a Quantitative Methodology to Assess the Impacts of Urban Transport Interventions and Related Noise on Well-Being. Int. J. Environ. Res. Public Health 2015, 12, 5792–5814. [Google Scholar] [CrossRef]
  25. Byaello, K. Impact of Noise Pollution on Community Health and Well-Being in Lagos, Nigeria. J. Wet. Health 2023, 4, 15–21. [Google Scholar] [CrossRef]
  26. Eurostat Database—Eurostat. Available online: https://ec.europa.eu/eurostat/web/main/data/database (accessed on 10 June 2025).
  27. Eurostat Income and Living Conditions (Ilc). Available online: https://ec.europa.eu/eurostat/cache/metadata/en/ilc_sieusilc.htm (accessed on 13 May 2025).
  28. Eurostat. Quality of Life Indicators—Measuring Quality of Life. Available online: https://ec.europa.eu/eurostat/statistics-explained/index.php?title=Quality_of_life_indicators_-_measuring_quality_of_life (accessed on 7 March 2025).
  29. World Bank Group. World Bank Open Data. Available online: https://data.worldbank.org (accessed on 10 June 2025).
  30. Hirsch Ballin, E.; Dijstelbloem, H.; de Goede, P. The Extension of the Concept of Security. In Security in an Interconnected World: A Strategic Vision for Defence Policy; Springer: Cham, Switzerland, 2020; pp. 13–39. [Google Scholar]
  31. Adebayo, G.O. Counter-Radicalization Policies and Policing in Education: Making a Case for Human Security in Europe. Heliyon 2021, 7, e05721. [Google Scholar] [CrossRef]
  32. Grey, D.; Garrick, D.; Blackmore, D.; Kelman, J.; Muller, M.; Sadoff, C. Water Security in One Blue Planet: Twenty-First Century Policy Challenges for Science. Philos. Trans. R. Soc. Math. Phys. Eng. Sci. 2013, 371, 20120406. [Google Scholar] [CrossRef] [PubMed]
  33. Mordwa, S. Subiektywne Poczucie Zagrożenia a Zachowania Obronne Mieszkańców Łodzi. Acta Univ. Lodz. Folia Geogr. Socio-Oeconomica 2016, 23, 151–170. [Google Scholar] [CrossRef]
  34. Wyligała, H. Bezpieczeństwo Ekologiczne; Wydawnictwo Naukowe Uniwersytetu Ignatianum w Krakowie: Kraków, Poland, 2023. [Google Scholar]
  35. Szewczyk, Z. Ecology Safety—Sustainable Development and Economical Aspect. Ann. Pol. Assoc. Agric. Agribus. Econ. 2017, XIX, 295–300. [Google Scholar] [CrossRef]
  36. Zapolska, K. Bezpieczeństwo Ekologiczne Jako Element Bezpieczeństwa Narodowego RP. In Współczesne Oblicza Bezpieczeństwa; Guzik-Makaruk, E.M., Pływaczewski, E.W., Eds.; Temida2: Białystok, Poland, 2015; pp. 209–217. ISBN 978-83-62813-66-7. [Google Scholar]
  37. Butts, K.H. Environmental Security and Climate Change: A Link to Homeland Security. J. Homel. Secur. Emerg. Manag. 2014, 11, 269–279. [Google Scholar] [CrossRef]
  38. Lonergan, S. Human Security, Environmental Security and Sustainable Development. In Environment and Security; Palgrave Macmillan UK: London, UK, 2000; pp. 66–83. [Google Scholar]
  39. Polyakova, E.; Gorina, L. Environmental Security and Sustainable Development of Large Urban Centres. E3S Web Conf. 2021, 250, 01003. [Google Scholar] [CrossRef]
  40. Ashraf, M.A.; Amescua García, C.M.; Chowdhury, A.J.K. Introduction Environment, Development and Sustainability. Rev. Int. Contam. Ambient. 2019, 35, 7–9. [Google Scholar] [CrossRef]
  41. Li, G. Sustainable Development Strategies in Urban Planning. Adv. Econ. Manag. Polit. Sci. 2024, 96, 107–111. [Google Scholar] [CrossRef]
  42. Ciszek, M. Ecological (Environmental) Security and Ecological (Environmental) Security Culture. Kult. Bezpieczeństwa 2016, 5, 11–22. [Google Scholar]
  43. Leszczyński, M. Bezpieczeństwo Ekologiczne w Poszerzonej Domenie Bezpieczeństwa. Nierówności Społeczne Wzrost Gospod. 2023, 74, 21–32. [Google Scholar] [CrossRef]
  44. Chaudhry, K.T.; Javed, A.; Nazir, M.A. Humanitarian Crisis and Intervention: Securitizing Environmental Challenges in Pakistan. Ann. Hum. Soc. Sci. 2022, 3, 10–20. [Google Scholar] [CrossRef]
  45. Iqbal, K.M.J.; Akhtar, N.; Amir, S.; Khan, M.I.; Shah, A.A.; Tariq, M.A.U.R.; Ullah, W. Multi-Variable Governance Index Modeling of Government’s Policies, Legal and Institutional Strategies, and Management for Climate Compatible and Sustainable Agriculture Development. Sustainability 2022, 14, 11763. [Google Scholar] [CrossRef]
  46. Bezpalova, O.I.; Onopriienko, S.; Tarasov, S.; Zavalna, Z.; Starynskyi, M. State Environmental Security in National and Globalization Aspects. J. Secur. Sustain. Issues 2020, 9, 797–806. [Google Scholar] [CrossRef] [PubMed]
  47. Raczkowski, K.; Żukrowska, K.; Żuber, M. Interdyscyplinarność Nauk o Bezpieczeństwie. Paradygmat, Wiedza, Demarkacja; Difin: Warszawa, Poland, 2013; ISBN 978-83-7641-880-3. [Google Scholar]
  48. Szwed, K. Konstytucyjny Obowiązek Prowadzenia Polityki Zapewniającej Bezpieczeństwo Ekologiczne Współczesnemu i Przyszłym Pokoleniom. Przegląd Prawa Konst. 2022, 67, 65–77. [Google Scholar] [CrossRef]
  49. Allenby, B.R. Environmental Security: Concept and Implementation. Int. Polit. Sci. Rev. 2000, 21, 5–21. [Google Scholar] [CrossRef]
  50. Toktogulov, A. Environmental safety and sustainable development. EurasianUnionScientists 2021, 1, 9–11. [Google Scholar] [CrossRef]
  51. Calaminus, G.; Barr, R. Economic Evaluation and Health-Related Quality of Life. Pediatr. Blood Cancer 2008, 50, 1112–1115. [Google Scholar] [CrossRef]
  52. McKevitt, C.; Wolfe, C. Quality of Life: What, How, Why?: The View of Healthcare Professionals. Qual. Ageing Older Adults 2002, 3, 13–19. [Google Scholar] [CrossRef]
  53. Waterman, A.S. The Relevance of Aristotle’s Conception of Eudaimonia for the Psychological Study of Happiness. Theor. Philos. Psychol. 1990, 10, 39–44. [Google Scholar] [CrossRef]
  54. Bradley, C. Feedback on the FDA’s February 2006 Draft Guidance on Patient Reported Outcome (PRO) Measures from a Developer of PRO Measures. Health Qual. Life Outcomes 2006, 4, 78. [Google Scholar] [CrossRef] [PubMed]
  55. Bergland, A.; Narum, I. Quality of Life Demands Comprehension and Further Exploration. J. Aging Health 2007, 19, 39–61. [Google Scholar] [CrossRef] [PubMed]
  56. Helseth, S.; Misvær, N. Adolescents’ Perceptions of Quality of Life: What It Is and What Matters. J. Clin. Nurs. 2010, 19, 1454–1461. [Google Scholar] [CrossRef]
  57. Streimikiene, D. Natural and Built Environments and Quality of Life in EU Member States. J. Int. Stud. 2014, 7, 9–19. [Google Scholar] [CrossRef]
  58. Çelik, F.; Jaiyeoba, E.B. The Contributions of the Green Areas in Residence Immediate Environment on Quality of Urban Life. Sage Open 2023, 13, 1–17. [Google Scholar] [CrossRef]
  59. Wang, K.; Tseng, S.; Lee, C.; Wang, K. Transfer Behaviors in Stroke and Dementia Development Associated with Environmental Risks. Geriatr. Gerontol. Int. 2024, 24, 766–772. [Google Scholar] [CrossRef]
  60. EC. A Sustainable Europe by 2030—European Commission. Available online: https://commission.europa.eu/publications/sustainable-europe-2030_en (accessed on 7 March 2025).
  61. EU. Treaty on European Union. Available online: https://ec.europa.eu/eurostat/statistics-explained/index.php?title=Glossary:Treaty_on_European_Union (accessed on 7 March 2025).
  62. OECD. OECD Guidelines on Measuring Subjective Well-Being. Available online: https://www.oecd.org/en/publications/oecd-guidelines-on-measuring-subjective-well-being_9789264191655-en.html (accessed on 7 March 2025).
  63. Chakraborty, S. TOPSIS and Modified TOPSIS: A Comparative Analysis. Decis. Anal. J. 2022, 2, 100021. [Google Scholar] [CrossRef]
  64. Vavrek, R. Evaluation of the Impact of Selected Weighting Methods on the Results of the TOPSIS Technique. Int. J. Inf. Technol. Decis. Mak. 2019, 18, 1821–1843. [Google Scholar] [CrossRef]
  65. Bánhidi, Z.; Dobos, I. Sensitivity of TOPSIS Ranks to Data Normalization and Objective Weights on the Example of Digital Development. Cent. Eur. J. Oper. Res. 2024, 32, 29–44. [Google Scholar] [CrossRef]
  66. Breusch, T.S.; Pagan, A.R. A Simple Test for Heteroscedasticity and Random Coefficient Variation. Econometrica 1979, 47, 1287. [Google Scholar] [CrossRef]
  67. Hausman, J.A. Specification Tests in Econometrics. Econometrica 1978, 46, 1251. [Google Scholar] [CrossRef]
  68. Cliff, A.D.; Ord, J.K. Spatial Processes: Models & Applications; Pion: London, UK, 1981; ISBN 978-0-85086-081-8. [Google Scholar]
  69. Anselin, L. Local Indicators of Spatial Association—LISA. Geogr. Anal. 1995, 27, 93–115. [Google Scholar] [CrossRef]
  70. Gallego-Alvarez, I.; Vicente-Galindo, M.P.; Galindo-Villardón, M.P.; Rodríguez-Rosa, M. Environmental Performance in Countries Worldwide: Determinant Factors and Multivariate Analysis. Sustainability 2014, 6, 7807–7832. [Google Scholar] [CrossRef]
  71. Štreimikienė, D.; Samusevych, Y.; Bilan, Y.; Vysochyna, A.; Sergi, B.S. Multiplexing Efficiency of Environmental Taxes in Ensuring Environmental, Energy, and Economic Security. Environ. Sci. Pollut. Res. 2022, 29, 7917–7935. [Google Scholar] [CrossRef]
  72. Reverte, C. The Importance of Institutional Differences among Countries in SDGs Achievement: A Cross-Country Empirical Study. Sustain. Dev. 2022, 30, 1882–1899. [Google Scholar] [CrossRef]
  73. Rothe, D. Seeing like a Satellite: Remote Sensing and the Ontological Politics of Environmental Security. Secur. Dialogue 2017, 48, 334–353. [Google Scholar] [CrossRef]
  74. Özcan, B.A. Defining Environmental Security as a National Security Issue. Int. J. Polit. Secur. 2023, 5, 73–94. [Google Scholar] [CrossRef]
  75. Räisänen, H.; Hakala, E.; Eronen, J.T.; Hukkinen, J.I.; Virtanen, M.J. Comprehensive Security: The Opportunities and Challenges of Incorporating Environmental Threats in Security Policy. Polit. Gov. 2021, 9, 91–101. [Google Scholar] [CrossRef]
  76. Kantemnidis, D.; Botetzagias, I. Understanding the Environmental Security Perceptions of the European Union’s Security Actors. Sustainability 2023, 15, 13027. [Google Scholar] [CrossRef]
  77. EPI. 2024 Environmental Performance Index. Available online: https://epi.yale.edu/measure/2024/EPI (accessed on 11 July 2025).
  78. Okpara, U.T.; Stringer, L.C.; Dougill, A.J.; Bila, M.D. Conflicts about Water in Lake Chad: Are Environmental, Vulnerability and Security Issues Linked? Prog. Dev. Stud. 2015, 15, 308–325. [Google Scholar] [CrossRef]
  79. Makeda, K. The Psychological Effects of Environmental Degradation on Human Well-Being. Int. J. Humanit. Soc. Sci. 2024, 2, 26–37. [Google Scholar] [CrossRef]
  80. Adger, W.N.; de Campos, R.S.; Siddiqui, T.; Gavonel, M.F.; Szaboova, L.; Rocky, M.H.; Bhuiyan, M.R.A.; Billah, T. Human Security of Urban Migrant Populations Affected by Length of Residence and Environmental Hazards. J. Peace Res. 2021, 58, 50–66. [Google Scholar] [CrossRef]
  81. Lim, J.Y.; Moon, K.-K. Perceived Environmental Threats and Pro-Environmental Behaviors: Investigating the Role of Political Participation Using a South Korean Survey. Int. J. Environ. Res. Public. Health 2020, 17, 3244. [Google Scholar] [CrossRef]
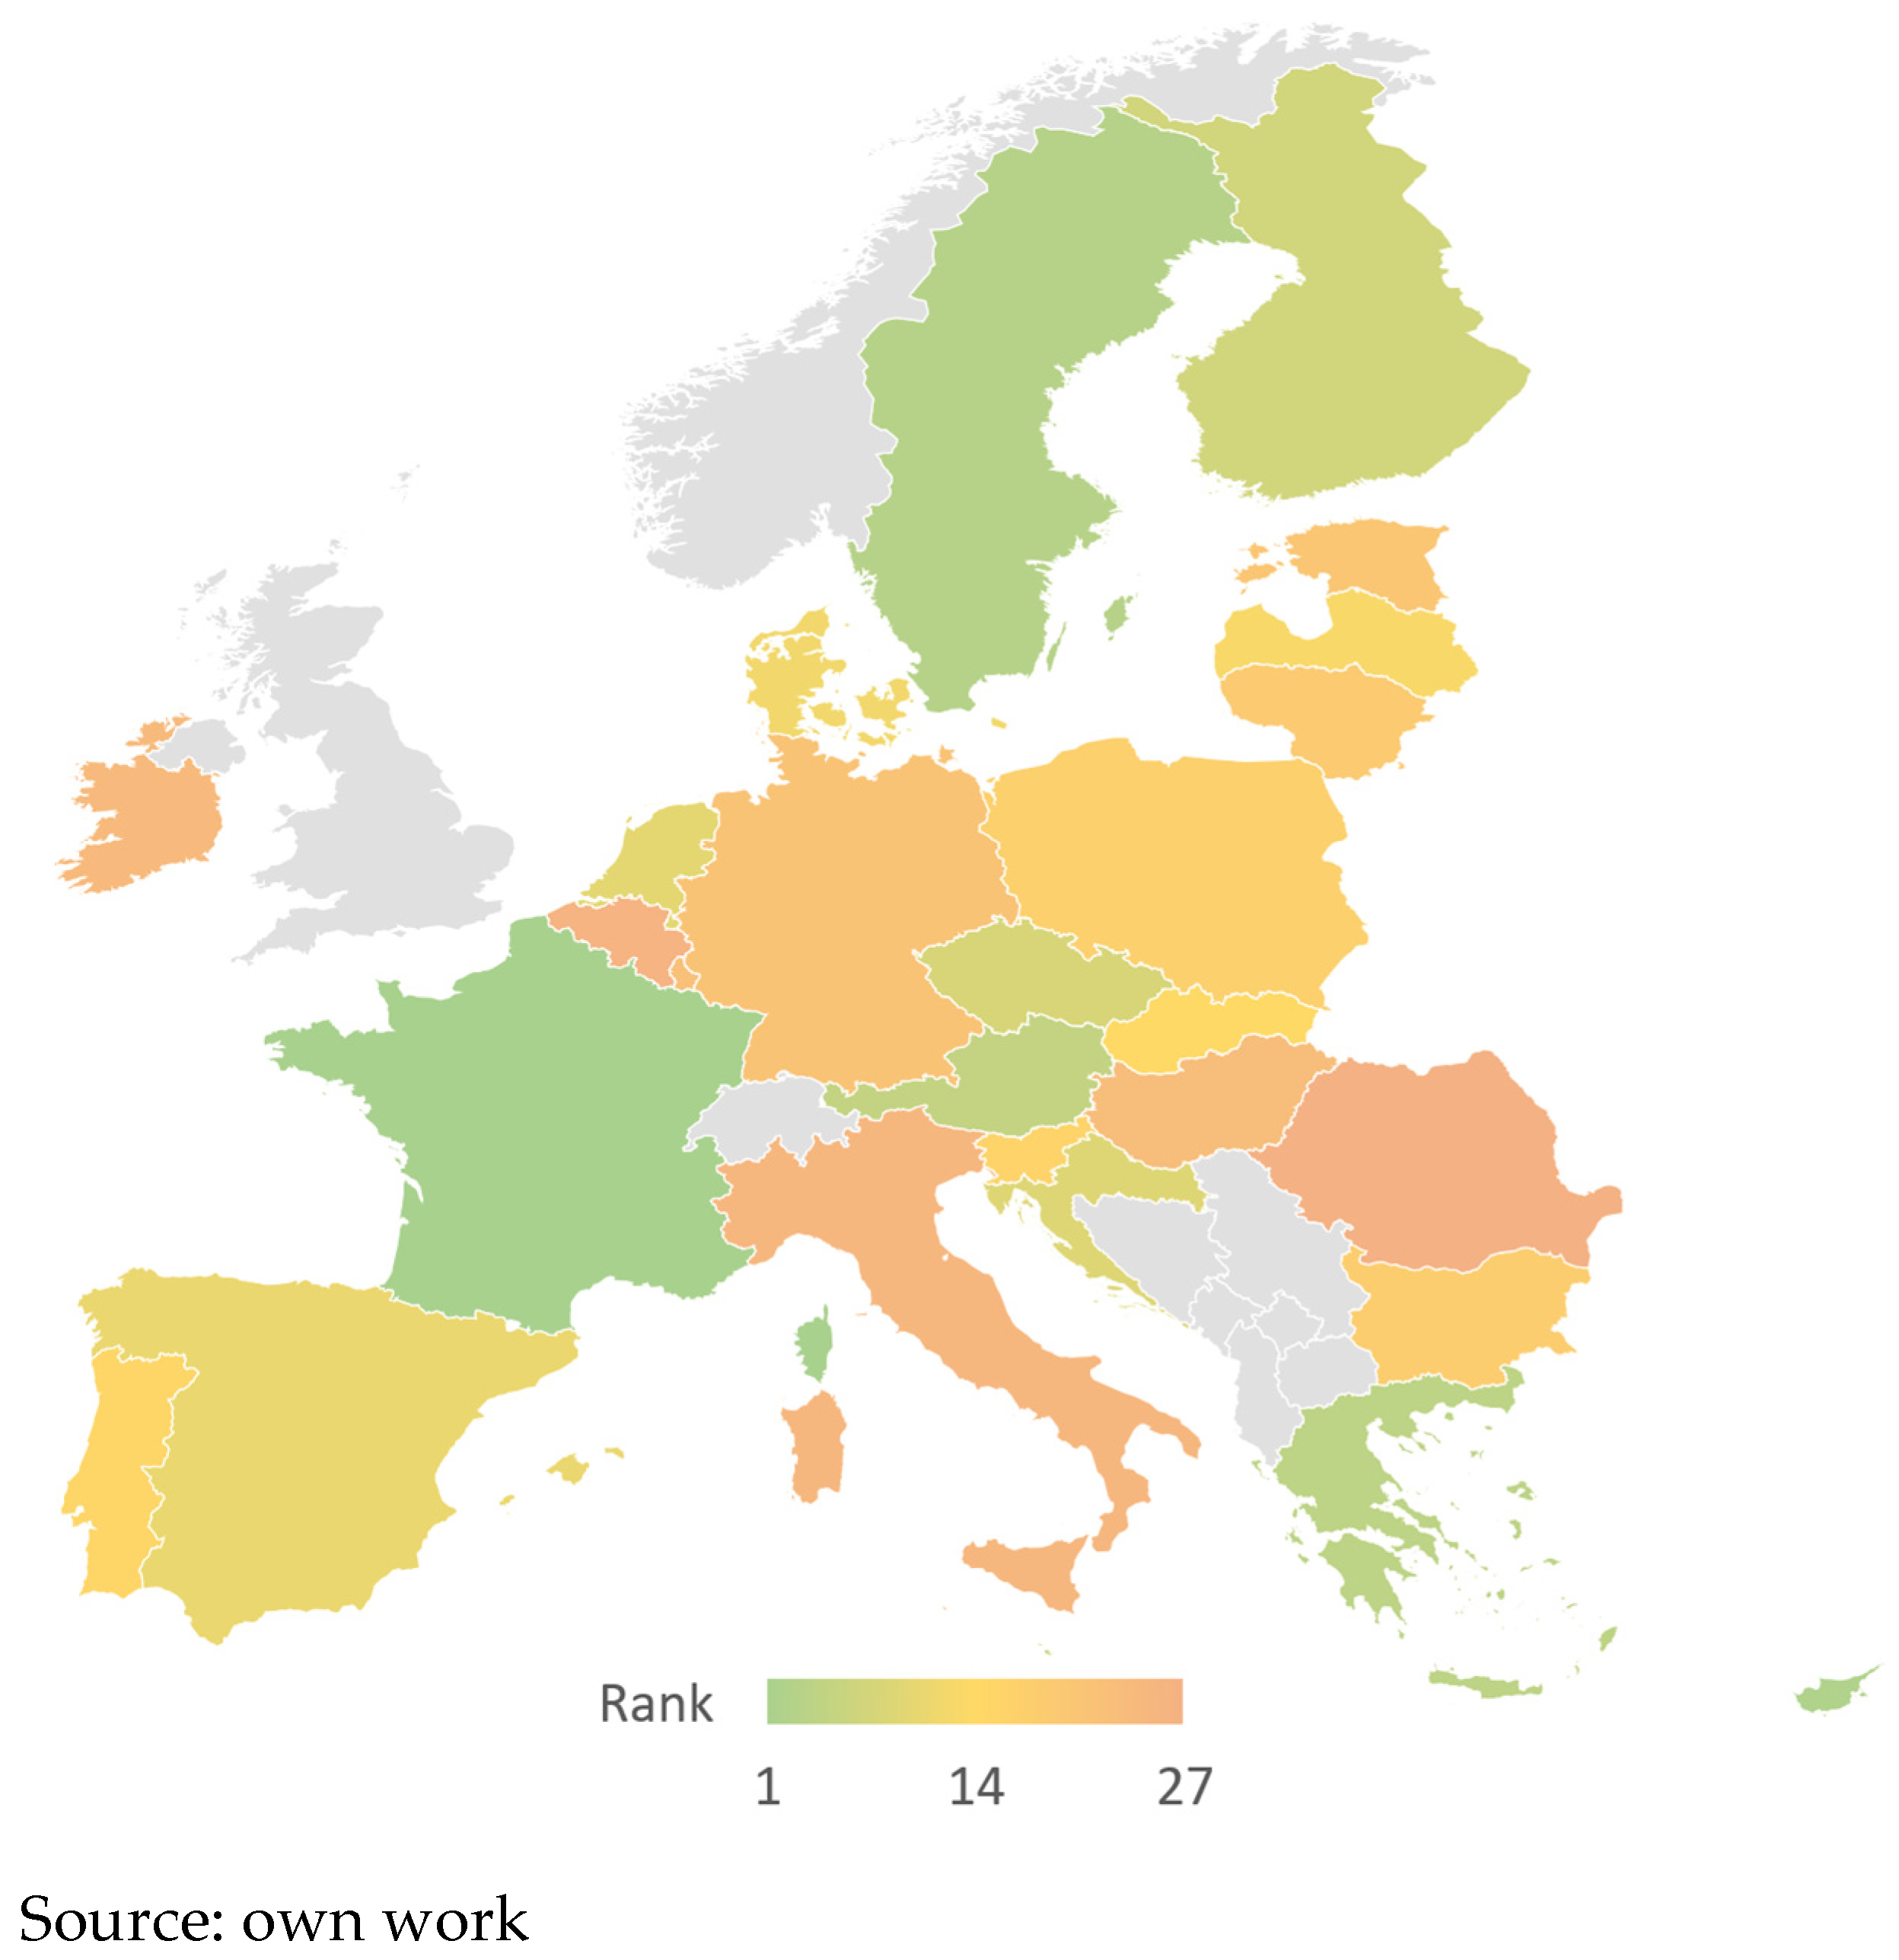
Figure 1. Environmental safety level in European Union countries according to the TOPSIS index for the years 2018–2023.
Sustainability 17 08412 g001
Figure 2. Local Indicator of Spatial Association (LISA) map.
Sustainability 17 08412 g002
Figure 3. Distribution of life satisfaction levels (high—Y1, medium—Y2, low—Y3) across 27 European Union countries. Source: own work.
Sustainability 17 08412 g003
Figure 4. Distribution of self-perceived health (Y4) in 27 European Union countries by five-level scale (Y4a–Y4e). Source: own work.
Sustainability 17 08412 g004
Figure 5. Average life satisfaction values (Y1–3) by ES_Score ranking position quartile in 2018–2023. Source: own work.
Sustainability 17 08412 g005
Figure 6. Average self-perceived health (Y4) by ES_Score ranking position quartile in 2018–2023. Source: own work.
Sustainability 17 08412 g006
Figure 7. Share of people reporting good or very good health (Y5) by ES_Score ranking position quartile (2018–2023). Source: own work.
Sustainability 17 08412 g007
Figure 8. Share of people with long-standing health problems (Y6) by ES_Score ranking position quartile (2018–2023). Source: own work.
Sustainability 17 08412 g008
Table 1. Definitions of variables used in the study.
Variable NameVariable DescriptionUnitDOI/Source
Variables Related to Environmental Safety
Indicators related to noise and the emission of harmful substances into the environment
X1Population living in households considering that they suffer from noise, by poverty status%https://doi.org/10.2908/SDG_11_20 (accessed on 10 June 2025)
X2Premature deaths due to exposure to fine particulate matter (PM2.5)number of premature deaths per 100,000 peoplehttps://doi.org/10.2908/SDG_11_52 (accessed on 10 June 2025)
X3Air emissions intensities by NACE Rev. 2 activitygrams per euro, current priceshttps://doi.org/10.2908/ENV_AC_AEINT_R2 (accessed on 10 June 2025)
X4Pollution, grime or other environmental problems%https://doi.org/10.2908/ILC_MDDW02 (accessed on 10 June 2025)
Indicators related to waste management
X5Investments in climate change mitigation€ mlnhttps://doi.org/10.2908/ENV_AC_CCMINV (accessed on 10 June 2025)
X6Recycling rate of municipal waste%https://doi.org/10.2908/SDG_11_60 (accessed on 10 June 2025)
X7Circular material use rate%https://doi.org/10.2908/ENV_AC_CUR (accessed on 10 June 2025)
Indicators related to access to water and afforestation
X8Population connected to public water supply%https://doi.org/10.2908/ENV_WAT_POP (accessed on 10 June 2025)
X9Population connected to wastewater treatment plants%https://doi.org/10.2908/ENV_WW_CON (accessed on 10 June 2025)
X10Forest and other wooded land%https://doi.org/10.2908/SDG_15_10 (accessed on 10 June 2025)
X11Fresh water abstraction by source per capita—m3 per capitam3 per capitahttps://doi.org/10.2908/TEN00003 (accessed on 10 June 2025)
Variables related to subjective assessment of quality of life—life satisfaction
Y1Overall life satisfaction—High%https://doi.org/10.2908/ILC_PW05 (accessed on 10 June 2025)
Y2Overall life satisfaction—Medium%https://doi.org/10.2908/ILC_PW05 (accessed on 10 June 2025)
Y3Overall life satisfaction—Low%https://doi.org/10.2908/ILC_PW05 (accessed on 10 June 2025)
Variables related to subjective assessment of quality of life—health
Y4Self-perceived health %https://doi.org/10.2908/HLTH_SILC_18 (accessed on 10 June 2025)
Y5Share of people with good or very good perceived health%https://doi.org/10.2908/SDG_03_20 (accessed on 10 June 2025)
Y6People having a long-standing illness or health problem%https://doi.org/10.2908/HLTH_SILC_19 (accessed on 10 June 2025)
Economic variables
variable namevariable descriptionunitsource
InflationAnnual CPI ratio%https://data.worldbank.org/indicator/FP.CPI.TOTL.ZG (accessed on 10 June 2025)
GDPgrowthAnnual GDP per capita growth%https://data.worldbank.org/indicator/NY.GDP.PCAP.KD.ZG (accessed on 10 June 2025)
AgeDependecyRatio of non-working to working-age people% https://data.worldbank.org/indicator/SP.POP.DPND (accessed on 10 June 2025)
Source: own work.
Table 2. Final weights assigned to individual environmental safety indicators.
Variable201820192020202120222023Avg
(2018–2023)
X10.0570.0590.0680.0670.0670.0700.065
X20.1080.1120.1270.1210.1110.1100.115
X30.0990.0920.0900.0910.0890.0750.089
X40.0680.0720.0700.0700.0700.0810.072
X50.2470.2670.2540.2620.2730.2750.263
X60.0640.0600.0610.0610.0610.0580.061
X70.1160.1120.1120.1090.1050.1100.111
X80.0360.0360.0350.0350.0350.0340.035
X90.0190.0180.0170.0170.0160.0160.017
X100.0650.0650.0640.0640.0640.0630.064
X110.1200.1070.1020.1040.1090.1080.108
Note: the table presents the final weights assigned to environmental variables (X) in the construction of the synthetic index (ES_Score). The definitions of the variables are in Table 1. Source: own work.
Table 3. Descriptive statistics for all variables.
VariableMeanStd. Dev.SkewnessKurtosis5th PercentileMedian95th Percentile
X115.966.360.31−0.078.0214.7528.20
X255.4639.370.810.385.0044.00124.70
X3313.86185.101.542.77113.40268.27737.20
X412.715.591.603.595.9011.8024.12
X53138.605086.002.726.8958.261289.0017,706.00
X640.2814.92−0.26−0.5912.3040.9562.60
X79.716.570.980.351.828.5021.49
X889.2419.01−3.8415.2971.1393.00100.00
X992.049.64−1.834.0578.9095.96100.00
X11348.28230.801.211.3579.60348.28890.60
Y1–334.182.74−0.690.9129.9534.2838.35
Y425.311.43−0.11−0.0222.5825.3127.86
Y567.349.00−0.740.1147.9368.0079.20
Y634.088.08−0.22−0.2719.5335.5047.29
Inflation4.193.411.302.160.763.1311.58
GPDgrowth2.064.41−0.280.70−6.541.978.58
AgeDependency54.414.80−0.770.3143.8955.3261.63
Note: the table presents basic descriptive statistics of environmental variables (X), quality of life and health variables (Y), and control variables used in the study. The definitions of the variables are in Table 1. Source: own work.
Table 4. A comparison of environmental safety in the EU(27) countries.
Panel A: Environmental Safety—ES_ScorePanel B: Environmental Safety—Ranks
Country/Year201820192020202120222023Avg (2018–2023)Country/Year201820192020202120222023Avg (2018–2023)
ES_Score Ranks
Austria0.480.450.460.420.410.410.44Austria4577675
Belgium0.280.280.310.290.280.300.29Belgium26262625262226
Bulgaria0.310.320.360.320.310.320.32Bulgaria22181717181618
Croatia0.460.400.440.400.390.400.44Croatia5101011989
Cyprus0.630.660.700.660.690.690.67Cyprus2222222
Czechia0.440.400.440.420.410.410.42Czechia9998568
Denmark0.380.370.400.370.360.350.37Denmark12121212121212
Estonia0.330.320.350.320.310.300.34Estonia16201920212320
Finland0.460.440.460.430.390.380.43Finland766611107
France0.730.770.720.730.740.740.74France1111111
Germany0.320.320.330.310.310.320.32Germany19192423201821
Greece0.480.450.470.450.400.420.45Greece3444744
Hungary0.320.310.340.320.300.280.31Hungary18222219232623
Ireland0.280.300.340.290.300.290.30Ireland25242324242424
Italy0.300.300.320.280.290.300.30Italy23252526252025
Latvia0.370.360.390.360.350.350.36Latvia13131313131313
Lithuania0.320.320.350.310.310.300.32Lithuania17172021192119
Luxembourg0.320.310.340.320.300.280.31Luxembourg20232118222522
Malta0.440.430.460.430.420.410.43Malta8755456
Netherlands0.420.410.450.410.400.390.42Netherlands108898910
Poland0.300.310.370.320.330.320.33Poland24211616141717
Portugal0.350.350.370.340.320.300.34Portugal15151515171915
Romania0.260.270.290.270.280.270.27Romania27272727272727
Slovakia0.370.360.380.350.330.320.35Slovakia14141414151514
Slovenia0.310.330.360.310.320.330.33Slovenia21161822161416
Spain0.410.400.430.400.390.370.40Spain11111110101111
Sweden0.460.460.510.480.460.460.47Sweden6333333
Source: own work.
Table 5. Moran’s I statistics of spatial correlations among countries’ environmental safety.
Country/Year201820192020202120222023Avg
(2018–2023)
Global−0.0829−0.0733−0.0732−0.0691−0.0673−0.0650−0.0718
Austria−0.1281−0.1132−0.0985−0.0716−0.0742−0.0829−0.0947
Belgium−0.2056−0.1996−0.1824−0.1758−0.1717−0.1074−0.1738
Bulgaria0.05980.05870.06070.05960.05620.04020.0559
Croatia−0.1308−0.0231−0.0533−0.0372−0.0280−0.0452−0.0529
Cyprus−0.2270−0.3061−0.3835−0.3281−0.4272−0.3726−0.3408
Czechia−0.0440−0.0148−0.0378−0.0510−0.0452−0.0452−0.0397
Denmark0.00640.01040.00960.00750.00880.01090.0089
Estonia−0.1031−0.0776−0.0853−0.0767−0.0157−0.0059−0.0607
Finland−0.1559−0.1244−0.1118−0.1046−0.0337−0.0206−0.0918
France−0.9382−1.0753−0.9118−0.9415−0.9826−0.9474−0.9661
Germany0.00480.02690.02310.01800.01910.01710.0182
Greece−0.0595−0.0312−0.0249−0.0356−0.0054−0.0072−0.0273
Hungary0.00080.03810.04900.05090.05900.05580.0423
Ireland−0.0875−0.0656−0.0434−0.0740−0.0530−0.0578−0.0636
Italy−0.02000.00260.00400.00650.00890.00100.0005
Latvia0.01990.02660.02290.02270.02750.02600.0243
Lithuania0.05710.06070.05150.05770.05470.05890.0568
Luxembourg−0.0665−0.0828−0.0576−0.0649−0.0845−0.1292−0.0809
Malta−0.0187−0.0201−0.0287−0.0285−0.0256−0.0131−0.0224
Netherlands−0.0332−0.0224−0.0520−0.0245−0.0211−0.0106−0.0273
Poland0.05640.06720.04820.06050.04540.04970.0546
Portugal−0.0172−0.0144−0.0158−0.0172−0.0244−0.0236−0.0187
Romania0.05480.05980.04880.05870.05920.03930.0534
Slovakia−0.0294−0.0121−0.00740.00080.0030−0.0022−0.0079
Slovenia−0.07830.01220.01000.01820.02000.0071−0.0018
Spain−0.0029−0.0002−0.0054−0.0034−0.00330.0002−0.0025
Sweden−0.0692−0.0862−0.1323−0.1236−0.1164−0.1264−0.1090
Source: own work.
Table 6. Classification of European Union countries into quartiles according to the level of environmental safety based on the ES_Score.
QuartileLevel of Environmental SafetyCountries
1st (ranks 1–7) HighFrance, Cyprus, Sweden, Greece, Austria, Malta, Finland
2nd (ranks 8–14)MediumCzechia, Croatia, Netherlands, Spain, Denmark, Latvia, Slovakia
3rd (ranks 15–21)LowPortugal, Slovenia, Poland, Bulgaria, Lithuania, Estonia, Germany
4th (ranks 22–27)Very lowLuxembourg, Hungary, Ireland, Italy, Belgium, Romania
Source: own work.
Table 7. Pairwise correlations among the variables.
VariableY4Y5Y6ES_ScoreX1X2X3X4X5X6X7X8X9X11InflationGPDgrowthAgeDependency
Y1–3 0.360.400.120.030.19−0.57−0.54−0.170.050.270.200.080.25−0.28−0.15−0.140.00
Y4 0.96−0.480.300.19−0.06−0.300.00−0.03−0.190.070.370.210.15−0.250.030.09
Y5 −0.530.210.21−0.09−0.340.010.02−0.080.210.410.280.16−0.24−0.010.09
Y6 0.28−0.270.160.16−0.06−0.130.19−0.07−0.09−0.350.050.220.05−0.19
ES_Score 0.26−0.45−0.450.040.910.480.480.260.470.04−0.28−0.240.34
X1 −0.39−0.470.620.250.030.300.230.22−0.10−0.23−0.150.14
X2 0.730.03−0.21−0.34−0.280.00−0.420.200.230.25−0.03
X3 −0.04−0.32−0.39−0.34−0.11−0.380.350.130.18−0.04
X4 0.12−0.170.23−0.020.04−0.02−0.100.010.23
X5 0.370.340.210.29−0.05−0.13−0.110.49
X6 0.410.050.45−0.20−0.08−0.16−0.15
X7 0.290.400.04−0.08−0.15−0.07
X8 0.370.18−0.09−0.06−0.06
X9 −0.05−0.33−0.12−0.11
X11 0.090.020.07
Inflation 0.090.07
GPDgrowth −0.03
Note: The table presents the pairwise correlations between environmental variables (X), quality of life and health variables (Y), and control variables used in the study. The definitions of the variables are in Table 1. Statistically significant values at the 0.1, 0.05 and 0.01 confidence levels are in italics, bold, and bold italics, respectively. Source: own work.
Table 8. Fixed effects model—environmental safety factors.
Model(1)(2)(3)(4)(5)(6)(7)(8)
Dep. VariableY1–3Y1–3Y4Y4Y5Y5Y6Y6
const65.826 *
(1.75)
54.478
(1.49)
22.334 ***
(3.64)
21.184 ***
(3.76)
51.919
(1.54)
37.451
(1.18)
19.392
(0.71)
57.690 *
(1.85)
X1−0.047
(1.18)
−0.044
(1.11)
−0.014
(1.08)
−0.003
(0.20)
−0.056
(0.57)
0.029
(0.26)
0.068
(0.51)
0.065
(0.48)
X20.008
(0.98)
0.011
(1.03)
0.001
(0.64)
0.002
(0.76)
0.009
(0.58)
0.019
(0.99)
−0.005
(0.27)
−0.004
(0.16)
X3−0.008 ***
(3.54)
−0.008 ***
(3.55)
−0.001
(0.77)
−0.001
(0.96)
−0.002
(0.48)
−0.006
(0.87)
−0.001
(0.25)
0.002
(0.50)
X40.125 **
(2.13)
0.116 *
(1.83)
0.007
(0.45)
0.004
(0.17)
0.001
(0.01)
−0.046
(0.33)
0.173
(1.55)
0.230 *
(1.80)
X5−0.0002 ***
(3.59)
−0.0002 **
(2.35)
−0.000
(1.63)
−0.000
(0.87)
−0.0003 *
(1.77)
−0.000
(0.89)
−0.000
(0.25)
−0.000
(0.82)
X6−0.011
(0.505)
−0.002
(0.08)
0.014
(1.48)
0.016 *
(1.75)
0.111 *
(2.04)
0.126 **
(2.47)
−0.004
(0.07)
−0.034
(0.70)
X7−0.093 *
(1.95)
−0.059
(1.13)
−0.033
(1.00)
−0.029
(1.01)
−0.259
(1.18)
−0.2033
(1.04)
0.187
(1.19)
0.050
(0.35)
X80.077
(0.19)
0.134
(0.34)
−0.025
(0.29)
0.012
(0.15)
−0.305
(0.60)
0.011
(0.02)
−0.045
(0.09)
−0.141
(0.27)
X9−0.323
(1.67)
−0.301
(1.60)
0.056
(0.784)
0.030
(0.448)
0.557
(1.32)
0.354
(0.85)
−0.008
(0.02)
−0.034
(0.07)
X110.005 **
(2.07)
0.004 *
(2.04)
−0.001
(1.61)
−0.001
(1.19)
−0.009 **
(2.11)
−0.007
(1.65)
0.007 *
(1.750)
0.008 *
(1.93)
Inflation0.032
(1.07)
0.119 ***
(3.62)
−0.007
(0.45)
0.025
(1.22)
0.033
(0.39)
0.320 ***
(3.97)
−0.052
(0.73)
−0.219 **
(2.58)
GDPgrowth−0.021
(1.20)
0.019
(0.46)
0.001
(0.11)
0.010
(0.84)
−0.020
(0.64)
0.019
(0.334)
−0.003
(0.16)
−0.050
(1.13)
AgeDependency−0.135
(0.85)
−0.076
(0.36)
0.012
(0.28)
0.009
(0.14)
0.099
(0.39)
−0.069
(0.20)
0.240
(0.93)
−0.256
(0.83)
Country effectsYesYesYesYesYesYesYesYes
Year effectsNoYesNoYesNoYesNoYes
No. of obs.162162162162162162162162
Within R20.2480.3000.1160.2040.1520.2880.1120.220
Note: The table presents the coefficients for the fixed effects model outlined in Section 3. Standard errors clustered by country and by year are presented in parentheses, and asterisks denote the statistical significance at the 0.1 (*), 0.05 (**) and 0.01 (***) levels. Source: own work.
Table 9. Between effects model—environmental safety factors.
Model(1)(3)(5)(8)
Dep. VariableY1–3Y4Y5Y6
const29.817 **
(2.22)
20.027 ***
(3.21)
17.553
(0.45)
12.601
(0.29)
X10.072
(0.44)
0.026
(0.34)
0.153
(0.32)
0.072
(0.14)
X2−0.030
(1.21)
0.014
(1.23)
0.110
(1.53)
−0.152 *
(1.92)
X3−0.002
(0.26)
−0.006 *
(2.03)
−0.041 **
(2.26)
0.021
(1.03)
X4−0.179
(1.14)
−0.064
(0.88)
−0.427
(0.94)
−0.263
(0.53)
X5−0.000
(1.06)
−0.000
(0.139)
−0.001
(1.69)
0.000
(0.71)
X60.028
(0.51)
−0.014
(0.54)
−0.062
(0.39)
−0.090
(0.52)
X70.091
(0.87)
0.038
(0.78)
0.400
(1.32)
−0.292
(0.88)
X80.017
(0.50)
0.019
(1.22)
0.118
(1.20)
−0.058
(0.54)
X9−0.029
(0.32)
0.003
(0.06)
0.091
(0.34)
0.313
(1.07)
X11−0.002
(0.90)
0.002
(1.43)
0.010
(1.43)
−0.004
(0.56)
Inflation−0.177
(0.36)
−0.290
(1.28)
−1.347
(0.95)
1.740
(1.12)
GDPgrowth0.317
(0.52)
0.388
(1.37)
1.970
(1.11)
−1.21
(0.62)
AgeDependency0.150
(1.02)
0.094
(1.37)
0.726
(1.69)
0.076
(0.16)
No. of obs.162162162162
Adj. R20.5540.6720.6750.513
Note: The table presents the coefficients for the between-effects model outlined in Section 3. Standard errors clustered by country and by year are presented in parentheses, and asterisks denote the statistical significance at the 0.1 (*), 0.05 (**) and 0.01 (***) levels. Source: own work.
Disclaimer/Publisher’s Note: The statements, opinions and data contained in all publications are solely those of the individual author(s) and contributor(s) and not of MDPI and/or the editor(s). MDPI and/or the editor(s) disclaim responsibility for any injury to people or property resulting from any ideas, methods, instructions or products referred to in the content.