Article

Study on the Spatial–Temporal Characteristics and Influencing Factors of the Synergistic Effect of Pollution and Carbon Reduction: A Case Study of the Chengdu–Chongqing Region, China

1
College of Architecture and Environment, Sichuan University, Chengdu 610065, China
2
College of Carbon Neutrality Future Technology, Sichuan University, Chengdu 610065, China
*
Authors to whom correspondence should be addressed.
Sustainability 2025, 17(18), 8365; https://doi.org/10.3390/su17188365
Submission received: 7 August 2025 / Revised: 10 September 2025 / Accepted: 16 September 2025 / Published: 18 September 2025

Abstract

In the context of China’s “double carbon” goals, examining the spatial–temporal characteristics and influencing factors of the synergistic effect of pollution control and carbon reduction (SEPCR) in the Chengdu–Chongqing region (CCR) is crucial for advancing both air pollution (AP) control and carbon emissions (CE) mitigation. This study uses data on AP and CE from 2007 to 2022 and employs the coupling coordination degree (CCD) model, spatial autocorrelation analysis, and kernel density estimation to investigate the spatial–temporal distribution and dynamic evolution of the CCD between AP and CE in the CCR. Additionally, the Tobit regression model is applied to identify the key factors influencing this synergy. The results indicate that (1) during the study period, the air pollutant equivalents (APE) in the CCR showed a declining trend, while CE continued to increase; (2) the overall level of coupling coordination remained low, exhibiting an evolutionary pattern of initial increase, subsequent decrease, and then recovery, with synergistic effects showing slight improvement but significant fluctuations; (3) the SEPCR in the CCR was generally dispersed, exhibiting no significant spatial autocorrelation. A “core–periphery” structure emerged, with Chongqing and Chengdu as the core and peripheral cities forming low-value zones. Low–low clusters indicative of a “synergy poverty trap” also appeared; (4) economic development (PGDP), openness level (OP), and environmental regulation intensity (ER) are significant positive drivers, while urbanization rate (UR), industrial structure upgrading (IS), and energy consumption intensity (EI) exert significant negative impacts.

1. Introduction

Global climate change and air pollution pose twin challenges to nations worldwide [1]. In addressing these pressing issues, China emerges as a critical case study, facing significant pressures on both fronts. As the nation advances its “dual carbon” goals (aiming to peak carbon emissions by 2030 and achieve carbon neutrality by 2060), its ecological civilization construction has entered a pivotal phase focused on synergistic reduction [2]. Thus, the advancement of this coordination is of strategic significance for facilitating a comprehensive green socioeconomic transition [3]. In January 2021, the Ministry of Ecology and Environment (MEE) issued the Guiding Opinions on Coordinating and Strengthening Climate Change Response and Ecological Environmental Protection. This pivotal policy explicitly advocates for the “co-control of greenhouse gases and pollutant emissions,” thereby establishing enhanced coordination efficiency as a fundamental principle for achieving pollution-carbon synergy [4]. Subsequently, in June 2022, seven ministries, including MEE, jointly released the Implementation Plan for Synergistic Pollution Reduction and Carbon Mitigation. The plan emphasizes that “synergistically advancing pollution reduction and carbon mitigation constitutes an essential pathway for China’s comprehensive green transition in the new development stage” [5]. The report to the 20th National Congress of the Communist Party of China stated: “We will simultaneously promote carbon reduction, pollution management, ecological enhancement, and economic development, emphasizing ecological priority conservation-intensive, and green, low-carbon growth.” This underscores the high strategic priority the Party Central Committee places on pollution control and carbon reduction [6].
Located at the intersection of the Belt and Road Initiative and the Yangtze River Economic Belt, the CCR stands as the most developed and dynamic economic hub in western China, regarded as the nation’s “fourth major economic growth pole.” However, compared to the highly developed growth poles, the CCR—as the most representative growth engine in western China—exhibits relatively weaker development foundations, a heavy industrial structure, and formidable challenges in traditional industrial transformation. These characteristics make it an ideal sample for observing synergistic pollution-carbon mitigation in less developed regions during catch-up development. Moreover, China’s SEPCR in cities is still in its early stages, with significant regional disparities persisting [7]. Therefore, based on the shared origins, sources, and processes of CE and AP [8,9], exploring the potential of SEPCR in the CCR and analyzing its influencing factors can facilitate the high-quality, green, and sustainable progress in the region and provide a reference pathway for other less-developed regions facing similar challenges.

2. Literature Review

Currently, research on the SEPCR has attracted extensive scholarly attention worldwide, focusing primarily on synergy measurement and influencing factors. In terms of assessing the SEPCR, the primary methods include comprehensive assessment models [10,11,12,13], synergistic effect modeling methods [14,15], econometric methods [16,17,18], data envelopment analysis (DEA) [19,20], and indicator system construction [21,22,23]. For example, Zhang et al. [24] constructed a multi-regional dynamic CGE model for China to explore the impact of regionally differentiated carbon pricing policies on air pollution, finding that such policies would significantly reduce PM2.5 emissions. Qin et al. [25] employed a coupled coordination model to evaluate the level of synergistic reduction of PM2.5 and CO2 and studied their spatial agglomeration in China’s provinces from 2000 to 2018. Tang et al. [26] employed pollution rights trading and carbon emissions trading policies as quasi-natural experiments, analyzing prefecture-level city data using a difference-in-differences (DDD) empirical model. The findings indicate that these policies significantly reduced emissions of carbon dioxide, sulfur dioxide, and particulate matter. Liu et al. [27] constructed a new quantitative assessment method for the SEPCR within the Data Envelopment Analysis (DEA) framework, from the viewpoint of marginal abatement costs, and conducted an empirical examination of China’s SEPCR. Xing et al. [21] conducted an empirical study on the regional disparities and evolutionary patterns of energy transition and SEPCR coordinated development in the Yangtze River Economic Belt from 2010 to 2022. By thoroughly examining the strategic framework for green energy transition and synergistic emission reduction, they constructed a comprehensive evaluation index system to assess these dual objectives.
The SEPCR is influenced by a complex array of factors [28,29]. Studies have employed various methods to analyze these influencing factors, including decomposition analysis [30], econometric analysis [31], fixed effects models [32], machine learning algorithms [33,34], and geographical detectors [35]. For example, Zhu et al. [36] employed an extended KAYA-LMDI decomposition model to analyze the impact effects of CO2, NOx, and SO2 emissions in Huaibei City from 2016 to 2021, identifying economic growth as the most significant influencing factor. Liu et al. [37] conducted a quantitative analysis of the SEPCR in Tianjin, examining total emissions, emission reductions, and synergy coefficients, based on the STIRPAT model. Wang et al. [38] examined the influencing factors of industrial SEPCR across 41 cities within the Yangtze River Delta, considering multiple aspects such as population growth based on the GTWR model. Chen et al. [16] employed a fixed effects model to examine the influencing factors in industrial SEPCR, using inter-provincial industrial panel data from China covering the years 2011 to 2019. The findings indicated that energy efficiency, industrial structure, and investment scale are key regulatory factors affecting synergistic effect. Xing et al. [39] used the XGBoost algorithm and SHAP value explanation algorithm to pinpoint the primary factors affecting SEPCR, revealing that energy intensity was the most significant factor with a negative effect. Chen et al. [40] developed a geographical detector model based on optimal parameters, identifying driving factors and providing synergistic pathways for pollution and carbon emission reduction across 108 cities in the Yangtze River Economic Belt.
In summary, existing research has made considerable progress in the theoretical framework, effect identification, and factor analysis of SEPCR. However, most of these studies have focused on macro-level analyses at the national or provincial scale, or on urban agglomerations in economically developed regions. There remains a significant gap in research systematically investigating the synergistic effects in less economically developed areas—particularly those in a catch-up phase with relatively weaker economic foundations. A case in point is the CCR, an emerging growth pole entrusted with a strategic national mission, where research on this topic is notably scarce. Based on this, this study takes the CCR as its research subject. It employs the CCD model to analyze the coupling status between the AP reduction system and the CE reduction system, examining their spatial–temporal evolutionary characteristics. Furthermore, the Tobit regression model is implemented to uncover the key elements impacting the SEPCR within this region. The findings aim to provide valuable insights for formulating synergistic pollution-carbon reduction policies, promoting regional coordinated development, and facilitating green transformation within the CCR.
The primary contributions of this research are threefold: (1) shifting away from the usual emphasis on developed urban clusters in current studies, this study examines the CCR—the only national strategic growth pole in China primarily composed of underdeveloped provinces. Its heavy-industry-oriented industrial structure and significant transition pressure provide a unique case study for observing synergistic pollution-carbon reduction mechanisms during economic catch-up processes. This research fills a critical gap in systematic studies on coordinated emission reduction within underdeveloped strategic growth poles. (2) A dual-system coupling coordination model was developed, integrating APE—incorporating four major pollutants (SO2, NOx, PM2.5, and PM10)—and CE data. This model quantitatively characterizes the spatial–temporal evolution of synergistic effects. Through three-dimensional kernel density estimation and spatial autocorrelation analysis, we revealed a distinctive “polarized yet spatially uncorrelated” pattern of pollution-carbon synergy in the CCR. (3) Employing the panel Tobit model, we identified the inhibitory effects of urbanization rate and industrial restructuring on synergistic effects. Our findings expose a fundamental contradiction in the CCR: energy consumption intensification during urbanization and the lag of industrial upgrading behind emission reduction demands. These insights provide a theoretical basis for formulating “co-governance” policies for pollution and carbon reduction in underdeveloped regions.
The subsequent parts of this paper are laid out as follows. Section 3 presents the methods and data. Section 4 outlines the spatial and temporal evolution features of the SEPCR in the CCR. Section 5 focuses on the factors that impact the SEPCR in this area. The final section presents conclusions, recommendations, and limitations.

3. Methods and Data

3.1. Research Background

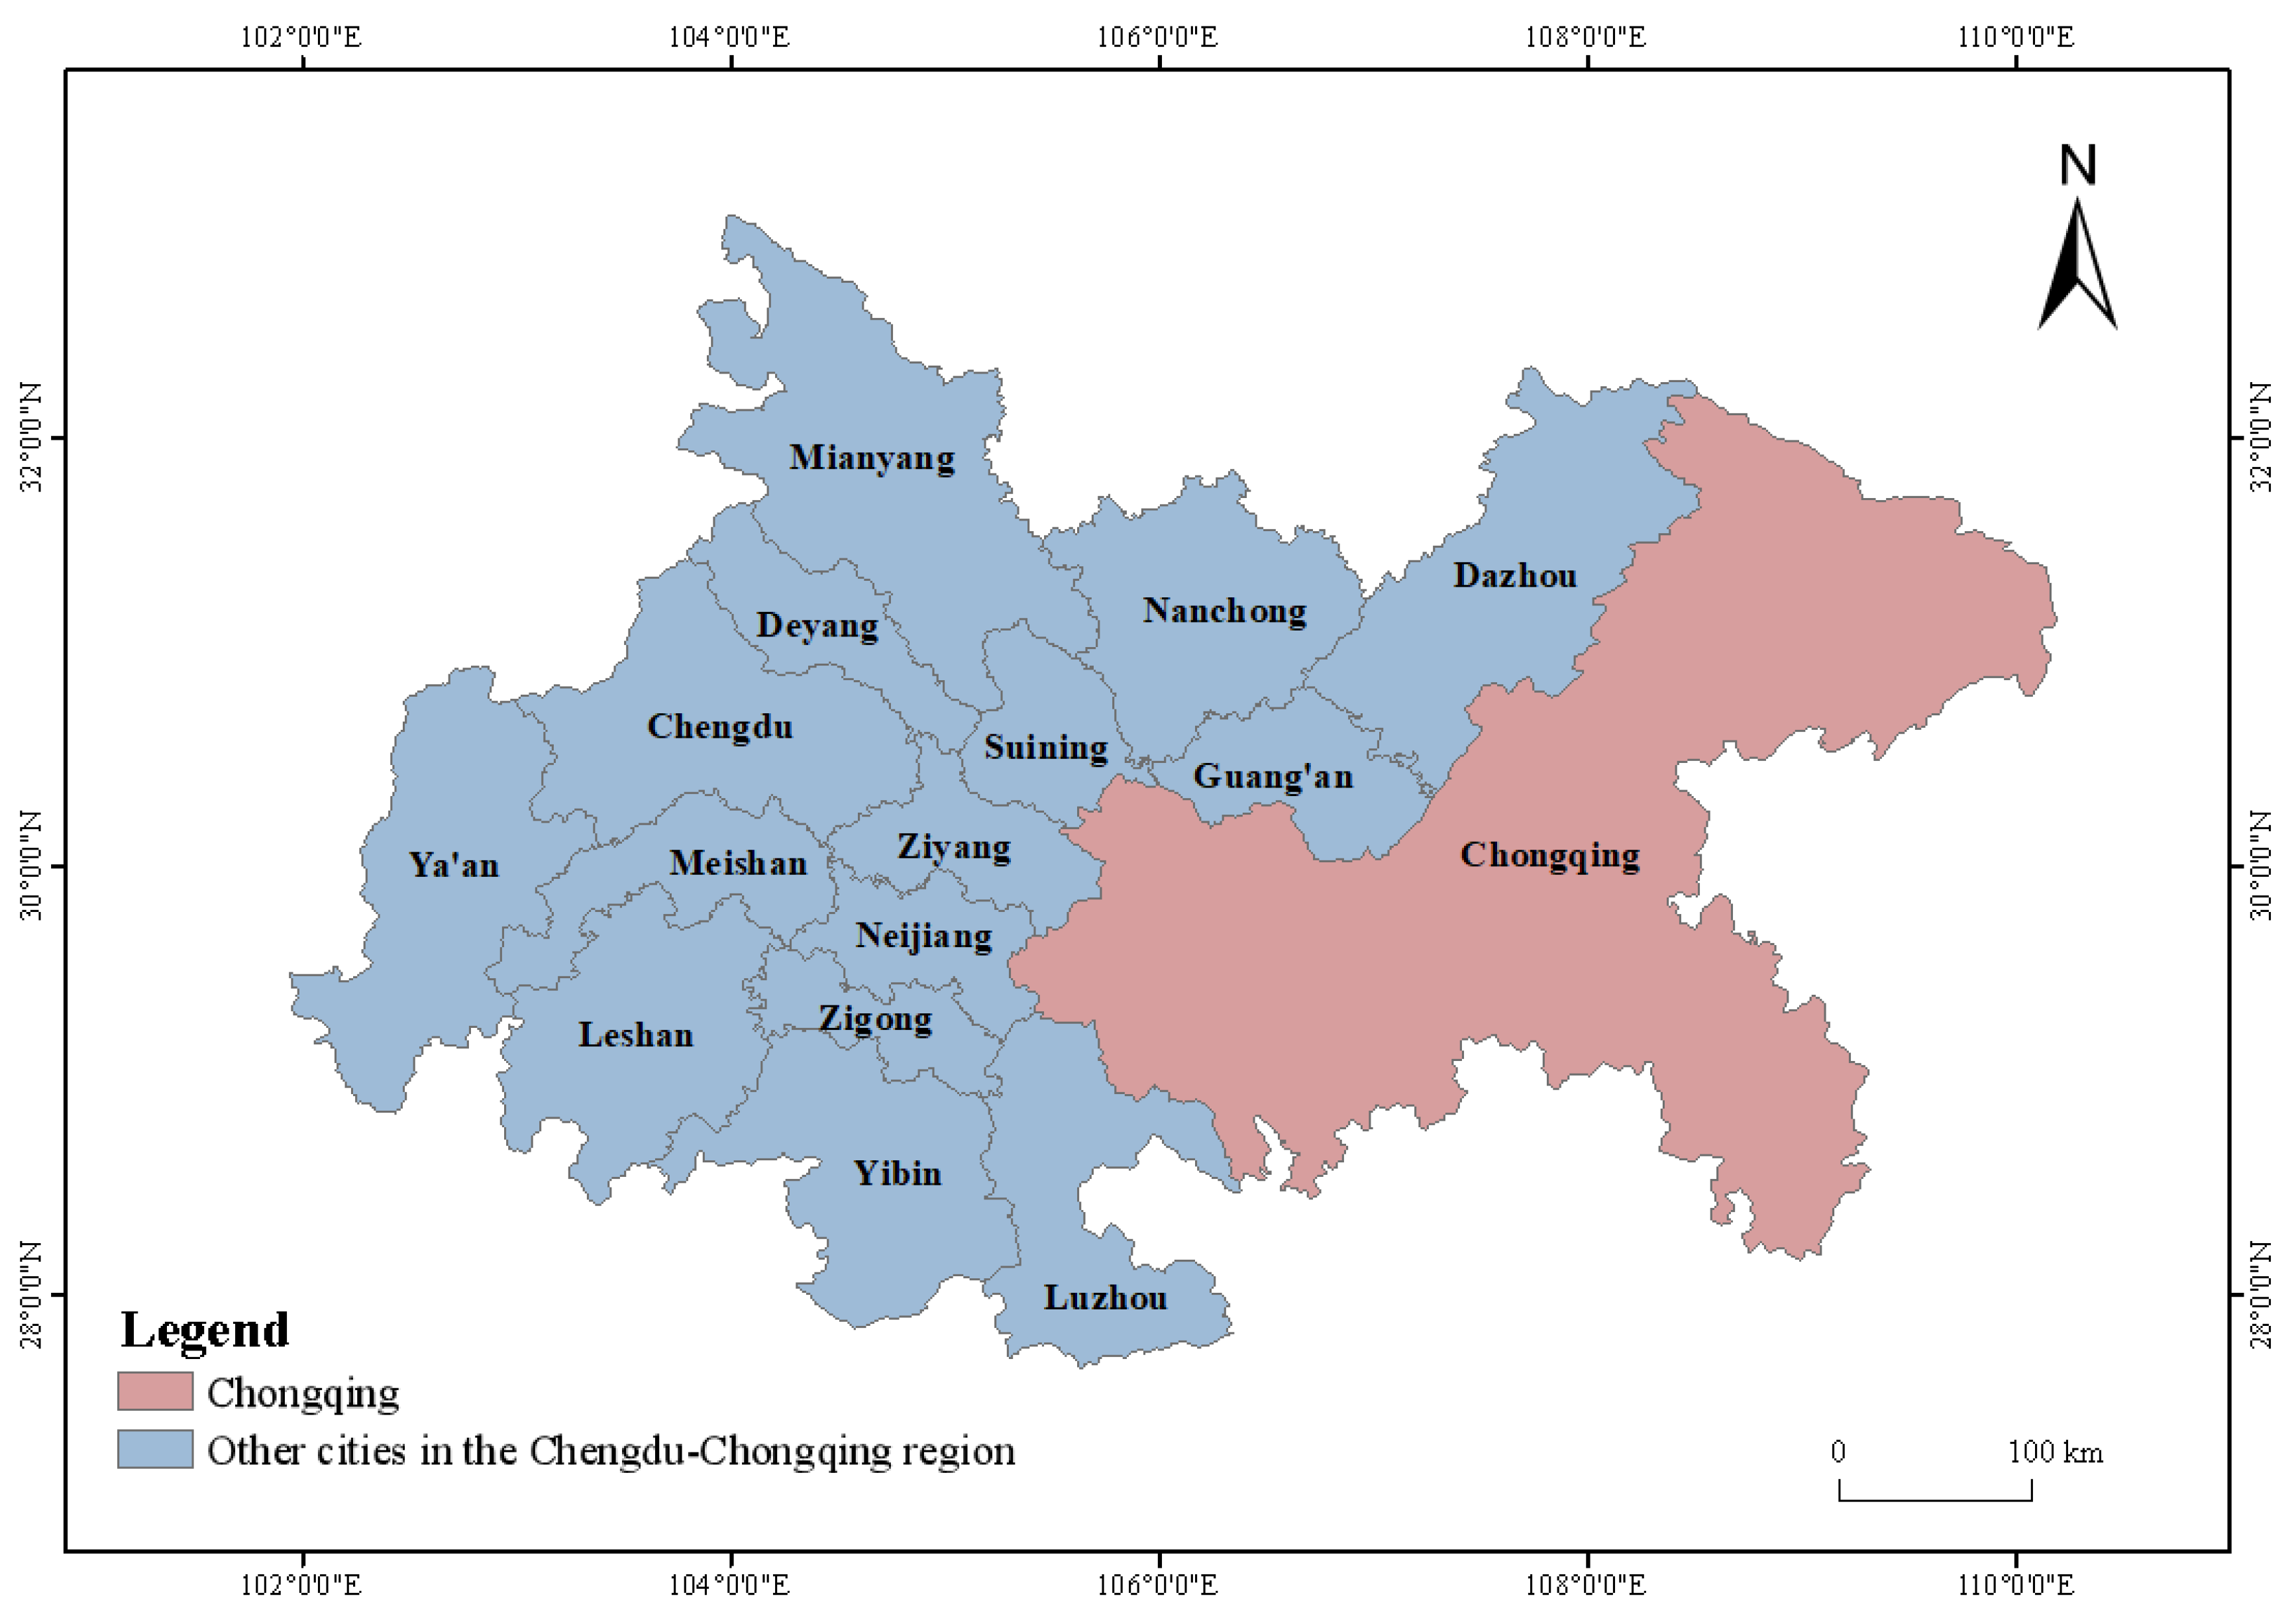
As a strategic pivot of the Yangtze River Economic Belt and a hub of the New Western Land–Sea Corridor, the CCR encompasses Chongqing and 15 cities in Sichuan Province, as shown in Figure 1. Its unique developmental stage and resource endowments establish it as a representative case study for examining the synergy in AP and CE reduction. Research on this region holds particular significance for three key reasons: First, designated as a crucial national area for AP reduction and CE mitigation, the CCR possesses favorable ecological endowments and abundant clean energy resources like natural gas and hydropower. This provides a solid foundation for achieving synergy between AP control and CE reduction. Second, while identified as the “fourth pole” of China’s economic growth, the CCR recorded a per capita GDP of approximately RMB 82,000 in 2023. This is significantly lower than the three major growth poles: the Yangtze River Delta (RMB 148,100), the Guangdong–Hong Kong–Macao Greater Bay Area (RMB 161,600), and the Beijing–Tianjin–Hebei region (RMB 95,600). It stands as China’s only strategic growth pole predominantly composed of less developed provinces. Third, the region’s energy consumption structure remains characterized by a heavy reliance on coal, and traditional heavy industries represent a substantial share of its economy. This renders the transformation and upgrading of conventional industries particularly challenging. Consequently, while other major growth poles are increasingly focusing on high-end industrial restructuring for emission reduction, the CCR faces the dual pressures of reducing its dependence on coal consumption and maintaining the stability of its traditional industrial clusters. Therefore, investigating the pathway towards SEPCR in the CCR holds significant reference value for other regions facing similar developmental contexts.

3.2. Research Methods

3.2.1. Calculation of Air Pollutant Equivalent

To assess the comprehensive APE across different cities within the CCR, this study employed the APE’s coefficients stipulated in the Environmental Protection Tax Law of the People’s Republic of China to normalize the emission indicators of various AP [15]. The method for calculation is as follows:
A P E = α Q S O 2 + β Q N O x + γ Q P M 2.5 + ω Q P M 10
where APE represents the air pollutant equivalent emissions; QSO2, QNOx, QPM2.5, and QPM10, represent the emission amounts of SO2, NOx, PM2.5, and PM10 for a specific city in the CCR, respectively; α , β , γ , and ω represent their corresponding equivalent coefficients, these coefficients are dimensionless and have values of 1/0.95, 1/0.95, 1/2.18, and 1/2.18, respectively.

3.2.2. Coupling Coordination Degree Mode

Given that AP and CE predominantly originate from fossil fuel combustion, they share homogeneous sources and processes [41]. This intrinsic linkage suggests a strong potential synergy between AP control and CE reduction. Hence, this study conceptualizes AP control and CE reduction as two subsystems within a single system, characterized by a close dynamic relationship and reciprocal feedback, where they are interdependent, interact, and influence one another [42]. The CCD model is effective in capturing the interactions between various subsystems and the overall state of the entire system. Drawing upon the modified CCD model [43], this study measures the SEPCR in the CCR. This approach reflects the SEPCR across different cities within the study area. The calculation steps are as follows:
First, to ensure comparability of data across different years and regions and to eliminate the influence of differences in the original data’s magnitude and dimension, the raw data were first subjected to standardization. Furthermore, to prevent zero values after standardization from rendering subsequent mathematical operations (such as logarithmic calculations) meaningless, a uniform linear offset of 0.00001 was applied to all standardized data [36]. The calculation formula is:
U i = X ij min j max i j min j + 0.00001
where Ui denotes the dimensionless processing result for the i-th indicator; Xij denotes the raw value of the j-th indicator for the i-th city; maxj denotes the maximum data value for the j-th indicator; minj denotes the minimum data value for the j-th indicator. i represents the CE subsystem or APE subsystem.
Second, establish a generalized formula for the coupling coordination degree between the two systems:
C = 2 U 1 U 2 U 1 + U 2 = [ 1 ( U 2 U 1 ) ] U 1 U 2
where U1 and U2 represent the minimum and maximum values of the two systems (CE and APE) in a city for a specific year after standardization. C represents the degree of coupling between the two systems, ranging from 0 to 1.
Finally, a dual-system coupling coordination degree evaluation model is constructed, with the formula as follows:
T = a U 1 + b U 2
D = C × T
where parameter T denotes the integrated coordination metric for the dual-system framework. Coefficients a and b represent the weights assigned to each subsystem. Given that CE reduction and AP control share common roots within the context of this study and are equally important for achieving synergistic governance objectives, they are assigned equal weights: a = b = 0.5. This constitutes a fundamental assumption based on the principle of “synergistic enhancement.” D signifies the CCD between the two systems, with its value domain constrained to [0, 1]. A higher D value indicates a higher level of coordinated development, while a lower value indicates a lower level of coordination. Drawing on the research by Wang [43] and Cui et al. [44], the coordination degree (D) is categorized into 10 distinct types based on its value. Additionally, the coordinated development phase is divided into five categories based on the level of coordination. Table 1 provides the detailed classification criteria.

3.2.3. Spatial Autocorrelation Model

The spatial distribution of SEPCR may not be random. Geographic proximity often leads to similar environmental policies, levels of economic development, and technology diffusion, making it likely that a city’s SEPCR is influenced by its neighboring cities and, in turn, influences them. This potential spatial dependency violates the independence assumption in traditional statistics. Therefore, we employ spatial autocorrelation analysis to quantitatively assess whether the spatial distribution pattern of SEPCR is clustered, dispersed, or random, and to identify local hot-spot and cold-spot regions. This step is crucial for verifying the existence of spatial effects and serves as a prerequisite for determining whether subsequent research requires more complex spatial econometric models.
The Global Moran’s I can measure the overall spatial pattern of SEPCR across the entire metropolitan area. Therefore, it was used to analyze the spatial distribution characteristics and aggregation levels of SEPCR within the CCR [45]. Its value ranges from -1 to 1. A value above 0 signifies a positive spatial autocorrelation in the synergistic effect, while a value below 0 signifies a negative spatial autocorrelation, and a value of 0 signifies no spatial autocorrelation. Local autocorrelation is used to pinpoint the specific locations of spatial clusters and anomalous zones, commonly represented by the Local Moran’s I index. Hence, to identify the local spatial associations of the synergistic effect between adjacent cities, Local Moran’s I was further utilized to identify the specific patterns of spatial heterogeneity. This analysis identified five distinct types of spatial patterns: high–high cluster (HH), high–low cluster (HL), low–high cluster (LH), low–low cluster (LL), and not significant (NS) [46]. The following are the formulas for calculation:
G l o b a l   M o r a n s   I = n i = 1 n j = 1 n W i j ( x i x ¯ ) ( x j x ¯ ) i = 1 n j = 1 n W i j i = 1 n ( x i x ¯ ) 2
Local   M o r a n s   I = n ( x i x ¯ ) j = 1 n W i j ( x j x ¯ ) i = 1 n ( x i x ¯ ) 2
where n indicates the total number of cities in the CCR; xi and xj signify the SEPCR values for city i and city j, respectively; x ¯ represents the average synergistic effect value for all cities; Wij represents the spatial weight matrix. This investigation utilizes the most commonly used geographical distance matrix:
W ij = 1 d i j ,   i j 0 ,   i = j
where dij signifies the straight-line geographical distance between city i and city j.

3.2.4. Kernel Density Estimation

The method of kernel density estimation (KDE) is used in statistics to estimate a random variable’s probability density function without using parameters. To estimate the overall probability density distribution, a kernel function is centered at each data point, and these functions are summed across all points [47]. KDE was applied to analyze the dynamic evolutionary traits of the CCD for pollution reduction and carbon mitigation in the CCR to achieve a more thorough understanding. The equation is provided as follows:
f ( x ) = 1 n h i = 1 n K x X i h
With n being the count of observations and h being the bandwidth; Xi are the independently distributed observations; K(.) is the kernel function. This study selected the commonly used Gaussian kernel function for estimation:
K ( x ) = 1 2 π exp x 2 2

3.2.5. Tobit Regression

The CCD calculated from APE and CE in this study is bounded within the interval [0, 1], constituting a limited dependent variable. Employing conventional Ordinary Least Squares (OLS) regression may yield biased estimates [48]. The Tobit regression model is a linear regression model primarily used to address statistical analysis problems involving censored data. This model converts such censored data into a probability model, thereby enabling statistical analysis of the censored data. Therefore, a panel Tobit model was utilized for regression analysis. The model is defined as follows:
D it = α 0 + β 1 ln P G D P i t + β 2 ln I S i t + β 3 ln U R i t + β 4 ln E I i t + β 5 ln O P i t + β 6 ln E R i t + ε i t
where Dit represents the CCD between AP reduction and CE mitigation for city i in year t, and ln denotes the natural logarithm of the variable; PGDP represents per capita GDP, IS indicates industrial structure upgrading, UR is the urbanization rate, EI stands for energy consumption intensity, OP measures openness level, and ER reflects environmental regulation intensity. The random disturbance term εit follows a normal distribution N (0, σ2), α 0 , β 1 , β 2 , β 3 , β 4 , β 5 and β 6 represent parameters to be estimated, i denotes the i-th city, and t represents the t-th year.

3.3. Data Sources

This study selects 16 cities in the CCR for the period 2007–2022. The CO2 and four typical AP (SO2, NOx, PM2.5, PM10) used to measure the SEPCR are sourced from the EDGAR (https://edgar.jrc.ec.europa.eu accessed on 15 September 2025) [49]. Raster data were extracted via ArcGIS to obtain city-level values for the CCR. Data for influencing factors primarily originated from: China City Statistical Yearbook, Sichuan Statistical Yearbook, Chongqing Statistical Yearbook, and statistical yearbooks of cities in the region. The total energy consumption was calculated by summing the indicators related to energy consumption converted into tons of standard coal. Missing data were reasonably imputed using interpolation and linear extrapolation techniques.
The SEPCR is influenced by multifaceted drivers. With reference to prior studies [50,51,52,53], consideration of regional characteristics, and data availability constraints, we selected 6 indicators as determinants of this synergy in the CCR, as shown in Table 2.

4. Analysis of Spatial-Temporal Evolution Characteristics

4.1. Spatial-Temporal Characteristics of APE and CE

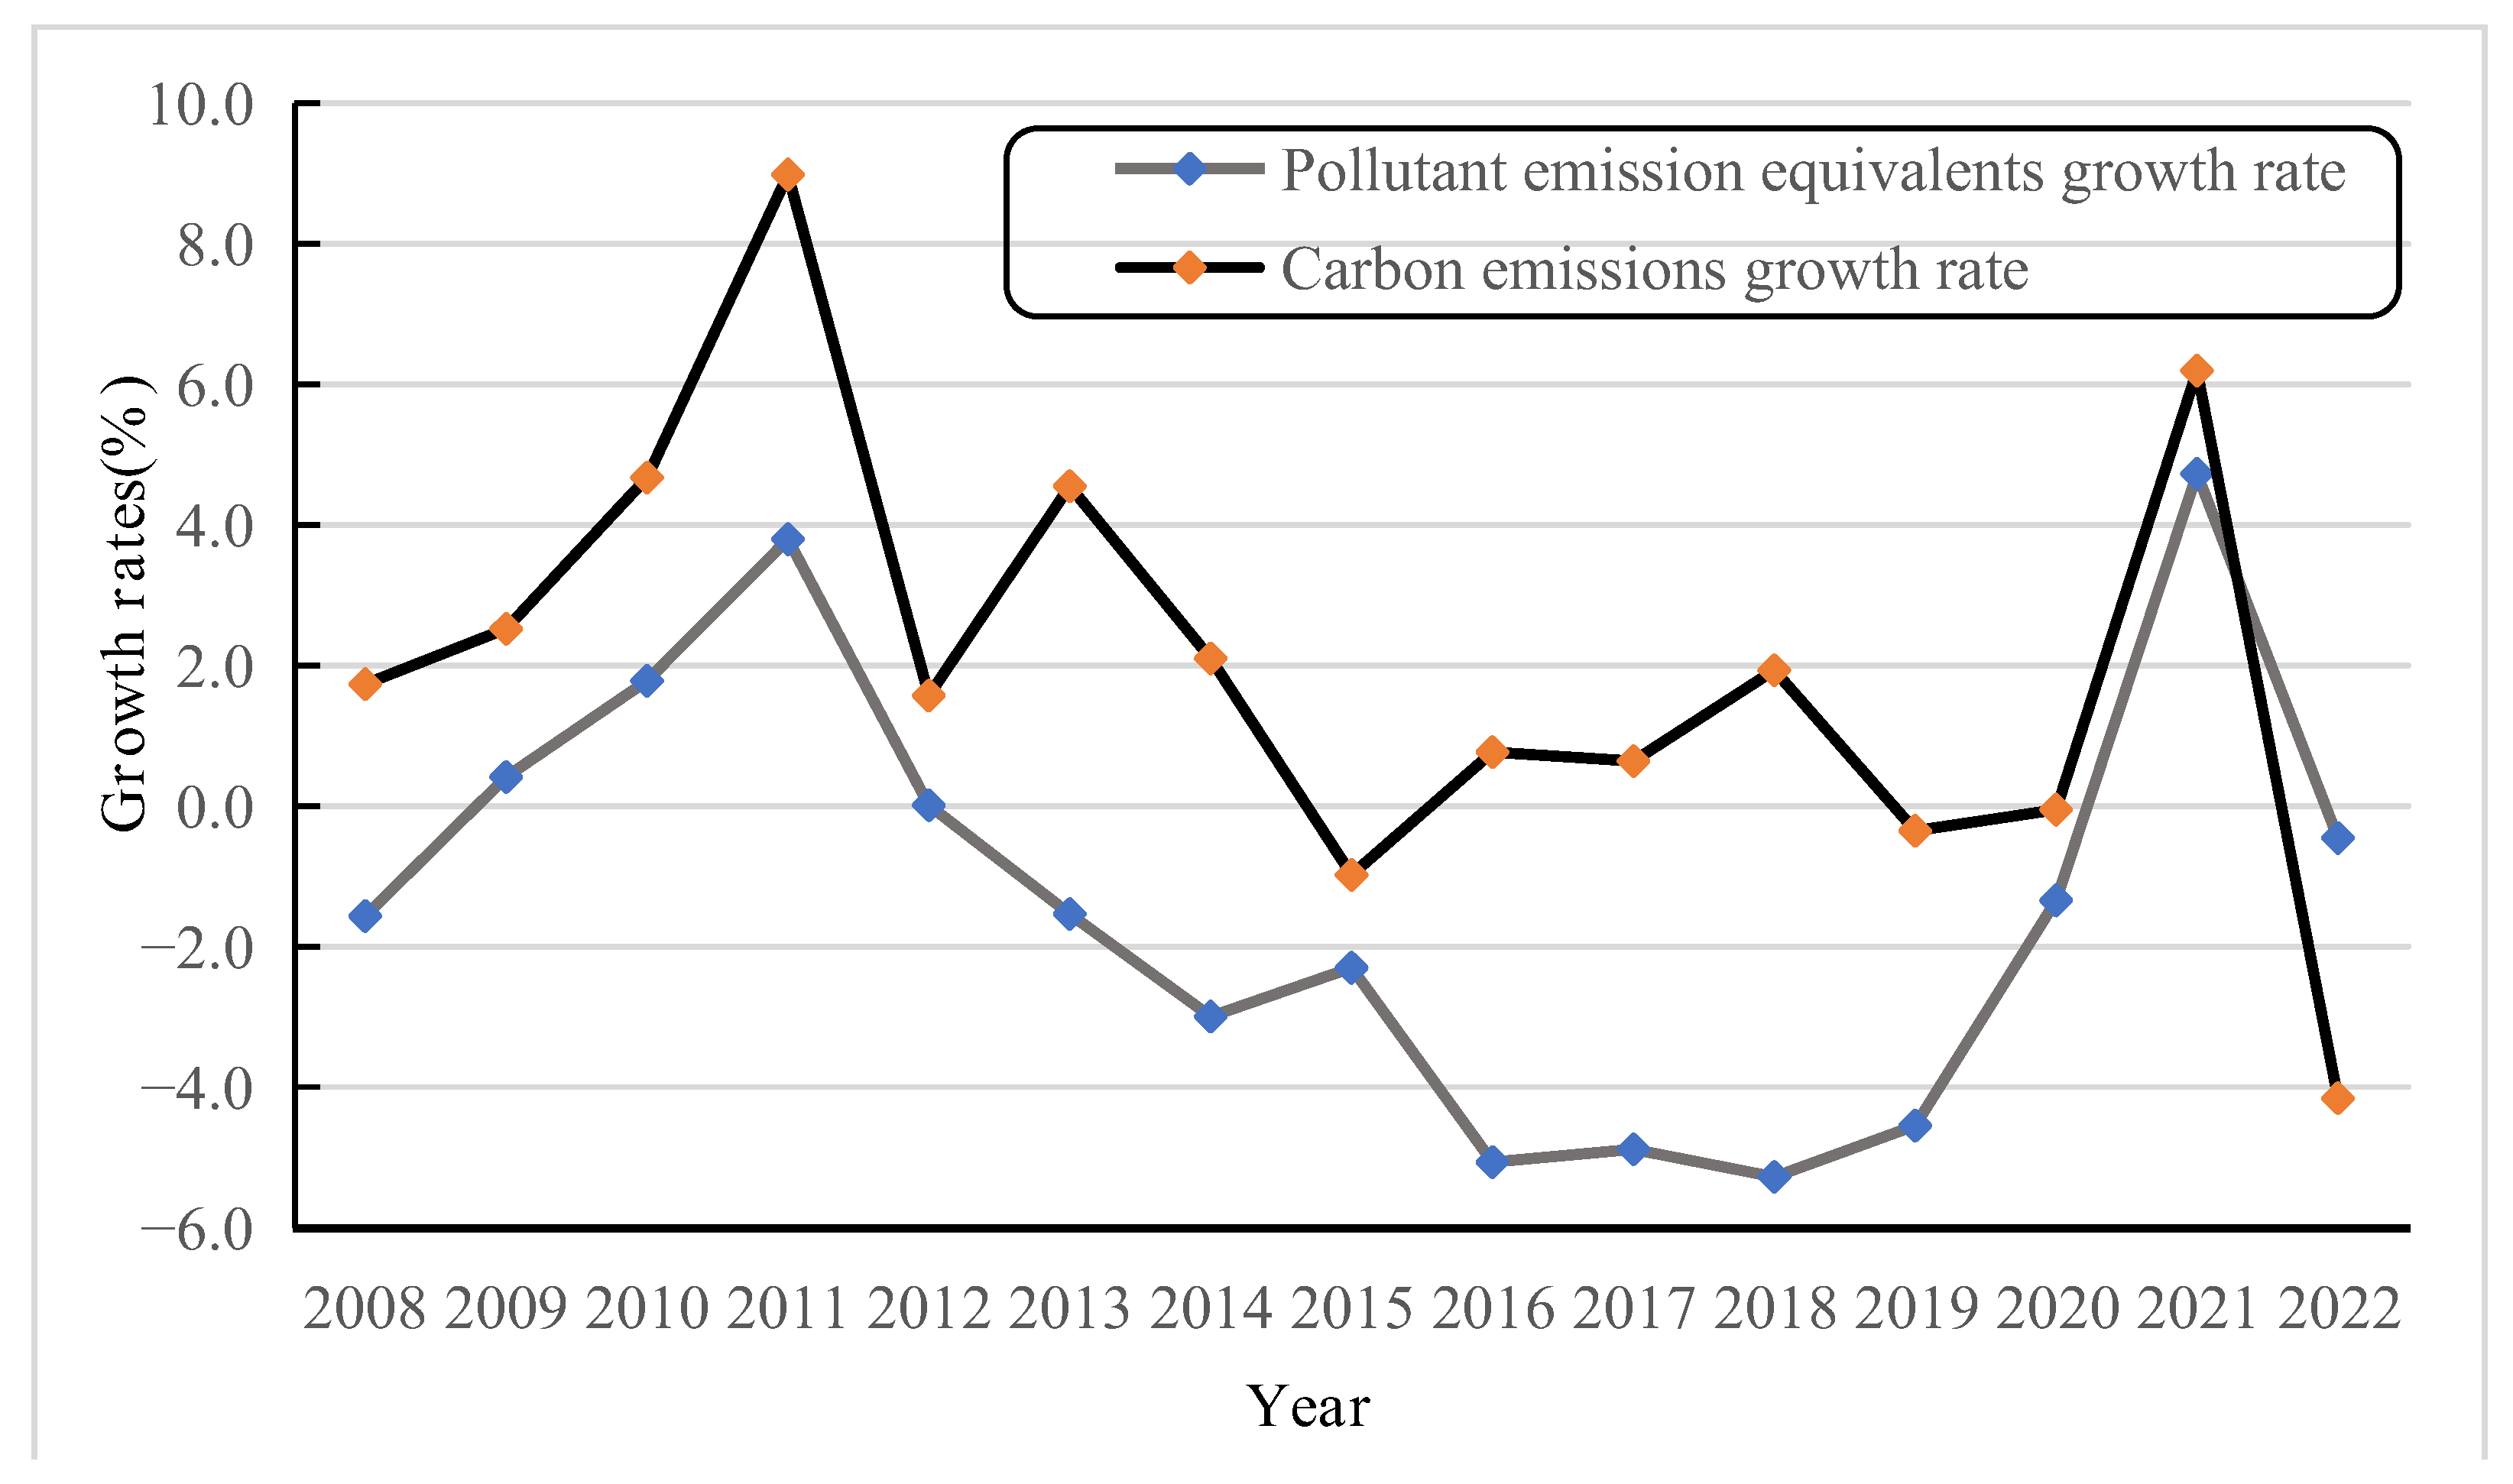
The overall changes and growth rates of AP and CE in 16 cities in the CCR from 2007 to 2022 are shown in Figure 2 and Figure 3. As indicated by the figures: APE followed an upward trend initially, then declined. Prior to 2012, APE exhibited gradual upward trajectory, with its growth rate increasing from negative to positive values, indicating an accelerating pace of growth during this period. From 2013 to 2020, the growth rate remained consistently negative, reflecting an overall downward trend. APE showed a negative growth, with emission levels gradually decreasing. Although a slight rebound occurred after 2021, with the growth rate turning positive, it subsequently began to decline again. In contrast, CE showed an overall upward trend. Over these 15 years, the growth rate of CE was predominantly positive, exhibiting a clear increasing trajectory until a slight decline emerged in 2022. This indicates that since the 18th National Congress of the Communist Party of China, AP prevention and control efforts in the CCR have yielded significant results, while CE have not decreased synchronously. This may be because pollutants such as SO2 and NOx have a significant environmental impact in the short period, and China’s traditional environmental governance policies have been more focused on controlling emissions of such pollutants. Although CE have now received substantial attention, CE reduction usually requires a longer timeframe and more structural adjustments, making it hard to accomplish significant governance effects a short period.
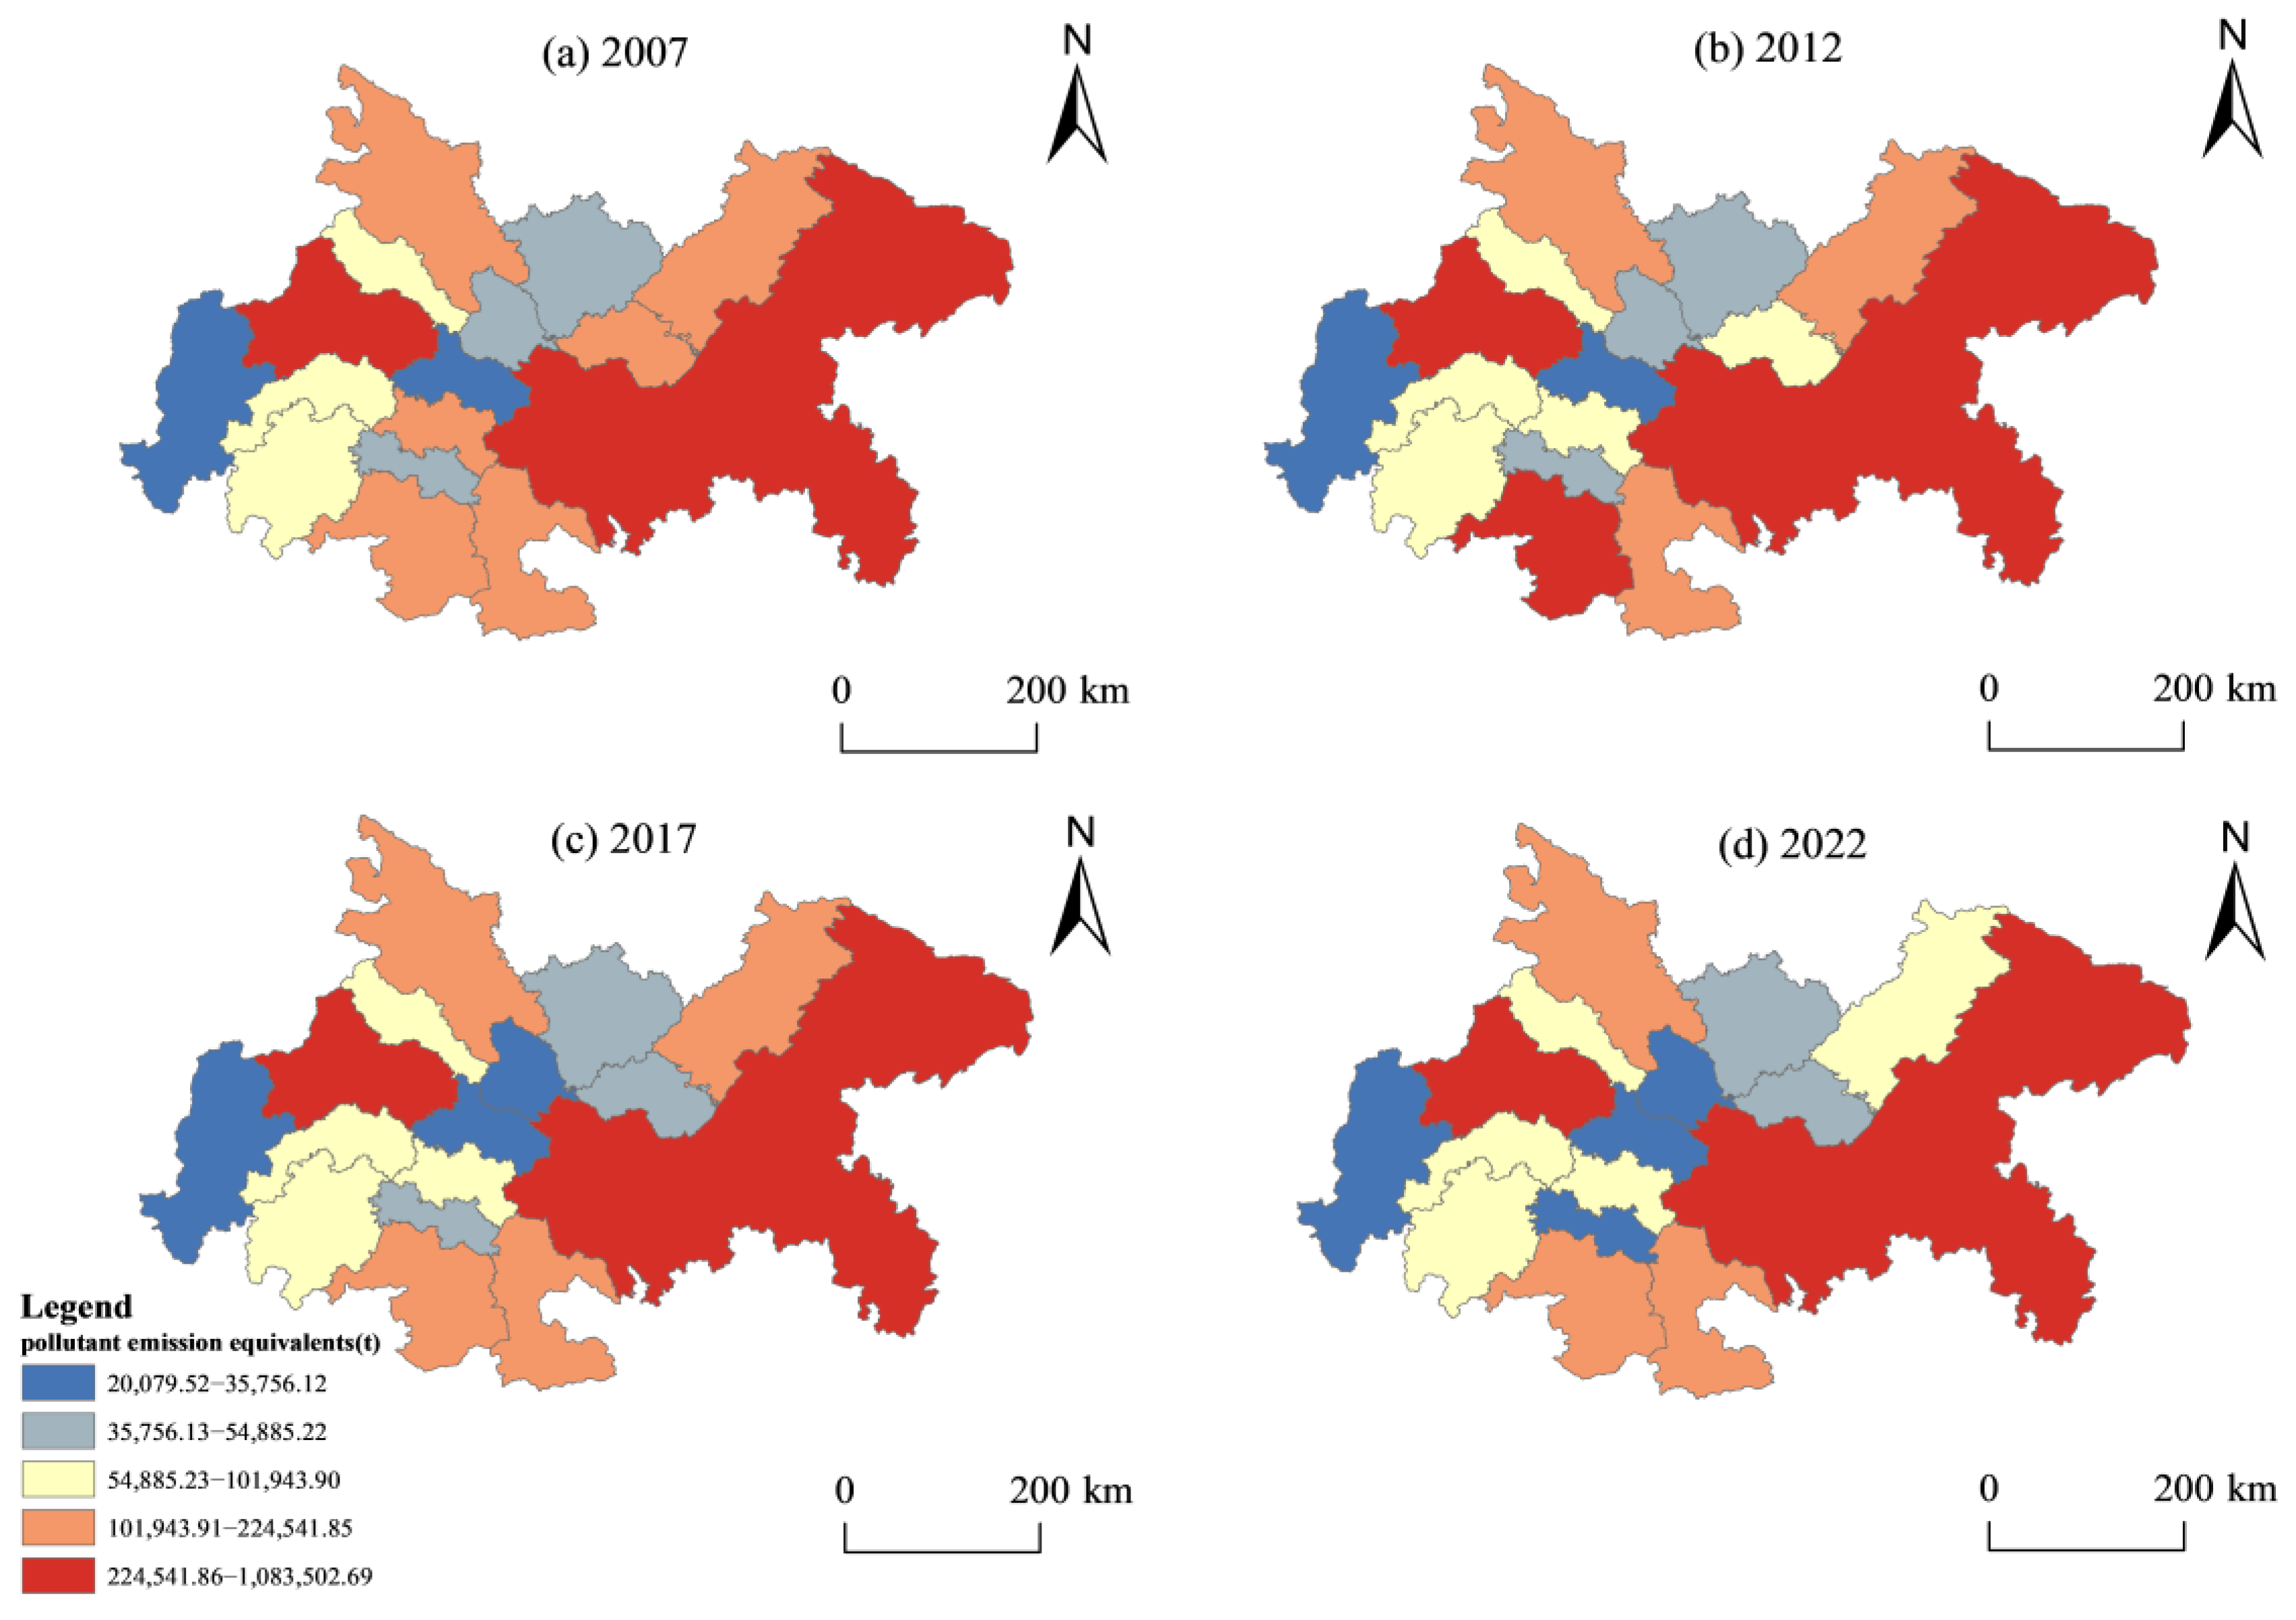
To investigate the spatial pattern characteristics of APE and CE in the 16 cities of the CCR, we selected four benchmark years (2007, 2012, 2017, and 2022) as representative study periods. The results are visualized in Figure 4 and Figure 5. Overall, cities with higher APE and CE were predominantly clustered in economically developed areas, such as Chongqing, Chengdu, Mianyang, Yibin, and Luzhou. For APE, compared to 2007, by 2012 all cities except Guang’an showed a significant decline, while others maintained an upward trend or remained largely unchanged. By 2017, cities such as Yibin, Suining, and Guang’an experienced substantial decreases, and other cities also showed declines within their respective ranges. By 2022, Dazhou and Zigong also saw notable reductions, alongside decreases in other cities. For CE, compared to 2007, Chengdu, Leshan, and Suining showed notable increases by 2012, with other cities also following an upward trend. By 2017, Leshan’s CE declined while cities like Nanchong saw increases. By 2022, Nanchong’s CE dropped significantly, with other cities experiencing slight fluctuations within their respective ranges. These patterns indicate that the changes in APE and CE are not synchronized, with significant temporal and spatial differences.

4.2. SEPCR’s Spatial and Temporal Features

4.2.1. Aspects of Temporal Changes

The temporal variation in the CCD for SEPCR in the CCR between 2007 and 2022 is displayed in Figure 6. Overall, the CCD followed a pattern of an initial upward trend, followed by a decrease, and then a subsequent recovery, resulting in a slight net improvement in the overall SEPCR over the study period. Based on the changes in CCD, the period can be divided into three distinct phases: from 2007 to 2014, the CCD increased slowly, indicating that although the overall level of CCR remained low during this period, it was progressing toward a more coordinated stage; from 2015 to 2020, it showed a slow downward trend, with the coordination between APE and CE progressively weakened. From 2021 to 2022, a rebound occurred, and the CCD increased. Notably, the downward trend began in 2015, which was closely related to the progress in AP prevention and control in China during this period. In 2013, the introduction and implementation of policies such as the Air Pollution Prevention and Control Action Plan strongly promoted AP control efforts in the CCR, leading to improved air quality. However, the lack of synchronous controls on CE hindered the full realization of SEPCR, resulting in a gradual weakening of the interaction between the two systems. From the distribution of CCD across individual cities, most cities remained at or below the dysregulation type, while one city (Chongqing) exhibited a CCD significantly higher than the others, ranging between the development type and coordination type.

4.2.2. Aspects of Spatial Changes

The evolution of CCD across the 16 cities in the CCR from 2007 to 2022 is summarized in Table 3. Based on the classification criteria established earlier (refer to Table 1), the coordinated development phases are categorized into five types: recession type, dysregulation type, transition type, development type, and coordination type. Analysis combining Table 1 and Table 3 reveals the following spatial patterns over the 2007–2022 period: The vast majority of cities did not undergo a shift in their coordinated development phase over the 15-year period. Specifically, seven cities—Zigong, Deyang, Suining, Nanchong, Meishan, Ya’an, and Ziyang—remained persistently in the recession type, indicating a chronic and unimproved state of decoupling between pollution control and carbon reduction efforts. Their CCD values persistently remained at the lower end of the spectrum, underscoring an entrenched challenge in initiating synergistic development. Similarly, five cities—Luzhou, Mianyang, Neijiang, Leshan, and Dazhou—were consistently classified as dysregulation type. While performing slightly better than the recession group, their stagnant status indicates persistent struggles in achieving stable, effective coordination. Chengdu, as the regional core, uniquely maintained a stable transitional status. Its relatively high but stagnant CCD value indicates that its development has entered a plateau phase, facing bottlenecks in advancing to higher coordination levels despite its relative economic and administrative advantages.
Chongqing represents the sole case of sustained improvement. It progressed from development type (2007–2010) to coordination type (2011–2022), establishing itself as the region’s top-performing city. Yibin exemplifies volatility and policy fragility. It progressed from dysregulation type (2007–2010) to transition type (2011–2016), indicating a period of positive change. However, its regression to dysregulation type (2017–2022) suggested that these gains failed to become consolidate, potentially due to inconsistent policy support, economic pressures, or insufficient foundational reforms. Guang’an’s trajectory represented a concerning regression. It declined from dysregulation type (2007–2014) to recession type (2015–2022). This downturn made it the only city where coordination status deteriorated significantly, pointing to potential severe misalignments in its development policies.
Based on the above analysis, Chongqing and Chengdu exhibit higher CCD and occupy more advanced development stages, which can be attributed to their robust economic foundations and scientific industrial structure. In contrast, most other cities within Sichuan Province still primarily rely on an extensive expansion, with traditional manufacturing industries accounting for a high proportion. The resource-dependent industrial development model remains largely unchanged, and sustainable industrial support remains weak. From the overall spatial evolution perspective, the coordination development stages remained unchanged for the vast majority of cities within the CCR. The few cities that did experience changes only transitioned between adjacent stages. Consequently, the spatial pattern of development stages has formed a persistent and relatively fixed developmental trajectory.

4.2.3. Spatial Autocorrelation Analysis

  • Global spatial autocorrelation
ArcMap10.8 was used to perform a global spatial autocorrelation analysis to assess the overall spatial distribution pattern of the SEPCR in the CCR for the years 2007, 2012, 2017, and 2022. Table 4 indicates that between 2007 and 2022, the global Moran’s I values were consistently greater than 0, though they were quite close to 0. Furthermore, all Z-values fell within the range of [0, 1.65], and all p-values exceeded 0.3, suggesting that the results did not achieve statistical significance. This lack of statistical significance is a key finding. It indicates that during the study period, the SEPCR in the CCR did not exhibit a structured spatial pattern—neither clustered nor dispersed. Instead, its values were randomly distributed in space, with no significant spatial correlation. This implies that a city’s level of collaborative governance is largely independent of that of its immediate geographic neighbors.
2.
Local Spatial Autocorrelation
Despite the absence of a globally significant pattern, local spatial heterogeneities may exist. To identify these specific local clusters and outliers, we performed local spatial autocorrelation analysis for the CCR in 2007, 2012, 2017, and 2022 (Figure 7). The results indicate that although most cities did not exhibit significant local spatial autocorrelation, a few persistent areas of local correlation were identified. These primarily manifested as LLs and HL anomaly zones.
The LLs (such as Suining and later Neijiang) represent areas requiring attention, where low-SEPCR cities are surrounded by other low-performing cities. This indicates the formation of a “synergy cold spot”, where the absence of positive spillover effects may perpetuate low performance across the entire subregion. The HL outliers zones (Neijiang in 2007 and 2012) represent cities with relatively high SEPCR surrounded by low-synergy neighbors. This pattern indicates that Neijiang initially exhibited higher synergy levels, but its success remained isolated, failing to radiate to neighboring areas.
A notable trend is the transition of Neijiang from an HL outlier (2007–2012) to an LL (2017–2022). This shift is critical, indicating that Neijiang’s relative advantage in SEPCR has diminished over time and converged toward the lower performance levels of its neighbors. This reveals a weakening of local synergistic drivers and highlights the risk of regional performance degradation.
In summary, the spatial analysis reveals a widespread lack of regional coordination in SEPCR development. The dominant random distribution pattern and emergence of LLs suggest that synergistic governance has historically been uncoordinated and fragmented. Observed trends do not suggest synchronized progress in synergistic AP control and CE reduction across the region. Therefore, efforts towards SEPCR in the CCR require further strengthening.

4.3. Dynamic Evolution Characteristics of CCD

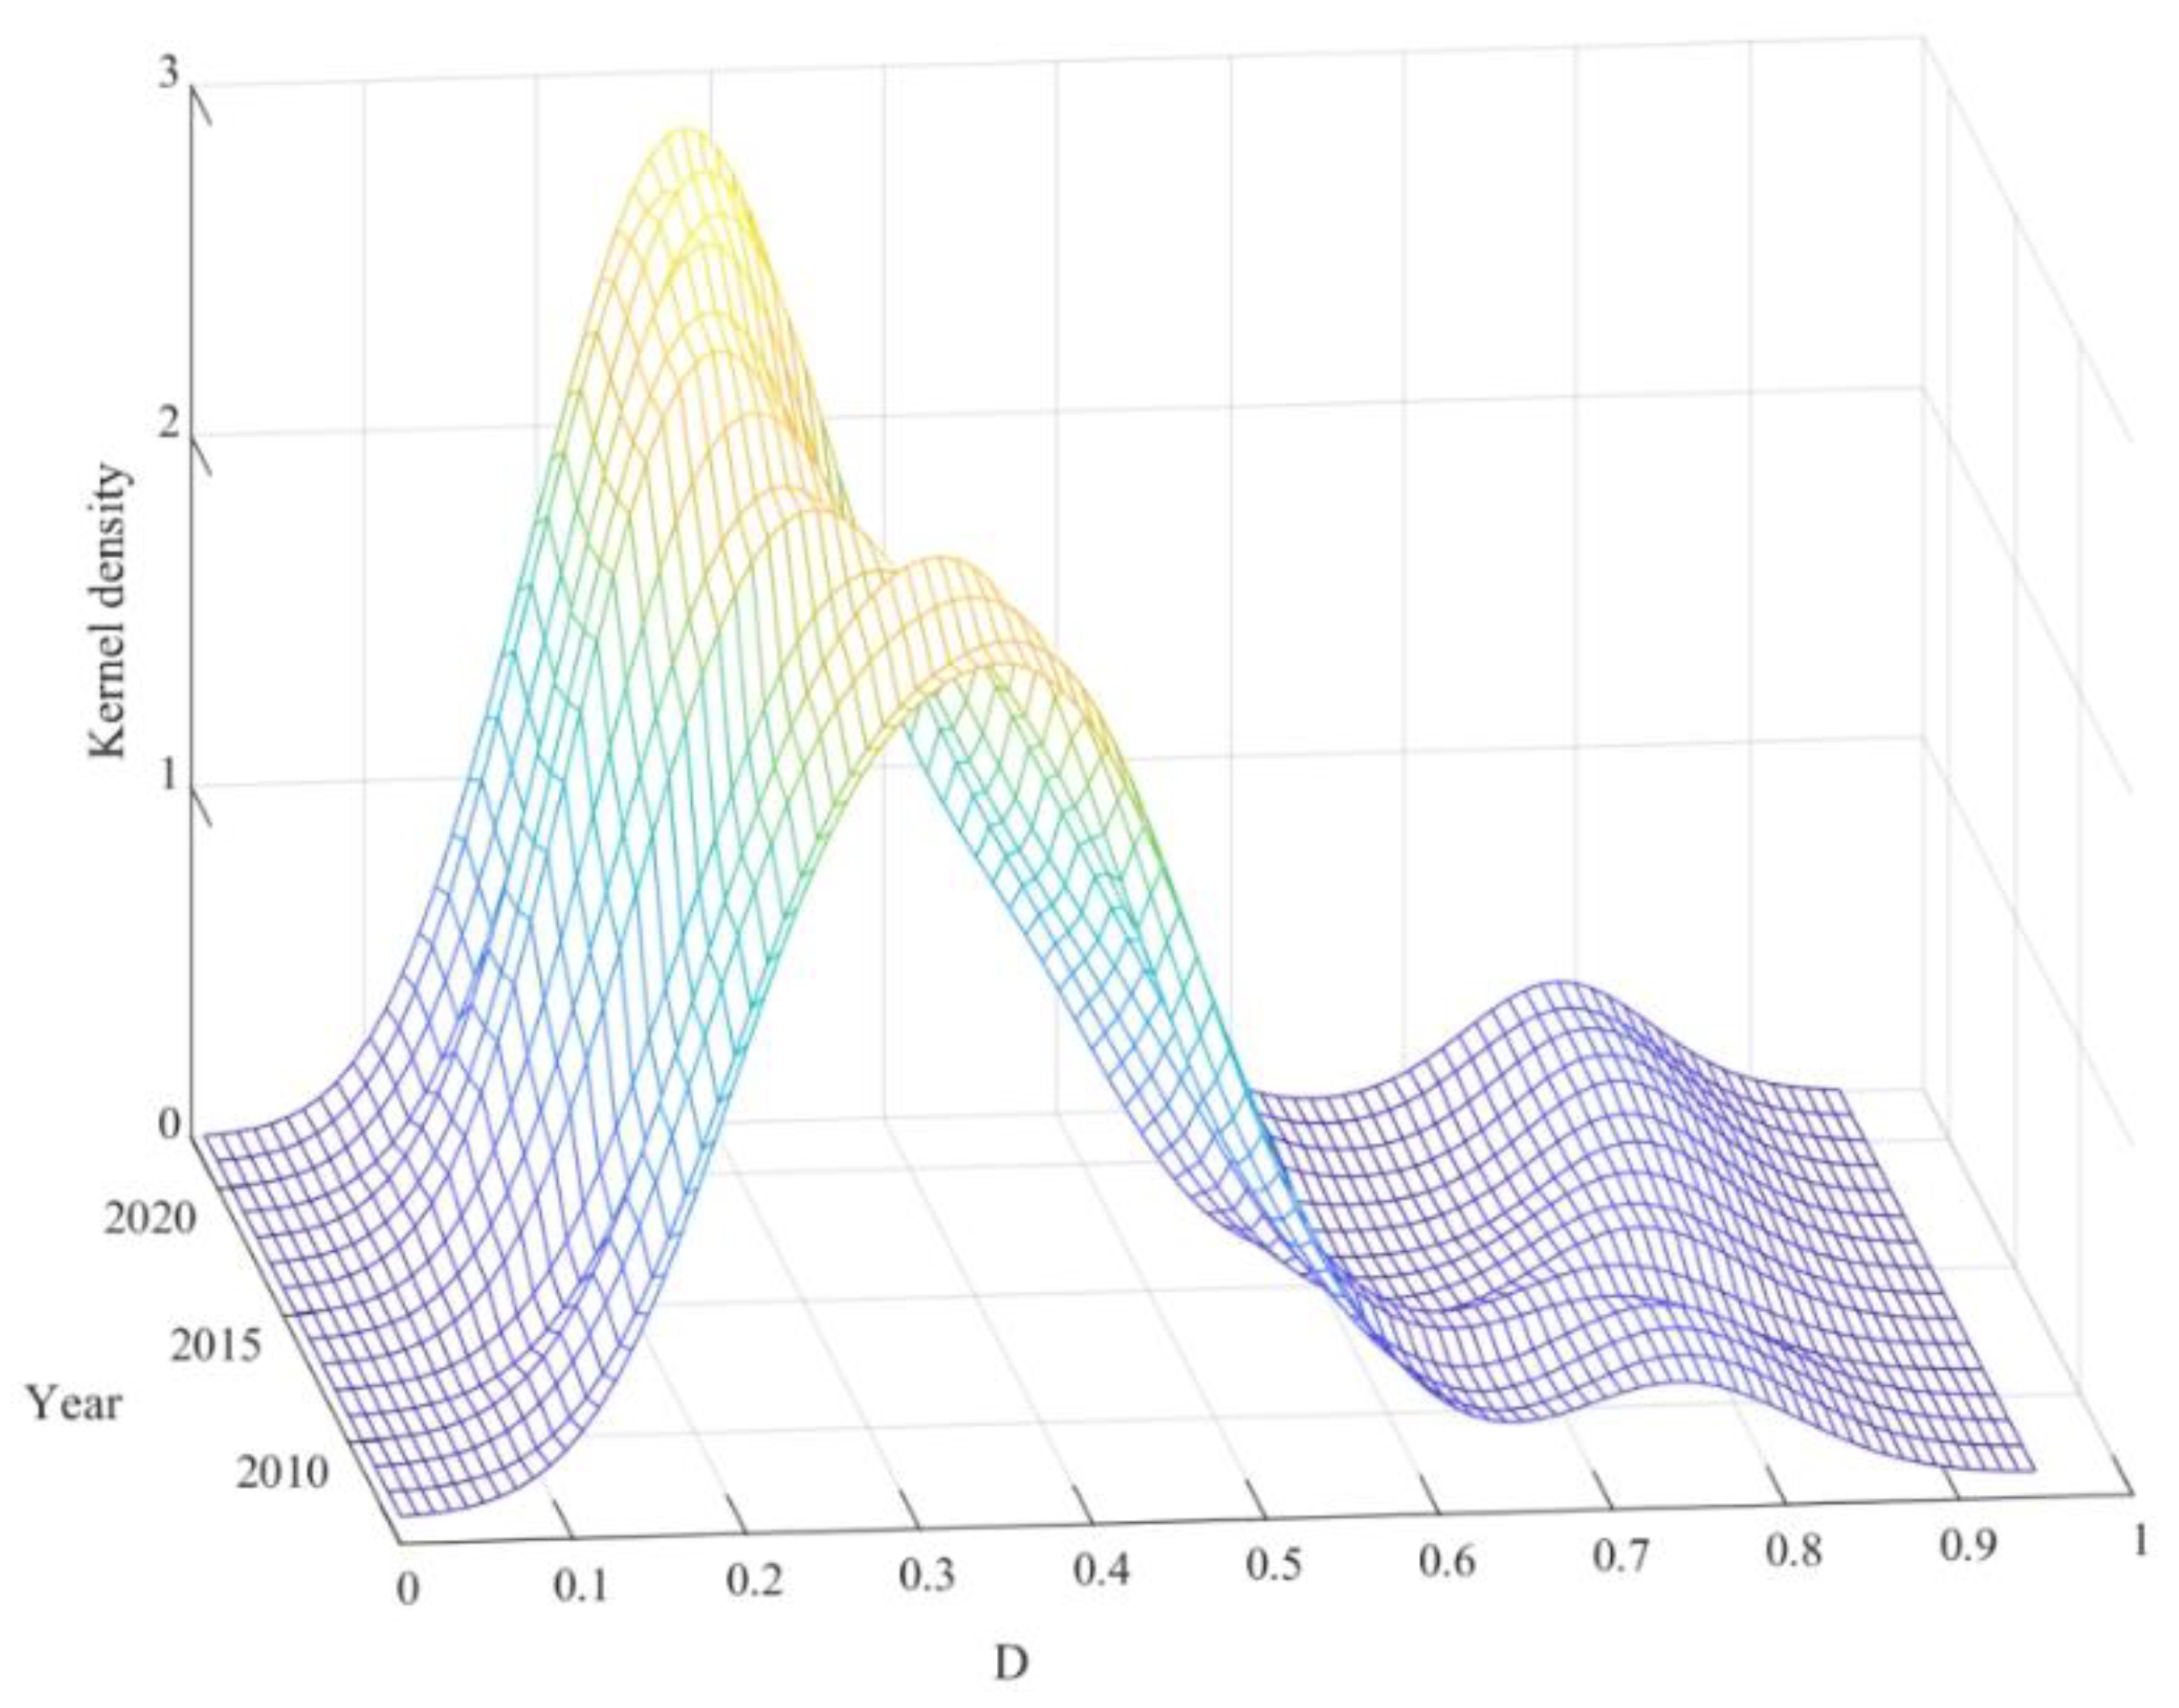
Figure 8 presents the dynamic evolution of the CCD within the CCR from 2007 to 2022 through a three-dimensional kernel density estimation (KDE) plot. This visualization effectively captures the spatial distribution and temporal shifts in synergistic development levels within the region. A core and critical feature of this figure is the persistent bimodal distribution throughout the study period. The emergence of two distinct peaks is not an artifact of the estimation process, but rather a reliable reflection of deeply entrenched regional development imbalances. This bimodal pattern indicates that cities within the CCR have not converged toward a common level of development, but have instead diverged into two distinct clusters.
The left peak exhibits characteristics of high density and stability. Its central position shows a slight leftward shift over time, indicating that the vast majority of cities maintain persistently low levels of CCD, and some have even experienced a collective decline. This cluster, encompassing most cities in the region, has fallen into a state of insufficient synergy between AP control and CE reduction. Their development models face similar structural constraints, such as fragmented governance, industrial structures locked into traditional sectors, and inadequate investment in green innovation. Conversely, the right peak is formed by Chongqing. Its center position has shifted significantly to the right, indicating that Chongqing has achieved and maintained a markedly higher level of CCD, far surpassing all other cities. This may be attributed to Chongqing’s unique status as a national-level municipality, which grants it greater policy autonomy, financial resources, and technological application capabilities, enabling it to attain a higher level of coordination. However, this peak underwent a process of initial strengthening followed by weakening, suggesting that even Chongqing’s high performance may have faced challenges or entered a plateau phase in later stages.
While KDE is a powerful non-parametric tool, the choice of bandwidth can influence the smoothness of the plot. The clear, separated bimodality observed here remains robust within a reasonable bandwidth range, confirming that the two maxima are genuine features of the underlying data distribution rather than statistical artifacts. The nature of these two maxima is the most significant finding: it provides both visual and quantitative evidence for the “dual-speed CCR” phenomenon. One “speed” represents the isolated, rapid advancement of the mega-city Chongqing, potentially driven by its superior economic resources, policy leverage, and concentrated innovation. The other “speed” reflects the slow progress and low-level equilibrium of the vast majority of other cities, likely hindered by fragmented governance, insufficient investment, and industrial structures locked into high emissions. This fundamental imbalance is the primary characteristic of the region’s synergistic development efforts.

5. SEPCR Analysis of SEPCR Influencing Elements

Building upon the analysis of the spatial and temporal features of the CCD for AP and CE reduction in the CCR, and to delve deeper into the primary factors contributing to its synergistic impact, this study constructs a Tobit regression model. The CCD serves as the dependent variable, while the six factors listed in Table 2 are employed as explanatory variables. This model is employed to examine how these factors affect the SEPCR in the area.

5.1. Descriptive Statistical Analysis

The outcomes of descriptive statistical analysis for the variables after logarithmic transformation are presented in Table 5. The VIF for every variable is less than 10, suggesting the absence of multicollinearity.

5.2. Unit Root Tests and Panel Cointegration Tests

The IPS test and the HT test were used to evaluate the stationarity of the data, with the outcomes detailed in Table 6. The tests revealed that three variables—the CCD for AP and CE reduction, industrial structure upgrading, and openness to foreign investment—were non-stationary. Therefore, the data were subjected to differencing. Table 7 displays the test results for the first-differenced variables. As evident from Table 7, all variables achieved stationarity after the first-differencing procedure. Among them, S stands for stationary and NS stands for non-stationary.
To confirm the existence of a long-term equilibrium relationship among the variables, the Pedroni cointegration test was conducted, and the findings are presented in Table 8. Table 8 presents three test statistics, all with p-values under 0.01, providing strong evidence against the null hypothesis of “no cointegration relationship”. This confirmation allows us to proceed with the Tobit regression analysis.

5.3. Regression Results

Given that the LR test was significant at the 1% level, the random-effects Tobit regression model was selected. Table 9 displays the regression outcomes.
As indicated in Table 9, all six explanatory variables exerted statistically significant effects on the SEPCR at the 1% or 5% level, with confidence intervals not encompassing zero, indicating robust and reliable relationships. These drivers can be categorized into positive and negative impacts.
PGDP exhibits a significant positive coefficient (β = 0.0256, p = 0.012), indicating that a 1% growth in PGDP results in a 0.0256% enhancement in the CCD. This is because as economic levels improve, traditional high-energy-consuming industries in the CCR may be replaced by green industry clusters. Increased investment in pollution control and growing public environmental awareness collectively drive improvements in the coordinated management of SEPCR.
As hypothesized, ER exhibited a strong positive effect (β = 0.0233, p < 0.001). This signifies that a 1% rise in ER leads to a 0.0233% growth in the CCD. This statistically compelling evidence indicates that stringent environmental policies effectively incentivize green technological innovation and industrial restructuring, achieving synergistic reductions in both AP and CE [54].
The coefficient for OP is positive and highly significant (β = 0.0085, p = 0.001), implying that a 1% increase in openness boosts the CCD by 0.0085%. This can be attributed to the fact that openness optimizes trade structures through import-export activities and facilitates technology transfer, effectively promoting industrial upgrading and supply chain optimization in the CCR.
UR has the largest marginal negative impact (β = −0.1194, p = 0.001). This highly significant result indicates that the large-scale concentration of populations in urban areas leads to spatial clustering of both people and economic activities. Simultaneously, cities exhibit pronounced heavy-duty consumption patterns, resulting in elevated total energy consumption and thus increased AP and CE, thereby hindering synergistic development. Therefore, during urbanization processes, attention should be directed toward optimizing urban industrial structures and promoting green energy adoption to achieve coordinated progress in economic development and ecological conservation.
EI is a major obstacle to synergistic development (β = −0.0270, p < 0.001). This statistically robust finding indicates that greater energy dependence (typically associated with fossil fuels) directly increases emissions and impedes synergistic emission reduction efforts. Consequently, implementing measures such as enhanced energy conservation to reduce total energy consumption—thereby lowering energy consumption intensity—proves conducive to curbing pollutants and carbon emissions at their source. This approach ultimately elevates the coupling coordination level between AP governance and CE reduction systems.
The coefficient for IS is negative and significant (β = −0.0188, p = 0.001). This counterintuitive finding, despite its statistical significance, warrants careful interpretation. This may indicate that ongoing industrial upgrading in the CCR remains reliant on high-energy-consuming sectors within the secondary industry, where efficiency gains are offset by increases in total output, resulting in net emissions growth. Therefore, during industrial restructuring, emphasis should be placed on clean energy substitution and green technology penetration to achieve synergistic advancement of economic growth and ecological conservation.
To confirm the reliability of empirical results, robustness tests are applied in this study, involving omitted variable testing and one-period lag processing of explanatory variables [55]. Specifically, considering that environmental protection investment intensity (PGI) may exert systematic influence on regression results, this variable was incorporated into the model for re-estimation. Simultaneously, all explanatory variables underwent one-period lag processing before model re-fitting. The results of both robustness tests are presented in Table 10 and strongly confirm the stability of the benchmark regression findings. It can be observed that the coefficient signs and statistical significance levels of all core explanatory variables remain nearly consistent across all three model specifications. This consistency underscores that the identified positive and negative drivers of synergistic efficiency are not spurious results but rather robust to different model perturbations.
Including PGI in the omitted variable test yielded an interesting result: it was statistically significant at the 1% level but exhibited a negative coefficient. This suggests that increased environmental investment in the short term may actually be associated with reduced levels of synergistic efficiency. A plausible explanation is that such investments may initially be allocated to end-of-pipe pollution control, which does not simultaneously reduce CE, thereby potentially creating a temporary trade-off rather than a synergy. The fact that the core findings persist even after controlling for this variable significantly enhances their credibility. The results of the one-period lag test indicate that the effects of explanatory variables are persistent, confirming that these relationships extend beyond the current period. The slight attenuation in the magnitude of some coefficients is expected when using lagged values and indicates that their immediate effect is strongest. After these rigorous tests, the coefficient signs and significance levels remained stable, providing compelling evidence that the empirical results are robust.

6. Conclusions, Suggestions, and Limitations

6.1. Conclusions

Based on relevant data from 16 cities in the CCR spanning 2007 to 2022, this study systematically analyzed the SEPCR using the CCD model, kernel density estimation, and other methods. The Tobit regression model was further applied to examine its influencing factors. The principal conclusions are as follows:
First, the APE and CE across cities in the CCR do not change in tandem, exhibiting distinct temporal and spatial differences. While APE showed a decrease, CE exhibited an upward trend, with high values concentrated in core economic hubs such as Chengdu and Chongqing.
Second, regarding the overall trend, the CCD displayed a pattern of initial increase, followed by a decline, and then a subsequent recovery, resulting in a slight improvement in the overall SEPCR. Spatially, Chongqing and Chengdu exhibited higher CCD, while the remaining cities were at lower coordinated development stages. Examining the overall spatial evolution, the coordination development stage remained unchanged for the majority of cities in the CCR. The few cities experiencing changes only transitioned between adjacent stages, forming a spatial pattern characterized by a relatively fixed developmental trajectory.
Third, the SEPCR across the CCR exhibited an overall tendency towards dispersion, showing no significant spatial autocorrelation. The increasing number of LLs indicates that efforts to control AP and reduce CE have not achieved simultaneous progress. Consequently, efforts to enhance synergy require further strengthening.
Fourth, the Tobit regression analysis indicated that economic development (PGDP), openness level (OP), and environmental regulation intensity (ER) are significant positive drivers. Conversely, the urbanization rate (UR), industrial structure upgrading (IS), and energy consumption intensity (EI) are significant negative drivers, revealing the inherent tension between rapid growth and green transition.

6.2. Recommendations

According to the findings discussed earlier, the following recommendations are put forward:
First, given the distinct temporal and spatial variations in APE and CE, regionally differentiated governance strategies should be implemented. For core cities like Chengdu and Chongqing with higher emission levels, advanced technologies and stricter emission standards should be adopted. For peripheral cities, such as those in the LLs, Chengdu and Chongqing can provide financial and technical support to strengthen regional collaboration and accelerate SEPCR. Simultaneously, leveraging the energy transition strategy of the CCR, policy priorities in the region should shift from end-of-pipe treatment to source prevention. This includes mandating green building standards and promoting the electrification of public transportation fleets. By leveraging the region’s abundant clean energy resources, efforts should accelerate the development of a new energy system centered on hydropower, wind power, and photovoltaics. Major projects such as wind farms, solar power stations, and pumped-storage hydroelectric plants should be constructed, particularly to reduce reliance on traditional fossil fuels in key sectors like industry and transportation.
Second, the overall trend of CCD—initial increase, followed by decline and subsequent recovery—underscores the need for consistent and stable policies. The absence of significant spatial autocorrelation and the increase in LL areas indicate a lack of synergistic regional reduction efforts. Inter-city collaborative governance should be strengthened by expanding pilot programs for SEPCR in key industries such as steel, chemicals, and power generation. This should be complemented by establishing real-time monitoring and data-sharing platforms, while incorporating appropriate pollution and carbon reduction metrics into the performance evaluation systems for local government officials.
Third, PGDP, OP, and ER demonstrate significant positive driving effects and should be translated into concrete policy instruments. It is recommended that a portion of fiscal revenue from developed regions be allocated to subsidize industrial energy efficiency upgrades and renewable energy projects in underdeveloped areas. Additionally, policies should guide green foreign investment inflows and strengthen environmental enforcement. Given that UR, IS, and EI currently exhibit negative impacts, targeted structural reforms can address these challenges. New urbanization planning should emphasize low-carbon focus, such as implementing building energy efficiency standards. Industrial policies should encourage the clustering of high-value-added, low-carbon segments. Energy consumption management must prioritize efficiency improvements and renewable energy substitution, avoiding blanket production restrictions that hinder rational development.
Fourth, the experience of CCR holds significant reference value for other inland urban agglomerations designated as national strategic growth poles in China, such as the Middle Yangtze River Urban Agglomeration or the Guanzhong Plain Urban Agglomeration. These regions face analogous challenges of intra-regional development disparity and pollution-carbon synergies. For other developing Asian countries, directly replicating specific technologies or stringent regulations may prove challenging due to differing developmental stages and fiscal capacities. Nevertheless, the experience of CCR offers crucial insights. The CCR’s case demonstrates that economic growth (PGDP) and environmental regulation (ER) can serve as synergistic drivers rather than opposing forces—a critical lesson for any nation seeking to avoid the “pollute first, clean up later” trap. The positive driving effect of openness (OP) indicates that developing countries can proactively attract green foreign investment to achieve leapfrog development toward cleaner technologies. The practice of differentiated governance (core and peripheral cities) also offers highly relevant experience for countries grappling with development imbalances.

6.3. Limitations

As the most representative growth engine in western China, the CCR should progressively achieve SEPCR while developing its economy. Therefore, this study holds certain reference value for the region’s future development planning. However, the research also has certain limitations:
First, due to data availability constraints, this study employs prefecture-level cities as the basic spatial analysis units. While this approach offers practical significance for regional collaborative policy formulation, it may significantly obscure intra-city disparities. Particularly in core cities of the CCR—such as Chengdu and Chongqing—differences between core urban districts and peripheral counties in pollution/carbon emissions, industrial upgrading progress, and technology penetration rates might be masked. Future research could integrate county-level data with enterprise-level geographic information to construct a multi-scale analysis framework encompassing “central urban districts-satellite cities-rural areas,” thereby revealing more granular mechanisms hindering collaborative emission reduction.
Second, although this study examines the CCR as a typical case of underdeveloped areas, its conclusions heavily rely on the region’s specific attributes as a “national strategic growth pole.” Consequently, findings may not be directly applicable to resource-dependent cities or borderland underdeveloped regions. Thus, the conclusions are more relevant to emerging growth poles with policy hub status, diversified industrial foundations, and high environmental resilience. For underdeveloped areas characterized by resource depletion, ecological fragility, or border security concerns, differentiated theoretical research on synergistic effects is required.
Author Contributions

Conceptualization, T.Z., L.Z. and J.Y.; methodology, T.Z. and J.Y.; software, T.Z., Z.Z. and X.Z.; validation, Z.Z., L.Z. and J.Y.; formal analysis, T.Z., Z.Z. and L.Z.; investigation, T.Z., Z.Z. and J.Y.; resources, T.Z.; data curation, T.Z. and X.Z.; writing—original draft preparation, T.Z., Z.Z. and J.Y.; writing—review and editing, T.Z., L.Z. and J.Y.; visualization, T.Z.; supervision, L.Z. and J.Y.; project administration, T.Z. All authors have read and agreed to the published version of the manuscript.

Funding

This research received no external funding.

Institutional Review Board Statement

Not applicable.

Informed Consent Statement

Not applicable.

Data Availability Statement

The data presented in this study are available on request from the corresponding author.

Conflicts of Interest

The authors declare no conflicts of interest.

References

  1. Agyemang, A.; Yusheng, K.; Kongkuah, M.; Musah, A.; Musah, M. Assessing the Impact of Environmental Accounting Disclosure on Corporate Performance in China. Environ. Eng. Manag. J. (EEMJ) 2023, 22, 389–397. [Google Scholar] [CrossRef]
  2. Liu, Y.H.; Li, Y.H.; Wang, W.T. Challenges, opportunities and actions for China to achieve the targets of carbon peak and carbon neutrality. China Popul. Resour. Environ. 2021, 31, 1–5. [Google Scholar] [CrossRef]
  3. Yang, X.J.; Xue, H.C. Spatiotemporal Evolution Pattern and Influencing Factors of Synergistic Effect of Urban Pollution Reduction and Carbon Reduction in China. Environ. Sci. 2025, 1–18. [Google Scholar] [CrossRef]
  4. Ren, Z.; Zheng, J.; Jiao, L.; He, M.; Hou, X.; Coffman, D.; Wang, S. The Synergic Impacts of Air Pollution Control Policies on Pollutants and Carbon Emissions. J. Environ. Manag. 2024, 370, 122730. [Google Scholar] [CrossRef]
  5. Zhang, C.; Wang, Z.; Wang, M.; Li, Y. Micro-Level Pollution Reduction Effect of Carbon Emissions Trading Policy: Based on a-Share Listed Enterprises in Pilot Cities. J. Clean. Prod. 2025, 486, 144442. [Google Scholar] [CrossRef]
  6. Li, Y.; Hao, S.; Liu, Y.; Chen, B.; Zou, T. Research on the Spatial Correlation Network and Its Driving Factors for Synergistic Development of Pollution Reduction, Carbon Reduction, Greening, and Growth in China’s Tourism Industry. J. Environ. Manag. 2025, 377, 124579. [Google Scholar] [CrossRef] [PubMed]
  7. Bosah, C.P.; Li, S.; Mulashani, A.K.; Ampofo, G.K.M. Analysis and Forecast of China’s Carbon Emission: Evidence from Generalized Group Method of Data Handling (g-GMDH) Neural Network. Int. J. Environ. Sci. Technol. (IJEST) 2024, 21, 1467–1480. [Google Scholar] [CrossRef]
  8. Swart, R.; Amann, M.; Raes, F.; Tuinstra, W. A Good Climate for Clean Air: Linkages between Climate Change and Air Pollution. An Editorial Essay. Clim. Change 2004, 66, 263–269. [Google Scholar] [CrossRef]
  9. Gehrsitz, M. The Effect of Low Emission Zones on Air Pollution and Infant Health. J. Environ. Econ. Manag. 2017, 83, 121–144. [Google Scholar] [CrossRef]
  10. Syri, S.; Karvosenoja, N.; Lehtil, A.; Laurila, T.; Tuovinen, J.P. Modeling the Impacts of the Finnish Climate Strategy on Air Pollution. Atmos. Environ. 2002, 36, 3059–3069. [Google Scholar] [CrossRef]
  11. Liu, J.; Zhou, W.; Yang, J.; Ren, H.; Zakeri, B.; Tong, D.; Guo, Y.; Klimont, Z.; Zhu, T.; Tang, X. Importing or Self-Dependent: Energy Transition in Beijing towards Carbon Neutrality and the Air Pollution Reduction Co-Benefits. Clim. Change 2022, 173, 18. [Google Scholar] [CrossRef]
  12. Jiang, H.D.; Liu, L.J.; Deng, H.M. Co-Benefit Comparison of Carbon Tax, Sulfur Tax and Nitrogen Tax: The Case of China. Sustain. Prod. Consum. 2022, 29, 239–248. [Google Scholar] [CrossRef]
  13. Beevers, S.D.; Carslaw, D.C. The Impact of Congestion Charging on Vehicle Emissions in London. Atmos. Environ. 2005, 39, 1–5. [Google Scholar] [CrossRef]
  14. Yi, L.; Yang, T.T.; Du, X. Collaborative pathways of pollution reduction and carbon abatement: Typical countries’ driving mechanisms and their implications for China. China Popul. Resour. Environ. 2022, 32, 53–65. [Google Scholar] [CrossRef]
  15. Mao, X.Q.; Zeng, A.; Hu, T. Evaluation of the Synergistic Control Effects of Technical Emission Reduction Measures. China Popul. Resour. Environ. 2011, 21, 7. [Google Scholar] [CrossRef]
  16. Chen, X.H.; Zhang, J.M.; Tang, X.B. Synergistic effect of industrial air pollution and carbon emission reduction in China and influencing mechanism. Resour. Sci. 2022, 44, 2387–2398. [Google Scholar] [CrossRef]
  17. Du, W.; Li, M. Assessing the Impact of Environmental Regulation on Pollution Abatement and Collaborative Emissions Reduction: Micro-Evidence from Chinese Industrial Enterprises. Environ. Impact Assess. Rev. 2020, 82, 106382. [Google Scholar] [CrossRef]
  18. Shakya, S.R.; Kumar, S.; Shrestha, R.M. Co-Benefits of a Carbon Tax in Nepal. Mitig. Adapt. Strateg. Glob. Change 2012, 17, 77–101. [Google Scholar] [CrossRef]
  19. Cui, L.B.; Li, X.; Duan, H.B. Synergistic effects of reducing pollution and carbon emissions in the Yangtze River Delta. China Popul. Resour. Environ. 2024, 34, 21–32. [Google Scholar] [CrossRef]
  20. Wei, X.; Zhao, R. Evaluation and Spatial Convergence of Carbon Emission Reduction Efficiency in China’s Power Industry: Based on a Three-Stage DEA Model with Game Cross-Efficiency. Sci. Total Environ. 2024, 906, 167851. [Google Scholar] [CrossRef]
  21. Di, Q.B.; Chen, X.L.; Hou, Z.W. Regional differences and key pathway identification of the coordinated governance of pollution control and carbon emission reduction in the three major urban agglomerations of China under the “Double-Carbon” targets. Resour. Sci. 2022, 44, 1155–1167. [Google Scholar] [CrossRef]
  22. Zheng, Z.; Xiao, W.; Cheng, Z. China’s Green Total Factor Energy Efficiency Assessment Based on Coordinated Reduction in Pollution and Carbon Emission: From the 11th to the 13th Five-Year Plan. Sustainability 2023, 15, 7301. [Google Scholar] [CrossRef]
  23. Burtraw, D.; Krupnick, A.; Palmer, K.; Paul, A.; Toman, M.; Bloyd, C. Ancillary Benefits of Reduced Air Pollution in the US from Moderate Greenhouse Gas Mitigation Policies in the Electricity Sector. J. Environ. Econ. Manag. 2003, 45, 650–673. [Google Scholar] [CrossRef]
  24. Zhang, W.-W.; Zhao, B.; Jiang, Y.-Q.; Nie, Y.-Y.; Sharp, B.; Gu, Y.; Xu, S.-C.; Zhu, Y.; Xing, J.; Wang, S.-X.; et al. Co-Benefits of Regionally-Differentiated Carbon Pricing Policies across China. Clim. Policy 2024, 24, 57–70. [Google Scholar] [CrossRef]
  25. Qin, P.; Ren, C.; Li, L.; Lei, Y.; Wu, S. Evaluation of PM2.5 and CO2 Synergistic Emission Reduction and Its Driving Factors in China. J. Clean. Prod. 2023, 428, 139296. [Google Scholar] [CrossRef]
  26. Tang, Y.; Hu, Y.; Cui, A. Research on the Synergistic Effects of Market-Oriented Environmental Regulations on Pollution and Carbon Emission Reduction. J. Environ. Manag. 2025, 380, 125115. [Google Scholar] [CrossRef]
  27. Liu, H.J.; Guo, L.X.; Qiao, L.C. Quantitative Evaluation of Co-Benefits of Air Pollution Reduction and Carbon Emission Reduction: Based on Marginal Abatement Cost. Stat. Res. 2023, 40, 19–33. [Google Scholar] [CrossRef]
  28. Herrerias, M.J.; Joyeux, R.; Girardin, E. Short- and Long-Run Causality between Energy Consumption and Economic Growth: Evidence across Regions in China. Appl. Energy 2013, 112, 1483–1492. [Google Scholar] [CrossRef]
  29. Zhang, Y.; Huang, Y.L. Spatio-Temporal Characteristics and Influencing Factors of The Coordinated Treatment Cost of Pollution Reduction and Carbon Reduction in China. Environ. Sci. 2025, 1–20. [Google Scholar] [CrossRef]
  30. Dong, F.; Yu, B.; Pan, Y. Examining the Synergistic Effect of CO2 Emissions on PM2.5 Emissions Reduction: Evidence from China. J. Clean. Prod. 2019, 223, 759–771. [Google Scholar] [CrossRef]
  31. Zhao, L.; Pan, W.; Lin, H. Can Fujian Achieve Carbon Peak and Pollutant Reduction Targets before 2030? Case Study of 3E System in Southeastern China Based on System Dynamics. Sustainability 2022, 14, 11364. [Google Scholar] [CrossRef]
  32. Zhao, R.; Hu, C.; Du, C.; Wang, C.; Sun, L. Synergistic Effect Assessment of Pollution and Carbon Reduction and Pathway of Green Transformation at Regional Level in China. J. Clean. Prod. 2025, 495, 145013. [Google Scholar] [CrossRef]
  33. Zhao, Q.; Jiang, M.; Zhao, Z.; Liu, F.; Zhou, L. The Impact of Green Innovation on Carbon Reduction Efficiency in China: Evidence from Machine Learning Validation. Energy Econ. 2024, 133, 107525. [Google Scholar] [CrossRef]
  34. Mavi, N.K.; Mavi, R.K. Energy and Environmental Efficiency of OECD Countries in the Context of the Circular Economy: Common Weight Analysis for Malmquist Productivity Index. J. Environ. Manag. 2019, 247, 651–661. [Google Scholar] [CrossRef]
  35. Sun, B.; Wang, M.; Zhang, H.; Zhao, Y.; Li, X. Assessing Spatiotemporal Trends and Drivers of Collaborative Governance for Air Quality and Carbon Emission Control: Evidence from Typical Urban Agglomerations in China. J. Clean. Prod. 2025, 519, 146034. [Google Scholar] [CrossRef]
  36. Zhu, W.W.; Wu, L.; Yang, M.Y.; Zhou, C.C.; Qian, J. Synergistic Path of Pollution Reduction and Carbon Reduction in Huaibei City based on LMDI-LEAP modeling. Environ. Sci. 2025, 1–20. [Google Scholar] [CrossRef]
  37. Liu, M.H.; Yue, Y.Y.; Liu, S.N.; Li, J.; Liu, J.H.; Sun, M. Multi-dimensional Analysis of the Synergistic Effect of Pollution Reduction and Carbon Reduction in Tianjin Based on the STIRPAT Model. Environ. Sci. 2023, 44, 1277–1286. [Google Scholar] [CrossRef]
  38. Wang, F.; Ge, S.Z.M.; Zhu, X.D. Analysis of Spatial-Temporal Evolution and Driving Forces of Industrial Air Pollutants and Carbon Dioxide Emission Reduction in the Yangtze River Delta. Res. Environ. Sci. 2024, 37, 661–671. [Google Scholar] [CrossRef]
  39. Xing, H.; Huo, X.Q. The spatiotemporal pattern evolution and influencing factors of synergistic reduction of pollution and carbon emissions in Chinese counties. China Environ. Sci. 2025, 45, 1657–1673. [Google Scholar] [CrossRef]
  40. Chen, S.; Tan, Z.; Mu, S.; Wang, J.; Chen, Y.; He, X. Synergy Level of Pollution and Carbon Reduction in the Yangtze River Economic Belt: Spatial-Temporal Evolution Characteristics and Driving Factors. Sustain. Cities Soc. 2023, 98, 104859. [Google Scholar] [CrossRef]
  41. Xian, B.; Xu, Y.; Chen, W.; Wang, Y.; Qiu, L. Co-Benefits of Policies to Reduce Air Pollution and Carbon Emissions in China. Environ. Impact Assess. Rev. 2024, 104, 107301. [Google Scholar] [CrossRef]
  42. Tang, X.B.; Zhang, Y.; Cao, L.Z.; Zhang, J.M.; Chen, X.H. Spatio-Temporal Characteristics and Influencing Mechanism of Synergistic Effect of Pollution and Carbon Emission Reduction in China. Res. Environ. Sci. 2022, 35, 2252–2263. [Google Scholar] [CrossRef]
  43. Wang, S.J.; Kong, W.; Ren, L. Misconceptions and Corrections in Coupling Coordination Models in China. J. Nat. Resour. 2021, 36, 793–810. [Google Scholar] [CrossRef]
  44. Cui, L.B.; Chen, H. Spatio-temporal characteristics and driving factors of pollution reduction and carbon emission reduction in the Beijing-Tianjin-Hebei urban agglomeration. J. Ind. Technol. Econ. 2023, 42, 87–96. [Google Scholar] [CrossRef]
  45. Wan, R.; Qian, S.; Ruan, J.; Zhang, L.; Zhang, Z.; Zhu, S.; Jia, M.; Cai, B.; Li, L.; Wu, J. Modelling Monthly-Gridded Carbon Emissions Based on Nighttime Light Data. J. Environ. Manag. 2024, 354, 120391. [Google Scholar] [CrossRef]
  46. Xiang, S.; Huang, X.; Lin, N.; Yi, Z. Synergistic Reduction of Air Pollutants and Carbon Emissions in Chengdu-Chongqing Urban Agglomeration, China: Spatial-Temporal Characteristics, Regional Differences, and Dynamic Evolution. J. Clean. Prod. 2025, 493, 144929. [Google Scholar] [CrossRef]
  47. Ke, N.; Lu, X.; Zhang, X.; Kuang, B.; Zhang, Y. Urban Land Use Carbon Emission Intensity in China under the “Double Carbon” Targets: Spatiotemporal Patterns and Evolution Trend. Environ. Sci. Pollut. Res. 2022, 30, 18213–18226. [Google Scholar] [CrossRef]
  48. Mei, S.; Yujin, G.; Jin, X.W. Spatiotemporal Evolution and Driving Factors of Carbon Emission Efficiency of Resource-Based Cities in the Yellow River Basin of China. Environ. Sci. Pollut. Res. 2023, 30, 96795–96807. [Google Scholar] [CrossRef]
  49. Li, X.Y.; Ban, F.M.; Bi, X.; Li, J.M. Spatio-Temporal Characteristics and Influencing Factors of Synergistic Effect of Coordination of Pollution and Carbon Emission Reduction in the Yellow River Basin. Res. Environ. Sci. 2024, 37, 2610–2621. [Google Scholar] [CrossRef]
  50. Yang, X.; Ran, G. Factors Influencing the Coupled and Coordinated Development of Cities in the Yangtze River Economic Belt: A Focus on Carbon Reduction, Pollution Control, Greening, and Growth. J. Environ. Manag. 2024, 370, 122499. [Google Scholar] [CrossRef]
  51. Zha, Q.; Liu, Z.; Wang, J. Spatial Pattern and Driving Factors of Synergistic Governance Efficiency in Pollution Reduction and Carbon Reduction in Chinese Cities. Ecol. Indic. 2023, 156, 111198. [Google Scholar] [CrossRef]
  52. Hu, S.L.; Bao, H.; Hao, J. The Impact of Environmental Regulations on Green Development in Yangtze River Delta Cities: An Analysis of the Role of Technological Innovation. J. Nat. Resour. 2022, 37, 1572–1585. [Google Scholar] [CrossRef]
  53. Yang, T.; Yi, L.; Yan, S.; Zhang, R.; Wang, X. Synergy of Pollution Reduction and Carbon Abatement of the 8 Urban Agglomerations in China: Status, Dynamic Evolution, and Spatial-Temporal Characteristics. Resour. Policy 2024, 95, 105180. [Google Scholar] [CrossRef]
  54. Shi, W.; Wang, W.; Tang, W.; Qiao, F.; Zhang, G.; Pei, R.; Zhang, L. How Environmental Regulation Affects Pollution Reduction and Carbon Reduction Synergies—An Empirical Analysis Based on Chinese Provincial Data. Sustainability 2024, 16, 5331. [Google Scholar] [CrossRef]
  55. Zhang, W.; Zhu, Z.; Liu, X.; Cheng, J. Can Green Finance Improve Carbon Emission Efficiency? Environ. Sci. Pollut. Res. 2022, 29, 68976–68989. [Google Scholar] [CrossRef]
Figure 1. Study area.
Sustainability 17 08365 g001
Figure 2. Temporal characteristics of APE and CE from 2007 to 2022.
Sustainability 17 08365 g002
Figure 3. Growth rates of APE and CE from 2007 to 2022.
Sustainability 17 08365 g003
Figure 4. Spatial distribution characteristics of APE from 2007 to 2022.
Sustainability 17 08365 g004
Figure 5. The spatial distribution patterns of CE in 2007, 2012, 2017, and 2022.
Sustainability 17 08365 g005
Figure 6. Temporal characteristics of the CCD for SEPCR from 2007 to 2022.
Sustainability 17 08365 g006
Figure 7. The LISA agglomeration map of 2007, 2012, 2017 and 2022.
Sustainability 17 08365 g007
Figure 8. Three-dimensional Dynamic Kernel Density Plot from 2007 to 2022.
Sustainability 17 08365 g008
Table 1. Classification of synergy levels.
D ValueCoordination LevelDevelopment Phase
(0.0, 0.1]Extreme dysregulationRecession type
(0.1, 0.2]Severe dysregulation
(0.2, 0.3]Moderate dysregulationDysregulation type
(0.3, 0.4]Mild dysregulation
(0.4, 0.5]Near dysregulationTransition type
(0.5, 0.6]Barely coordinated
(0.6, 0.7]Primary coordinationDevelopment type
(0.7, 0.8]Intermediate coordination
(0.8, 0.9]Well-coordinatedCoordination type
(0.9, 1.0]High-quality coordination
Table 2. Driving factors for SEPCR.
Variable CategoryVariable NameDefinitionUnit
Explained VariableCoupling Coordination Degree (D)Coupling coordination level in CCRDimensionless
Explanatory VariablesEconomic Development (PGDP)Regional GDP/PopulationCNY
Industrial Structure Upgrading (IS)Tertiary industry added value/secondary industry added valueDimensionless
Urbanization Rate (UR)Urban population proportion at year-end%
Energy Consumption Intensity (EI)Energy consumed per unit GDPtce/CNY 10,000
Openness Level (OP)Total import–export trade volumeUSD 100 million
Environmental Regulation Intensity (ER)Frequency of environmental terms/total words in Government Work Reports%
Table 3. CCD from 2007 to 2022.
D2007200820092010201120122013201420152016201720182019202020212022
Chongqing0.7190.73910.75450.77640.80350.81190.85870.90230.91650.9510.94090.90460.87950.86470.88070.8815
Chengdu0.44690.44690.4540.46980.47750.47380.47510.47370.47660.47380.47290.47360.47560.47860.48590.4834
Zigong0.10910.10660.10910.11670.12010.12310.11990.11760.12080.11790.11520.11430.1120.1140.1150.1163
Luzhou0.23770.26950.26820.27580.28540.28390.28550.28280.28230.27530.27480.27690.27350.2740.29280.2958
Deyang0.17780.17540.17740.18780.19280.19360.19080.18890.19430.18770.18280.18190.17850.18190.18140.1841
Mianyang0.36280.35570.35650.36640.37970.37910.38140.38120.37710.37540.37290.37480.36220.36710.39310.3913
Suining0.080.08260.08450.09120.0950.09780.1010.10040.10380.10220.10040.10120.09870.10030.10060.1018
Neijiang0.26020.25850.26490.26970.27590.27180.28190.27710.2630.25080.2430.22650.21430.20730.2150.2165
Leshan0.22360.21330.21950.22480.23140.23490.21980.220.21440.2120.21180.20620.20260.19560.20120.2013
Nanchong0.1160.11530.11720.12230.12640.13030.13380.13470.13810.13870.13850.13580.13220.13220.13240.1331
Meishan0.16120.16440.16770.17760.18290.18380.18550.18130.18620.17970.17550.17570.17230.17470.17430.1771
Yibin0.31070.30750.30560.31520.4030.42980.43230.430.40540.40560.39450.3830.37490.37120.37930.3797
Guang’an0.29450.27780.26020.24830.24480.23480.22480.2090.19510.18790.18560.18310.17710.17250.17880.1771
Dazhou0.28420.29730.30370.29290.30320.30580.31170.31240.30610.29450.28850.27130.26770.25950.26620.2669
Ya’an0.05320.05820.06880.0750.08040.08580.08960.08050.08420.08270.08310.07460.06740.05690.06170.059
Ziyang0.02970.00930.02120.03080.03670.04130.04470.04330.04620.04440.03670.02890.0080.01260.02470.0175
Sustainability 17 08365 i001: Recession type; Sustainability 17 08365 i002: Dysregulation type; Sustainability 17 08365 i003: Transition type; Sustainability 17 08365 i004: Development type; Sustainability 17 08365 i005: Coordination type.
Table 4. The Global Moran’s I index of 2007, 2012, 2017 and 2022.
YearGlobal Moran’s IZ Valuep Value
20070.0675 0.9160 0.3597
20120.0554 0.8470 0.3970
20170.0524 0.8984 0.3690
20220.0632 0.9384 0.3480
Table 5. Descriptive statistical analysis results.
VariableSample SizeAVGSDMinMaxVIF
D2560.25760.19390.00800.9510
lnPGDP25610.34810.57739.016011.54624.69
lnIS256−0.31000.4368−1.09170.77111.72
lnUR2563.80250.22223.13554.38076.73
lnEI256−0.92590.3590−1.8212−0.05351.30
lnOP2562.05261.9220−2.35397.14932.50
lnER256−0.16130.2827−1.06260.57721.30
Table 6. Results of unit root tests.
VariableIPS TestHT TestResult
Z-t-Tilde-Barpzp
D−1.25030.10563.73700.9999NS
lnPGDP−3.24890.0006−1.87450.0304S
lnIS−1.60650.05411.39170.9180NS
lnUR−5.10520.0000−5.34720.0000S
lnEI−4.29610.0000−2.37310.0088S
lnOP−2.32530.0100−1.06340.1438NS
lnER−4.88290.0000−4.36430.0000S
Table 7. Results of the unit root lag-one test.
VariableIPS TestHT TestResult
Z-t-Tilde-Barpzp
D−6.33850.0000−2.78510.0027S
lnPGDP−8.19030.0000−12.08540.0000S
lnIS−6.39110.0000−6.44980.0000S
lnUR−8.06890.0000−10.21990.0000S
lnEI−8.24640.0000−11.10920.0000S
lnOP−6.88330.0000−9.68010.0000S
lnER−8.21460.0000−12.20590.0000S
Table 8. Pedroni cointegration test results.
Statisticp
Modified Phillips–Perron t6.15520.0000
Phillips–Perron t−4.17740.0000
Augmented Dickey–Fuller t−3.34060.0002
Table 9. Tobit regression results.
VariableCoefficientSDzp > |z|[95% Conf. Interval]Significance
lnPGDP0.02560.01012.510.012[0.0056, 0.0455]***
lnIS−0.01880.0056−3.350.001[−0.0298, −0.0078]***
lnUR−0.11940.0370−3.250.001[−0.1915, −0.0474]***
lnEI−0.02700.0071−3.810.000[−0.0409, −0.0131]***
lnOP0.00850.00273.180.001[0.0033, 0.0137]***
lnER0.02330.00623.740.000[0.0111, 0.0355]***
Constant0.40280.09924.630.000[0.2321, 0.5735]***
sigma_u0.19120.03405.610.000[0.1244, 0.2580]***
sigma_e0.02140.001021.990.000[0.0195, 0.0233]***
LR test of sigma_u = 0:Prob ≥ chibar2 = 0.000
*** p < 0.01.
Table 10. Robustness test results.
Benchmark Panel TobitOmitted Variable TestOne-Period Lag Test
lnPGDP0.026 **0.028 ***0.013 *
(2.510)(2.838)(1.314)
lnIS−0.019 ***−0.020 ***−0.017 ***
(−3.348)(−3.658)(−3.137)
lnUR−0.119 ***−0.103 ***−0.095 ***
(−3.249)(−2.859)(−2.657)
lnEI−0.027 ***−0.026 ***−0.032 ***
(−3.807)(−3.719)(−3.830)
lnOP0.008 ***0.007 ***0.009 ***
(3.178)(2.819)(3.389)
lnER0.023 ***0.021 ***0.014 **
(3.740)(3.429)(2.250)
lnPGI-−0.019 ***-
(−3.537)
Constant0.403 ***0.227 **0.431 ***
(4.625)(2.287)(5.028)
sigma_u0.191 ***0.192 ***0.191 ***
(5.612)(5.614)(5.610)
sigma_e0.021 ***0.021 ***0.020 ***
(21.898)(21.899)(21.154)
*** p < 0.01, ** p < 0.05, * p < 0.10.
Disclaimer/Publisher’s Note: The statements, opinions and data contained in all publications are solely those of the individual author(s) and contributor(s) and not of MDPI and/or the editor(s). MDPI and/or the editor(s) disclaim responsibility for any injury to people or property resulting from any ideas, methods, instructions or products referred to in the content.