Article

Cropland, Competing Land Use, and Food Security Implications: Seven-Decade Case Analysis of USA

by
Isaac Kwadwo Mpanga
1,2,* and
Eric Koomson
3
1
Circular Planet Institute LLC, 5900 Bacons Drive, Suite 100, Austin, TX 78731, USA
2
Environmental Graduate Studies, Unity Environment University, 70 Farm View Drive, Suite 200, New Gloucester, ME 04260, USA
3
Institute of Agricultural Sciences in the Tropics (Hans-Ruthenberg-Institute), University of Hohenheim, Garbenstrasse 13, 70599 Stuttgart, Germany
*
Author to whom correspondence should be addressed.
Sustainability 2025, 17(18), 8352; https://doi.org/10.3390/su17188352
Submission received: 23 July 2025 / Revised: 4 September 2025 / Accepted: 12 September 2025 / Published: 17 September 2025
(This article belongs to the Special Issue Climate Change, Biodiversity and Sustainability)

Abstract

Land is a finite global resource supporting the growing population with food, shelter, recreation, and other environmental benefits. The United States has over 10% of global arable land, contributing to domestic and global food security. The number of farms in the United States has steadily declined with a relatively stable average farm size. Increasing population growth, pressure on food production and environmental sustainability are concerns for cropland decline and food security. This study analyzed the effects of competing land use, agricultural innovation and technology, climate change, and government policy on cropland. Seven decades (1945–2017) of United States Department of Agriculture (USDA) Census of Agriculture datasets were used as a case study to analyze drivers of cropland changes. The total amount of cropland recorded a 13% reduction in 2017 from 1945. Cropland used for pasture decreased by 72%, representing the most substantial proportional decline among the cropland categories. Competing land uses to cropland such as rural parks and wildlife increased over 1000%, urbanized land increased by 395%, and land designated for defense and industrial areas rose by 13% by 2017. The divergence between total factor productivity and farm inputs suggests that productivity gains were driven primarily by technological advancements rather than increased resource use. Linkages were drawn from several studies on climate change and population growth’s negative impact on cropland, whereas government policies and priorities can either influence cropland decline or increase, based on how the policies are structured. This study underscores a strategic planning approach that incorporates technological innovation, climate adaptation, and sustainable land management to balance agricultural output with competing land needs without compromising food security for the growing global population.

1. Introduction

Land is a finite resource with a relatively constant total area, but as the human population grows, shifts, and adapts to climate change, its distribution and use change amid competing demands. Land use refers to the alteration of natural environments by human activities, including agriculture, urban development, industry, and conservation efforts [1]. In the U.S., agriculture dominates land use, with nearly two million farms covering over half of the country’s total land area [2]. Among land use categories in agricultural census records, cropland is the most consistent indicator of agricultural production [3] and reflects the most intensively managed form of agriculture [4].
The United States has more than 10% of the world’s arable land [5,6], contributing significantly to both domestic and global food security [7]. In addition to food production, U.S. agricultural lands support biofuel and fiber production [8,9] while delivering vital ecosystem services that benefit both people and the environment [10,11]. The number of farms has steadily declined in the United States, with more impact on small-scale farms [12], although the average farm sizes have remained relatively stable since the 1970s [13]. This trend prompts important concerns about the causes of cropland decline and its potential consequences for food security on national and global scales.
Cropland availability is key for food security; hence, identifying the causes of its decline, such as urbanization [14], climate change [14,15], economic fluctuations, and policy decisions, is critical for maintaining sustainable food systems amid rising global populations [15] and environmental pressures.
Population growth drives increased demand for food, housing, and infrastructure, all of which significantly impact land use patterns, especially at the edges of urban and agricultural areas [16]. Between 1950 and 2020, the global population rose by 5.3 billion, with rapid urbanization contributing to deforestation, reduced biodiversity, and disruptions in water cycles [17]. Urban development, particularly in developing nations, has drastically reshaped natural landscapes and influenced local climate conditions [18]. Once land is urbanized, it is rarely converted back to agricultural use, making such changes largely permanent. This continued loss of farmland poses a growing risk to local and regional food security, especially in areas where croplands are disappearing rapidly [19,20]. Without effective intervention, the current trajectory of urban-driven cropland decline is expected to persist [21,22].
Climate change, on the other hand, is recognized as an anthropogenic driver that intensifies land use changes by disrupting agricultural productivity, water resources, and ecosystems [23]. Warming temperatures and altered rainfall regimes directly and indirectly affect crop productivity, compelling farmers to modify land management strategies or relocate croplands [24]. Extreme weather events, including floods, droughts, heatwaves, and soil erosion, worsen land degradation and trigger human displacement, indirectly fueling urban expansion and land use pressures [25]. Xie et al. [26] further demonstrated that escalating climate pressures will increasingly drive farmers to abandon marginal lands, which may then be converted to urban uses, especially where climate adaptations such as the efficient irrigation systems reported in the southwestern United States become economically unviable [27].
Understanding the complex interactions among land use, population growth, and climate change is essential for achieving sustainable land management. This requires a holistic approach that integrates socio-economic and environmental dimensions to reduce negative impacts and enhance the resilience of both human and ecological systems [28]. Recent research indicates that although agricultural productivity has outpaced the rate of global population growth, the total area of cropland has remained largely static from 1900 to 2024 [29]. However, many studies have failed to fully consider how population growth and other competing demands for agricultural land influence cropland redistribution with reliable long-term data. Existing research on land use changes in the U.S. has primarily concentrated on the county [3] or state [12] level, often lacking a broader national perspective. In addition, some reports that appear to contradict the trend of cropland decline in the U.S. tend to focus only on short-term patterns [8]. These gaps in long-term analysis may obscure critical patterns needed to inform policy decisions, agricultural practices, and conservation efforts aimed at optimizing land use efficiency and food security in the decades ahead. Moreover, federal agricultural policies and conservation measures have shaped land use decisions yet have not completely halted the ongoing reduction in cropland and trend toward less diverse landscapes, despite these interventions [30,31].
This study uses the United States as a case study to explore land use dynamics with a focus on cropland trends and factors (population growth, technological innovation in agriculture, government policies, and climate variability) influencing those trends, utilizing seven decades of USDA agricultural census data. Although cropland can vary in its ecological impacts depending on how intensively it is managed [4], this analysis focuses solely on cropland as the total land area used for crop production, pasture production (cropland used for pasture), and idled cropland (cropland removed from production under government programs such as the USDA, Farm Survey Agency (FSA) Conservation Research Program). The key objective of this study is to provide timely insights into long-term cropland use, and to shed light on how demographic shifts, other competing land use changes, progress in agricultural innovation, climate variability, and socio-economic conditions collectively shape cropland dynamics that could support evidence-based land use planning by policymakers towards sustainable food systems and climate resilience goals.

2. Materials and Methods

2.1. Study Area and Scope

This study examines the United States, employing a longitudinal approach to analyze key drivers of cropland changes from 1945 to 2017 (most recent data) across seven decades and considers the implications of these trends for national food security. The U.S. was selected due to its extensive agricultural history, availability of long-term land use datasets, and significant shifts in agricultural policies, urbanization, diverse agroecological zones, and climate patterns. A combination of statistical analysis and literature review was used to identify patterns among cropland area, urbanization, technological progress, economic indicators, and climate variability.

2.2. Data Source

Primary data on cropland area and drivers of cropland change were obtained from the United States Department of Agriculture (USDA) Census of Agriculture datasets (1945–2017), available at five-year intervals [32]. The USDA, Economic Research Service’s (ERS) Major Land Uses (MLU) is the only inventory of data for all major public and private land use in all 50 States in the U.S. These datasets have been published at nearly 5-year intervals since 1945 with the latest data in 2017, which coincides with the USDA Census of Agriculture data [33]. The criteria used to select the cropland driver’s data were similarity of methodology and data collection year, except for climate change, population, and agriculture innovation analysis, which were based on the published literature. The national-level data was used for a broader discussion on policy and decision-making that has global applicability beyond local (state or county) contexts.

2.3. Land Use Types Based on the USDA Census of Agriculture

The land use types selected for this study were based on the USDA Census of Agriculture data (Table 1), with consistency in the data collection years and methodology. This typology and its sub-categories were chosen because they were consistently classified in the same way from 1945 to 2017, using the same methodology in data collection and analysis. The only variation was due to methodological changes in the 2007 and 2012 Census of Agriculture data, which reclassified some cropland pasture as permanent grassland pasture and rangeland [33,34].

2.4. Data Curation and Analysis

The downloaded datasets were categorized based on land use changes and their sub-categories (Table 1), focusing on the national level for a broader discussion on policy and decision-making that has global applicability. Descriptive data analyses were used to examine temporal trends in cropland area and land use types (Table 1), and these were visualized using time-series graphs. The relative changes in cropland were compared across decades to assess their relationships. Finally, the change between the baseline data (1945) and the most current year’s data (2017) was expressed in percentages to determine either an increase or a decline. The dataset has limitations, such as the reclassification of cropland pasture as permanent grassland pasture and rangeland; however, the data is presented in a manner that allows these effects to be isolated when necessary. It is also recognized that the national-level data presented here may exhibit variations at the state and county levels.

3. Results and Discussion

3.1. Cropland Use Trends in the United States

Figure 1 displays the temporal trends in land use for cropland purposes in the United States from 1945 to 2017, categorized into three main uses: cropland used for crops, cropland idled, and cropland used for pasture. Total cropland in the three categories recorded about 13% in absolute reduction from 1945 to 2017 with an estimated 1.67 million hectares of total cropland reduction every five years based on the regression equation (Figure 1). From 1945 to 2017, the area allocated to cropland used for crops remained relatively stable, with only a modest decline of 7%. Throughout the seven-decade period, this category consistently occupied the largest proportion of cropland, indicating its central role in U.S. agricultural production. While some fluctuations occurred across the decades, especially around the 1980s and 2000s, the overall extent of land dedicated to cropping activities showed limited long-term variability.
Cropland used for pasture experienced a decline over the study period. Between 1945 and 2017, pasture use decreased by approximately 72%, representing the most substantial proportional decline among the three land-use categories. The most notable reductions occurred after the 1960s, with continued downward trends through the 2000s, suggesting a progressive shift away from integrating pasture into cropland systems. The drastic decline in total cropland is also due to methodological changes in the 2007 and 2012 Censuses of Agriculture that reclassified some cropland pasture as permanent grassland [33,34].
The area of cropland idle, which includes land temporarily removed from production (e.g., through conservation or fallow practices), showed modest variation across decades. There was an overall reduction of 3% from 1945 to 2017. The highest values for idled cropland occurred in the mid 1980s, which coincides with the period following the implementation of federal land retirement and conservation programs. After this peak, the proportion declined and stabilized in subsequent decades. Continuous croplands decline without agricultural productivity could trigger food insecurity in the future due to food price increases.

3.2. Factors Driving Total Cropland Decline in the United States

3.2.1. Competing Land Use

These are many uses of land that compete with cropland for reallocation, such as rural and urban land use, land use for conservation purposes, transportation, and other miscellaneous land uses. The discussion in this section elaborates on how competing land uses influence cropland use trends in the United States.
Rural Development
Figure 2 provides a longitudinal overview of rural land use dynamics in the United States, illustrating contrasting trends between declining cropland and expanding land allocations for infrastructure and conservation purposes. Between 1945 and 2017, total cropland area in the United States declined by 13%. Cropland remained relatively stable from 1945 through the mid 1980s, fluctuating slightly between census intervals. However, beginning in the late 1980s, a sustained decline was observed, with sharper reductions between 1997 and 2012. From 2012 to 2017, cropland showed minimal change.
Land allocated to rural parks and wildlife areas exhibited a consistent and substantial increase from 1964 to 1978 and more than doubled in 1982 with slight increases through 2017. From a modest baseline in 1945, this land category increased by over 1000% by 2017. Most of the land area for rural parks and transportation increased consistently even before the observed drastic reduction in total cropland with a rather minimal additional increase in the same years that recorded higher total cropland decline.
Land use for rural transportation facilities also rose steadily over time, though at a lower magnitude compared to parks and wildlife areas. From 1945 to 2017, this category increased by 13%. Unlike parks and wildlife areas, the growth in transportation land use was more gradual and showed less fluctuation between census periods.
A major expansion of land dedicated to rural parks/wildlife and transportation facilities occurred earlier, with minimal increase concurrent with the decline in total cropland (idle cropland, cropland and pastureland). By 2017, the proportion of land used for non-agricultural rural purposes had markedly increased, while agricultural land use had contracted. The cumulative trend indicates a shifting rural land use profile over the seven-decade period.
According to Nickerson et al. [35], policy shifts toward sustainability and conservation intended to protect wildlife and invertebrates, have sometimes resulted in cropland being converted to other land uses or managed less intensively, contributing to overall potential cropland reduction.
The USDA Economic Research Service [36] data indicates that rural migration rates reached their highest level during the mid 1990s “rural rebound,” with another surge occurring between 2004 and 2006 and a net positive rural migration in subsequent years until increases during and after the 2020 COVID-19 pandemic, driven by retirees and remote workers [37]. This demographic shift in the rural U.S. is creating competing demands that have contributed to the conversion of cropland to non-farm uses.
Farmstead and Miscellaneous Land Use
Land used in farmsteads, roads, and miscellaneous farmland experienced a 60% decrease, but had a relatively low proportion of land area compared to cropland. This category remained relatively low throughout the timeline, with minor fluctuations but a generally declining trend, especially after the mid 1980s (Figure 3).
In contrast, land categorized as “miscellaneous or other land” increased substantially, by more than 100%, due to its low number of hectares in 1945. This could be associated with unexplained major agriculture disruptions, likely World War II or inconsistent data reporting, since it is a voluntary report. The most significant increase in other land uses occurred between 1945 and 1949, followed by a decrease in 1954, and then a sustained increase from 1959 until 1978 before a signification reduction again from 1982 to 2017 (Figure 3).
These trends indicate a pattern that is reduced when compared to the data from the middle years of the study, but is still a significant increase in area when compared to the baseline year, 1945, and which could be contributing to total cropland decline (Figure 3).
Natural Resources Conservation
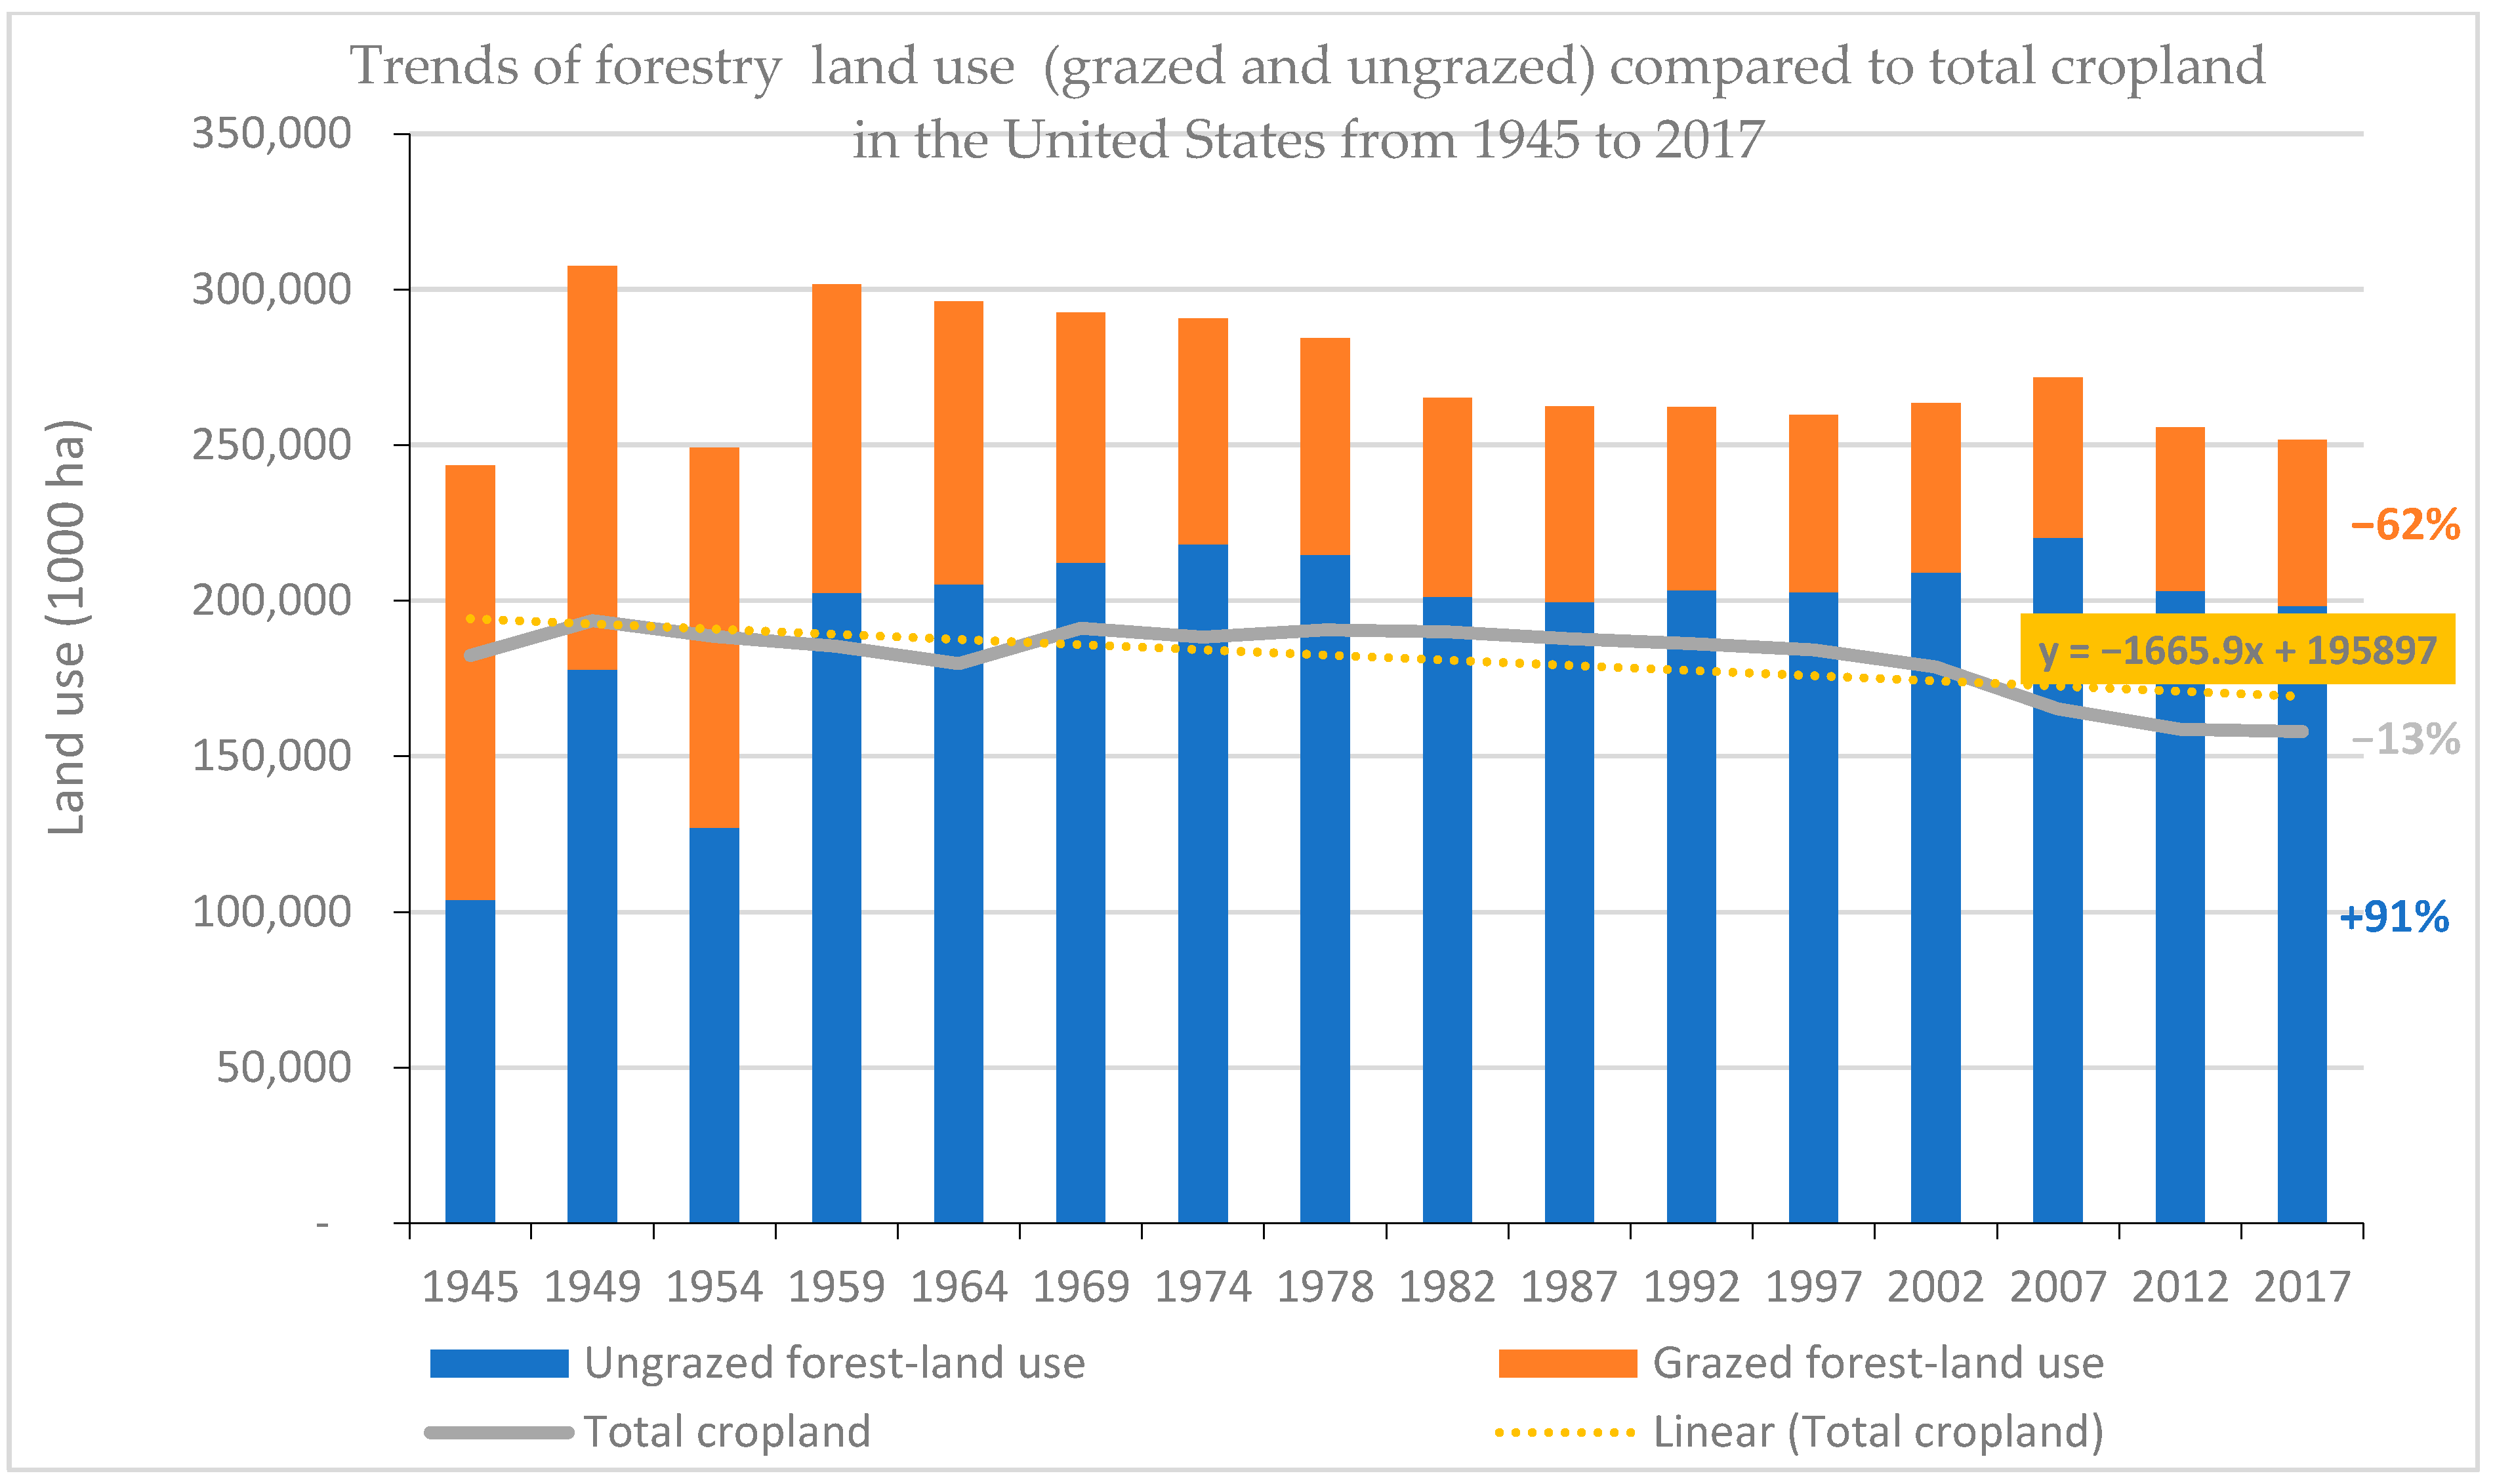
Forest-use land only includes commercial forest-use lands, such as grazed and ungrazed forest-use land. This excludes land that has forest cover but is used for other purposes, such as forestland in parks, wildlife areas, or other special uses [33]. Between 1945 and 2017, land allocated to forestry, both grazed and ungrazed, exhibited divergent long-term trends, while total cropland experienced a gradual decline over the same period (Figure 4).
In 1945, grazed forest land constituted a larger proportion of forestry land use than ungrazed forest land, and grazed forest land declined by approximately 62% over the study period, with the most noticeable reductions occurring after the 1970s. In contrast, ungrazed forest land increased by 91%, with sustained growth over the decades. By 2017, ungrazed forest areas had become the dominant form of forestry land use, indicating a major shift in land allocation practices within forested regions. Total cropland had decreased by approximately 13% by 2017 compared to 1945 levels (Figure 4).
Throughout the study period, the decline in total cropland paralleled the expansion of ungrazed forest land, particularly from the mid 1980s. Conversely, the sharp reduction in grazed forest land diverged from both the steady cropland decline and the increasing ungrazed forest cover. These findings reflect dynamic changes in land use priorities across rural landscapes in the United States from 1945 to 2017, with significant sustained increases in ungrazed forest land use, while grazed forest land and total cropland were reduced (Figure 4). Thus, the expansion of ungrazed forest areas may be contributing to the reduction in cropland. According to [38], changes in land use, including the reversion of croplands to forests, shrublands, or grasslands, have been a major factor in the reduction in cropland over the last 150 years. The study by Xie et al. [39] demonstrated that abandoned croplands in the U.S. have been repurposed into different land types, many of which now serve as either grazed or ungrazed areas. Approximately 18.6% of abandoned croplands shifted to shrubland and forest, reflecting a transition toward mostly ungrazed environments. Lawler et al. [30] highlighted that such changes enhance carbon sequestration and timber production, but also alter habitats, potentially impacting biodiversity. While policy measures encouraging forest growth and conservation can influence land use trends, they cannot completely counteract them. Lawler et al. suggest that more aggressive strategies are needed to substantially redirect land use patterns and mitigate their ecological consequences.
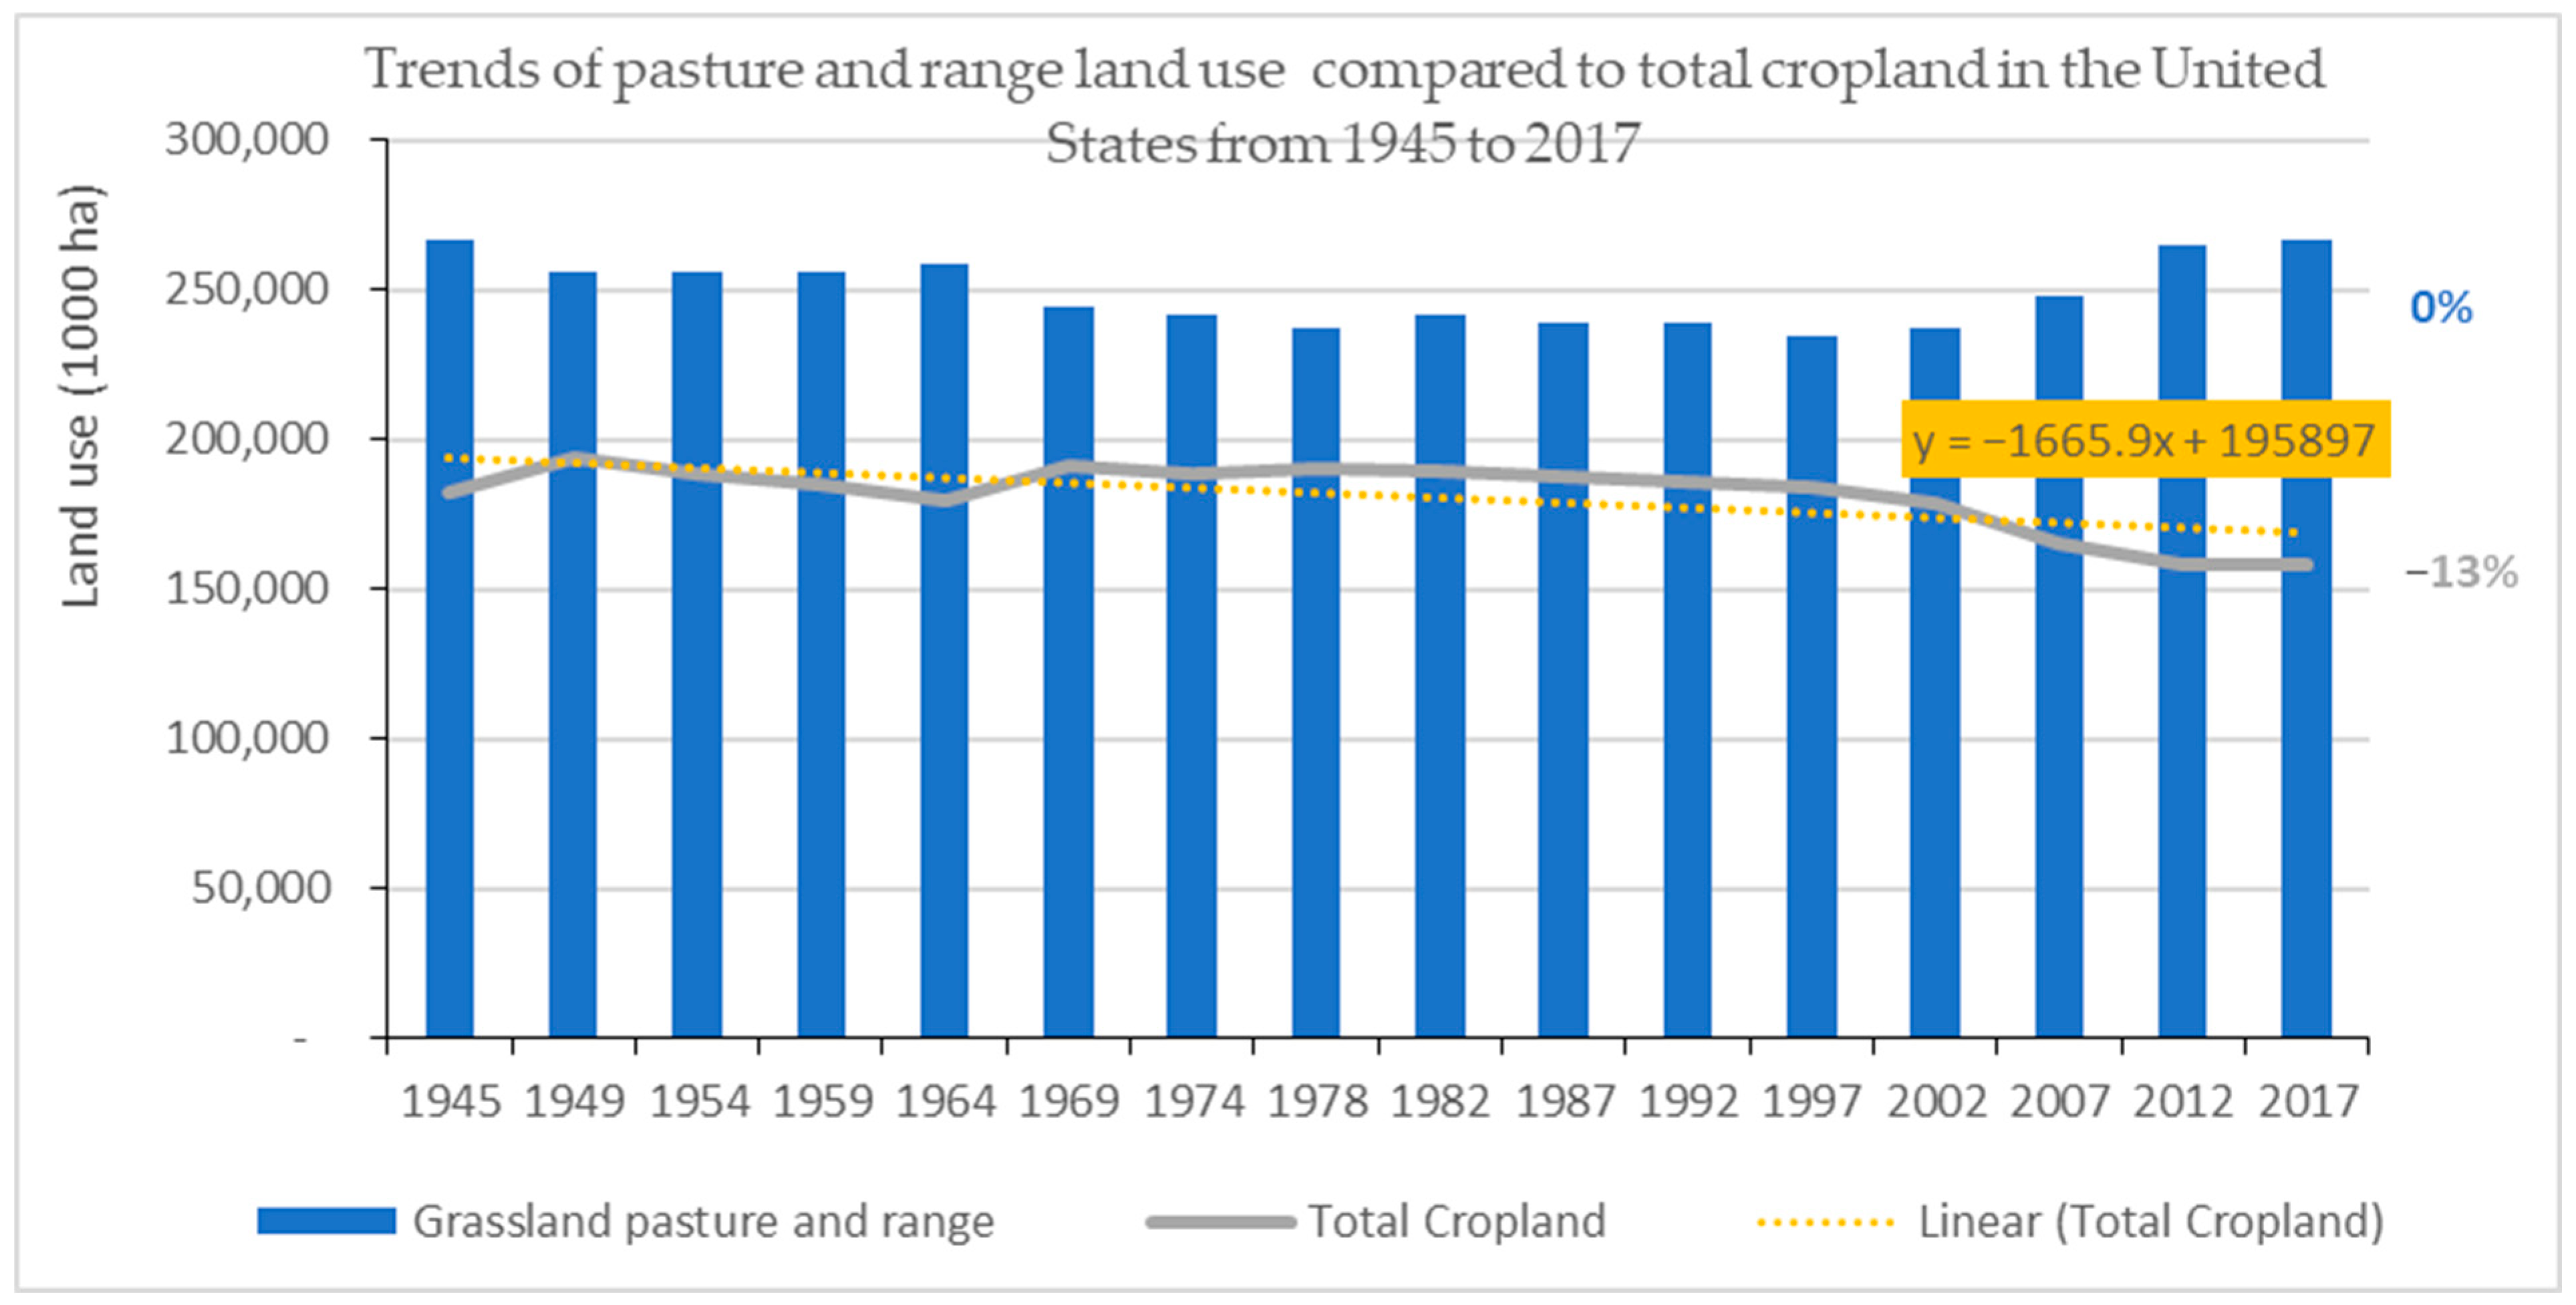
The dynamics between grazed and ungrazed land use mirror broader agricultural development trends, including both land use changes and shifting emphases in plant production systems [40]. Grazed forest area decreased, but this decline did not appear to affect cropland (Figure 4). Instead, there was a transition from forest grazing to pasture and rangeland, which experienced minor declines between the mid 1960s and early 2000s, followed by an upward shift from 2002 onward, returning to levels comparable to the 1945 baseline by 2017 (Figure 5).
Despite fluctuations in specific years, the overall pasture and range land use trend showed no net change (0%) from 1945 to 2017. However, comparative patterns revealed antagonistic trends, especially in the mid 1980s, where cropland decreased while grassland pasture and range land use began to recover. This divergence was more noticeable from 2002 to 2017 when grassland pasture and range land use increased, while cropland declined (Figure 5). This observed pattern can be attributed to the census reclassification processes in 2007 and 2012, wherein certain areas previously designated as cropland pasture were reassigned to permanent grassland pasture and rangeland categories, thereby influencing the apparent growth in total cropland during this period (Figure 1; [33,34]).
Several studies have documented the conversion of cropland to grassland pastures (grazed), which significantly impacts key ecosystem services, including carbon storage, supporting biodiversity, water purification, and agricultural productivity [30,39]. Furthermore, Lark et al. [41,42] have also demonstrated that other land uses, such as grassland conversion into cropland in the United States, intensive agricultural practices, and evolving land management strategies over the past three decades have influenced cropland and impacted ecosystem degradation.
Urbanization and Industrialization
The expansion of urban and industrial areas has driven U.S. cropland reduction by directly converting farmland to urban uses, economically marginalizing agricultural production, and altering land management practices in surrounding areas. This inverse relationship between urbanization and industrialization (increasing) and cropland (decreasing) is reflected in Figure 6 over the seven decades (1945–2017).
In 1945, land allocated to urban areas and defense/industrial purposes was minimal, with both categories combined representing a small proportion of the land use category. By 2017, land use in urban areas had increased by 395%, while land designated for defense and industrial areas rose by 13%. The most pronounced increase occurred in urban land use, which showed a consistent upward trend throughout the study period. By contrast, industrial and defense-related land use grew more modestly, stabilizing after the early 1990s.
Over this period, total cropland decreased by 13%, from a peak in the mid-20th century to lower levels in recent years. This decline coincided with the expansion of land for urban and industrial purposes, showing different land use trends. Overall, these results demonstrate a consistent increase in land used for urbanization, along with a smaller but steady growth in industrial land use, amid a gradual decrease in cropland area in the United States over the seven-decade study period.
Global population growth [28] coupled with urbanization and migration trends [37] is driving increased competition for land resources, particularly for housing, transportation networks, and industrial development. Research demonstrates that U.S. cropland loss stems largely from urban and industrial development. Liu et. al. [43] found agricultural lands being paved over for infrastructure, while a dryland cropping system study by Schillinger et al. [44] documented that conversion to residential and commercial uses collectively diminished farmland availability.
Some studies also found that urbanization is responsible for cropland decline through the economic marginalization of farmland. The economic impacts of urbanization, including escalating land prices and changing local economic bases, progressively marginalize farmland by decreasing agricultural profitability, particularly in peri-urban areas [43]. Other studies also highlighted an indirect cropland decline through reduced active management of agricultural lands. As shown by [45], increasing population density and decreasing distance from urban areas lead to abandonment of active management practices, resulting in either cropland loss or degradation. As shown by Clement et al. [46], urbanization fragments croplands into discontinuous patches, raising their vulnerability to abandonment or repurpose over time.

3.2.2. Agricultural Technology and Innovation Improvements

Figure 7, adopted from Fuglie et al. [29], and USDA data reveal distinct trends for total agricultural output, total factor productivity (TFP), and total farm inputs over the 70-year study period. Total agricultural output exhibited steady growth, increasing from an index value of 1.0 in 1948 to approximately 2.8 by 2018. In contrast, total farm inputs remained relatively stable, with only marginal fluctuations around the baseline (index range: 0.9–1.1). TFP demonstrated the most pronounced upward trend, rising from the baseline to an index value of 3.0 by 2018. Period-specific patterns show that from 1948 to the 1970s, output and TFP grew at comparable rates, while input remained stable. From the 1980s to 2018, TFP growth accelerated, whereas output increased moderately with declined input. The divergence between TFP and farm inputs suggests that productivity gains were driven primarily by technological advancements rather than increased resource use [2,28].
Several studies in the United States have observed that the relationship between technology and land use is complex and mediated by market forces, policy incentives, and demand trends [41,47,48]. Improved crop genetics, precision agriculture, enhanced mechanization, and better water management have all been recognized as major technological advancements in US agriculture [47]. These innovations have primarily resulted in increased crop yields per unit area, greater input efficiency (e.g., water, fertilizers), and the ability to cultivate less suitable or marginal lands. However, these improvements have not been directly linked to a reduction in cropland area. In some cases, higher productivity could theoretically reduce the need for additional cropland if demand is stable.
Improvements in agricultural technology and innovation, such as advanced machinery and precision agriculture, boost crop yields per hectare, which can reduce the total amount of arable land needed to sustain or increase production [49,50]. Technological advances enable more efficient use of inputs (like fertilizers and pesticides), allowing farmers to intensify production on existing land and potentially convert marginal cropland to other uses such as forestry or development [35]. The adoption of biotechnology and information control systems in agriculture supports higher productivity and can lead to a decline in cropland as less land becomes necessary to meet food demand [50].
Advancements in agricultural technology and innovation have boosted traditional crop yields, enabling more food to be produced on less land and contributing to the reduction in cropland in the United States [2]. Developments such as improved water management, increased efficient fertilizer application, and the adoption of high-yield seed varieties can substantially raise crop yields per hectare. As crop yields per hectare rise through technological innovation, less land is required to produce the same amount of food, resulting in overall cropland decline. This process, often linked with the “green revolution,” illustrates how land-efficient technical progress can lead to cropland decrease by making agriculture more land-efficient [51].
The Green Revolution during the 1960s appears to have positively influenced total cropland areas, leading to an expansion that remained steady until the Biotechnology Revolution in the 2000s [28]. Biotechnology introduced scientific breakthroughs, such as enhanced genetics, better pest and disease management, and improved crop resilience to environmental stresses, boosting productivity and yield per acre. These advancements may have contributed to the decline in total cropland area observed in the United States since the 2000s. Advances in biotechnology and enhanced crop varieties have increased agricultural productivity and resilience, enabling farmers to grow more food using less land, which has led to a reduction in total cropland area. Additionally, the adoption of sustainable farming methods, such as conservation agriculture, backed by modern innovations, improves soil health and resource efficiency, further reducing the need for extensive farmland [52,53].

3.2.3. Climate Change

Several studies linking cropland decline to climate change in the United States have been documented, especially in areas with extreme drought, heat, flood, erosion, and water availability [54]. A study by Crossley et al. [55] found that U.S. agriculture has undergone a dramatic spatial concentration of crop types, with most agricultural belts collapsing and crop diversity within counties declining. The number of counties producing each major crop and the total area devoted to those crops have declined by up to 97–98% since the mid 20th century, even as total production has increased through intensification. This spatial concentration is partly a response to environmental pressures, including those induced by climate change.
Climate change is projected to reduce cropland in the United States by increasing crop failures, which are particularly sensitive to higher spring and fall temperatures [56]. Warming temperatures and increased frequency of heat waves are projected to significantly decrease corn and soybean yields in the United States, leading to potential cropland decline under high-emissions scenarios (RCP 8.5) [57]. In the same study, the combined effects of heat extremes and changing CO2 levels create uncertainty in future crop productivity, highlighting the risk of cropland decline and the need for further research on these interactions.
Rising average temperatures due to climate change can shorten the growing season for many crops, leading to reduced yields and potential cropland decline [58]. In a similar context, Climate change can cause cropland decline in the United States by shifting optimal growing conditions for conventional crops like corn and wheat to more northerly latitudes, potentially reducing yields in traditional southern regions. Increased frequency of heat waves and changes in precipitation patterns can cause water scarcity and soil degradation, making some land less suitable for agriculture [58]. Schillinger et al. [44] also observed that environmental concerns, including soil degradation and water scarcity, have contributed to cropland decline as some areas become less suitable or sustainable for agriculture.

3.2.4. Government Economic Policies

The policies and priorities set by governments can affect cropland to some degree, particularly when they include financial incentives that promote environmental conservation. For example, in the U.S., programs like the Conservation Reserve Program (CRP) have contributed to the reduction in cropland. Launched in 1985, the CRP provided $1.7 billion in payments to farmers by 2005 [49]. The 1996 Farm Bill allowed farmers greater flexibility in crop selection, while the CRP encouraged them to retire cropland for conservation purposes. Over time, this program removed an area equivalent to Iowa’s total land area from agricultural production.
This government policy obviously influenced cropland area by shifting land toward conservation uses, delivering long-term ecological benefits such as preventing soil erosion, enhancing water quality, and supporting wildlife habitats [49]. However, enrollment in the CRP declined following the 2014 Farm Bill, which lowered the program’s maximum acreage from 32 million to 24 million by 2017 [59].
On the other hand, government policies can also expand cropland and agricultural acreage. For instance, the U.S. federal crop insurance program, which offers financial protection to farmers, may incentivize cultivation of marginal or ecologically vulnerable lands [49] rather than enrolling them in conservation programs like the CRP. Between 2000 and 2013, the area covered by this program grew from 83 million to 110 million hectares [59]. The competing effects of these two U.S. agricultural policies highlight how government decisions can directly impact cropland dynamics. Furthermore, trade and tariff policies also play a significant role, as they may either expand or reduce cropland depending on whether they strengthen or weaken farmers’ competitiveness in domestic and global markets.
Beyond domestic policy influences, global market forces have also played a role in shaping U.S. cropland trends. Research by Glauber and Effland [60] highlights how U.S. agricultural policies and budget allocations have failed to keep pace with evolving global market conditions, diminishing the sector’s competitive edge. Additionally, import-dependent regions like the Middle East and North Africa (MENA) have diversified their supply sources, prioritizing cost efficiency and reliability, leading to decreased dependence on U.S. crop exports. This shift has indirectly accelerated the reduction in domestic cropland [50].

3.2.5. Population Growth and Food Security

The human population is growing rapidly and is expected to reach 8.24 billion with a growth rate of 0.9% per year, which amounts to 70 million people annually based on 2025 data [61,62]. Urbanization is a clear example of how human population growth influences land use for agriculture. The relationship between population growth and land use change has complex interdependencies that require understanding for policy and planning to promote economic, environmental, and social sustainability [63]. Current rapid population growth, particularly in developing regions, has visibly strained land for housing, infrastructure, food production, and ecosystem services [63]. Managing population size, land use decisions, agricultural productivity, and environmental stewardship in an integrated manner is essential to securing food supply now and in the future. This approach should be guided by effective policy and partnerships.

4. Concluding Remarks

The long-term analysis of USDA data from 1945 to 2017 clearly shows a continuous decline in total cropland area across the United States that is consistent with the global trends driven by the global north, while the global south conversely recorded increased cropland [64]. This study clearly highlighted that the trend in cropland decline could be a food security issue in the future if not addressed. Several factors such as competing land uses, especially the growth of urban, industrial, transportation, recreational, and conservation areas, increasingly encroach on farmland and take away cropland that could affect food production and prices. Simultaneously, advances in agricultural innovation and technology could eliminate food security concerns even with declining cropland area by improving land and natural resource use efficiency and agricultural productivity. Moreover, climate variability has affected land suitability for agriculture. Additionally, shifts in government and state policies, including conservation programs and land reclassification, may have also played a role in cropland decline. This downward trend in cropland highlights the changing dynamics of U.S. agriculture, where gains in efficiency and economic shifts compensate agriculture food production and food security. However, the continuous population growth and climate effects in the long-term would require an integrated approach that ensures food security and environmental sustainability. Policymakers and stakeholders must carefully guide land use priorities to ensure the resilience and productivity of agriculture in the long-term. Strategic planning of new communities should factor in innovations such as circular communities that integrate food production and sustainable land management, which is crucial for balancing agricultural output for food security with competing land needs.
This study examined national-level trends; therefore, further research at the state and local scales is recommended. Such analyses could reveal the underlying drivers of cropland use dynamics and provide more context-specific insights to inform policy and decision-making, as national or global assessments may overlook important local details.

Author Contributions

Conceptualization, I.K.M.; methodology, I.K.M. and E.K.; validation, I.K.M. and E.K.; formal analysis I.K.M. and E.K.; investigation, I.K.M.; data curation I.K.M.; writing—original draft preparation, I.K.M.; writing—review and editing, E.K.; visualization, I.K.M. All authors have read and agreed to the published version of the manuscript.

Funding

This research was funded by Circular Plant Institute as part of regular contributions to science without any external funding.

Institutional Review Board Statement

Not applicable.

Informed Consent Statement

Not applicable.

Data Availability Statement

Data sources added to the main manuscript.

Acknowledgments

Thank God for life and strength. Also, thanks to the USDA team for their dedicated open-source data collection approach that made this research possible.

Conflicts of Interest

Isaac Kwadwo Mpanga is the Founder of Circular Planet Institute LLC. The remaining authors declare that the research was conducted in the absence of any commercial or financial relationships that could be construed as a potential conflict of interest.

References

  1. Lambin, E.F.; Geist, H.J.; Lepers, E. Dynamics of land-use and land-cover change in tropical regions. Annu. Rev. Environ. Resour. 2001, 28, 205–241. [Google Scholar] [CrossRef]
  2. USDA, Economic Research Services. Agricultural Productivity in the United States. 2024. Available online: https://www.ers.usda.gov/data-products/agricultural-productivity-in-the-united-states/summary-of-recent-findings (accessed on 22 March 2025).
  3. Waisanen, P.J.; Bliss, N.B. Changes in population and agricultural land in conterminous United States counties, 1790 to 1997. Glob. Biogeochem. Cycles 2002, 16, 84-1–84-19. [Google Scholar] [CrossRef]
  4. Brown, D.G.; Johnson, K.M.; Loveland, T.R.; Theobald, D.M. Rural land-use trends in the conterminous United States, 1950–2000. Ecol. Appl. 2005, 15, 1851–1863. [Google Scholar] [CrossRef]
  5. FAO. The State of the World’s Land and Water Resources for Food and Agriculture (SOLAW)—Managing Systems at Risk; FAO: Rome, Italy, 2011. [Google Scholar]
  6. Sorensen, A.; Freedgood, J.; Dempsey, J.; Theobald, D. Farms Under Threat: The State of America’s Farmland; American Farmland Trust: Washington, DC, USA, 2018. [Google Scholar]
  7. D’Odorico, P.; Carr, J.A.; Laio, F.; Ridolfi, L.; Vandoni, S. Feeding humanity through global food trade. Earth’s Future 2014, 2, 458–469. [Google Scholar] [CrossRef]
  8. Lark, T.J.; Spawn, S.A.; Bougie, M.; Gibbs, H.K. Cropland expansion in the United States produces marginal yields at high costs to wildlife. Nat. Commun. 2020, 11, 4295. [Google Scholar] [CrossRef]
  9. Lark, T.J.; Hendricks, N.P.; Smith, A.; Pates, N.; Spawn-Lee, S.A.; Bougie, M.; Booth, E.G.; Kucharik, C.J.; Gibbs, H.K. Environmental outcomes of the US Renewable Fuel Standard. Proc. Natl. Acad. Sci. USA 2022, 119, e2101084119. [Google Scholar] [CrossRef]
  10. Durán, A.P.; Duffy, J.; Gaston, K.J. Exclusion of agricultural lands in spatial conservation prioritization strategies: Consequences for biodiversity and ecosystem service representation. Proc. R. Soc. B Boil. Sci. 2014, 281, 20141529. [Google Scholar] [CrossRef]
  11. Scherr, S.J.; McNeely, J.A. Biodiversity conservation and agricultural sustainability: Towards a new paradigm of ‘ecoagriculture’ landscapes. Philos. Trans. R. Soc. B Biol. Sci. 2007, 363, 477–494. [Google Scholar] [CrossRef] [PubMed]
  12. Mpanga, I.K.; Neumann, G.; Schuch, U.K.; Schalau, J. Sustainable Agriculture Practices as a Driver for Increased Harvested Cropland Among Large-scale Growers in Arizona: A Paradox for Small-scale Growers. Adv. Sustain. Syst. 2020, 4, 1900143. [Google Scholar] [CrossRef]
  13. USDA—ERS. Farming and Farm Income. 2025. Available online: https://www.ers.usda.gov/data-products/ag-and-food-statistics-charting-the-essentials/farming-and-farm-income (accessed on 10 September 2025).
  14. Radeloff, V.C.; Helmers, D.P.; Kramer, H.A.; Mockrin, M.H.; Alexandre, P.M.; Bar-Massada, A.; Butsic, V.; Hawbaker, T.J.; Martinuzzi, S.; Syphard, A.D. Rapid growth of the US wildland-urban interface raises wildfire risk. Proc. Natl. Acad. Sci. USA 2018, 115, 3314–3319. [Google Scholar] [CrossRef] [PubMed]
  15. Foley, J.A.; Defries, R.; Asner, G.P.; Barford, C.; Bonan, G.; Carpenter, S.R.; Snyder, P.K. Global consequences of land use. Science 2005, 309, 570–574. [Google Scholar] [CrossRef] [PubMed]
  16. Seto, K.C.; Güneralp, B.; Hutyra, L.R. Global forecasts of urban expansion to 2030 and direct impacts on biodiversity and carbon pools. Proc. Natl. Acad. Sci. USA 2012, 109, 16083–16088. [Google Scholar] [CrossRef]
  17. United Nations, Department of Economic and Social Affairs. Population Division (2019). World Population Prospects; Comprehensive Tables; United Nations: New York, NY, USA, 2019; Volume I.
  18. Angel, S.; Parent, J.; Civco, D.L.; Blei, A.; Potere, D. The dimensions of global urban expansion: Estimates and projections for all countries, 2000–2050. Prog. Plan. 2011, 75, 53–107. [Google Scholar] [CrossRef]
  19. Seto, K.C.; Fragkias, M.; Güneralp, B.; Reilly, M.K. A Meta-Analysis of Global Urban Land Expansion. PLoS ONE 2011, 6, e23777. [Google Scholar] [CrossRef] [PubMed]
  20. Huang, Q.; Liu, Z.; He, C.; Gou, S.; Bai, Y.; Wang, Y.; Shen, M. The occupation of cropland by global urban expansion from 1992 to 2016 and its implications. Environ. Res. Lett. 2020, 15, 084037. [Google Scholar] [CrossRef]
  21. Bren D’Amour, C.; Reitsma, F.; Baiocchi, G.; Barthel, S.; Güneralp, B.; Erb, K.-H.; Haberl, H.; Creutzig, F.; Seto, K.C. Future urban land expansion and implications for global croplands. Proc. Natl. Acad. Sci. USA 2017, 114, 8939–8944. [Google Scholar] [CrossRef] [PubMed]
  22. Chen, G.; Li, X.; Liu, X.; Chen, Y.; Liang, X.; Leng, J.; Xu, X.; Liao, W.; Qiu, Y.; Wu, Q. Global projections of future urban land expansion under shared socioeconomic pathways. Nat. Commun. 2020, 11, 537. [Google Scholar] [CrossRef] [PubMed]
  23. IPCC. Climate Change (2014): Synthesis Report. Contribution of Working Groups I, II and III to the Fifth Assessment Report of the Intergovernmental Panel on Climate Change; IPCC: Geneva, Switzerland, 2014. [Google Scholar]
  24. Hansen, J.; Sato, M.; Ruedy, R. Global temperature in 2017. Earth Space Sci. 2018, 5, 40–46. [Google Scholar]
  25. Myers, N. Environmental refugees: A growing phenomenon of the 21st century. Philos. Trans. R. Soc. B Biol. Sci. 2002, 357, 609–613. [Google Scholar] [CrossRef]
  26. Xie, Y.; Spawn-Lee, S.A.; Radeloff, V.C.; Yin, H.; Robertson, G.P.; Lark, T.J. Cropland abandonment between 1986 and 2018 across the United States: Spatiotemporal patterns and current land uses. Environ. Res. Lett. 2024, 19, 044009. [Google Scholar] [CrossRef]
  27. Mpanga, I.K.; Omololu, J.I. A decade of irrigation water use trends in Southwest USA: The role of irrigation technology, best management practices, and outreach education programs. Agric. Water Manag. 2021, 243, 106438. [Google Scholar] [CrossRef]
  28. Turner, B.L.; Lambin, E.F.; Reenberg, A. The emergence of land change science for global environmental change and sustainability. Proc. Natl. Acad. Sci. USA 2007, 104, 20666–20671. [Google Scholar] [CrossRef]
  29. Fuglie, K.; Jelliffe, J.; Morgan, S. Slowing Productivity Reduces Growth in Global Agricultural Output; USDA, Economic Research Service: Washington, DC, USA, 2024.
  30. Lawler, J.J.; Lewis, D.J.; Nelson, E.; Plantinga, A.J.; Polasky, S.; Withey, J.C.; Helmers, D.P.; Martinuzzi, S.; Pennington, D.; Radeloff, V.C. Projected land-use change impacts on ecosystem services in the United States. Proc. Natl. Acad. Sci. USA 2014, 111, 7492–7497. [Google Scholar] [CrossRef]
  31. Spangler, K.; Burchfield, E.K.; Schumacher, B. Past and Current Dynamics of U.S. Agricultural Land Use and Policy. Front. Sustain. Food Syst. 2020, 4, 98. [Google Scholar] [CrossRef]
  32. USDA—ERS. Major Land Uses. Major Land Uses | Economic Research Service. 2025. Available online: https://www.ers.usda.gov/data-products/major-land-uses (accessed on 20 April 2025).
  33. Winters-Michaud, C.; Haro, A.; Callahan, S.; Bigelow, D.P. Major Uses of Land in the United States, 2017 (Report No. EIB-275); U.S. Department of Agriculture, Economic Research Service: Washington, DC, USA, 2024.
  34. Bigelow, D.; Borchers, A. Major Uses of Land in the United States, 2012 (Report No. EIB-178); U.S. Department of Agriculture, Economic Research Service: Washington, DC, USA, 2017.
  35. Nickerson, C.; Ebel, R.; Borchers, A.; Carriazo, F. Major Land Uses in the United States, 2007; Economic Research Service, Economic Information Bulletin 89; U.S. Department of Agriculture: Washington, DC, USA, 2011.
  36. USDA—ERS. Population and Migration. 2025. Available online: https://www.ers.usda.gov/topics/rural-economy-population/population-migration (accessed on 10 September 2025).
  37. Farrigan, T.; Genetin, B.; Sanders, A.; Pender, J.; Thomas, K.L.; Winkler, R.; Cromartie, J. Rural America at a Glance: 2024 Edition (Report No. EIB-282); U.S. Department of Agriculture, Economic Research Service: Washington, DC, USA, 2024.
  38. Cao, Y.; Zhou, Z.; Liao, Q.; Shen, S.; Wang, W.; Xiao, P.; Liao, J. Effects of landscape conservation on the ecohydrological and water quality functions and services and their driving factors. Sci. Total Environ. 2023, 861, 160695. [Google Scholar] [CrossRef] [PubMed]
  39. Xie, Y.; Hunter, M.; Sorensen, A.; Nogeire-McRae, T.; Murphy, R.; Suraci, J.P.; Lischka, S.; Lark, T.J. U.S. Farmland under Threat of Urbanization: Future Development Scenarios to 2040. Land 2023, 12, 574. [Google Scholar] [CrossRef]
  40. Belous, N.M.; Vaskin, V.F.; Kuzmitskaya, A.A.; Kubyshkin, A.V.; Schmidt, Y.I. Dynamics of crop production and rational use of agricultural lands. In Proceedings of the IOP Conference Series: Earth and Environmental Science, Krasnoyarsk, Russia, 17–19 November 2021; IOP Publishing: Bristol, UK, 2022; Volume 981, p. 042009. [Google Scholar] [CrossRef]
  41. Lark, T.J.; Salmon, J.M.; Gibbs, H.K. Cropland expansion outpaces agricultural and biofuel policies in the United States. Environ. Res. Lett. 2015, 10, 044003. [Google Scholar] [CrossRef]
  42. Spawn, S.A.; Lark, T.J.; Gibbs, H.K. Carbon emissions from cropland expansion in the United States. Environ. Res. Lett. 2019, 14, 045009. [Google Scholar] [CrossRef]
  43. Liu, J.; Zeng, S.; Ma, J.; Chang, Y.; Sun, Y.; Chen, F. The Impacts of Rapid Urbanization on Farmland Marginalization: A Case Study of the Yangtze River Delta, China. Agriculture 2022, 12, 1276. [Google Scholar] [CrossRef]
  44. Schillinger, W.F.; Papendick, R.I.; Guy, S.O.; Rasmussen, P.E.; Van Kessel, C. Dryland Cropping in the Western United States: Dryland Agriculture. In Agronomy Monograph No. 23, 2nd ed.; American Society of Agronomy: Madison, MI, USA; Crop Science Society of America: Madison, MI, USA; Soil Science Society of America Journal: Madison, MI, USA, 2006. [Google Scholar] [CrossRef]
  45. Munn, I.A.; Barlow, S.A.; Evans, D.L.; Cleaves, D. Urbanization’s impact on timber harvesting in the south central United States. J. Environ. Manag. 2002, 64, 65–76. [Google Scholar] [CrossRef]
  46. Clement, M.T.; Chi, G.; Ho, H.C. Urbanization and Land-Use Change: A Human Ecology of Deforestation Across the United States, 2001–2006. Sociol. Inq. 2015, 85, 628–653. [Google Scholar] [CrossRef]
  47. Crookston, R.K. A Top 10 List of Developments and Issues Impacting Crop Management and Ecology During the Past 50 Years. Crop Sci. 2006, 46, 2253–2262. [Google Scholar] [CrossRef]
  48. Hanson, J.D.; Hendrickson, J.; Archer, D. Challenges for maintaining sustainable agricultural systems in the United States. Renew. Agric. Food Syst. 2008, 23, 325–334. [Google Scholar] [CrossRef]
  49. Lubowski, R.N.; Bucholtz, S.; Claassen, R.; Roberts, M.; Cooper, J.; Gueorguieva, A.; Johansson, R. Environmental Effects of Agricultural Land-Use Change: The Role of Economics and Policy; ERR-25; U.S. Department of Agriculture, Economic Research Service: Washington, DC, USA, 2006.
  50. USDA. 2023. Available online: www.ers.usda.gov/data-products/chart-gallery/gallery/chart-detail/?chartId=106637 (accessed on 10 September 2025).
  51. Stone, B. Developments in Agricultural Technology; Cambridge University Press: Cambridge, UK, 1988. [Google Scholar] [CrossRef]
  52. Food and Agriculture Organization (FAO). Scaling Conservation Agriculture: Policy Implications for Climate-Resilient Farming; FAO: Rome, Italy, 2021. [Google Scholar]
  53. Mpanga, I.K.; Schuch, K.U.; Schalau, J. Adaptation of resilient regenerative agricultural practices by small-scale growers towards sustainable food production in north-central Arizona. Curr. Res. Environ. Sustain. 2021, 3, 100067. [Google Scholar] [CrossRef]
  54. Chimwamurombe, P.M.; Mataranyika, P.N. Factors influencing dryland agricultural productivity. J. Arid. Environ. 2021, 189, 104489. [Google Scholar] [CrossRef]
  55. Crossley, M.S.; Burke, K.D.; Schoville, S.D.; Radeloff, V.C. Recent collapse of crop belts and declining diversity of US agriculture since 1840. Glob. Change Biol. 2021, 27, 151–164. [Google Scholar] [CrossRef]
  56. Kim, S.M.; Mendelsohn, R. Climate change to increase crop failure in U.S. Environ. Res. Lett. 2023, 18, 014014. [Google Scholar] [CrossRef]
  57. Petersen, L.K. Impact of Climate Change on Twenty-First Century Crop Yields in the U.S. Climate 2019, 7, 40. [Google Scholar] [CrossRef]
  58. Baskaran, R.; Karunakaran, V.; Pandiyan, M. Climate change on crop production. J. Pharmacogn. Phytochem. 2019, SP2, 744–748. [Google Scholar]
  59. USDA—ERS. Risk Management—Risk in Agriculture. 2025. Available online: https://www.ers.usda.gov/topics/farm-practices-management/risk-management/risk-in-agriculture (accessed on 20 April 2025).
  60. Glauber, J.W.; Effland, A. United States Agricultural Policy: Its Evolution and Impact (20 July 2016). IFPRI Discussion Paper 1543. Available online: https://ssrn.com/abstract=2813385 (accessed on 10 September 2025).
  61. Worldometer. World Population Clock: 8.24 Billion People. 2025. Available online: https://www.worldometers.info/world-population/ (accessed on 10 August 2025).
  62. United Nations. World Population Prospects. Department of Economic and Social Affairs, Population Division. 2024. Available online: https://population.un.org/wpp/ (accessed on 10 August 2025).
  63. Yadav, A.; Yadav, T.K. Study of population growth and land use change impacts on socio economic conditions. Int. J. Innov. Res. Anal. (IJIRA) 2024, 4, 258–262. [Google Scholar]
  64. Fuglie, K.; Morgan, S.; Jelliffe, J. World Agricultural Production, Resource Use, and Productivity, 1961–2020; EIB-268; U.S. Department of Agriculture, Economic Research Service: Washington, DC, USA, 2024.
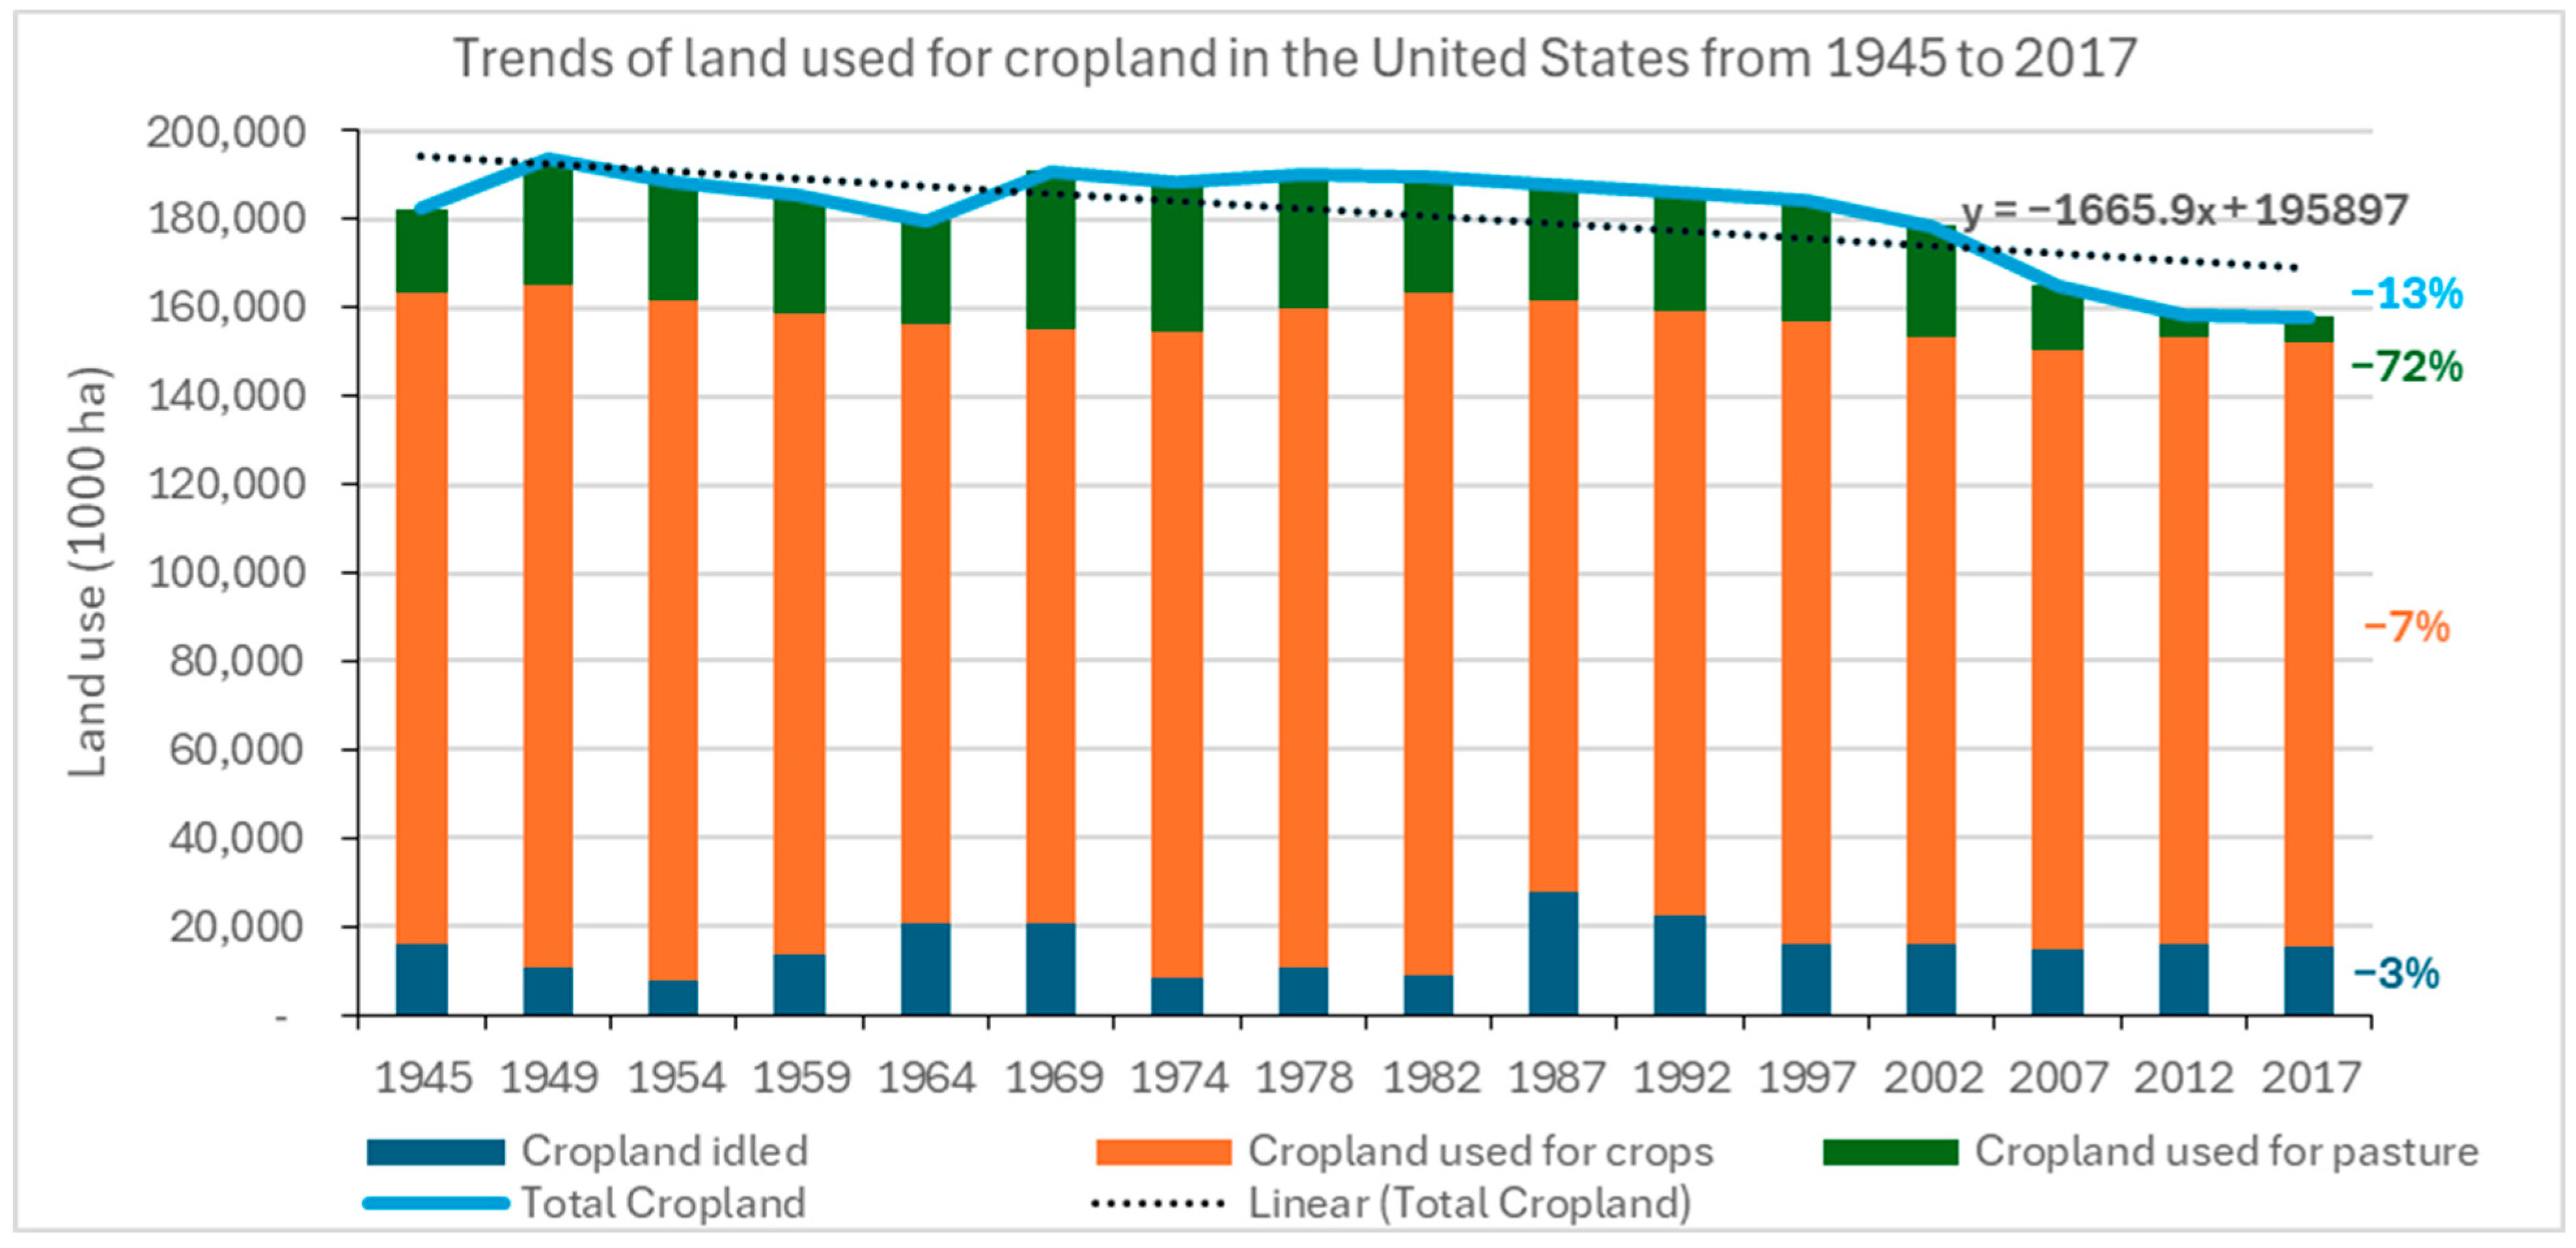
Figure 1. Cropland use trends in the United States from 1945 to 2017. The percentage number on the right side of the figure represents a change between 1945 and 2017. Note that the drastic decline in total cropland between 2002 and 2012 is partly due to methodological changes in the 2007 and 2012 Censuses of Agriculture that reclassified some cropland pasture as permanent grassland pasture and range land.
Sustainability 17 08352 g001
Figure 2. Rural American land use trends from 1945 to 2017 as a driver for declining cropland area. The percentage number on the right side of the figure represents a change between 1945 and 2017.
Sustainability 17 08352 g002
Figure 3. Farmstead and other miscellaneous land use trends in the U.S. from 1945 to 2017 as a driver for declining cropland area. The percentage number on the right side of the figure represents a change between 1945 and 2017.
Sustainability 17 08352 g003
Figure 4. Ungrazed and grazed forest land use trends in the U.S. from 1945 to 2017 as a driver for declining cropland area. The percentage number on the right side of the figure represents a change between 1945 and 2017.
Sustainability 17 08352 g004
Figure 5. Pasture and range land use trends in the U.S. from 1945 to 2017 as a driver for declining cropland area. The percentage number on the right side of the figure represents a change between 1945 and 2017. Note that the drastic decline in total cropland between 2002 and 2012 is partly due to methodological changes in the 2007 and 2012 Censuses of Agriculture that reclassified some cropland pasture into permanent grassland pasture and range land leading, hence the increase in 2012 (Figure 1; [33,34]).
Sustainability 17 08352 g005
Figure 6. Urban and industrial land use trends in the U.S. from 1945 to 2017 as a driver for declining cropland area. The percentage number on the right side of the figure represents a change between 1945 and 2017.
Sustainability 17 08352 g006
Figure 7. U.S. agricultural inputs, outputs, and total productivity from 1948 to 2021 (Adopted and modified from USDA, Economic Research Services [2]). Overlay of global agricultural technology revolutions in the 1960s and 2000s adopted from [28,29].
Sustainability 17 08352 g007
Table 1. Land use types and their sub-categories in the United States based on the Census of Agriculture by the United States Department of Agriculture (USDA) (Adopted from Winters-Michaud et al. [33]).
Land Use TypesSub-Categories of Land Use
Crop landCropland used for crops
Cropland idle
Cropland used for pasture
Farmstead, roads and miscellaneous landFarmsteads and roads
Other miscellaneous land
Rural landLand in rural parks and wildlife areas
Land used in rural transportation facilities
Urban and industrial landLand in urban areas
Land in defense and industrial areas
Forest and pasturelandUngrazed forest-land use
Grazed forest-land use
Grassland pasture and range
Disclaimer/Publisher’s Note: The statements, opinions and data contained in all publications are solely those of the individual author(s) and contributor(s) and not of MDPI and/or the editor(s). MDPI and/or the editor(s) disclaim responsibility for any injury to people or property resulting from any ideas, methods, instructions or products referred to in the content.