Abstract
As the urgency of climate action intensifies, organizations are increasingly required not only to reduce their instantaneous internal emissions (Scopes 1 and 2) and their value chain impacts (Scope 3), but also to demonstrate their overall contribution to climate change. Therefore, this paper introduces and formalizes the concept of Scope 4 emissions, defined as avoided emissions enabled by a company’s products, services, or business models, representing the fourth strategic pillar in corporate climate accounting. The paper proposes how to quantify the Scope 4 emissions through the decarbonization plan, using a stadium decarbonization plan as an illustrative example to show how Scope 1–3 reductions can be complemented by cumulative Scope 4 impacts, the advantages of undertaking proactive approaches toward sustainability and proposing the concept of relative carbon neutrality. Finally, the paper connects the Scope 4 emissions with ESG factors, highlights possible risks and challenges associated with its computation, and inviting regulators and policy makers to devise new Scope 4-based policies and incentives needed when considering the directives’ dynamics (e.g., the Omnibus Package).
1. Introduction
The worldwide need to deal with climate change issues has elevated the importance of greenhouse gas (GHG) emissions to the forefront of corporate responsibility, regulatory compliance, and environmental strategy. As scientific certainty regarding human-caused climate change increases, the necessity for valid and pertinent emissions accounting becomes more pressing [1]. Organizations are asked not only to cut their emissions, but they are also obliged to make them publicly known to stakeholders. Therefore, GHG accounting has taken a key position in ESG assessments, climate risk reporting, and corporate decarbonization strategies [2].
The GHG Protocol is the most common standard for reporting emissions, and it divides emissions into three scopes. Scope 1 is direct emissions from sources owned or controlled by the company reporting, like onsite fuel combustion; Scope 2 is indirect emissions from the production of bought electricity, steam, heating, and cooling, while Scope 3 includes all other indirect emissions throughout the value chain, including supplier emissions, logistics, customer product use, and end-of-life disposal [3]. As far as this tripartite system allows for an exhaustive inventory of emissions, it also demonstrates profound challenges, especially under Scope 3, where data availability, methodological differences, and attribution disputes compromise reporting integrity [4].
Although being helpful for accounting operational and value chain effects, this conventional framework effectively overlooks the possibility of accounting for emissions avoided—emissions that a company avoids after starting the journey toward sustainability. These emissions, hereby named Scope 4 (avoided) emissions, represent a category still not elaborated within mainstream GHG reporting but increasingly prominent for research and climate innovation policy [5].
Hence, the purpose of this paper is to develop theory and practice behind the concept of Scope 4, which is a complementary concept to Scopes 1, 2, and 3. Instead of focusing on a company’s own business or supply chain carbons obligations, Scope 4 is interested in the inquiry of what emissions have been avoided overall. Accordingly, Scope 4 diverts emissions accounting from a backward-looking metric of damage to a forward-looking metric of climate contribution. Therefore, this paper has a two-fold contribution. Firstly, it contributes theoretically by integrating current academic literature on avoided emissions, indirect climate effects, and attribution complexity into a consistent framework for Scope 4. Secondly, it contributes practically by suggesting a step-by-step approach to measure Scope 4 emissions in addition to conventional scopes. The proposed framework is cross-sector and allows companies to account for their contribution to systems-level decarbonization initiatives.
Additionally, this paper places Scope 4 as a strategic facilitator of business climate action and the ability to inform investment portfolios, innovation pipelines, and stakeholder engagement. With avoided emission measurement, companies can more closely align with Science-Based Targets, make their communication toward climate change more robust and transparent. Yet, such an opportunity is not risk-free: inflated baselines, rebound effects, double-counting, and questionable attribution can erode credibility if not managed carefully. To mitigate these dangers, we outline a methodological framework and apply it on a business case. Apart from its environmental relevance, Scope 4 has social and governance implications for ESG. From a social point of view, achieving emissions savings translates into cleaner air, public health, and fair access to sustainable alternatives—benefits whose incidence disproportionately affects vulnerable groups [6]. From a governance point of view, monitoring and reporting Scope 4, requires strong data governance, value chain collaboration, and disclosure transparency, thus underpinning a firm’s ESG credentials beyond carbon footprinting [7]. These implications highlight the need for ad hoc policies and incentives based on the Scope 4 (avoided) emissions.
The rest of the paper is organized as follows. Section 2 gives a review of the literature on emissions accounting and climate reporting standards, and Section 3 derives the new notion of Scope 4 (avoided) emissions and formulates the methodological framework for Scope 4, delineating major steps like definition of functional unit, baseline scenario development, and attribution modeling. Section 4 illustrates this model with a real-case example—the decarbonization of a stadium—how Scope 4 can be quantified and illustrated in conjunction with Scopes 1–3. Section 5 addresses policy implications, Section 6 introduces risks and challenges related to Scope 4 while Section 7 connects the Scope 4 to factors “S” and “G” of ESG. Section 8 introduces the theoretical contributions of this work while Section 9 concludes by indicating areas of further research and proposing a roadmap for bringing Scope 4 into mainstream corporate sustainability practice.
2. Literature Review
The GHG Protocol, along with new regulatory demands such as the Corporate Sustainability Reporting Directive (CSRD) and emerging international modification (e.g., Omnibus package) disclosure standards, has made calculating and reporting Scope 1, 2, and 3 emissions the cornerstone of the corporate climate action [3,8]. Scope 1 emissions are an organization’s direct greenhouse gas (GHG) emissions resulting from sources that are owned or directly controlled. They take place as a direct consequence of operations like fuel combustion, chemical processing, and other on-site activities. These emissions are the most controllable and immediate type of emissions under the control of an organization [9]. In line with the GHG Protocol principles of relevance, completeness, consistency, transparency, and accuracy, the final accounting has to be supported by documentation explaining data sources, assumptions, emission factors, and exclusions or estimates used. Ideally, accounting is also third-party-assured and reviewed internally, especially if the results are to be used for external reporting, target-setting (e.g., under the Science Based Targets initiative), or compliance with regulatory schemes like the EU Emissions Trading System [10]. Finally, accounting Scope 1 seeks to demonstrate the firm’s level of responsibility to decrease the direct emissions, although the less stringent obligations contemplated in the directives’ modifications like the Omnibus package can push companies to step back from their obligations, while negatively impacting on their reputation due to perceiving sustainability like compliance rather than as a true commitment.
Since Scope 1 emissions consist of numerous various greenhouse gases—not just carbon dioxide (CO2) but also methane (CH4), nitrous oxide (N2O), and hydrofluorocarbons (HFCs), etc.—each must be transformed into its carbon dioxide equivalent (CO2e). This is done through the recognition of the notion of Global Warming Potential (GWP), the comparative climate effect of one unit of a given gas to one unit of CO2 over a time horizon, typically 100 years. The GWP of methane is about 27–30, and that of nitrous oxide is about 273 (as per the IPCC Sixth Assessment Report) [1]. Each gas’s emissions are scaled by its GWP to calculate CO2e, allowing aggregation by gas type.
Scope 2 emissions are indirect GHG emissions from the production of purchased energy—mostly electricity, steam, heating, and cooling—that an organization uses when running its “core” operations and activities [11]. Although these emissions take place in the energy producer’s facilities, they are accounted for by the organization purchasing and using the energy since the demand for these sources causes the impact, which is counted in the firms’ reporting. Though the company itself is not directly accountable for the energy generation process, it can greatly influence by what sources of energy it procures—e.g., by shifting to renewable electricity, enhancing energy efficiency, or through power purchase agreements (PPAs) for clean energy [12]. Importantly, Scope 2 emissions are the only category of indirect emissions that are mandatorily reported under the GHG Protocol, and it is a critical connection between the direct business operations effects (Scope 1) of a firm and its value chain emissions (Scope 3).
Scope 2 emissions calculation encompasses a standardized and stringent methodology comprising the determination of energy purchases, gathering consumption data, choosing emission factors, using transparent reporting. These steps all help form a verifiable and confirmed emissions inventory in accordance with well-known international standards, such as the Carbon Disclosure Project (CDP), the Science Based Targets initiative (SBTi), and national reporting requirements [13]. GHG Protocol mandates that organizations measure Scope 2 emissions through two complementary accounting methods: the location-based method and the market-based method. The first is the average emission intensity of the grid in the geographical region in which the energy is being consumed. It makes the assumption that the company has no control over the creation of the electricity and applies only a default average grid emission factor, usually issued by national governments or energy authorities. The second, on the other hand, is the emissions from the actual electricity purchases made by a firm, particularly when the company has procured low-carbon or renewable power. As usual, the emissions for both the approaches are calculated by multiplying the energy consumed by the respective emission factor (e.g., Scope 2 Emissions (kg CO2e) = Energy consumed (kWh) × Emission factor (kg CO2e/kWh)). Since electricity generation is likely to lead to emissions of more than one GHG (CO2, CH4, and N2O), the emission factors used are likely to be combined and represented in CO2e to represent the overall climate effect [14].
Finally, Scope 3 emissions are all the other indirect greenhouse gas (GHG) emissions that arise from an organization’s operations, but from sources that the organization does not own or control. They cover the whole value chain, both upstream (prior to a product entering an organization) and downstream (after the product has left an organization), and typically account for most of a company’s overall carbon footprint [4]. Though these emissions occur from sources not owned or directly controlled by the organization, they are caused by its activities, decisions, and presence in the market, and thus fall within its control and responsibility. For the majority of companies—particularly consumer goods, transportation, technology, and services—Scope 3 emissions comprise the largest share of overall GHG emissions, typically 70% to 90% of their carbon footprint [15].
Currently, Scope 3 emissions are under- or mis-measured because of the methodological and data challenges of tracking emissions through extensive and often opaque supply chains and diversified end-use patterns [16]. In order to bring methodological simplicity, Scope 3 has been divided into 15 various categories that fall under upstream and downstream activities. The upstream Scope 3 emissions are all indirect emissions that take place before the reporting company’s control of a product or service. These impacts are products and services purchased, capital goods, fuel- and energy-related activities (excluding Scope 1 and 2), transport and distribution upstream, waste in operations, business travel, commuting by employees, and upstream leased assets. The downstream Scope 3 emissions, however, occur after a product or service has crossed the control of the reporting company and include: downstream transportation and distribution, processing of sold products, use of sold products, end-of-life treatment of sold products, downstream leased assets, franchises, and investments.
Scope 3 emissions calculation starts with a screening analysis to identify what 15 categories are relevant and material to the business. Not every category will be material to every company, and the GHG Protocol suggests prioritizing on the basis of materiality, data availability, and stakeholder expectations [17]. Having chosen relevant categories, the business will need to gather activity data, such as volumes purchased or business trips taken. Among the greatest challenges to Scope 3 emissions estimation is the challenge of obtaining accurate, first-hand information from value chain partners, especially suppliers. Supply chain intricacy and geographic spread, and the lack of standard environmental disclosure conventions among upstream and downstream counterparts all typically make it impossible for companies to use direct emissions information alone. While the 2025 Omnibus Package has suggested several step backs regarding the Scope 3 emissions (e.g., accounting for the emissions generated by the direct suppliers in the upstream and in the downstream of the chain), the GHG Protocol suggests a hierarchy of acceptable methodological frameworks for scope 3 emission estimation. At the pinnacle of this hierarchy is the supplier-specific method, which entails the application of confirmed actual GHG emissions from specific suppliers achieved through the use of life cycle assessment (LCA) or environmental product declarations (EPDs) [6]. Differently, the hybrid approach is a pragmatic trade-off between accuracy and feasibility since it blends partial supplier-specific information with secondary data, i.e., industry averages, proxy models, or generic emission factors. This approach is most helpful when companies have useful activity data (e.g., amounts of a particular material purchased) but no supplier-level emissions data. Furthermore, the average data method relies exclusively on secondary data, i.e., average emission factors from industry-wide LCAs or environmental databases in the public domain. Lastly, the spend-based approach is the lowest tier in the hierarchy and the least accurate method. It calculates the emissions through the use of financial spending data multiplied by economic input-output (EIO) emission factors, where EIO emission factors are average emissions per unit of money spent in a particular sector or industry [18].
Research and Theoretical Gap
Other than Scopes 1, 2, and 3 that cover GHG emissions that are caused by or linked to an organization’s operations, supply chain, and products, there are GHG emissions resulting “avoided” due to the activities, products, or influence of an organization. These are counterfactual emissions, i.e., those that would have taken place in a business-as-usual circumstance but are evaded due to interventions by the organization. Therefore, we suggest operationalization of this type of emissions within the scope named Scope 4.
3. Scope 4 Emissions: Definition and Conceptual Scope
Formally, we formulate the definition of the Scope 4 (avoided) emissions as
“The quantifiable greenhouse gas emissions avoided—both within and beyond the organizational boundary—as a result of the deployment, adoption, or promotion of a company’s operations, products, services, business models, or systemic interventions, measured relative to a clearly defined baseline scenario.”
The baseline scenario mentioned in our definition serves as the reference point against which emissions reductions are calculated. It usually depicts the status quo or a probable alternate direction that would have occurred in case of no intervention. Yet, for example, the European Union has set the baseline scenario to the CO2 emission level of 1990, to be used to set the decarbonization targets at 55% reduction by 2030, 90% reduction by 2040, and 100% reduction by 2030. Indeed, while this type of records can be seen utopistic (nobody was recording the CO2 emission levels in 1990!), a baseline should be identified looking at “reasonable” benchmarks like the average of the last five years emissions, the average emissions of the industry, or a combination of both.
The Scope 4 concept comes from an understanding that companies generate value not just by minimizing their own instantaneous emissions, but counting all avoid emissions since their sustainability journey. For example, the substitution of an efficient heat pumps saves energy not only in the specific year when it was installed but in all consecutive years it is used. Hence, unlike Scope 3 emissions, which attempt to trace accountability through upstream and downstream relationships, Scope 4 focuses on the impact a firm has through its overall sustainability path. It aligns with broader notions of systemic sustainability, mission-driven innovation, and the idea of companies as agents of transition toward low-carbon futures. Importantly, Scope 4 does not overlap with Scope 3: it accounts not for the emissions related to a product’s use or end-of-life, but for the difference in emissions between a high-carbon baseline and a lower-carbon alternative adopted by a firm. This positioning requires strong scenario modeling and transparency, since the impact of avoided emissions is very context-dependent on user behavior, regulatory context, and system dynamics.
Conceptually, Scope 4 is a groundbreaking carbon accounting framework: from accounting for emissions created, to credit for emissions saved through innovation and influence. It offers a pathway to account for positive externalities in climate impact, and opens new terrain for performance measurement, particularly when integrated with sustainability-oriented business models. Because the Scope 4 emissions are not directly observable, their quantification requires a scenario-based approach grounded in robust assumptions, boundary clarity, and transparent comparison with a defined baseline. Therefore, we propose a five-stage methodological framework for computing Scope 4 emissions, which is graphically displayed in Figure 1.
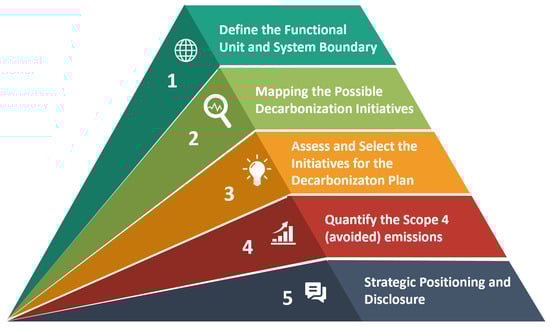
Figure 1.
A proposed framework for Scope 4 (avoided) emissions.
- Step 1:
- Define the Functional Unit and System Boundary
- The first step is to define the functional unit in a clear manner that represents the foundation for the comparison of both the intervention and baseline (counterfactual) scenarios in terms of quantities. This step is then in line with the argumentation done in LCA, where the functional unit facilitates an equitable and normalized comparison between scenarios [19]. Alongside this, the system boundary must be rigorously delineated, covering:
- Time range (e.g., a year, the entire decarbonization period),
- Spatial scope (e.g., urban, national, transboundary),
- Lifecycle stages addressed (e.g., cradle-to-grave, use-phase only),
- Parties involved (e.g., users, facility managers, suppliers).
A well-established boundary maintains methodological consistency and avoids boundary manipulation, which may over- or under-estimate Scope 4 calculations and often results in opaque comparison [20].
- Step 2:
- Mapping the Possible Decarbonization Initiatives
This step involves the creation of a structured plan that can generate emissions reduction and, consequently, identify the path to compute the avoided emissions. Examples of such initiatives are: energy efficiency improvements [21], transport mode shifts [22], or digital substitution of physical services [23]. Indeed, the mapping of these initiatives should be always guided by carbon hotspot analysis [24], sectoral decarbonization pathways [25], taxonomy and policy development [26], and stakeholder expectations and ESG materiality matrices [27]. Practically, mapping the initiatives creates awareness on the intervention universe to be afterwards filtered and phased into a decarbonization roadmap.
- Step 3:
- Assess and Select the Initiatives for the Decarbonization Plan
After identifying potential initiatives, organizations must assess them according to their:
- Environmental effectiveness (e.g., CO2e avoided/year)
- Economic feasibility (e.g., marginal abatement cost)
- Technological maturity (e.g., solutions exists or they will exist over the time period of the decarbonization plan)
- Implementation readiness (e.g., behavioral change potential, tough especially when involving Scope 3 emissions)
Multi-criteria decision analysis (MCDA) and marginal abatement cost curves (MACC) are widely used methods in this stage [28]. The output is a sequenced plan that aligns technical feasibility with strategic ambition and financial capacity.
- Step 4:
- Quantify the Scope 4 (Avoided) Emissions
With initiatives selected, the Scope 4 emissions are calculated as the difference between the emissions of the baseline scenario (business-as-usual) and the intervention scenario. This difference must be calculated using emission factors and inventory methods from reputable databases (e.g., [1,14], or national LCI datasets like Ecoinvent). For comparability, firms should report normalized Scope 4 metrics (e.g., avoided emissions per euro revenue, per functional unit, or per capita) [29].
To assess the contribution of Scope 4 emissions over the lifecycle of a decarbonization strategy, we introduce a dynamic formulation model that captures both the cumulative benefit of enabling initiatives and the systemic adjustments that affect their long-term performance. The model is time-dependent and allows readers to simulate the trajectory of Scope 4 avoided emissions in relation to operational progress and adoption maturity.
We define the rate of change of Scope 4 emissions over time as
where
- : Instantaneous rate of Scope 4 avoided emissions at time t (measured in kg or tons of CO2e per unit time).
- : Time-varying implementation or adoption of initiative i.
- : Emission factor for initiative i, measuring the marginal avoided emissions enabled per output unit (e.g., tons CO2e per replaced activity).
- : Systemic decay factor term that reflects the decreased net benefit, capturing rebound effects or marginal reduction.
- : Quantification of Scope 4 (avoided) emissions at the beginning of the decarbonization plan.
The cumulative Scope 4 emissions by time T are then:
This model provides a forward-looking quantitative framework that can be calibrated with real-world data from scope 1–3 interventions, with T being the end of the decarbonization plan where S(T) is the accumulated stock of avoided emissions.
- Step 5:
- Strategic Positioning and Disclosure
Once it is measured, Scope 4 needs to be integrated into the company’s overall climate strategy and reported in a way that will promote comparability, transparency, and credibility. Disclosure requirements like the Task Force on Climate-related Financial Disclosures [15,30], and the International Sustainability Standards Board’s (ISSB) IFRS S2 are increasingly adopting forward-looking metrics, such as avoided emissions. The strategic integration of Scope 4 serves multiple goals, one for most, demonstrating sustainability commitments (defined later as responsible sustainability) beyond compliance; this point is particularly relevant when directives (e.g., CSRD and CS3D) impose restrictions to specific categories of companies (e.g., large corporations) or modify their content meanwhile being applied (e.g., Omnibus package modified the obligations for CSRD and CS3D). In such cases, computing and properly disclosing the Scope 4 can inform whether a company does sustainability because of a mere purpose of compliance or it has seriously taken sustainability in the corporate strategy and governance, modifying its DNA profoundly. Indeed, a proper disclosure of Scope 4 provides many other benefits, like supporting climate financing eligibility and giving stakeholders an overview of environmental value creation. However, in order to give evidence of credibility, all assumptions, methodology, and uncertainties must be reported in stand-alone technical report and independent verification must be sought wherever practicable.
4. Scope 4 When Decarbonizing a 40k-Seat Stadium
While Section 4 specifically focused on developing the concept of Scope 4 (avoided) emissions, positioning with respect the other scopes, proposed a framework along with a general methodology for its computation, this section focuses on an application of the proposed theoretical frameworks and models. This allows the research to align the theoretical and scientific developments with a case-based application, furnishing then the methodology along with an application of such methodology. In order to go from conceptual debate to illustrating Scope 4’s tangible value, we propose a case of actual-world decarbonization of a stadium. Stadiums are high-impact, high-complexity venues with direct operational emissions and far-reaching downstream impacts through mobility, energy consumption, and material flows. In this manner, they provide a perfect context within which to demonstrate how Scope 1, 2, and 3 emissions can be successively mitigated through targeted measures—and how Scope 4 emissions can be identified, measured, and monetized as avoided emissions enabled by the same measures. However, the readers can easily apply the proposed framework to any type of context, product, service or supply chain of interest.
4.1. Baseline Emissions Profile—Step 1
The baseline CO2 emissions profile is based on a stadium hosting large-scale events (football matches, concerts), with an average annual schedule of 30 events and 40,000 attendees per event. Based on data collected through the literature review, which summarized in Table 1, we capture the weight of Scope 1, 2 and 3 in Figure 2.

Table 1.
Details of the Scope 1, 2 and 3 impact.
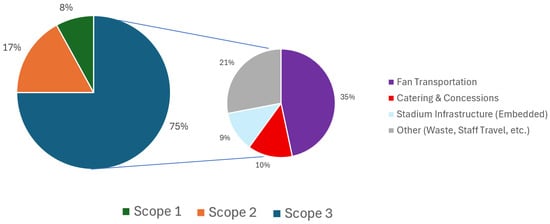
Figure 2.
Scope 1, 2 and 3 for a 40,000-seat stadium.
This baseline shows that only 25% of emissions are under the control of the stadium, while the remaining 75% refers to indirect sources of emissions [24,31]. Based on activity data and sectoral benchmarks, the stadium’s total annual emissions are estimated at approximately 18,000 metric tons of CO2-equivalent (tCO2e). Assuming the venue hosts 30 major events per year, this translates to an average of 600 tCO2e per match. With a stadium capacity of 40,000 seats, assuming that the stadium is always full, the resulting per-fan emission at baseline is approximately 15 kg CO2e per visit. Figure 2 captures emissions across Scope 1–3 while Table 1 reports all the details.
Scope 1 emissions, which are direct GHG emissions from stadium-owned or -controlled operations, are mostly on-site fossil fuel combustion [3]. They include natural gas for space heating systems and catering kitchen facilities and diesel fuel for standby generators to meet peak load or develop resilience to power outage [32]. As they are released within the physical and operational boundary of the facility, they are wholly assigned to the stadium and directly come under its environmental account [14].
Scope 2 emissions, instead, are indirect emissions resulting from the production of purchased energy that the stadium uses. They can result from electricity consumption in powering lighting systems, electronic scoreboards, digital displays, HVAC systems, and the training complex [24]. The stadium is accountable for the emissions arising from its consumption. Scope 2 carbon intensity is a function of the electricity source—national energy mix, renewables, or fossil fuel—and the type of market-based energy purchasing the company engages in [33].
Scope 3 emissions are indirect emissions not included in Scope 2 that take place within the broader value chain. At a sports stadium, Scope 3 emissions typically comprise most of the GHG profile, typically more than 70% of total emissions [31,34]. They encompass upstream and downstream activities such as fan transportation, food and beverage and retail purchases, merchandise, and waste management. One should note the impact of fan travel, with most fans employing car or air transport in the event of elite events, creating high mobility emissions [35,36]. Catering facilities also generate significant impact due to the carbon intensity of meat-based menus and disposable packaging. Furthermore, infrastructure emissions—embodied in concrete, steel, and other materials—represent long-term carbon signatures linked to stadium construction and maintenance [37]. Digital infrastructure, including servers and streaming sites, represents a burgeoning source of emissions as virtual attendance and online participation is currently taking a center stage in fan culture [38].
4.2. Mapping the Possible Decarbonization Initiatives (Step 2)
As it emerges from the proposed framework in Figure 1, the literature can drive the identification of potential interventions for Scope 1, 2, and 3 emissions under the scope of stadium operations. Each initiative has backing from evidence in peer-reviewed literature, institutional guidelines, or best practices in sustainability standards. Besides describing the technical potential of such actions, the literature enables us to estimate their probable environmental effect, costs, and practical limitations. They are the components of our decarbonization strategy and the basis for developing a realistic action plan. All considered interventions and their estimated effects are listed in Table 2, along with the references from the literature.
Table 2.
The impact of the identified initiatives.
4.2.1. Initiatives to Abet the Scope 1 Emissions
Scope 1 emissions cover about 8% of the stadium’s overall carbon footprint and, consequently, present themselves as a strategic decarbonization priority being directly controlled. One of the straightforward Scope 1 reduction approaches is retrofitting natural gas-fired heating systems with efficient electric heat pumps. This change allows the stadium to progressively delink its heating infrastructure from fossil fuels and match it with cleaner electricity sources, particularly if Scope 2 reductions are also achieved simultaneously [21]. Additionally, a substitution of diesel generators with battery energy storage systems—preferably with renewable energy—has the twofold advantage of minimizing both direct emissions and local air pollution, such as NOx and particulate matter [46]. Other alternatives, such as incorporating energy recovery ventilation systems within the HVAC design, allow firms to recycle exhaust air thermal energy and further improve the efficiency of operations [39]. Based on the suggested infrastructure investments and phasing implementation over a five-year timeframe, these actions can reasonably decrease Scope 1 emissions by 50%.
4.2.2. Initiatives to Abet the Scope 2 Emissions
Scope 2 emissions, which represent around 12% of the overall footprint, can be reduced through a twofold approach. Firstly, it can procure renewable electricity by long-term PPAs or green energy certificates, enabling the organization to move away from average grid emissions (location-based) to specific low-carbon energy sources (market-based) [47]. Secondly, the installation of on-site solar photovoltaic arrays on roof surfaces, open concourses, or surrounding parking facilities can directly offset peak grid demand.
Additional efficiencies are achievable through AI-driven building energy management systems (BEMS) that modulate energy consumption dynamically in response to event schedules, weather predictions, and real-time occupancy. Studies demonstrate that these systems can lower electricity usage in large facilities by 15–25% [40]. By pairing renewable procurement with smart load management, Scope 2 emissions can be cut by as much as 100%, especially when grid decarbonization trends are coupled with these investments.
4.2.3. Initiatives to Abet the Scope 3 Emissions
Scope 3 emissions are by far the largest contributor to the overall carbon footprint of the stadium, accounting for approximately 75% of overall GHGs. Emissions can be decreased by promoting plant-based food choices and low-carbon providers. Research has continually indicated that plant-based diets have 40–70% less carbon intensity per meal compared to conventional meat-based substitutes [41]. Concurrently, transport emissions can be tackled through combined public transport and ticket bundles, free shuttle buses, bike parking facilities, and awareness-raising campaigns aimed at changing travel habits [22]. On the merchandise side, a transition to recycled materials, phasing out plastic packaging, and providing in-stadium repair or customization services promotes circularity and minimizes emissions throughout product lifecycles. IT and media emissions—while comparatively small at 3%—can be reduced by transferring server loads to data centers powered by renewables and streamlining digital streaming bandwidth [38].
Lastly, Scope 3 waste management can be enhanced by implementing overall zero-waste systems with good signage, intelligent bins, and collaboration with circular economy waste vendors that are certified. These collective actions have the potential to decrease Scope 3 emissions substantially, subject to partner uptake, regulatory backing, and behavioral participation [15,43].
4.3. Assessing the Decarbonization Initiatives (Step 3)
To systematically value and rank decarbonization actions for stadium-scale operations, we applied a multi-criteria assessment framework along three axes: environmental impact, economic feasibility, and technical feasibility. The environmental impact is measured through the percentages of possible cut emerged from the literature review and displayed in Table 2. The other axes were scored on a 1 to 5 scale, with higher numbers reflecting greater strategic attractiveness for implementation. We involved 12 sustainable managers of clubs, leagues, and associations of the soccer world, along with 3 Ph.D. students, 4 faculty members, and 10 additional company representatives to have their evaluation on economic and technological feasibility of these solutions. The rationale for the grading process is based on standard precepts of environmental economics, energy transition research, and climate mitigation policy, in particular the marginal abatement cost (MAC) logic and widely applied in policy analysis.
After computing the means, we plotted all initiatives in Figure 3, where the size of the spheres indicates the percentage of environmental abetment. Initiatives facilitating fossil fuel displacement, significant changes in consumption patterns, or system changes in energy procurement were rated higher (4–5). For instance, the substitution of diesel generators with battery storage or procuring renewable power purchase agreements directly eliminates high-emission energy sources, which has a measurable impact on organizational carbon intensity. These ratings align with literature in sustainable tourism and events management research (e.g., [24]), who contend that large event venues can be valuable leverage points for urban emission reduction when invested with appropriate interventions. In contrast, interventions with marginal or indirect impacts, such as partial menu substitutions or incremental waste diversion enhancements, were rated more conservatively.
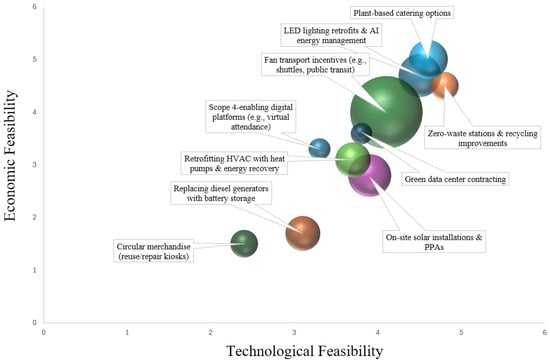
Figure 3.
Environmental, technological and economic (sphere size) analysis of the possible decarbonization initiatives.
Alongside, economic feasibility provided for the investment cost, cost savings from operations, and expected payback periods. Options like LED lighting retrofits, plant-based catering, and behavioral nudges (e.g., incentivizing fans to use public transport) emerged as economically attractive due to their low capital intensity and fast returns. These findings are supported by empirical studies on sustainability in sports and entertainment [35], according to which small-scale environmental initiatives can have considerable impacts without high levels of upfront investment. By contrast, infrastructure-heavy programs like battery system installation or merchandise logistics redesign were assigned lower economic feasibility scores due to high capital expenditure and delayed monetization.
Lastly, technological feasibility evaluated the maturity, availability, and integration complexity of the proposed solutions. Readily available and mature technologies—like AI-powered energy management systems or cloud green data centers—scored high, considering their high technology readiness level. This dimension was informed by international standards on climate innovation tracking, specifically the International Energy Agency’s sectoral readiness assessments [21]. More ambitious and nascent interventions, particularly those aimed at Scope 4 digital enablement platforms or circular supply chains, were moderately rated feasible considering the need for ecosystem-level coordination or regulatory alignment.
By integrating these three dimensions, we not only bring to the surface “quick wins” that are achievable immediately but also highlight longer-term strategic bets and innovation enablers that may be critical to future-proofing a venue’s decarbonization pathway. This framework enables decision-makers to deploy capital and organizational effort where it delivers the highest climate return per capital invested, while remaining in lockstep with both regulatory imperative and voluntary ESG commitments.
4.4. Quantify the Scope 4 (Avoided) Emissions (Step 4)
After evaluating and choosing appropriate decarbonization activities, the execution of the ensuing plan yields a quantifiable decrease in greenhouse gas emissions linked with the system being examined—in the current scenario, the emissions produced per fan going to events at the stadium. Each intervention’s effect is quantified by ascertaining the variation in emissions between the baseline scenario (Year 0), which provides the assumption of no decarbonization action (15 kg CO2e per fan), and the post-intervention scenarios that successively minimize emissions through the adoption of focused initiatives.
As reported in Table 3, the deployment of a PPA for renewable electricity in Year 1 marks the initial reduction, decreasing emissions to 14.3 kg CO2e per fan and resulting in an avoided emission of 0.7 kg CO2e per fan—this value representing the Scope 4 impact for that year. As the plan unfolds, interventions such as green fan transport (Year 2), plant-based catering (Year 3), and retrofitting with heat pumps (Year 4) continue to decrease the emission intensity. By Year 6, with the addition of AI energy management and optimization systems, emissions drop to 9.75 kg CO2e per fan, and the annual Scope 4 grows to 0.95 kg CO2e per fan.
Table 3.
Analysis of decarbonization initiatives and quantification of Scope 4 emissions.
The Scope 4 total per fan increases stepwise with each project, echoing the compounding benefits of sequential decarbonization actions. In Year 11, after the introduction of battery storage in place of diesel generators, the per-fan emissions are 6.6 kg CO2e—less than half the initial baseline. The total Scope 4 effect achieved over the 11-year deployment timeline is 8.4 kg CO2e per fan. The result confirms that avoided emissions compound over the duration of time and that each individual project—small in the impact of a single year—is highly material in long-term emissions savings when incorporated into an integrated plan.
The quantification maps directly onto the dynamic graphing of Scope 4 via the creation of a differential equation. Every yearly intervention creates a marginal benefit of avoided emissions, which can be mathematically defined as the rate over time of Scope 4 (e.g., ). This is the yearly Scope 4 per fan, which is the marginal effort of the particular initiative taken in year t. For instance, the green transport initiative launched in Year 2 yields a differential of 1.5 kg CO2e avoided per fan—that is exactly CO2e.
By cumulatively adding these annual contributions across the planning horizon, we obtain the cumulative Scope 4 per fan, S(t). This function increases incrementally with each project developed, capturing the time-compounded and systemic advantages of the decarbonization trajectory. At the end of the planning horizon, T = 11 years, the final accumulated value S(T) is 8.4 kg CO2e per fan, as shown in Table 3.
The use of the proposed equations offers a tractable and powerful representation of avoided emissions dynamics. It enables practitioners to monitor, assess, and predict the time-changing climate contribution of their decarbonization plan, while being able to differentiate between the marginal benefit in a given year and the cumulative climate contribution S(T). The dynamic measurement of Scope 4 emissions not only makes possible a longitudinal perspective on avoided emissions, but also a consistent integration with modeling approaches standard in environmental economics.
Interestingly, the intersection point of the first emission trajectory and the cumulative Scope 4—i.e., where avoided emissions equal newly generated emissions—can be regarded as a type of “relative carbon neutrality”. Unlike conventional carbon neutrality or net zero, which typically involve offsetting all of the emissions under all of the scopes, partial carbon neutrality can be defined as
“the point where the systemic emission reductions generated by enabling actions (Scope 4) balance the ongoing operational emissions (typically Scope 1–3). It is therefore the point where the ongoing impacts generated by Scope 1, 2 and 3 are equal to the Scope 4 (avoided) emissions.”
This consideration is especially relevant to those organizations that do not yet reach absolute zero emissions, but whose innovation, behavioral nudging, or infrastructural change substantially cuts emissions. It is a milestone of relative balance in environmental accountability, particularly when firms serve as enablers within a broader decarbonization ecosystem.
4.5. Strategic Positioning and Disclosure (Step 5)
When firms calculate and report their Scope 4 pathways, they enable investors, partners, and regulators to see not only how green the firm is but how green it makes others. One of the key challenges in operationalizing Scope 4 is making it comparable across companies working in different industries, scales, and business models. Because absolute figures of avoided emissions expressed in tons of CO2 equivalent are necessarily a function of company size, volume of output, and sectoral context, reporting Scope 4 solely in absolute terms can be confusing or not adequate. To remedy this, we suggest normalizing Scope 4 emissions through intensity metrics, which represent avoided emissions relative to a unit of economic or functional output.
For example, businesses can report Scope 4 on a per unit of product or service provided basis—e.g., tons CO2e saved per car sold, per digital transaction, per megawatt-hour produced, or per square meter constructed. As another option, companies can use monetary intensity measures, e.g., emissions avoided per euro of revenue or per million euros of investment, allowing performance comparison across extremely divergent industries. This method improves interpretability and equity, allowing for credible communication, promoting cross-sectoral comparability and facilitating investor decision-making.
Figure 4 offers complementary information regarding the progression and effectiveness of the stadium’s decarbonization journey from the Scope 4 perspective. The left-hand side of Figure 4, aiming at emissions captured in year 11, presents a picture of a mature decarbonization profile: of total emissions associated with a fan visit, only 6.6 kg CO2e are now generated by residual Scope 1, 2, and 3 activities, while 8.4 kg CO2e are saved by the cumulative effect of decarbonization initiatives. This demonstrates the application of the relative carbon neutrality concept, where the avoided emissions (Scope 4) equal or exceed the operational emissions. This indicates that the stadium, as a system, has transitioned from a net emitter to an active driver of decarbonization.
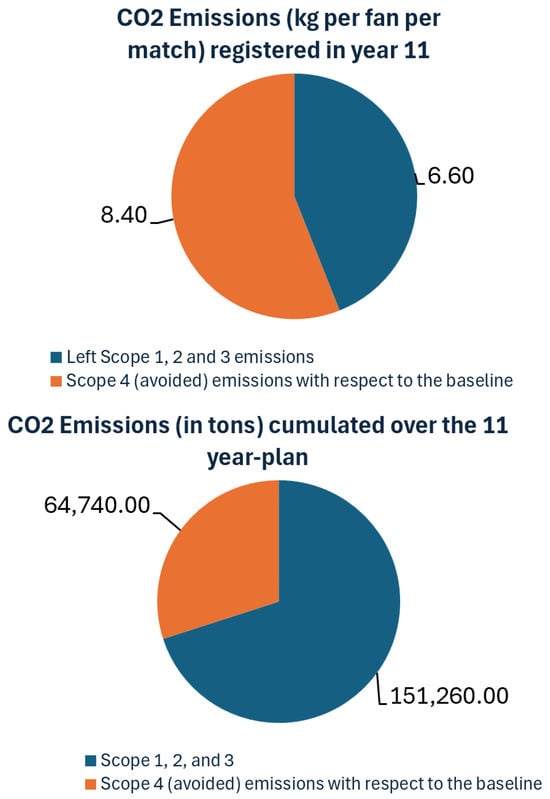
Figure 4.
Quantifying the Scope 4 (avoided) emissions.
Furthermore, the right-hand side of Figure 4—which displays the emissions cumulated over the 11-year timeline—reveals the inertia typical of complex decarbonization processes. Despite the success achieved in year 11 and exemplified by the left-hand side of Figure 4, the cumulative Scope 1, 2, and 3 emissions over the decarbonization plan far outweigh the total avoided emissions. This gap echoes a gradual starting rate of intervention, with more disruptive and greater-impact activities postponed to later years as a function of technological readiness, capital availability, or organizational resistance. It underscores the fact that the path to sustainability is not linear: initial rapid gains were lower in their system impact, and only subsequent investments—like virtual coordination, circular procurement, and infrastructure retrofits—enabled the Scope 4 metric to surpass residual emissions.
Figure 5 replicates the analysis displayed in the right-hand side of Figure 4 on the cumulated Scope 4 (avoided) emissions. However, the initiatives are now concentrated in 6 years rather than being spread in 11 years with the assumption of taking one initiative per year. Interesting, the results in year 6 would be the same as described in the left-hand side of Figure 4, since all initiatives would have been implemented anyways (in 6 years rather than in 11 years). In fact, Figure 5 counts for PPA for renewables and green fan transport in Year 1, plant-based catering and heat pump retrofit in Year 2, on-site solar and AI energy optimization in Year 3, zero-waste systems and green data centers in Year 4, energy recovery HVAC and sustainable merchandise in Year 5, and battery Storage in Year 6. Then, Scope 4 is bigger in Figure 5 than in Figure 4 after 11 years since, from Year 6 to Year 11, the stadium benefits from high Scope 4.
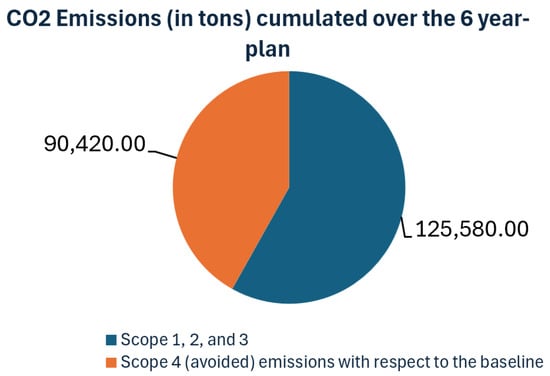
Figure 5.
Quantifying the Scope 4 (avoided) emissions with proactive climate change approaches.
In sum:
- -
- If the initiatives to reduce Scope 1, 2 and 3 are implemented in 11 years, the Scope 4 after 11 years is 60,740 tons CO2e;
- -
- If those initiatives are implemented in 6 years, the Scope 4 after 11 years is 90,420 tons CO2e;
Consequently, companies that act responsibly by committing genuinely to sustainability, adhering to their decarbonization targets irrespective of regulatory changes or modifications are those demonstrating consistency, trustability, and responsibility. These firms stay the course on reducing Scope 1, 2, and 3 emissions not as a mere compliance requirements (signaling greenwashing) but as a credible commitment and true responsibility. Consequently, we formulate the definition of “responsible sustainability”:
“Responsible Sustainability is the companies’ strategic and proactive commitment to implement timely, ambitious, and well-structured decarbonization plans aimed at reducing Scope 1, 2, and 3 emissions, independent of external regulatory changes or easing of requirements. It reflects a company’s genuine dedication to sustainability, avoiding greenwashing by delivering measurable and cumulative Scope 4 (avoided) emissions that contribute to systemic decarbonization beyond the organizational boundary.”
5. Policy Mechanisms Associated with Scope 4
Whereas Scope 1, 2 and 3 are officially governed (e.g., GHG protocol, CSRD, etc.), Scope 4 is meanwhile still largely voluntary. This lacuna is both a challenge and a strategic opportunity. To tap Scope 4’s potential as an environmental value driver, it needs to be aligned with the policy levers that already condition climate action. Extending [48,49], we discuss five institutional instruments—carbon pricing, public procurement, tax incentives and finance, disclosure obligations, and environmental taxonomies—that can act as vectors for bringing Scope 4 into the environmental governance and ESG mainstream. Such alignment would not only compensate companies for their transformational efforts towards decarbonization, but also ensure that Scope 4 is developed with the same stringency, transparency, and accountability that now characterize the other three scopes.
The first and arguably most iconic policy instrument in environmental governance is carbon pricing, encompassing instruments like carbon taxes and emissions trading schemes. These instruments assign a financial cost to emitting activities, thus encouraging firms to shrink their operational footprint. Scopes 1 and 2 are regularly addressed by such schemes, especially in geographies covered by emissions trading systems. While Scope 3 is still less uniformly priced, Scope 4 does not yet have any formal valuation mechanism. However, the logic of carbon pricing can be applied to avoided emissions: if a company can credibly show that its products or technologies cause other actors to avoid emissions that would otherwise have taken place, those avoidance has an implicit carbon value. In the fullness of time, this could lead to a class of impact-based carbon credits based on enabling substitution or behavior change, rather than sequestration or offsetting. Such credits would be distinct from conventional offsets in that they are inherent to the product or service design itself, rather than externally procured. To facilitate this, strict accounting rules and third-party verification protocols would need to be established, but the result would be definitely novel with respect to existing frameworks: Scope 4 would be reconstituted from a measure for stakeholders to demonstrate the sustainability commitments to a monetizable environmental asset with carbon market applicability.
A second domain in which Scope 4 might be operationalized is in public procurement and supplier qualification systems. Currently, environmental aspects of procurement generally focus on supplier-level emissions—asking, for example, if a bidder’s energy is renewable or whether their products fulfill particular eco-design requirements. Public and non-public tenders might include, however, avoided emissions as a performance criterion. A bidder offering a solution—a building management system, a digital conferencing platform, or a low-carbon mobility network, for example—could be awarded bonus points for its quantified Scope 4 effect. In this manner, Scope 4 is rendered a competitive advantage in public tenders, with companies rewarded not only for being sustainable in their operations, but for facilitating wider decarbonization. Additionally, such inclusion would encourage companies to invest in measuring and documenting avoided emissions, reporting Scope 4 throughout supply chains.
The third mechanism is access to green finance and fiscal policy. Governments and financial institutions already offer tax credits, grants, concessional loans, and preferential bond terms to companies satisfying environmental criteria—particularly around renewable energy, energy efficiency, or emissions reduction. These incentives have typically been premised on performance metrics linked to Scopes 1 and 2. But Scope 4, in its capture of emissions avoidance, is equally—if not more scalable—a pathway to climate mitigation. A firm that develops software for optimizing energy in industrial systems, or that manufactures modular components for circular construction, should be able to claim eligibility for green tax credits for the avoided emissions of downstream users. Green bonds and sustainability-linked loans, likewise, could incorporate Scope 4 performance metrics as triggers for interest rate adjustment or bonus mechanisms. This would effectively make Scope 4 a qualifying metric for climate-positive financing, extending the definition of environmental impact to cover both direct and enabled contributions.
A fourth and critical lever is the domain of mandatory and voluntary disclosure. Scopes 1 to 3 are already covered by far-reaching reporting obligations under several disclosure regimes. These obligations seek to bring comparability, traceability, and accountability to corporate environmental performance. Scope 4, however, is not yet covered by standardized guidance. Over time, such disclosures could become part of transition plans, product labeling, and impact reports submitted to investors and regulators. Finally, environmental taxonomies and classification systems—such as the EU Sustainable Finance Taxonomy—provide a critical infrastructure for defining what constitutes “green.” These taxonomies currently address whether a company’s activities are aligned with climate change mitigation and adaptation goals, based on thresholds of energy performance, lifecycle emissions, or carbon intensity. Bringing Scope 4 into these taxonomies would mean recognizing products and services that have enabling impacts.
6. Challenges and Risks in Scope 4 Emissions
While Scope 4 (avoided) emissions do offer a new and promising direction for companies to communicate their contribution to system-level decarbonization, their application is not without fundamental challenges. As it stands, Scope 4 accounting poses a distinct set of risks that, if not conscientiously managed, can lead to overestimation of climate impacts, loss of credibility, or even strategic manipulation of the concept.
One of the most fundamental challenges concerns the development of the baseline scenario, which provides the benchmark against which avoided emissions are quantified. Because this scenario depicts what would otherwise have occurred in the absence of the firm’s intervention, it might be either real or hypothetical. Companies might exaggerate the calculated climate benefit of their product or service if they select baselines that are excessively pessimistic—for example, by assuming universal adoption of old, high-emitting technologies. This creates so-called optimism bias or baseline manipulation. The more ambitious or speculative the assumptions built into the baseline, the higher the risk of overestimating the firm’s Scope 4 contribution. To maintain credibility, it is thus critical that baseline scenarios are developed from conservative, evidence-based assumptions anchored in current market data, policy trajectories, or peer-reviewed research.
A second fundamental issue regards double counting. Given that Scope 4 (avoided) emissions are computed using a systematic approach to carbon accounting, it is likely that more than one actor may seek to take credit for the same reduction in emissions. Avoided emissions from an efficient appliance, for instance, could simultaneously be attributed to the manufacturer, the consumer, the utility, and even the national government, depending on how the emissions accounting is framed. Without coordination and boundary clarity, such overlapping claims risk undermining overall carbon accounting scheme integrities. Therefore, businesses adopting Scope 4 should ensure that attribution rules are clearly documented and consistently applied, with clear recognition of whether the reported reduction in emissions is shared, partial, or enabling rather than exclusive.
Closely related is the challenge of attribution uncertainty—that is, determining to what extent the firm can legitimately claim credit for the emissions avoided. In complex value chains and multi-actor ecosystems, it is often unclear whether the firm’s action is the proximate cause of the emissions reduction or merely one contributing factor among several. This uncertainty becomes particularly pressing in platform-based models, where value is co-created with users, partners, or regulators. In these cases, attribution needs to be based on an explicit logic of causal contribution, ideally supported by adoption data, impact modeling, or third-party validation. Neglecting to determine the firm’s contribution risks inflating claims or undue reputational gain.
A further aspect of risk relates to temporal uncertainty. Scope 4 estimates tend to extrapolate emissions savings over extended time frames—sometimes several decades—in line with assumptions regarding product lifespan, market up-take rates, or systemic behavior change. Yet, actual events in the form of technology obsolescence, evolving regulations, or modifying user behaviors can profoundly reshape actual effect. A product set to mitigate emissions for 15 years can be replaced ahead of time, or the manner in which it is used can diverge from intended use cases. Companies should therefore exercise restraint in forecasting long-term Scope 4 effects without explicit disclosure of the time frames concerned, as well as in performing sensitivity analyses that account for the unpredictability of real-world processes.
In addition, companies need to be mindful of rebound effects, a widely documented phenomenon in energy and environmental economics in which efficiency gains are followed by increased overall consumption. For instance, a more fuel-efficient car might induce users to drive more often or further afield, thus canceling out some of the emissions savings initially assumed. In certain situations, rebound effects entirely negate the climate benefit, especially in price-sensitive or consumption-oriented markets. A sound Scope 4 approach should provide for such behavioral feedback, either by discounting the impact estimates or by clearly flagging it as a risk to net climate benefit.
Finally, the greatest risk—the most strategic in nature—is one of greenwashing or strategic abuse. Because Scope 4 is not yet under mandatory reporting regimes, and because its calculations are inevitably interpretive in nature, there is a danger of its opportunistic deployment to burnish sustainability communication or distract from Scope 1–3 emissions. This is particularly concerning where companies present Scope 4 impact as a substitute for decarbonization efforts of their own, rather than a complementary lever. To avoid this risk, companies must incorporate Scope 4 accounting within an overall strategy of reductions, making it evident that avoided emissions neither offset nor compensate for direct emissions. Instead, Scope 4 must be positioned as a strategic amplifier of climate effect, legitimate only when prosecuted in tandem with deep, science-based reductions in Scopes 1, 2, and 3. Third-party verification, strict documentation of assumptions, and adherence to emerging standards—such as impending GHG Protocol revisions or ISO standards—will be key to maintaining Scope 4 as a credible, science-based, and socially accepted tool for corporate climate impact measurement.
7. Scope 4 Emissions for “S” and “G” Factors
While Scope 4 emissions are largely presented as an environmental measure, both the “S” and the “G” factors of ESG can gain substantial benefits.
- The Social Dimension of Scope 4: From Climate Benefit to Social Benefit
One of the most immediate social implications of Scope 4 relates to talent attraction and purpose alignment. In today’s labor market, particularly for younger generations, there is a growing desire to be engaged in climate-positive work. Employees increasingly look for meaning, purpose, and alignment between their moral values and work activities. While companies that seek to reduce their own emissions (through Scopes 1 to 3) are often perceived as responsible and compliant, those that proactively enable system-level decarbonization through Scope 4 can be viewed as transformational players—visionary companies that are shaping the future rather than reacting to it. A clearly articulated and credible Scope 4 strategy can thus act as a magnet for talent, particularly in fields such as clean technology, digital services, sustainable infrastructure, and circular manufacturing. It elevates the employee value proposition by giving a sense of participation in a broader societal mission, which in turn has the potential to foster retention, engagement, and innovation.
Beyond the workplace, Scope 4 also yields deep public health benefits. Greenhouse gas emission savings—particularly when achieved across urban transportation, energy systems, or industrial design—often coincide with reductions in harmful co-pollutants such as particulate matter (PM2.5), nitrogen oxides (NOx), and sulfur dioxide (SO2). These co-pollutants are major drivers of respiratory disease, cardiovascular disease, and numerous cancers. Therefore, Scope 4 initiatives that enable transitions away from fossil fuel dependence do more than prevent climate change. They also reduce disease burden, prevent premature death, and increase life expectancy, particularly in densely populated or disadvantaged areas. In this sense, Scope 4 (avoided) emissions yield health co-benefits at scale, creating a more resilient, wealthy, and equitable society.
- The Scope 4 Governance Dimension: From Climate Benefit to Ethical Accountability
We must not overlook that Scope 4’s value and legitimacy as a corporate measure are wholly dependent on the quality of its governance. In contrast to Scopes 1, 2, and 3, which describe direct and indirect emissions that can frequently be assessed with relative accuracy and traceability, Scope 4 is counterfactual in nature. It poses the question: What emissions were avoided due to our intervention? This question brings with it significant methodological and ethical complexity, thus a natural test for governance integrity.
At its most fundamental level, Scope 4 requires organizations to demonstrate a type of anticipatory accountability. Since the claims made under Scope 4 are based on assumptions, modeled baselines, and scenario comparisons, they are susceptible to exaggeration, selective presentation, or untested optimism. Hence, good governance starts with the implementation of strong internal processes to ensure that any Scope 4 claim is supported by transparent, conservative, and reproducible methods. This involves being explicit about the baseline scenario (i.e., what would have happened in the absence of the intervention), revealing the data sources and assumptions, and defining the system boundaries. Wherever feasible, such claims should be submitted to third-party assurance, especially when they are associated with high-profile reporting, financing vehicles, or branding initiatives.
Scope 4 governance also involves the function of boards and executive leadership. As firms transition from compliance-driven carbon accounting to purpose-driven climate enablement, their boards of directors need to adopt an expansive view of fiduciary duty—one that encompasses stewardship of systemic impact. Scope 4 should not be a footnote in the sustainability department but needs to be incorporated into enterprise risk management, strategic planning, and ESG governance. Boards of directors should ensure consistency of Scope 4 with the firm’s overall climate pledges (e.g., under SBTi or CSRD), verify that avoided emissions claims are not being utilized to mask internal reductions, and examine the alignment of Scope 4 activities with core business strategy.
Additionally, good governance demands good internal architecture. Companies need to establish internal ownership of Scope 4 quantification, preferably integrating it into interdisciplinary teams that bring together sustainability, innovation, operations, and finance. They need to establish internal audit procedures to monitor methodological consistency across time, and to verify data integrity in impact models. Notably, such internal mechanisms must be scalable and flexible, with the ability to refine them as standards emerge and data availability increases. Lastly, Scope 4 governance should include internal incentives and performance systems. Firms can look to incorporate Scope 4 metrics into executive compensation models, innovation key performance indicators, and impact dashboards. That alignment solidifies the connection between sustainability ambition and governance structure, elevating Scope 4 from an accounting novelty to a strategic asset.
8. Theoretical Contributions
Despite the increased attention on corporate actions to reduce climate change, both the managerial and scientific communities still struggle with a lack of a well-defined, holistic, and theory-driven framework to account for avoided emissions, representing a novel aspect to the overall relevance of corporate decarbonization actions instead. Despite Scopes 1, 2, and 3 having been thoroughly integrated into the Greenhouse Gas Protocol and related reporting structures, the dominant focus of Scope 1 along with the preoccupations for Scope 3 continue to be real. Yet, there exists a significant lack of a theory-based, strong viewpoint prepared to conceptualize and evaluate the positive externalities created by organizations through their sustainability initiatives. By operationalizing the concept of Scope 4, we address this void. We provide a formalized structure to recognize and measure avoided emissions, that is, those emissions that would arise under a business-as-usual situation in the absence of any mitigation actions by a specific entity aiming for decarbonization.
In order to refine conceptual clarity and reduce ambiguity by resorting to the use of analogous frameworks—like Scope 3 emissions, value chain externalities, or measures of emission reduction—this paper provides a complete explanation, definition, rationale for assessment, and direction regarding Scope 4 in Table 4. It operationalizes Scope 4 as a much-needed and new complement to the current emissions accounting schemes and helps in furthering theory and practice for the progressive development of carbon disclosure and accountability.
Table 4.
Comparison between Scope 3 and Scope 4 emissions.
The notion of Scope 4, based on the complex realities of decarbonization, offers a sequence of seminal theoretical contributions addressing prevalent gaps in the academic literature. It extends the definitional range of emissions accounting by adding a new category: the avoided emissions. The latter include climate benefits linked to the various green initiatives undertaken by a company and, consequently, contrasts with the definition of Scope 3, since it includes the measurement of Scope 1, 2, and 3 impact categories comparatively to a credible counterfactual baseline. In addition, it defines a dynamic measurement system based on the cumulated benefits and impacts of sustainability. Hence, Scope 4 offers a new theoretical vantage point by linking emissions accounting with the performance of corporate decarbonization policies, thus turning sustainability debates from compliance metrics into performance-based measures of sustainability assessment.
On point of novelty relates to the approach used to count the avoided emissions, which enables a normative shift in responsibility by reframing the overall environmental contributions of a company and, therefore, integrating with aspects of stakeholder theory and extended producer responsibility. The Scope 4 approach offers avenues of methodological integration with established measures such as the LCA, the Clean Development Mechanism (CDM), and the World Business Council for Sustainable Development (WBCSD) and World Resources Institute (WRI) GHG Protocol Product Standard, simultaneously addressing their limitations in the recognition of system-enabling climate measures. In fact, the ensuing five-step approach for the estimation of Scope 4 emissions integrates the underlying principles of LCA (codified in ISO 14044), including the identification of system boundaries and the definition of baseline or counterfactual scenario. The approach also draws on the United Nations Framework Convention on Climate Change (UNFCCC) framework, which formalized the concept of additionality and outlined the procedure for ensuring emissions reductions against a business-as-usual counterfactual.
Moreover, the proposed approach aligns with the WBCSD and WRI principles, which suggest how to assess the relative emissions contribution of goods and services. The main differences with the Scope 4 framework, however, relate to the dynamic avoided emissions originating from corporate-driven decarbonization initiatives, the ability to integrate avoided emissions into the discourse related to Scope 1–3, and adherence to long-term strategic planning. The resulting contribution should therefore not be seen as an entirely new benchmark; instead, it is a systematic and practitioner-oriented approach that enables organizations to evaluate and report on their enabling role in large-scale decarbonization initiatives.
To position the methodology of Scope 4 emissions developed in this paper with existing methods and approaches for emissions accounting, Table 5 compares the five-step approach to established frameworks earlier mentioned over the manuscript, specifically: LCA [19], the Clean Development Mechanism (CDM-UNFCCC), and the WBCSD/WRI product guidance on avoided emissions. This comparison highlights both the points of continuity and the areas of theoretical innovation, demonstrating the differences among all displayed methods.
Table 5.
Comparison between Scope 4 emissions with LCA, CDM, and WRI/WBCSD.
Finally, this research contributes to theoretical developments in the field of sustainability by introducing the concept of relative carbon neutrality. The latter is not to be seen as a substitute for net zero ambitions but as a supplementary metric in the overall method of decarbonization measurement. More specifically, this concept refers to the link when the overall avoided emissions (Scope 4) from company actions become equal to or surpass the overall actual operational emissions generated by the company (Scope 1, 2, and 3). Therefore, it provides a different method of measurement for corporate performance. Moreover, from a theoretical perspective, this paper develops the concept of Responsible Sustainability, which refers to the overall and verified firms’ commitment toward sustainability and is quantified through the Scope 4 measure.
9. Conclusions
This research has proposed and formalized the idea of Scope 4 emissions—facilitating the avoidance of greenhouse gas emissions—as an essential addition to the existing GHG accounting system dominated by Scopes 1, 2, and 3. Whereas conventional emissions reporting aims to measure a company’s direct and indirect climate liabilities, Scope 4 flips the perspective to the positive systemic impact an organization can have by systematically using a dynamic counting approach that cumulates the positive environmental effects created by a firm over time through initiatives linked to Scopes 1, 2 and 3. Therefore, this study explores how the concept of Scope 4 emissions—defined as avoided emissions attributable to a company’s green interventions and initiatives—could be integrated into existing carbon accounting frameworks to capture firms’ positive contributions to climate action in a more structure and precise way.
From a theoretical point of view, this research explains Scope 4’s conceptual difference with Scope 1, 2 and 3, suggests a definition based on life cycle and counterfactual reasoning, and illustrates its consistency with environmental accounting theory. In doing so, it contributes to extending the boundary of carbon accounting by conceptualizing and operationalizing the importance of avoided impact of corporate climate interventions, which instead focuses on static accounting systems. Methodologically, we put forward a 5-step framework to Scope 4 calculation, specifying phases from baseline establishment (business as usual) to the various decarbonization initiatives. The proposed framework helps lay the foundation for future academic exploration and empirical validation of avoided emissions as a measurable category. In order to give an evidence of how to apply the concept of Scope 4 emissions, this research also develops a case study; specifically, the concept of avoided emissions is applied to the decarbonization of a 40,000-seat stadium, where Scope 4 is quantified dynamically in addition to Scopes 1–3, illustrating both the maturity of the intervention and the gradual temporal unfolding of its cumulative effect.
We argued that Scope 4 is not an accounting exercise, but it is a strategic environmental governance instrument. It enables companies to rethink their purpose in climate transitions, justify climate-aligned investments, and report performance in a way that communicates both impact and intent. Normalized per unit of output or per user enabled, Scope 4 offers a feasible basis for cross-sectoral comparability, thus enhancing transparency in ESG reporting and sustainable finance analyses. According to our developments, the Scope 4 framework supports the decarbonization strategies by tracking the systemic climate impact of their products, services, and innovations; hence, computing the Scope 4 offers a new metric with which to enhance the transparency and completeness of ESG disclosures while also allowing us to compare companies’ commitment toward sustainability.
From a corporate strategy perspective, this paper encourages to integrate the concept of avoided emissions to highlight the contribution offered to climate changes and adopt a forward-looking perspective that strategize on decarbonization rather than limiting its analysis on the operational boundaries. This can also require the support of policy makers through the introduction of ad hoc mechanisms and incentives, along with standards and methods. This paper also links the concept of avoided emissions with the S and G pillars of ESG: the cumulated benefits created for the environment generate positive impact on public health and quality of life; hence, governance requires a mindset switch to deploy robust methodologies, attribution standards, and verification processes in the interest of avoided emissions accountability. However, Scope 4 also brings some risks exemplified by the data used for the baselines and possible rebound effects. Accordingly, we suggest the creation of conservative, standardized protocols to allow Scope 4 reporting to be credible, reproducible, and aligned with net-zero trajectories. Only when doing so, Scope 4 can authorize companies to report on their external mitigation impact, drive innovation, and provide evidence of environmental transition.
While this research presents a novel and feasible framework for considering and estimating the Scope 4 emissions, several limitations must be acknowledged and used as source of future inspiration. The method proposed in this paper relies on counterfactual scenarios and emission factors that require a deep analysis of risks and uncertainty along with a justification for the model assumptions. Therefore, the accuracy of Scope 4 emissions calculations strictly depends on the baseline model, which may vary significantly according to many parameters. Future research on Scope 4 emissions should then consider existing frameworks for computing the benchmark scenario. While the dynamic equation exemplifying Scope 4 offers a clear approach to dynamic environmental accounting, it requires empirical testing along with simulation and validation to verify its robustness and behavior under various decarbonization trajectories. In this paper, the case reported here provides a helpful example, yet extensions to other contexts, products, services, and supply chains are requested. Future studies should apply and calibrate the Scope 4 framework across different industries and test its adaptability and sector-specific implications. Incorporating the Scope 4 into institutional reporting frameworks requires a structured alignment with existing standards such as the GHG Protocol, the International Sustainability Standards Board (ISSB), the Corporate Sustainability Reporting Directive (CSRD), and Science-Based Targets Initiative (SBTi). Such integration can definitely elevate the value of using and further adopting the accounting of avoided emissions and allow policy makers to develop ad hoc directives and regulations for companies to formally include it in the carbon accounting. This study assumes constant user behavior and does not account for rebound effects or external disruptions; future research should integrate behavioral dynamics and systemic feedback loops to better capture real-world variability in avoided emissions outcomes. Comparative cross-industry case studies could further examine the framework’s robustness and flexibility. In this regard, Scope 4 proposes an emerging scientific agenda where industrial ecology, climate policy, ESG performance measurement, and sustainable operations management intersect to generate novel and unique research. Hence, interdisciplinary research might explore how Scope 4 informs behavioral economics, climate justice, and environmental finance, and which new incentive and disclosure mechanisms can be tapped.
Funding
This research received no external funding.
Institutional Review Board Statement
Not applicable.
Informed Consent Statement
Not applicable.
Data Availability Statement
The raw data supporting the conclusions of this article will be made available by the authors on request.
Conflicts of Interest
The author declares no conflicts of interest.
References
- IPCC. Climate Change 2021: The Physical Science Basis; Cambridge University Press: Cambridge, UK, 2021; Available online: http://www.ipcc.ch/report/ar6/wg1/ (accessed on 4 July 2025).
- He, R.; Luo, L.; Shamsuddin, A.; Tang, Q. Corporate carbon accounting: A literature review of carbon accounting research from the Kyoto Protocol to the Paris Agreement. Account. Financ. 2022, 62, 261–298. [Google Scholar] [CrossRef]
- WRI; WBCSD. The Greenhouse Gas Protocol: A Corporate Accounting and Reporting Standard (Revised Edition); World Resources Institute: Washington, DC, USA; World Business Council for Sustainable Development: Geneva, Switzerland, 2004; Available online: https://archive.wbcsd.org/contentwbc/download/2670/33469/1 (accessed on 4 July 2025).
- Downie, J.; Stubbs, W. Corporate carbon strategies and greenhouse gas emission assessments: The implications of scope 3 emission factor selection. Bus. Strategy Environ. 2012, 21, 412–422. [Google Scholar] [CrossRef]
- Erickson, P.; Lazarus, M.; Spalding-Fecher, R. Net climate change mitigation of the Clean Development Mechanism. Energy Policy 2014, 72, 146–154. [Google Scholar] [CrossRef]
- De Giovanni, P.; Costabile, M. Quantifying Social and Environmental Impacts Through the Life Cycle Assessment: Life Cycle Assessment and Impacts; Corporate Governance and Research & Development Studies: Napoli, Italy, 2025. [Google Scholar]
- Eccles, R.G.; Klimenko, S. The investor revolution. Harv. Bus. Rev. 2019, 97, 106–116. [Google Scholar]
- Sethi, S.P.; Rovenpor, J.L.; Demir, M. Enhancing the quality of reporting in Corporate Social Responsibility guidance documents: The roles of ISO 26000, Global Reporting Initiative and CSR-Sustainability Monitor. Bus. Soc. Rev. 2017, 122, 139–163. [Google Scholar] [CrossRef]
- Hertwich, E.G.; Wood, R. The growing importance of scope 3 greenhouse gas emissions from industry. Environ. Res. Lett. 2018, 13, 104013. [Google Scholar] [CrossRef]
- CDSB. Environmental and Climate Change Reporting Framework; Climate Disclosure Standards Board: London, UK, 2019; Available online: https://www.wemeanbusinesscoalition.org/wp-content/uploads/2021/12/cdsb_framework_2019_v2.2.pdf (accessed on 4 July 2025).
- Schaltegger, S.; Csutora, M. Carbon accounting for sustainability and management. J. Clean. Prod. 2012, 36, 1–16. [Google Scholar] [CrossRef]
- Reid, E.M.; Toffel, M.W. Responding to public and private politics: Corporate disclosure of climate change strategies. Strateg. Manag. J. 2009, 30, 1157–1178. [Google Scholar] [CrossRef]
- Weidema, B.P.; Thrane, M.; Christensen, P.; Schmidt, J.; Løkke, S. Carbon footprint: A catalyst for life cycle assessment? J. Ind. Ecol. 2008, 12, 3–6. [Google Scholar] [CrossRef]
- Defra. UK Government GHG Conversion Factors for Company Reporting 2023. 2023. Available online: https://www.gov.uk/government/publications/greenhouse-gas-reporting-conversion-factors-2023 (accessed on 4 July 2025).
- CDP. Engaging the Chain: Driving Speed and Scale. 2022. Available online: https://cdn.cdp.net/cdp-production/cms/reports/documents/000/006/106/original/CDP_SC_Report_2021.pdf?1644513297 (accessed on 4 July 2025).
- Wiedmann, T.; Minx, J. A definition of ‘carbon footprint’. In Ecological Economics Research Trends; Pertsova, C.C., Ed.; Nova Science Publishers: Hauppauge, NY, USA, 2008; pp. 1–11. [Google Scholar]
- Pandey, D.; Agrawal, M.; Pandey, J.S. Carbon footprint: Current methods of estimation. Environ. Monit. Assess. 2011, 178, 135–160. [Google Scholar] [CrossRef]
- Wiedmann, T.; Lenzen, M.; Turner, K.; Barrett, J. Examining the global environmental impact of regional consumption activities—Part 2: Review of input-output models for the assessment of environmental impacts embodied in trade. Ecol. Econ. 2009, 69, 211–222. [Google Scholar] [CrossRef]
- ISO 14044; Environmental Management—Life Cycle Assessment—Requirements and Guidelines. International Organization for Standardization: London, UK, 2006. Available online: https://www.en-standard.eu/bs-en-iso-14044-2006-a2-2020-environmental-management-life-cycle-assessment-requirements-and-guidelines/?msclkid=a4c05d612e3e1c2731fe35126a4f90e7 (accessed on 4 July 2025).
- Maleki Vishkaei, B.; De Giovanni, P. Smart food-sharing platforms for social sustainability: A heuristic algorithm approach. Int. Trans. Oper. Res. 2024. early view. [Google Scholar] [CrossRef]
- IEA. The Future of Heat Pumps; International Energy Agency: Paris, France, 2022; Available online: http://www.iea.org/reports/the-future-of-heat-pumps (accessed on 4 July 2025).
- Creutzig, F.; Jochem, P.; Edelenbosch, O.Y.; Mattauch, L.; van Vuuren, D.P.; McCollum, D.; Minx, J. Transport: A roadblock to climate change mitigation? Science 2015, 350, 911–912. [Google Scholar] [CrossRef]
- Maleki Vishkaei, B.; De Giovanni, P. A smart mobility game with blockchain and hardware oracles. Int. J. Prod. Econ. 2025, 282, 109533. [Google Scholar] [CrossRef]
- Gössling, S.; Hall, C.M. The Sustainable Chef: The Environment in Culinary Arts, Restaurants, and Hospitality; Routledge: London, UK, 2021. [Google Scholar]
- Science Based Targets initiative (SBTi). Foundations for Science-Based Net-Zero Target Setting in the Financial Sector. 2023. Available online: https://files.sciencebasedtargets.org/production/files/Foundations-for-Science-Based-Net-Zero-Target-Setting-in-the-Financial-Sector.pdf (accessed on 4 July 2025).
- EU Taxonomy. EU Taxonomy Climate Delegated Act. 2021. Available online: https://www.europarl.europa.eu/RegData/etudes/BRIE/2022/698935/EPRS_BRI(2022)698935_EN.pdf (accessed on 4 July 2025).
- GRI. Universal Standards 2021. 2021. Available online: http://www.globalreporting.org/standards/standards-development/universal-standards/ (accessed on 4 July 2025).
- McKinsey & Company. How to Succeed with Carbon Reduction Emissions. 2020. Available online: http://www.mckinsey.com/capabilities/strategy-and-corporate-finance/our-insights/on-target-how-to-succeed-with-carbon-reduction-initiatives (accessed on 4 July 2025).
- Russel, S. Estimating and Reporting the Comparative Emissions Impacts of Products; World Resources Institute: Washington, DC, USA, 2019. [Google Scholar]
- TCFD. Final Report: Recommendations of the Task Force on Climate-Related Financial Disclosures. 2023. Available online: https://www.fsb.org/2017/06/recommendations-of-the-task-force-on-climate-related-financial-disclosures-2/#:~:text=This%20report%20by%20the%20Task%20Force%20on%20Climate-related,FSB%20has%20welcomed%20the%20publication%20of%20the%20recommendations (accessed on 4 July 2025).
- UEFA. Football Sustainability Strategy 2030; Union of European Football Associations: Nyon, Switzerland, 2022. [Google Scholar]
- Environmental Protection Agency. EPA Releases 2021 Data Collected under Greenhouse Gas Reporting Program. 2022. Available online: https://www.epa.gov/newsreleases/epa-releases-2021-data-collected-under-greenhouse-gas-reporting-program (accessed on 22 August 2025).
- Brander, M.; Sood, A.; Wylie, C.; Haughton, A.; Lovell, J. Electricity-Specific Emission Factors for Grid Electricity: Technical Paper; Ecometrica: Edinburgh, Scotland, 2011; Available online: https://bravenewclimate.com/files/assets/media/pdf/electricity_factors_paper.pdf (accessed on 1 September 2025).
- GHG. Global GHG Emissions Hit Record High in 2013. 2014. Available online: https://unfccc.int/news/global-ghg-emissions-hit-record-high-in-2013 (accessed on 22 August 2025).
- Collins, A.; Jones, C.; Munday, M. Assessing the environmental impacts of mega sporting events: Two options? Tour. Manag. 2007, 28, 828–837. [Google Scholar] [CrossRef]
- Filimonau, V.; Dickinson, J.; Robbins, D. The carbon impact of short-haul tourism: A case study of UK travel to Southern France using life cycle analysis. J. Clean. Prod. 2014, 64, 628–638. [Google Scholar] [CrossRef]
- Pomponi, F.; Moncaster, A. Scrutinising embodied carbon in buildings: The next performance gap made manifest. Renew. Sustain. Energy Rev. 2018, 81, 2431–2442. [Google Scholar] [CrossRef]
- Coroama, V.C.; Hilty, L.M.; Heiri, E.; Horn, F.M. The direct energy demand of internet data flows. J. Ind. Ecol. 2013, 17, 680–688. [Google Scholar] [CrossRef]
- Zender–Świercz, E. A review of heat recovery in ventilation. Energies 2021, 14, 1759. [Google Scholar] [CrossRef]
- Cao, X.; Dai, X.; Liu, J. Building energy-consumption status worldwide and the state-of-the-art technologies for zero-energy buildings during the past decade. Energy Build. 2016, 128, 198–213. [Google Scholar] [CrossRef]
- Poore, J.; Nemecek, T. Reducing food’s environmental impacts through producers and consumers. Science 2018, 360, 987–992. [Google Scholar] [CrossRef]
- McKinsey & Company. Tackling Scope 3 Emissions Through Supplier Collaboration. McKinsey Sustainability Insights. 2023. Available online: https://www.mckinsey.com/capabilities/sustainability/our-insights/sustainability-blog/tackling-scope-3-emissions-through-supplier-collaboration (accessed on 4 July 2025).
- Ivanova, D.; Barrett, J.; Wiedenhofer, D.; Macura, B.; Callaghan, M.; Creutzig, F. Quantifying the potential for climate change mitigation of consumption options. Environ. Res. Lett. 2020, 15, 093001. [Google Scholar] [CrossRef]
- UNEP. UN Environmental Programme. Annual Report. 2022. Available online: https://www.unep.org/resources/annual-report-2022 (accessed on 22 August 2025).
- Diplo. Global e-Sustainable Initiatives. 2021. Available online: https://www.gesi.org (accessed on 22 August 2025).
- IRENA. Electricity Storage and Renewables: Costs and Markets to 2030; International Renewable Energy Agency: Masdar City, Abu Dhabi, 2021; Available online: http://www.irena.org/publications/2017/Oct/Electricity-storage-and-renewables-costs-and-markets (accessed on 4 July 2025).
- Re100. Climate Group and CDP. RE100 Annual Progress and Insights Report. 2023. Available online: https://www.there100.org/our-work/publications/re100-2023-annual-disclosure-report (accessed on 4 July 2025).
- De Giovanni, P.; Ramani, V. A selected survey of game theory models with government schemes to support circular economy systems. Sustainability 2024, 16, 136. [Google Scholar] [CrossRef]
- Ramani, V.; De Giovanni, P. Circular economy business strategies and public schemes: A game theory-based survey. Int. Trans. Oper. Res. 2025; early view. [Google Scholar]


Disclaimer/Publisher’s Note: The statements, opinions and data contained in all publications are solely those of the individual author(s) and contributor(s) and not of MDPI and/or the editor(s). MDPI and/or the editor(s) disclaim responsibility for any injury to people or property resulting from any ideas, methods, instructions or products referred to in the content. |
© 2025 by the author. Licensee MDPI, Basel, Switzerland. This article is an open access article distributed under the terms and conditions of the Creative Commons Attribution (CC BY) license (https://creativecommons.org/licenses/by/4.0/).