1. Introduction
The intensifying global climate crisis has accelerated the demand for transformative innovations in the energy sector, particularly those that support carbon neutrality and enhance climate resilience [
1]. As nations advance their commitments under the Paris Agreement [
2] and strive toward the United Nations Sustainable Development Goals (SDGs), notably SDG 7 (Affordable and Clean Energy) and SDG 13 (Climate Action) [
3]. The large-scale deployment of renewable energy technologies has become a strategic imperative [
4,
5]. Among these, solar energy stands out for its abundance, scalability, and rapidly declining costs [
6,
7,
8]. However, real-world deployment of solar technologies, especially in arid and semi-arid regions such as the Middle East, Africa, and Central Asia, faces persistent challenges [
9,
10]. Harsh climatic conditions, characterized by dust accumulation, high ambient temperatures, and intense solar irradiance, lead to substantial performance degradation in conventional photovoltaic (PV) systems [
6]. Dust-induced soiling can reduce efficiency by over 30–40%, while thermal stress negatively impacts PV performance and accelerates material fatigue [
9,
11]. Simultaneously, the growing demand for thermal energy in these regions, for air conditioning, desalination, and industrial heat, remains inefficiently addressed by standalone PV systems [
12]. Consequently, hybrid solar photovoltaic–thermal (PVT) technologies have emerged as viable solutions for dual-mode energy harvesting [
13,
14].
The hybrid PV/T systems were introduced to the market early in the year 2000 [
15], but the products at that time were too expensive with low reliability, while the outlet temperature was limited to 60–75 °C to avoid comptonization of the electrical efficiency of PV modules [
16]. Moreover, the thermal efficiency is inversely proportional to the outlet temperature of the cooling water, which represents another limitation for the outlet water temperature for this conventional PV/T technology [
17]. Hence, the system is heavily coupled with a severe trade-off between the overall efficiency and the outlet water temperature that dictates the “usability” or number of applications to utilize this thermal energy at low temperature quality. Therefore, this low temperature level can be used only for limited applications such as swimming pool heating, space heating, domestic hot water, and a very narrow window of process heat [
18,
19].
Unlike standalone PV or thermal collectors, PVT systems simultaneously generate electricity and capture usable heat, increasing the overall solar utilization efficiency of a given area [
20]. Recent reviews highlight their suitability in climate-stressed regions, particularly when integrated with storage systems and heat pumps [
21]. A 2021 meta-analysis review by Bandaru et al. examined over 160 water-based PVT systems. It concluded that while standard PVT panels offer electrical efficiencies of ~15–18% and thermal efficiencies exceeding 50%, the integration of advanced heat transfer techniques (e.g., nanofluids, turbulators) can push thermal performance up to 80–85% [
22]. However, many existing systems are designed for temperate climates and underperform in high-irradiance, high-temperature regions like the Middle East and North Africa (MENA) [
6,
23,
24].
Recent experimental investigations have explored unconventional geometries to improve the performance of solar thermal collectors. One notable approach involves the use of reverse flat plate collectors (RFPCs), an inverted absorber configuration combined with a stationary reflector to concentrate solar radiation upward [
25,
26]. The concept of RFPC, central to the Hassabou collector, has gained increasing attention due to its potential to suppress convective heat losses and improve stratification [
27]. Traditional flat-plate collectors suffer from overheating and inefficiencies when operating at intermediate temperatures (100–200 °C) [
28], a gap that RFPCs aim to address.
A major frontier in PVT and thermal collector design involves the use of enhanced heat transfer fluids, especially nanofluids [
29]. Nanoparticles such as Al
2O
3, CuO, and TiO
2 dispersed in base fluids (e.g., water or glycol) substantially improve thermal conductivity and heat transfer coefficients [
30,
31]. Zaboli et al. (2023) conducted a comparative assessment of nanofluid-enhanced collectors and reported thermal efficiencies exceeding 86.5%, with a Nusselt number increase of 40–60% when coupled with twisted tape turbulators [
32]. However, few studies have combined these enhancements in vertically stacked or hybrid RFPC–PVT configurations.
Moreover, thermal energy storage (TES) integration remains a key enabler of operational stability in hybrid solar systems [
33,
34]. Phase change materials (PCMs), sensible heat storage tanks, and stratified water tanks allow for the buffering of thermal loads and improve the matching of supply and demand [
35,
36]. Okamkpa et al. (2024) demonstrated that coupling a PCM-enhanced TES tank with a hybrid PVT-thermoelectric panel increased electrical output by up to 68% and reduced temperature fluctuations in output water by more than 30% [
37]. Similarly, studies by Li et al. (2022) modeled hybrid PVT–PCM systems in desert climates and observed a 25% extension in the daily operational window due to stored heat reusability [
38]. The Hassabou system’s inclusion of a ground-mounted TES tank—insulated and operating in the intermediate temperature range—is thus aligned with global trends toward load-shifting and energy resilience, particularly in off-grid or water-scarce regions [
27]. However, this analysis shall focus only on the solar collector, as the main engine in different solar systems serves different applications.
When considering both energy quantity and quality, exergy analysis becomes essential for solar system optimization. A 2019 field study conducted in Ghana assessed the performance of a commercial water-based photovoltaic–thermal system compared to a conventional photovoltaic module under real-world tropical conditions. Installed at the Kwame Nkrumah University of Science and Technology, the system integrated a 200 W mono-crystalline PV module with a water-cooling mechanism to provide both electrical and thermal outputs. Over the testing period, the hybrid PVT module achieved an average electrical efficiency of approximately 13.5% [
39], while the standalone PV module recorded around 11.4%, reflecting a ~2.1% absolute gain due to cooling [
40]. Additionally, the PVT system delivered usable thermal energy with output temperatures reaching up to 55 °C, suitable for domestic water heating and sanitation applications [
41]. The system operated reliably across varying solar irradiance levels typical of the hot-humid sub-Saharan climate. While the study provided valuable operational insights for the deployment of hybrid solar systems in West Africa, it did not include exergy analysis, limiting its assessment of the thermodynamic quality of energy conversion [
42].
Similarly, an experimental study in Sharjah, United Arab Emirates, evaluated a prototype polycrystalline solar panel integrated with a backside water-cooling plate to form a hybrid PVT system. The study demonstrated that water cooling led to a 15–20% increase in electrical output relative to a PV-only setup due to reduced panel temperatures. More notably, the system achieved thermal efficiencies ranging from 60 to 70%, indicating substantial recovery of solar heat in the arid desert environment. Despite its promising results, the study did not perform an exergy analysis or assess the combined thermodynamic efficiency of the system. Nonetheless, it underscored the benefits of simple water-based cooling strategies for enhancing PV performance in high-temperature regions [
43].
Economic assessments are equally encouraging. A recent study uses Qatar’s first utility-scale PV installation, the 800 MWp Alkarsaah PV farm, as a case study to evaluate the design and economic viability of large-scale solar power in the Gulf region. Despite the rapid deployment of PV systems in the GCC, detailed economic analyses of such projects remain limited. The study compares the Levelized Cost of Electricity (LCOE) of Alkarsaah—calculated at
$14.03/MWh—with the region’s most efficient combined cycle power plants (CCPP), which have LCOEs of
$39.18/MWh and
$24.6/MWh. The results underscore the economic superiority of PV farms over fossil-based systems in achieving cost-effective, low-carbon energy transitions in the GCC [
44]. It is worth mentioning that the conventional CCPP delivers stabilized power that is dispatchable on demand day and night, with obvious benefits for smooth operation of the public grid as well as efficient demand-supply management, which cannot be achieved with high reliability and cost-effectiveness with conventional PV systems when integrated with electric batteries.
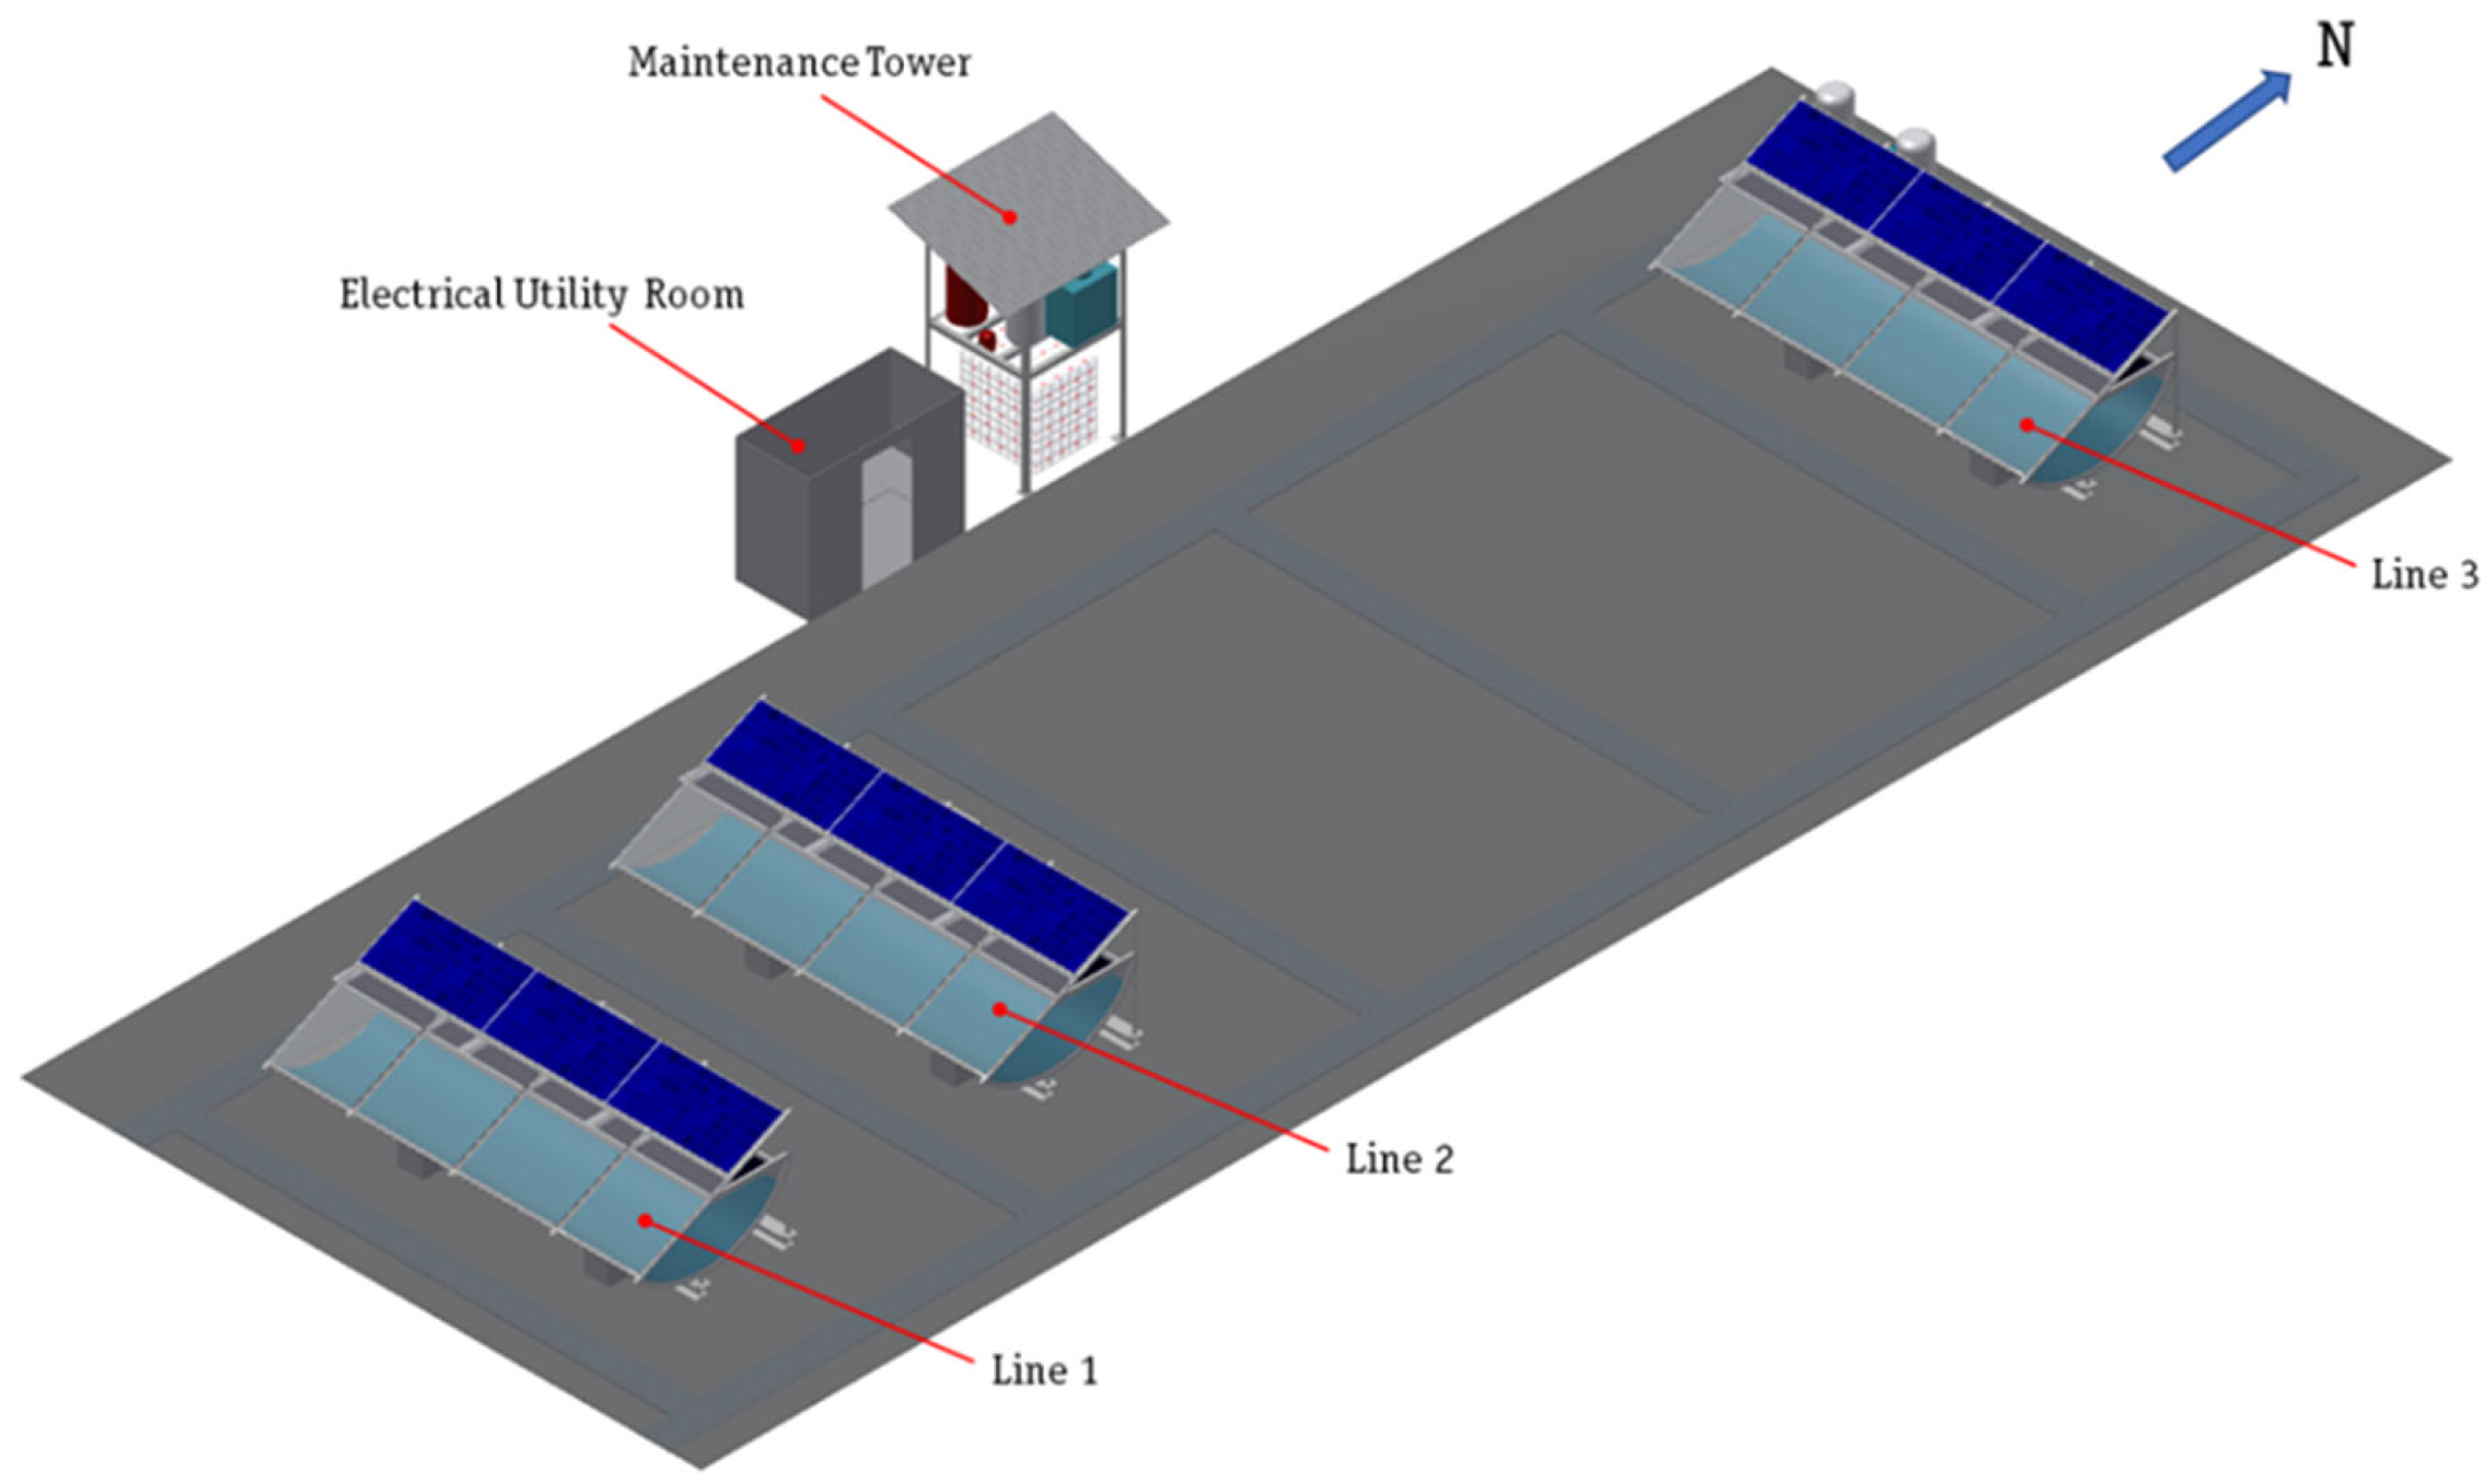
Despite growing interest in hybrid solar systems, few studies comprehensively evaluate hybrid PVT–RFPC configurations under arid climate conditions using both experimental and simulation approaches. The novelty of this work lies in deploying a vertically stacked PVT + RFPC system inspired by the innovative design of Hassabou (WO2017136377A1), which integrates reflective concentrators, stratified thermal storage, and dual fluid loops for optimized energy capture. The system was tested under real environmental conditions in Germany and Qatar and further analyzed using its own technical and financial models using typical meteorological year (TMY) data. Unlike prior studies, this research benchmarks system performance not only in terms of electrical and thermal efficiency but also evaluates exergy output, Levelized Cost of Energy, and lifecycle CO2 savings. Moreover, it contextualizes deployment potential within national decarbonization strategies across MENA and Sub-Saharan Africa, regions characterized by abundant solar resources but limited PVT uptake. This integrative methodology advances the field by bridging technological innovation, technoeconomic feasibility, and policy-oriented relevance, filling a critical gap in scalable solar solutions for climate-vulnerable regions.
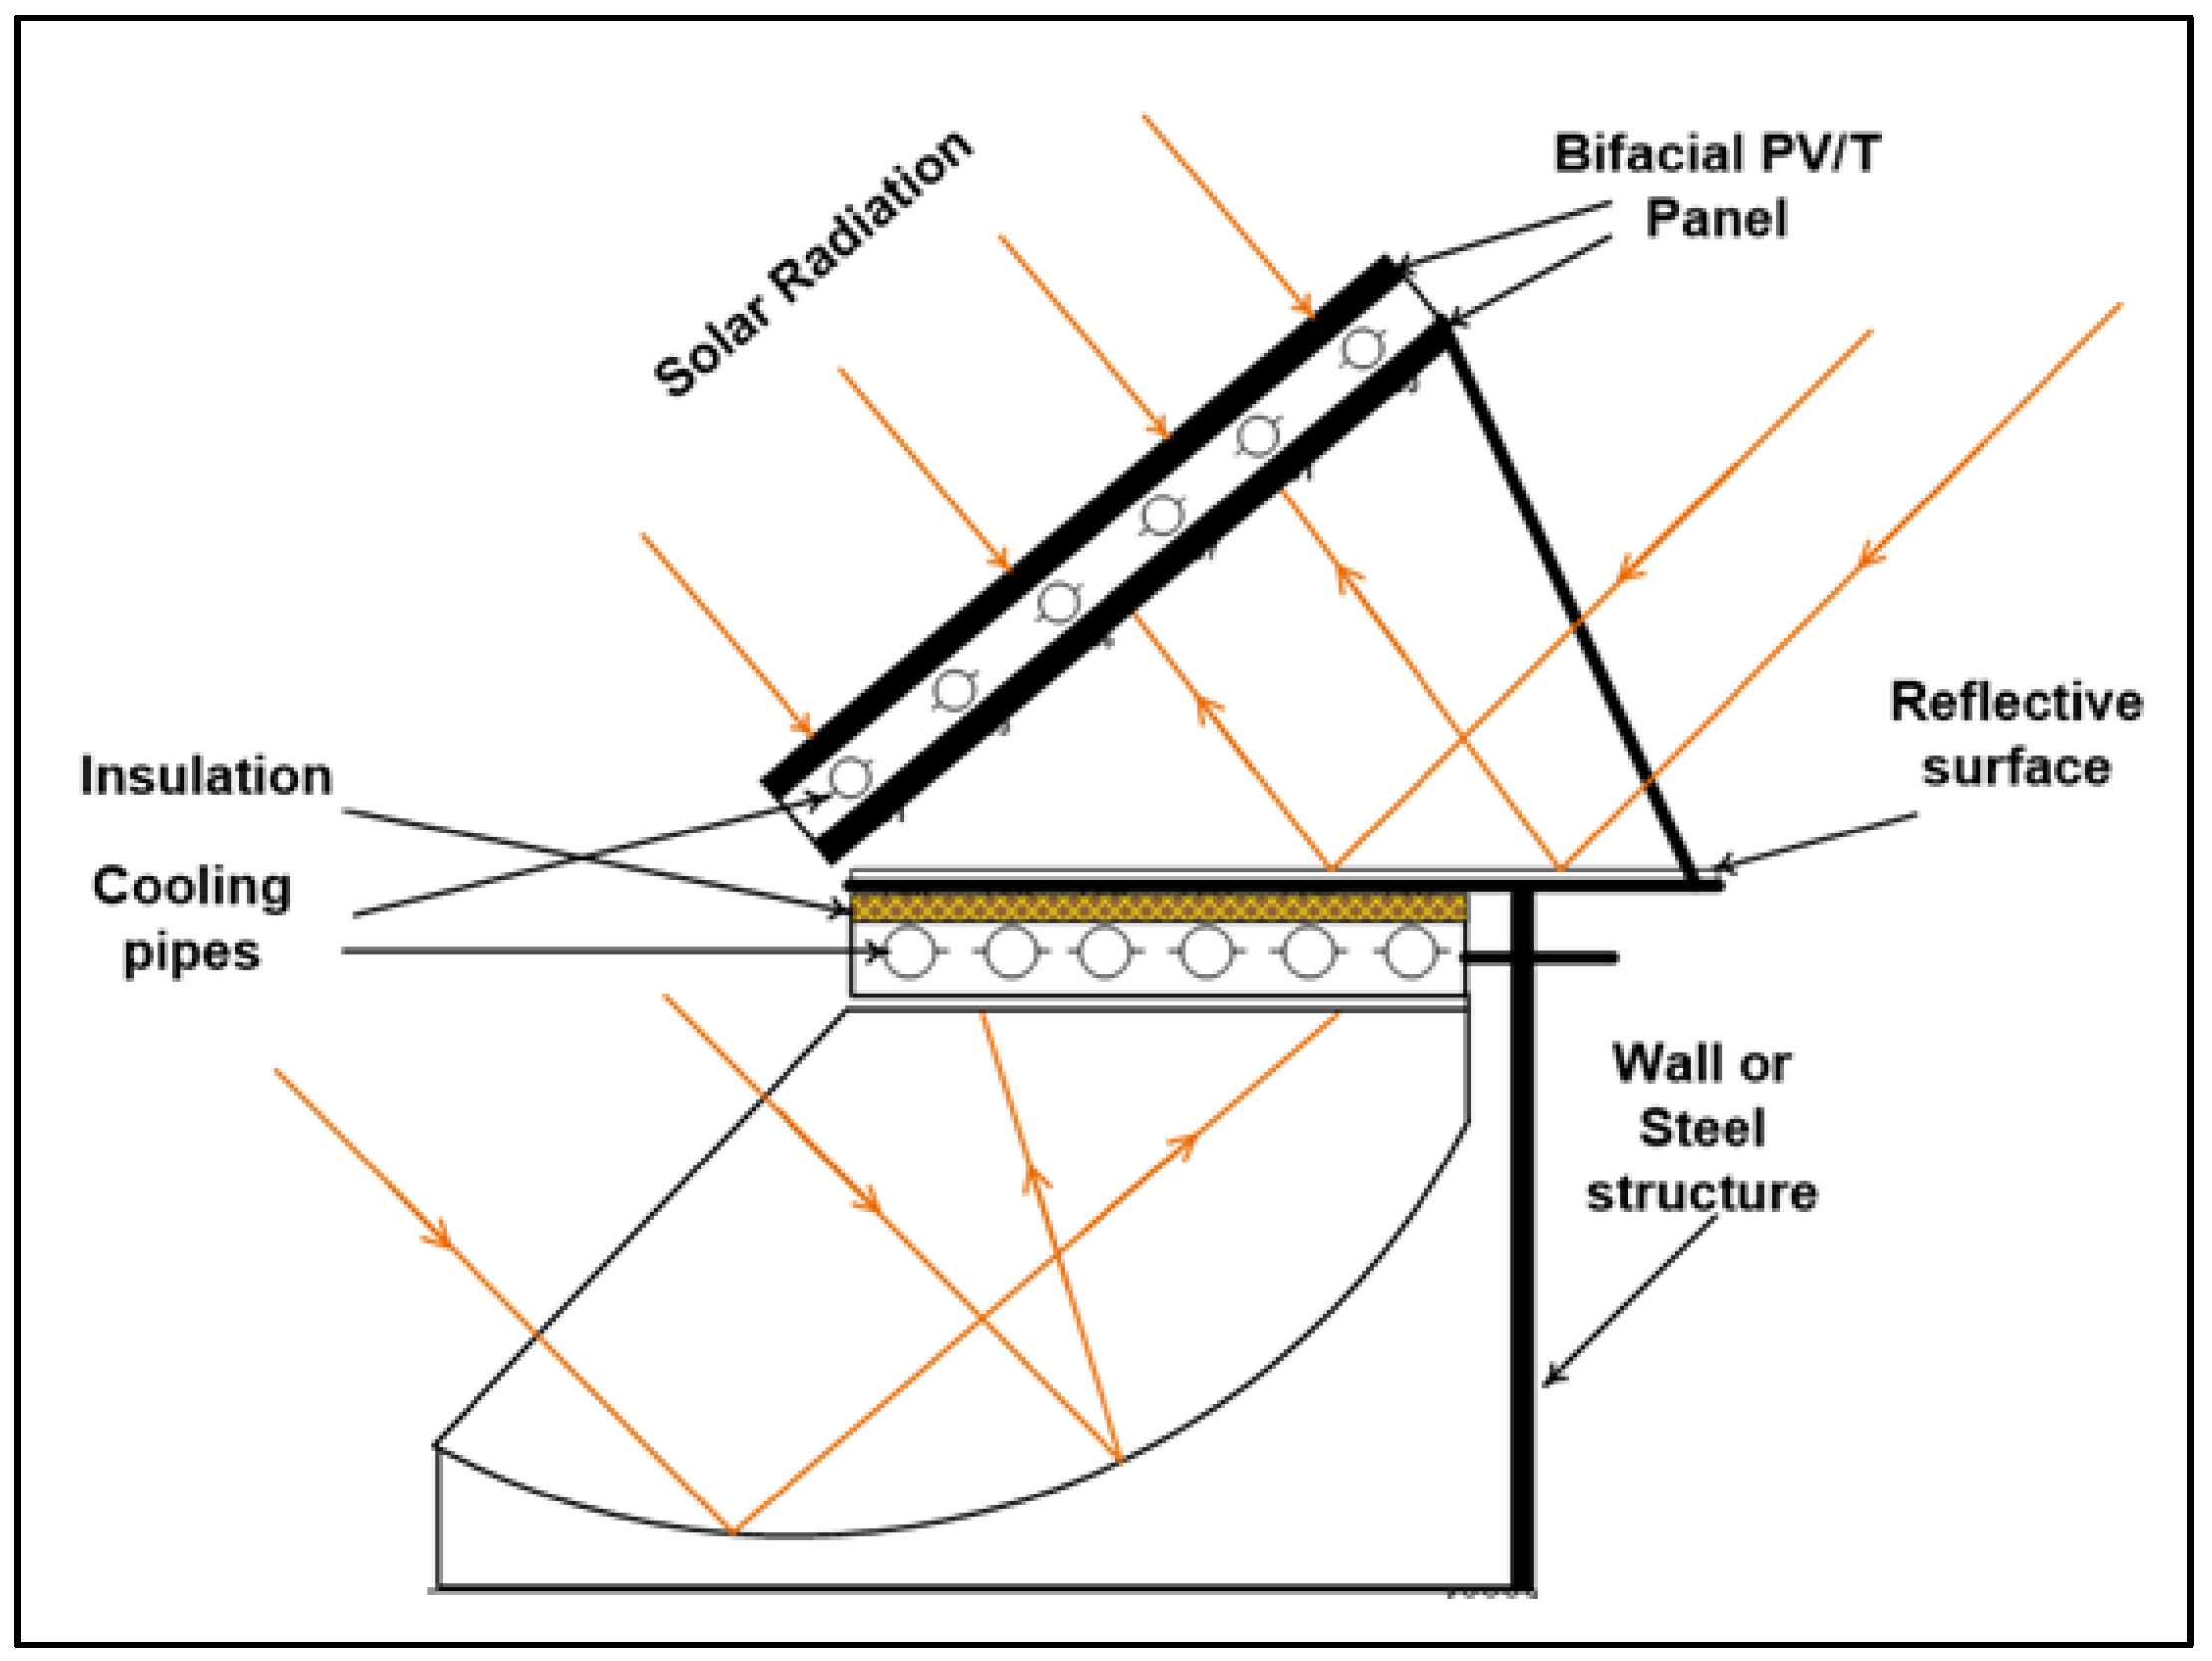
In response to these challenges, Hassabou’s collector (U.S. Patent No. 11,431,289 B2) introduces a novel hybrid photovoltaic–thermal (PVT) system that combines a reverse flat plate collector (RFPC) with a multi-functional PVT panel. This system is engineered to improve energy efficiency, mitigate performance losses under extreme weather conditions, and maximize total energy yield.
In addition to technical gains, the system offers a reduced structural footprint—critical for both urban, on-grid and off-grid applications—and supports integration with storage solutions and microgrids. It thus presents a flexible platform for improving energy resilience and grid stability, particularly in resource-constrained or climate-stressed environments.
This study evaluates the real-world performance of the hybrid PVT–RFPC system, focusing on its technical, economic, and environmental impacts. Specifically, it aims to (1) assess the system’s electro-thermal efficiency under varying irradiance and temperature profiles; (2) benchmark its performance against conventional standalone PV and thermal systems; (3) analyze lifecycle benefits, including carbon emission reductions and improvements in LCOE; and (4) explore scalable deployment models across residential, industrial, and remote settings.
By aligning engineering innovation with policy imperatives, this research positions the hybrid PVT–RFPC system as a scalable and climate-adaptive solution to pressing energy challenges. It contributes to the discourse on integrated solar technologies that support sustainable development and national decarbonization pathways.
3. Results and Discussions
3.1. Conventional PVT and the Mini CSP/RFPC
For conventional PVT, i.e., the upper part, the useful thermal power output is dependent on the inlet and outlet temperatures of the HTF. The higher the outlet temperature, the lower the thermal efficiency of the collector. The simulation results for the conventional PVT yielded a thermal power of 660 W/m2 compared to measured data of 490 W/m2 (Gs = 1000 W/m2, dT = 35 K from 25 °C to 60 °C). Considering an average PVT collector temperature of 42.5 °C, the thermal peak capacity according to the measured data is estimated at 564 W/m2. Hence, the temperature-dependent convective heat loss factor a2 of 0 W/K2/m2 is deemed optimistic compared to a standard FPC with 0.017 W/K2/m2. Therefore, it is determined that the realistic heat loss factor a2 is to be considered as 50% of the standard efficiency factors mentioned above. This conservative value shall be considered for the lifecycle analysis of industrial-scale power plants.
The maximum attainable thermal efficiency of a flat plate thermal collector (FPC), i.e., the optical efficiency a
0 =
η0, is usually around 80%. For conventional PVT systems, i.e., the upper part of the Hassabou Collector, and in reference to
Table 1, the thermal efficiency is around 62–63% since the thermal absorber is receiving solar heat indirectly through the back side of the PV module. However, this conventional design of PVT significantly increases the overall efficiency up to >85% compared to the efficiency of around 22–24% for PV alone for a temperature difference of 35 °C between the outlet water and ambient temperatures.
The possible losses in a conventional FPC facing upward are attributed mainly to convection losses (~13%), absorber reflection losses (~8%), and absorber radiation losses (~6%).
For the mini-CSP/RFPC, the reversed position of the FPC suppresses the natural convection currents and drastically reduces both reflection (due to the existence of reflecting mirrors) and radiation losses because the absorber does not see the sky. Therefore, the RFPC produces better efficiency with at least 10% enhancement over that of conventional FPCs due to a significant reduction of at least 50% of the losses at the same temperature level, i.e., thermal efficiency of 72–73%, with no evacuation. Moreover, the incident solar radiation on the RFPC is almost double that falling on the PVT module due to the larger aperture (reflecting mirrors) area. Hence, the weighted average thermal efficiency of the top thermal absorber and the RFPC is calculated at 69%, which results in an overall efficiency of Hassabou Collector, i.e., including the PV efficiency 22–24%, is approximately 91–93%.
3.2. Energy Output Comparisons with Existing Systems
The Hassabou PVT system delivers a thermal peak capacity (at 130 °C outlet hot pressurized water temperature) of the RFPC part of the collector. It is calculated as 315 W/m2 glass surface or 566 W/m2 absorber surface (Global Solar Radiation = 1000 W/m2, T = 105 K from 25 °C to 130 °C).
The analysis results reveal that the heat-to-power ratio is 7/1, which means that for each one kWh of electricity produced by the installed PV system, 7 kWh of thermal energy is produced simultaneously at a temperature of 130 to 170 °C. However, to account for energy losses in the piping system and thermal energy storage that is estimated at 0.3–0.5% per hour, the net thermal energy to electrical energy ratio is considered 6/1.
Hence, the novel design of the thermal energy absorbers in Hassabou Collector captures and delivers a magnificent heat flow rate under all conditions, which otherwise would have been wasted to the ambience while drastically impacting the electrical efficiency and lifetime of PV modules. An overall efficiency of >90% for both thermal and electrical parts together was reported by the outcomes of the final project report.
It is worth noting that the available contemporary solar PVT technologies cannot deliver temperatures higher than 80 °C, with the vast majority delivering temperature levels limited to 60– 65 °C to avoid compromising the PV electrical efficiency and lifetime. Furthermore, by integrating an electric boiler to convert the electrical component into the Hassabou PVT system, the temperature level can be increased up to 310 °C, which covers the whole range of thermal applications with no additional equipment.
The PVT can be integrated with low-temperature power generation turbines such as Organic Rankine Cycle or low-temperature steam turbines, as shown in
Figure 6, to produce a firm capacity of stabilized electricity around the clock 24/7 with a long-duration hot pressurized water storage, thereby eliminating the need for electric batteries and molten salt.
Conventional PVT systems deliver a low temperature of a maximum of 60 °C of the HTF, which cannot be used in power generation for 24/7 operations. Similarly, PCM is used only for passive thermal management of PV modules, but cannot be used for 24/7 power generation. Nanofluids enhance the heat transfer characteristics, but again, this cannot contribute to increasing the HTF temperature in conventional PVT beyond 60 °C, which also cannot be used in power generation for 24/7 operation. However, Hassabou revolutionary PVT collectors can deliver temperatures higher than 100 °C, contrary to conventional PVT collectors that cannot contribute to continuous power generation using low-temperature steam turbines or ORC. Hence, considering such a specific application, the long-term duration of energy storage to deliver electrical power 24/7 based on thermal storage and low-temperature steam turbines or ORC is the focus of this paper.
3.3. Comparative Cost–Benefit Analysis
As far as the power supply is needed 24 h per day, this requires long-duration storage. Three different technologies that are considered state-of-the-art have been considered for this analysis to deliver continuous power during the day and night.
The technological options include:
Solar PV + Battery energy storage systems (BESS); PV + BESS
Hybrid PV + CSP equipped with molten salt thermal storage; PV + CSP
Hassabou Solar PV-T equipped with hot pressurized water thermal storage and Organic Rankine Cycle; PVT + TES + ORC
Due to the high costs of PV + BESSs, a hybrid PV (no batteries) + CSP (with molten salt storage) system has been introduced on the market in the last five years. In this case, it is necessary to have a labor force with two different skills to work side by side: one is trained to run PV, while the other has skills to run the sophisticated CSP systems. The land footprint is quite big to accommodate both standing-alone systems, even though they are collocated, while a sophisticated control system is essentially needed to guarantee a fully orchestrated performance. The CSP is bulky and sturdy. It requires sun tracking and uses evacuated tubes and molten salt storage that must always be in a liquid state, even during nighttime and under cold weather conditions. In some cases, maintaining the molten salt temperature above the solidification point requires that the system be equipped with natural gas burners. Furthermore, the energy yield of CSP systems on cloudy or dusty days is absolute zero since it relies on beam radiation that is available only on clear sky days.
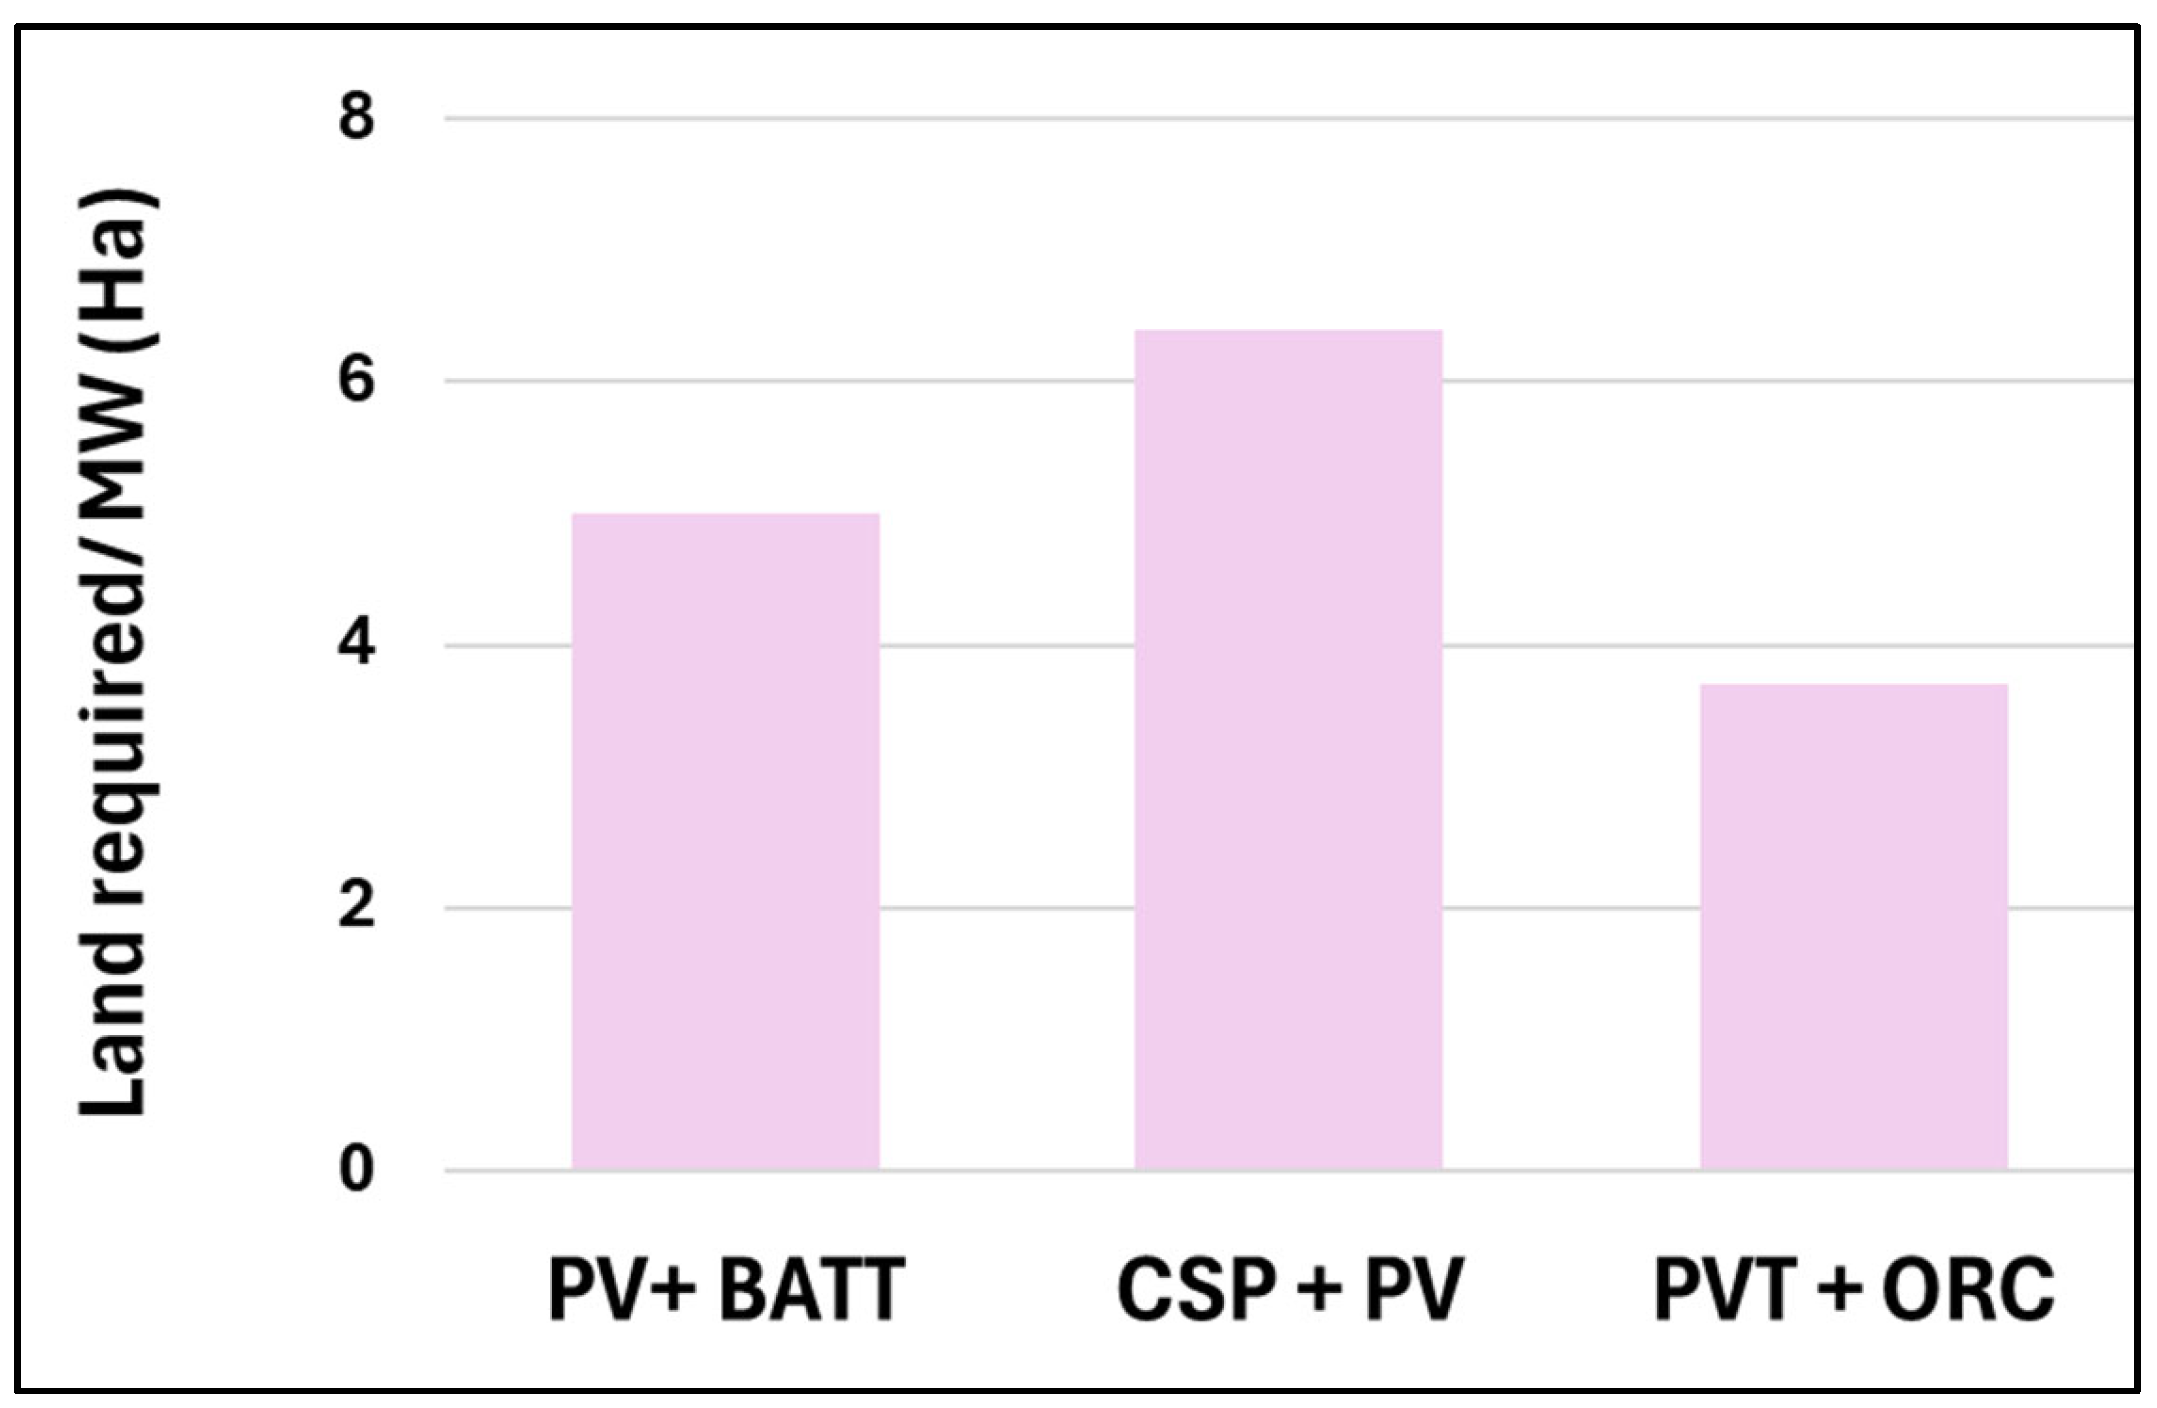
To overcome the above-mentioned challenges, the Hassabou PV-T collector combines both PV and CSP in one simple system. Compact, non-evacuated, stationary (non-tracking), non-evacuated absorbers, and no molten salt storage is needed, as it utilizes hot water storage. Furthermore, it utilizes both beam and diffuse radiation and delivers a firm capacity in both sunny and cloudy/dusty days with ultra-high efficiency and long-duration hot water thermal storage. Moreover, the system reduces the land footprint by 50–60% compared with the contemporary PV + BESS hybrid PV + CSP systems.
For hot climates, the lifetime of the PVT modules is 25 years, due to the built-in active cooling effect in the design, while the lifetime of the standing-alone PV modules in hot climates like GCC is predicted to be less than 15 years, which means the PV modules must be replaced at half the time. In comparison, the lifetime of the Li-ion batteries is 10 years, which means the BESS must be replaced twice during the lifetime of the project, with the battery costs discounted accordingly. Hence, the PV + BESS is extremely expensive since the BESS represents more than 60% of the total capital cost. This is a critical issue for the life cycle economic assessment, especially for large utility-scale projects.
As the Hassabou PVT technology delivers immense thermal energy at high temperatures above 100 °C simultaneously with electrical energy, it can serve almost all other applications and sectors globally for a successful transition towards a near-zero-carbon economy.
A techno-economic comparative analysis, with the financial model parameters presented in
Table 4, has been performed between the three technological options, considering the above-mentioned features of each system. The selected geographical location and the financial parameters are based on the market values in Riyadh, Saudi Arabia.
The levelized cost of energy (LCOE) is calculated for each specific case, and the average LCOE is then evaluated over the lifetime of the plant.
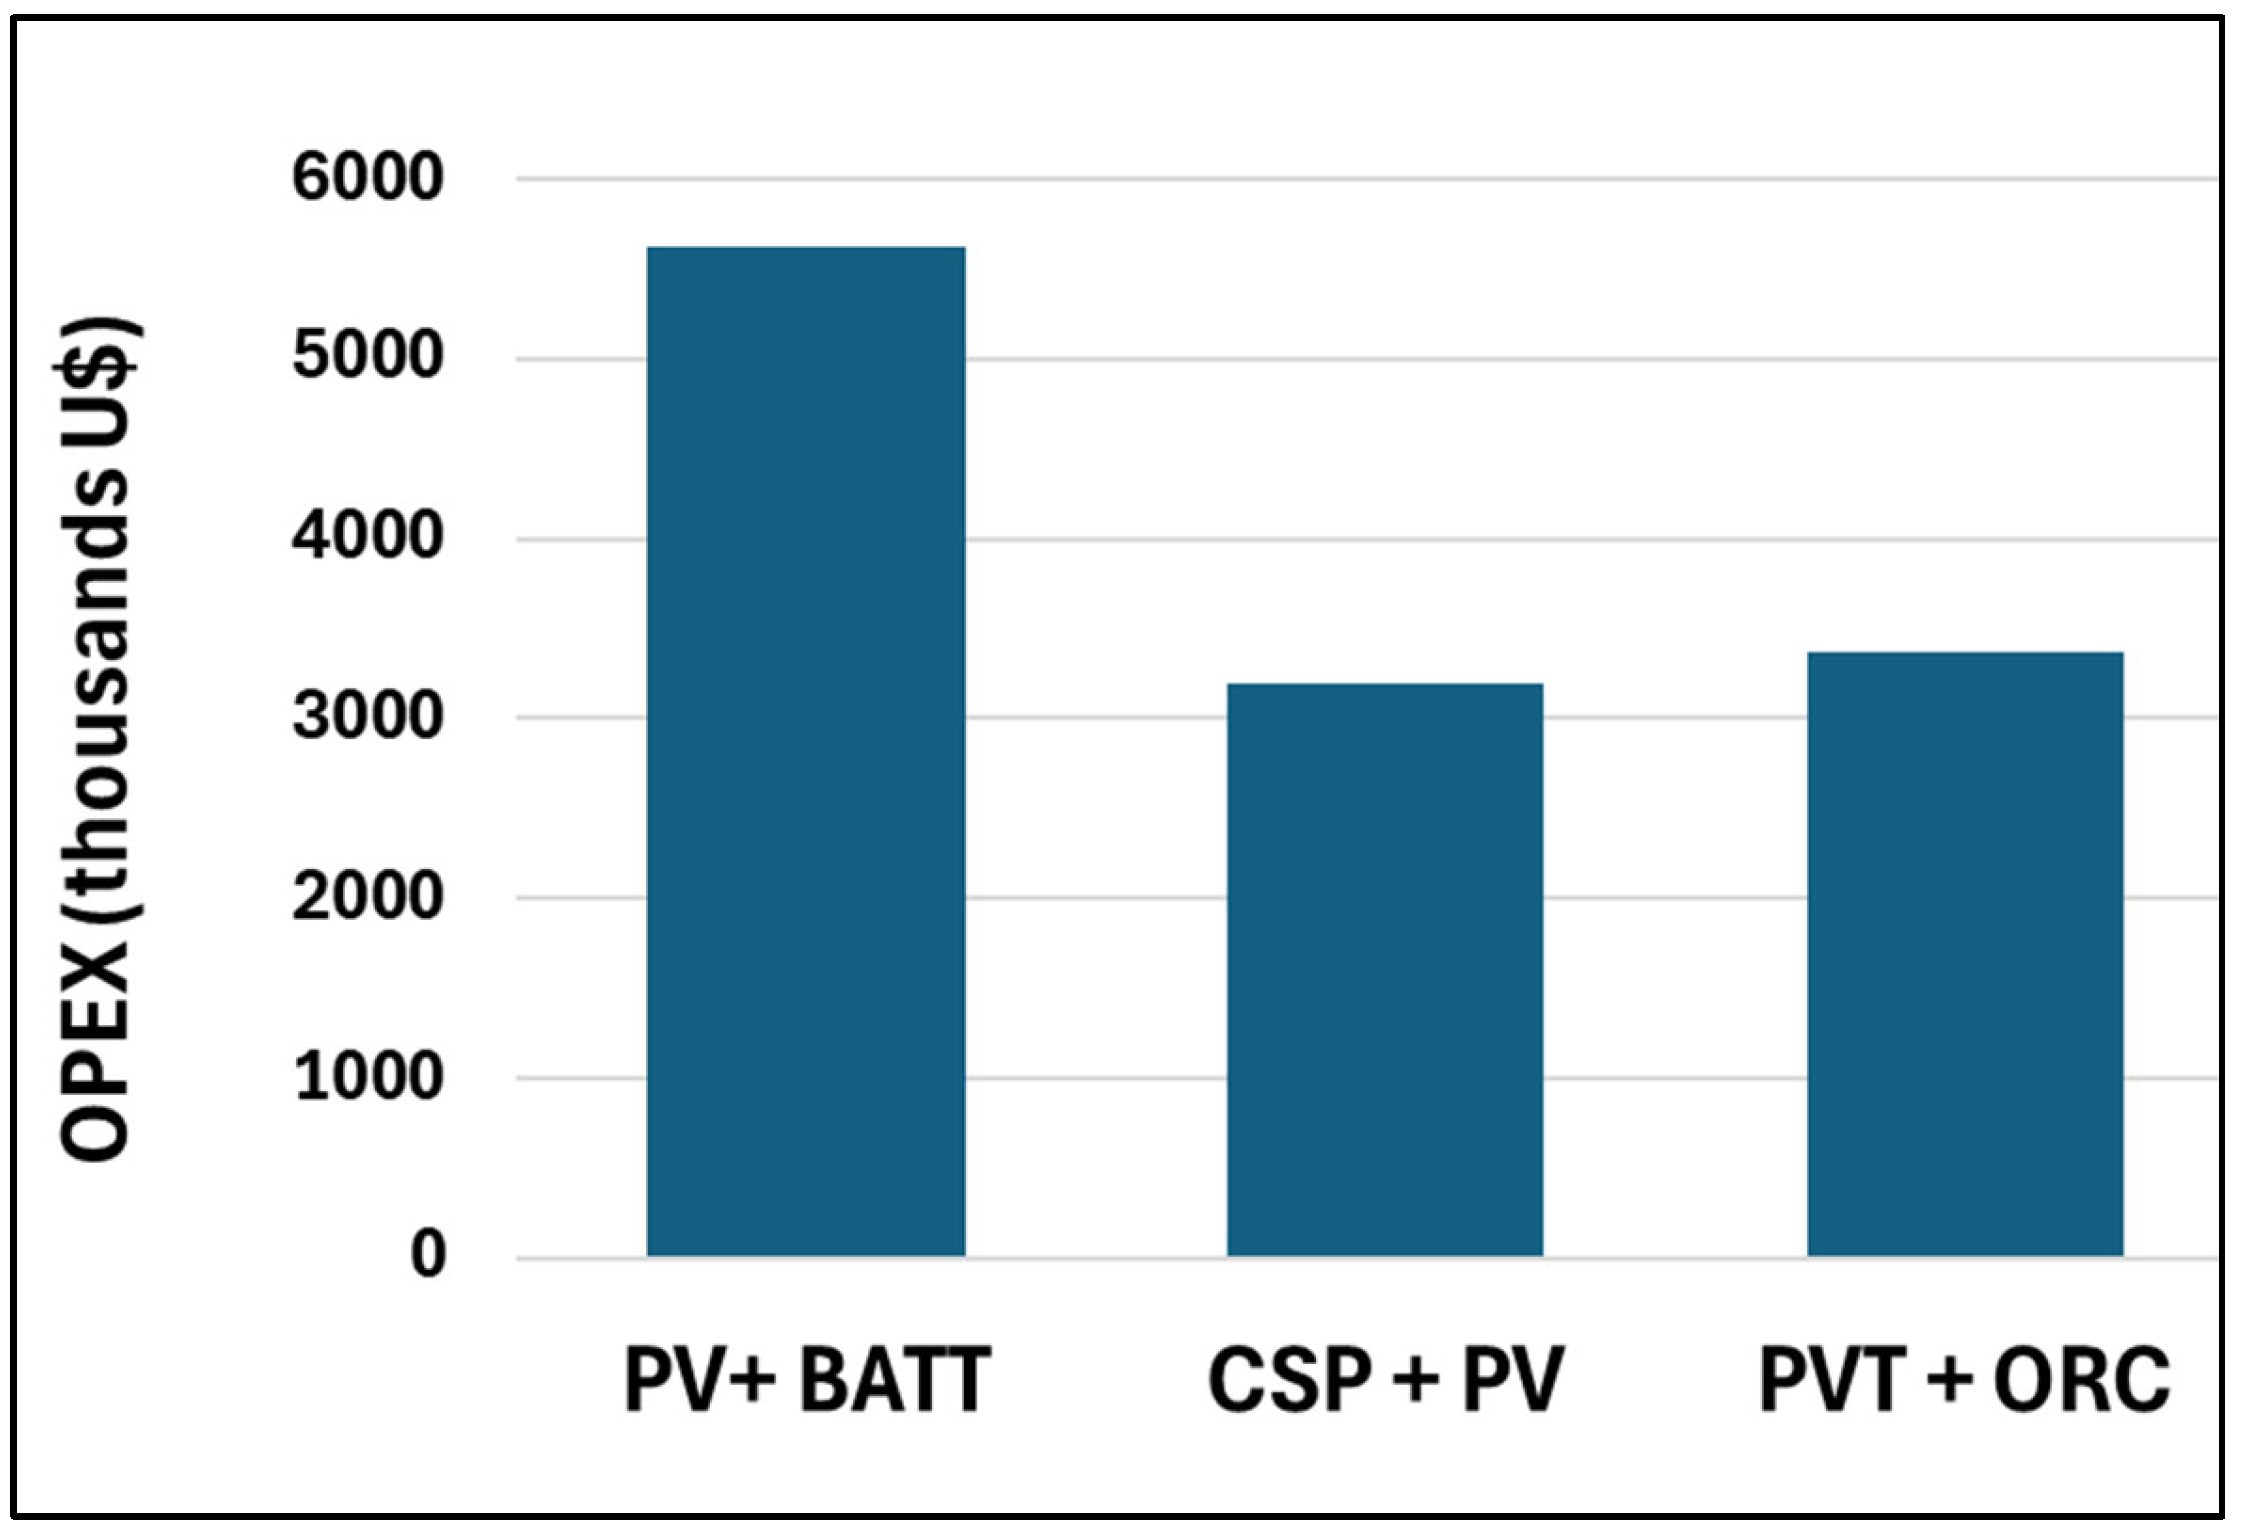
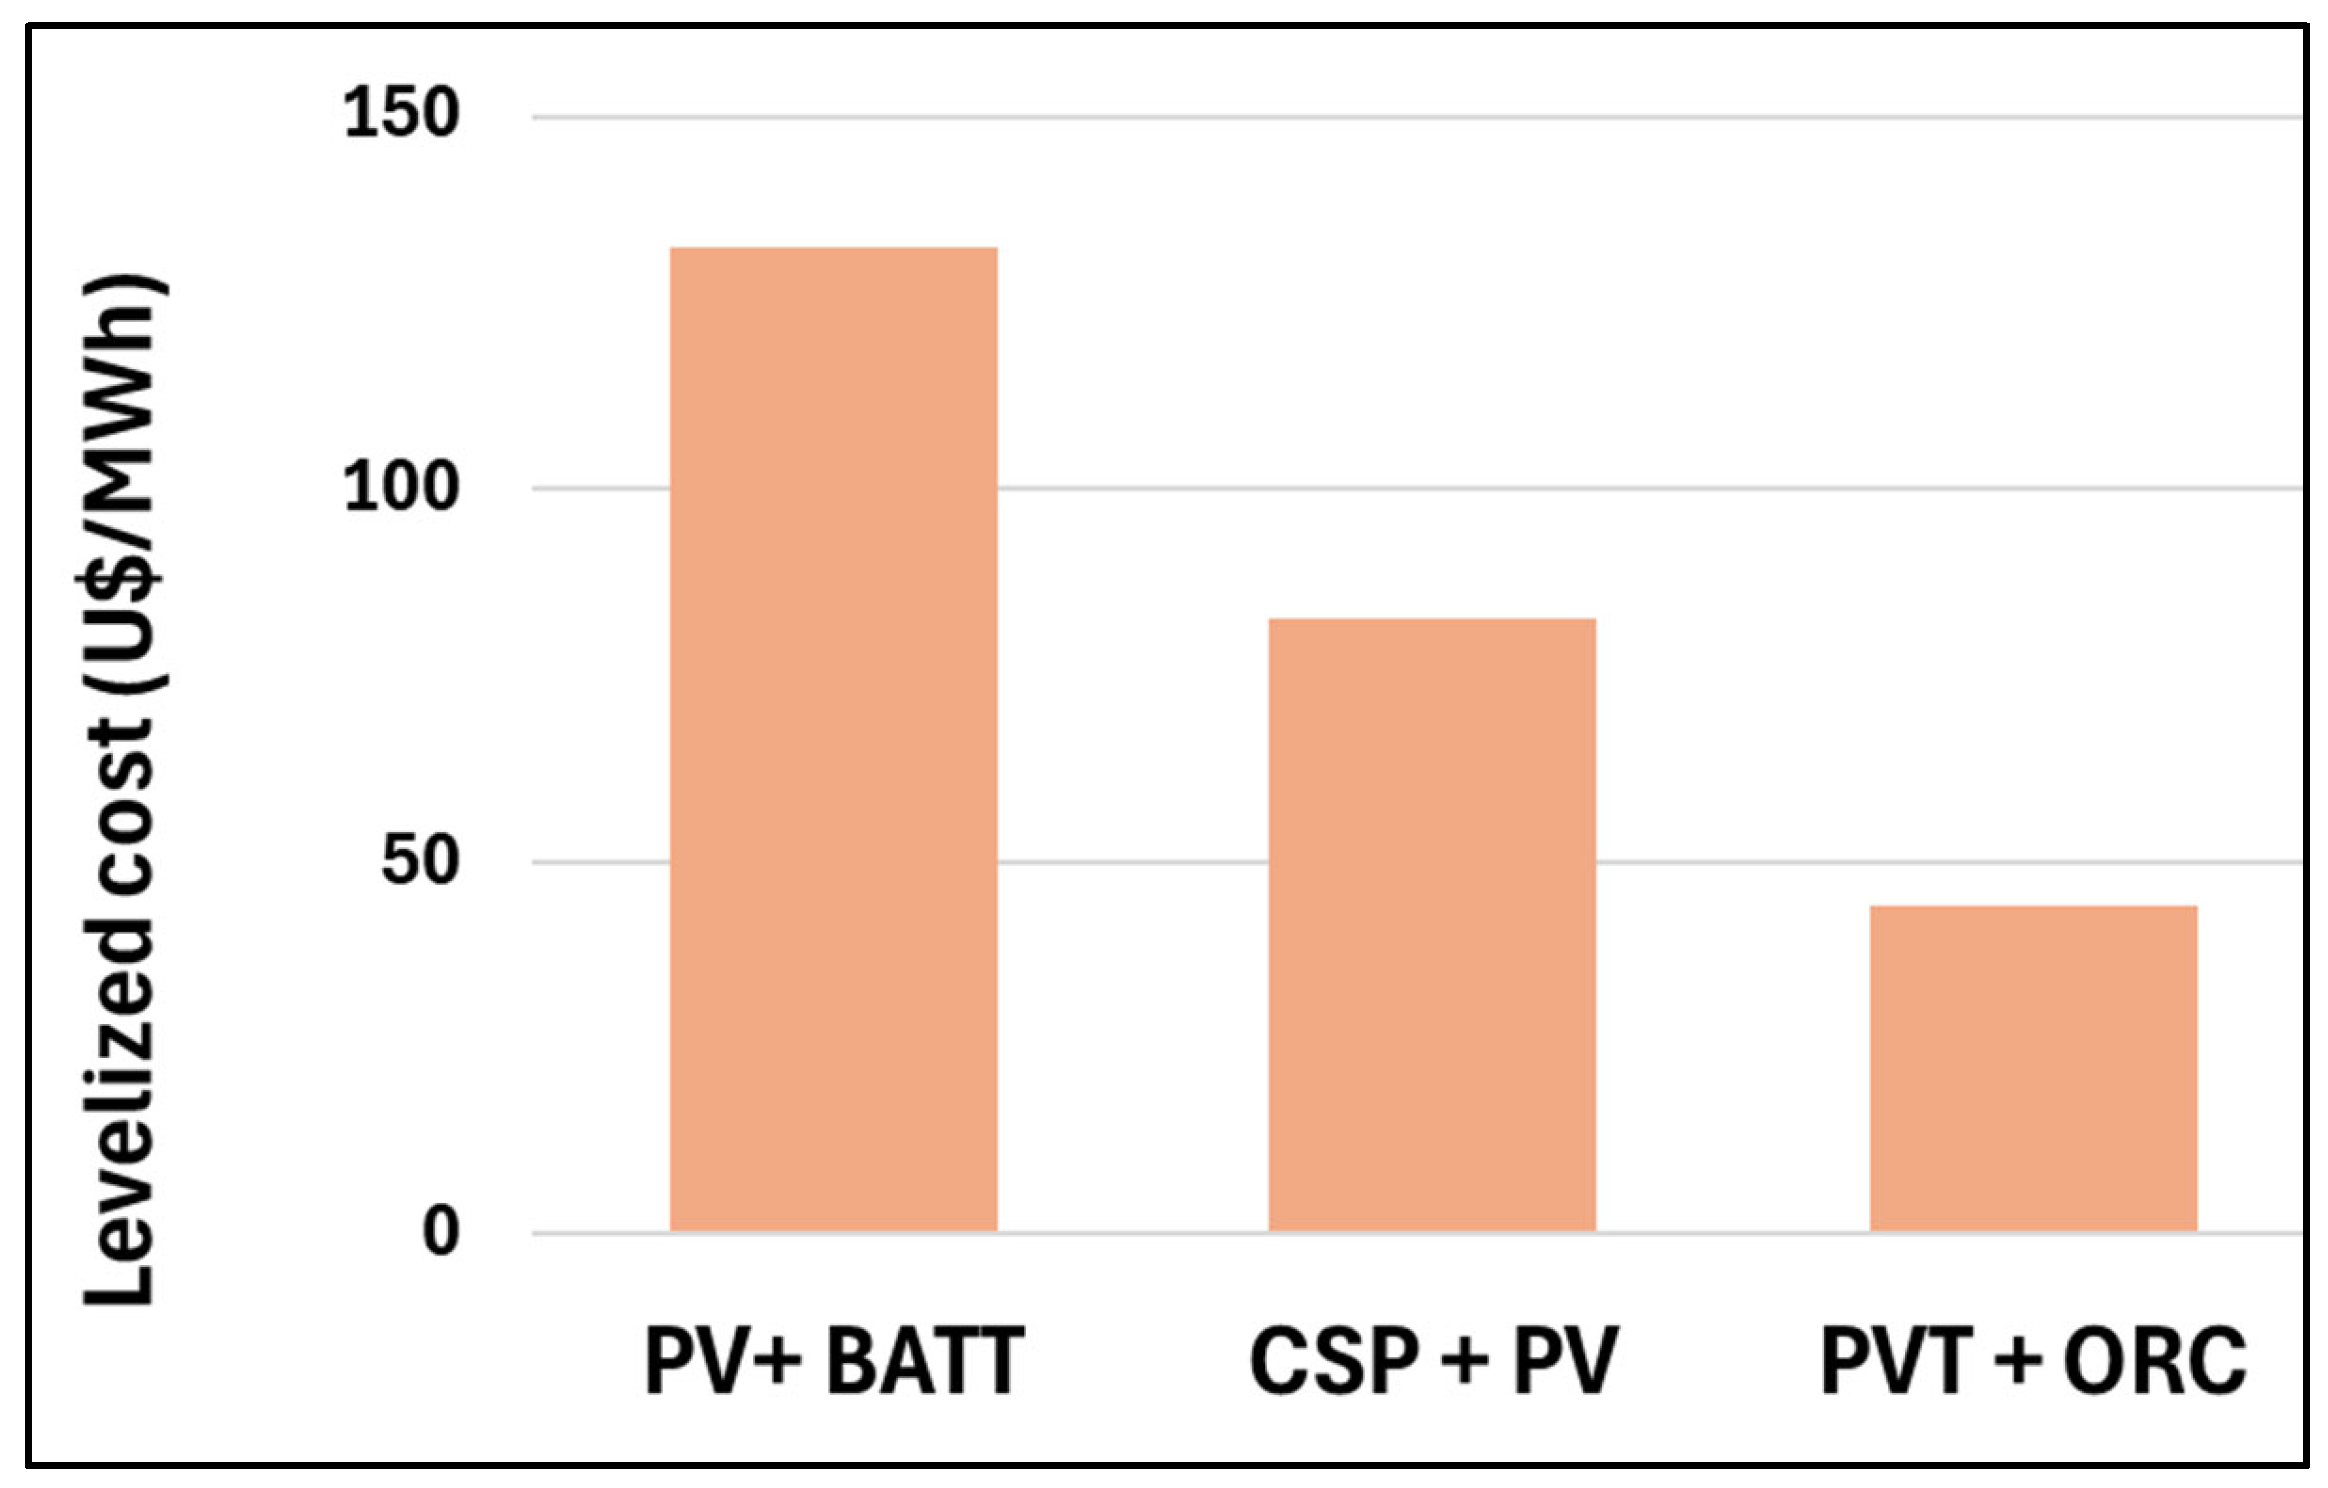
Table 5 and
Figure 7,
Figure 8,
Figure 9 and
Figure 10 present the cost analysis results, including capital and operation costs, LCOE, electricity selling price to achieve an Internal Rate of Return (IRR) of 10% and the land footprint for each technological option.
It is evident from the analysis that the PVT + ORC option is the most economically viable in terms of CAPEX, LCOE, and land footprint. It is significantly cheaper than the PV + BESS, with almost one third of CAPEX and an LCOE of 0.044 $/kWh compared to the PV + BES value of 0.132 $/kWh and PV + CSP value of 0.0828 $/kWh. For the PV + BESS, batteries significantly increase both the CAPEX and the LCOE—mainly as a result of the high cost of batteries, with the requirement to replace them every 10 years. Other advantages of the PVT + ORC include simplicity of operation, smaller land footprint, higher efficiency, and longer lifetime.
For applications where thermal energy supply is needed, such as district heating and industry process heat, it is obvious that the levelized cost of thermal energy of the PVT would be, similarly, significantly cheaper than the conventional CSP or PV+ Electrical heater. Moreover, a detailed analysis of the levelized cost of thermal energy needs to be conducted for each specific project, as the PVT design provides great flexibility in delivering the optimum power-to-heat ratio and a variety of plausible coupling concepts that will ultimately dictate the levelized cost.
In this analysis, we considered a fixed capacity for long-duration storage for all options; however, the impact of the size of the thermal storage in the PVT + ORC plants and its effect on the electricity generation will be elaborated for each specific project. It is worth noting that the LCOE is moderately sensitive to the size and cost of storage, due to the positive role of the economies of scale since a hot pressurized water tank is used compared with sophisticated and expensive molten salt or thermal oil for the CSP and battery storage in the PV + BESS system. It was indicated in previous research for CSP that realistic values of the thermal storage lie in the range of 30–50
$/kWh thermal for the two-tank liquid storage design [
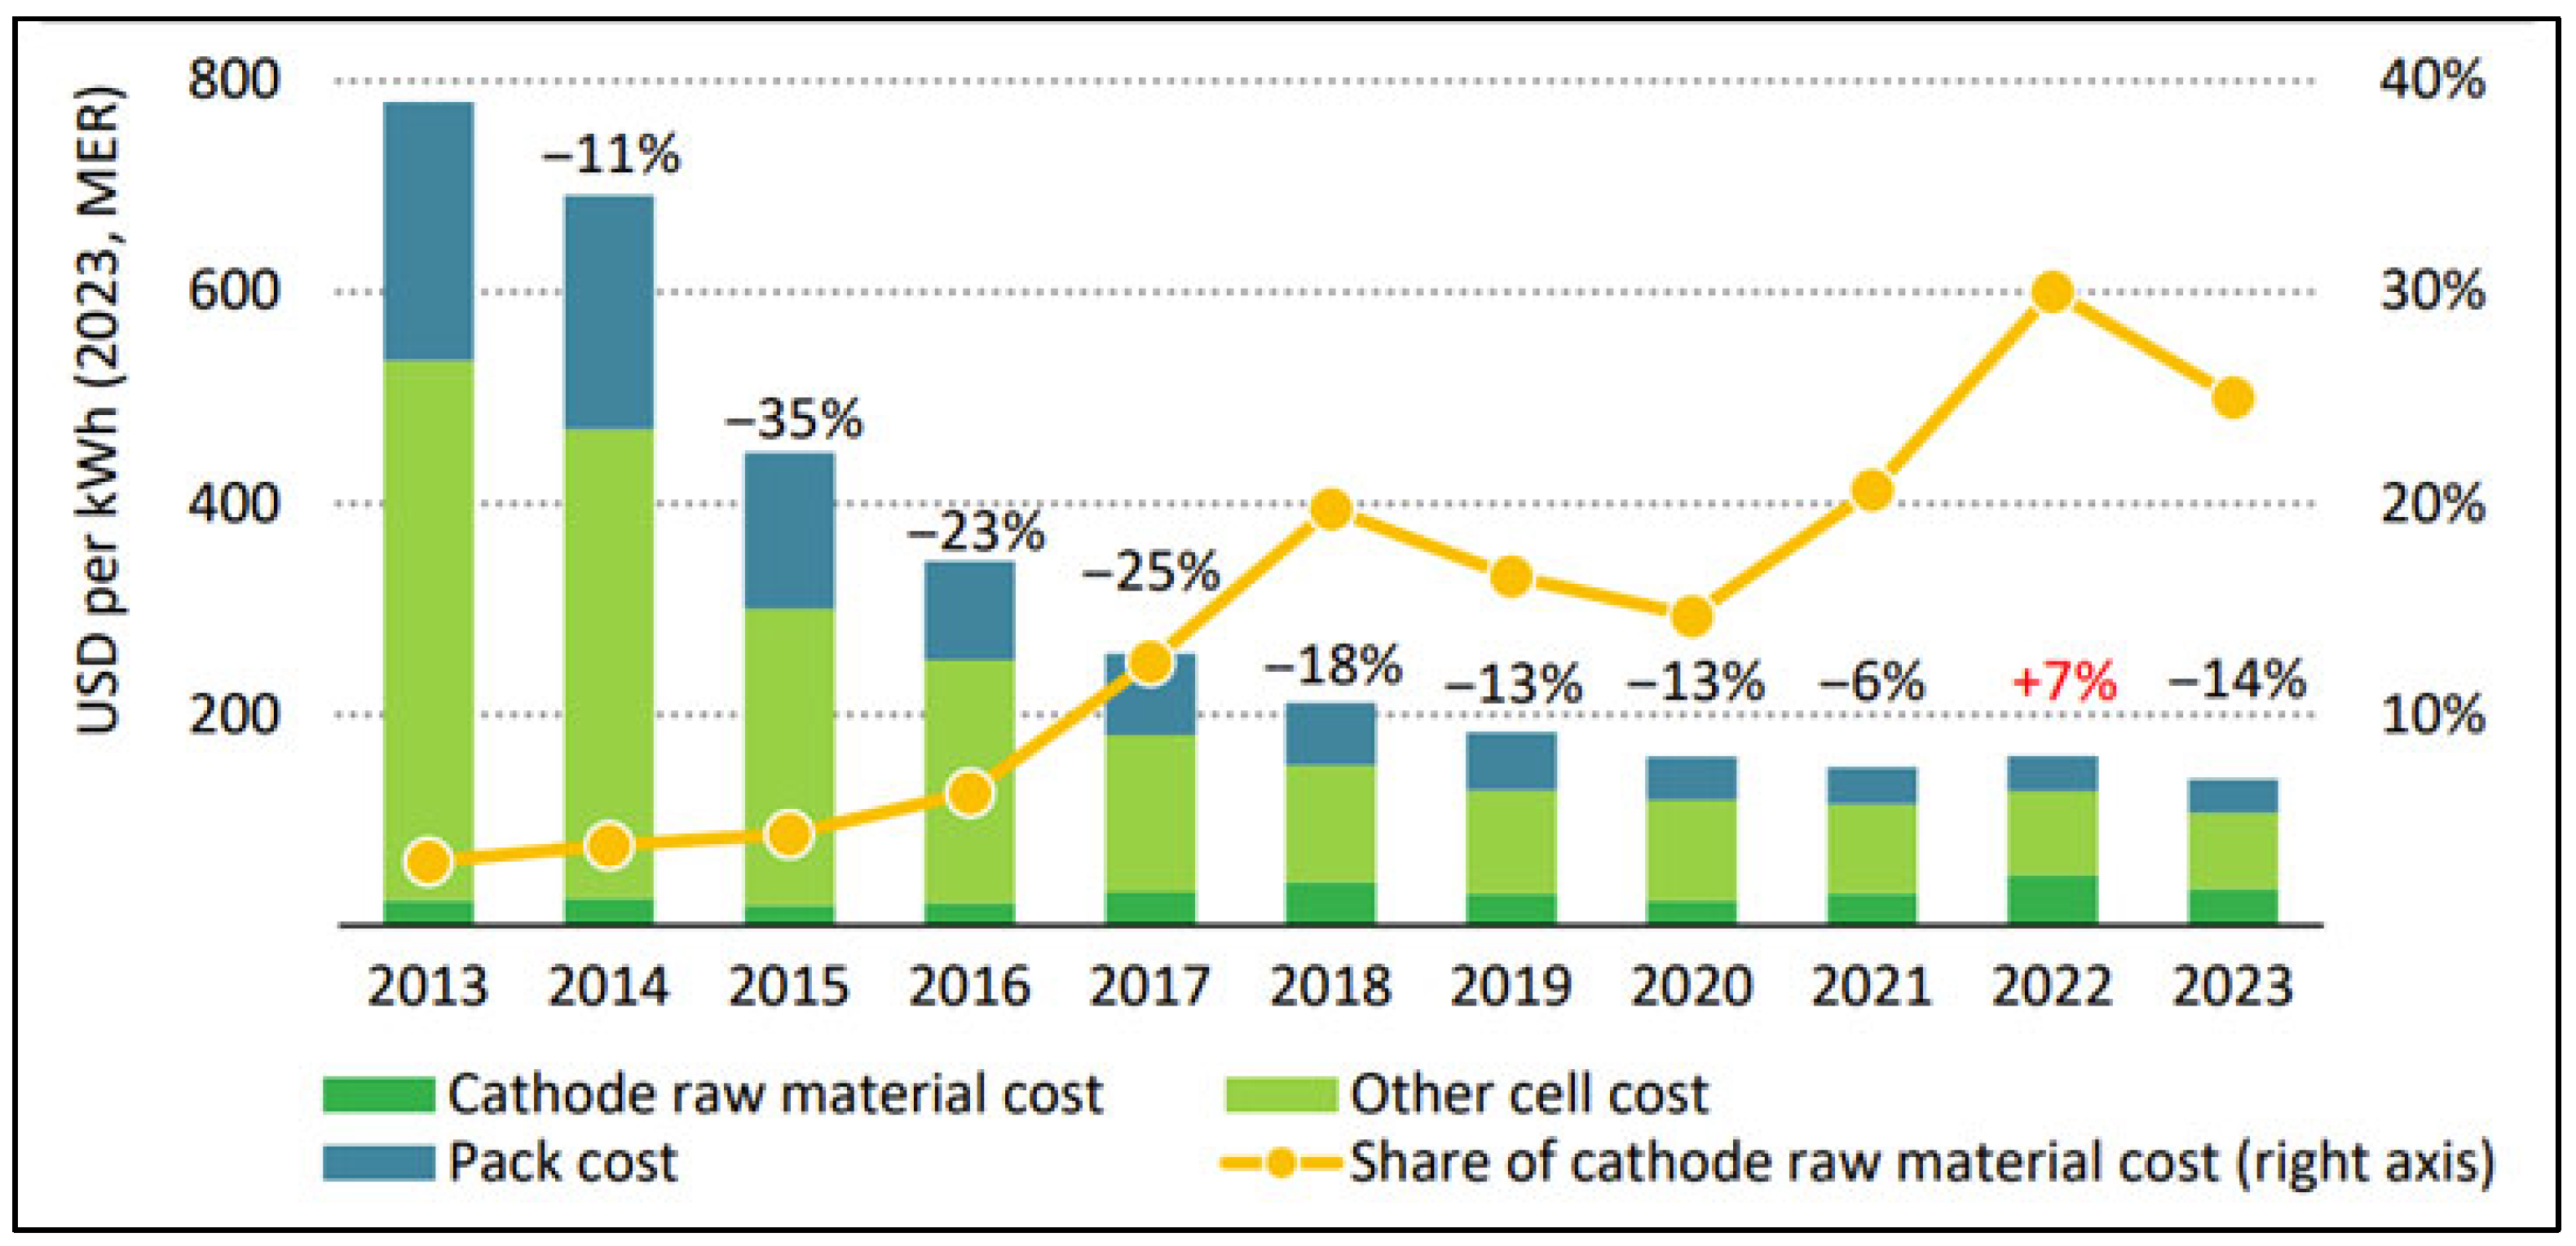
49]. Costs for BESS around 150 USD/kWh of installed capacity are still very high compared with thermal storage,
Figure 11.
It is worth noting that in this analysis, we have considered an enormous capacity of storage in isolation of the demand side and not considering any local or national strategies in the respective country, i.e., KSA, for a renewables share of 50% equally with the natural gas (NG) driven CCPP share. This is an important matter of optimization for each specific project and within the local context/energy strategy in each country, which may potentially reduce the LCOE significantly.
4. Market Analysis and Potential Applications
As Hassabou PVT technology delivers substantial thermal energy at high temperatures above 130 °C simultaneously with electrical energy, it can serve almost all other applications and sectors globally for a successful transition towards a near-zero-carbon economy. Just as the last industrial revolution was based on engineering and chemistry, so will the current one be based on green technologies, biotech, and Artificial Intelligence. This section shall focus on some specific market opportunities using Hassabou’s collector technology for the global community.
4.1. Application in AI and Data Centers
Energy demand for AI and data centers is huge and represents a big challenge. According to the IEA, meeting energy demand for AI and data centers will require a diverse range of energy sources. Half of the global growth in data center power demand over the next decade is set to be met by renewables, presenting another challenge related to a requirement for long-duration energy storage to meet the 24/7 power needs.
Globally, data centers are set to account for less than 10% of electricity demand growth by 2030. But some regions are more affected. In the United States, they are set to make up nearly half of electricity demand growth. In Japan, more than half; in Malaysia, up to a fifth (i.e., 20%), and it is expected to see a big percentage in the KSA, Qatar, UAE, and Kuwait, at least the same as or bigger than Japan.
Construction of data centers takes 1 to 2 years, while new transmission lines and power generation can take up to 6 years [
50]. Therefore, utilization of this innovative off-grid solar system can eliminate the need for expansion of the grid and can be constructed in 2 years in parallel with the construction of the data centers. Moreover, as the peak demand for electricity in hot climates happens in summer, the surplus PV electricity in summer can be fed directly into the grid during the day around noontime, thereby contributing to meeting part of the peak demand in good harmony with the energy supply/demand management and smooth operation of the grid.
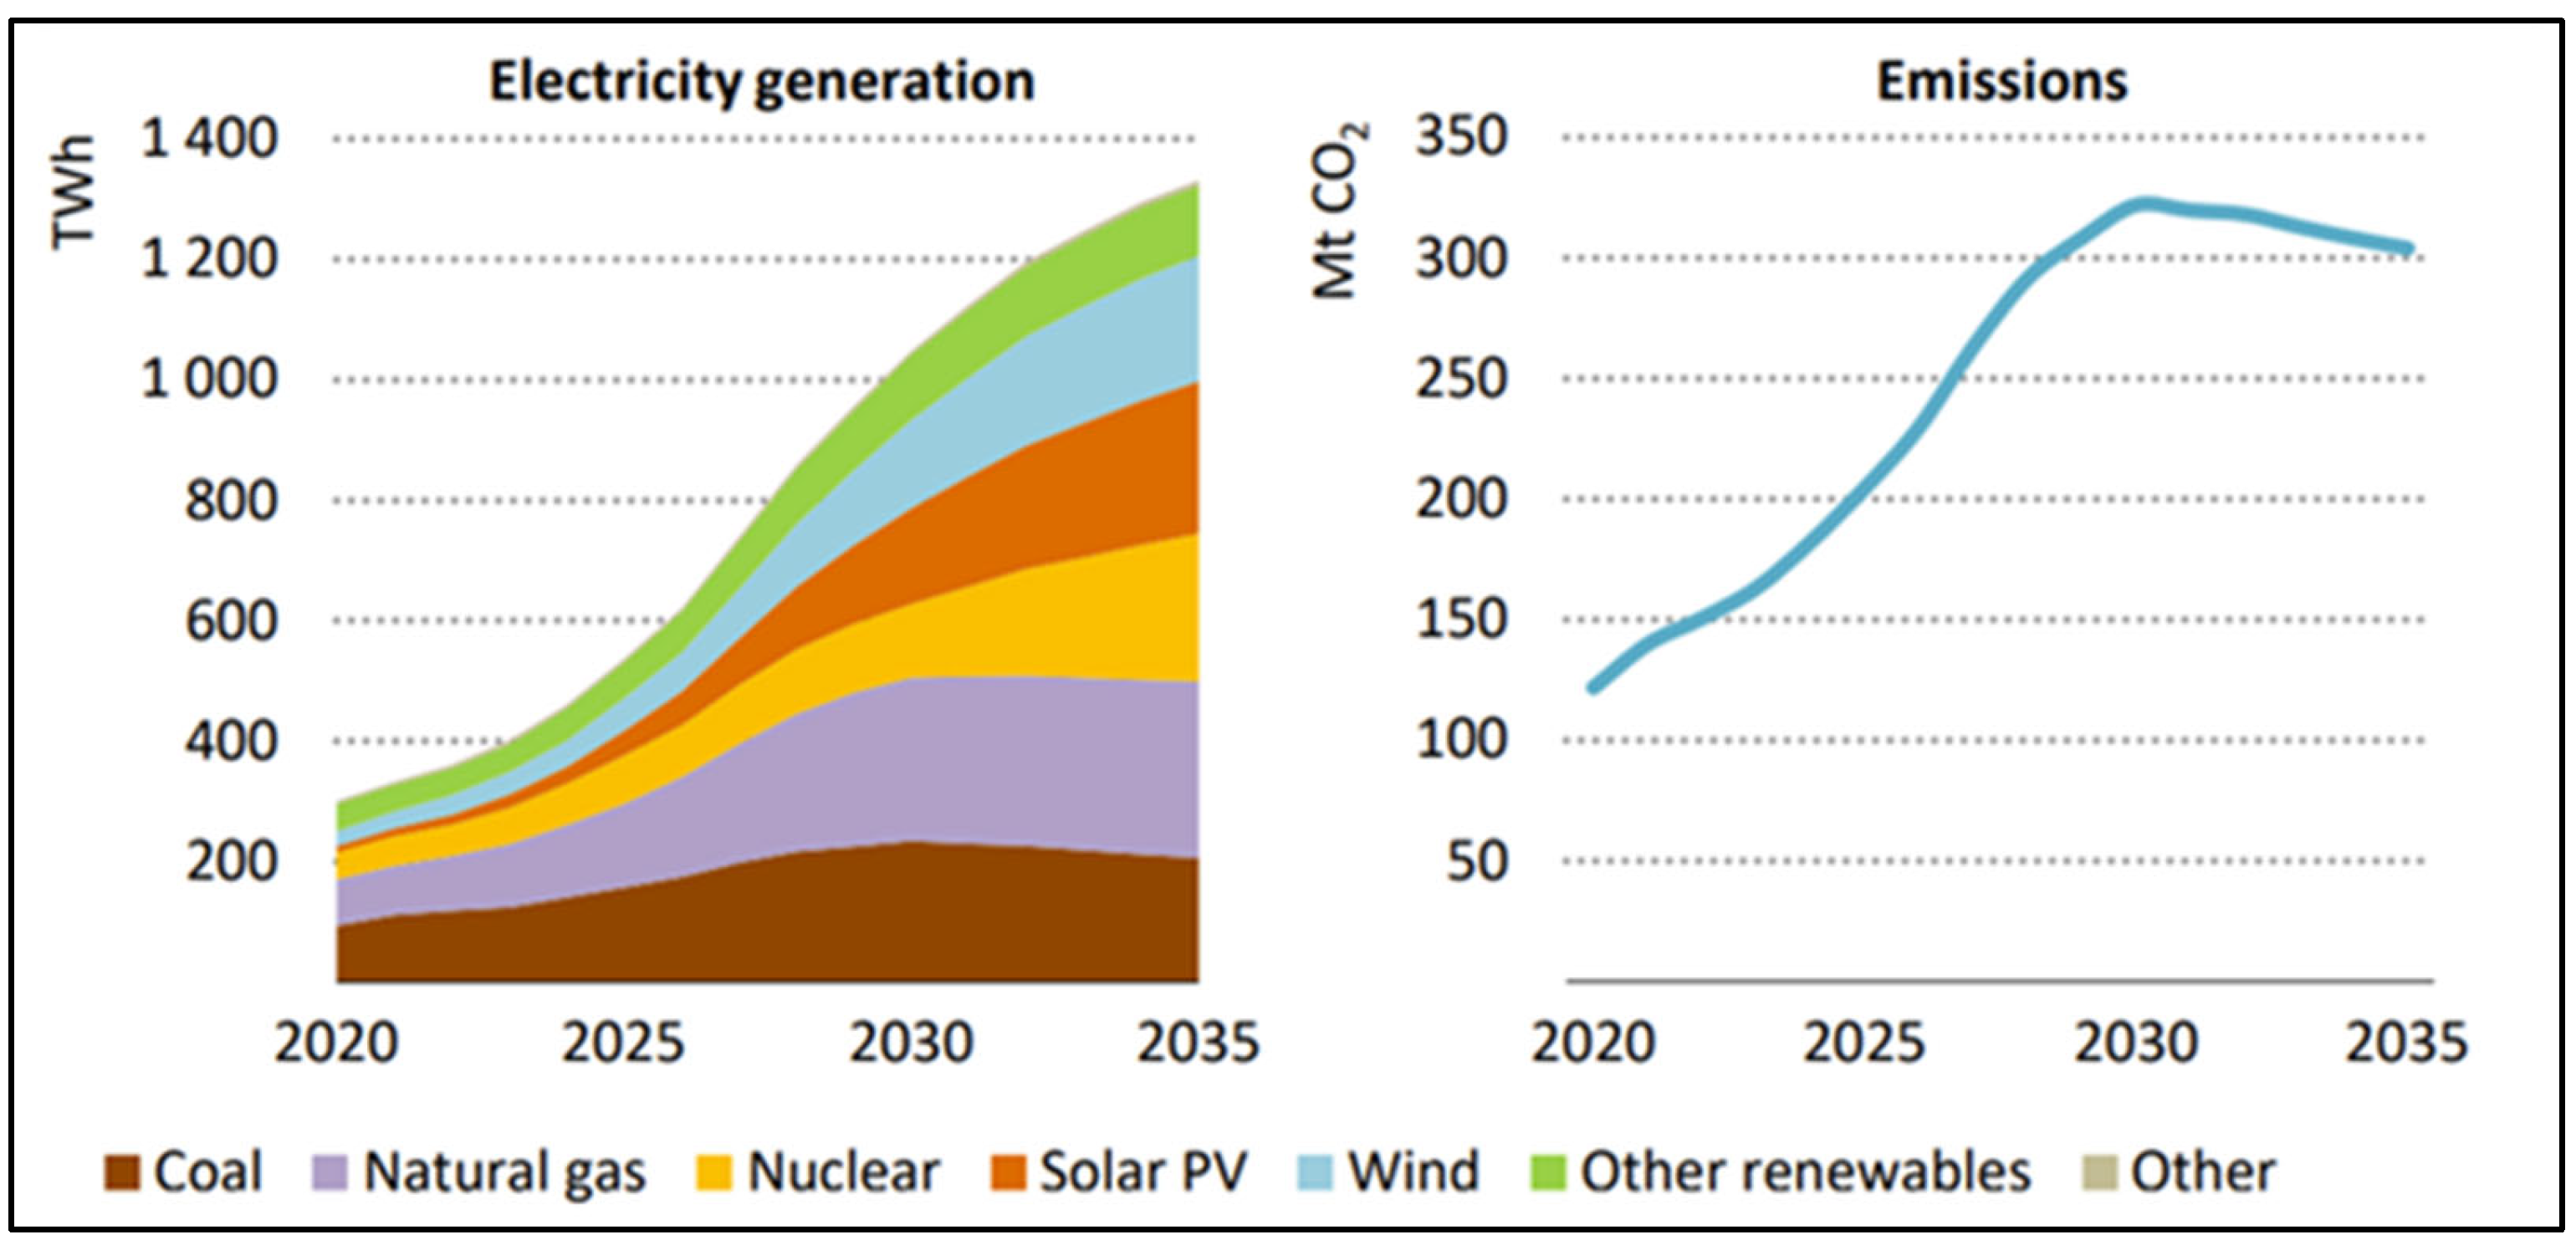
In the base case scenario, global electricity generation to supply data centers is projected to grow from 460 TWh in 2024 to over 1000 TWh in 2030 and 1300 TWh in 2035 [
50]. Renewables are expected to meet nearly half of the additional demand by 2030, followed by natural gas and coal, with nuclear starting to play an increasingly important role beyond 2030 (
Figure 12).
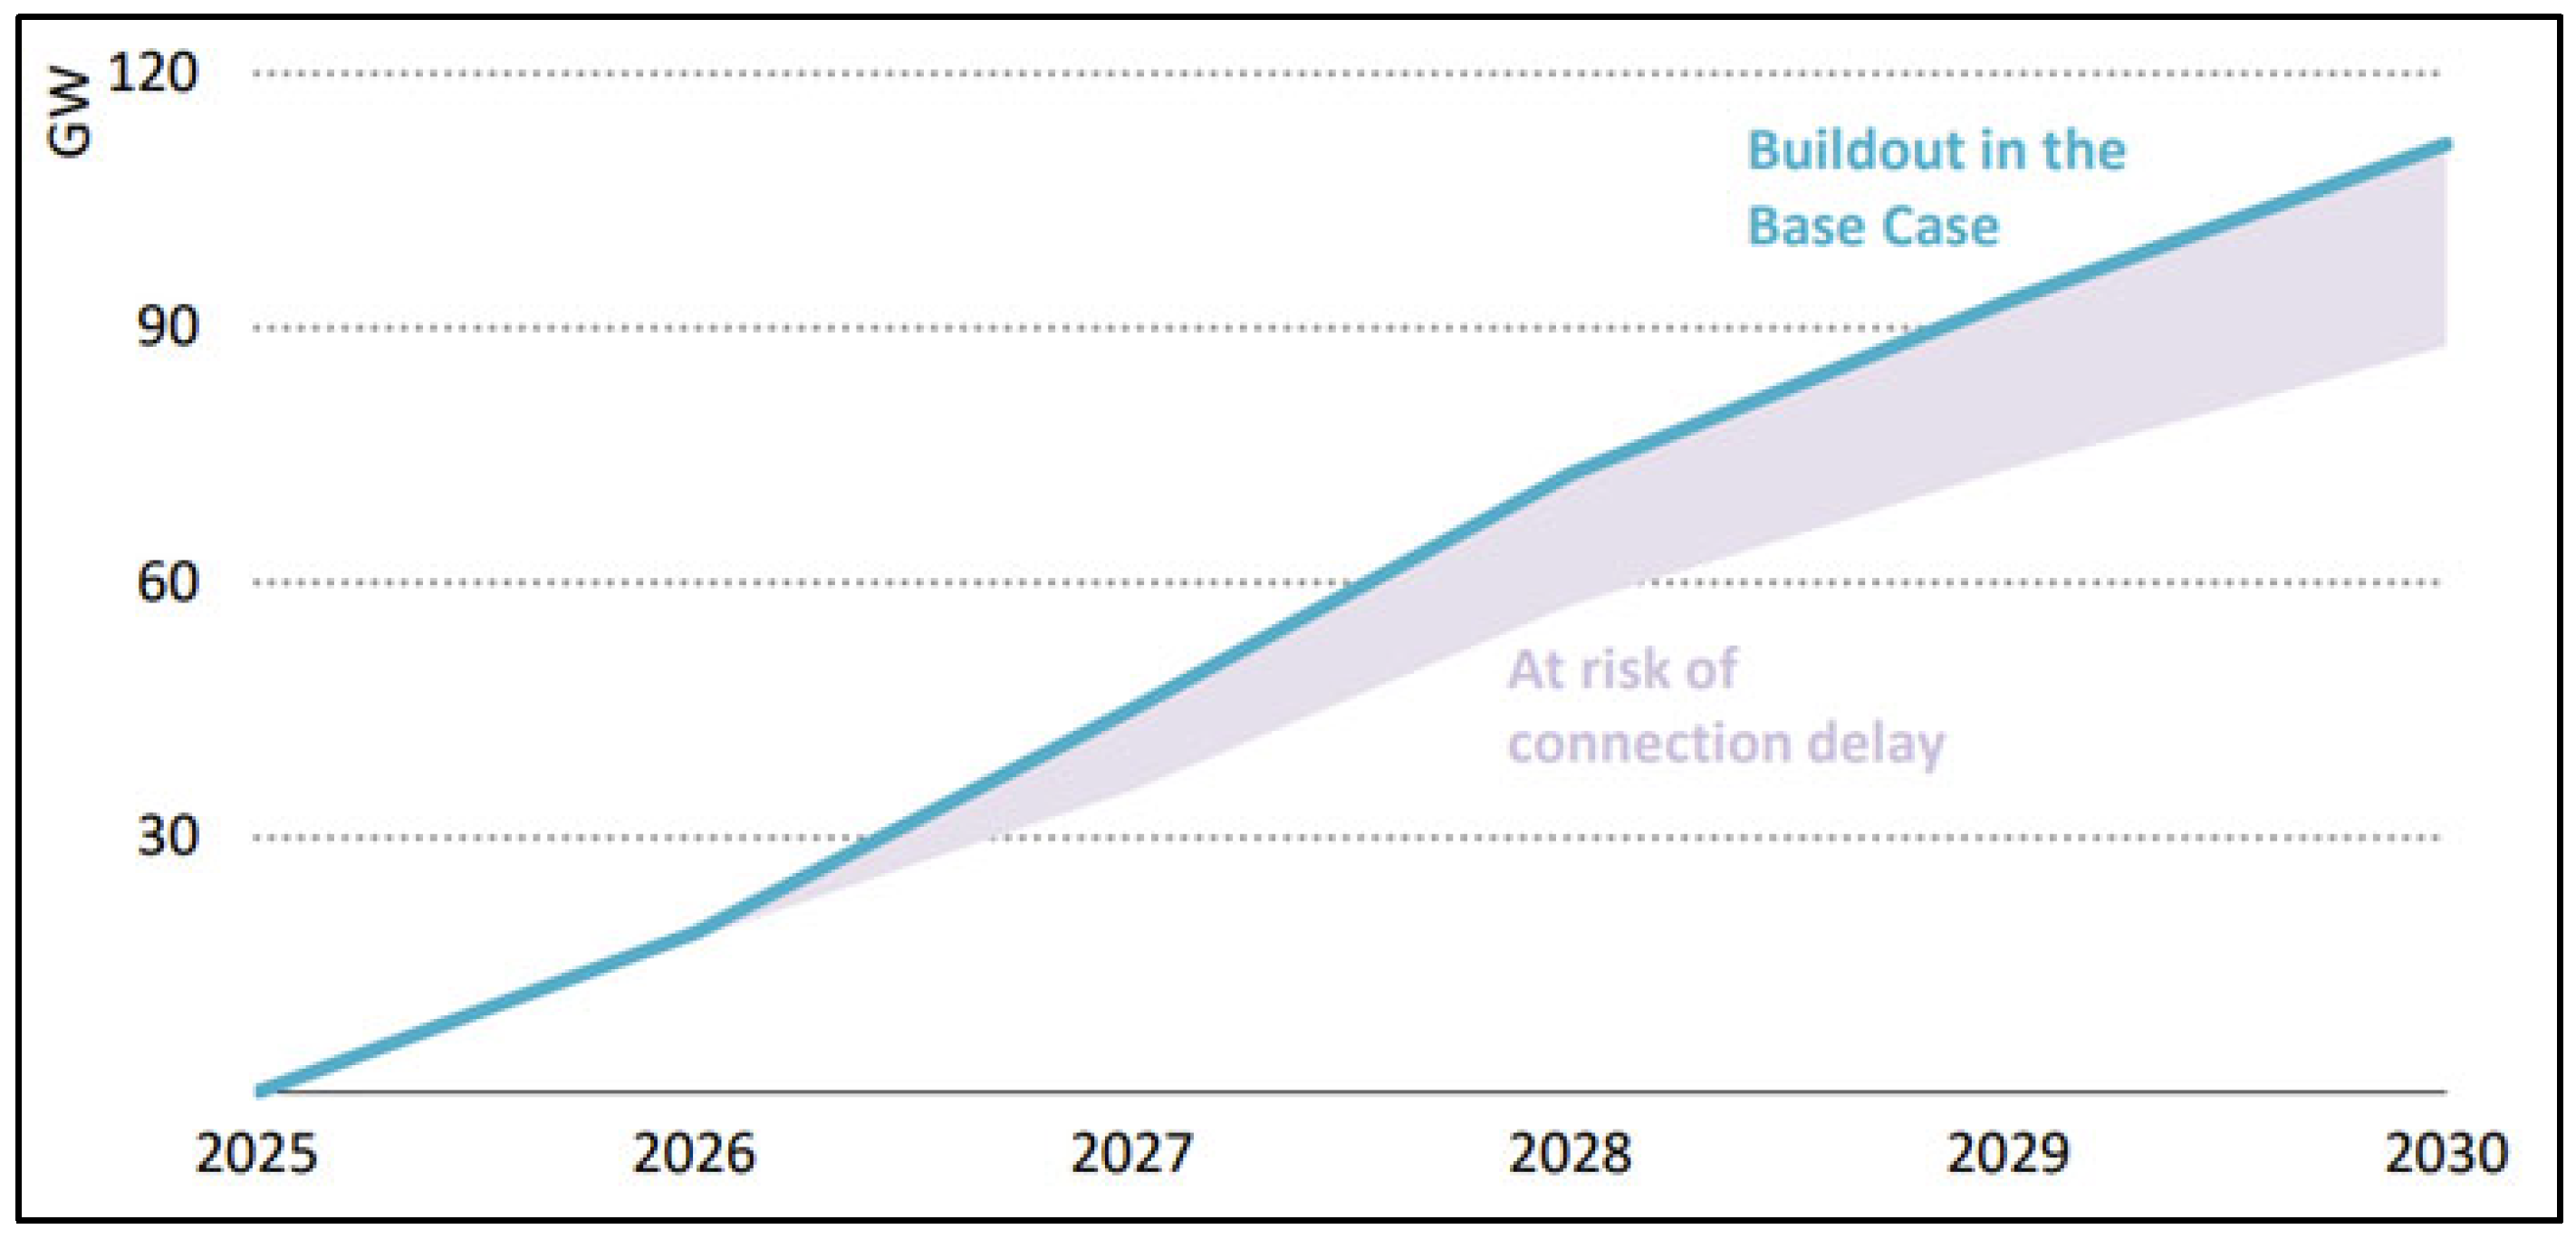
The IEA examined the current congestion levels, grid policies, and connection timelines to understand the extent to which data centers might face connection delays [
50]. The analysis revealed that grid constraints could delay around 20% of the global data centers’ capacity planned for construction by 2030—
Figure 13. This gives rise to off-grid dedicated power plants such as Hassabou PVT + ORC to ensure that data centers come online in a timely way and that the electricity system does not create a critical bottleneck in this regard.
However, as cooling and air conditioning consume 60–80% of the electrical energy demand, a successful decarbonization strategy should consider dedicated power plants for the AI, as well as consider cooling loads to be met by the thermally driven absorption chillers (ABC) that reduce electrical energy consumption by 80%. All energy, cooling, and water demand can be ideally secured with the stand-alone off-grid solar PVT with ORC/Steam Turbine system for both power generation, air conditioning, and central cooling systems.
As water demand for data centers is also significantly high, fresh water is secured through seawater desalination in the GCC and some parts of the USA. Water desalination is energy-intensive; development plans and economic growth are heavily dependent on whether the growth in energy supply can meet the surge in electricity demand in such water-scarce countries. The situation is expected to be more challenging, according to the recent IEA report, as demand growth for electricity is expected to be six times faster in the next period from now to 2035, mainly driven by air conditioners, AI/data centers, EVs, and other applications.
However, medium and large-scale water desalination systems can be integrated with Hassabou PVT solar power and central cooling to upgrade the water quality of the Treated Sewage Effluents (TSE) to be safely reused in AI and data centers, as well as aquifer recharge for sustainable agriculture in the desert. The same trigeneration system can serve industry, district cooling, and production of green hydrogen with hygiene TSE. The concept of coupling desalination with central cooling/district cooling for polishing the TSE water quality is patented by the first author [
53]. Polishing and reuse of TSE water saves 75% of costs compared with sea water desalination can be installed anywhere inland where the TSE is available, which eliminates the need for big investments in infrastructure to extend pipelines from shorelines to inland and for a water distribution network. The total savings of 75% include 40% savings in the water distribution network and 35% savings in desalination plants.
4.2. Application for Water Desalination
In an era of accelerated climatic change and drought conditions, water scarcity is hitting many parts of the world with consequences on both increasing desertification and imposing severe limitations on achieving national development plans. However, most of the water-scarce countries have access to seawater and underground brackish water that can provide a reliable solution to face the growing shortage in water resources.
As desalination is energy-intensive, one can envision a self-sustaining economy booming into a water-strained community enabled by heretofore unavailable water and expensive, undependable power supplies. This economy can include agriculture supported by the Solar-Hybrid PVT power plants so that such arid regions become self-sufficient with water, energy, nutritious food, affordable housing, and jobs. The infrastructure needed to meet water shortage with desalination is huge, especially power supply, and relying on fossil fuels will not provide a sustainable route for meeting the global water demand.
Water desalination systems are broadly classified as membrane and thermal desalination processes [
54]. Membrane systems, like RO, require electrical energy to drive the process, while thermal technologies, like Multi-Effect Distillation (MED), Multi-Stage Flash (MSF), and Membrane Distillation (MD), require less electrical energy and thermal energy as well [
55,
56]. For medium and utility scale desalination plants, regardless of the type of technology used, continuous operation day and night is essential since startup and shutdown of such large capacities take several hours. Therefore, affordable and reliable long-term energy storage becomes a necessity, and this challenge is the main reason why, to date, we have not seen any large-scale desalination plants driven purely by solar or renewable energy, even though this has been a dream in both scientific and industrial communities in the desalination field.
With the solar PVT + ORC system, a continuous energy supply can be provided to all desalination technologies at an affordable cost and high efficiency. The outlet temperature heat source water from the ORC system is at 70 °C, which is higher than the temperature level needed for the MED, i.e., 68 °C. Integration of MED desalination with the PVT + ORC provides a unique opportunity to utilize waste heat from the ORC for the production of huge capacities of desalinated water, with a low cost compared to similar plants driven by fossil fuels. The calculations show that a 50 MW PVT + ORC system can produce up to 300,000 m3 of desalinated water per day using MED technology. With such Innovative design concepts, integrating the PVT system with state-of-the-art desalination technologies will ensure reliability, minimize the environmental and land footprint, enhance efficiency, and reduce specific water costs.
4.3. Application in Industry Process Heat
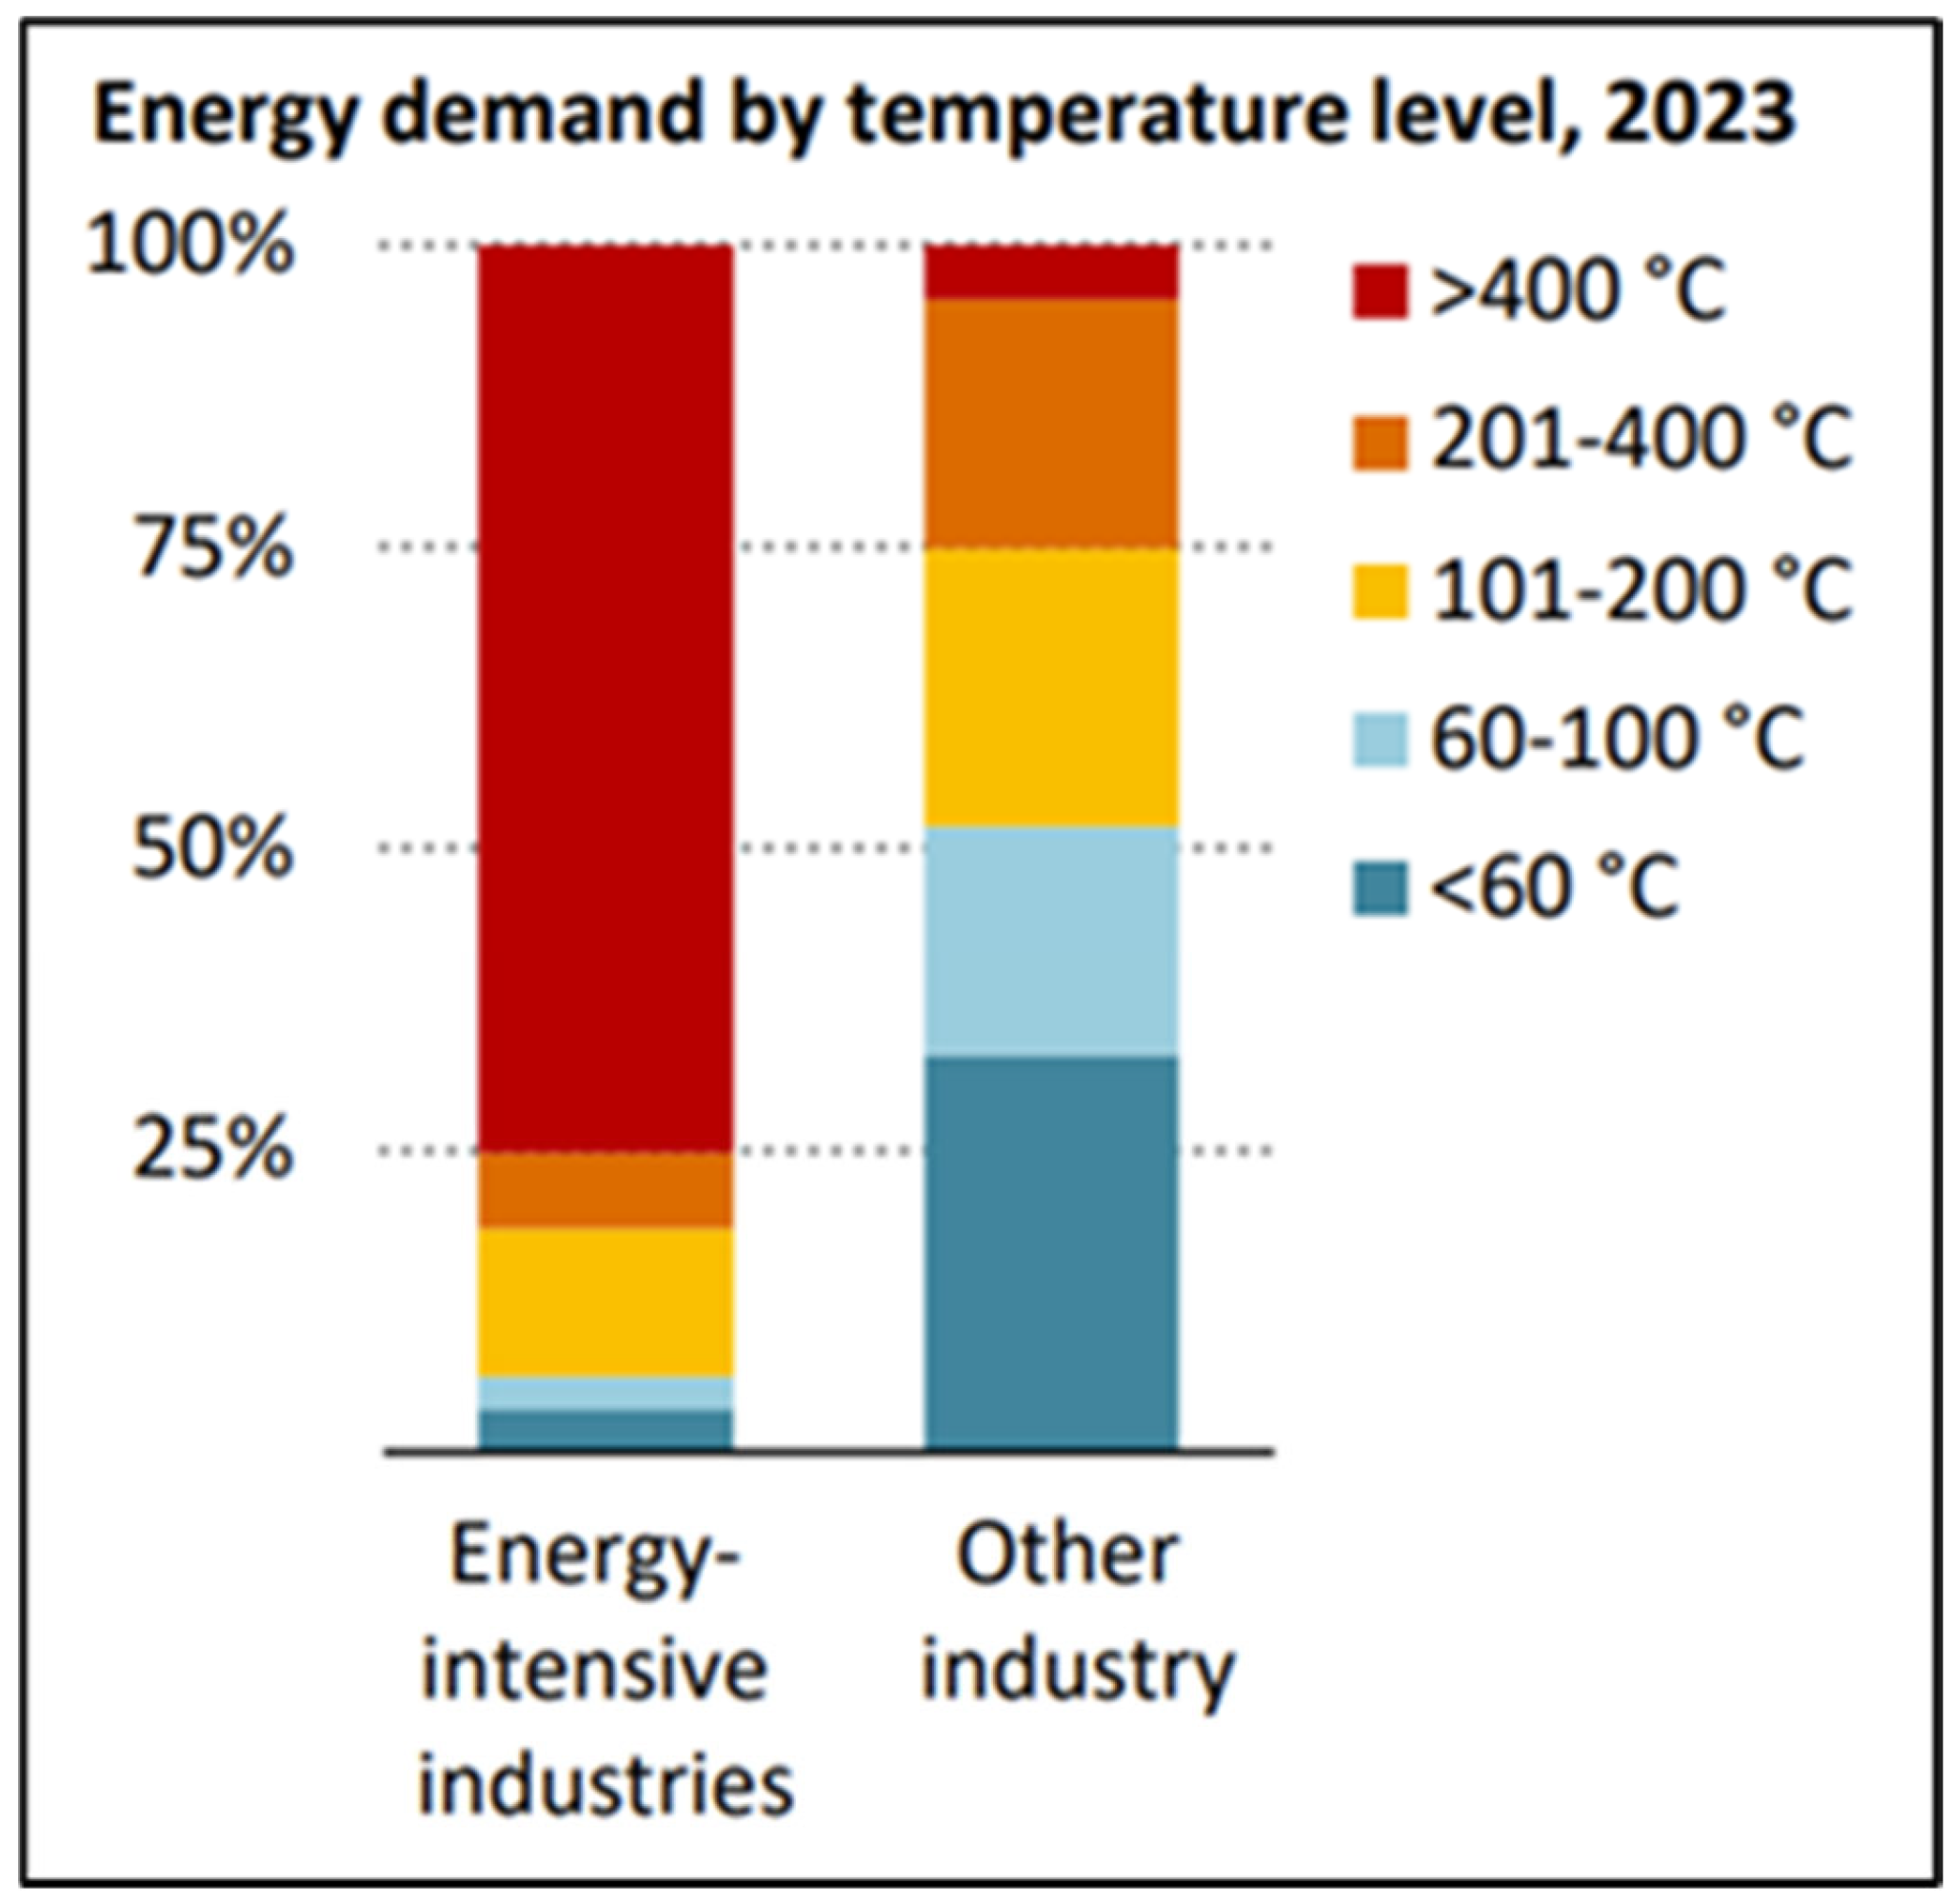
According to the recent IEA report, up to 78% of the primary energy demand for industry is in thermal energy or heating and cooling form, while 50% of the global energy demand is thermal, which is a huge market that needs to be decarbonized [
50]. The share of electricity in industry energy demand increases gradually over time, rising from 22% in 2023 to 25% in 2030 [
50]. This shows the large potential of heat demand in the industry. Further, as per
Figure 14, it becomes clear that a large portion of the process heat demand lies within the temperature range of below 200 °C, i.e., being able to be fully addressed by Hassabou’s PVT technology integrated with an electric heater that is driven by the PV electrical component.
Higher temperatures can be provided by the production of green hydrogen to address the big demand for energy-intensive industries (
Figure 14). Other technology options with the Hassabou PVT + ORC system to decarbonize high-temperature applications involve direct electrification, for example, electric steam crackers. Direct use of the thermal energy delivered by the PVT system is more straightforward for non-energy-intensive industries, where around half of the thermal energy that is required is below 100 °C and can be supplied at competitive prices with no need for heat pumps.
4.4. Application of Conversion of Municipal Solid Waste into Clean Energy
Safe disposal and recycling of Municipal Solid Waste (MSW) is critical for combating climate change, as MSW landfills are a significant source of methane, which contributes a considerable portion of total GHG emissions. While MSW is a burden and can be a liability in most countries, it is in fact a valuable resource that can be beneficially recovered through conversion to energy (waste2energy “W2E” and waste2water “W2W”), composting, and recycling materials such as metals, glass, aluminum, fibers, etc.
However, significant quantities of MSW continue to be disposed of in landfills since W2E and recycling plants require big capital investments, while the net power generation is quite low, which needs a long time for payback, and consequently does not help in building an attractive business case for investors.
To address this challenge, we developed a unique concept for integrating W2E with our revolutionary solar hybrid PV-Thermal technology. This innovative concept can potentially increase the power generation from W2E four times, i.e., 400%, while doubling the required capital, which is a game changer with a payback of less than 10 years.
4.5. Applications for Green and Blue Hydrogen
The hydrogen industry is well established and has decades of experience in industry sectors using hydrogen as a feedstock. Most of the hydrogen has been produced from Natural Gas. In 2023, 97 Mt of hydrogen was produced using conventional energy sources, which produced more than 1200 million tons of CO
2 emissions per year [
57].
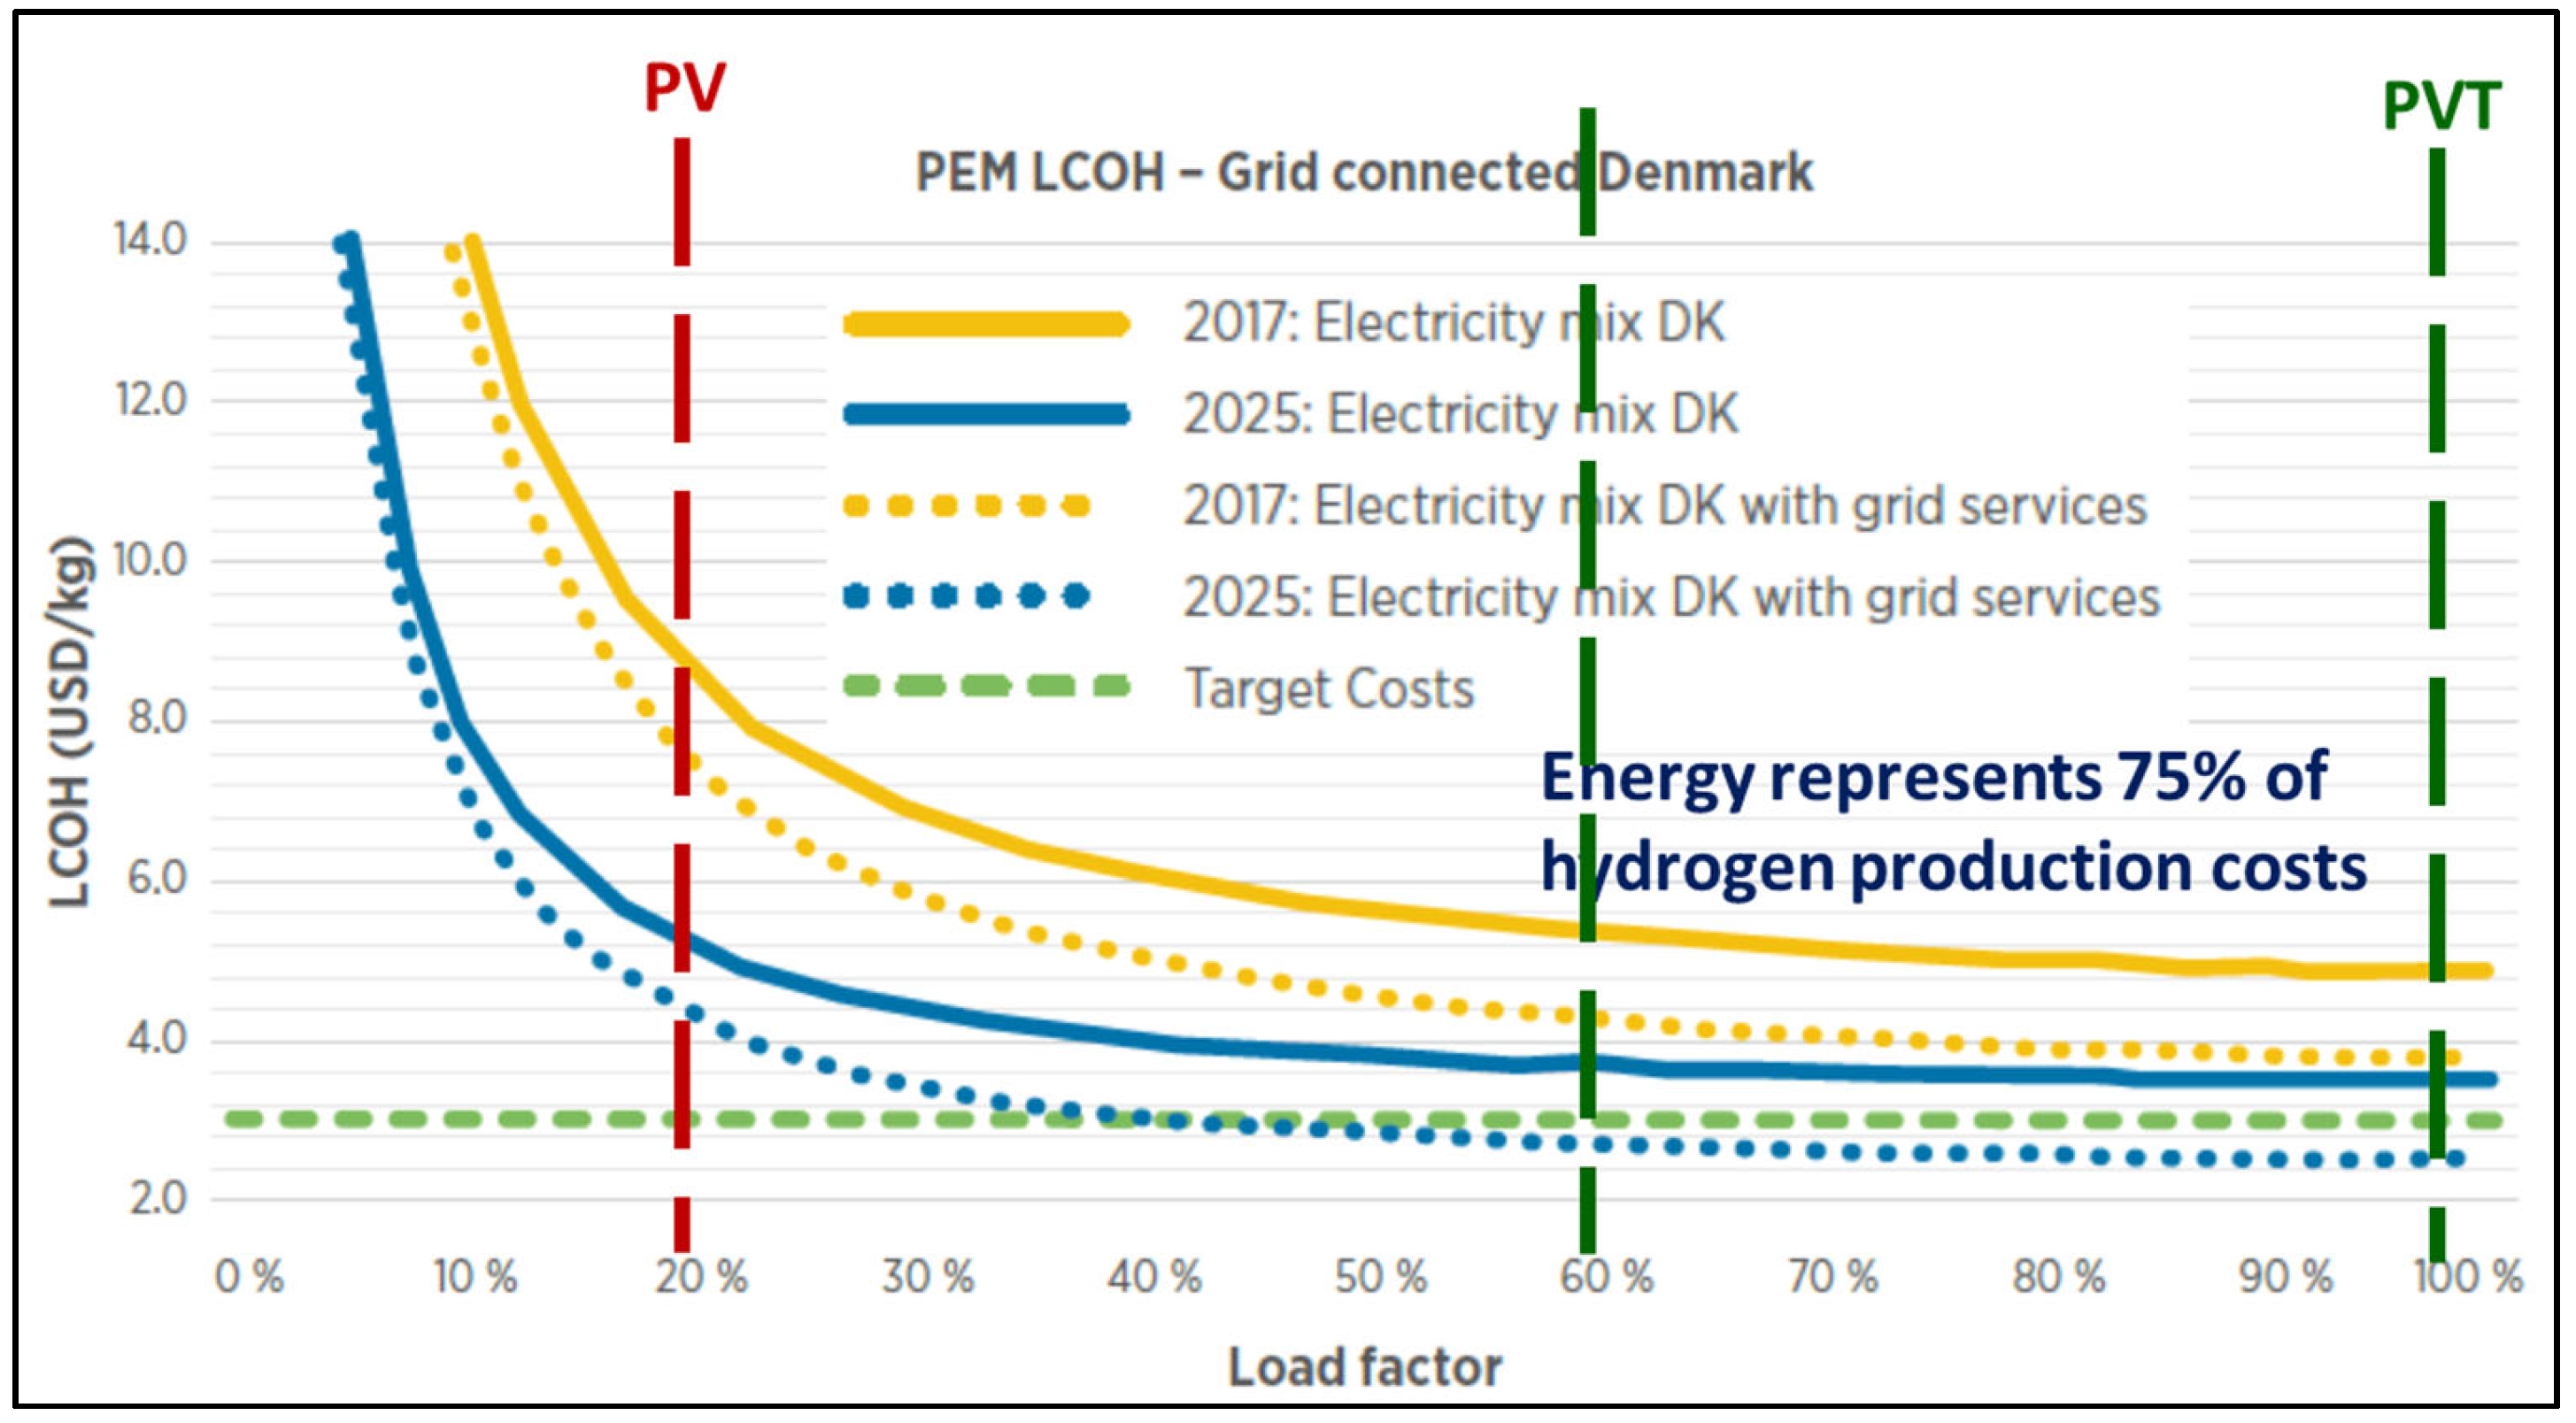
Hence, the transition into clean energy and the production of Green Hydrogen requires clean sources of energy and renewable clean sources of feedstock, such as water using electrolysis or other technologies. Hydrogen offers added possibilities, as an energy carrier, to tap high-quality renewable energy resources, including those located far from end-user demand, e.g., cold, cloudy regions, farms, resorts, and industrial entities. Large-scale, off-grid hydrogen projects directly connected to solar farms in higher source locations may provide 100% renewable hydrogen, but the capacity factor of the energy source, i.e., how many hours per day the renewable power supply would be available, has a significant influence on the LCOH of hydrogen—
Figure 15. The LCOH should be assessed carefully for each specific production site and energy supply technology.
It is critical to operate the hydrogen production systems at a load factor higher than 50% to keep the cost as low as possible. As PVT + ORC provides a power supply 24 h a day, i.e., a capacity factor of 100% compared with a capacity factor of conventional PV of only 20%, as a result, the LCOH with the PVT system is less than 50% of the cost attributed to conventional PV. The market potential for the hydrogen feedstock had a total estimated value of USD 115 billion in 2020 and is expected to grow significantly in the coming years, reaching more than 400 million tons per year by 2050—
Figure 16. It is estimated that more than 30 million jobs and sales of equipment for both energy and hydrogen, with an estimated value of 2.5 trillion USD per year, will be created.
5. Conclusions
Using a common 120 MW reference case with harmonized techno-economic assumptions, this study finds that the hybrid PVT + ORC configuration achieves the lowest levelized cost of electricity, the smallest land footprint per megawatt, and operating-cost intensity that is comparable to the best of the alternative options, PV + BESS and PV + CSP. These comparative advantages are consistent across the cost and siting benchmarks, and they arise from cogeneration that simultaneously harvests useful heat and electricity from the same aperture, thereby raising the effective utilization of the solar resource in arid conditions. Within the modeling scope adopted here, the evidence supports PVT + ORC as the most cost-effective of the three pathways considered for the stated capacity and boundary conditions, while acknowledging that absolute values remain contingent on-site parameters, financing terms, and technology-specific learning curves.
By contrast, the proposed extensions of this architecture to desalination, AI, data center operations, and low-carbon hydrogen production are prospective and not yet validated by primary deployments in this study. Their feasibility depends on local demand profiles, the temperature and quality of recoverable heat, cooling, and water availability, grid constraints and uptime requirements, and the surrounding regulatory context, including data protection, siting, and permitting. For desalination, integration pathways may include solar-assisted preheating for MED or RO balance-of-plant loads; for data centers, thermal integration may support absorption cooling or heat reuse subject to tight reliability envelopes; for hydrogen, low-carbon electricity can power electrolysis while cogenerated heat may improve auxiliary processes. These are technically plausible but remain hypotheses until verified through context-specific design, controls, and measurement.
To move from evidence to practice, we recommend staged pilots that evaluate integration under real operating conditions, apply independent scoring to estimate inter-rater reliability and internal consistency, and assess validity and sensitivity to alternative domain weightings. Pilots should quantify availability, power-to-heat utilization, delivered temperature grades, and lifecycle performance, while documenting bankability indicators such as capex certainty, O&M regimes, and contractual interfaces. The contribution of this paper is therefore twofold: a comparative evidence base that demonstrates the relative advantage of PVT + ORC over PV + BESS and PV + CSP for the stated case, and a clearly delineated set of application hypotheses that invite rigorous validation before large-scale adoption. Future work should also explore cross-regional benchmarking, supply chain sensitivities, and environmental co-benefits to ensure transferability and durability of the results, including water savings, emissions intensity, and land restoration opportunities, in the long term.
