1. Introduction
Urban traffic congestion remains a pressing challenge for rapidly growing cities worldwide, with far-reaching consequences for economic performance, public health, and environmental sustainability. In car-dependent regions such as Saudi Arabia, congestion is particularly acute due to rapid urbanization, limited public transit infrastructure, and increasing motorization rates. Jeddah, one of the Kingdom’s largest and fastest-growing cities, exemplifies this issue, experiencing daily congestion that undermines mobility and strains urban systems. Despite the significance of the problem, traffic studies in Saudi Arabia and the broader Middle East region still rely heavily on static, pre-collected data (e.g., manual traffic counts, periodic surveys). Such approaches fall short of capturing the real-time dynamics of urban traffic, limiting their usefulness for proactive traffic management or dynamic policy interventions. Moreover, high-resolution traffic sensor networks remain limited or cost-prohibitive in many developing cities. This study addresses these limitations by introducing a scalable, data-driven framework for monitoring urban congestion in real time, using crowd-sourced data from the Google Maps API. By collecting travel time data across major corridors in Jeddah at high temporal resolution, this research offers a fine-grained view of congestion behavior that has not previously been documented in the region. Through the application of exploratory data analysis (EDA) and unsupervised clustering, the study identifies route-level congestion hotspots, characterizes their temporal variability, and examines systematic differences across day types (weekdays vs. weekends). Critically, it also validates the reliability of Google Maps API data against GPS-based observations, strengthening the case for leveraging such publicly available tools in cities lacking formal traffic-monitoring systems. To our knowledge, this is the first peer-reviewed study to use validated, real-time Google Maps API data to quantify route-specific congestion dynamics in a Middle Eastern urban context. The methodology presented offers a replicable framework for other data-scarce cities seeking to harness low-cost data sources for evidence-based urban mobility planning. The specific contributions of this study are fourfold:
It identifies route-level congestion hotspots and peak hours in Jeddah, providing granular insights for targeted traffic interventions.
It analyzes intra-day temporal patterns of congestion to better understand commuter behavior and bottlenecks.
It evaluates the reliability of Google Maps travel time estimates by benchmarking them against observed GPS data.
It proposes a scalable, replicable framework for real-time congestion analysis in data-limited urban environments.
To guide this investigation, the study addresses the following research questions:
How can real-time crowd-sourced data be harnessed to systematically quantify urban congestion at fine temporal resolutions?
What temporal congestion patterns emerge across different day types, and how can these insights support more adaptive and responsive traffic management strategies?
Subsequent sections review the literature, detail the methodology, discuss findings on temporal congestion patterns and hotspot identification, and conclude with policy implications and future research directions. This case study highlights the value of integrating real-time analytics into traffic-monitoring practices, offering a model for similar urban environments across the Kingdom.
2. Literature Review
Crowd-sourced traffic data is derived from GPS-enabled devices, mobile navigation applications, connected vehicles, and social media platforms, allowing researchers and policymakers to access real-time traffic insights [
1]. This real-time approach improves situational awareness and enables adaptive traffic management strategies [
2]. Studies show that user-reported incidents and vehicle trajectories significantly enhance road safety monitoring by identifying high-risk areas, hazardous road conditions, and congestion hotspots [
3]. Additionally, passively collected data from ride-sharing platforms and fleet management systems can supplement traditional traffic models, particularly in areas where official transportation data is sparse or outdated [
1]. Moreover, studies have shown that integrating GPS probe data with social media inputs significantly enhances congestion detection in data-sparse environments. For instance, Wang et al. (2017) [
4] developed a hybrid framework that effectively computes urban traffic congestion using sparse GPS data enriched with geotagged tweets. Building on this, Wang et al. (2019) [
5] proposed a Parallel Coupled Hidden Markov Model to fuse heterogeneous data sources for accurate and scalable traffic estimation.
The integration of real-time event detection with historical congestion patterns enables researchers to predict and mitigate traffic bottlenecks, contributing to safer and more efficient urban mobility [
6]. Artificial intelligence (AI) and machine learning algorithms have further enhanced the effectiveness of crowd-sourced data by refining congestion prediction models, enabling dynamic rerouting, and improving incident response coordination [
7]. Research suggests that crowd-sourced traffic enforcement data, such as reports on speed limit violations and police presence, can influence traffic speed distributions and improve congestion forecasting [
8]. Moreover, data obtained through crowd-sourcing methodologies has demonstrated significant utility in the examination of the robustness of urban transportation networks amidst severe meteorological phenomena [
9]. The Google Maps API has emerged as a powerful tool for urban traffic analysis, offering a comprehensive platform for real-time traffic monitoring, route optimization, and congestion management [
10]. Automated data extraction tools can process real-time Google Maps traffic information to pinpoint consistently slow-moving areas, helping local governments implement targeted congestion relief strategies [
11]. Similarly, visualization techniques such as GIS-based traffic modeling allow urban planners to compare congestion levels across different cities and assess their correlation with socioeconomic factors [
12]. The API is widely utilized in smart city initiatives, supporting real-time traffic control systems, ride-sharing services, and public transportation planning [
13]. For instance, studies show that Google Maps JavaScript API 3.65-used for traffic predictions can assist in developing adaptive signal control algorithms, dynamically adjusting green light durations based on live traffic flow [
10]. Moreover, researchers have explored the potential of integrating Google Maps data with AI-based traffic forecasting models to improve transportation resilience [
13]. Given its accuracy, scalability, and accessibility, the Google Maps API represents an indispensable resource for modern traffic analysis. GIS-based traffic modeling visualizes congestion, enabling urban planners to compare levels across cities and assess correlations with socioeconomic factors [
12].
Recent studies underscore the growing use of crowd-sourced traffic data and AI techniques for congestion analysis in urban environments. In Casablanca, Morocco, researchers employed the Waze API (Waze Transport SDK version 4.43) to calculate a Travel Time Index (TTI) and used K-means clustering to classify congestion levels, linking them to land use patterns [
14]. Ji et al. (2021) [
15] validated the reliability of Google Maps traffic data in Montgomery County by comparing it with sensor-based ground truth data, finding strong correlations. Dao et al. (2020) [
16] introduced a 3DCNN-based deep learning model to predict congestion on spatial meshcodes, enabling efficient pattern recognition through temporal databases. Similarly, in Tokyo, Arp et al. (2020) [
17] applied a metaheuristic optimization framework to crowd-sourced mobility data to dynamically reallocate traffic and reduce travel times. These studies highlight scalable, real-time, and data-rich approaches to urban mobility planning, though challenges remain in data accessibility, cost, and context-specific adaptability.
Recent studies emphasize the need for intelligent transportation systems in Saudi Arabia, advocating for the integration of AI-driven congestion monitoring, smart traffic signals, and culturally sensitive urban planning [
18]. A GIS-based study conducted at King Abdulaziz University highlights the importance of spatial data in prioritizing road infrastructure investments, particularly in high-traffic areas [
19]. Additionally, researchers have developed IoT-based adaptive traffic control algorithms using convolutional neural networks (CNNs) and real-time sensor data, demonstrating their potential to reduce congestion and waiting times [
20]. The primary factors contributing to congestion in Jeddah include high population density, infrastructure limitations, and inefficient traffic management strategies [
21]. While urban expansion has increased reliance on private vehicles, technological advancements in real-time traffic monitoring could offer scalable solutions to mitigate congestion [
22].
By harnessing data from GPS tracking, public transit systems, ride-sharing platforms, and IoT-enabled traffic sensors, researchers can detect congestion patterns, identify mobility bottlenecks, and develop smarter transportation networks [
23]. Predictive modeling techniques, including machine learning algorithms and real-time traffic data integration, have demonstrated strong potential for congestion forecasting and dynamic traffic rerouting [
24]. For instance, studies utilizing edge-cloud computing frameworks have shown how taxi fleets and ride-hailing services can optimize passenger pickups and minimize traffic congestion in dense urban areas [
25]. Additionally, process mining techniques applied to open transportation allow researchers to uncover commuter behavior trends and detect urban mobility inefficiencies [
26]. These findings underscore the importance of real-time data integration in traffic management.
Recent works in 2023–2025 have increasingly emphasized the role of real-time, crowd-sourced, and AI-integrated traffic data in urban mobility planning [
1,
3]. However, these studies remain concentrated in North American, European, and East Asian settings. Also, recent research has demonstrated diverse applications of the Google Maps API in traffic analysis across different contexts. Muñoz-Villamizar et al. (2021) [
27] applied the Google Maps API to evaluate urban traffic congestion in Boston, demonstrating how real-time travel time data can be used to construct congestion indices and analyze spatial–temporal mobility patterns. Hasabi et al. (2024) [
28] mapped congestion patterns in urban Jakarta using digitized Google Maps data and linked them to gas station density as an emerging pollution proxy.
However, most applications of the Google Maps API remain concentrated in Western urban contexts, with limited attention to data-scarce regions such as the Middle East. Systematic application and validation of the Google Maps API remain largely unexplored in Middle Eastern contexts. Our contribution, therefore, lies in extending these methods to a data-scarce environment (Jeddah), validating the API against GPS trajectories and proposing a scalable congestion-monitoring framework that can be adapted to similar urban settings. This study analyzes real-time, crowd-sourced traffic data from the Google Maps API in Jeddah, Saudi Arabia, to monitor congestion. Using exploratory data analysis, clustering, and congestion index modeling, it offers insights for urban planners and policymakers to improve mobility.
3. Methodology
This section details the data collection process, the computation of a congestion index, and the analytical techniques—such as cluster analysis—used to examine temporal and spatial variations in traffic conditions. Collectively, these methods establish a practical framework for real-time congestion monitoring and data-driven decision making in urban mobility planning.
3.1. Study Area and Data Collection
Jeddah, the second-largest city in Saudi Arabia, is a crucial economic, commercial, and transportation hub. Situated along the eastern coast of the Red Sea, Jeddah plays a pivotal role in the national economy and serves as the primary gateway for millions of pilgrims traveling to the holy cities of Mecca and Medina. However, rapid urbanization, population growth, and increasing vehicle ownership have significantly strained the city’s road infrastructure, leading to chronic traffic congestion, particularly along its major arterial roads and urban corridors.
The road network in Jeddah is composed of a combination of highways, expressways, arterial roads, and local streets, each serving distinct purposes in facilitating urban mobility [
29,
30,
31,
32]:
King Abdulaziz Road: Parallel to the coast; links residential, commercial, and industrial areas.
King Fahd Road: Major commercial route intersecting King Abdulaziz Road; handles heavy business traffic.
Madinah Road: Connects Jeddah to Medina; passes urban districts, malls, and industrial areas.
Prince Majed Road: Key east–west corridor intersecting King Abdulaziz Road; links city sectors.
King Abdullah Road: Crucial for central traffic; intersects King Fahd Road.
Corniche Road: Coastal route for transport and leisure; busy on weekends/holidays.
Sari St: Commercial corridor intersecting King Abdulaziz Road.
Ghernata Street: Links Prince Mohammed Road to Palestine Road; supports local traffic.
Hera Street: Dense business area; intersects King Fahd Road.
Tahlia Street: Major shopping/entertainment hub; high peak-hour traffic.
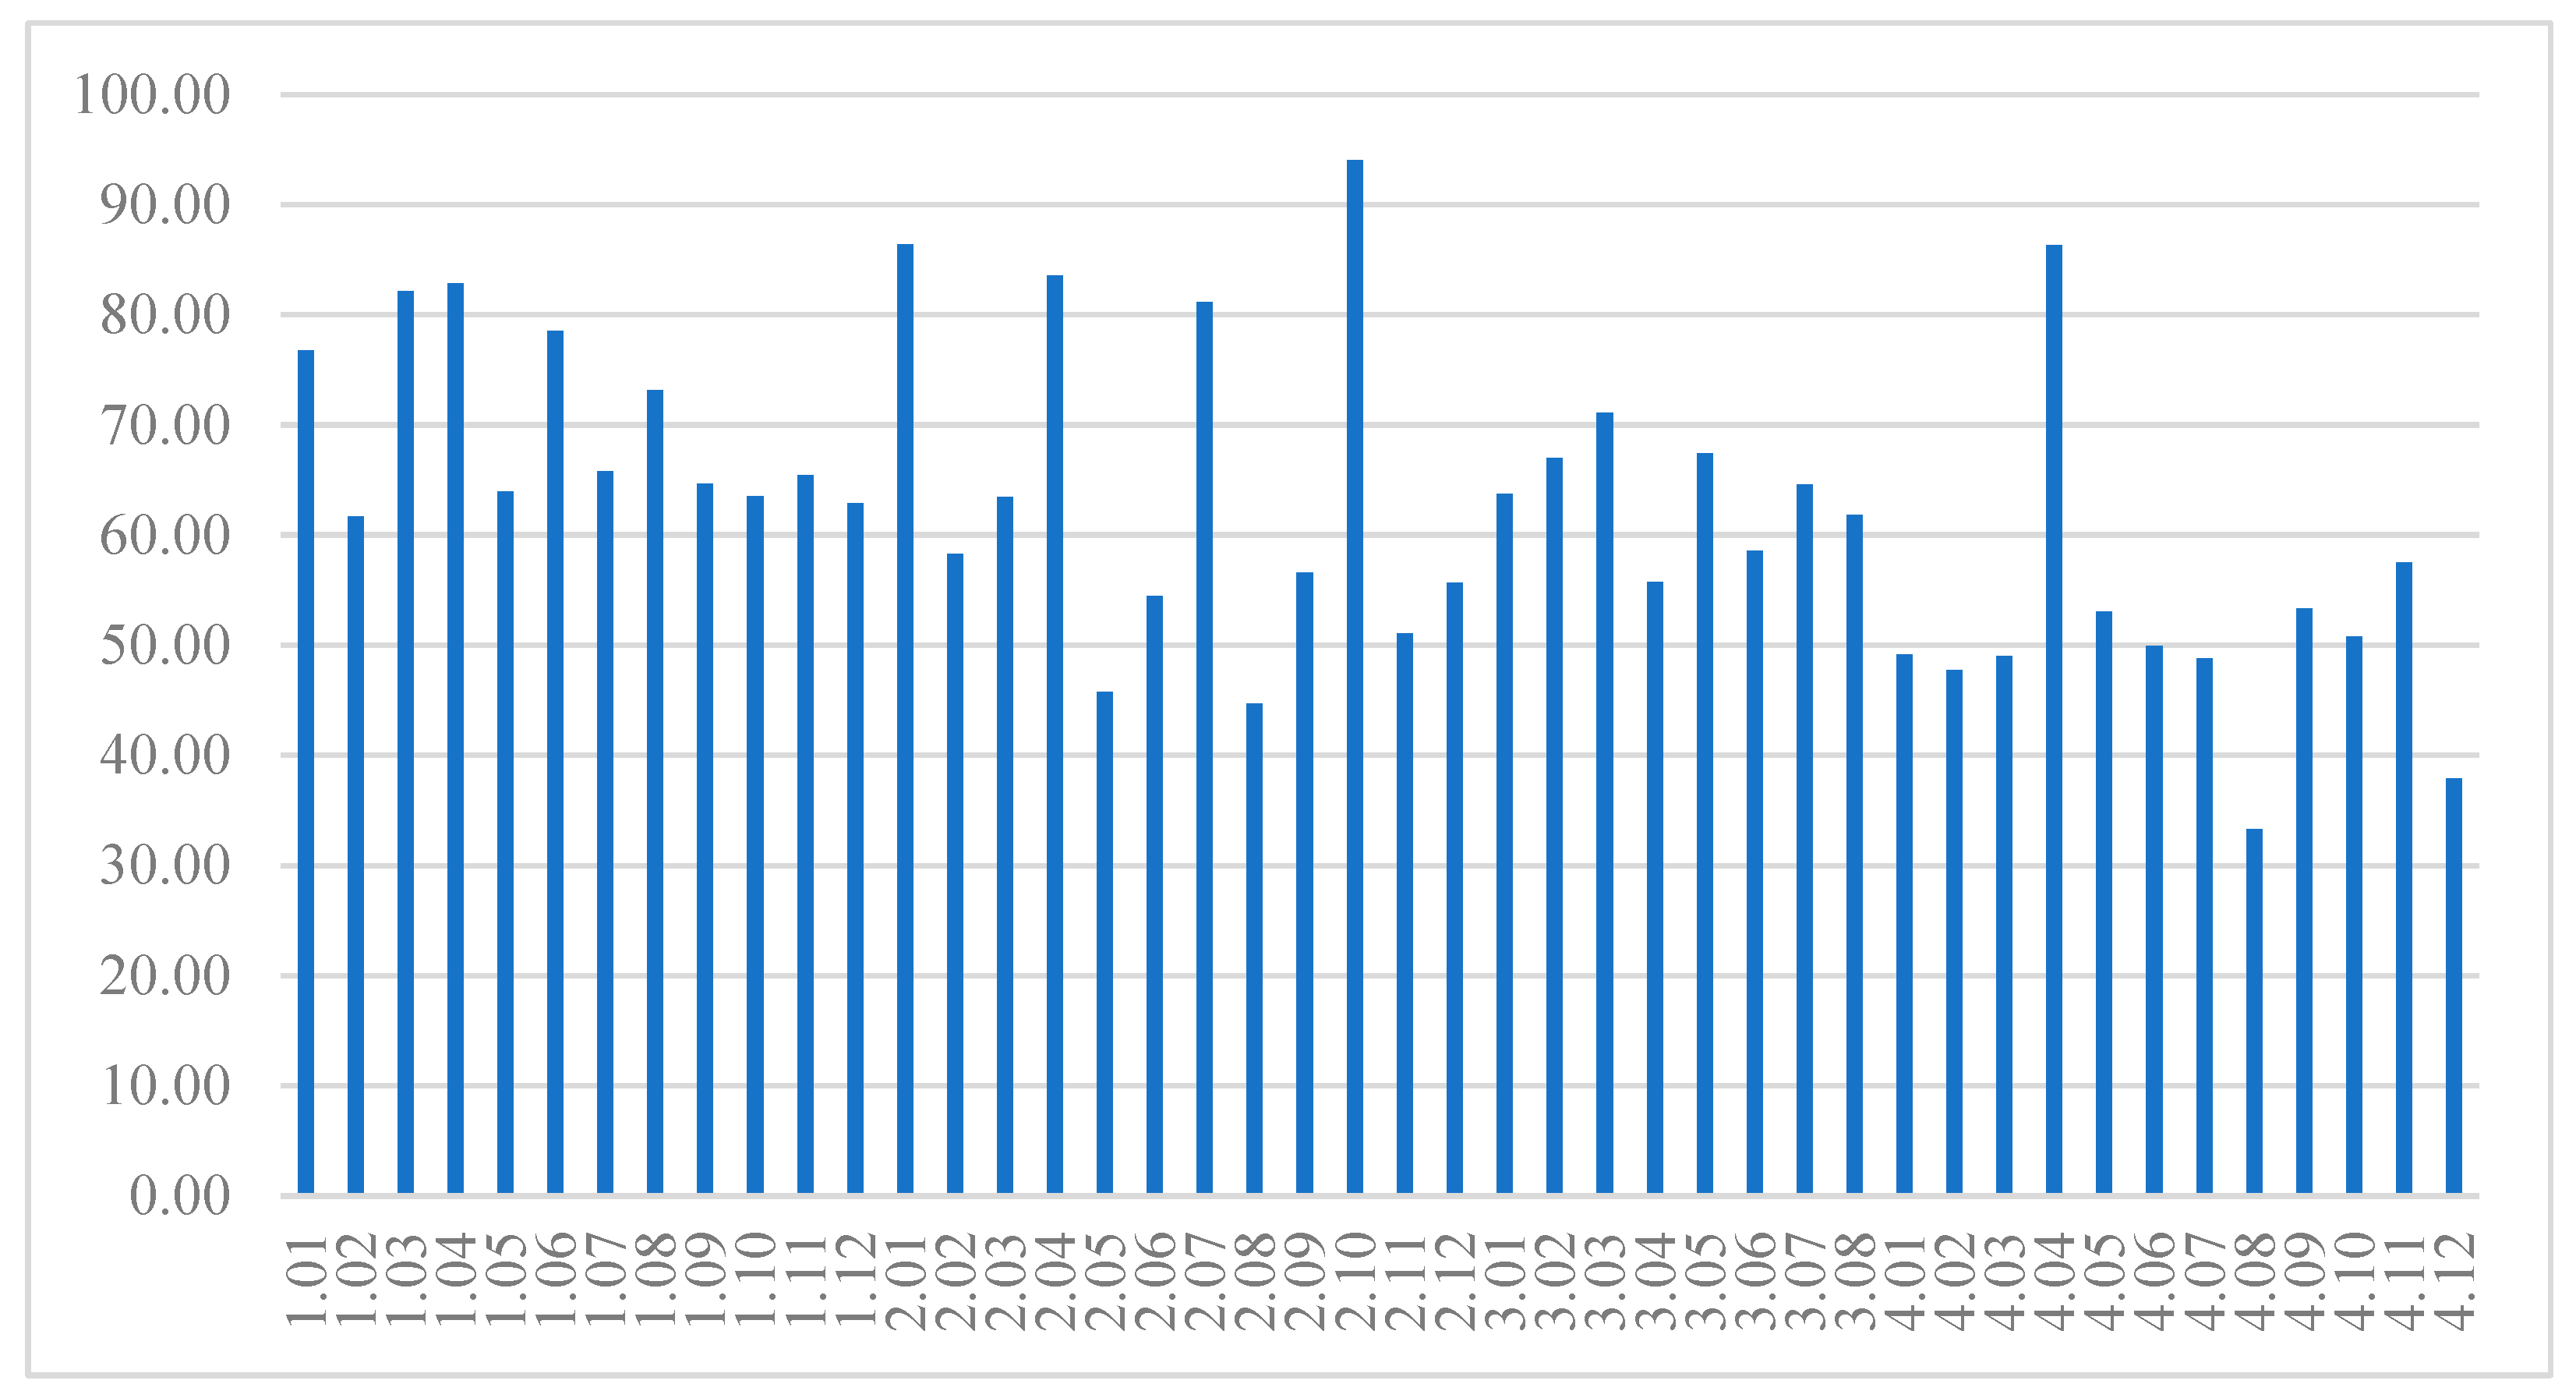
To analyze real-time traffic congestion trends across Jeddah’s Road network, this study utilizes crowd-sourced data from the Google Maps API, which aggregates live traffic information from GPS-enabled devices, navigation apps, and connected vehicles. A total of 44 key routes were selected for this study, covering roads with historical congestion trends, high traffic volumes, and strategic importance. Among these, four major intersections, known for experiencing persistent congestion, were chosen for in-depth analysis: (1) Palestine Road and King Fahd Road, (2) Palestine Road and Prince Majid Road, (3) Madinah Road and Palestine Road, and (4) King Fahd Road and Ghernata Street.
Figure 1 is a visual representation of these intersections on the city map.
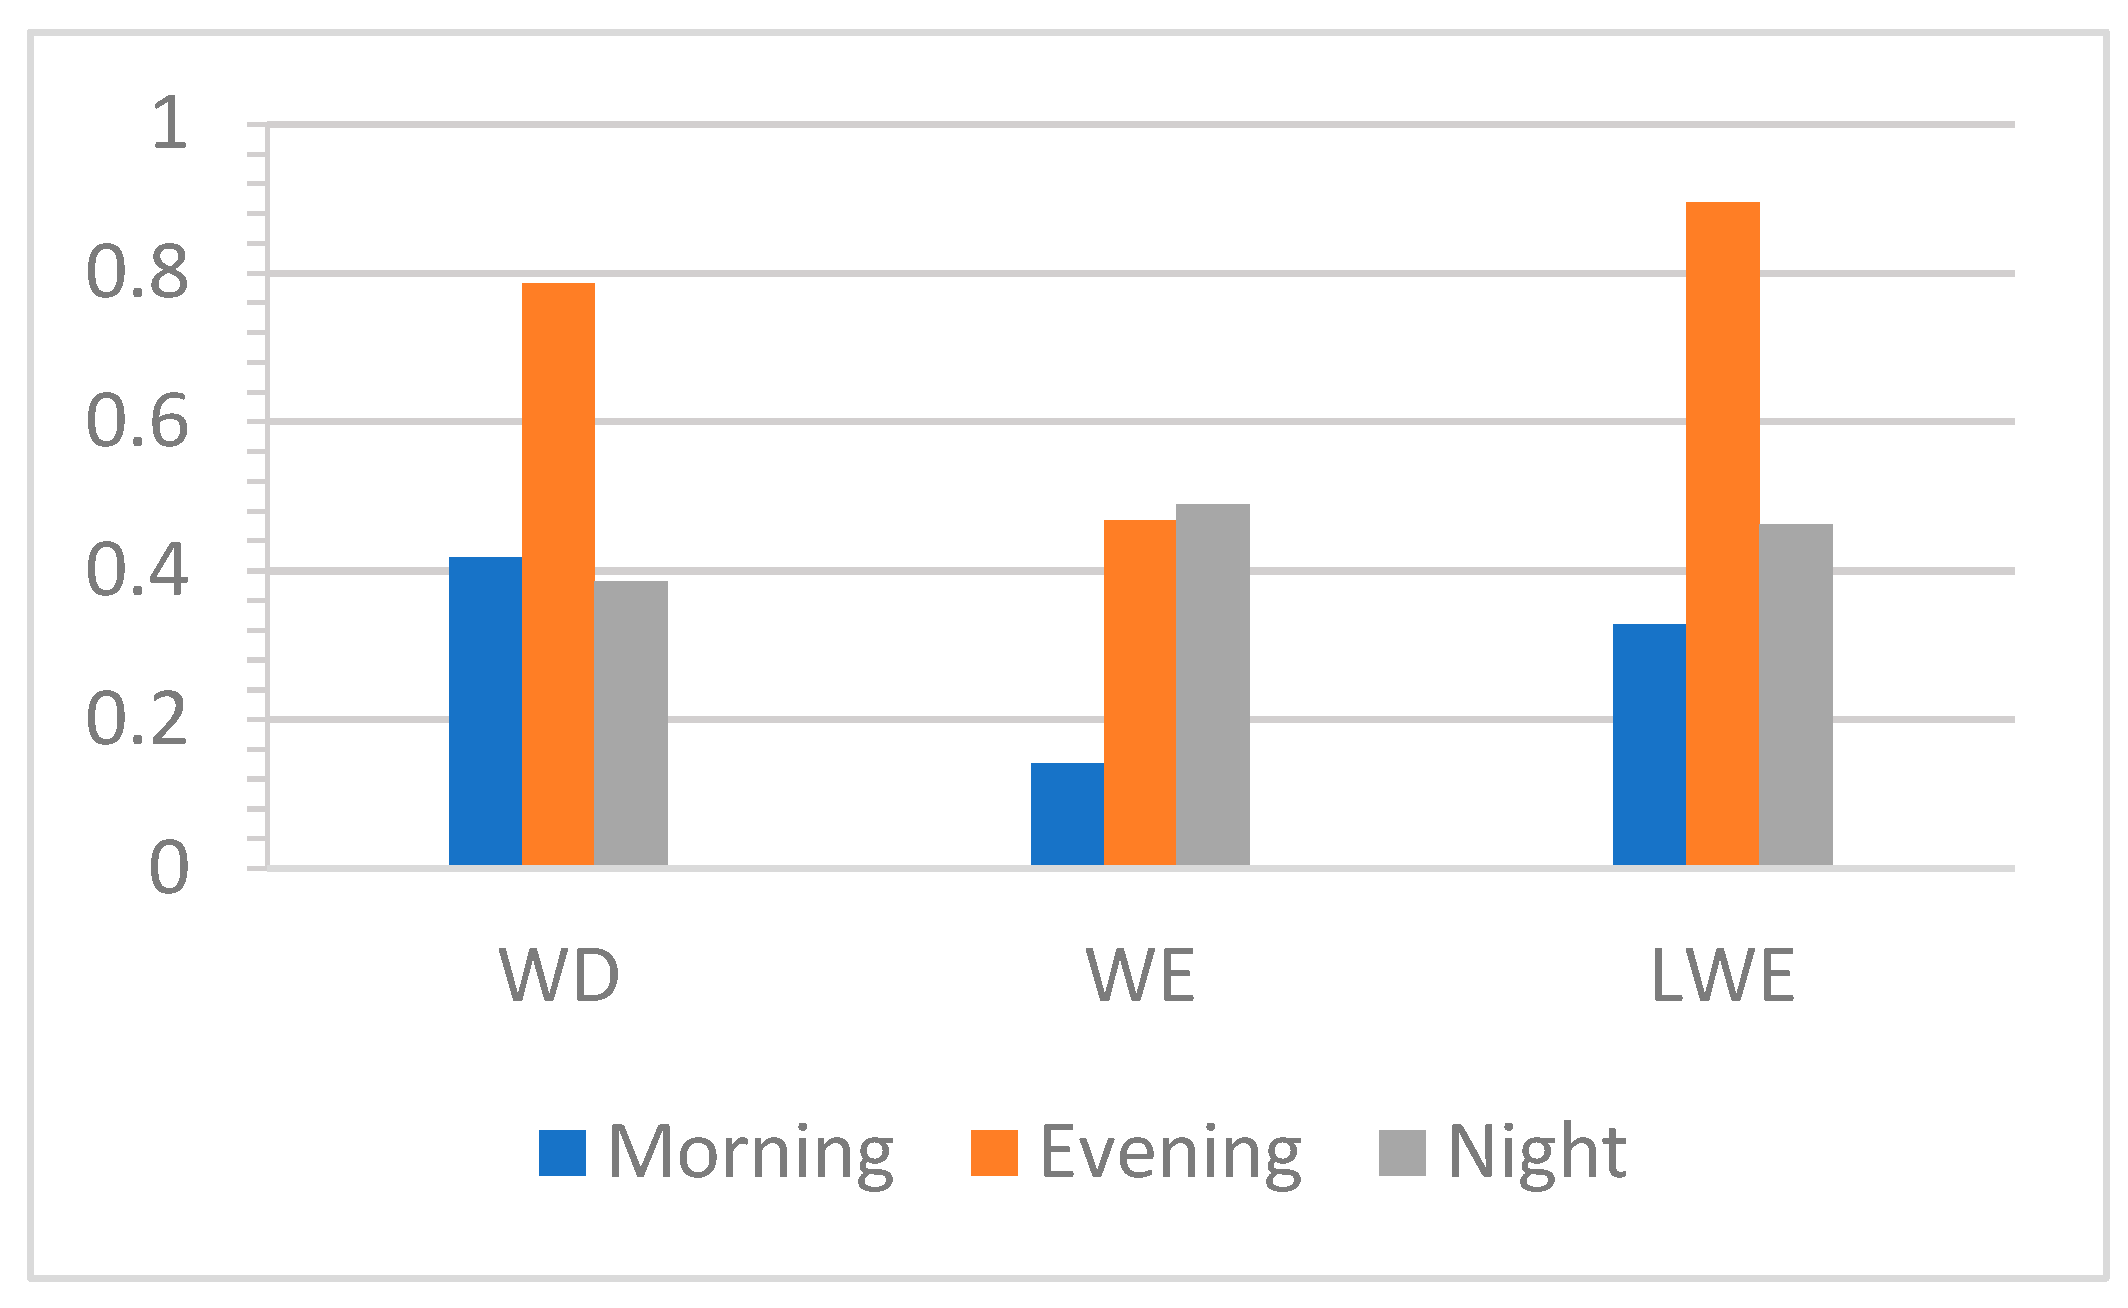
To ensure a comprehensive dataset, traffic data was collected over a nine-day period starting on 23 May 2023, capturing a variety of commuting behaviors and congestion patterns: (a) five regular workdays (WDs) to study peak-hour congestion under normal weekday conditions, (b) two weekend days (WEs) to observe leisure-related traffic fluctuations, and (c) two long weekend days (LWEs) to evaluate how extended holidays influence traffic patterns. To gather real-time traffic data, the Google Maps API was leveraged, which compiles live traffic information from millions of GPS-enabled devices, navigation apps, and connected vehicles. A Python script (python 3.10 running on a Google Cloud Virtual Machine) was developed to automatically retrieve average speed and travel time estimates for each selected route at 15 min intervals, ensuring a continuous and comprehensive dataset. The script was deployed on a Google Cloud Virtual Machine (VM) to automate data collection without interruptions. For each query, the API provided the timestamp (date and time of retrieval), route ID (unique identifier for each road segment), current traffic speed (km/h), expected travel time (minutes), and estimated free-flow speed (FFS). To ensure accuracy, each route’s start and end coordinates were predefined, and only verified road segments were included in the study. The details of the selected routes, including coordinates, segment lengths, and directions, are presented in
Appendix A.
Once collected, the data underwent structuring and cleaning to ensure consistency and reliability. This involved (1) synchronizing timestamps across all routes to maintain uniform data intervals, (2) standardizing data formats to ensure compatibility across different analytical tools, and then (3) checking for missing or duplicated entries to maintain dataset integrity. This refined dataset serves as the foundation for the congestion analysis, allowing us to examine traffic flow variations across different time periods and urban zones.
3.2. Congestion Index Calculation
Traditional measures such as the Travel Time Index (TTI), Speed Reduction Index (SRI), or delay-based measures focus primarily on deviations in travel time or average speed relative to free-flow conditions. While useful, these indices often overlook spatial variability and may underrepresent congestion severity in multi-corridor settings. The Congestion Index (CI) proposed in this study provides a more comprehensive measure by directly benchmarking observed speeds against route-specific free-flow speeds, thereby reflecting both the intensity and persistence of congestion across time and space. Compared with TTI, which normalizes delays as a ratio of peak-to-free-flow travel times, our
CI offers finer temporal resolution (15 min intervals) and explicit alignment with widely understood Google Maps’ color-coded thresholds, enhancing both interpretability and policy relevance. Previous studies that employed the Google Maps API for congestion measurement, such as Muñoz-Villamizar et al. (2021) [
27] and Hasabi et al. (2024) [
28], demonstrate the practicality of travel time-based indices but did not emphasize route-level benchmarking or temporal clustering, as presented here. Accordingly, the
CI facilitates hotspot identification and real-time applicability in data-scarce environments, making it a robust and scalable alternative for congestion monitoring in Middle Eastern cities.
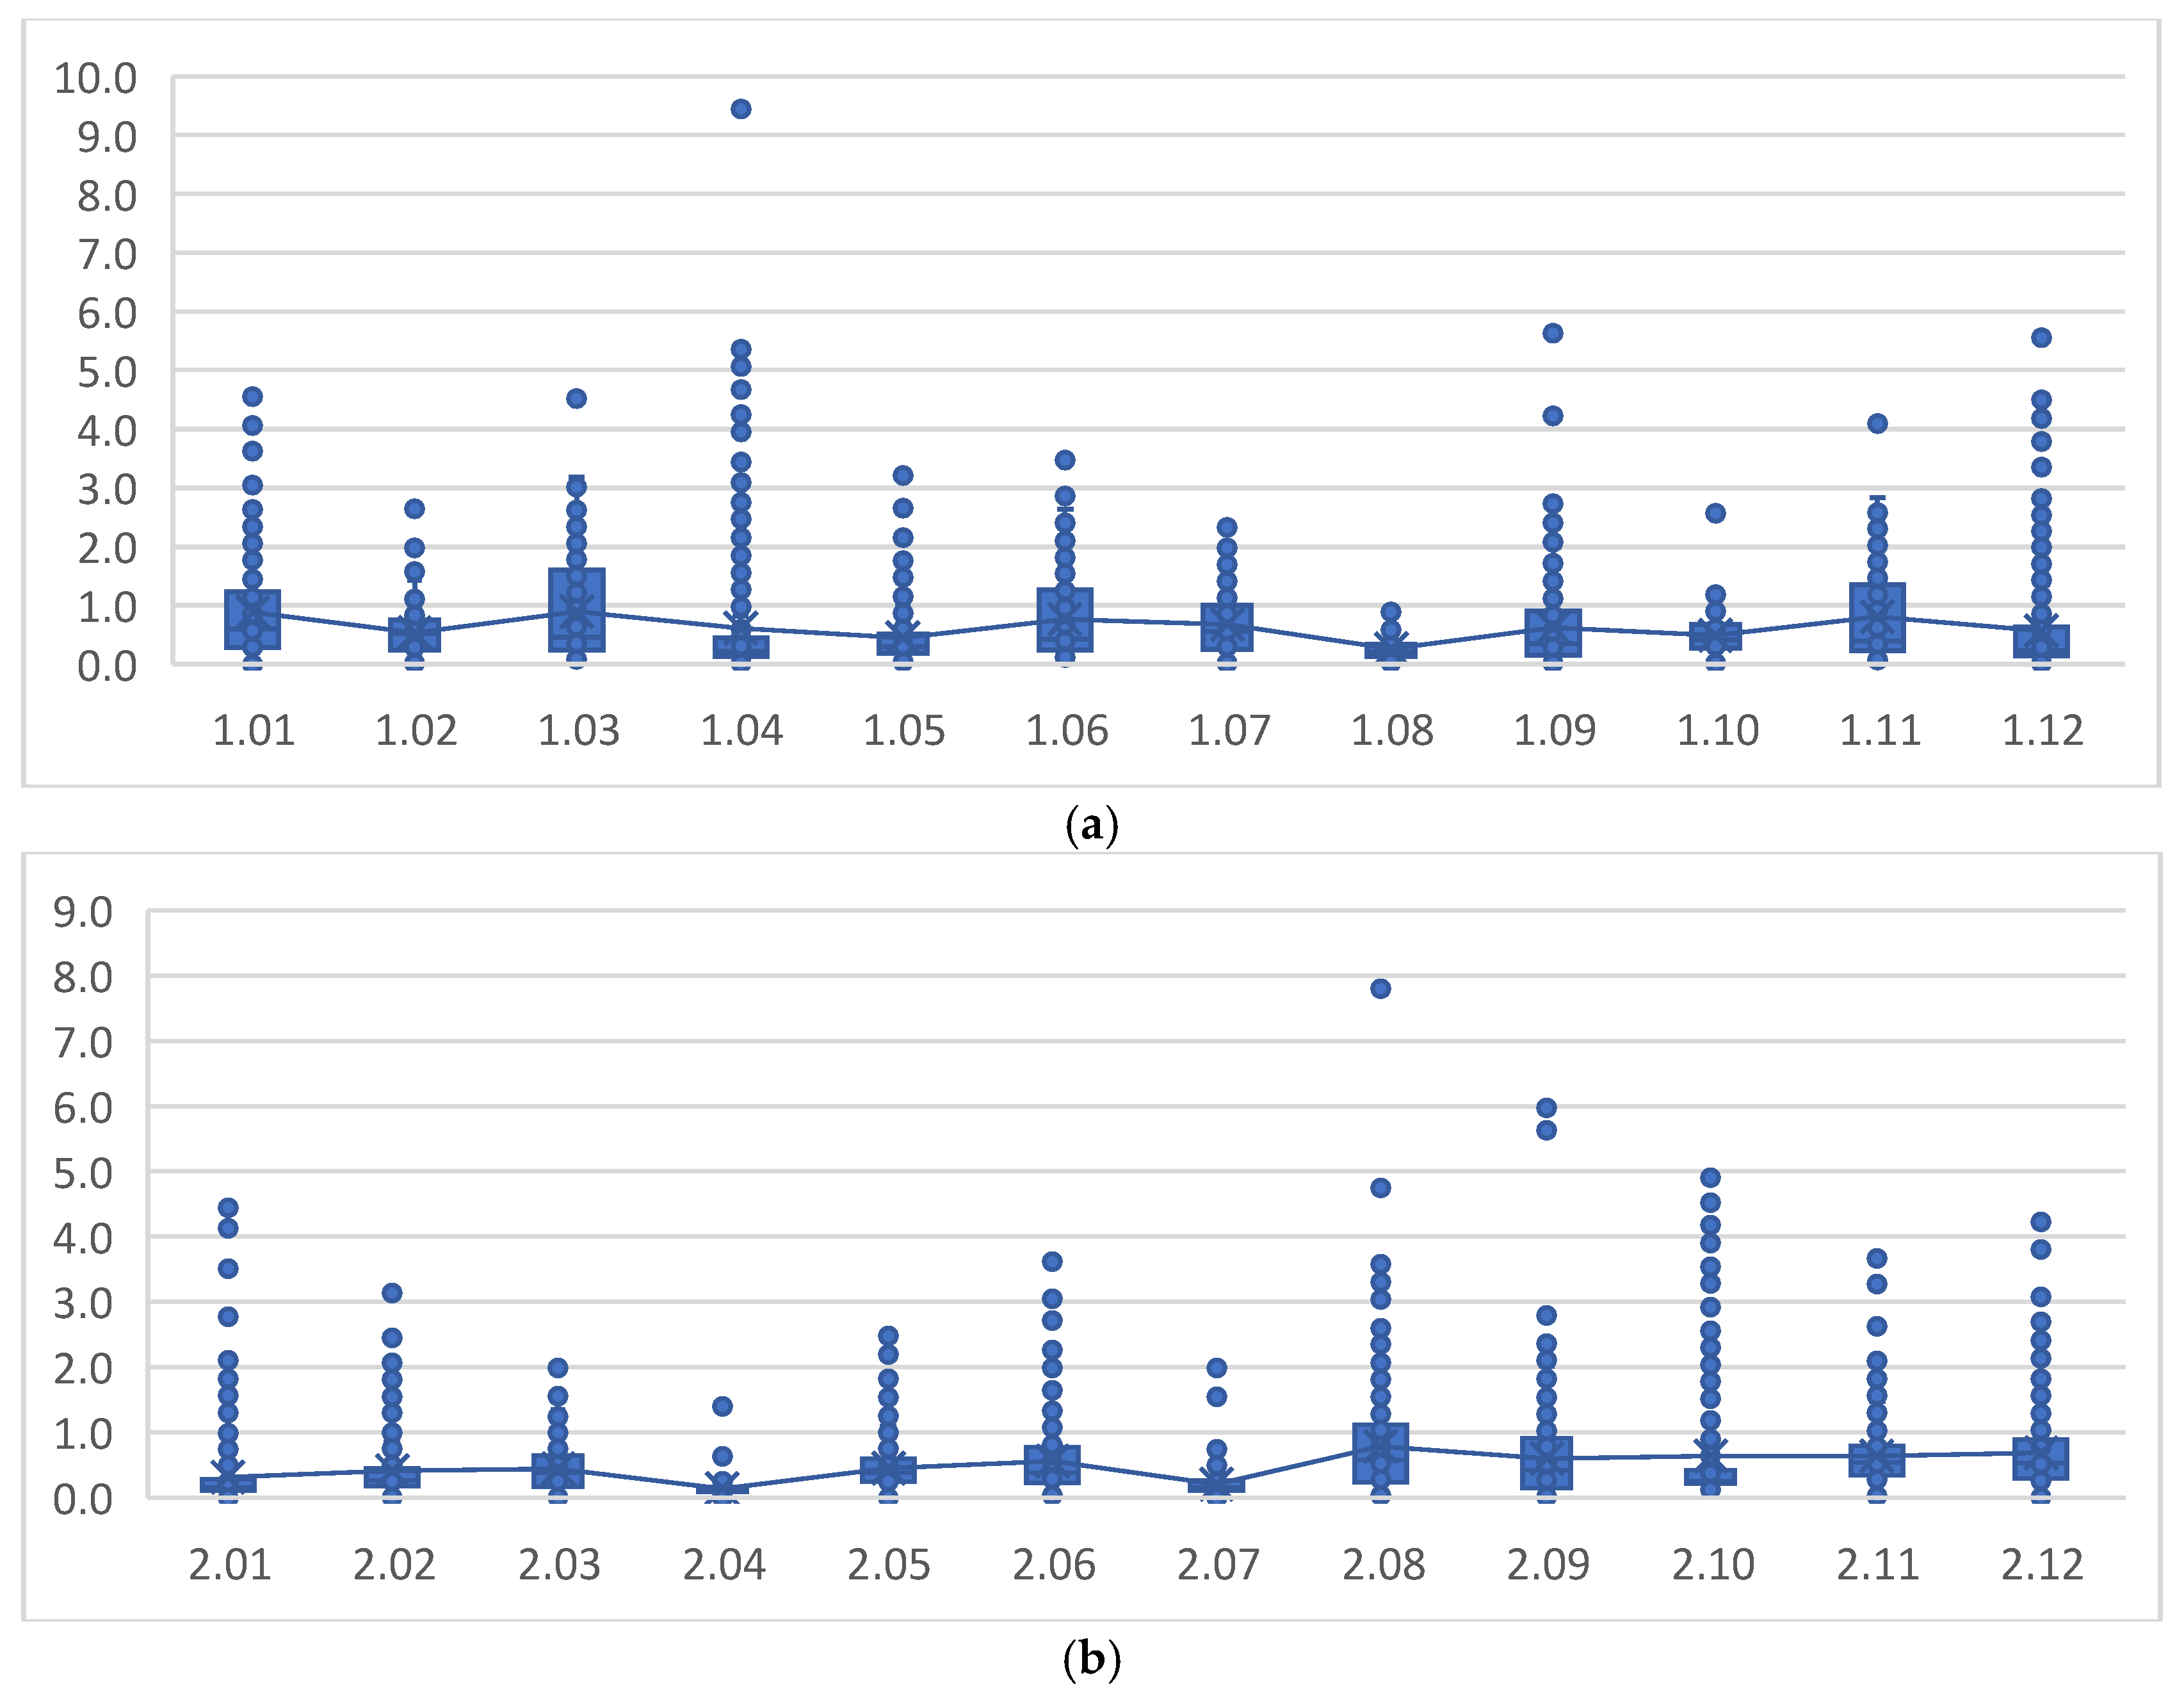
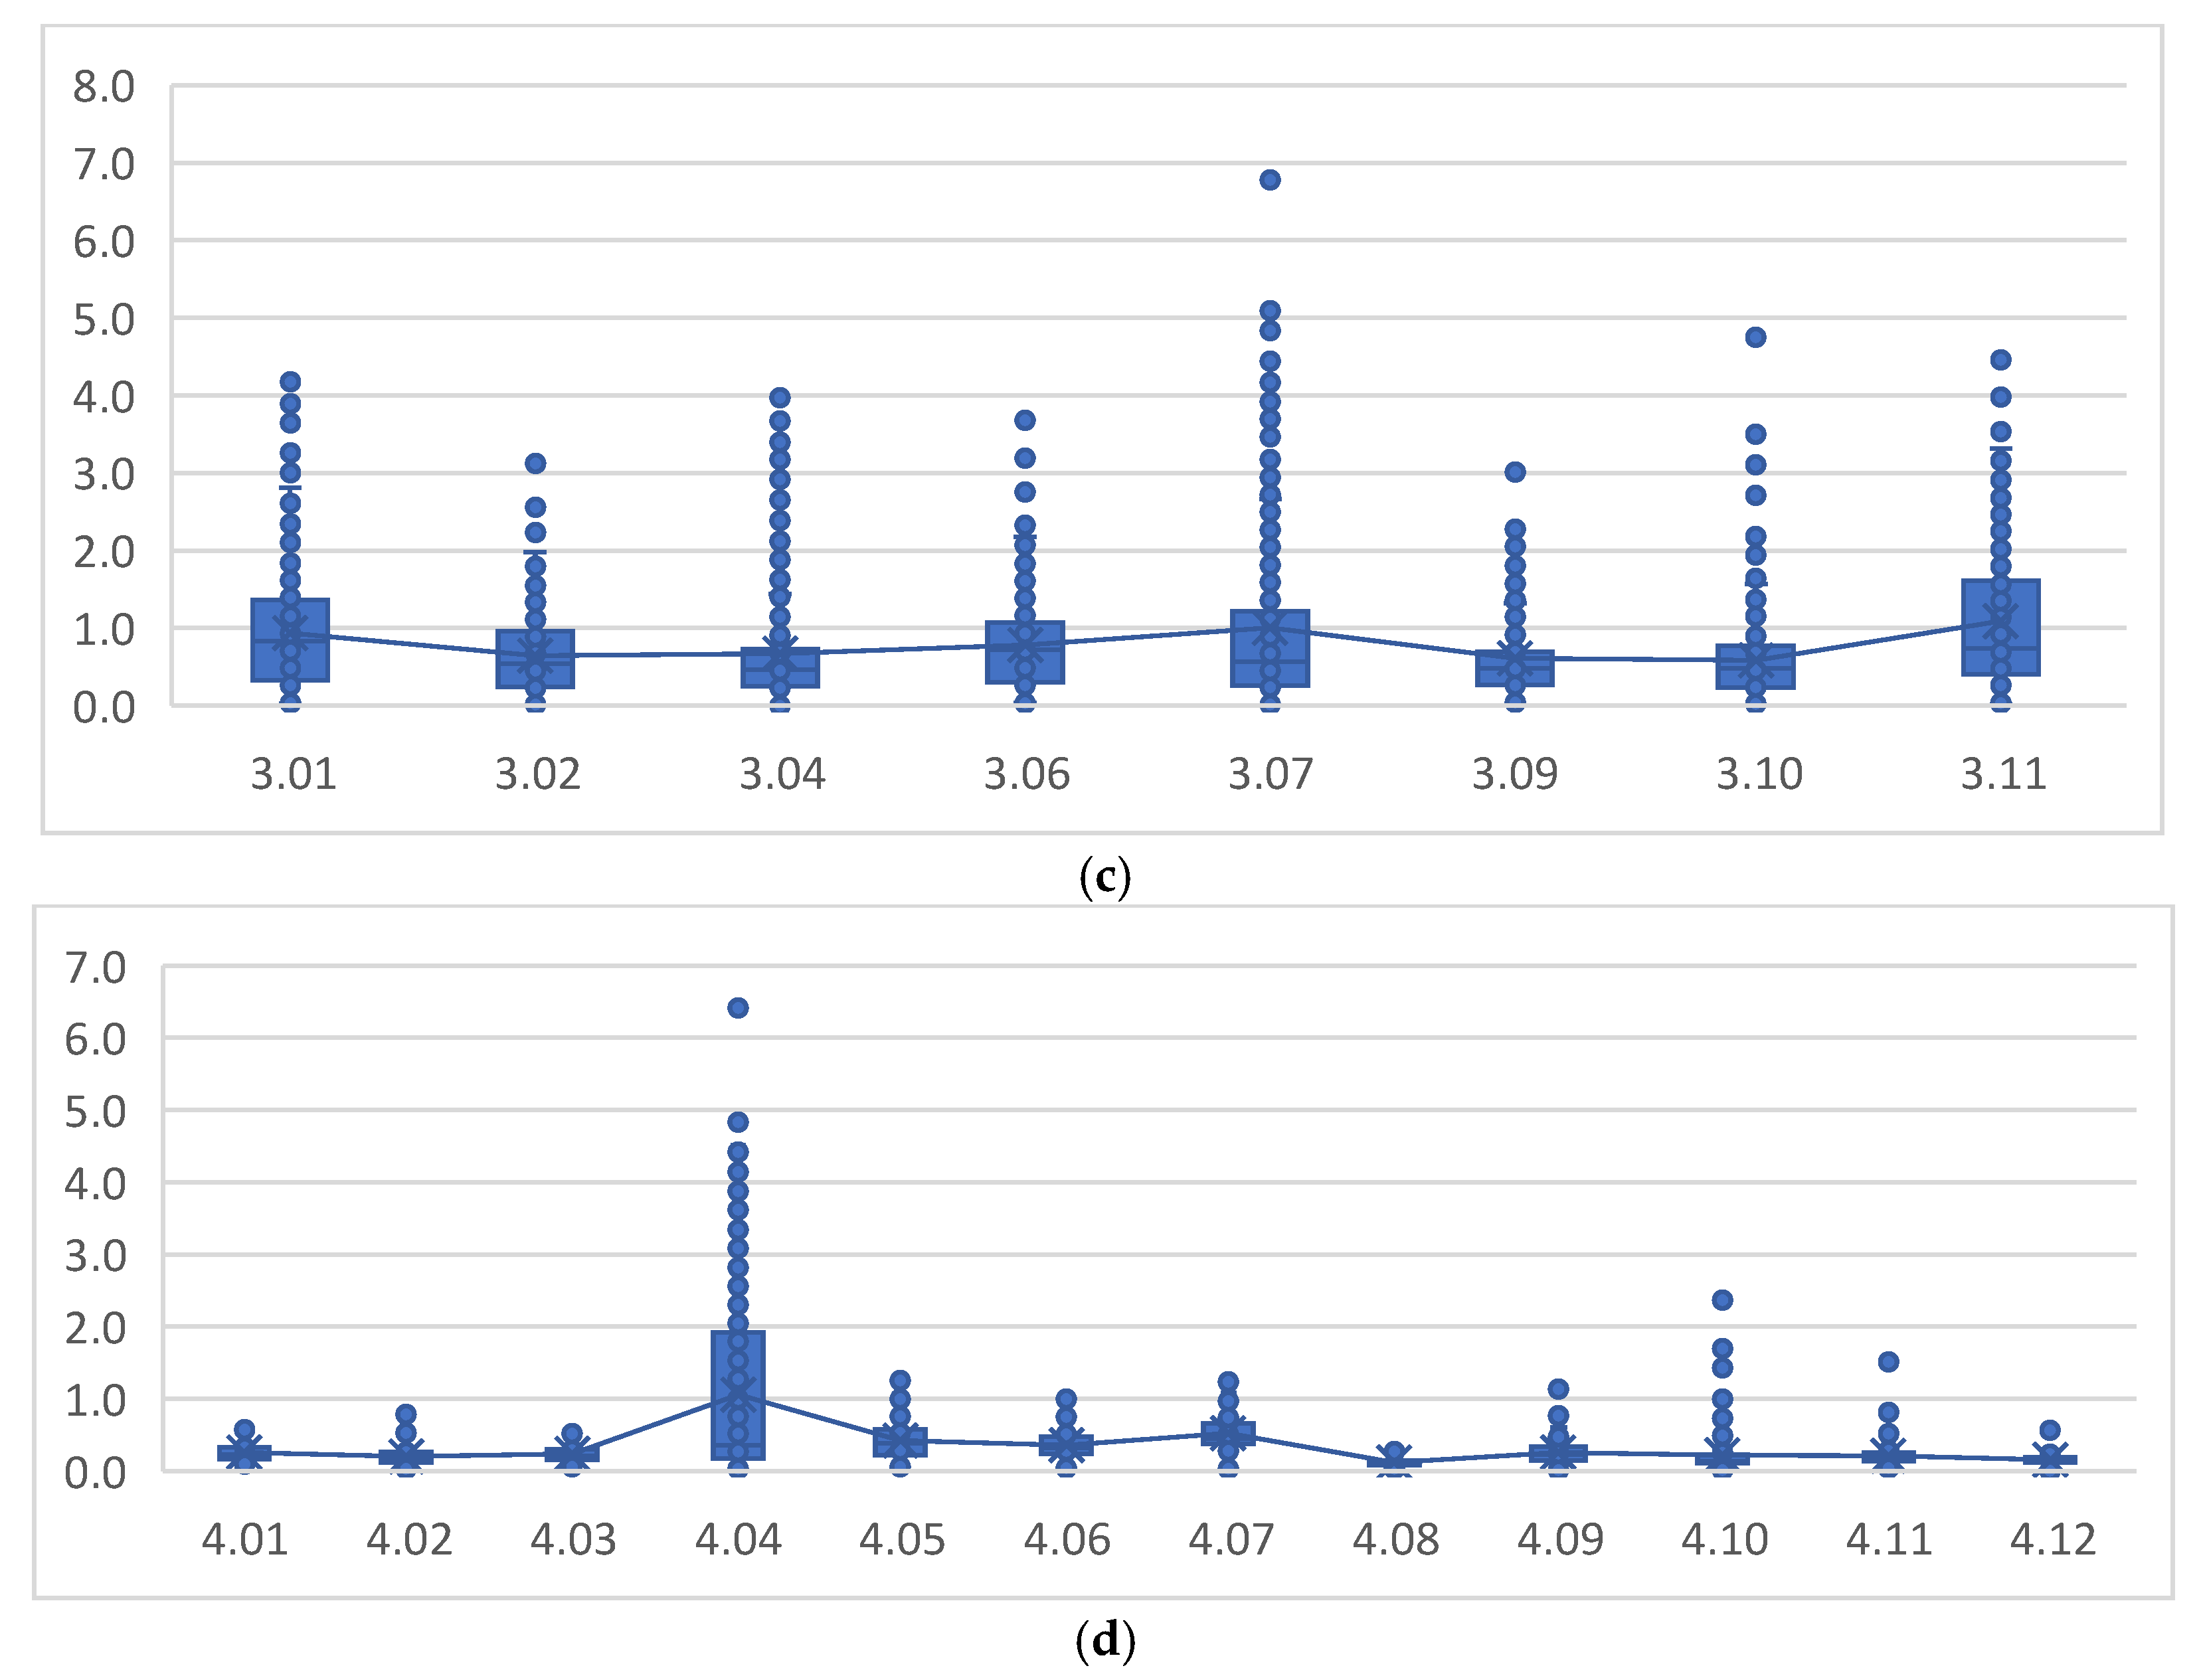
Addressing congestion effectively requires a quantifiable measure that enables urban planners and traffic management authorities to assess road performance and mobility trends. In this study, the Congestion Index (CI) is employed as a key metric to evaluate the severity of traffic congestion across Jeddah’s major roadways. The Congestion Index (CI) serves as a quantitative indicator, representing the degree to which real-time traffic speeds deviate from ideal, uncongested conditions. This deviation is assessed by comparing observed vehicle speeds to a reference benchmark, commonly defined as the free-flow speed (FFS): the maximum attainable speed under optimal conditions with minimal external disruptions. Higher CI values indicate severe congestion and diminished traffic efficiency, whereas lower values suggest smooth vehicular movement and minimal delays.
Urban traffic management authorities rely on the Congestion Index to monitor, analyze, and optimize transportation networks, enabling the development of data-driven congestion mitigation strategies. This study employs a methodology that systematically compares real-time traffic speeds against historically recorded free-flow conditions (Nair et al., 2019 [
12]). The Congestion Index (
CI) is calculated using the following formula:
where
: Congestion Index for a specific road segment n at time t.
: Actual traffic speed (km/h) at time t.
: Free-flow speed (km/h), representing the highest speed recorded when the road is uncongested.
This formula effectively captures the relative speed reduction experienced during congestion: when CI approaches zero, the road operates near its free-flow capacity; when CI increases beyond 0.54, severe congestion is present.
Google Maps employs a color-coded scheme: green, yellow (orange), and red, each corresponding to specific CI thresholds, effectively categorizing road segments based on congestion intensity. The Congestion Index (CI) measures traffic conditions, aligning with Google Maps’ color-coded system to represent congestion severity:
Green (Free-Flowing Traffic): CI ≤ 0.18 indicates minimal congestion, with traffic moving at 85–100% of free-flow speed.
Yellow (Moderate Congestion): CI between 0.18 and 0.54 reflects moderate traffic, with speeds at 65–85% of free-flow speed, and mild delays.
Red (Heavy Congestion): CI > 0.54 indicates significant congestion, with speeds below 65% of free-flow speed, causing severe delays and potential route changes.
This system offers a quick, visual understanding of traffic conditions for commuters and planners, especially during severe slowdowns, stop-and-go movement, and extended travel delays, requiring route adjustments or traffic interventions to improve flow.
The Congestion Index operates on a continuous gradient, where higher values indicate worsening congestion levels. As
CI approaches zero, the actual travel speed is nearly equivalent to free-flow speed, classifying the road segment as green. Conversely, higher
CI values (above 0.54) indicate severe congestion, triggering a red classification. This dynamic color representation is particularly useful for real-time navigation, as it enables both daily commuters and transportation planners to identify congestion hotspots and make informed travel decisions.
Table 1 presents the specific Congestion Index thresholds corresponding to Google Maps’ navigation colors, providing a structured reference for interpreting congestion levels.
The real-time updating of Google Maps’ traffic colors is directly linked to CI calculations, ensuring that users receive accurate, continuously refreshed insights into road conditions. This integration significantly enhances situational awareness, empowering drivers to make data-driven route adjustments while providing urban planners with a robust tool for congestion analysis and intervention strategies. To systematically evaluate congestion levels across Jeddah’s road network, a structured approach was adopted:
Estimating Free-Flow Speed (): The free-flow speed for each route segment was determined by analyzing historical speed data during late-night and early-morning hours (typically between 2:00 a.m. and 6:00 a.m.), when traffic is minimal and unobstructed.
Collecting Real-Time Speed Data (): Using the Google Maps API, traffic speed data was retrieved every 15 min for all selected road segments, ensuring a comprehensive dataset capturing temporal congestion fluctuations.
Computing the Congestion Index (CI): The CI formula was applied to quantify congestion severity by comparing real-time speeds () with free-flow conditions (), identifying delays and efficiency losses across different routes.
Mapping CI Values to Google Traffic Colors: Each road segment was assigned a congestion level (Green, Yellow, or Red) based on CI thresholds, ensuring alignment with Google Maps’ real-time traffic visualization.
3.3. Free-Flow Speed Analysis
Free-flow speed (FFS) is the ideal travel speed on a road segment under uncongested conditions, serving as a baseline for evaluating traffic delays. Common methods for collecting FFS include (1) field observations under low-traffic conditions, (2) traffic simulations, and (3) historical speed data analysis. In this study, FFS is essential for calculating the Congestion Index (CI) and is estimated using historical speed data from low-traffic hours (2:00–6:00 a.m.). This approach, which avoids fieldwork, captures consistent speed trends and offers a reliable, scalable method suited to Jeddah’s urban environment.
Although closely related, free-flow speed (FFS) and posted speed limits often differ. FFS represents the maximum speed in ideal conditions, while speed limits are influenced by safety, road design, and policy. Key factors influencing speed limit decisions include:
Road design: Curvature, lane width, and pavement quality determine safe travel speeds.
Pedestrian/cyclist activity: High-foot-traffic areas may have lower speed limits, even if the road could support higher speeds.
Traffic control measures: Intersections and stop signs disrupt FFS but may not justify speed limit reductions.
Accident history/enforcement: High accident rates may lead to lower speed limits for safety.
Comparing FFS and posted limits offers insights into road efficiency:
FFS > Speed Limit: Indicates overly restrictive speed limits or that the road design could support higher speeds.
FFS < Speed Limit: Suggests external factors like congestion or poor road conditions are limiting speed, pointing to potential infrastructure improvements.
Understanding these differences helps policymakers adjust regulations to better align speed limits with actual driving conditions while maintaining safety.
3.4. Data Validation: Ensuring Accuracy and Reliability
To establish confidence in the accuracy and reliability of the traffic data collected from the Google Maps API, a validation process was conducted by cross-referencing the extracted dataset with real-time GPS-based travel data. Since crowd-sourced data can be influenced by factors such as user participation density, API constraints, and temporary network anomalies, it was essential to verify that the retrieved traffic estimates reflected actual conditions on Jeddah’s road network. By conducting a comparative analysis between the API-derived values and real-time navigation estimates, this study ensures that any potential discrepancies are minimized, reinforcing the credibility of the dataset for congestion analysis.
To validate the dataset, the validation process followed a structured approach:
Route Selection: Diverse road segments, including highways, arterial roads, and dense commercial streets, were chosen to represent diverse traffic conditions.
Comparative Analysis: API-derived speed and travel time estimates were compared with real-time GPS travel estimates obtained through Google Maps navigation.
Deviation Measurement: A 5% deviation threshold was used as a benchmark for reliability, ensuring that any observed variations remained within an acceptable margin.
Final Accuracy Assessment: The overall consistency of API-derived traffic data was evaluated to confirm alignment with real-time conditions.
Validation showed discrepancies between API data and GPS estimates stayed below 5%, confirming high accuracy. This supports the use of the Google Maps API for reliable travel speed and congestion estimates in traffic analysis. Consistent results across road types further validate its role in planning and policymaking. However, despite the strong accuracy indicators, certain inherent limitations of crowd-sourced traffic data must be acknowledged:
User Participation Limitations: Low-traffic areas may yield fewer data points, causing slight inconsistencies.
No Historical Data: The API provides real-time traffic data only, requiring ongoing collection for long-term analysis.
Uncaptured Disruptions: Sudden congestion events or harsh conditions (e.g., accidents, road closures, weather changes, or extreme scenarios) may not be fully reflected in real time, which could affect reliability.
Despite minor limitations, validation confirms Google Maps API data as a reliable, scalable, and cost-effective tool for analyzing congestion and mobility in Jeddah. Its low error margin supports the use of real-time crowd-sourced data in urban transport planning.
5. Conclusions, Limitations, and Future Research Directions
5.1. Concluding Insights
This study has offered a grounded, data-informed view of Jeddah’s traffic congestion landscape, drawing on real-time, crowd-sourced data from the Google Maps API to better understand how mobility patterns shift across time and location. As Jeddah grows and urbanizes, the demand for smarter, more adaptive traffic solutions becomes increasingly urgent. Through a detailed analysis of congestion indices (CIs) across 44 representative road segments and time intervals, this research sheds light on when and where traffic bottlenecks are most severe, and what that means for daily travel in the city. This study contributes a novel, data-driven framework for understanding and managing urban congestion using real-time, crowd-sourced travel time data. By applying this approach to Jeddah, a rapidly urbanizing city with limited access to traditional traffic-monitoring infrastructure, we demonstrate how publicly available data from the Google Maps API can be used to generate high-resolution insights into congestion dynamics. Through a combination of exploratory data analysis, congestion index computation, and unsupervised clustering, we identify temporal patterns and spatial hotspots that are critical for targeted interventions. The validation of Google Maps API data against observed GPS measurements further reinforces the reliability of this low-cost data source in regions where sensor networks and traffic flow models are not readily available.
The contribution of this study also aligns with broader sustainability objectives. By enabling real-time congestion monitoring and supporting data-driven traffic management, the proposed framework can help reduce fuel consumption and vehicle emissions, thereby mitigating the environmental footprint of urban mobility. From a social perspective, improving traffic flow enhances accessibility, reduces travel-related stress, and contributes to public health by lowering exposure to air pollution. Economically, more reliable traffic conditions reduce travel time losses and improve productivity. Collectively, these impacts demonstrate how intelligent congestion management systems can serve as enablers of sustainable urban development, particularly in rapidly growing cities such as Jeddah.
This work moves beyond descriptive reporting by offering a scalable and replicable framework for real-time congestion analysis. It provides a template for data-scarce cities to adopt modern traffic intelligence tools, without the need for expensive infrastructure investments. Ultimately, this study advances the practice of urban mobility planning in the Middle East by operationalizing open data for strategic, evidence-based traffic management. In sum, this case study illustrates how cities like Jeddah can take practical steps toward smarter traffic management using tools already within reach. It reinforces the value of data-driven planning and provides a working model for other urban centers in Saudi Arabia and beyond looking to integrate technology into everyday mobility solutions.
5.2. Discussion of Limitations
While this study offers a practical framework for congestion monitoring using real-time, crowd-sourced data, some limitations must be acknowledged: The study depends on Google Maps API travel time estimates, which are based on proprietary algorithms that lack transparency regarding data sources and computation methods. This may introduce hidden biases in congestion measurements. To address this, future work should incorporate cross-validation with independent GPS or loop detector data to improve reliability and interpretability. Also, the study focused on 44 routes in Jeddah. While these were chosen for their strategic importance, they may not fully capture localized congestion phenomena in secondary roads or residential areas. Future studies should extend data collection to a wider range of road types and over longer periods to improve generalizability. External factors like weather, road construction, or special events were not considered. Integrating incident reports or weather data could improve congestion prediction and event-based traffic management.
Another limitation relates to the duration of the data collection period. Although the nine-day window was designed to capture variability across regular weekdays, weekends, and long weekends, it does not encompass longer-term or seasonal fluctuations, such as those associated with religious festivals or special events. As such, while our framework remains valid for demonstrating congestion dynamics under typical conditions, future studies extending the data collection period would provide additional insights into rare or seasonal congestion scenarios.
While validation results confirmed strong alignment between API-derived estimates and GPS trajectories under normal operating conditions, the study did not explicitly test performance in extreme scenarios (e.g., sudden incidents, weather disruptions, or unusually high event-driven demand). Future studies should incorporate such conditions to enhance the robustness of validation efforts. Also, future research should incorporate additional independent data sources (e.g., loop detectors, mobile GPS traces) to further strengthen the robustness and interpretability, as the use of the Google Maps API entails a certain level of opacity, since its underlying algorithms and data aggregation processes are proprietary and not fully transparent.
5.3. Future Research Directions
Building on the insights gained from this study, several avenues for future research emerge, paving the way for continued advancements in urban mobility and transportation management in Jeddah and beyond.
Future extensions of this framework could include case-specific applications that translate congestion-monitoring outputs into operational measures, such as adaptive signal timing adjustments, dynamic rerouting strategies, or demand management interventions. Designing such case studies would help illustrate the practical decision-support capabilities of the proposed framework in real-world traffic management scenarios.
Integration of Machine Learning for Traffic Prediction: By Analyzing historical traffic data alongside real-time variables such as road incidents, weather conditions, and special events.
Assessing the Impact of Public Transportation Initiatives: Examining how investments in bus networks, metro systems, and ride-sharing services influence traffic congestion in Jeddah could offer valuable insights into transportation strategies.
Dynamic Traffic Signal Control Systems: By optimizing signal timings based on congestion levels, these systems could significantly improve traffic flow efficiency, particularly at high-traffic intersections identified in this study.
Community Engagement and User-Centric Traffic Solutions: By incorporating user-reported data on delays, bottlenecks, and alternative routes, transportation authorities could develop more responsive, citizen-centric traffic management policies.
Future research could build on this framework by incorporating external and contextual factors that influence urban mobility. These include weather conditions, roadworks, and accidents, as well as behavioral and socioeconomic variables such as demographics, public transport usage, and policy interventions.

