Integrating CMIP6 and Remote Sensing Datasets for Current and Future Flood Susceptibility Projections Using Machine Learning Under Climate Change Scenarios in Demak District for Future Sustainable Planning
Abstract
1. Introduction
2. Materials and Methods
2.1. Study Area
2.2. Datasets
2.2.1. Flood Inventory Map
2.2.2. Flood Conditioning Factors
2.2.3. CMIP6 Global Climate Models (GCMs)
2.2.4. Gauge Station
2.3. Methods
2.3.1. Multicollinearity Analysis
2.3.2. Machine Learning Models
MLP-NN
Random Forest
Support Vector Machine (SVM)
XGboost
2.3.3. Evaluation Metric
2.3.4. Symmetrical Uncertainty
2.3.5. Rating Metric
2.3.6. Multi-Model Ensemble
2.3.7. Multi-Model Ensemble Evaluation
3. Results
3.1. Multicollinearity Analysis
3.2. Feature Importance
3.3. Model Validation
3.4. Flood Susceptibility Map
3.5. Feature Contribution
3.6. Future Flood Projection
3.6.1. Multi-Model Ensemble
3.6.2. Future Flood Projection in Different Scenarios
4. Discussion
5. Conclusions
Author Contributions
Funding
Institutional Review Board Statement
Informed Consent Statement
Data Availability Statement
Conflicts of Interest
References
- Shen, G.; Hwang, S.N. Spatial–Temporal Snapshots of Global Natural Disaster Impacts Revealed from EM-DAT for 1900–2015. Geomat. Nat. Hazards Risk 2019, 10, 912–934. [Google Scholar] [CrossRef]
- Bui, D.T.; Tsangaratos, P.; Ngo, P.T.T.; Pham, T.D.; Pham, B.T. Flash Flood Susceptibility Modeling Using an Optimized Fuzzy Rule Based Feature Selection Technique and Tree Based Ensemble Methods. Sci. Total Environ. 2019, 668, 1038–1054. [Google Scholar] [CrossRef] [PubMed]
- Chowdhuri, I.; Pal, S.C.; Chakrabortty, R. Flood Susceptibility Mapping by Ensemble Evidential Belief Function and Binomial Logistic Regression Model on River Basin of Eastern India. Adv. Space Res. 2020, 65, 1466–1489. [Google Scholar] [CrossRef]
- Gai, L.; Nunes, J.P.; Baartman, J.E.M.; Zhang, H.; Wang, F.; de Roo, A.; Ritsema, C.J.; Geissen, V. Assessing the Impact of Human Interventions on Floods and Low Flows in the Wei River Basin in China Using the LISFLOOD Model. Sci. Total Environ. 2019, 653, 1077–1094. [Google Scholar] [CrossRef]
- Gholami, F.; Sedighifar, Z.; Ghaforpur, P.; Li, Y.; Zhang, J. Spatial–Temporal Analysis of Various Land Use Classifications and Their Long-Term Alteration’s Impact on Hydrological Components: Using Remote Sensing, SAGA-GIS, and ARCSWAT Model. Environ. Sci. Water Res. Technol. 2023, 9, 1161–1181. [Google Scholar] [CrossRef]
- Roy, P.; Chandra Pal, S.; Chakrabortty, R.; Chowdhuri, I.; Malik, S.; Das, B. Threats of Climate and Land Use Change on Future Flood Susceptibility. J. Clean. Prod. 2020, 272, 122757. [Google Scholar] [CrossRef]
- Filonchyk, M.; Peterson, M.P.; Zhang, L.; Hurynovich, V.; He, Y. Greenhouse Gases Emissions and Global Climate Change: Examining the Influence of CO2, CH4, and N2O. Sci. Total Environ. 2024, 935, 173359. [Google Scholar] [CrossRef]
- Prăvălie, R.; Bandoc, G.; Patriche, C.; Sternberg, T. Recent Changes in Global Drylands: Evidences from Two Major Aridity Databases. Catena 2019, 178, 209–231. [Google Scholar] [CrossRef]
- Kim, J.C.; Lee, S.; Jung, H.S.; Lee, S. Landslide Susceptibility Mapping Using Random Forest and Boosted Tree Models in Pyeong-Chang, Korea. Geocarto Int. 2018, 33, 1000–1015. [Google Scholar] [CrossRef]
- Coronese, M.; Lamperti, F.; Keller, K.; Chiaromonte, F.; Roventini, A. Evidence for Sharp Increase in the Economic Damages of Extreme Natural Disasters. Proc. Natl. Acad. Sci. USA 2019, 116, 21450–21455. [Google Scholar] [CrossRef]
- Rajkhowa, S.; Sarma, J. Climate Change and Flood Risk, Global Climate Change. Glob. Clim. Change 2021, 321–339. [Google Scholar] [CrossRef]
- Janizadeh, S.; Kim, D.; Jun, C.; Bateni, S.M.; Pandey, M.; Mishra, V.N. Impact of Climate Change on Future Flood Susceptibility Projections under Shared Socioeconomic Pathway Scenarios in South Asia Using Artificial Intelligence Algorithms. J. Environ. Manag. 2024, 366, 121764. [Google Scholar] [CrossRef]
- Mahdian, M.; Hosseinzadeh, M.; Siadatmousavi, S.M.; Chalipa, Z.; Delavar, M.; Guo, M.; Abolfathi, S.; Noori, R. Modelling Impacts of Climate Change and Anthropogenic Activities on Inflows and Sediment Loads of Wetlands: Case Study of the Anzali Wetland. Sci. Rep. 2023, 13, 5399. [Google Scholar] [CrossRef]
- Kurniadi, A.; Weller, E.; Kim, Y.H.; Min, S.K. Evaluation of Coupled Model Intercomparison Project Phase 6 Model-Simulated Extreme Precipitation over Indonesia. Int. J. Climatol. 2023, 43, 174–196. [Google Scholar] [CrossRef]
- Ge, F.; Zhu, S.; Luo, H.; Zhi, X.; Wang, H. Future Changes in Precipitation Extremes over Southeast Asia: Insights from CMIP6 Multi-Model Ensemble. Environ. Res. Lett. 2021, 16, 024013. [Google Scholar] [CrossRef]
- Eyring, V.; Bony, S.; Meehl, G.A.; Senior, C.A.; Stevens, B.; Stouffer, R.J.; Taylor, K.E. Overview of the Coupled Model Intercomparison Project Phase 6 (CMIP6) Experimental Design and Organization. Geosci. Model. Dev. 2016, 9, 1937–1958. [Google Scholar] [CrossRef]
- O’Neill, B.C.; Tebaldi, C.; Van Vuuren, D.P.; Eyring, V.; Friedlingstein, P.; Hurtt, G.; Knutti, R.; Kriegler, E.; Lamarque, J.F.; Lowe, J.; et al. The Scenario Model Intercomparison Project (ScenarioMIP) for CMIP6. Geosci. Model. Dev. 2016, 9, 3461–3482. [Google Scholar] [CrossRef]
- Aryal, A.; Acharya, A.; Kalra, A. Assessing the Implication of Climate Change to Forecast Future Flood Using CMIP6 Climate Projections and HEC-RAS Modeling. Forecasting 2022, 4, 582–603. [Google Scholar] [CrossRef]
- Sun, J.; Yan, H.; Bao, Z.; Wang, G. Investigating Impacts of Climate Change on Runoff from the Qinhuai River by Using the SWAT Model and CMIP6 Scenarios. Water 2022, 14, 1778. [Google Scholar] [CrossRef]
- Mia, M.U.; Chowdhury, T.N.; Chakrabortty, R.; Pal, S.C.; Al-Sadoon, M.K.; Costache, R.; Islam, A.R.M.T. Flood Susceptibility Modeling Using an Advanced Deep Learning-Based Iterative Classifier Optimizer. Land 2023, 12, 810. [Google Scholar] [CrossRef]
- Liu, J.; Wang, J.; Xiong, J.; Cheng, W.; Li, Y.; Cao, Y.; He, Y.; Duan, Y.; He, W.; Yang, G. Assessment of Flood Susceptibility Mapping Using Support Vector Machine, Logistic Regression and Their Ensemble Techniques in the Belt and Road Region. Geocarto Int. 2022, 37, 9817–9846. [Google Scholar] [CrossRef]
- Shahabi, H.; Shirzadi, A.; Ghaderi, K.; Omidvar, E.; Al-Ansari, N.; Clague, J.J.; Geertsema, M.; Khosravi, K.; Amini, A.; Bahrami, S.; et al. Flood Detection and Susceptibility Mapping Using Sentinel-1 Remote Sensing Data and a Machine Learning Approach: Hybrid Intelligence of Bagging Ensemble Based on K-Nearest Neighbor Classifier. Remote Sens. 2020, 12, 266. [Google Scholar] [CrossRef]
- de Brito, M.M.; Almoradie, A.; Evers, M. Spatially-Explicit Sensitivity and Uncertainty Analysis in a MCDA-Based Flood Vulnerability Model. Int. J. Geogr. Inf. Sci. 2019, 33, 1788–1806. [Google Scholar] [CrossRef]
- Ranjgar, B.; Razavi-Termeh, S.V.; Foroughnia, F.; Sadeghi-Niaraki, A.; Perissin, D. Land Subsidence Susceptibility Mapping Using Persistent Scatterer SAR Interferometry Technique and Optimized Hybrid Machine Learning Algorithms. Remote Sens. 2021, 13, 1326. [Google Scholar] [CrossRef]
- Dodangeh, E.; Singh, V.P.; Pham, B.T.; Yin, J.; Yang, G.; Mosavi, A. Flood Frequency Analysis of Interconnected Rivers by Copulas. Water Resour. Manag. 2020, 34, 3533–3549. [Google Scholar] [CrossRef]
- Mishra, A.; Mukherjee, S.; Merz, B.; Singh, V.P.; Wright, D.B.; Villarini, G.; Paul, S.; Kumar, D.N.; Khedun, C.P.; Niyogi, D.; et al. An Overview of Flood Concepts, Challenges, and Future Directions. J. Hydrol. Eng. 2022, 27, 03122001. [Google Scholar] [CrossRef]
- Samanta, S.; Pal, D.K.; Palsamanta, B. Flood Susceptibility Analysis through Remote Sensing, GIS and Frequency Ratio Model. Appl. Water Sci. 2018, 8, 66. [Google Scholar] [CrossRef]
- Tehrany, M.S.; Pradhan, B.; Jebur, M.N. Flood Susceptibility Mapping Using a Novel Ensemble Weights-of-Evidence and Support Vector Machine Models in GIS. J. Hydrol. 2014, 512, 332–343. [Google Scholar] [CrossRef]
- Mehravar, S.; Razavi-Termeh, S.V.; Moghimi, A.; Ranjgar, B.; Foroughnia, F.; Amani, M. Flood Susceptibility Mapping Using Multi-Temporal SAR Imagery and Novel Integration of Nature-Inspired Algorithms into Support Vector Regression. J. Hydrol. 2023, 617, 129100. [Google Scholar] [CrossRef]
- Ngo, P.T.T.; Pham, T.D.; Nhu, V.H.; Le, T.T.; Tran, D.A.; Phan, D.C.; Hoa, P.V.; Amaro-Mellado, J.L.; Bui, D.T. A Novel Hybrid Quantum-PSO and Credal Decision Tree Ensemble for Tropical Cyclone Induced Flash Flood Susceptibility Mapping with Geospatial Data. J. Hydrol. 2021, 596, 125682. [Google Scholar] [CrossRef]
- Beck, H.E.; Zimmermann, N.E.; McVicar, T.R.; Vergopolan, N.; Berg, A.; Wood, E.F. Present and Future Köppen-Geiger Climate Classification Maps at 1-Km Resolution. Sci. Data 2018, 5, 180214. [Google Scholar] [CrossRef]
- Benzougagh, B.; Frison, P.L.; Meshram, S.G.; Boudad, L.; Dridri, A.; Sadkaoui, D.; Mimich, K.; Khedher, K.M. Flood Mapping Using Multi-Temporal Sentinel-1 SAR Images: A Case Study—Inaouene Watershed from Northeast of Morocco. Iran. J. Sci. Technol. Trans. Civ. Eng. 2022, 46, 1481–1490. [Google Scholar] [CrossRef]
- Moharrami, M.; Javanbakht, M.; Attarchi, S. Automatic Flood Detection Using Sentinel-1 Images on the Google Earth Engine. Environ. Monit. Assess. 2021, 193, 248. [Google Scholar] [CrossRef] [PubMed]
- Pelich, R.-M.; Schumann, G.; Giustarini, L.; Tran, K.H.; Menenti, M.; Jia, L. Surface Water Mapping and Flood Monitoring in the Mekong Delta Using Sentinel-1 SAR Time Series and Otsu Threshold. Remote Sens. 2022, 14, 5721. [Google Scholar] [CrossRef]
- Tiwari, V.; Kumar, V.; Matin, M.A.; Thapa, A.; Ellenburg, W.L.; Gupta, N.; Thapa, S. Flood Inundation Mapping-Kerala 2018; Harnessing the Power of SAR, Automatic Threshold Detection Method and Google Earth Engine. PLoS ONE 2020, 15, e0237324. [Google Scholar] [CrossRef]
- Ahmad, A.; Chen, J.; Chen, X.; Khadka, N.; Khan, M.U.; Wang, C.; Tayyab, M. Flood Risk Modelling by the Synergistic Approach of Machine Learning and Best-Worst Method in Indus Kohistan, Western Himalaya. Geomat. Nat. Hazards Risk 2025, 16, 2469766. [Google Scholar] [CrossRef]
- Kia, M.B.; Pirasteh, S.; Pradhan, B.; Mahmud, A.R.; Sulaiman, W.N.A.; Moradi, A. An Artificial Neural Network Model for Flood Simulation Using GIS: Johor River Basin, Malaysia. Environ. Earth Sci. 2012, 67, 251–264. [Google Scholar] [CrossRef]
- Karpouza, M.; Bathrellos, G.D.; Kaviris, G.; Antonarakou, A.; Skilodimou, H.D. How Could Students Be Safe during Flood and Tsunami Events? Int. J. Disaster Risk Reduct. 2023, 95, 103830. [Google Scholar] [CrossRef]
- Khosravi, K.; Pourghasemi, H.R.; Chapi, K.; Bahri, M. Flash Flood Susceptibility Analysis and Its Mapping Using Different Bivariate Models in Iran: A Comparison between Shannon’s Entropy, Statistical Index, and Weighting Factor Models. Environ. Monit. Assess. 2016, 188, 656. [Google Scholar] [CrossRef]
- Pham, B.T.; Luu, C.; Van Phong, T.; Nguyen, H.D.; Van Le, H.; Tran, T.Q.; Ta, H.T.; Prakash, I. Flood Risk Assessment Using Hybrid Artificial Intelligence Models Integrated with Multi-Criteria Decision Analysis in Quang Nam Province, Vietnam. J. Hydrol. 2021, 592, 125815. [Google Scholar] [CrossRef]
- Choubin, B.; Moradi, E.; Golshan, M.; Adamowski, J.; Sajedi-Hosseini, F.; Mosavi, A. An Ensemble Prediction of Flood Susceptibility Using Multivariate Discriminant Analysis, Classification and Regression Trees, and Support Vector Machines. Sci. Total Environ. 2019, 651, 2087–2096. [Google Scholar] [CrossRef]
- Kazakis, N.; Kougias, I.; Patsialis, T. Assessment of Flood Hazard Areas at a Regional Scale Using an Index-Based Approach and Analytical Hierarchy Process: Application in Rhodope-Evros Region, Greece. Sci. Total Environ. 2015, 538, 555–563. [Google Scholar] [CrossRef]
- Chen, Y.; Liu, R.; Barrett, D.; Gao, L.; Zhou, M.; Renzullo, L.; Emelyanova, I. A Spatial Assessment Framework for Evaluating Flood Risk under Extreme Climates. Sci. Total Environ. 2015, 538, 512–523. [Google Scholar] [CrossRef] [PubMed]
- Rahmati, O.; Hamid Reza, P.; Zeinivand, H. Flood Susceptibility Mapping Using Frequency Ratio and Weights-of-Evidence Models in the Golastan Province, Iran. Geocarto Int. 2016, 31, 42–70. [Google Scholar] [CrossRef]
- Regmi, A.D.; Devkota, K.C.; Yoshida, K.; Pradhan, B.; Pourghasemi, H.R.; Kumamoto, T.; Akgun, A. Application of Frequency Ratio, Statistical Index, and Weights-of-Evidence Models and Their Comparison in Landslide Susceptibility Mapping in Central Nepal Himalaya. Arab. J. Geosci. 2014, 7, 725–742. [Google Scholar] [CrossRef]
- Mohammadi, A.; Kamran, K.V.; Karimzadeh, S.; Shahabi, H.; Al-Ansari, N. Flood Detection and Susceptibility Mapping Using Sentinel-1 Time Series, Alternating Decision Trees, and Bag-ADTree Models. Complexity 2020, 2020, 4271376. [Google Scholar] [CrossRef]
- Fiorentino, C.; Donvito, A.R.; D’Antonio, P.; Lopinto, S. Experimental Methodology for Prescription Maps of Variable Rate Nitrogenous Fertilizers on Cereal Crops. In Innovative Biosystems Engineering for Sustainable Agriculture, Forestry and Food Production; Springer: Cham, Switzerland, 2020; Volume 67, pp. 863–872. [Google Scholar] [CrossRef]
- Aalto, R.; Maurice-Bourgoin, L.; Dunne, T.; Montgomery, D.R.; Nittrouer, C.A.; Guyot, J.L. Episodic Sediment Accumulation on Amazonian Flood Plains Influenced by El Niño/Southern Oscillation. Nature 2003, 425, 493–497. [Google Scholar] [CrossRef]
- Khosravi, K.; Shahabi, H.; Pham, B.T.; Adamowski, J.; Shirzadi, A.; Pradhan, B.; Dou, J.; Ly, H.B.; Gróf, G.; Ho, H.L.; et al. A Comparative Assessment of Flood Susceptibility Modeling Using Multi-Criteria Decision-Making Analysis and Machine Learning Methods. J. Hydrol. 2019, 573, 311–323. [Google Scholar] [CrossRef]
- Yalcin, A.; Reis, S.; Aydinoglu, A.C.; Yomralioglu, T. A GIS-Based Comparative Study of Frequency Ratio, Analytical Hierarchy Process, Bivariate Statistics and Logistics Regression Methods for Landslide Susceptibility Mapping in Trabzon, NE Turkey. Catena 2011, 85, 274–287. [Google Scholar] [CrossRef]
- Soltani, K.; Ebtehaj, I.; Amiri, A.; Azari, A.; Gharabaghi, B.; Bonakdari, H. Mapping the Spatial and Temporal Variability of Flood Susceptibility Using Remotely Sensed Normalized Difference Vegetation Index and the Forecasted Changes in the Future. Sci. Total Environ. 2021, 770, 145288. [Google Scholar] [CrossRef]
- Shrestha, S.; Dahal, D.; Poudel, B.; Banjara, M.; Kalra, A. Flood Susceptibility Analysis with Integrated Geographic Information System and Analytical Hierarchy Process: A Multi-Criteria Framework for Risk Assessment and Mitigation. Water 2025, 17, 937. [Google Scholar] [CrossRef]
- Hong, H.; Panahi, M.; Shirzadi, A.; Ma, T.; Liu, J.; Zhu, A.X.; Chen, W.; Kougias, I.; Kazakis, N. Flood Susceptibility Assessment in Hengfeng Area Coupling Adaptive Neuro-Fuzzy Inference System with Genetic Algorithm and Differential Evolution. Sci. Total Environ. 2018, 621, 1124–1141. [Google Scholar] [CrossRef]
- Fang, Z.; Wang, Y.; Peng, L.; Hong, H. Predicting Flood Susceptibility Using LSTM Neural Networks. J. Hydrol. 2021, 594, 125734. [Google Scholar] [CrossRef]
- Tariq, A.; Yan, J.; Ghaffar, B.; Qin, S.; Mousa, B.G.; Sharifi, A.; Huq, M.E.; Aslam, M. Flash Flood Susceptibility Assessment and Zonation by Integrating Analytic Hierarchy Process and Frequency Ratio Model with Diverse Spatial Data. Water 2022, 14, 3069. [Google Scholar] [CrossRef]
- Vibhute, A.D.; Dhumal, R.; Nagne, A.; Surase, R.; Varpe, A.; Gaikwad, S.; Kale, K.V.; Mehrotra, S.C. Evaluation of Soil Conditions Using Spectral Indices from Hyperspectral Datasets. In Proceedings of the 2017 2nd International Conference on Man and Machine Interfacing, Bhubaneswar, India, 21–23 December 2017. [Google Scholar] [CrossRef]
- Nobre, A.D.; Cuartas, L.A.; Hodnett, M.; Rennó, C.D.; Rodrigues, G.; Silveira, A.; Waterloo, M.; Saleska, S. Height Above the Nearest Drainage—A Hydrologically Relevant New Terrain Model. J. Hydrol. 2011, 404, 13–29. [Google Scholar] [CrossRef]
- Aristizabal, F.; Salas, F.; Petrochenkov, G.; Grout, T.; Avant, B.; Bates, B.; Spies, R.; Chadwick, N.; Wills, Z.; Judge, J. Extending Height Above Nearest Drainage to Model Multiple Fluvial Sources in Flood Inundation Mapping Applications for the U.S. National Water Model. Water Resour. Res. 2023, 59, e2022WR032039. [Google Scholar] [CrossRef]
- Arora, A.; Arabameri, A.; Pandey, M.; Siddiqui, M.A.; Shukla, U.K.; Bui, D.T.; Mishra, V.N.; Bhardwaj, A. Optimization of State-of-the-Art Fuzzy-Metaheuristic ANFIS-Based Machine Learning Models for Flood Susceptibility Prediction Mapping in the Middle Ganga Plain, India. Sci. Total Environ. 2021, 750, 141565. [Google Scholar] [CrossRef]
- Khodaei, H.; Nasiri Saleh, F.; Nobakht Dalir, A.; Zarei, E. Future Flood Susceptibility Mapping under Climate and Land Use Change. Sci. Rep. 2025, 15, 12394. [Google Scholar] [CrossRef] [PubMed]
- Asghar Rostami, A.; Taghi Sattari, M.; Apaydin, H.; Milewski, A. Modeling Flood Susceptibility Utilizing Advanced Ensemble Machine Learning Techniques in the Marand Plain. Geosciences 2025, 15, 110. [Google Scholar] [CrossRef]
- Darabi, H.; Rahmati, O.; Naghibi, S.A.; Mohammadi, F.; Ahmadisharaf, E.; Kalantari, Z.; Torabi Haghighi, A.; Soleimanpour, S.M.; Tiefenbacher, J.P.; Tien Bui, D. Development of a Novel Hybrid Multi-Boosting Neural Network Model for Spatial Prediction of Urban Flood. Geocarto Int. 2022, 37, 5716–5741. [Google Scholar] [CrossRef]
- Isabona, J.; Imoize, A.L.; Ojo, S.; Karunwi, O.; Kim, Y.; Lee, C.C.; Li, C.T. Development of a Multilayer Perceptron Neural Network for Optimal Predictive Modeling in Urban Microcellular Radio Environments. Appl. Sci. 2022, 12, 5713. [Google Scholar] [CrossRef]
- Chen, W.; Li, Y.; Xue, W.; Shahabi, H.; Li, S.; Hong, H.; Wang, X.; Bian, H.; Zhang, S.; Pradhan, B.; et al. Modeling Flood Susceptibility Using Data-Driven Approaches of Naïve Bayes Tree, Alternating Decision Tree, and Random Forest Methods. Sci. Total Environ. 2020, 701, 134979. [Google Scholar] [CrossRef]
- Tsagkrasoulis, D.; Montana, G. Random Forest Regression for Manifold-Valued Responses. Pattern Recognit. Lett. 2018, 101, 6–13. [Google Scholar] [CrossRef]
- Al-Aizari, A.R.; Alzahrani, H.; Althuwaynee, O.F.; Al-Masnay, Y.A.; Ullah, K.; Park, H.-J.; Al-Areeq, N.M.; Rahman, M.; Hazaea, B.Y.; Liu, X. Uncertainty Reduction in Flood Susceptibility Mapping Using Random Forest and EXtreme Gradient Boosting Algorithms in Two Tropical Desert Cities, Shibam and Marib. Remote Sens. 2024, 16, 336. [Google Scholar] [CrossRef]
- Ren, F.; Wu, X.; Zhang, K.; Niu, R. Application of Wavelet Analysis and a Particle Swarm-Optimized Support Vector Machine to Predict the Displacement of the Shuping Landslide in the Three Gorges. Environ. Earth Sci. 2015, 73, 4791–4804. [Google Scholar] [CrossRef]
- Parisouj, P.; Mohebzadeh, H.; Lee, T. Employing Machine Learning Algorithms for Streamflow Prediction: A Case Study of Four River Basins with Different Climatic Zones in the United States. Water Resour. Manag. 2020, 34, 4113–4131. [Google Scholar] [CrossRef]
- Akinci, H.; Ozalp, A.Y. Investigating the Effects of Different Data Classification Methods on Landslide Susceptibility Mapping. Adv. Space Res. 2024, 75, 3427–3450. [Google Scholar] [CrossRef]
- Ren, H.; Pang, B.; Bai, P.; Zhao, G.; Liu, S.; Liu, Y.; Li, M. Flood Susceptibility Assessment with Random Sampling Strategy in Ensemble Learning (RF and XGBoost). Remote Sens. 2024, 16, 320. [Google Scholar] [CrossRef]
- Mosavi, A.; Golshan, M.; Janizadeh, S.; Choubin, B.; Melesse, A.M.; Dineva, A.A. Ensemble Models of GLM, FDA, MARS, and RF for Flood and Erosion Susceptibility Mapping: A Priority Assessment of Sub-Basins. Geocarto Int. 2022, 37, 2541–2560. [Google Scholar] [CrossRef]
- Dikshit, A.; Sarkar, R.; Pradhan, B.; Jena, R.; Drukpa, D.; Alamri, A.M. Temporal Probability Assessment and Its Use in Landslide Susceptibility Mapping for Eastern Bhutan. Water 2020, 12, 267. [Google Scholar] [CrossRef]
- Nashwan, M.S.; Shahid, S. Symmetrical Uncertainty and Random Forest for the Evaluation of Gridded Precipitation and Temperature Data. Atmos. Res. 2019, 230, 104632. [Google Scholar] [CrossRef]
- Singh, B.; Kushwaha, N.; Vyas, O.P.; Singh, B.; Kushwaha, N.; Vyas, O.P. A Feature Subset Selection Technique for High Dimensional Data Using Symmetric Uncertainty. J. Data Anal. Inf. Process. 2014, 2, 95–105. [Google Scholar] [CrossRef]
- Hassan, I.; Kalin, R.M.; White, C.J.; Aladejana, J.A. Selection of CMIP5 GCM Ensemble for the Projection of Spatio-Temporal Changes in Precipitation and Temperature over the Niger Delta, Nigeria. Water 2020, 12, 385. [Google Scholar] [CrossRef]
- Chen, W.; Jiang, Z.; Li, L. Probabilistic Projections of Climate Change over China under the SRES A1B Scenario Using 28 AOGCMs. J. Clim. 2011, 24, 4741–4756. [Google Scholar] [CrossRef]
- Dey, A.; Sahoo, D.P.; Kumar, R.; Remesan, R. A Multimodel Ensemble Machine Learning Approach for CMIP6 Climate Model Projections in an Indian River Basin. Int. J. Climatol. 2022, 42, 9215–9236. [Google Scholar] [CrossRef]
- Jose, D.M.; Vincent, A.M.; Dwarakish, G.S. Improving Multiple Model Ensemble Predictions of Daily Precipitation and Temperature through Machine Learning Techniques. Sci. Rep. 2022, 12, 4678. [Google Scholar] [CrossRef] [PubMed]
- Bordoni, S.; Kang, S.M.; Shaw, T.A.; Simpson, I.R.; Zanna, L. The Futures of Climate Modeling. NPJ Clim. Atmos. Sci. 2025, 8, 1–6. [Google Scholar] [CrossRef]
- Parsons, L.A.; Amrhein, D.E.; Sanchez, S.C.; Tardif, R.; Brennan, M.K.; Hakim, G.J. Do Multi-Model Ensembles Improve Reconstruction Skill in Paleoclimate Data Assimilation? Earth Space Sci. 2021, 8, e2020EA001467. [Google Scholar] [CrossRef]
- Panda, K.C.; Singh, R.M.; Thakural, L.N.; Sahoo, D.P. Representative Grid Location-Multivariate Adaptive Regression Spline (RGL-MARS) Algorithm for Downscaling Dry and Wet Season Rainfall. J. Hydrol. 2022, 605, 127381. [Google Scholar] [CrossRef]
- Salman, S.A.; Shahid, S.; Ismail, T.; Ahmed, K.; Wang, X.-J. Selection of Climate Models for Projection of Spatiotemporal Changes in Temperature of Iraq with Uncertainties. Atmos. Res. 2018, 213, 509–522. [Google Scholar] [CrossRef]
- Rondinone, M.; Fortunato, S.; Sasso, D.; Htay Aung, H.; Contillo, L.; Dimola, G.; Schiattarella, M.; Fiorentino, M.; Telesca, V. Assessing Flood and Landslide Susceptibility Using XGBoost: Case Study of the Basento River in Southern Italy. Appl. Sci. 2025, 15, 5290. [Google Scholar] [CrossRef]
- Pradhan, B.; Lee, S.; Dikshit, A.; Kim, H. Spatial Flood Susceptibility Mapping Using an Explainable Artificial Intelligence (XAI) Model. Geosci. Front. 2023, 14, 101625. [Google Scholar] [CrossRef]
- Waleed, M.; Sajjad, M. High-Resolution Flood Susceptibility Mapping and Exposure Assessment in Pakistan: An Integrated Artificial Intelligence, Machine Learning and Geospatial Framework. Int. J. Disaster Risk Reduct. 2025, 121, 105442. [Google Scholar] [CrossRef]
- Zhu, K.; Wang, Z.; Lai, C.; Li, S.; Zeng, Z.; Chen, X. Evaluating Factors Affecting Flood Susceptibility in the Yangtze River Delta Using Machine Learning Methods. Int. J. Disaster Risk Sci. 2024, 15, 738–753. [Google Scholar] [CrossRef]
- Mao, Y.; Van Niel, T.G.; McVicar, T.R. Reconstructing Cloud-Contaminated NDVI Images with SAR-Optical Fusion Using Spatio-Temporal Partitioning and Multiple Linear Regression. ISPRS J. Photogramm. Remote Sens. 2023, 198, 115–139. [Google Scholar] [CrossRef]
- Bilbao-Barrenetxea, N.; Martínez-España, R.; Jimeno-Sáez, P.; Faria, S.H.; Senent-Aparicio, J. Multi-Model Ensemble Machine Learning Approaches to Project Climatic Scenarios in a River Basin in the Pyrenees. Earth Syst. Environ. 2024, 8, 1159–1177. [Google Scholar] [CrossRef]
- Ahmed, K.; Sachindra, D.A.; Shahid, S.; Iqbal, Z.; Nawaz, N.; Khan, N. Multi-Model Ensemble Predictions of Precipitation and Temperature Using Machine Learning Algorithms. Atmos. Res. 2020, 236, 104806. [Google Scholar] [CrossRef]
- Tahir, Z.; Haseeb, M.; Mahmood, S.A.; Batool, S.; Abdullah-Al-Wadud, M.; Ullah, S.; Tariq, A. Predicting Land Use and Land Cover Changes for Sustainable Land Management Using CA-Markov Modelling and GIS Techniques. Sci. Rep. 2025, 15, 3271. [Google Scholar] [CrossRef]
- Lukas, P.; Melesse, A.M.; Kenea, T.T. Prediction of Future Land Use/Land Cover Changes Using a Coupled CA-ANN Model in the Upper Omo–Gibe River Basin, Ethiopia. Remote Sens. 2023, 15, 1148. [Google Scholar] [CrossRef]
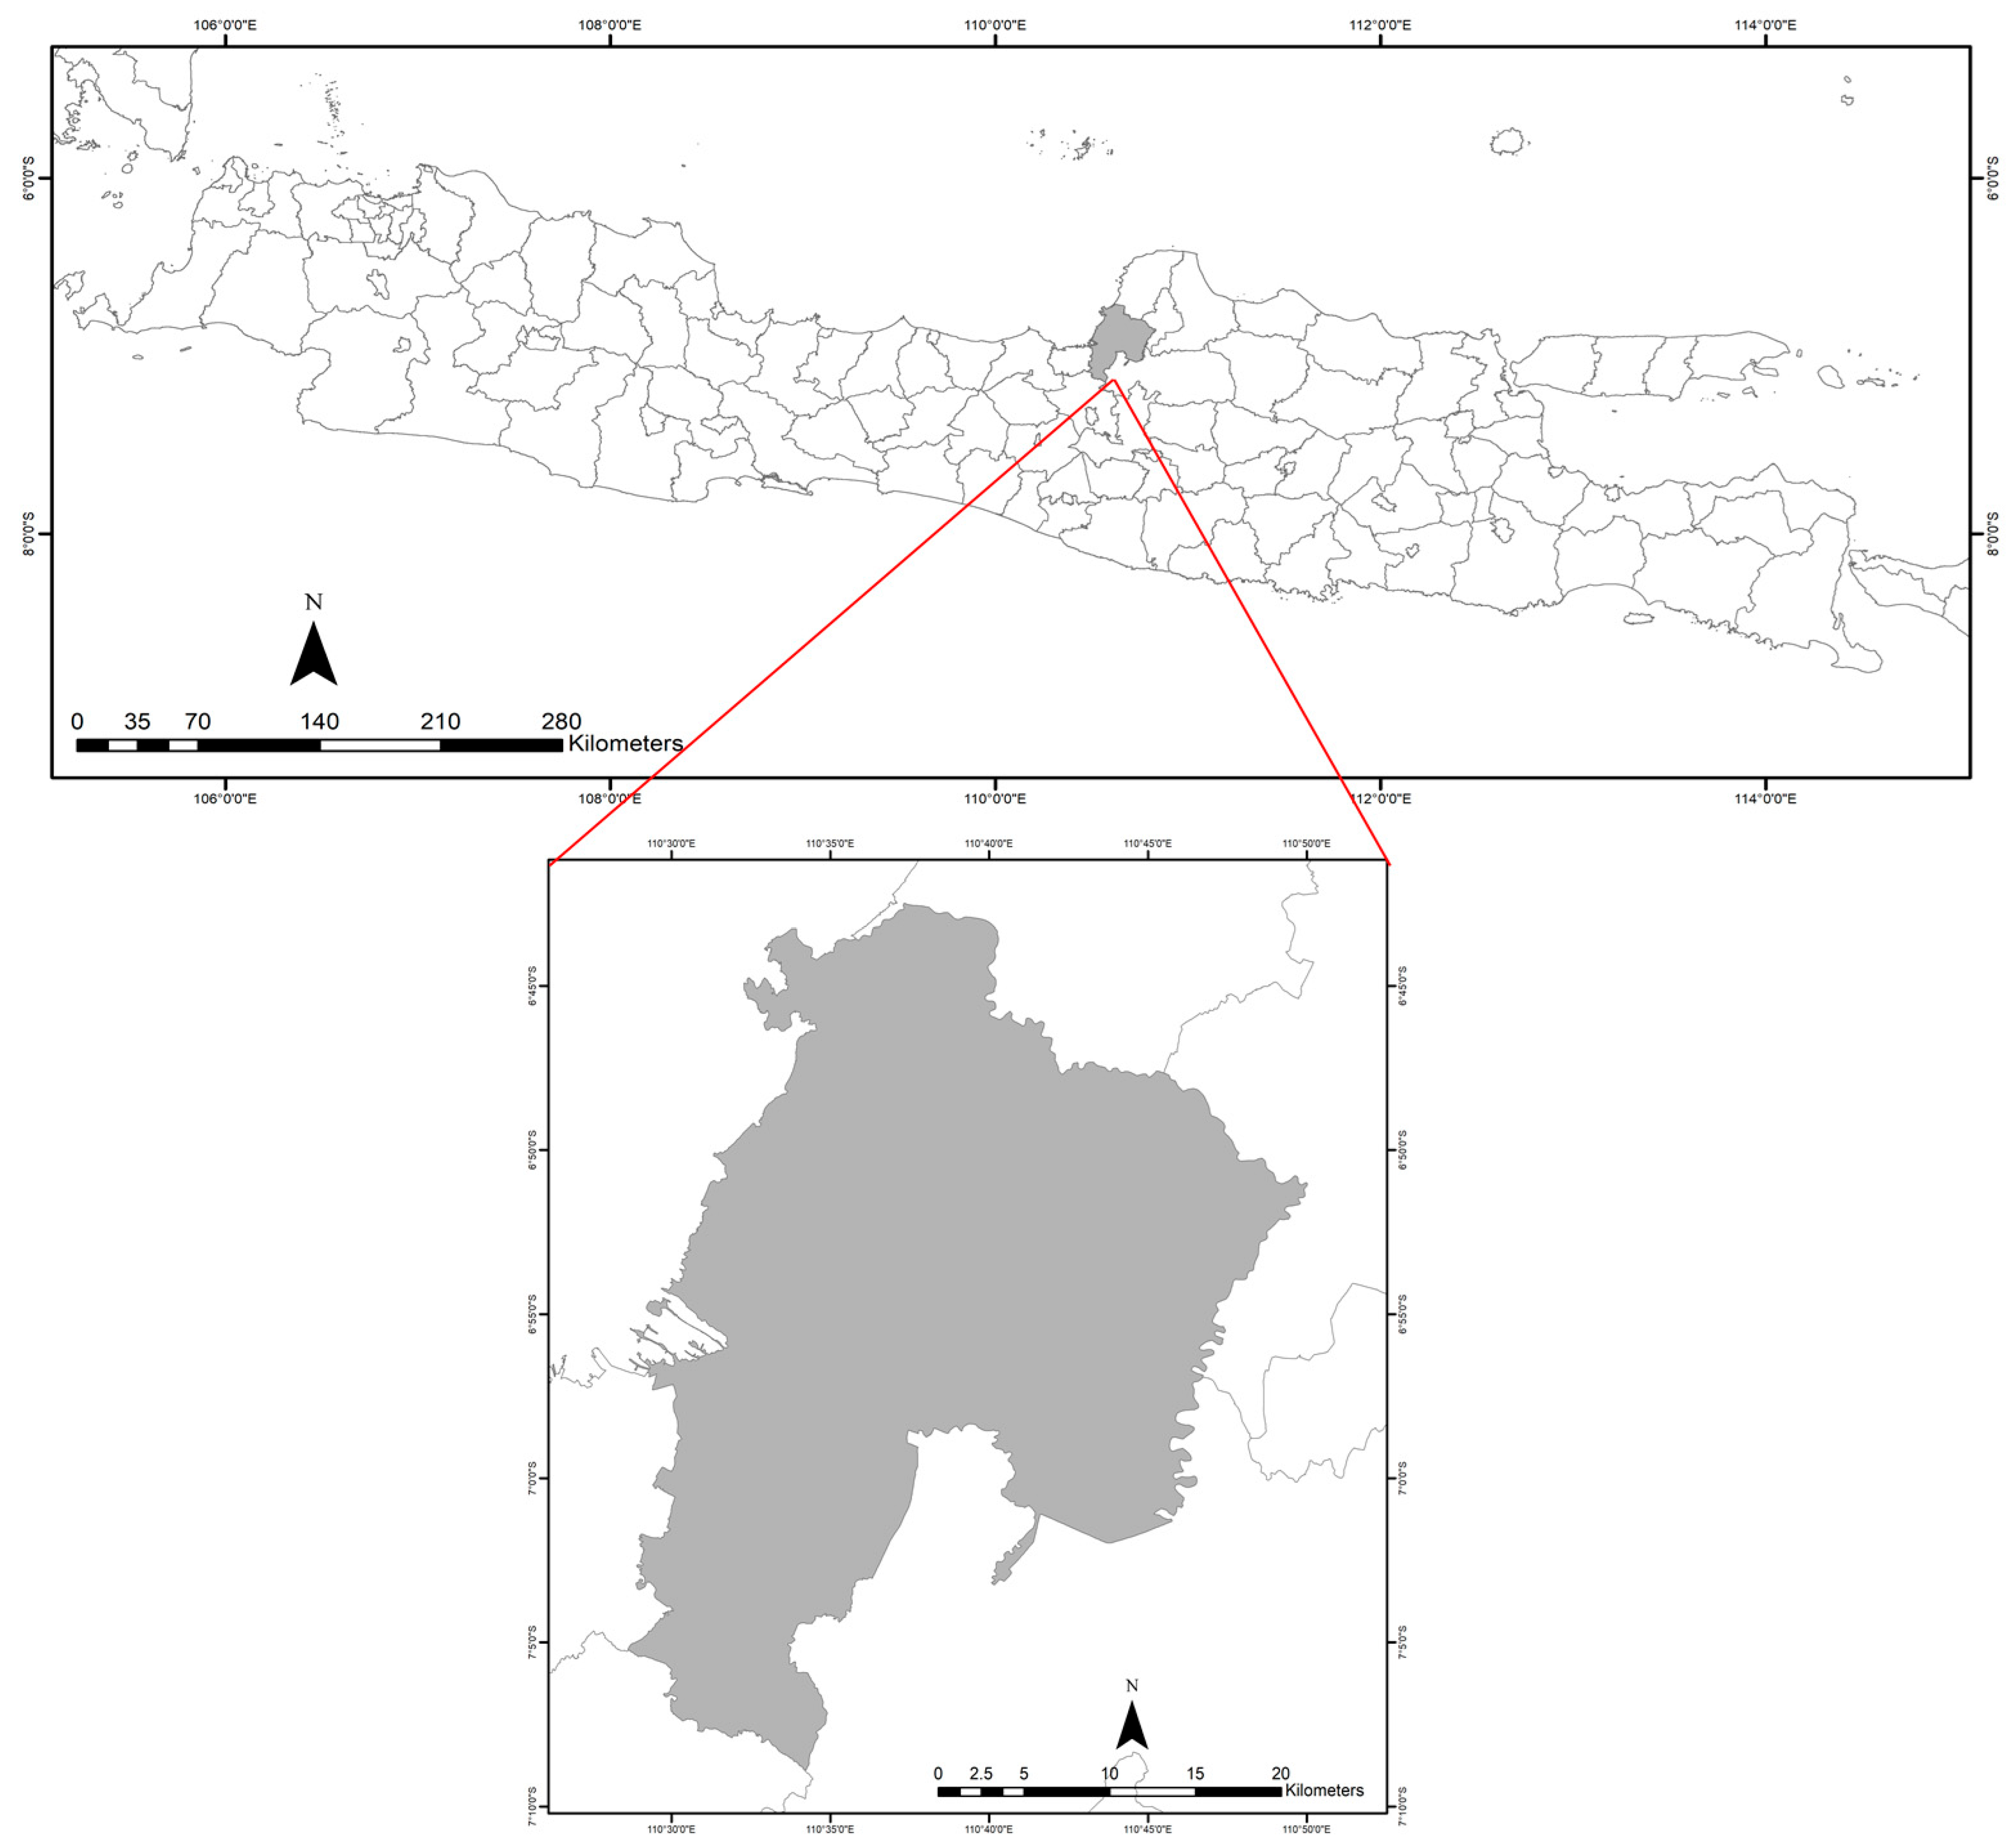
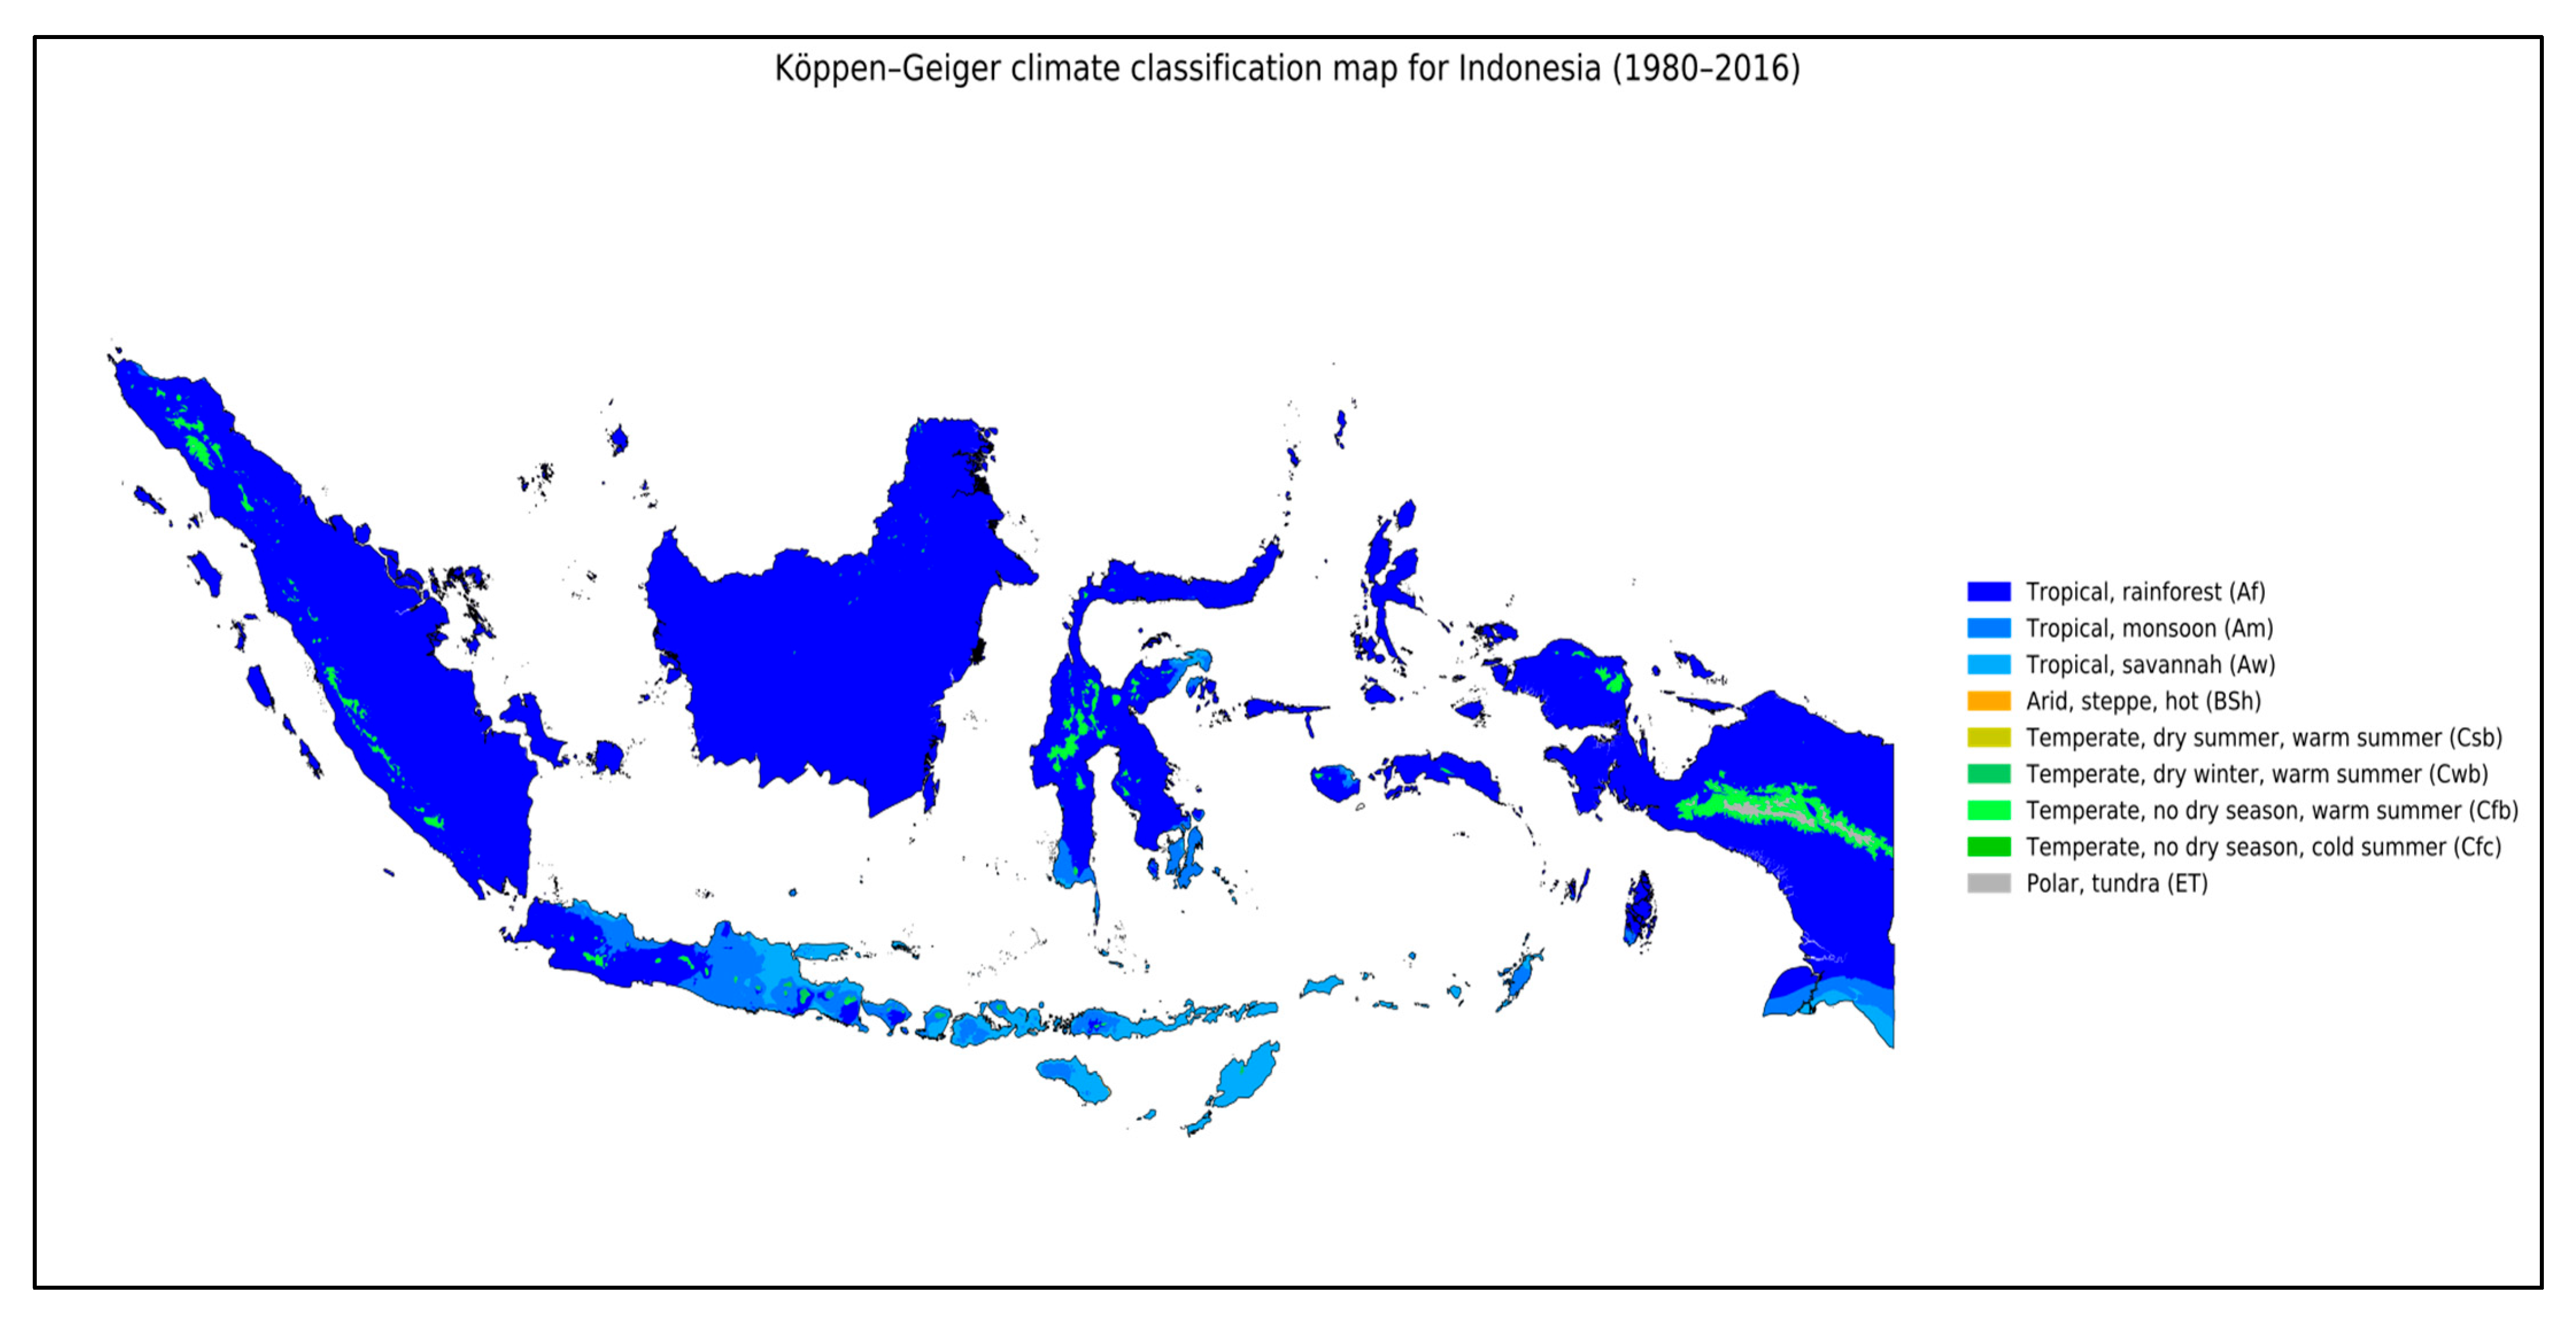
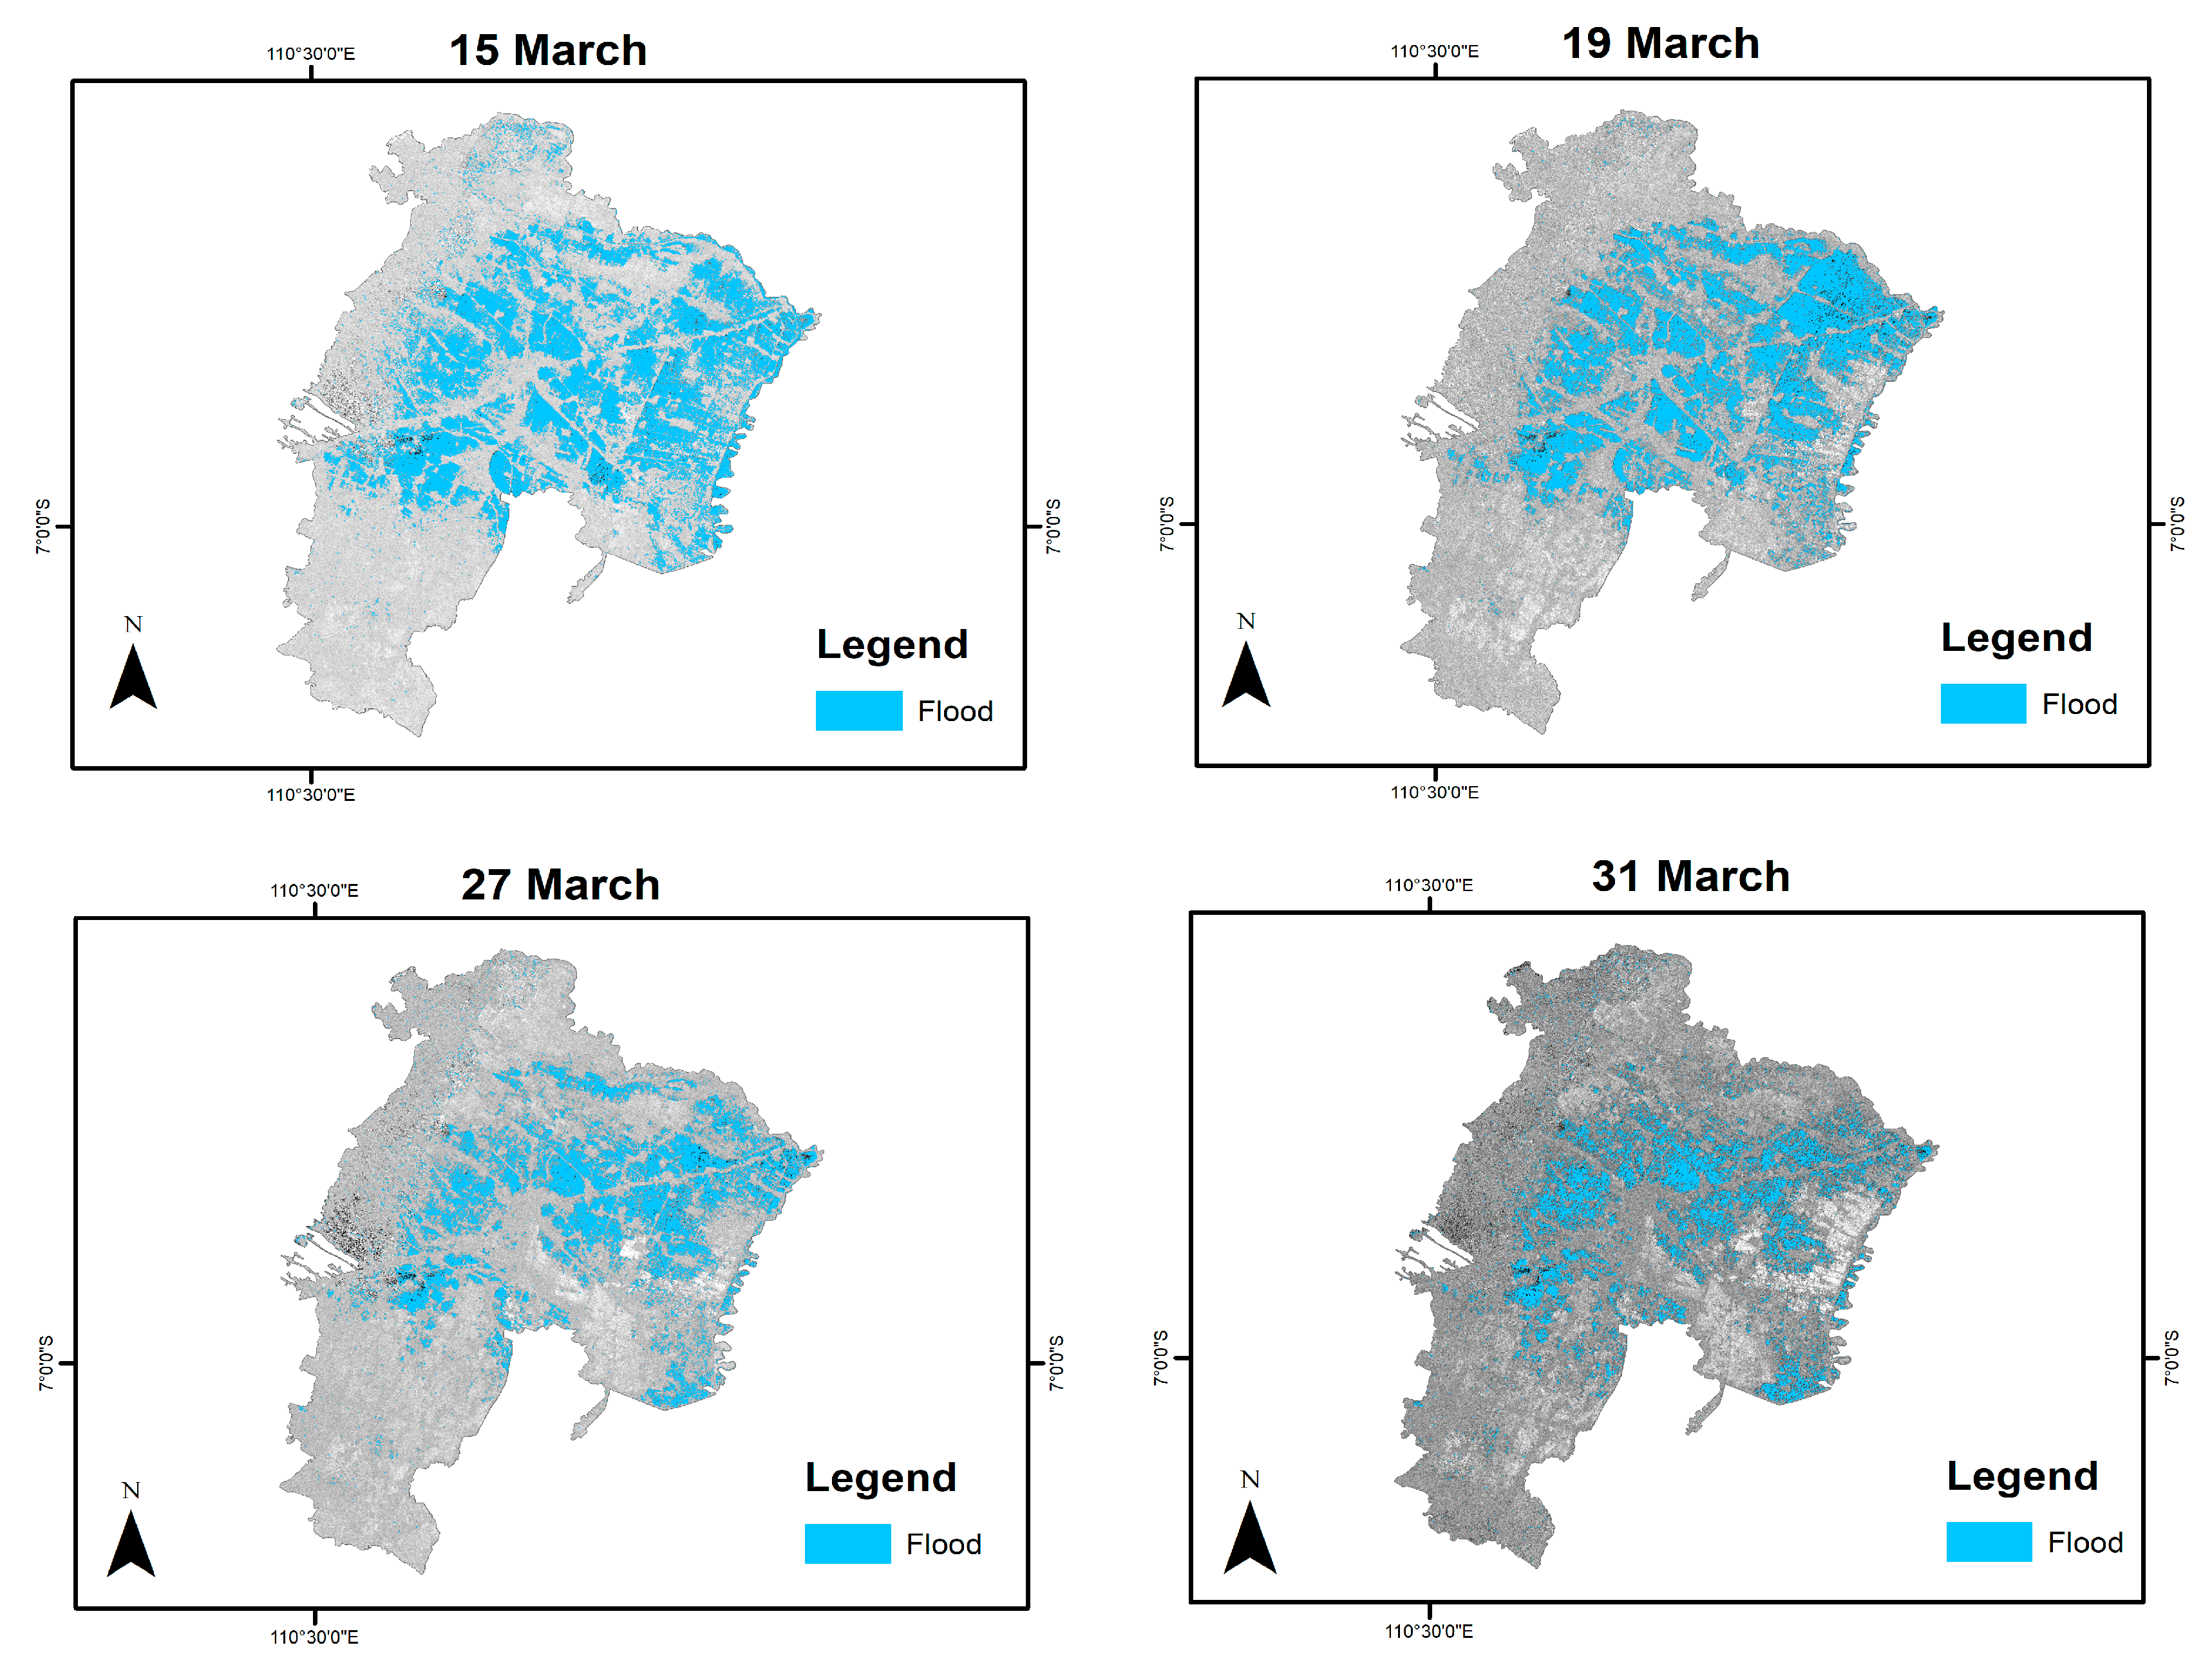
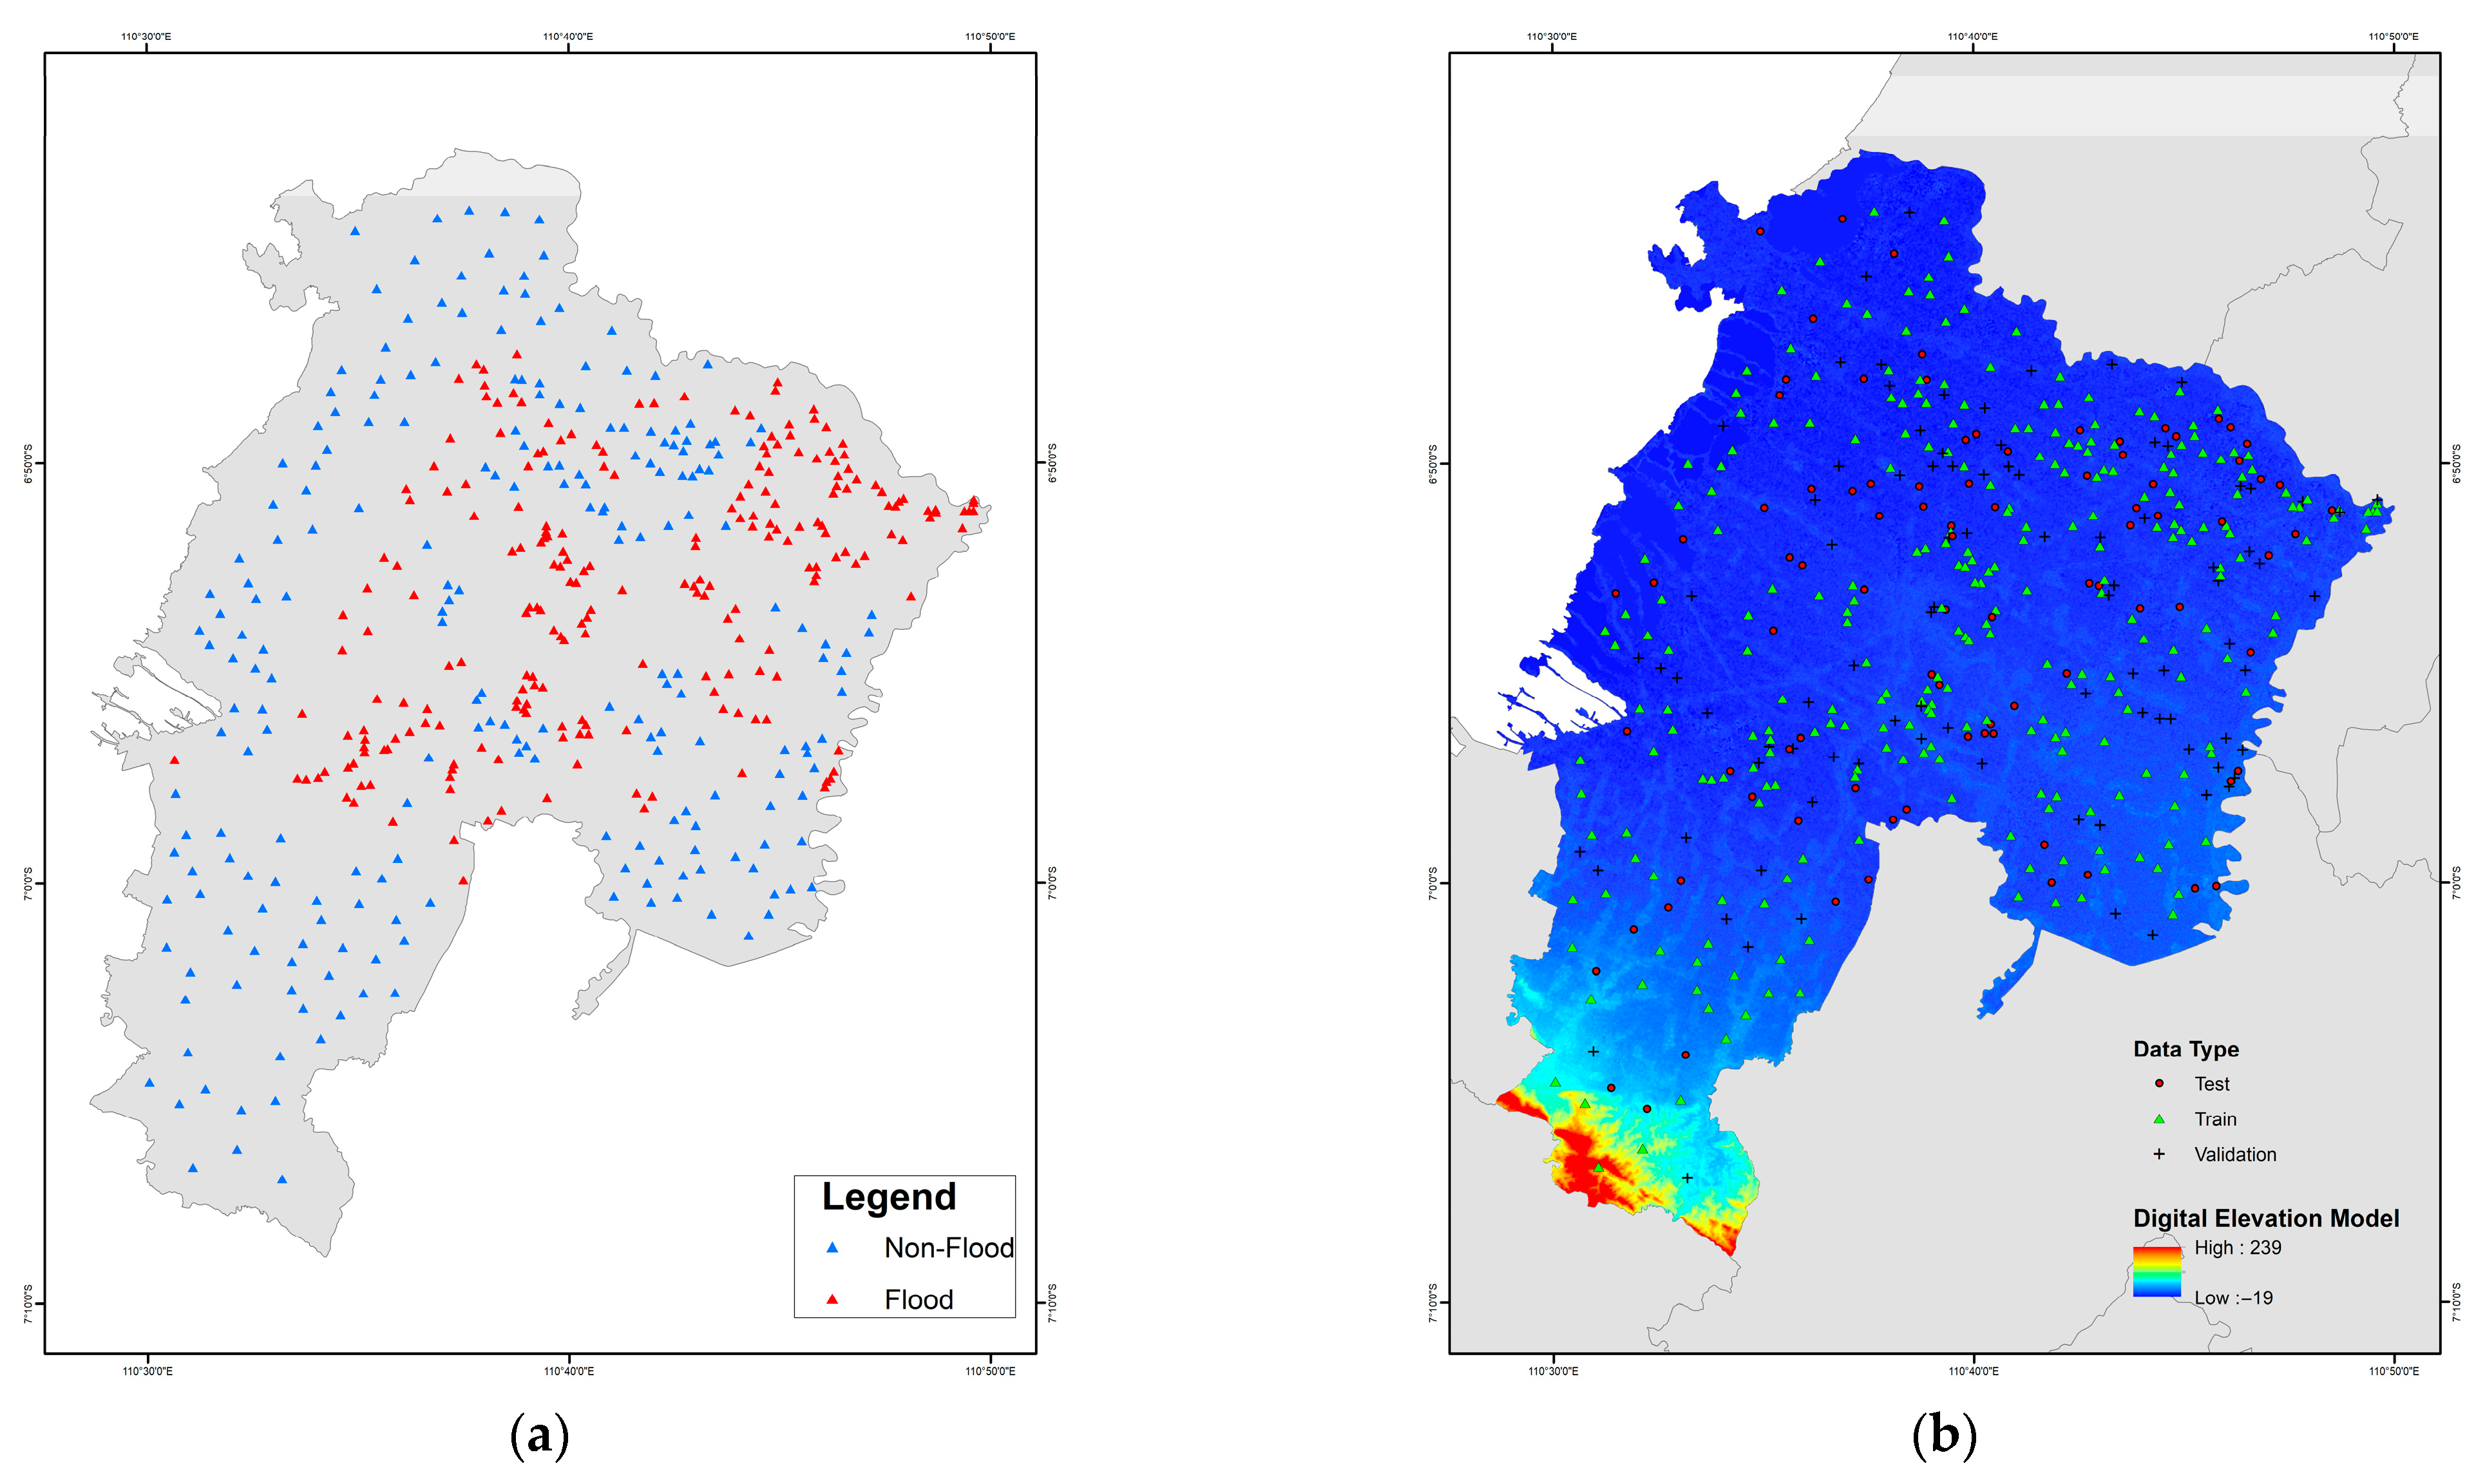
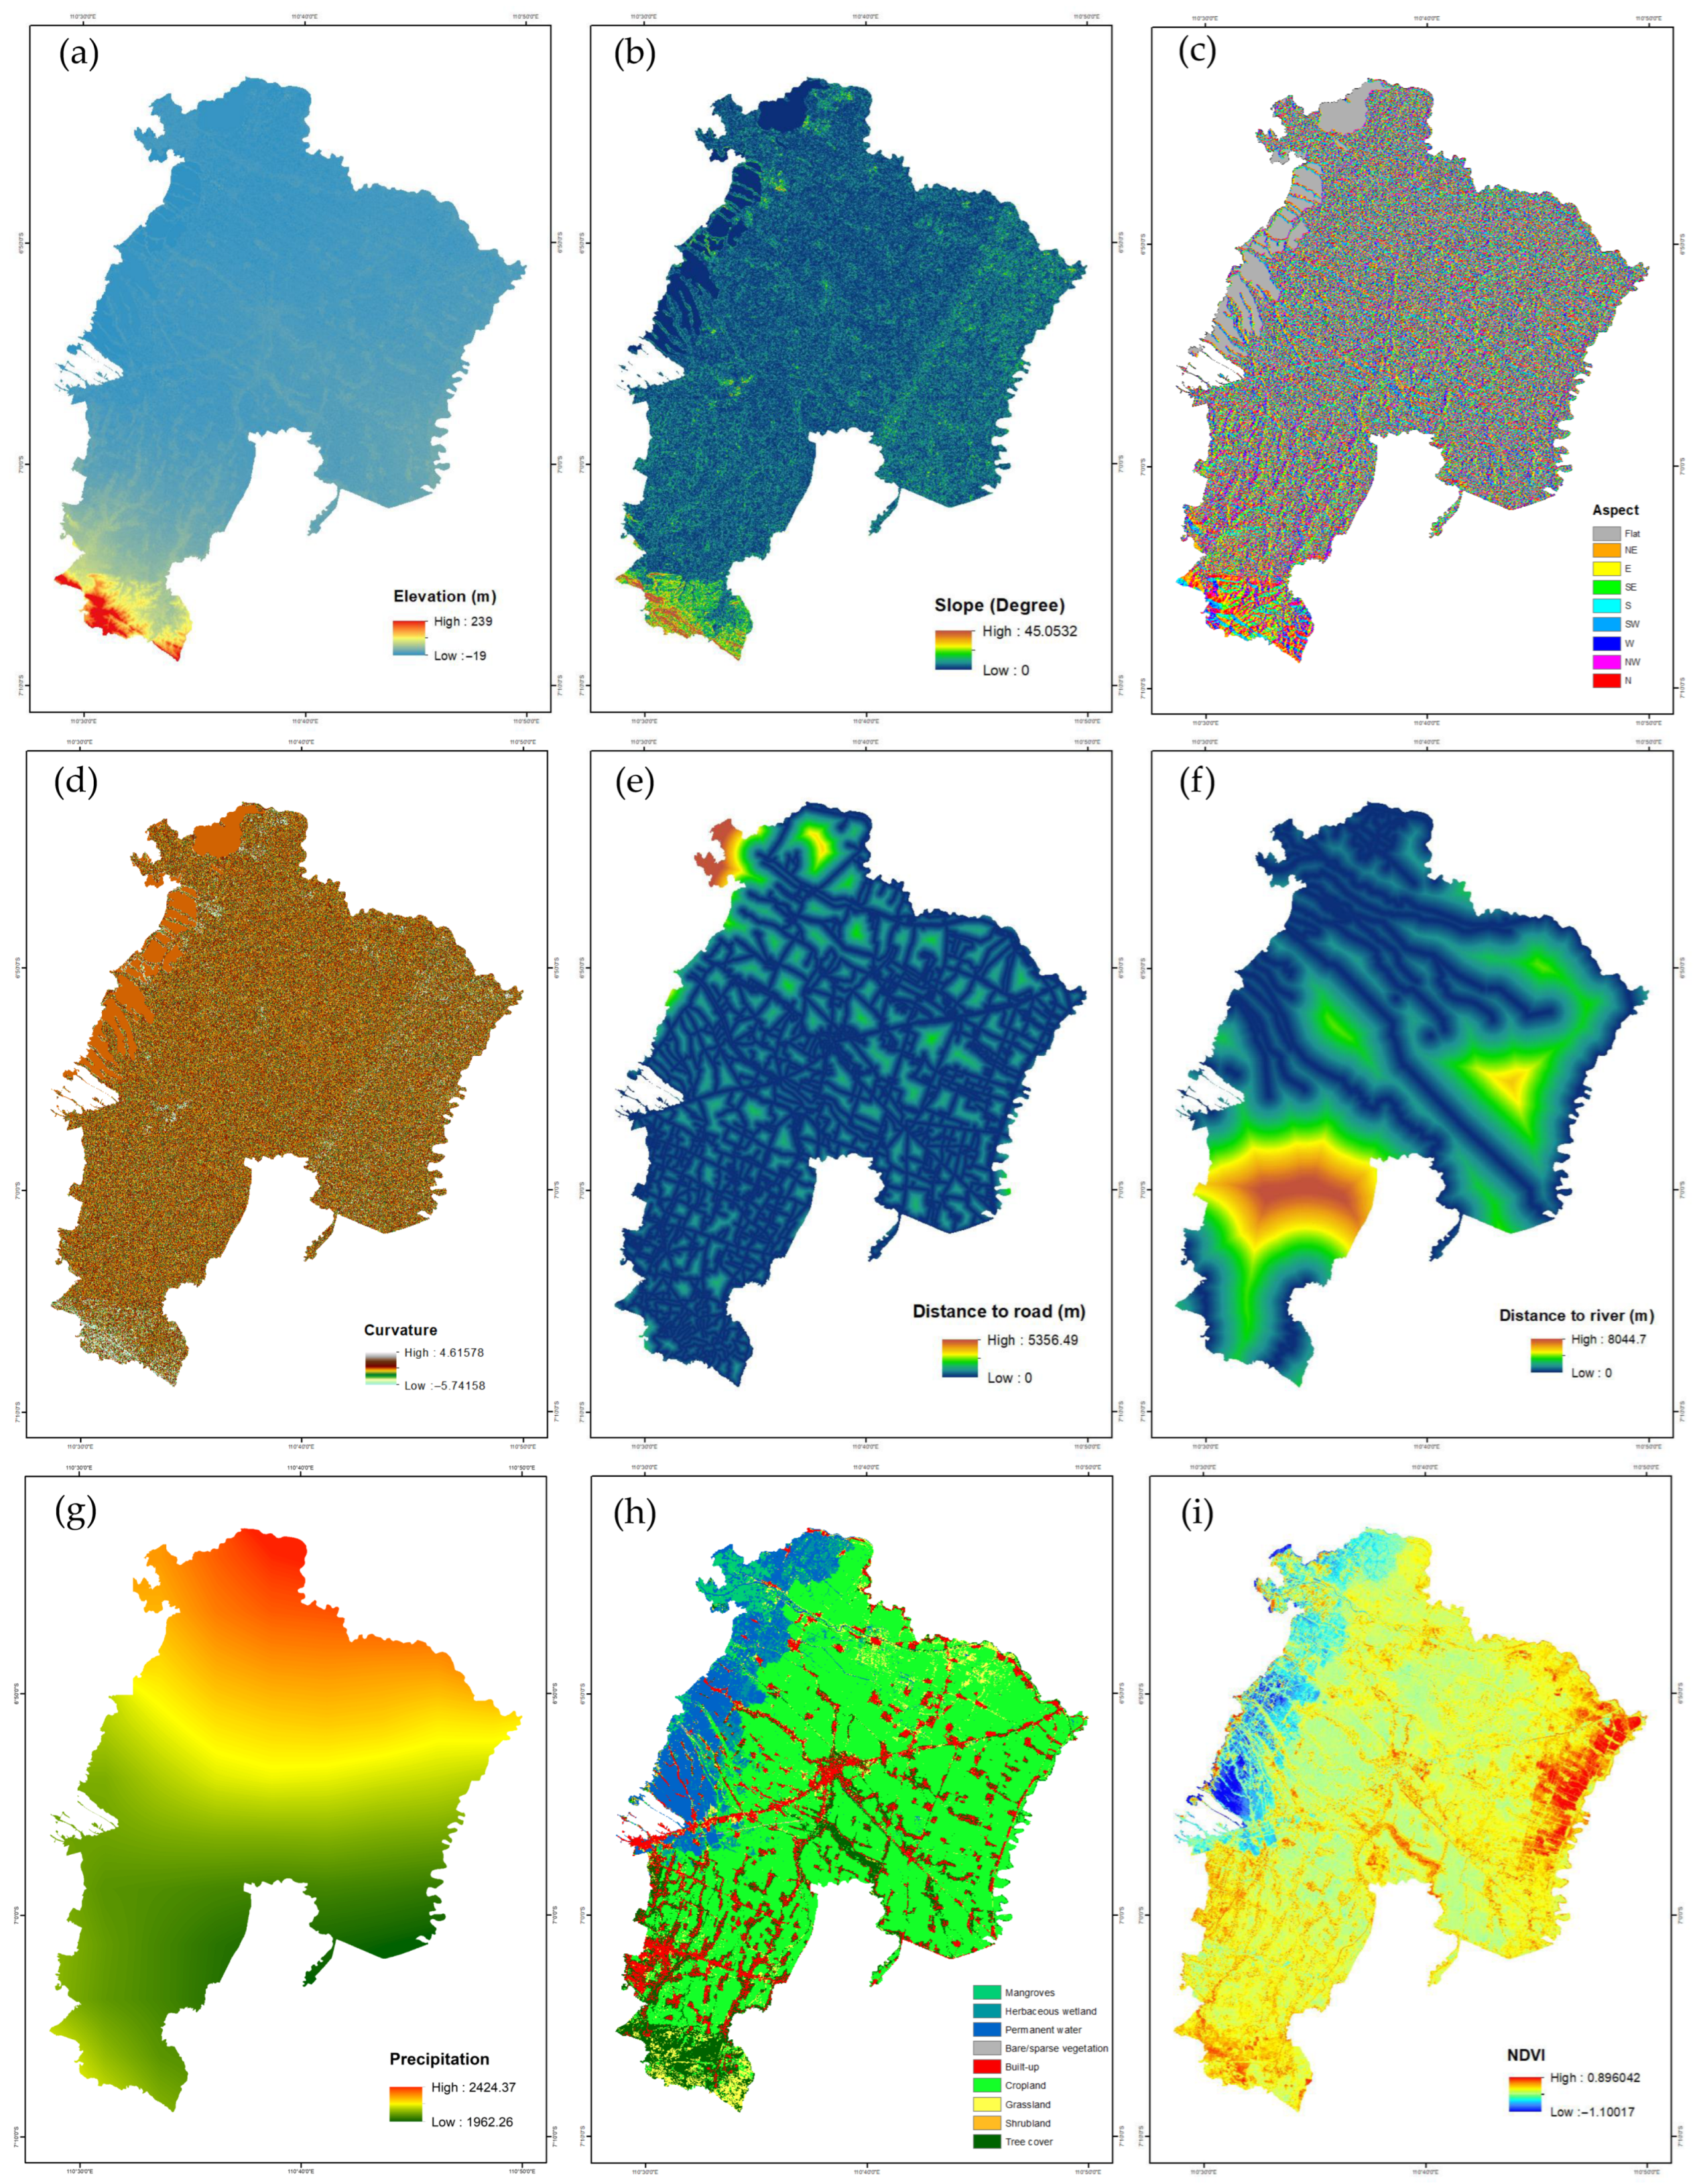
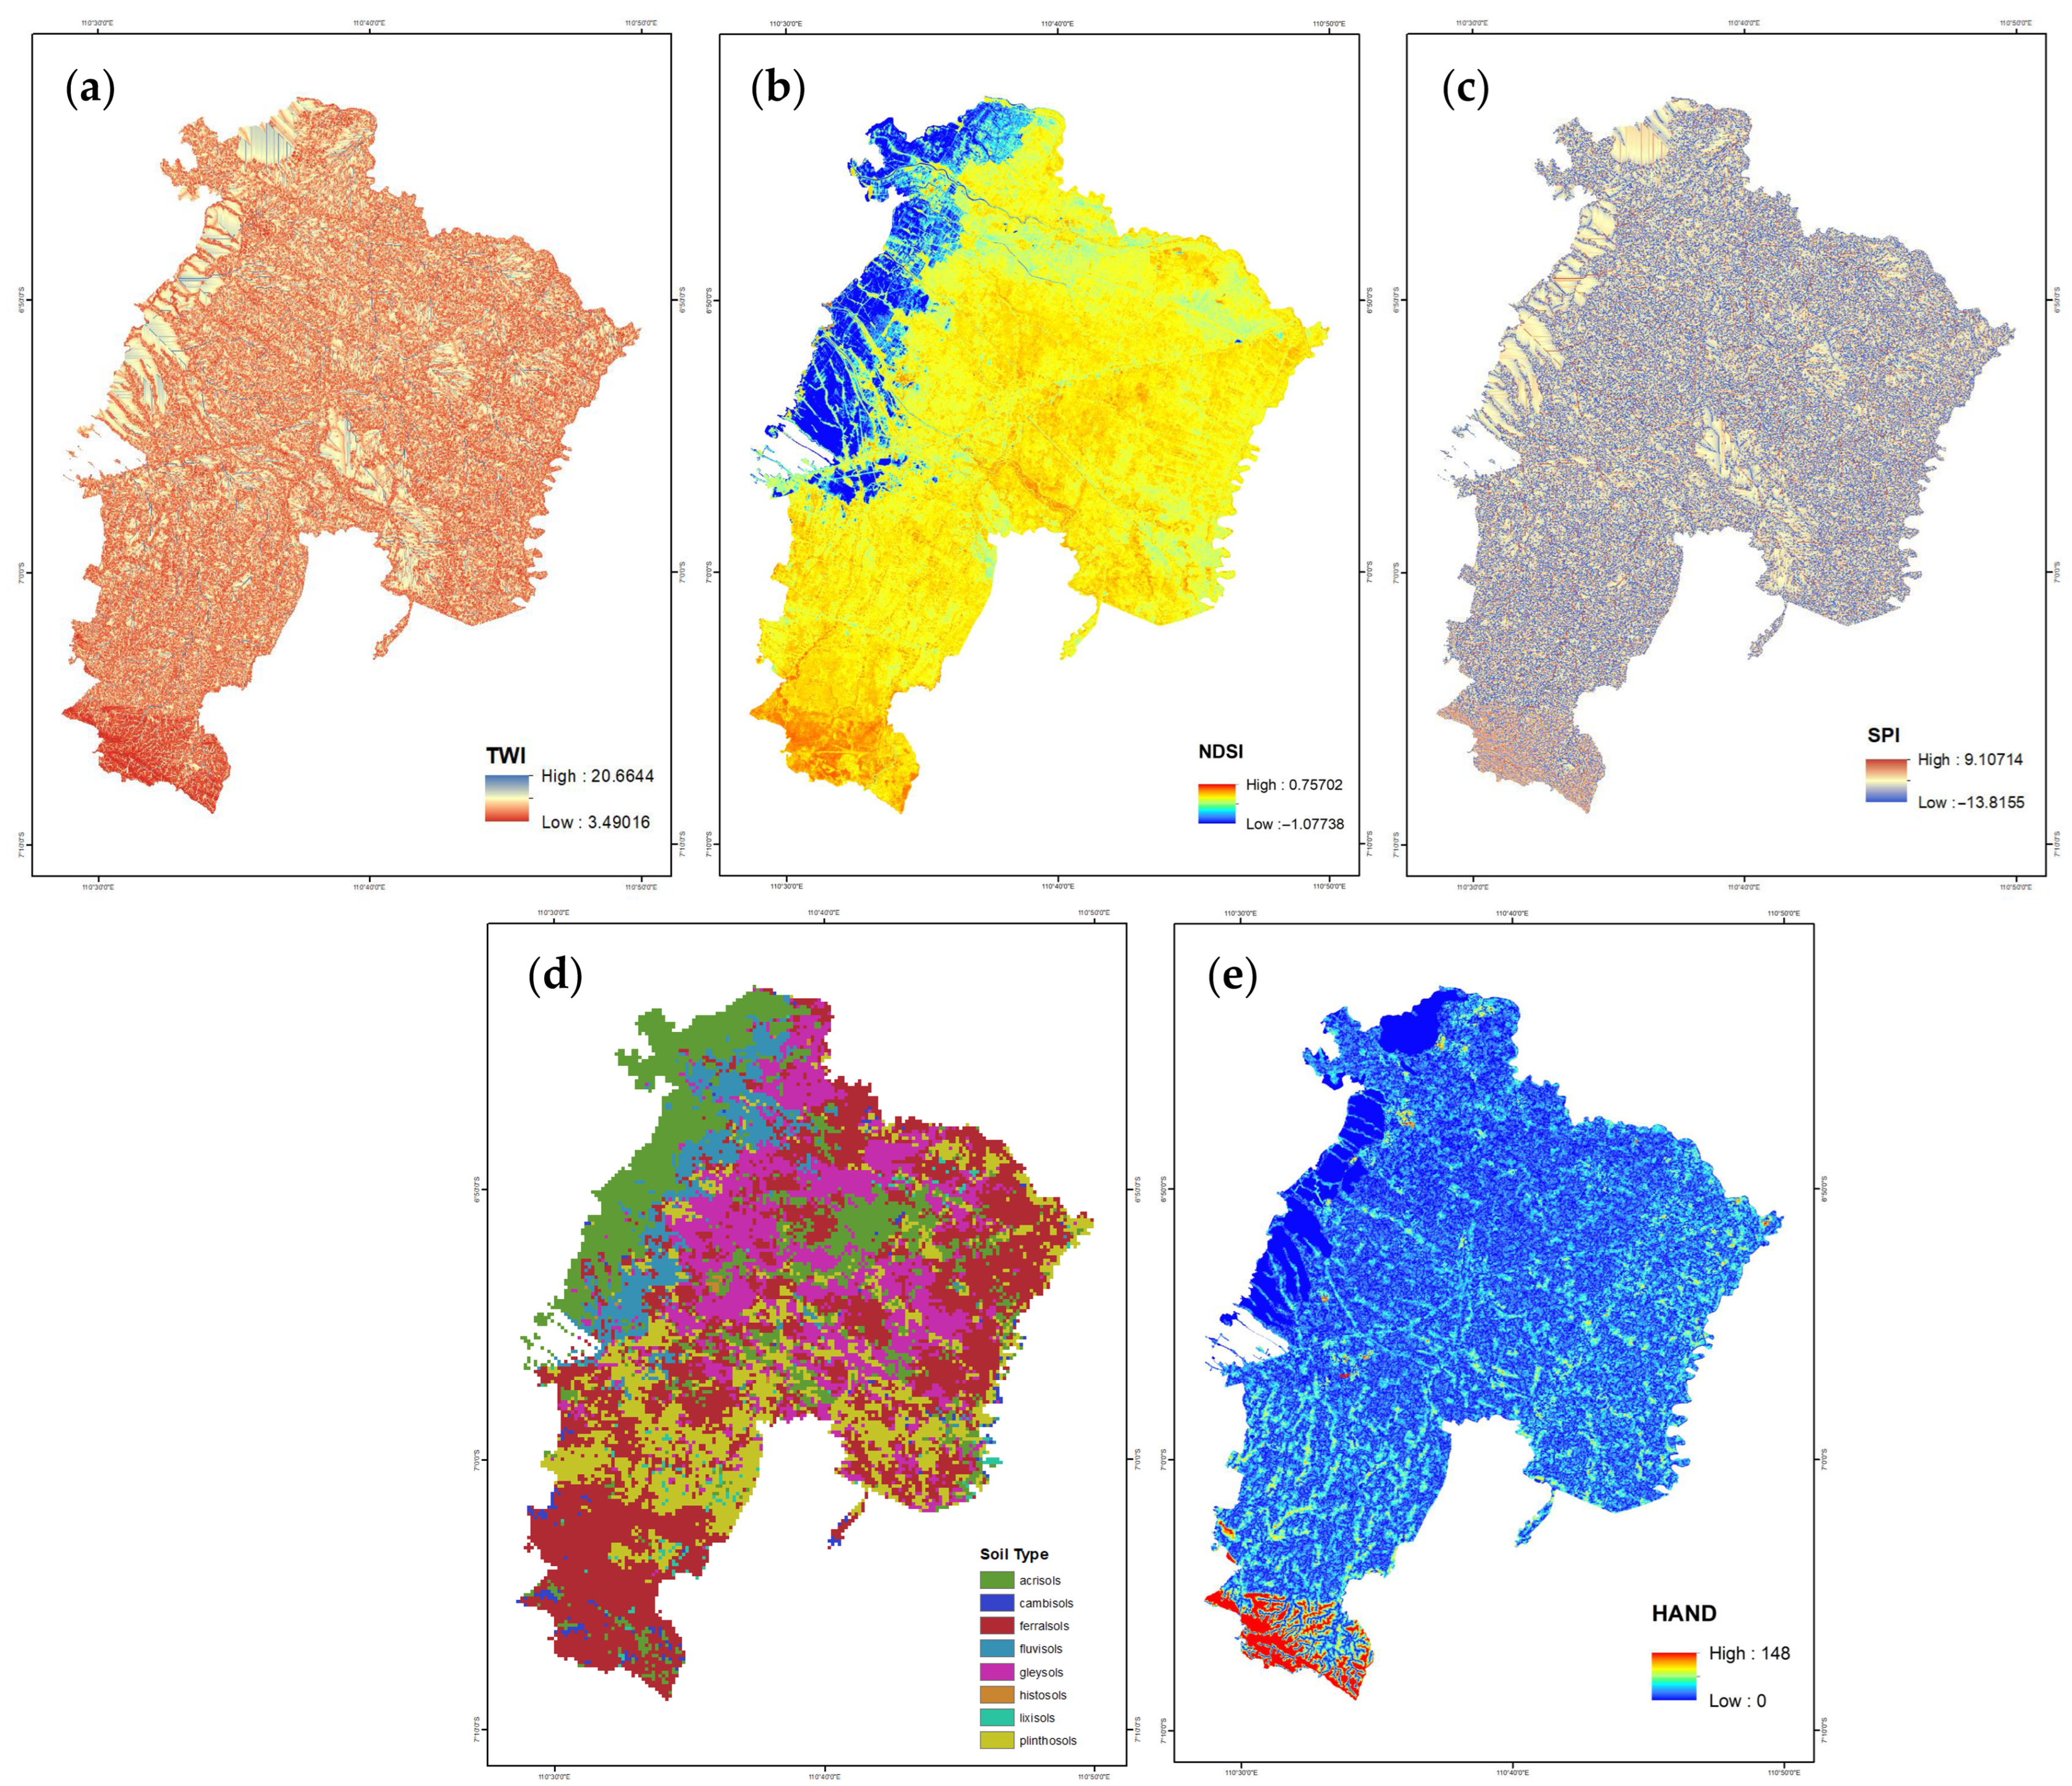



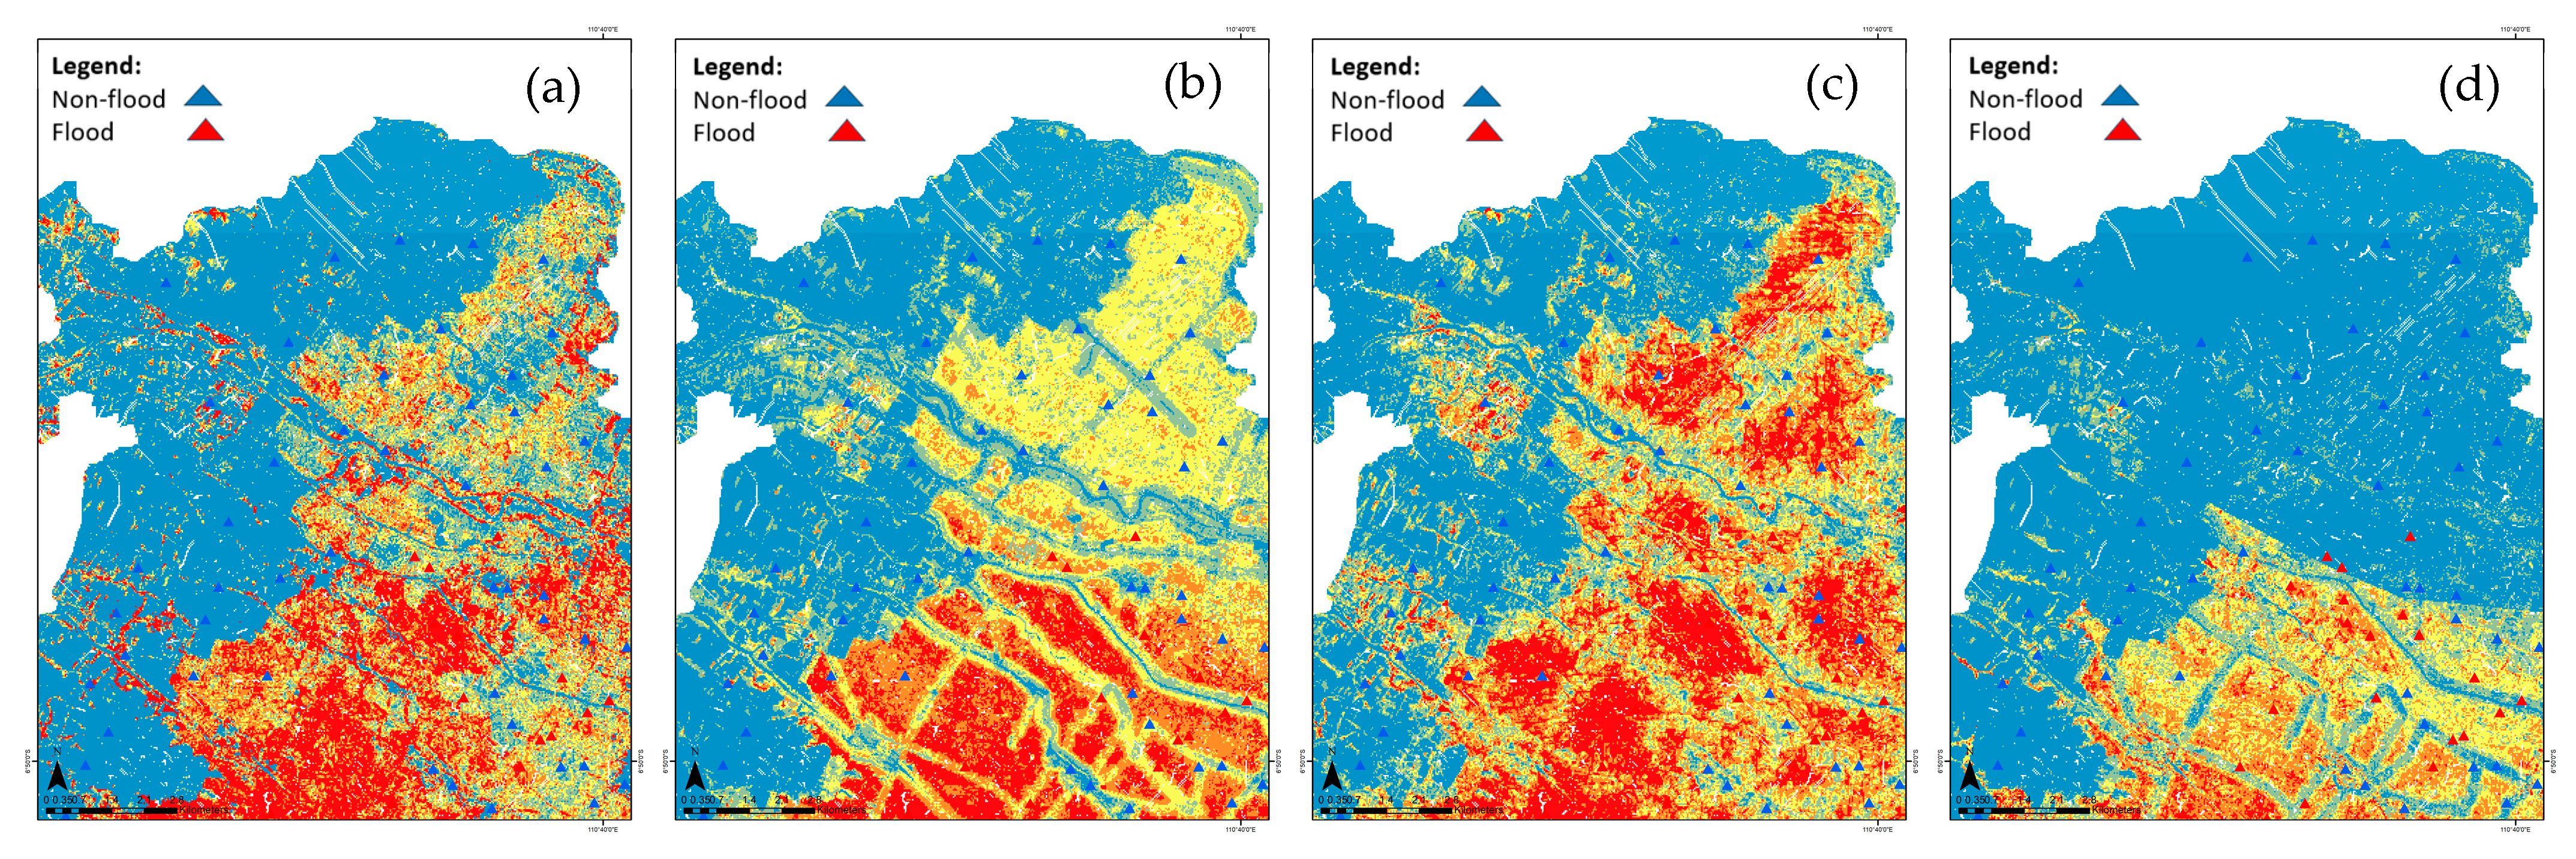
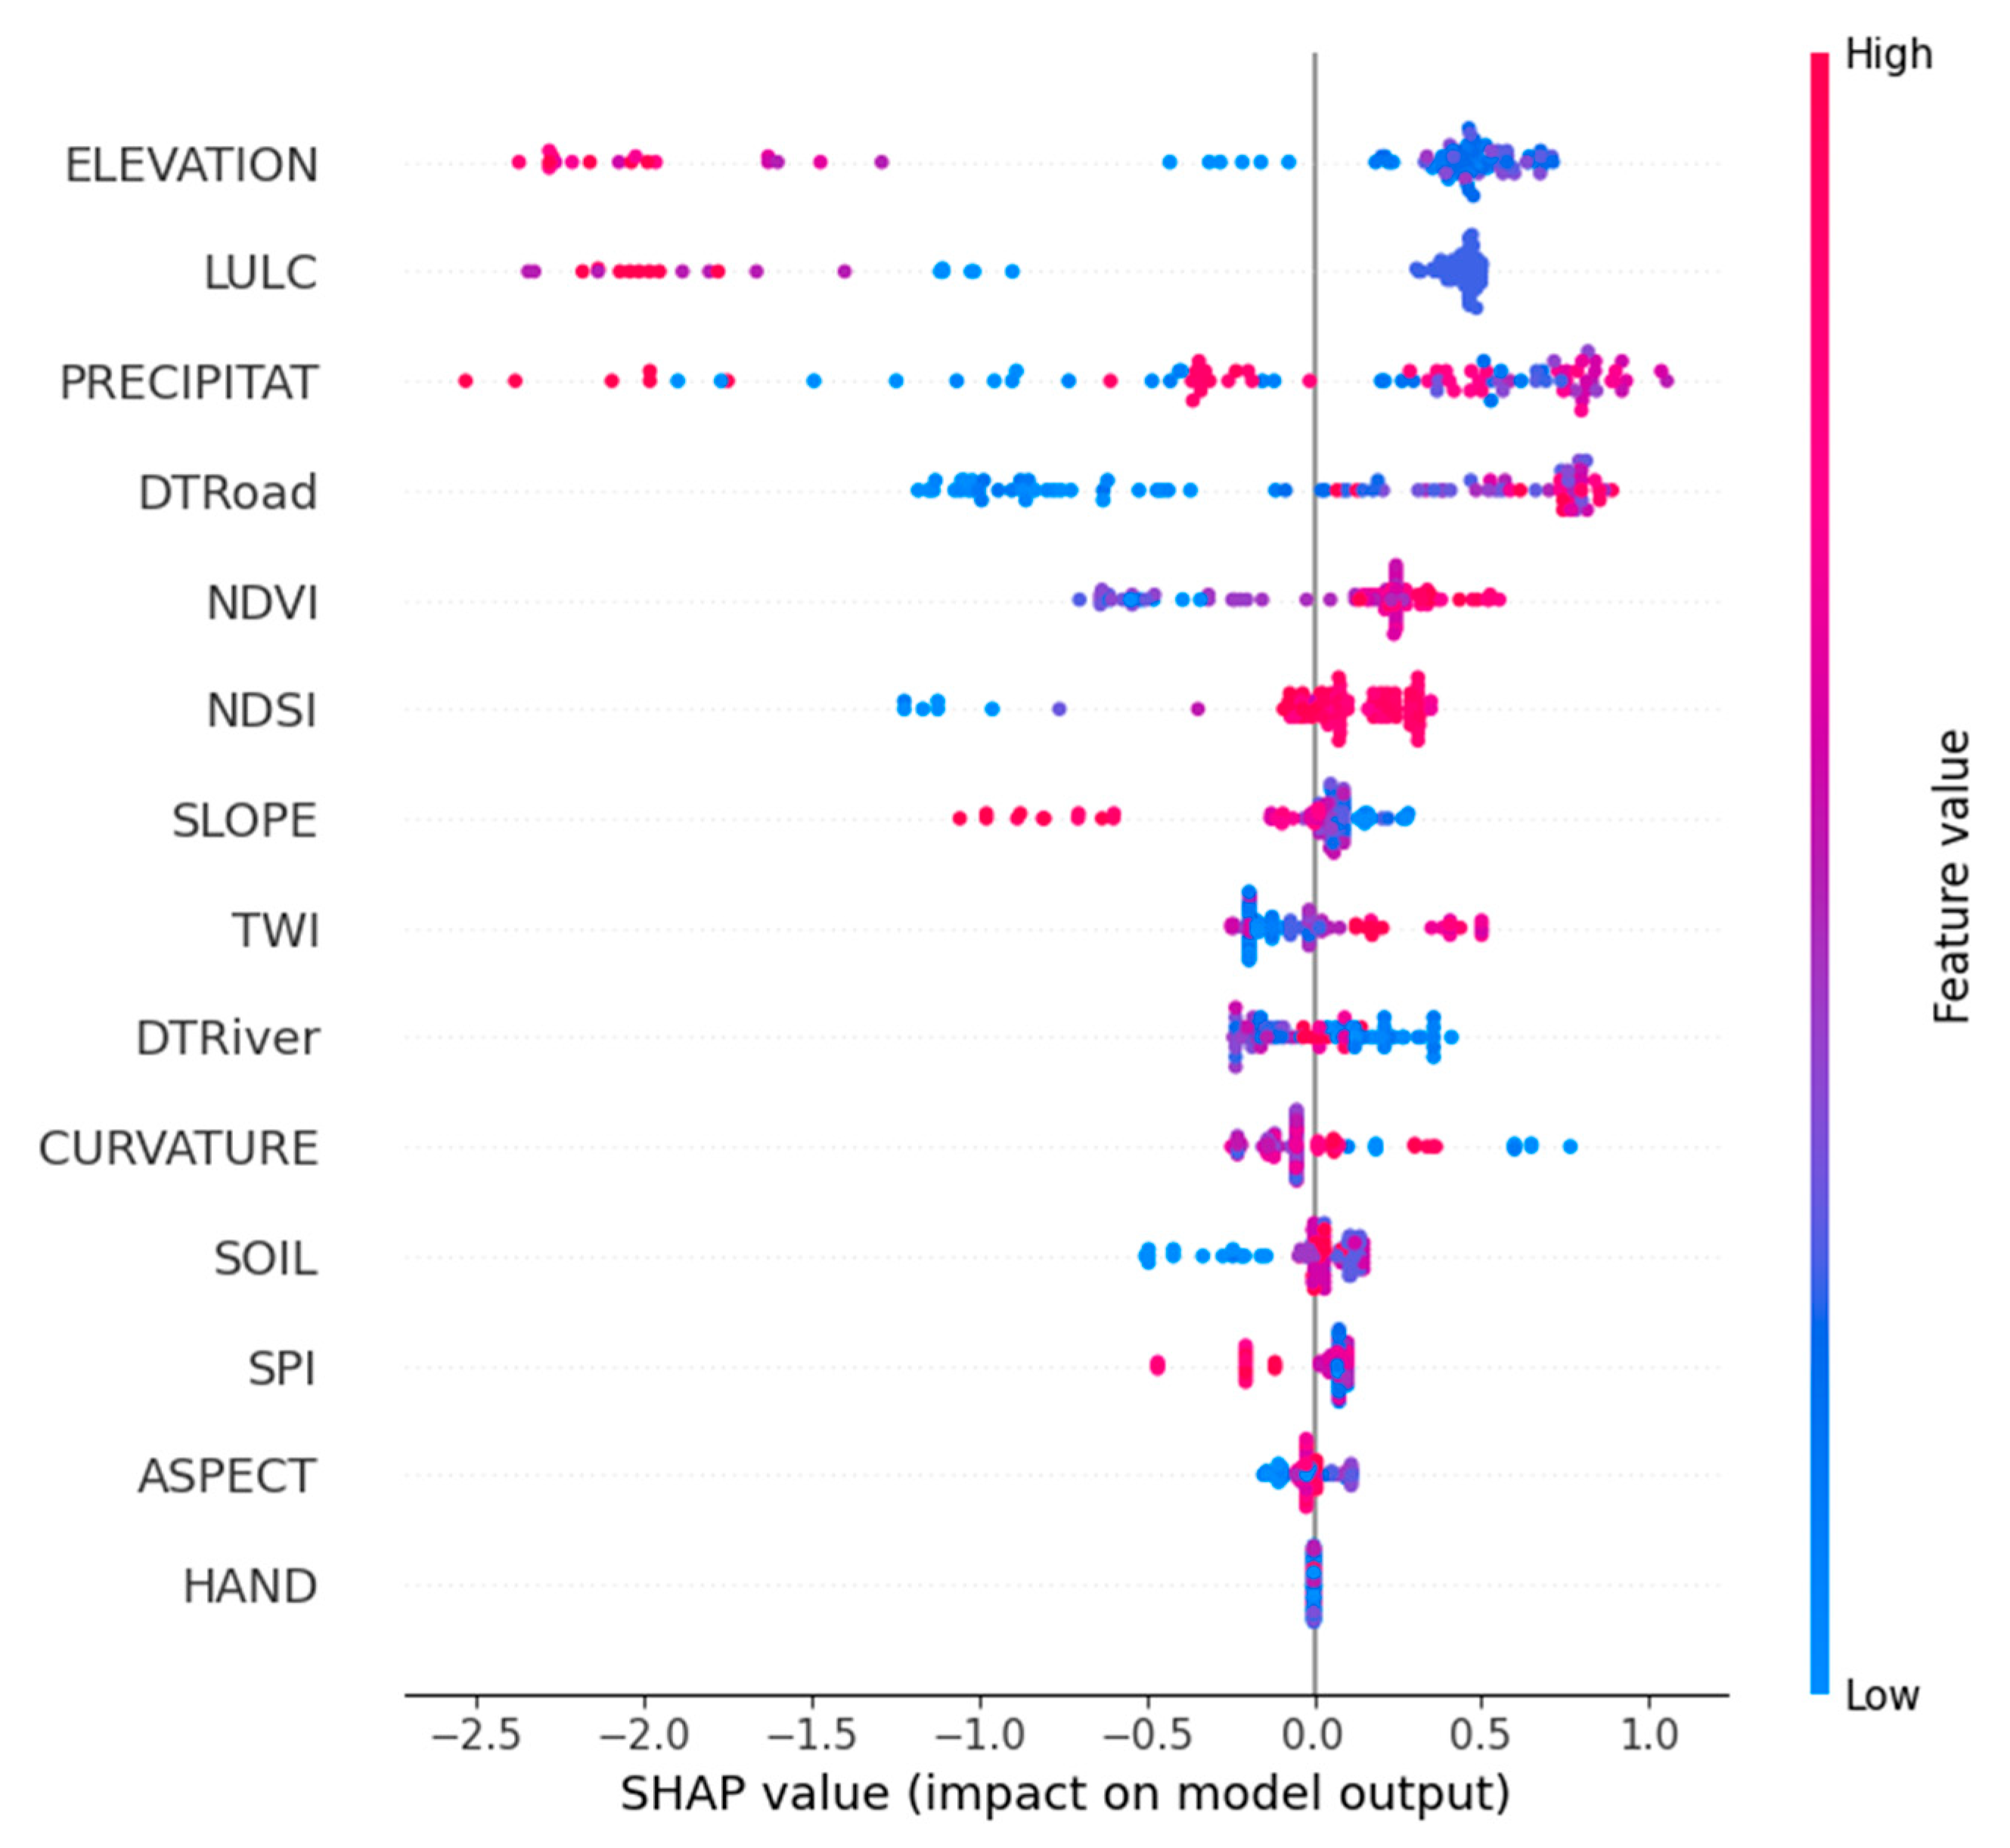
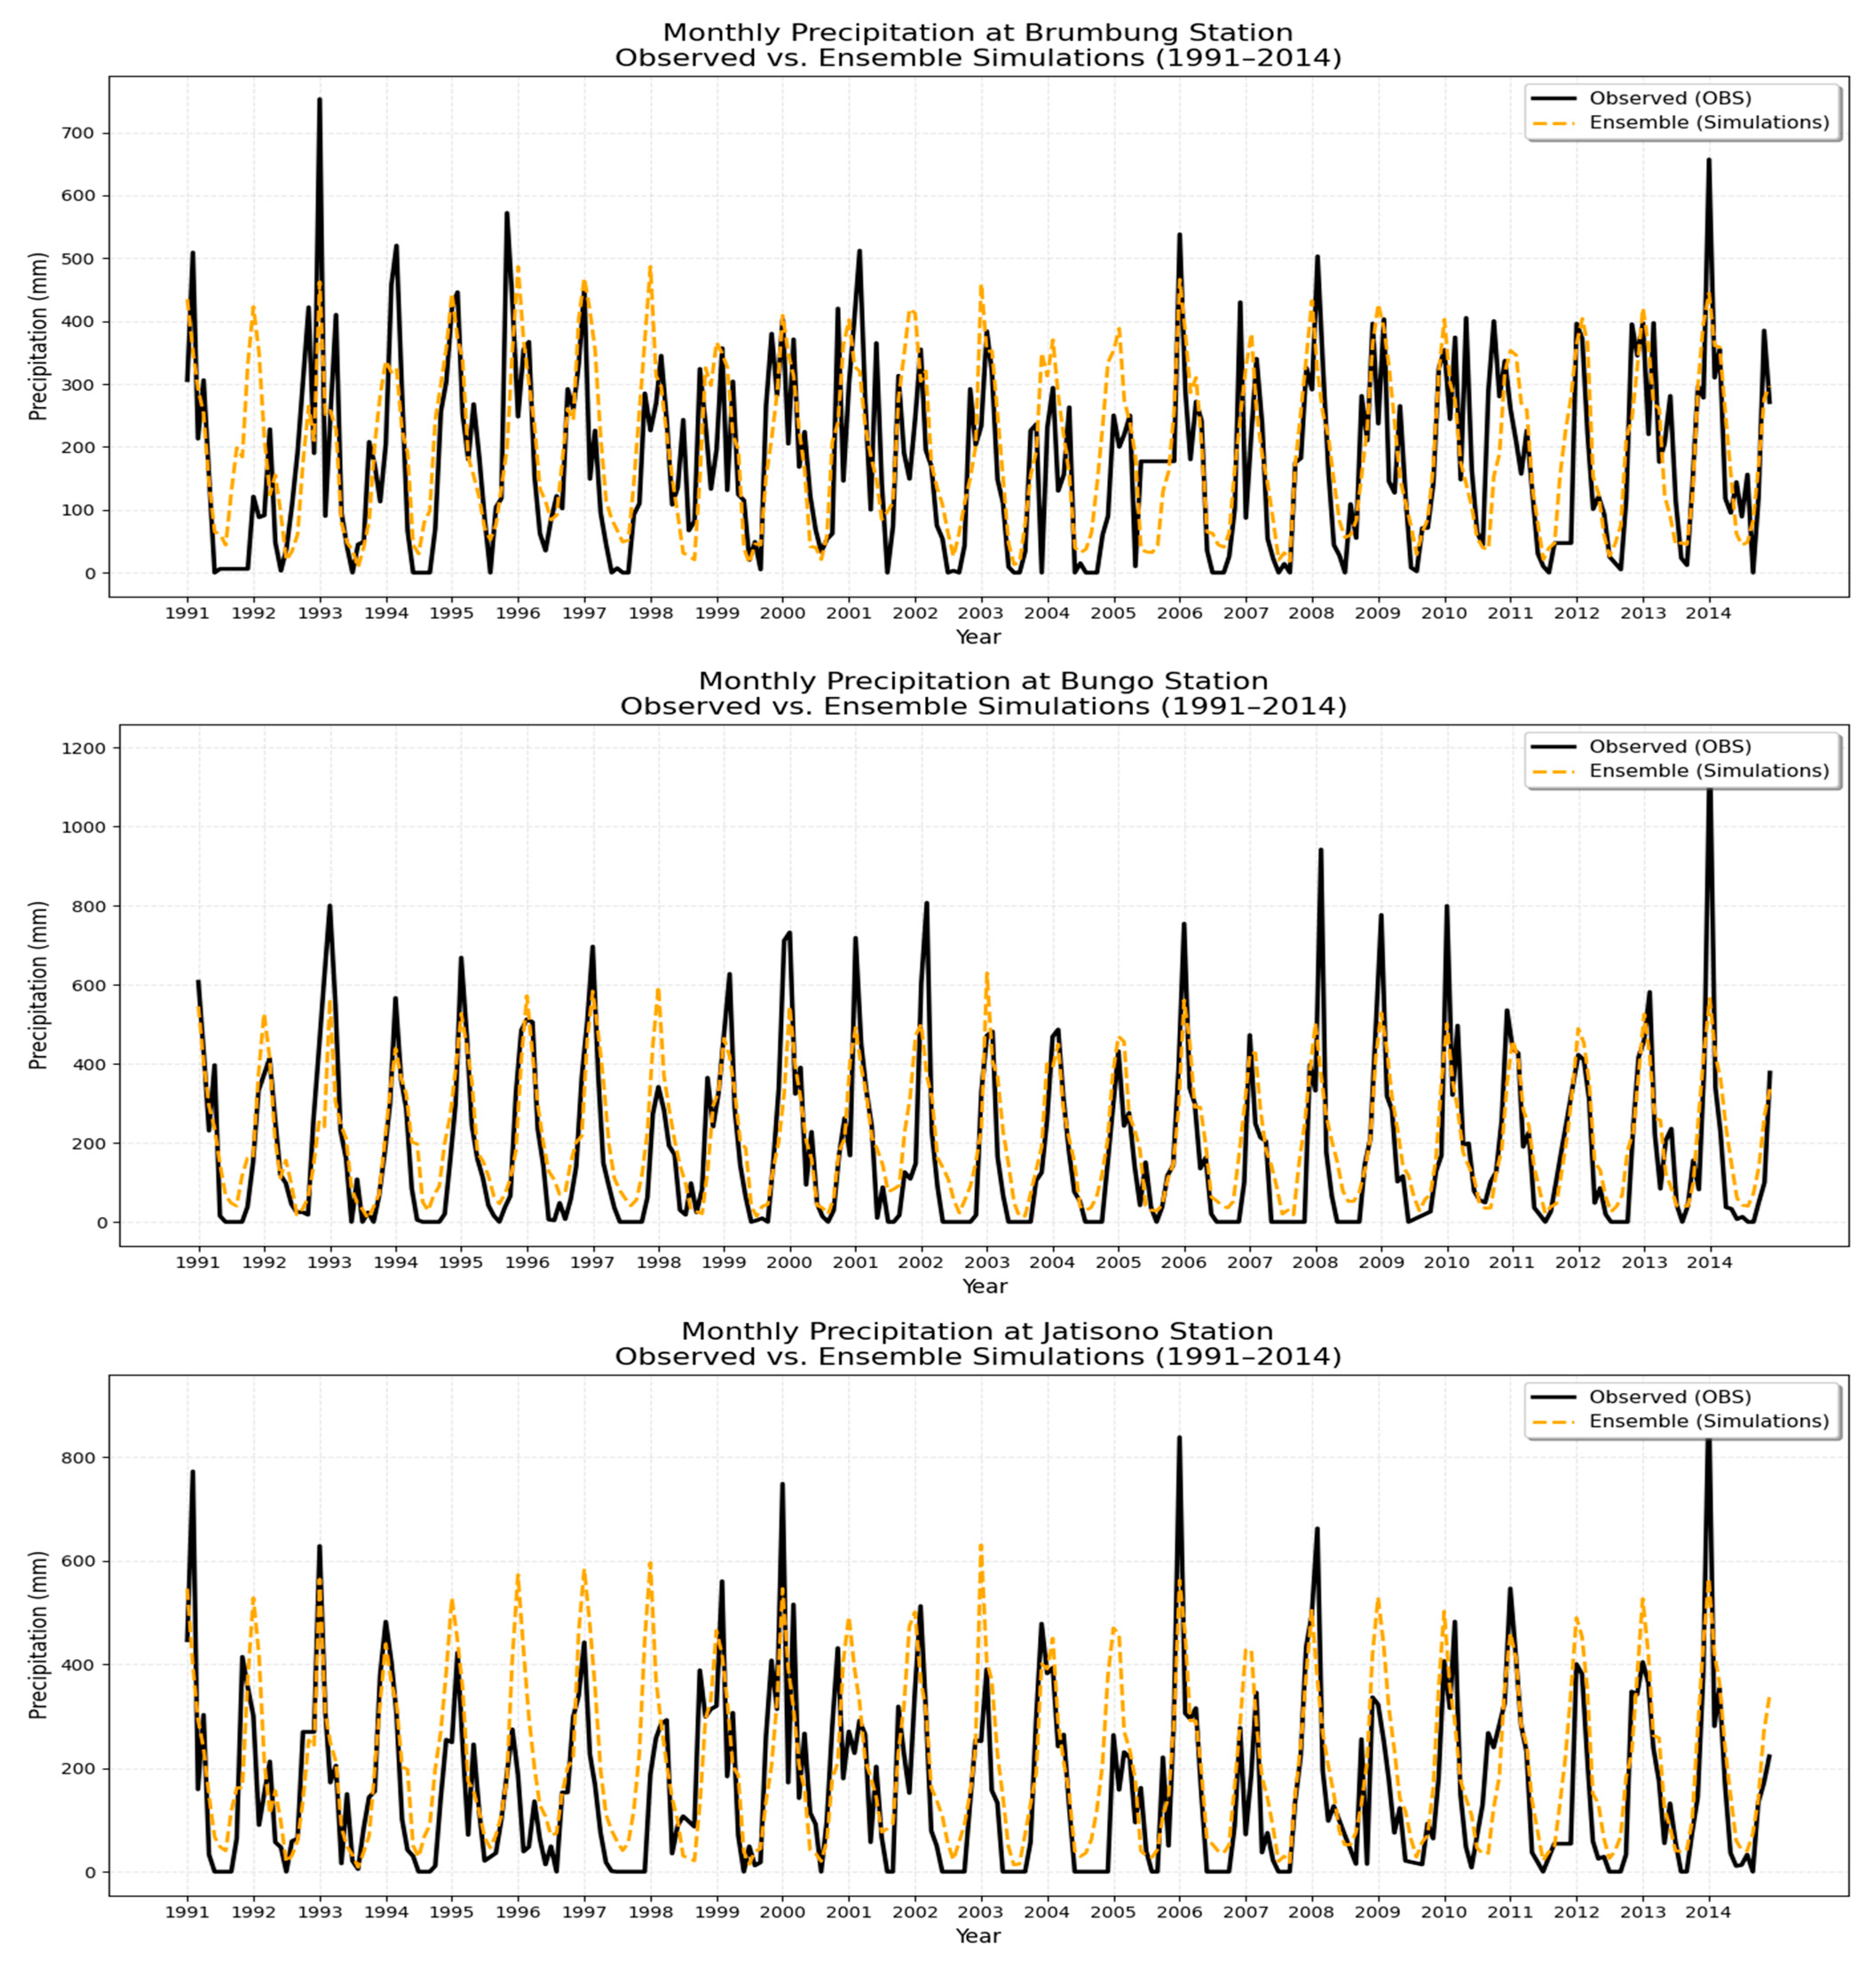

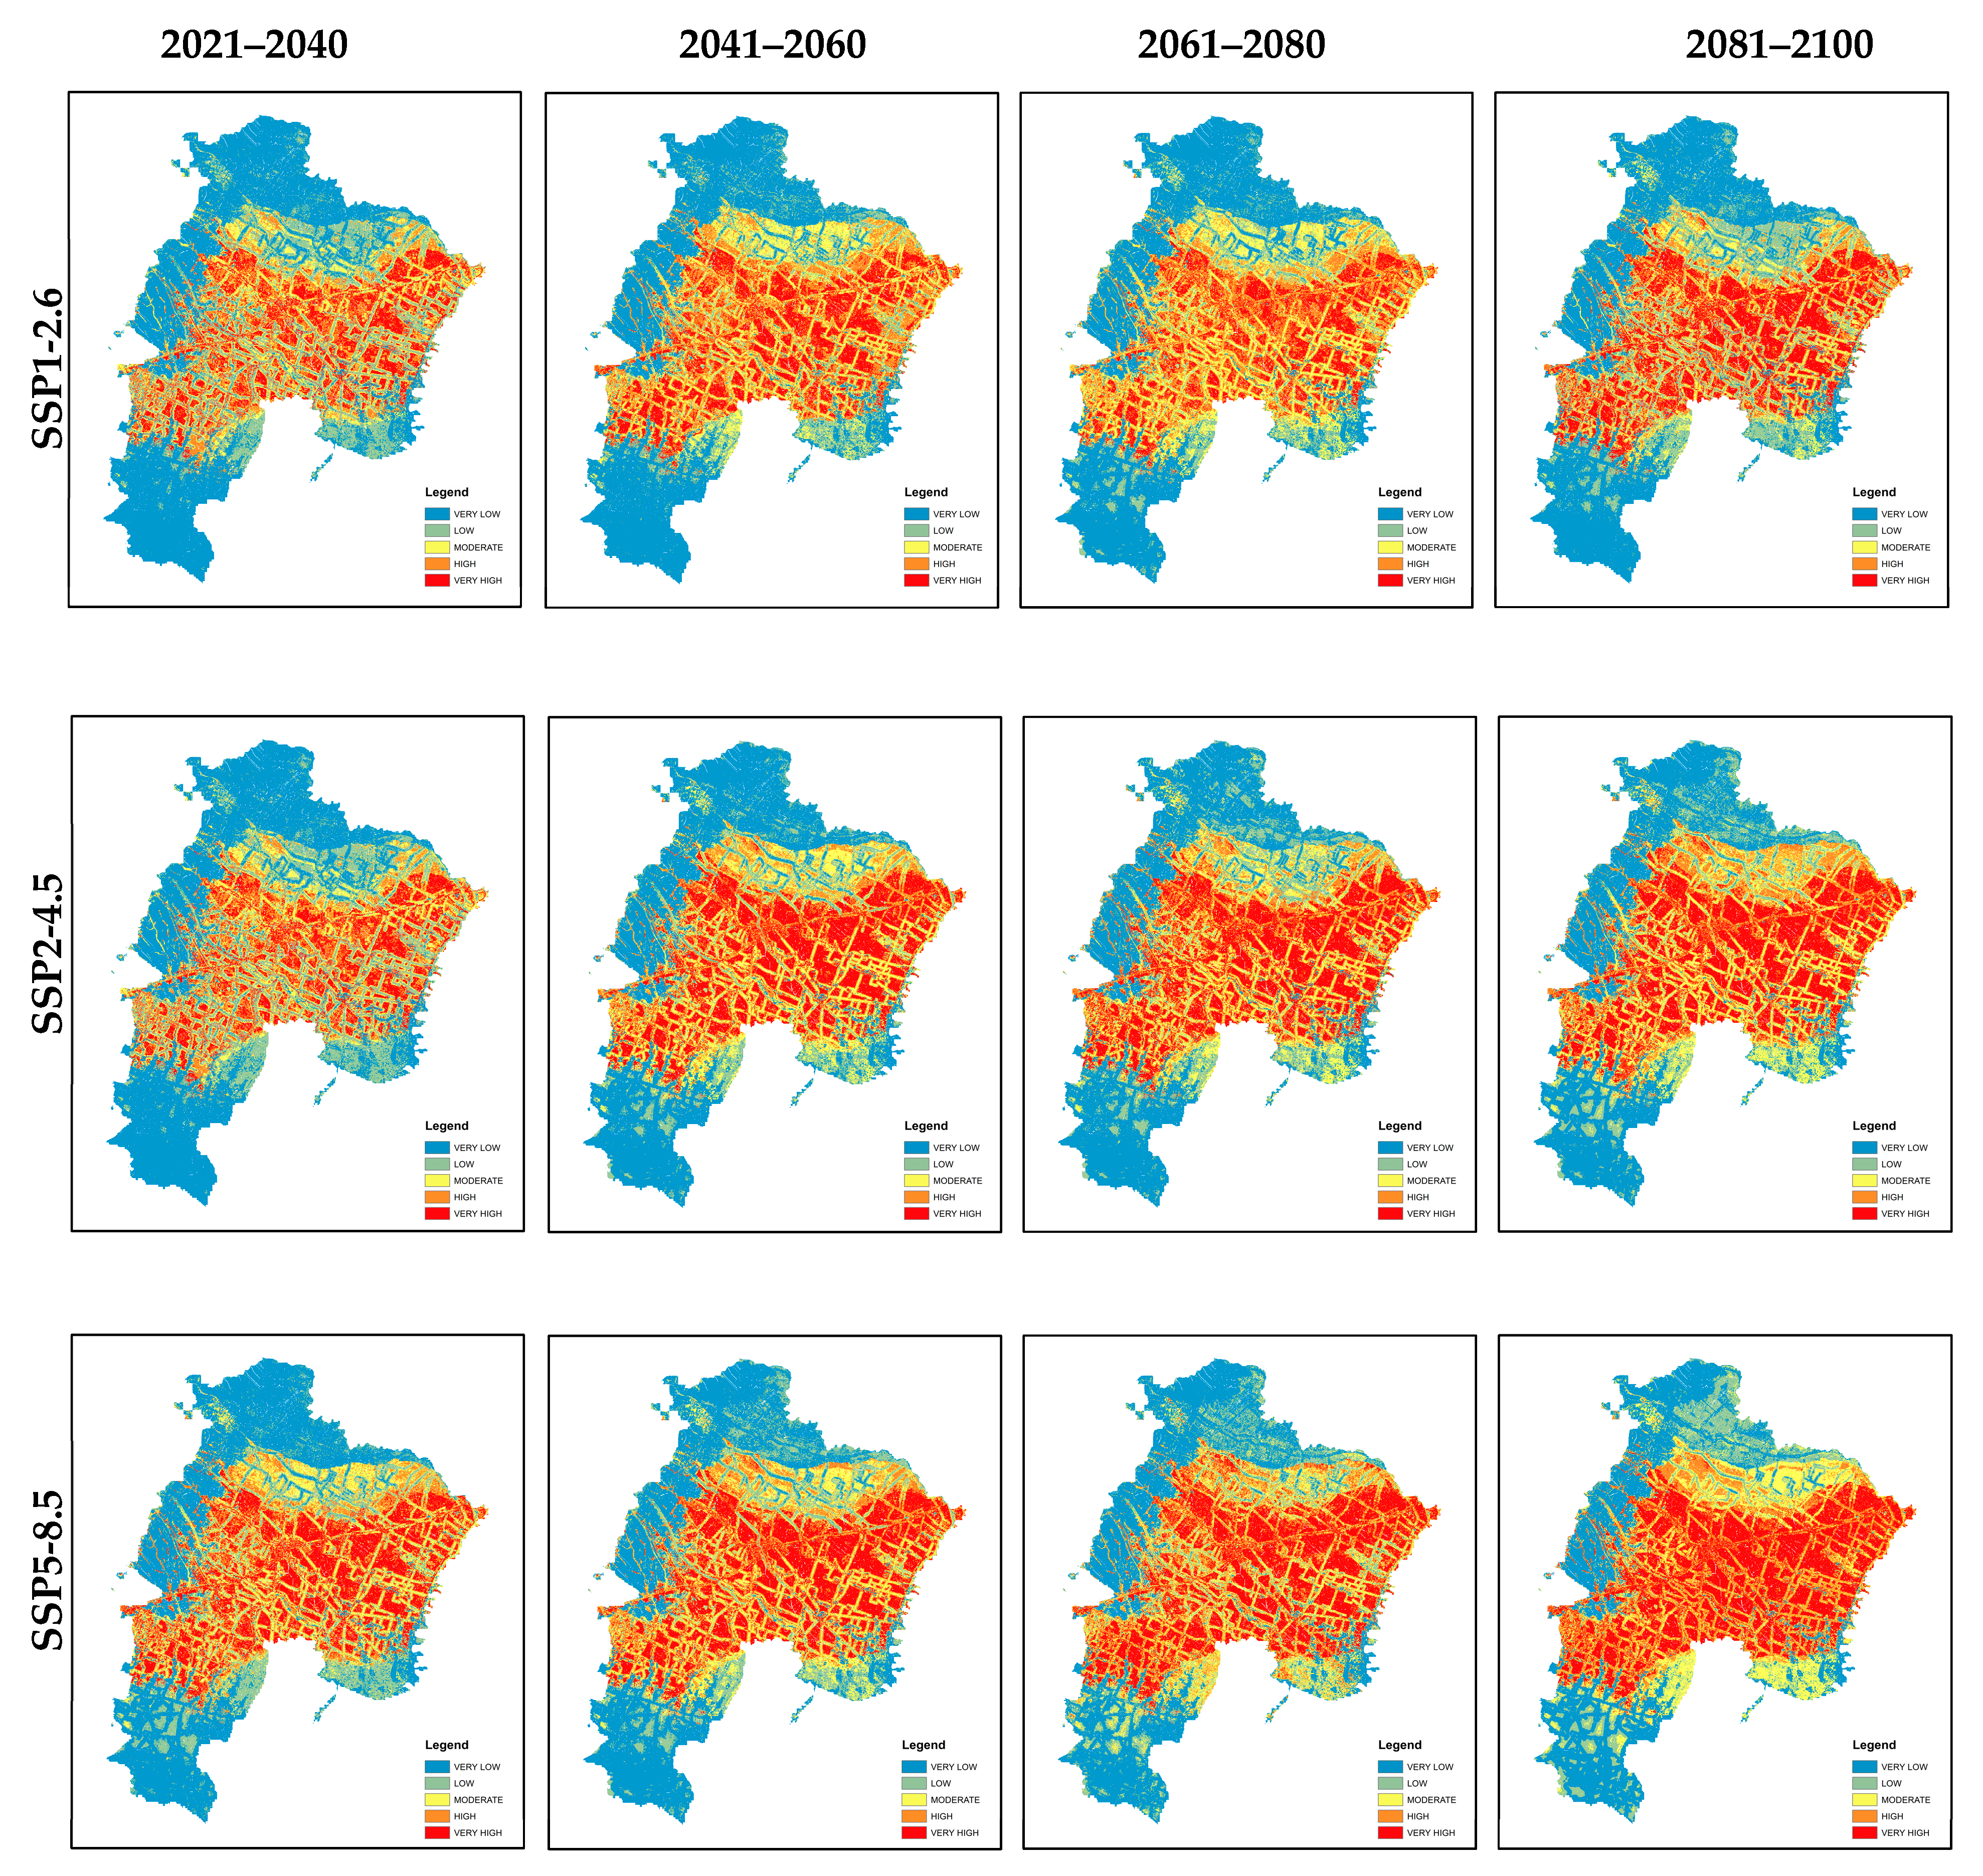
| No. | Parameter | Data Type | Spatial Resolution | Data Source |
|---|---|---|---|---|
| 1 | Elevation | Raster | 30 m | SRTM DEM |
| 2 | Aspect | Raster | 30 m | |
| 3 | Curvature | Raster | 30 m | |
| 4 | Slope | Raster | 30 m | |
| 5 | TWI | Raster | 30 m | |
| 6 | SPI | Raster | 30 m | |
| 7 | HAND | Raster | 30 m | |
| 8 | DTRiver | Vector | - | Geospatial Information Agency of Indonesia |
| 9 | DTRoad | Vector | - | OpenStreetMap |
| 10 | LULC | Raster | 10 m | ESRI Land Cover |
| 11 | Soil Type | Raster | 250 m | SoilGrids |
| 12 | Precipitation | Raster | 5000 m | CHIRPS |
| 13 | NDVI | Raster | 30 m | Landsat-8 OLI |
| 14 | NDSI | Raster | 30 m |
| Product Type | Observation | Mode | Polarization | Spatial Resolution | Acquisition | Orbit Phase |
|---|---|---|---|---|---|---|
| GRD | Before flood | IW | VH | 10 × 10 m | 3 March 2024 | Descending |
| GRD | Before flood | IW | VH | 10 × 10 m | 7 March 2024 | Ascending |
| GRD | During the flood | IW | VH | 10 × 10 m | 15 March 2024 | Descending |
| GRD | During the flood | IW | VH | 10 × 10 m | 19 March 2024 | Ascending |
| GRD | During the flood | IW | VH | 10 × 10 m | 27 March 2024 | Descending |
| GRD | During the flood | IW | VH | 10 × 10 m | 31 March 2024 | Ascending |
| Scenarios | Expected Temperature Rise | Description |
|---|---|---|
| SSP1-2.6 | 1.8 °C | Sustainability—taking the green road (low challenges to mitigation and adaptation) |
| SSP2-4.5 | 2.7 °C | Middle of the road (medium challenges to mitigation and adaptation) |
| SSP5-8.5 | 4.4 °C | Fossil-fueled development—taking the highway (high challenges to mitigation, low challenges to adaptation) |
| No | GCM Name | Institute | Variable | Spatial Resolution |
|---|---|---|---|---|
| 1 | ACCESS-CM2 | Australian Community Climate and Earth-System Simulator (ACCESS)-CSIRO Australia | Precipitation | 925 m |
| 2 | MPI-ESM1-2-HR | Max Planck Institute for Meteorology, Germany | ||
| 3 | HadGEM3-GC31-LL | Met Office Hadley Center (United Kingdom) | ||
| 4 | MRI-ESM2-0 | Meteorological Research Institute (MRI), Japan | ||
| 5 | MIROC6 | Japanese consortium led by the University of Tokyo, JAMSTEC, and NIES | ||
| 6 | BCC-CSM2-MR | Centro Euro-Mediterraneo sui Cambiamenti Climatici (CMCC), Italy | ||
| 7 | GISS-E2-1-G | NASA Goddard Institute for Space Studies (GISS), USA | ||
| 8 | UKEMS1-0-LL | UK Earth System Model team (UK Met Office and partners) | ||
| 9 | CMCC-ESM2 | Centro Euro-Mediterraneo sui Cambiamenti Climatici (CMCC), Italy | ||
| 10 | EC-Earth3-Veg-LR | Consortium of European research institutions | ||
| 11 | INM-CM5-LR | Institute of Numerical Mathematics, Russia | ||
| 12 | IPSL-CM6A-LR | Institut Pierre-Simon Laplace (IPSL), France |
| No | Gauge Station | Coordinates | Period |
|---|---|---|---|
| 1 | Brumbung | −7.01911, 110.51725 | 1991–2014 |
| 2 | Bungo | −6.77567, 110.62782 | 1991–2014 |
| 3 | Jatisono | −6.92023, 110.71170 | 1991–2014 |
| Brumbung | Bungo | Jatisono | ||||||
|---|---|---|---|---|---|---|---|---|
| Model | SU | Rank | Model | SU | Rank | Model | SU | Rank |
| IPSL | 0.87 | 1 | MIROC6 | 0.85 | 1 | IPSL | 0.83 | 1 |
| EC-EARTH | 0.85 | 2 | EC-EARTH | 0.85 | 2 | MIROC6 | 0.76 | 2 |
| BCC | 0.85 | 3 | BCC | 0.81 | 3 | MPI | 0.74 | 3 |
| MIROC6 | 0.82 | 4 | IPSL | 0.79 | 4 | EC-EARTH | 0.74 | 4 |
| ACCESS | 0.81 | 5 | MPI | 0.76 | 5 | MRI | 0.72 | 5 |
| MRI | 0.8 | 6 | MRI | 0.75 | 6 | BCC | 0.72 | 6 |
| MPI | 0.8 | 7 | ACCESS | 0.72 | 7 | ACCESS | 0.71 | 7 |
| GISS | 0.34 | 8 | INM-CM5 | 0.29 | 8 | GISS | 0.37 | 8 |
| INM-CM5 | 0.32 | 9 | GISS | 0.28 | 9 | INM-CM5 | 0.36 | 9 |
| CMCC | 0.29 | 10 | CMCC | 0.18 | 10 | CMCC | 0.3 | 10 |
| UKEMS | 0.03 | 11 | HADGEM | 0 | 11 | HADGEM | 0 | 11 |
| HADGEM | 0.01 | 12 | UKEMS | 0 | 12 | UKEMS | 0 | 12 |
| Model | Brumbung | Bungo | Jatisono | Average Rank | Rating Metric | Overall Rank |
|---|---|---|---|---|---|---|
| IPSL | 1 | 4 | 1 | 2 | 0.83 | 1 |
| MIROC6 | 4 | 1 | 2 | 2.33 | 0.81 | 2 |
| EC-EARTH | 2 | 2 | 4 | 2.67 | 0.78 | 3 |
| BCC | 3 | 3 | 6 | 4 | 0.67 | 4 |
| MPI | 7 | 5 | 3 | 5 | 0.58 | 5 |
| MRI | 6 | 6 | 5 | 5.67 | 0.53 | 6 |
| ACCESS | 5 | 7 | 7 | 6.33 | 0.47 | 7 |
| GISS | 8 | 9 | 8 | 8.33 | 0.31 | 8 |
| INM-CM5 | 9 | 8 | 9 | 8.67 | 0.28 | 9 |
| CMCC | 10 | 10 | 10 | 10 | 0.17 | 10 |
| HADGEM | 12 | 11 | 11 | 11.33 | 0.06 | 11 |
| UKEMS | 11 | 12 | 12 | 11.67 | 0.03 | 12 |
| Variable | Multicollinearity Analysis | |
|---|---|---|
| Variance Inflation Factor (VIF) | Tolerance | |
| ELEVATION | 2.873 | 0.348 |
| SLOPE | 2.151 | 0.465 |
| ASPECT | 1.075 | 0.930 |
| CURVATURE | 1.467 | 0.681 |
| TWI | 3.264 | 0.306 |
| DTRiver | 1.310 | 0.763 |
| DTRoad | 1.104 | 0.906 |
| LULC | 1.671 | 0.599 |
| NDVI | 1.647 | 0.607 |
| PRECIPITAT | 1.522 | 0.657 |
| SPI | 3.553 | 0.281 |
| SOIL | 1.097 | 0.912 |
| NDSI | 2.002 | 0.499 |
| HAND | 2.490 | 0.402 |
| Model | Stage | Criteria | ||||
|---|---|---|---|---|---|---|
| Sensitivity | Specificity | PPV | NPV | AUC | ||
| MLP-NN | Train | 0.9531 | 0.8873 | 0.8841 | 0.9545 | 0.9618 |
| Test | 0.7843 | 0.8718 | 0.8889 | 0.7556 | 0.9105 | |
| Random Forest | Train | 0.9725 | 0.9718 | 0.9697 | 0.9602 | 0.9862 |
| Test | 0.8039 | 0.8718 | 0.8913 | 0.7727 | 0.9286 | |
| SVM | Train | 0.9219 | 0.8028 | 0.8082 | 0.9194 | 0.9291 |
| Test | 0.7451 | 0.8718 | 0.8837 | 0.7234 | 0.9236 | |
| XGBoost | Train | 0.9801 | 0.9648 | 0.9624 | 0.985 | 0.9877 |
| Test | 0.8824 | 0.8718 | 0.9000 | 0.85 | 0.9291 | |
| Models | AUROC | Standard Error | Asymptotic Sig. | Asymptotic 95% Confidence Interval | |
|---|---|---|---|---|---|
| Lower Bound | Upper Bound | ||||
| MLP-NN | 0.9105 | 0.0135 | 0.0000 | 0.8841 | 0.9369 |
| Random Forest | 0.9286 | 0.0121 | 0.0000 | 0.9048 | 0.9524 |
| SVM | 0.9236 | 0.0125 | 0.0000 | 0.899 | 0.9481 |
| XGBoost | 0.9291 | 0.0121 | 0.0000 | 0.9054 | 0.9528 |
| Model | Accuracy | Precision | Recall | F1 Score | Cohen’s Kappa |
|---|---|---|---|---|---|
| MLP-NN | 0.822 | 0.889 | 0.784 | 0.833 | 0.644 |
| Random Forest | 0.833 | 0.891 | 0.804 | 0.845 | 0.666 |
| SVM | 0.800 | 0.884 | 0.745 | 0.809 | 0.602 |
| XGBoost | 0.878 | 0.9 | 0.882 | 0.891 | 0.752 |
| Class | Models | |||
|---|---|---|---|---|
| MLP-NN | Random Forest | SVM | XGBoost | |
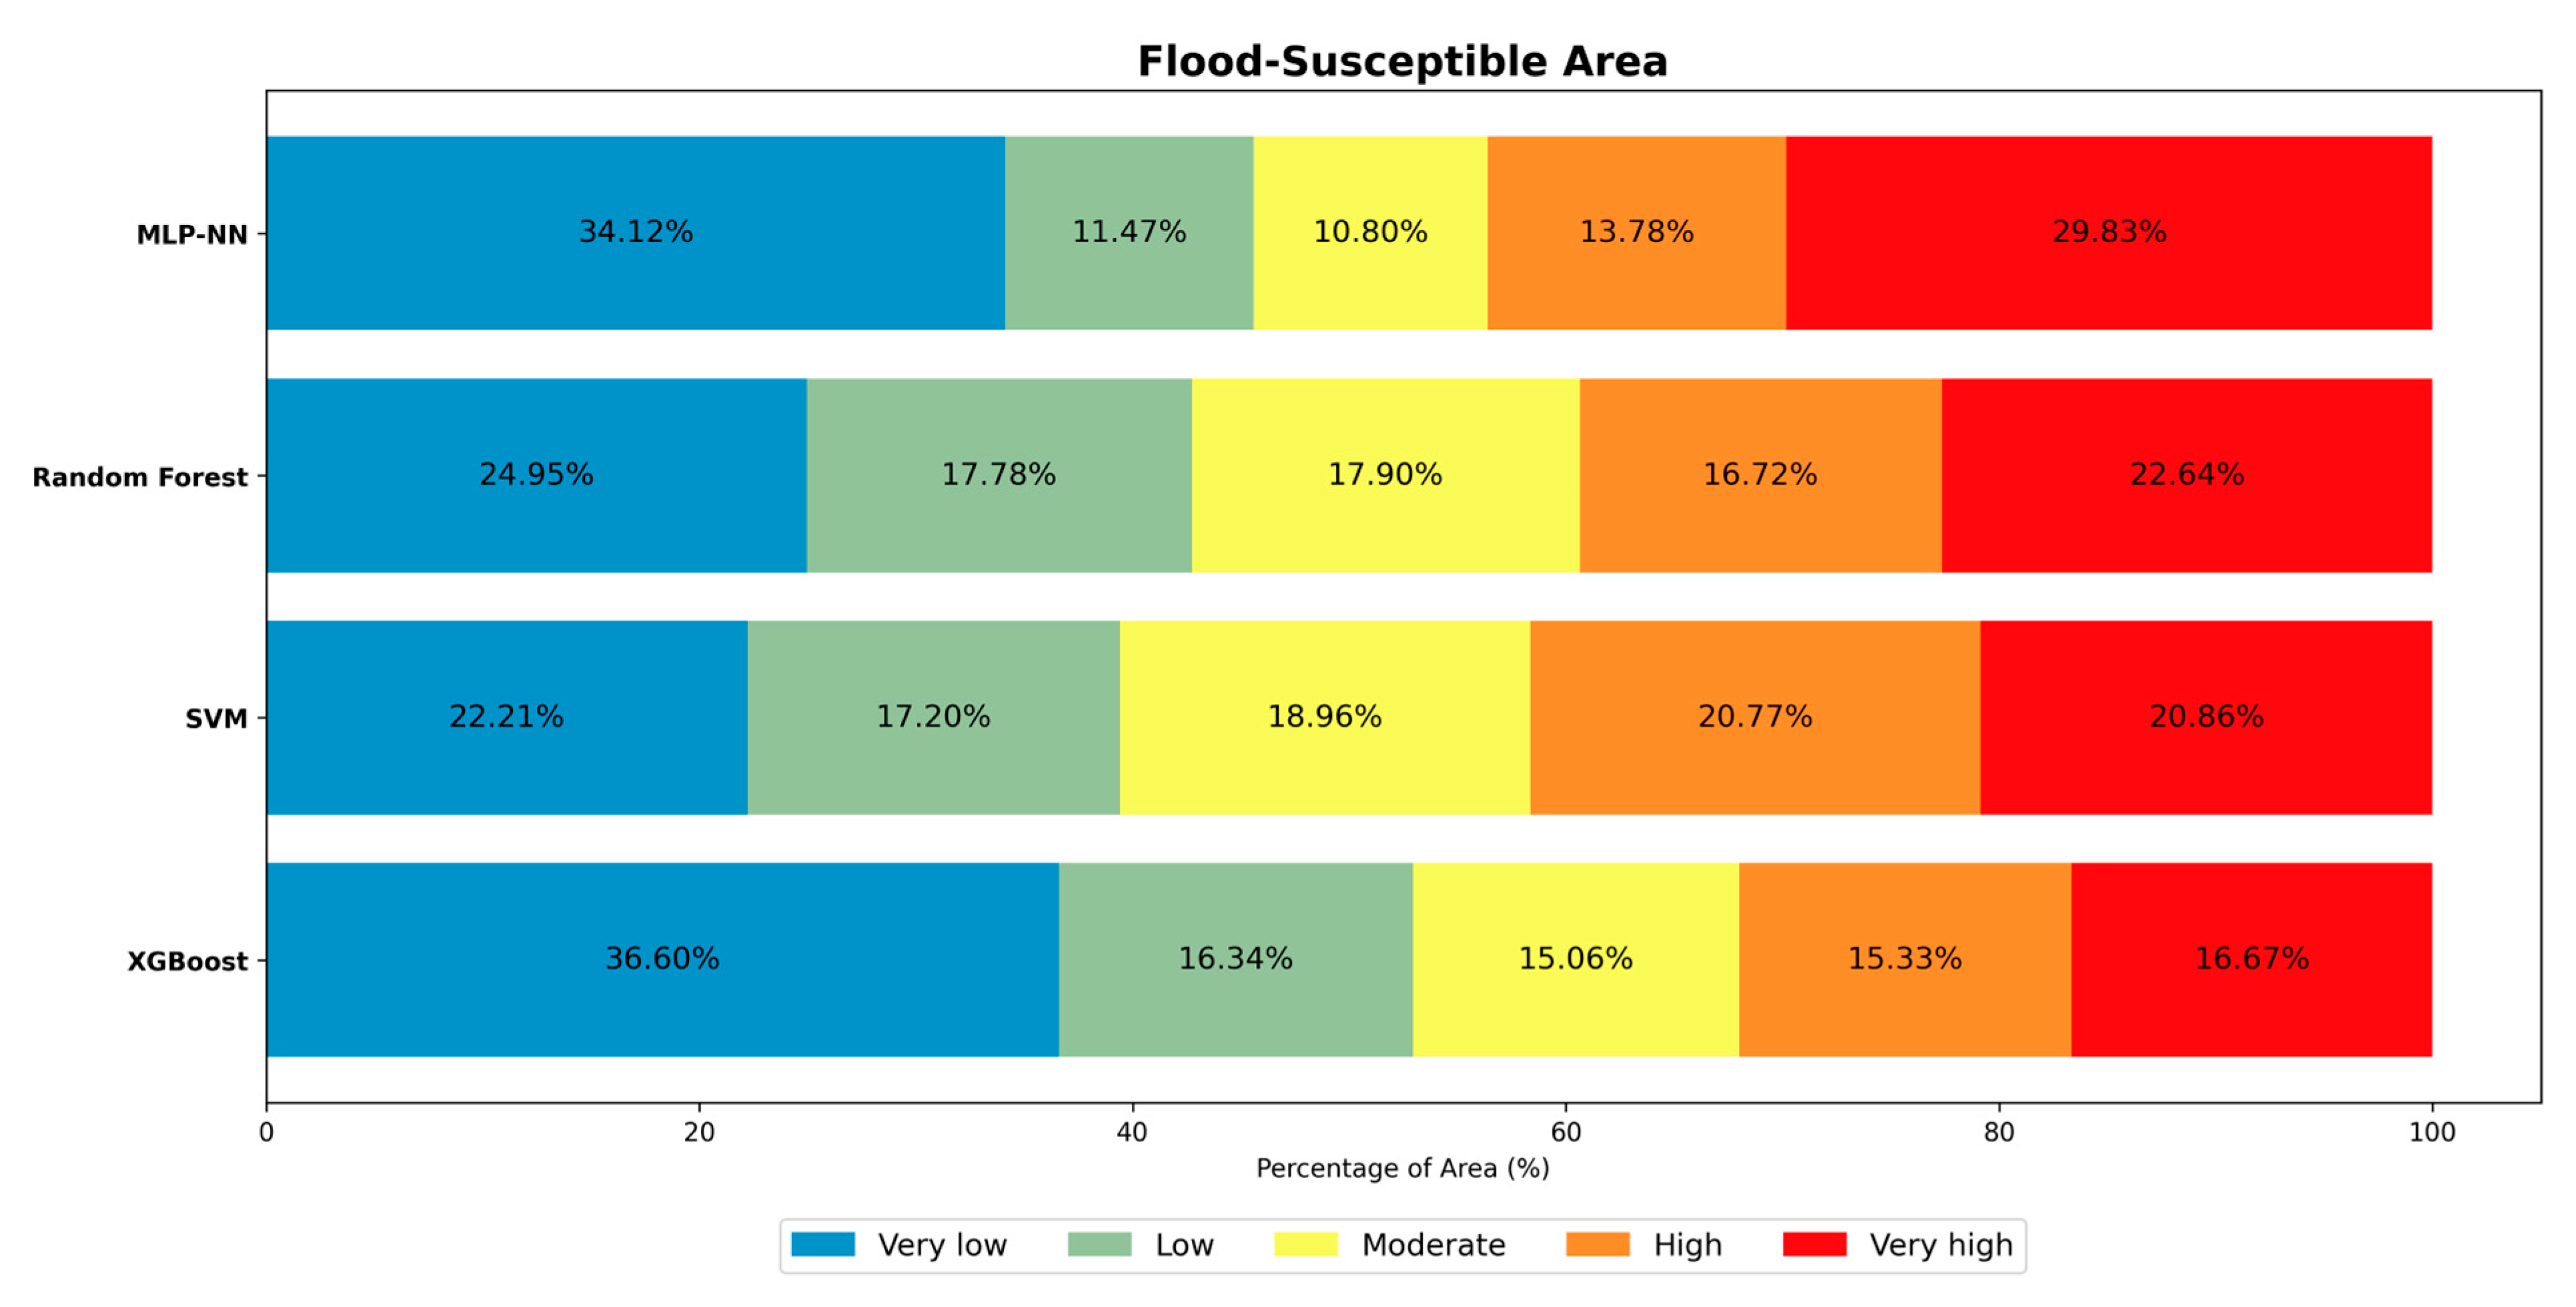
| Very Low | 316.2 | 233.43 | 208.64 | 343.36 |
| Low | 106.3 | 166.37 | 161.73 | 153.29 |
| Moderate | 100.25 | 167.1 | 177.83 | 141.27 |
| High | 127.93 | 156.49 | 194.57 | 143.75 |
| Very High | 276.12 | 211.42 | 195.78 | 156.35 |
| Gauge Station | ||||
|---|---|---|---|---|
| Brumbung | 0.99 | 0.91 | 31.1 | 0.98 |
| Bungo | 0.98 | 0.92 | 52.7 | 0.98 |
| Jatisono | 0.99 | 0.80 | 55.63 | 0.96 |
| Periods | Maximum | Minimum | Average | ||||||
|---|---|---|---|---|---|---|---|---|---|
| SSP126 | SSP245 | SSP585 | SSP126 | SSP245 | SSP585 | SSP126 | SSP245 | SSP585 | |
| 2021–2040 | 2588 | 2592 | 2561 | 2112 | 2109 | 2077 | 2299 | 2300 | 2268 |
| 2041–2060 | 2635 | 2619 | 2646 | 2140 | 2127 | 2157 | 2333 | 2321 | 2349 |
| 2061–2080 | 2628 | 2662 | 2701 | 2150 | 2158 | 2201 | 2338 | 2356 | 2398 |
| 2081–2100 | 2652 | 2694 | 2761 | 2153 | 2191 | 2263 | 2351 | 2388 | 2462 |
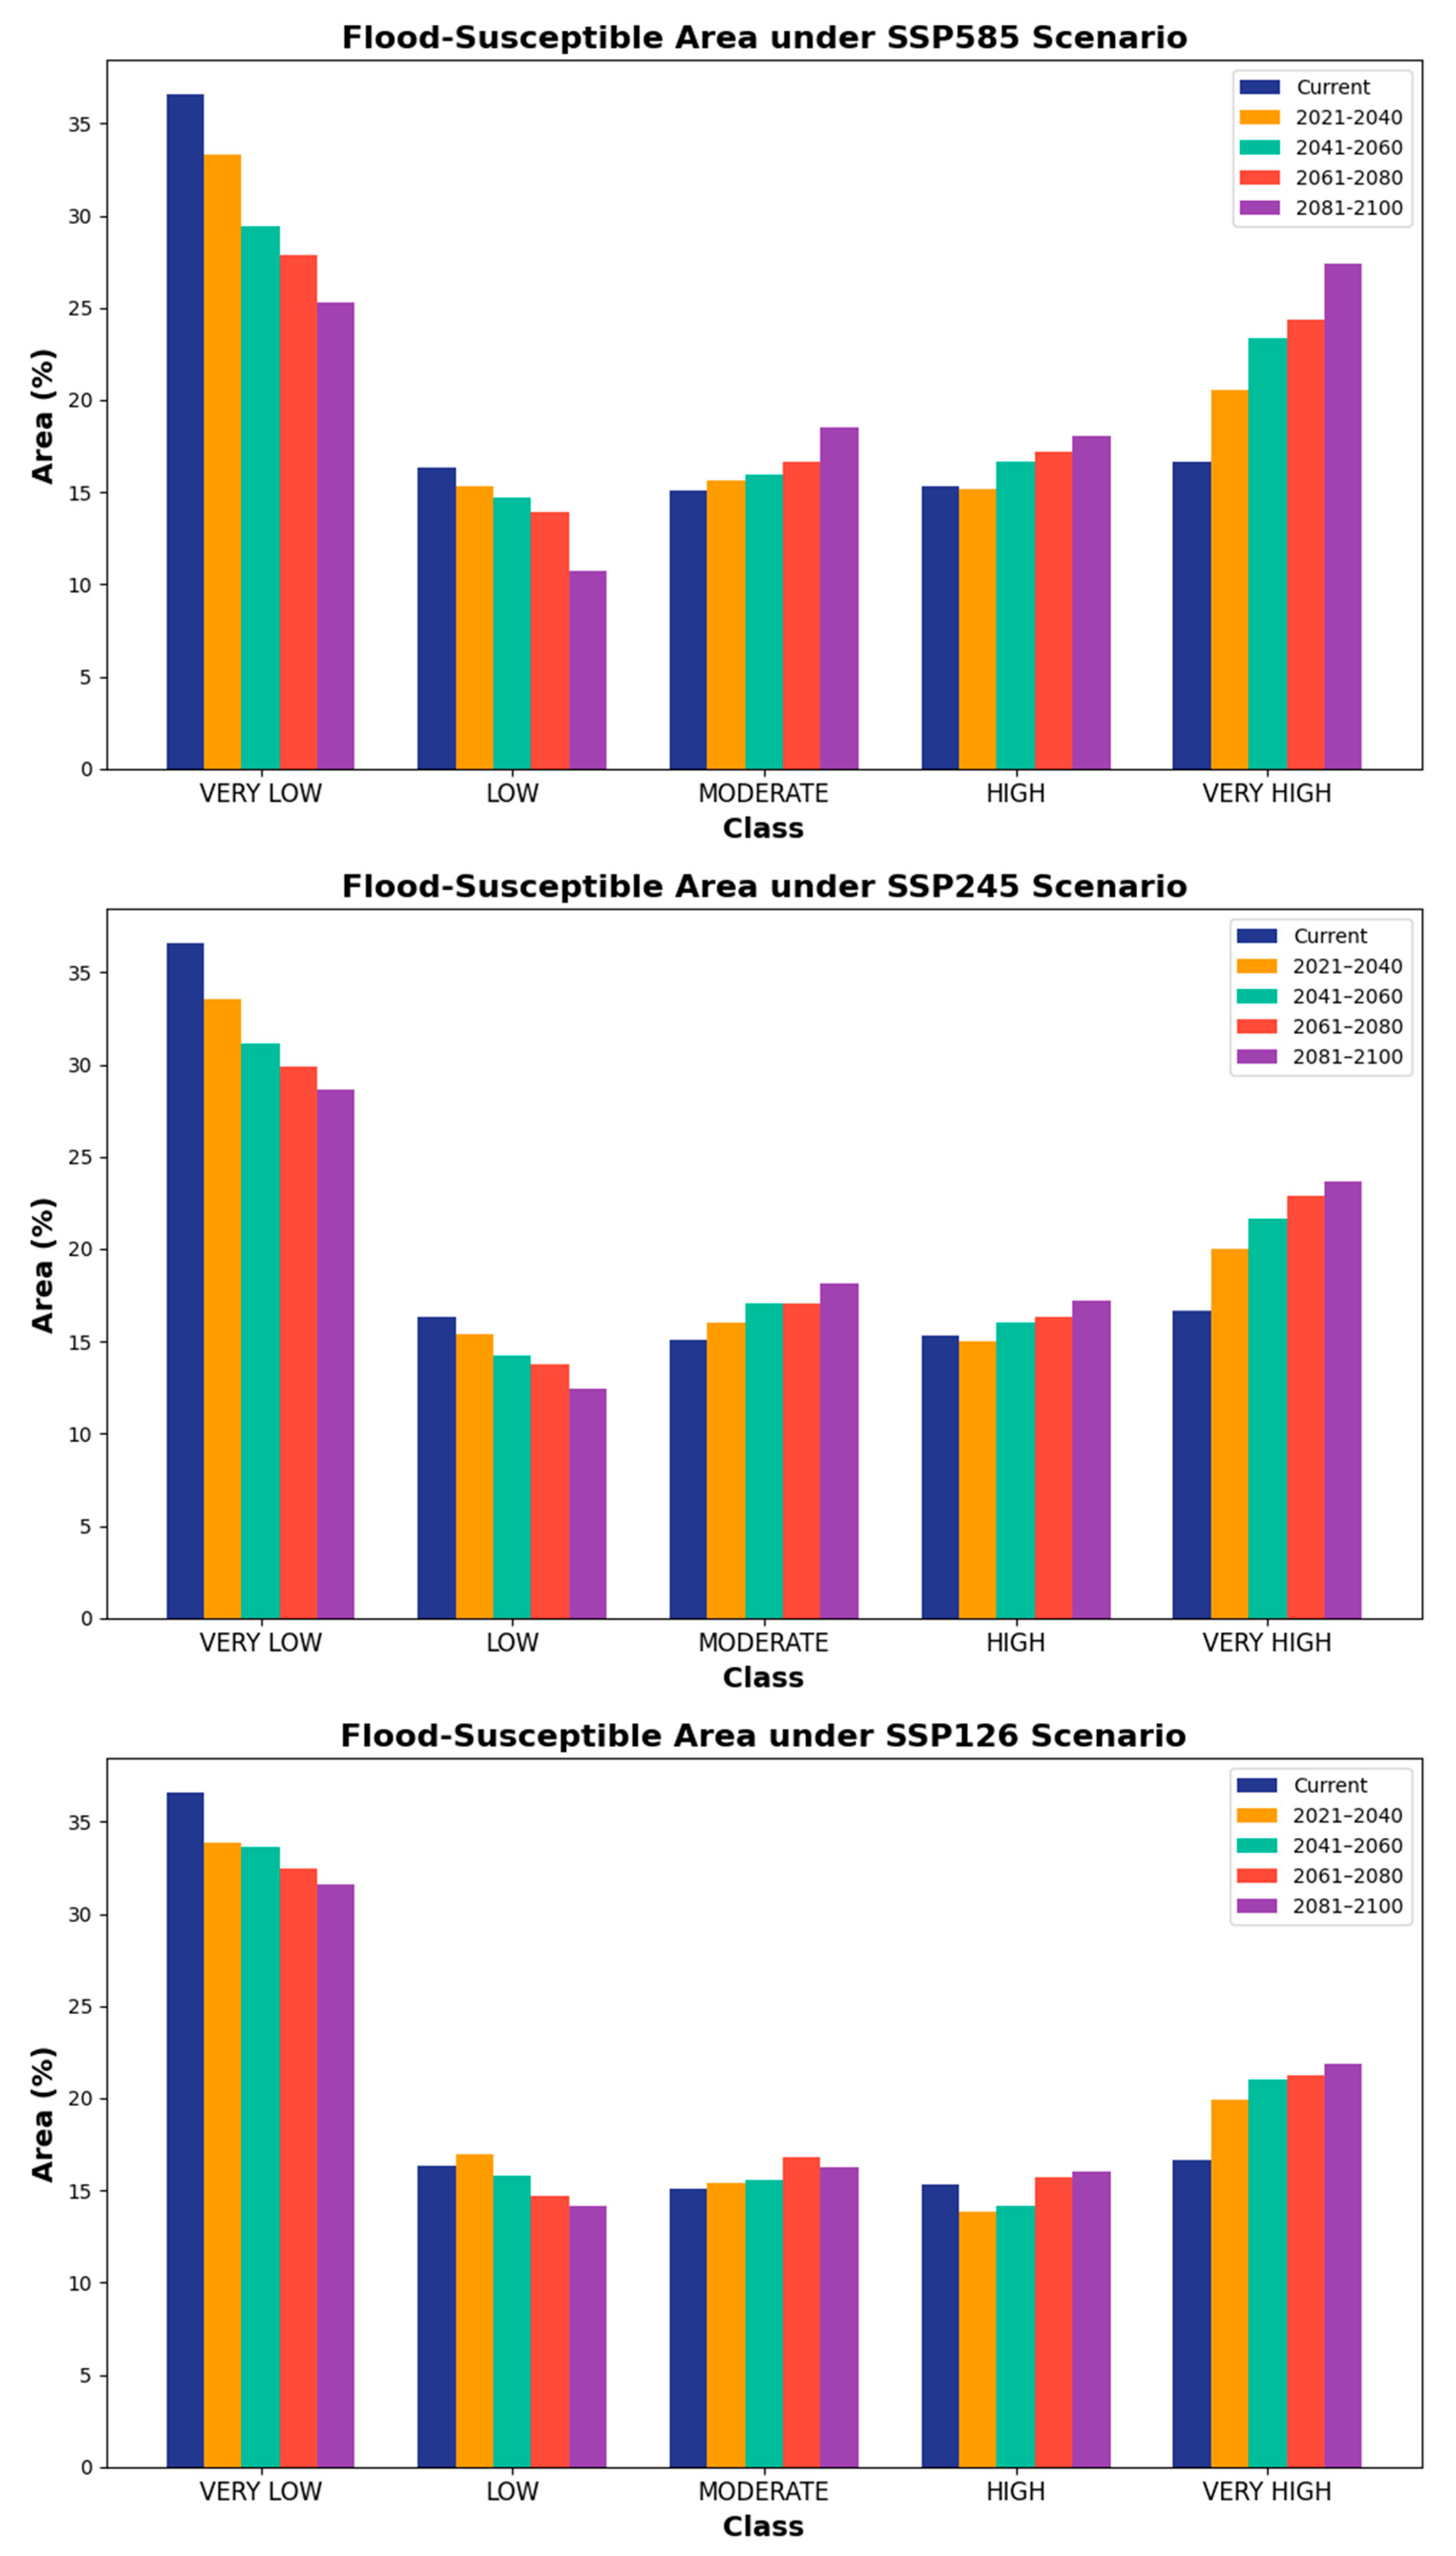
| Class | Current | 2021–2040 | 2041–2060 | 2061–2080 | 2081–2100 |
|---|---|---|---|---|---|
| Very Low | 36.6 | 33.84 | 33.6 | 32.47 | 31.64 |
| Low | 16.34 | 16.95 | 15.77 | 14.7 | 14.17 |
| Moderate | 15.06 | 15.42 | 15.54 | 16.83 | 16.25 |
| High | 15.33 | 13.85 | 14.17 | 15.72 | 16.06 |
| Very High | 16.67 | 19.94 | 20.98 | 21.28 | 21.88 |
| Class | Current | 2021–2040 | 2041–2060 | 2061–2080 | 2081–2100 |
|---|---|---|---|---|---|
| Very Low | 36.6 | 33.54 | 31.14 | 29.92 | 28.61 |
| Low | 16.34 | 15.38 | 14.26 | 13.79 | 12.47 |
| Moderate | 15.06 | 16.05 | 17.00 | 17.03 | 18.11 |
| High | 15.33 | 15.01 | 16.00 | 16.37 | 17.19 |
| Very High | 16.67 | 20.02 | 21.63 | 22.89 | 23.62 |
| Class | Current | 2021–2040 | 2041–2060 | 2061–2080 | 2081–2100 |
|---|---|---|---|---|---|
| Very Low | 36.6 | 33.3 | 29.45 | 27.85 | 25.32 |
| Low | 16.34 | 15.32 | 14.72 | 13.95 | 10.71 |
| Moderate | 15.06 | 15.63 | 15.96 | 16.63 | 18.53 |
| High | 15.33 | 15.2 | 16.62 | 17.21 | 18.01 |
| Very High | 16.67 | 20.55 | 23.33 | 24.36 | 27.43 |
| CLASSES | SSP1-2.6 | SSP2-4.5 | SSP5-8.5 | ||||||
|---|---|---|---|---|---|---|---|---|---|
| (Expected Temp. Rise 1.8 °C) | (Expected Temp. Rise 2.7 °C) | (Expected Temp. Rise 4.4 °C) | |||||||
| (2041–2060) − (2021–2040) | (2061–2080) − (2041–2060) | (2081–2100) − (2061–2080) | (2041–2060) − (2021–2040) | (2061–2080) − (2041–2060) | (2081–2100) − (2061–2080) | (2041–2060) − (2021–2040) | (2061–2080) − (2041–2060) | (2081–2100) − (2061–2080) | |
| VERY LOW | −0.24 | −1.13 | −0.83 | −2.4 | −1.22 | −1.31 | −3.85 | −1.60 | −2.53 |
| LOW | −1.18 | −1.07 | −0.53 | −1.12 | −0.47 | −1.32 | −0.60 | −0.77 | −3.24 |
| MODERATE | 0.12 | 1.29 | −0.58 | 0.95 | 0.03 | 1.08 | 0.33 | 0.67 | 1.90 |
| HIGH | 0.32 | 1.55 | 0.34 | 0.99 | 0.37 | 0.82 | 1.42 | 0.59 | 0.80 |
| VERY HIGH | 1.04 | 0.30 | 0.60 | 1.61 | 1.26 | 0.73 | 2.78 | 1.03 | 3.07 |
| CLASSES | 2021–2040 | 2041–2060 | 2061–2080 | 2081–2100 | ||||
|---|---|---|---|---|---|---|---|---|
| SSP245 − SSP126 | SSP585 − SSP245 | SSP245 − SSP126 | SSP585 − SSP245 | SSP245 − SSP126 | SSP585 − SSP245 | SSP245 − SSP126 | SSP585 − SSP245 | |
| VERY LOW | −0.30 | −0.24 | −2.46 | −1.69 | −2.55 | −2.07 | −3.03 | −3.29 |
| LOW | −1.57 | −0.06 | −1.51 | 0.46 | −0.91 | 0.16 | −1.70 | −1.76 |
| MODERATE | 0.63 | −0.42 | 1.46 | −1.04 | 0.20 | −0.40 | 1.86 | 0.42 |
| HIGH | 1.16 | 0.19 | 1.83 | 0.62 | 0.65 | 0.84 | 1.13 | 0.82 |
| VERY HIGH | 0.08 | 0.53 | 0.65 | 1.70 | 1.61 | 1.47 | 1.74 | 3.81 |
| Scenario | Current Area (%) | Projected Area (%) | Change (%) |
|---|---|---|---|
| SSP1-2.6 | 16.67 | 21.88 | +5.21 |
| SSP2-4.5 | 16.67 | 23.62 | +6.95 |
| SSP5-8.5 | 16.67 | 27.43 | +10.76 |
Disclaimer/Publisher’s Note: The statements, opinions and data contained in all publications are solely those of the individual author(s) and contributor(s) and not of MDPI and/or the editor(s). MDPI and/or the editor(s) disclaim responsibility for any injury to people or property resulting from any ideas, methods, instructions or products referred to in the content. |
© 2025 by the authors. Licensee MDPI, Basel, Switzerland. This article is an open access article distributed under the terms and conditions of the Creative Commons Attribution (CC BY) license (https://creativecommons.org/licenses/by/4.0/).
Share and Cite
Verdyansyah, A.; Chang, Y.-L.; Wang, F.-C.; Tsai, F.; Lin, T.-H. Integrating CMIP6 and Remote Sensing Datasets for Current and Future Flood Susceptibility Projections Using Machine Learning Under Climate Change Scenarios in Demak District for Future Sustainable Planning. Sustainability 2025, 17, 8188. https://doi.org/10.3390/su17188188
Verdyansyah A, Chang Y-L, Wang F-C, Tsai F, Lin T-H. Integrating CMIP6 and Remote Sensing Datasets for Current and Future Flood Susceptibility Projections Using Machine Learning Under Climate Change Scenarios in Demak District for Future Sustainable Planning. Sustainability. 2025; 17(18):8188. https://doi.org/10.3390/su17188188
Chicago/Turabian StyleVerdyansyah, Aprizal, Yi-Ling Chang, Fu-Cheng Wang, Fuan Tsai, and Tang-Huang Lin. 2025. "Integrating CMIP6 and Remote Sensing Datasets for Current and Future Flood Susceptibility Projections Using Machine Learning Under Climate Change Scenarios in Demak District for Future Sustainable Planning" Sustainability 17, no. 18: 8188. https://doi.org/10.3390/su17188188
APA StyleVerdyansyah, A., Chang, Y.-L., Wang, F.-C., Tsai, F., & Lin, T.-H. (2025). Integrating CMIP6 and Remote Sensing Datasets for Current and Future Flood Susceptibility Projections Using Machine Learning Under Climate Change Scenarios in Demak District for Future Sustainable Planning. Sustainability, 17(18), 8188. https://doi.org/10.3390/su17188188


