Article

Mapping the Transmission of Carbon Emission Responsibility Among Multiple Regions from the Perspective of the Energy Supply Chain: EA-MRIO Method and a Case Study of China

1
State Key Laboratory of Power Systems, Department of Energy and Power Engineering, Tsinghua University, Beijing 100084, China
2
Tsinghua-Rio Tinto Joint Research Centre for Resources, Energy and Sustainable Development, Laboratory for Low Carbon Energy, Tsinghua University, Beijing 100084, China
3
China Electric Power Planning & Engineering Institute, Beijing 100120, China
4
China Electric Power Research Institute, State Grid Corporation of China, Beijing 100192, China
5
School of Management, Guilin University of Aerospace Technology, Guilin 541004, China
6
Institute of Energy, Environment and Economy, Tsinghua University, Beijing 100084, China
*
Author to whom correspondence should be addressed.
Sustainability 2025, 17(18), 8166; https://doi.org/10.3390/su17188166
Submission received: 3 August 2025 / Revised: 25 August 2025 / Accepted: 7 September 2025 / Published: 11 September 2025
(This article belongs to the Section Energy Sustainability)

Abstract

In low-carbon transition policy management, rationally determining the energy-related carbon emission responsibilities (ERCERs) across multiple regions is a fundamental issue. Reasonable allocation must take into account regional heterogeneities, such as energy endowments, economic development levels, industrial structures, and complex interconnections within the multi-regional energy supply chain. Previous studies mostly analyzed it via the multi-regional input–output (MRIO) model on the energy-consumption side, often neglecting the regional distribution of energy production and inter-regional energy transport on the energy-production side. This limitation risks a mismatch between energy policies and economic policies in practical policy governance. To address this gap, this study develops an energy allocation-induced MRIO (EA-MRIO) method integrating energy allocation analysis and an MRIO model to trace ERCER transmissions holistically across the entire energy supply chain. The framework covers seven stages including energy supply, inter-regional energy transport, direct energy consumption of end-use sectors, inter-regional intermediate products input and output, final products supply, inter-regional final products transport, and final demand, applied to a case study of China’s 31 provinces in 2017. Results show that ERCERs mainly transfer from western and northern regions to eastern and southern coastal areas: ERCERs embodied by energy production in western and northern provinces first flow to northern coastal provinces (main intermediate products producers), then to eastern and southern coastal provinces (main final products producers), with 23% ultimately attributed to exports. These findings call for allocating ERCERs based on different subregions’ roles within the national energy–economic system to facilitate more equitable and effective carbon reduction policymaking.

1. Introduction

The latest report from IPCC indicates that global temperatures have risen by 1.1 °C in 2011–2020 than 1850–1900 [1], presenting unprecedented challenges across all countries to sustainable development worldwide. In response to this escalating crisis, many countries have proposed carbon neutrality goals and are actively implementing relevant low-carbon transition actions [2,3]. As carbon neutrality is inherently a global objective and multi-regional shared challenge [4], it necessitates coordinated action and mutual complementarity among regions in setting and achieving emission reduction targets [5].
Given that energy is the primary source of carbon emissions, it serves as the key arena for achieving carbon neutrality [6]. Its low-carbon transition similarly requires multi-regional collaboration. A critical challenge in policy implementation is how to rationally assign energy-related carbon emission responsibilities (ERCERs) to different regions. The significance lies in clarifying who emits, who benefits, and who should bear responsibility. Failure to properly assign ERCERs will overburden energy-producing regions with direct emissions, while leaving demand-driven regions understating their true responsibilities [7]. This misalignment may cause carbon leakage, inequitable burden-sharing, and reduced national policy effectiveness. In countries like China, with marked regional heterogeneity in resource endowments, industrial structures, and economic development, developing a scientifically robust ERCERs allocation framework is particularly urgent [8,9,10]. Without it, regional disparities may worsen in the progress of transition, compromising fairness and efficiency in achieving national carbon neutrality.
However, ERCERs are not static but transmitted across multiple stages along the entire multi-regional energy supply chain and should be jointly assumed by all regions [11,12,13]. Rather than debating which party bears more responsibility, elucidating the transmission process of ERCERs provides a more scientific and equitable basis for allocation [14]. Based on the relative sequence of energy and economic products production and consumption, the energy supply chain consists of an upstream energy-production side and a downstream energy-consumption side. Energy is supplied from the energy-production side, consumed by end-use sectors to produce economic products, and these products ultimately serve the final demand following complex economic activities [15,16]. Specifically, this supply chain comprises four main production and consumption stages: energy production, intermediate product manufacturing (consuming energy), final product supply (consuming intermediate products), and final demands (consuming final products) including investment, final consumption, and import–export. ERCERs accumulate unevenly across these stages and regions, transmitted through intricate inter-regional trade networks.
To trace the transmission of ERCERs, the multi-regional input–output (MRIO) model has become a widely used tool [13,14]. However, previous studies have primarily focused on post-energy production consumption-side links, i.e., direct and indirect energy use in economic activities, often neglecting the spatial distribution of energy production and inter-regional energy trade [14,17,18]. As a result, these analyses fall short in policy implications on energy supply and supporting policies that require the integration of economic and energy dimensions in the context of low-carbon transitions. As the urgency for low-carbon energy transitions grows, it is increasingly important to understand how energy production is distributed across regions and how existing energy trade structures might be adjusted. Regions with concentrated fossil energy exports or imports often bear high carbon emissions and face greater challenges in decarbonization [19]. This calls for the development of a new MRIO-based method that captures the coupling between energy production and economic activities, allowing for the quantified analysis of ERCERs on both energy production and consumption sides.
To bridge this gap, this study proposes an integrated method, called energy allocation-induced multi-regional input–output (EA-MRIO), which combines the energy allocation analysis (EAA), rooted in the energy systems theory [20,21,22,23,24], with the MRIO model. This method allows for the consistent measurement of ERCER transmissions from the energy production side to the consumption side. Unlike previous studies limited to single-region analysis [20,25,26], this method extends to a multi-regional context, enabling the explicit tracing of ERCER flows across regions and sectors.
The purpose of this study is thus to enhance the methodological applicability in practical policymaking by integrating the energy production side into ERCERs accounting and to provide a scientific basis for more equitable and effective policy design, thereby facilitating coordinated low-carbon development across regions. To achieve this, this study first establishes a modeling framework for a multi-regional energy supply chain, comprising seven key stages: energy supply, inter-regional energy transport, direct energy use by end-use sectors, inter-regional intermediate products input and output, final products supply, inter-regional final products transport, and final demand. Second, we develop ERCER measurement formulas for each link. Finally, applying this method and data from 31 provinces and municipalities in China in 2017, a case study is conducted, and the results are visualized through a Sankey diagram to reveal the spatial transmission patterns of ERCERs.
The main contributions of this paper are twofold:
(1) It is the first to incorporate the energy production stage and propose a high-resolution framework for consistently measuring ERCERs across all links of a multi-regional energy supply chain, thereby clarifying regional responsibilities at each stage;
(2) The proposed framework offers a scientific basis for the formulation of more equitable and effective ERCER allocation policies under the carbon neutrality agenda. Especially, through a case study of 31 Chinese provinces in 2017, it demonstrates the spatial transmission of ERCERs and provides evidence for China.

2. Literature Review

The allocation of carbon emission responsibilities has been extensively discussed in the literature, where carbon emissions are primarily calculated based on fossil fuels. To enhance terminological precision, this study refers to such responsibilities as energy-related carbon emission responsibilities (ERCERs). Previous research on the regional allocation of ERCERs were typically based on the perspective of either the product–producer or product–consumer responsibility [27,28,29,30,31,32], focusing on the energy-consumption side, offering useful insights but also presenting limitations. The product–producer perspective adheres to a clear logic that the production of economic products generates emissions, and thus, the product–producing area should bear the corresponding responsibility [33,34]. This perspective emphasizes emission responsibility in regions with energy-intensive industries, while underestimating the driving influence of consumer demand and the phenomenon of “carbon leakage” [35,36]. Conversely, the product–consumer perspective holds that the final consumption region should bear the responsibility, as the produced products flow through the supply chain and ultimately serve to meet the final demands of end consumers [33,34]. This perspective highlights the role of demand-side control but often overlooks direct emissions in production regions and fails to account for the need for fossil fuel reduction in production processes [37].
To overcome these limitations, an increasing number of studies advocate for shared responsibility, distributing emissions along economic product supply chains to balance producer and consumer roles [11,38,39,40,41]. For example, Zhu et al. [41] analyzed the carbon emission responsibility transfers in the global supply chain. In these studies, MRIO models are widely used to trace embodied ERCERs in inter-regional product trade and have been extended to environmental applications (called environmentally extended input–output, EE-MRIO) [42,43,44,45]. They are effective in quantifying the carbon footprints in final demands and analyzing ERCER transfers. However, although these works integrate the perspectives of product–producer and product–consumer, they still focus on the energy-consumption side, calculating ERCERs in direct and embodied energy consumption. Such an approach overlooks key energy-production-side factors, including the sectoral energy structure, spatial distribution of energy production, and inter-regional energy flows, thereby limiting the policy implications for energy production. In addition, these studies lack detailed analyses of ERCERs embodied in both intermediate and final products, as they often focus solely on those embodied in the final demand. Enhancing this level of resolution on the energy-consumption side is necessary to achieve a more comprehensive understanding.
Energy allocation analysis (EAA), based on energy balance sheets, provides a systematic framework of energy flows from energy production to direct energy consumption in end-use sectors [46,47]. A holistic picture of ERCER transmissions on both sides of the energy sully chain can be achieved by combining EAA with the input–output model. This approach has been applied at a single-region level of research. For instance, Chong et al. [20] employed it to track the energy consumption responsibility transfer within China. Furthermore, Zhao et al. [25] incorporated carbon emission factors to trace ERCERs across 28 economic sectors in China. Extending this logic to a multi-regional context enables analysis of ERCER transmissions from energy supply on the energy-production side to final demand on the energy-consumption side, which forms the methodological basis of this study.
In summary, existing studies of multi-regional ERCERs are mainly based on the energy-consumption side, often overlooking the spatial energy supply including energy production and transport. This limitation constrains policy insights into energy production. Moreover, the resolution of regional ERCER transfers along the energy supply chain remains insufficient. Therefore, integrating EAA with MRIO is essential to quantify ERCER transfers across the entire multi-regional energy supply chain. Filling this gap can provide a better understanding of regional ERCER dynamics in the context of sustainable development.

3. Materials and Methods

This section first presents a comprehensive model that illustrates the transfer of ERCERs within an entire multi-regional energy supply chain. Next, we develop the EA-MRIO method and formulate specific measurement equations for ERCERs at each stage. Finally, we select 31 provinces and municipalities of China in 2017 as a case study and input the relevant data.

3.1. Modeling Framework for a Multi-Regional Energy Supply Chain

This study extends the single-region, national-level energy–economic system model into a multi-regional context, as illustrated in Figure 1. The core innovation lies in expanding the MRIO model beyond the energy-consumption side to also encompass the energy-production side. This is achieved by integrating the direct energy consumption of end-use sectors with sector-specific energy structures, while simultaneously tracing the regional origins of these energy inputs. The framework categorizes regions into four hierarchical tiers: Tier 1 (energy supply), Tier 2 (direct energy consumption), Tier 3 (final products supply), and Tier 4 (final demand). This model works as follows: on the energy-production side, energy produced in Tier 1 regions is transported to Tier 2 regions via inter-regional energy trade. On the energy-consumption side, in Tier 2 regions, the energy is directly consumed by end-use sectors to produce intermediate products. Those intermediate products are then processed into the final products output in Tier 3 regions through inter-regional economic input and output activities. Finally, final products are transported to Tier 4 regions to meet their final demand, including consumption and investment or export to foreign regions. ERCERs are represented as carbon sources in Tier 1 regions, direct carbon emissions in Tier 2 regions, and emission responsibilities in Tier 3 and Tier 4 regions. And they are transmitted through energy and economic products transport, from left to right. To ensure both completeness and realism of the energy supply chain, this study considers the international energy trades in the link between Tier 1 and Tier 2 and ERCERs embodied in import products.

3.2. EA-MRIO Method for Measuring ERCERs

After establishing the framework model, there are two main steps of the EA-MRIO method for quantifying ERCERs. First, by extending the row of direct energy consumption and ERCERs of end-use sectors in Tier 2 regions, the EE-MRIO model is employed to formulate the equations tracking ERCER flows on the energy-consumption side. Then, EAA is used to trace the regional energy sources (Tier 1 region) of energy consumed in the Tier 2 region.

3.2.1. Measurement of ERCERs on Energy-Consumption Side

The measurement of ERCERs on the economic side is based on the EE-MRIO model. This model is widely utilized to analyze the intrinsic link among economic sectors across various regions and the impact of regional final demand on different sectors within those regions. By extending the row dedicated to direct energy consumption of various end-use sectors within the traditional MRIO table [48], the flow and transmission of embodied energy (i.e., energy consumption responsibility) throughout complex economic activities can be traced, enabling analysis of the effects of Tier 4 regional final demand on Tier 2 and Tier 3 regions. Furthermore, by incorporating sectoral energy structures and carbon emission coefficients into the emissions accounting process, the direct energy consumption can be converted into ERCERs. Similarly, adding the extended row of ERCERs into the MRIO table enables the quantification of ERCER transmissions.
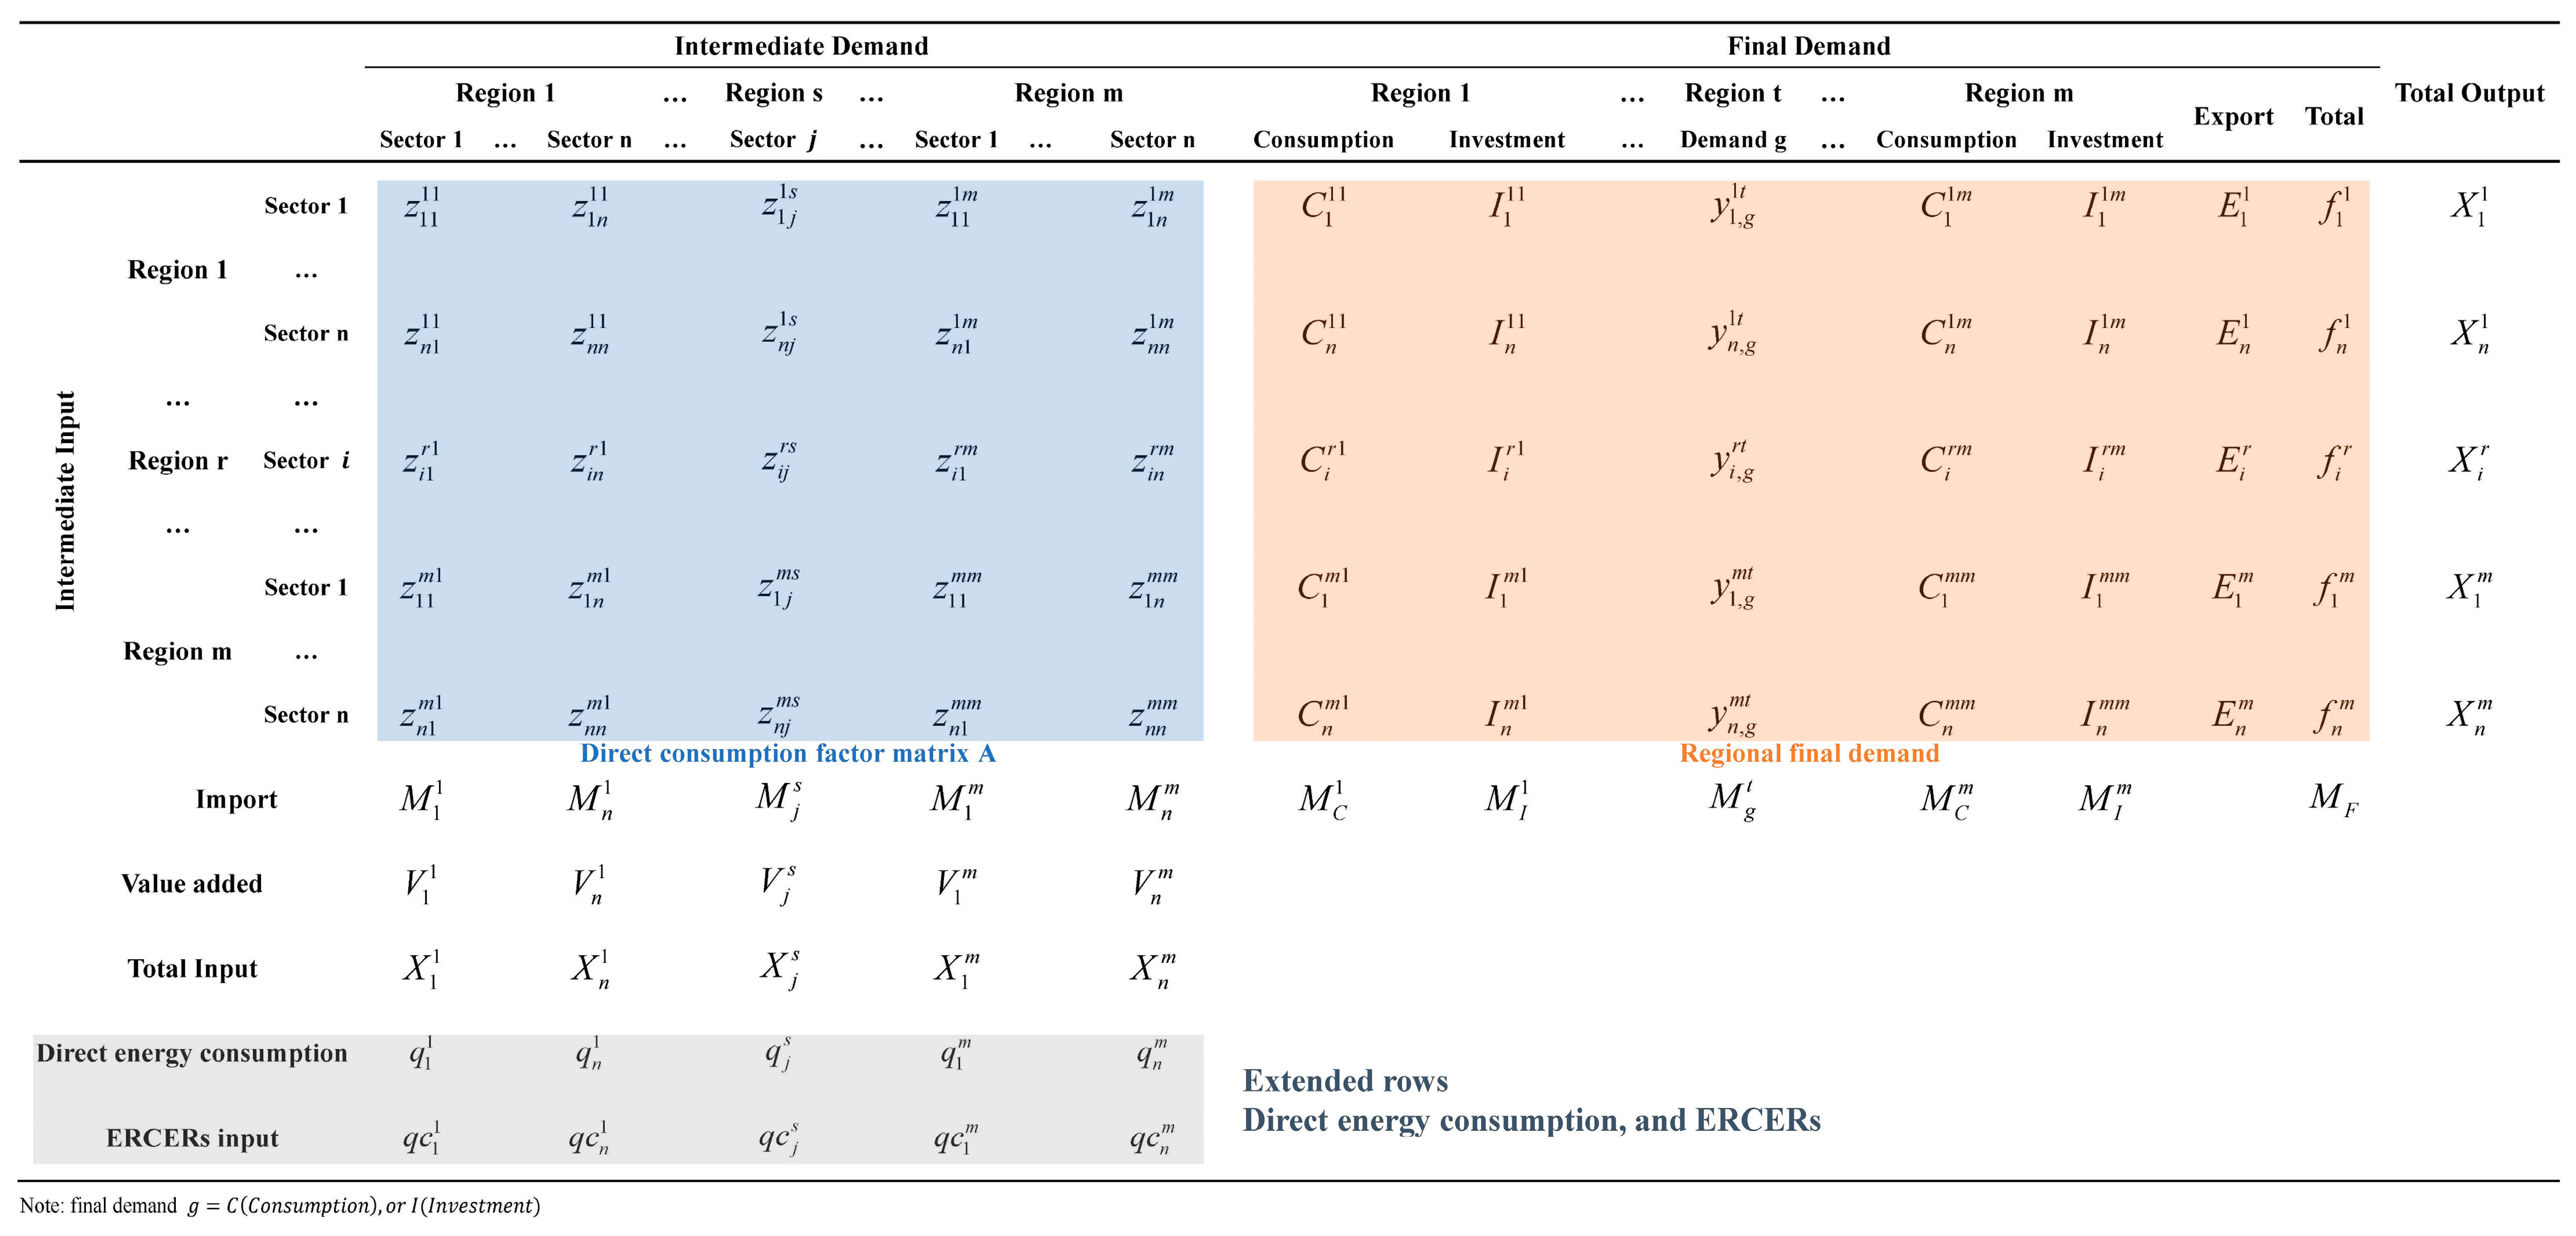
The basic framework of the EE-MRIO model used in this study is shown as Figure 2. Assume that a multi-regional energy supply chain can be divided into m regions, each region has n sectors. Some basic definitions are in Equations (1)–(3), where X (mn × 1) represents the total economic output, I is an mn × mn unit matrix, and F is an mn × 1 final demand vector composed of consumption, investment, and exports. z is an mn × mn intermediate transaction matrix, and A is an mn × mn direct consumption factor matrix. A hat (^) indicates a diagonal matrix. For relevant detailed terminology and methodologies related to input–output analysis, refer to Ref. [49].
X = ( X 1 1 , , X n 1 , , X 1 m , , X n m ) T ,   F = ( f 1 1 , , f n 1 , , f 1 m , , f n m ) T
f i r = s = 1 m ( g y i , g r s ) + E i r = s = 1 m ( C i r s + I i r s ) + E i r
a i j r s = z i j r s / X j s ,   A = a i j r s m n × m n ,   z = z i j r s m n × m n ,   A = z X ^ 1
To link direct energy consumption and ERCERs with economic final demand, first, calculate the vector of direct energy consumption and ERCER coefficients, denoted as e and c, which are composed of coefficients e j s and c j s , respectively:
q j s = p q j , p s ,   q c j s = p q j , p s k p ,   e j s = q j s / X j s ,   c j s = q c j s / X j s
q = e ^ X ,   q c = c ^ X
where q and qc indicate the mn × 1 vector of direct energy consumption and ERCERs separately, p represents different energy varieties, and k is the carbon emission coefficient of each energy variety.
The standard Leontief’s demand-driven MRIO model is Equation (6), where L is an mn × mn Leontief inverse matrix:
X = L F = ( I A ) 1 F = ( I z X ^ 1 ) 1 F
Combining the extended row with the above model, the relationship between direct steel consumption, ERCERs, and final demand can be obtained as the following equation:
q = e ^ X = e ^ L F ,   q c = c ^ X = c ^ L F
The components of this matrix operation equation reveal the flow of energy consumption responsibility and ERCERs, respectively, on the energy-consumption side.

3.2.2. Measurement of ERCERs on Energy-Production Side

The EAA is used to quantify the regional sources of ERCERs on the energy-production side, based on the energy balance sheet. By introducing the inter-regional energy transport coefficient table, as depicted in Table 1, the regional sources (Tier 1 regions) of energy directly consumed by Tier 2 regions can be effectively traced. For energy variety p in region r, there is a balance formula, shown as Equation (8), where Q p r is the total energy supply of region r, λ is the transport factor, and Q p E is the total energy export of all regions.
Q p r = s = 1 m j = 1 n λ p r s q j , p s + Q p E λ p r E ,   r = 1 m λ p r s + λ p M s = 1 ,   r = 1 m λ p r E = 1

3.3. Case Study and Data Input

After establishing the modeling framework for a multi-regional energy supply chain and deriving the corresponding formulas of the EA-MRIO method to measure ERCERs, this study applies these to a case study involving 31 provinces and municipalities in China. Due to the availability of China’s MRIO table, the year 2017 is selected as the research focus. China’s 2017 MRIO table is obtained from the CEADs database [49]. The key to connecting the energy-production side and energy-consumption side lies in the matching of sectors on both sides. To ensure direct energy consumption data matched with official energy statistics, the original 42 economic sectors are aggregated into 6 sectors, and the details about the abbreviations and reclassifications in the MRIO table are in Table A1 and Table A2.
Sectoral direct energy consumption data for the 31 regions (Tier 2 regions) are sourced from the regional energy balance sheets published in the China Energy Statistical Yearbook 2018 [50]. In addition, inter-regional energy transport data from Li et al. [51,52,53] are used as reference allocation weights to guide the spatial distribution of energy inputs across provinces (Tier 1 regions). The relevant inter-regional energy transport coefficient tables are shown in Supplementary Material S1. Energy import and export data are from the yearbook [50]. The ERCERs embodied in import products are estimated based on the assumption that they have the same ERCER coefficients as domestic products.
Carbon emission coefficients for fossil fuels were drawn from the China Energy Statistical Yearbook 2018 [50], as shown in Table 2. Additionally, the carbon emission coefficient for electricity locally supplied within each region was derived from the power generation structure detailed in the 2018 China Electric Power Yearbook [54], while that of the electricity consumed by the economic sectors of each region was weighted based on its electricity source. The calculated results of CO2 emission factors of electricity on the supply and consumption sides are shown in Supplementary Material S2. The detailed data for ERCERs in Tier 3 and Tier 4 regions and the inter-regional products transport are derived from the above data and our method.

4. Results and Discussion

4.1. A Holistic Picture of China’s Multi-Regional ERCER Transmissions in 2017

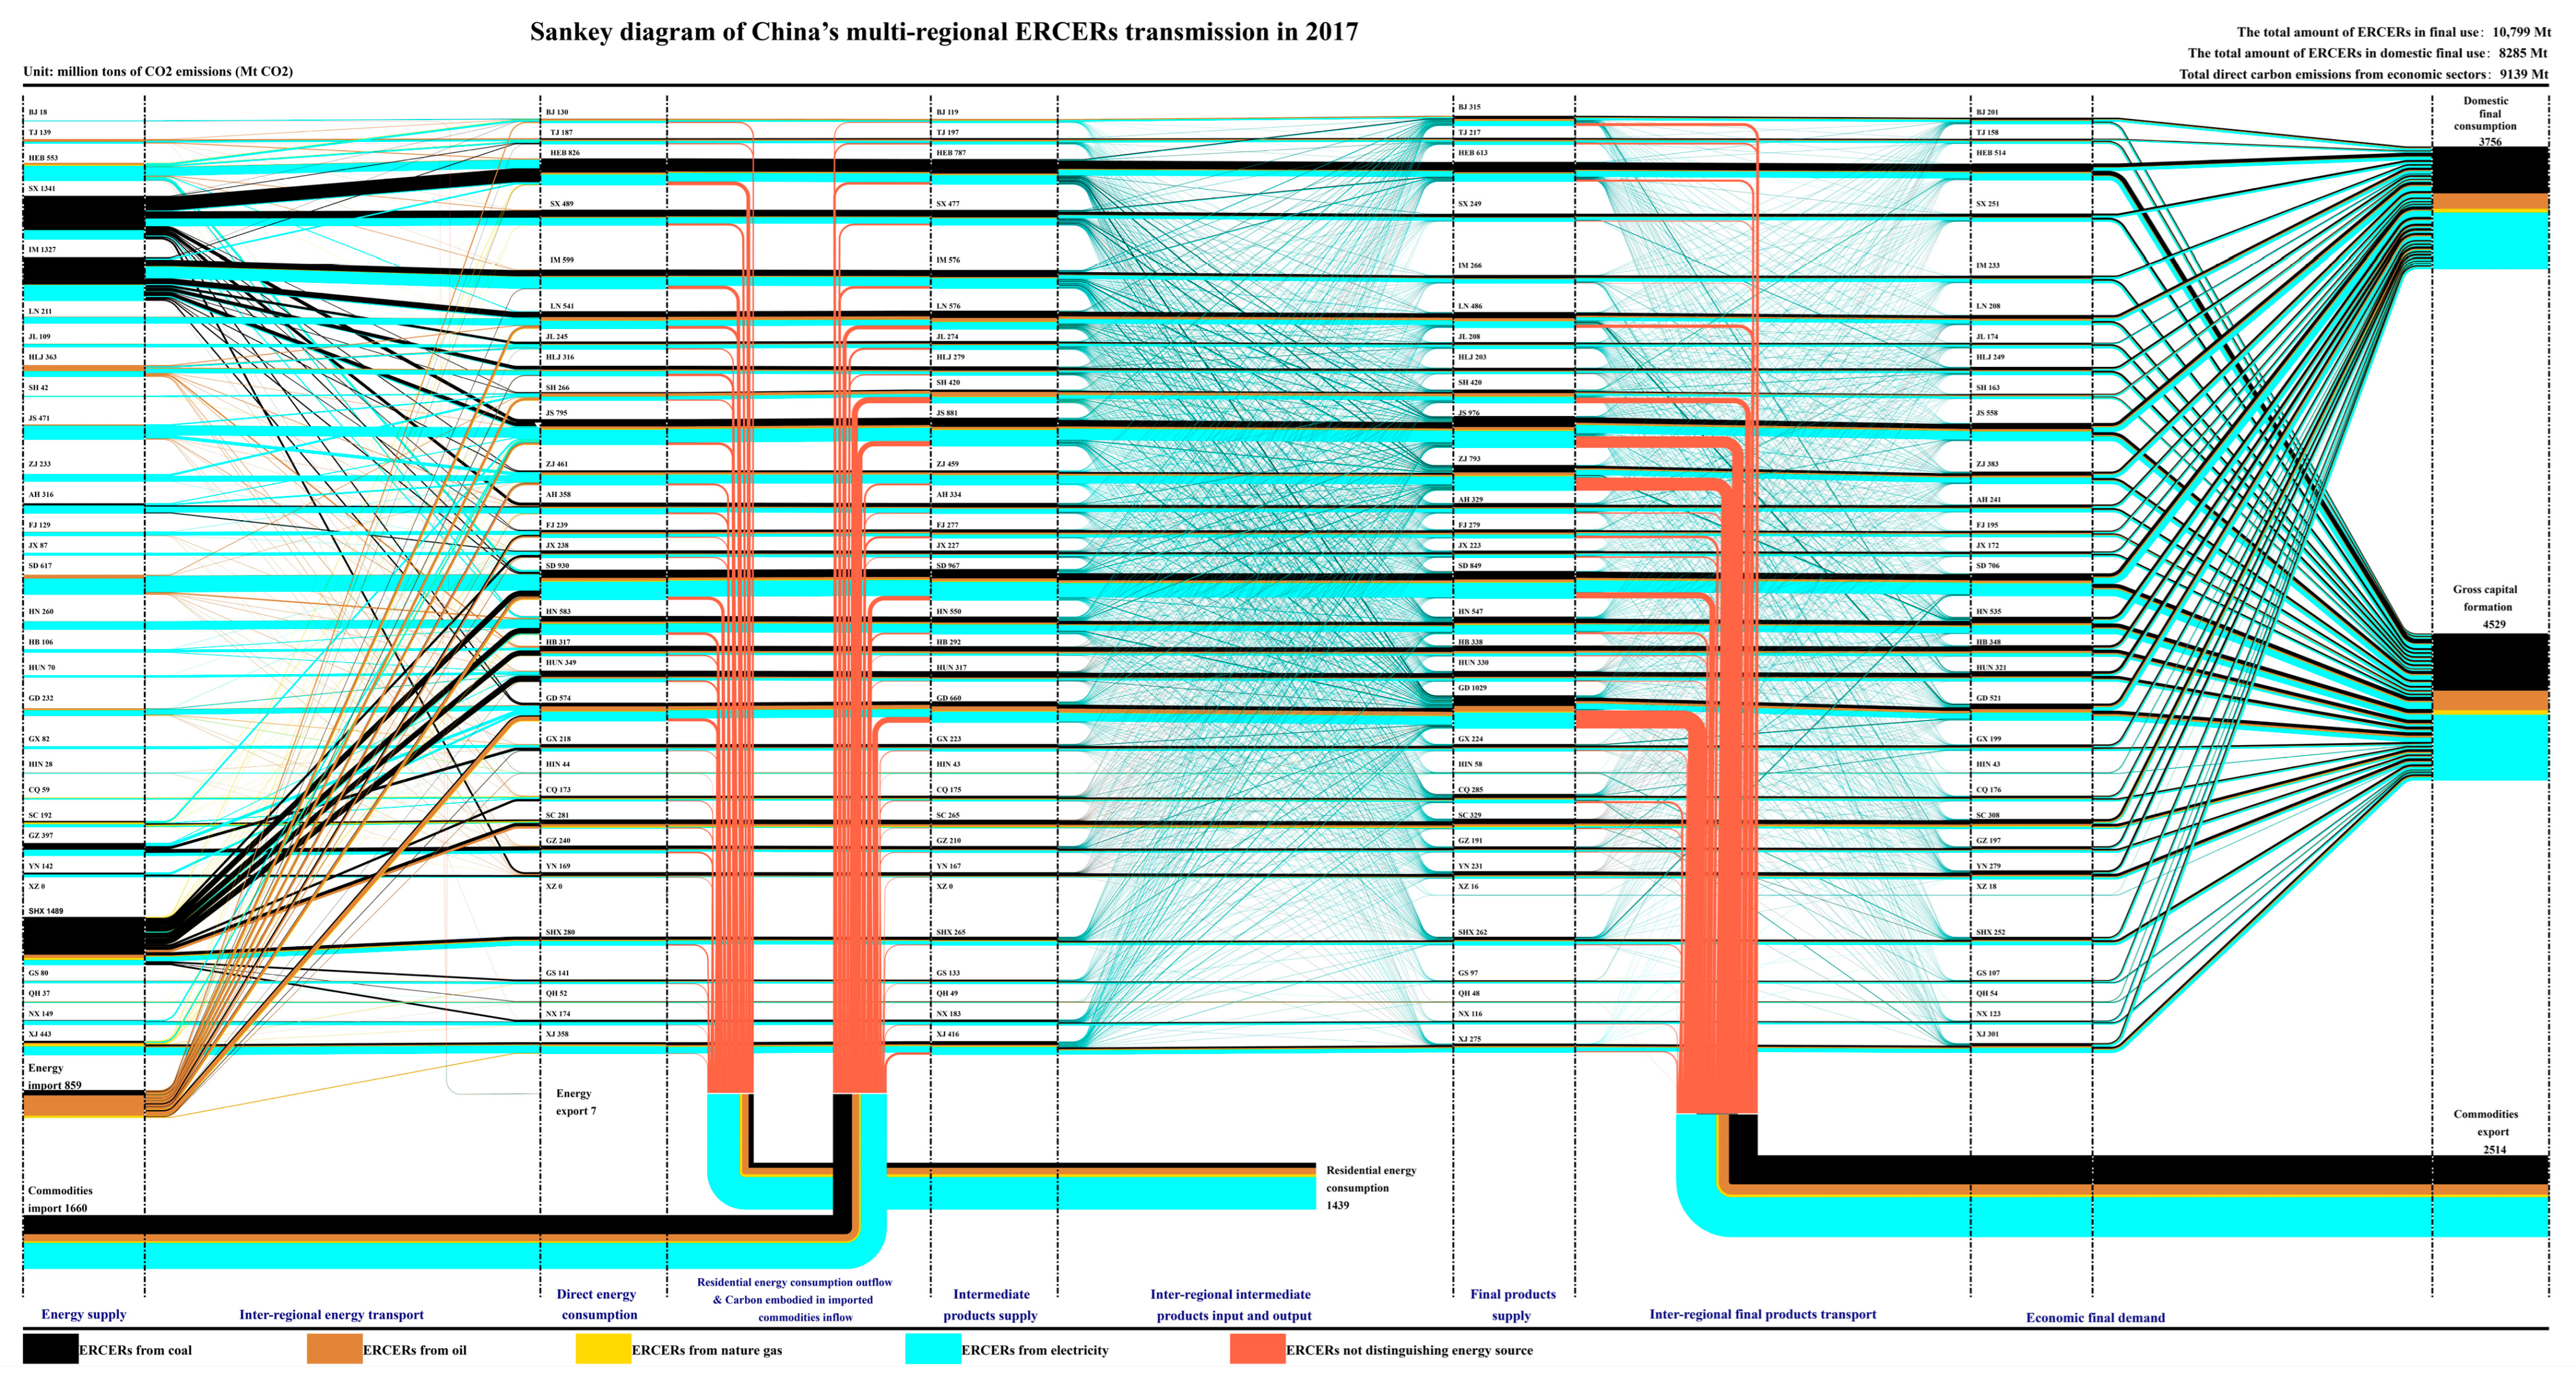
Based on the above method, a Sankey diagram is used to represent the comprehensive flow and transmission of ERCERs across 31 provinces and municipalities in China in 2017, as illustrated in Figure 3. The diagram displayed the ERCERs, depicted in different colors corresponding to various energy sources, flowing sequentially from the regional energy supply to economic final demand, from left to right.
In the energy supply link, the carbon sources of ERCERs embodied in domestic energy supply amount to 9722 Mt (million tons), dominated by coal, whereas those in energy imports total 859 Mt, with oil being the primary component. Overall, there is a discernible pattern where northern regions contribute more than southern regions, a trend closely associated with the distribution of energy resources across the nation. Notably, Shaanxi, Shanxi, and Inner Mongolia are dominant, collectively accounting for about 42.8% of the total domestic energy supply, since they are the primary coal-producing regions in China. In contrast, southern provinces, endowed with abundant hydroelectric resources, generally show lower amounts of carbon sources in their energy supply. Coal and electricity are the main energy carriers, accounting for 55.3% and 35.1%, separately. Considering that 64.7% of electricity is converted from coal [54], the proportion of coal in the primary energy supply is higher.
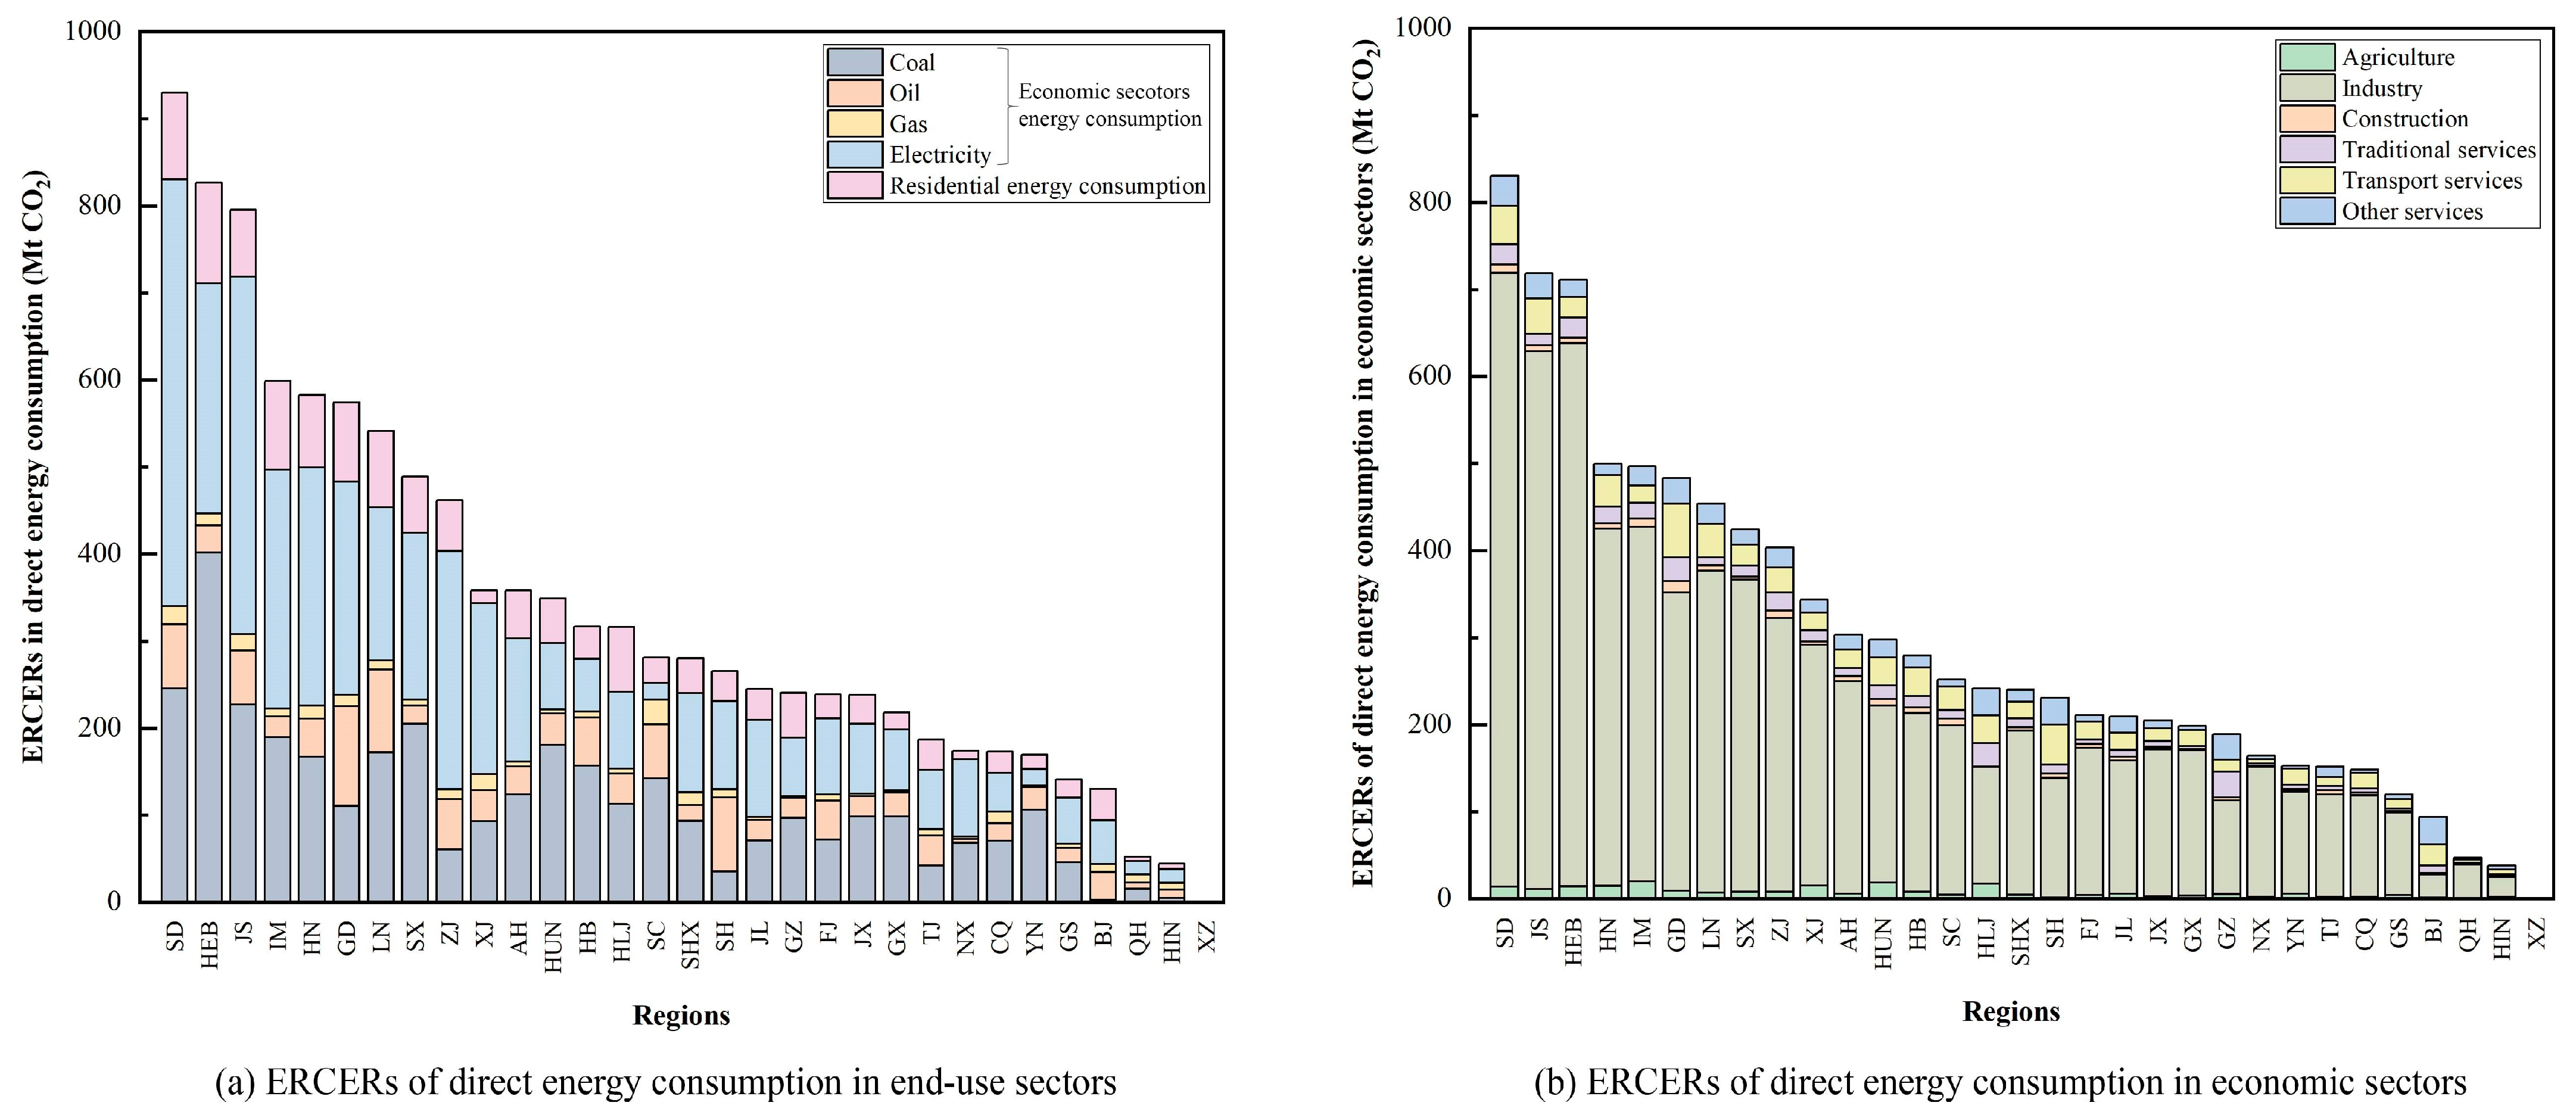
In terms of the direct energy consumption of end-use sectors, the ERCERs are reflected as direct CO2 emissions. End-use sectors emit 10,575.4 Mt of CO2 nationally, among which energy consumption emissions from economic sectors amount to 9138.8 Mt, while those from residential sectors reach 1436.6 Mt, accounting for 13.6%. This notable escalating trend in household energy usage and carbon emissions has become a pressing concern in China’s low-carbon development trajectory [55]. Regional details are presented in Figure 4. Regarding energy sources, electricity consumption in most regions emerges as the primary CO2 emitter, followed closely by coal consumption. Geographically, carbon emissions from energy-related activities within the economic sectors are distinctly concentrated in the eastern regions, such as Shandong, Hebei, and Jiangsu, the primary contributors to direct carbon emissions, located along the eastern coast. As for sectoral distribution, ERCERs from the industrial sector total 7184.3 Mt, significantly exceeding those from other sectors. Our previous work provides the comprehensive analyses of direct energy consumption of end-use sectors across various regions in China [26].
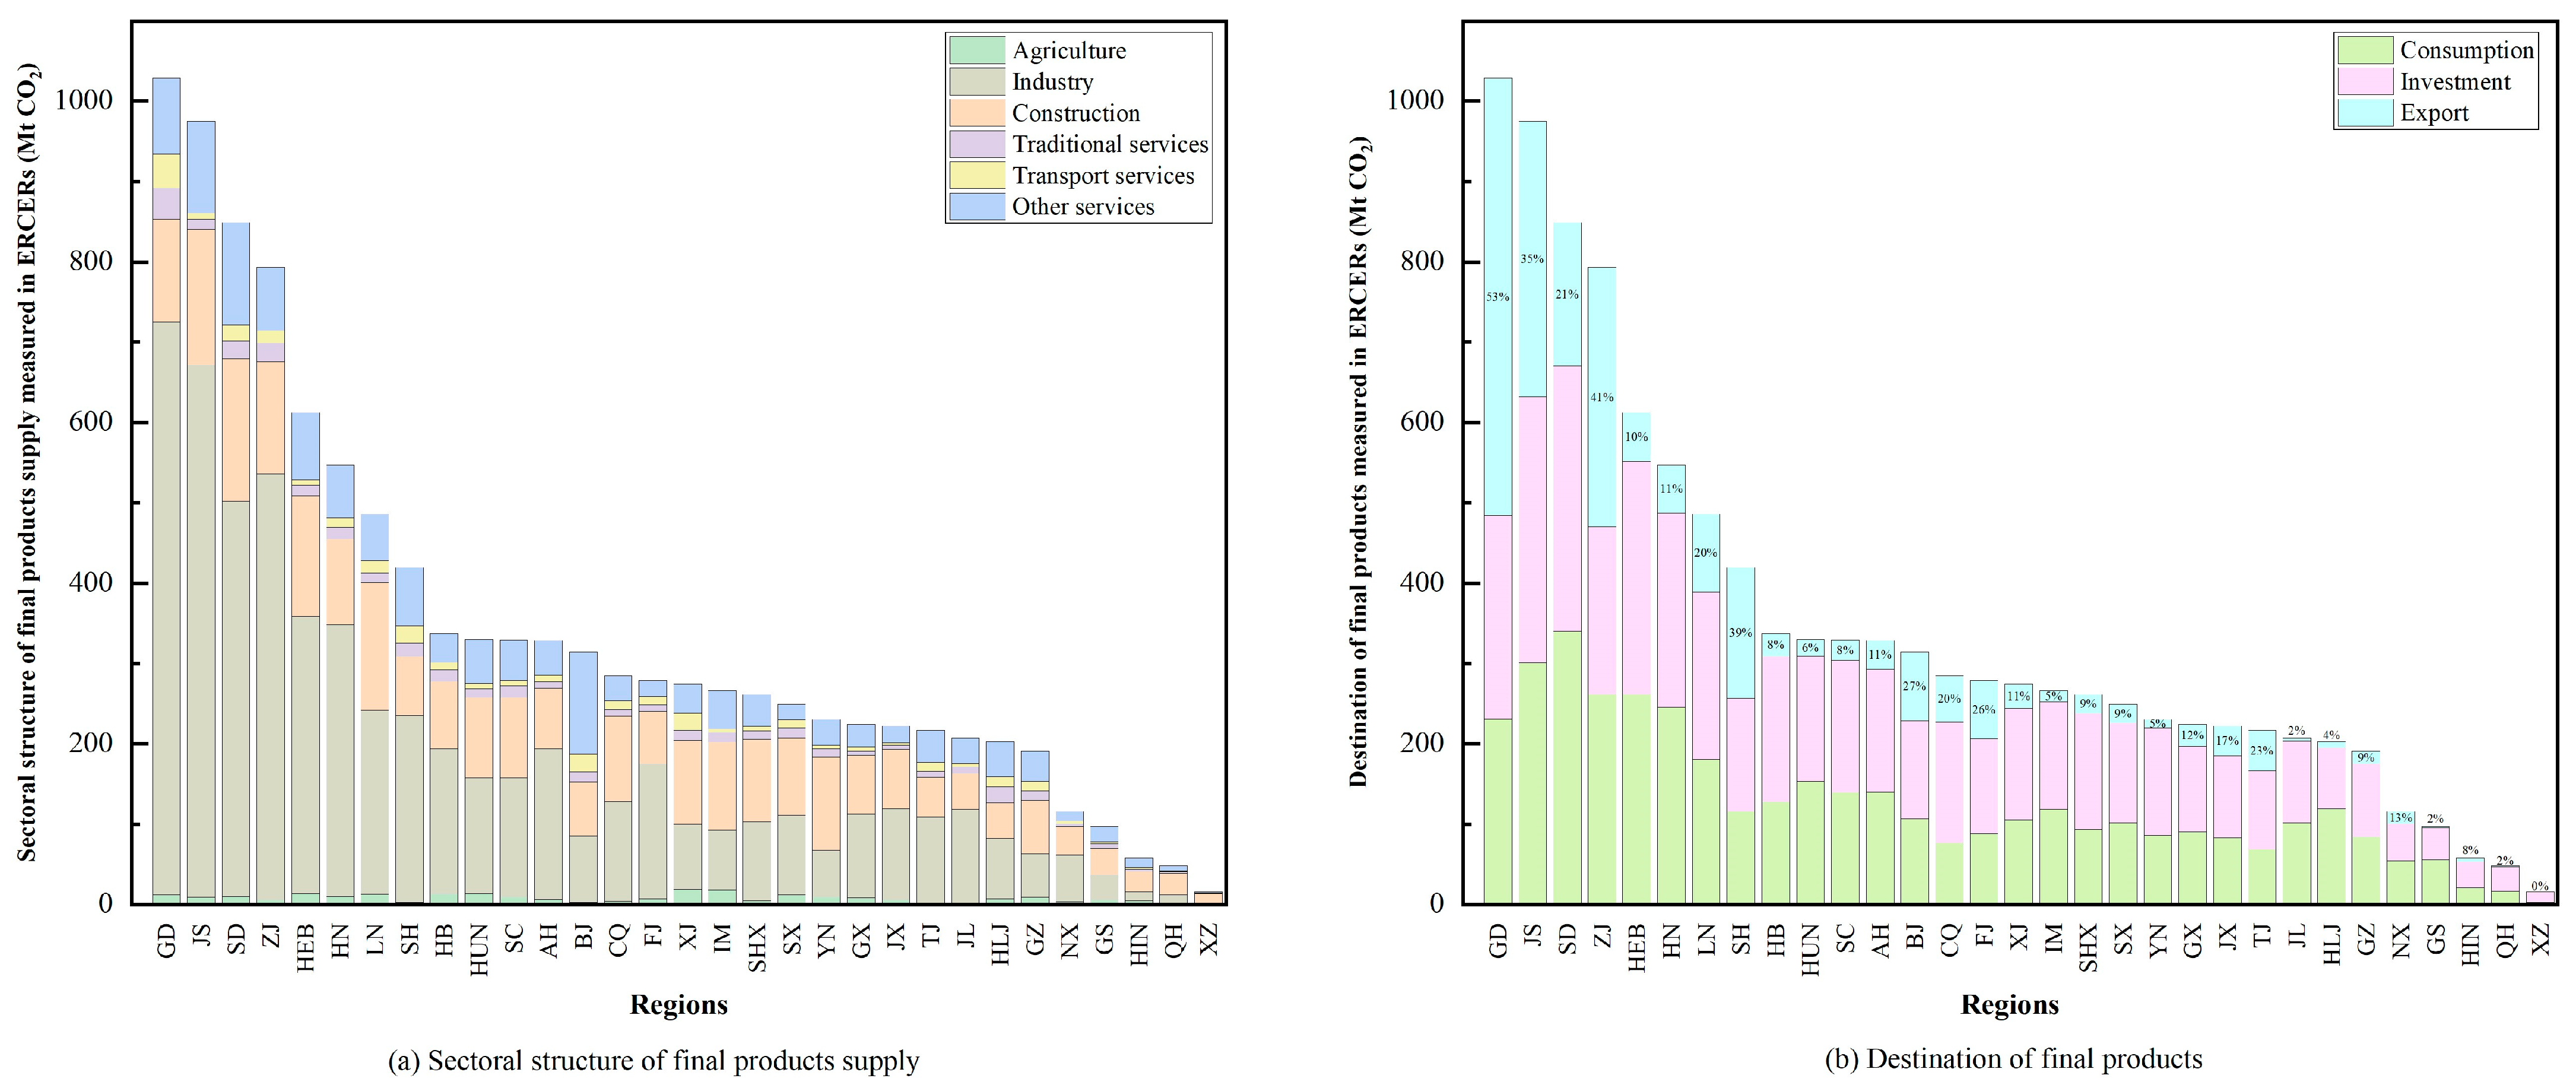
In the link to the final products supply, the ERCERs in final products nationally amount to 10,799.1 Mt. Figure 5 shows the sectoral structure and destination of final products produced in each region. Geographically, the distribution of ERCERs embodied in the final products supply closely corresponds to the level of regional economic development. Regions with the highest ERCERs are primarily located in the three major coastal economic zones, such as Guangdong, Jiangsu, Shandong, and Zhejiang, with a notable concentration in the Yangtze River Delta. Conversely, regions with the lowest ERCERs are mainly situated in the northwest, such as Xizang, followed by parts of the southwest and northeast. These coastal regions are characterized by relatively advanced economies, well-established industrial systems, and comprehensive infrastructure. As a result, they exhibit a state of “stable operation,” with a higher proportion of industry and a relatively lower proportion of construction. In contrast, the western regions lag behind in economic development, often lacking complete industrial systems and sufficient infrastructure. These regions are still undergoing extensive capacity building and infrastructure expansion, which leads to a higher share of ERCERs in the construction. Furthermore, regarding the destination of final products produced in each region, a notable feature is that final products from eastern and southern coastal regions, such as Guangdong, Jiangsu, and Zhejiang, account for a large proportion of exports, exhibiting characteristics of an export-oriented economy, whereas those from northern coastal regions, e.g., Shandong and Hebei, are primarily used domestically.
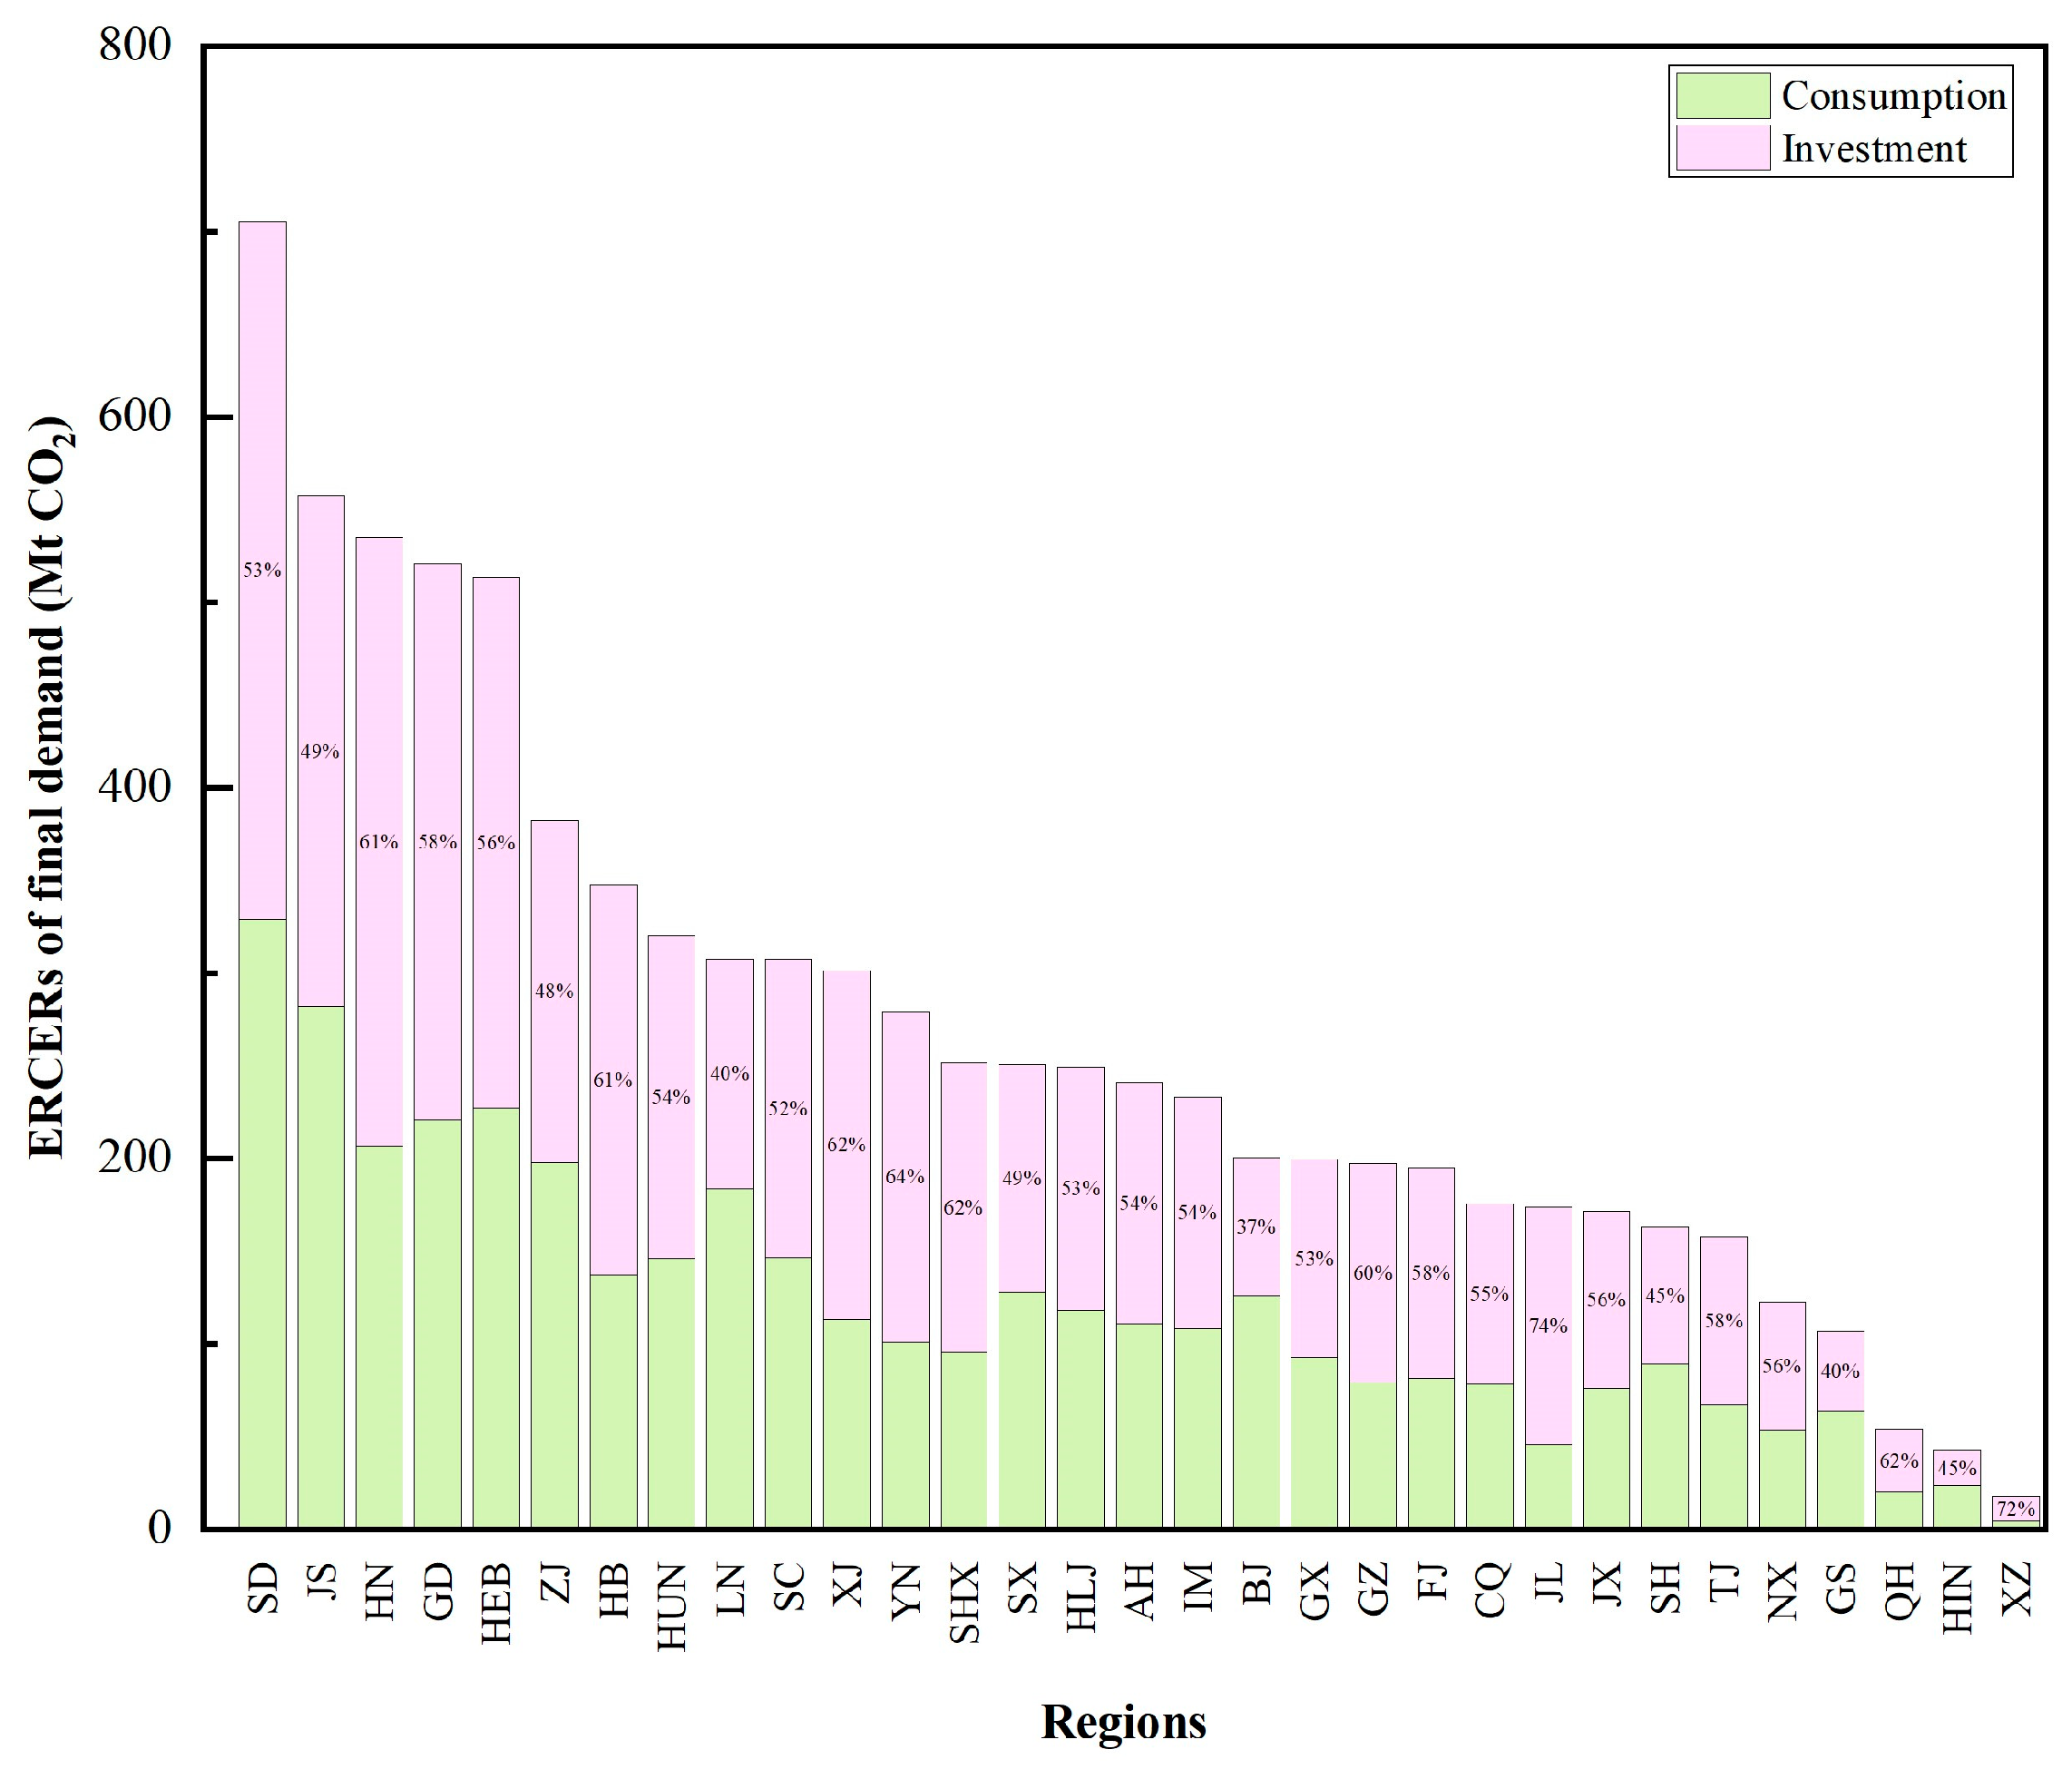
In terms of final demand, the total ERCERs amount to 10,799 Mt. Among the components of the final demand, gross capital formation (investment) constitutes the largest share at 42%, followed by domestic consumption at 34.8% and exports at 23.3%. Regional details are outlined in Figure 6. Across nearly all regions, the share of ERCERs embodied in investment exceeds 50%. This proportion is particularly high in western regions, where the increased input of final products is required to support ongoing infrastructure development and capacity expansion. Regions with high ERCERs can be categorized into two types: (1) economically developed and affluent coastal provinces, such as Shandong, Guangdong, and Zhejiang; (2) populous inland provinces with large-scale economies, including Henan and Sichuan. This feature is almost unchanged from 2010 [13].

4.2. Spatial Transmission Analysis of ERCERs

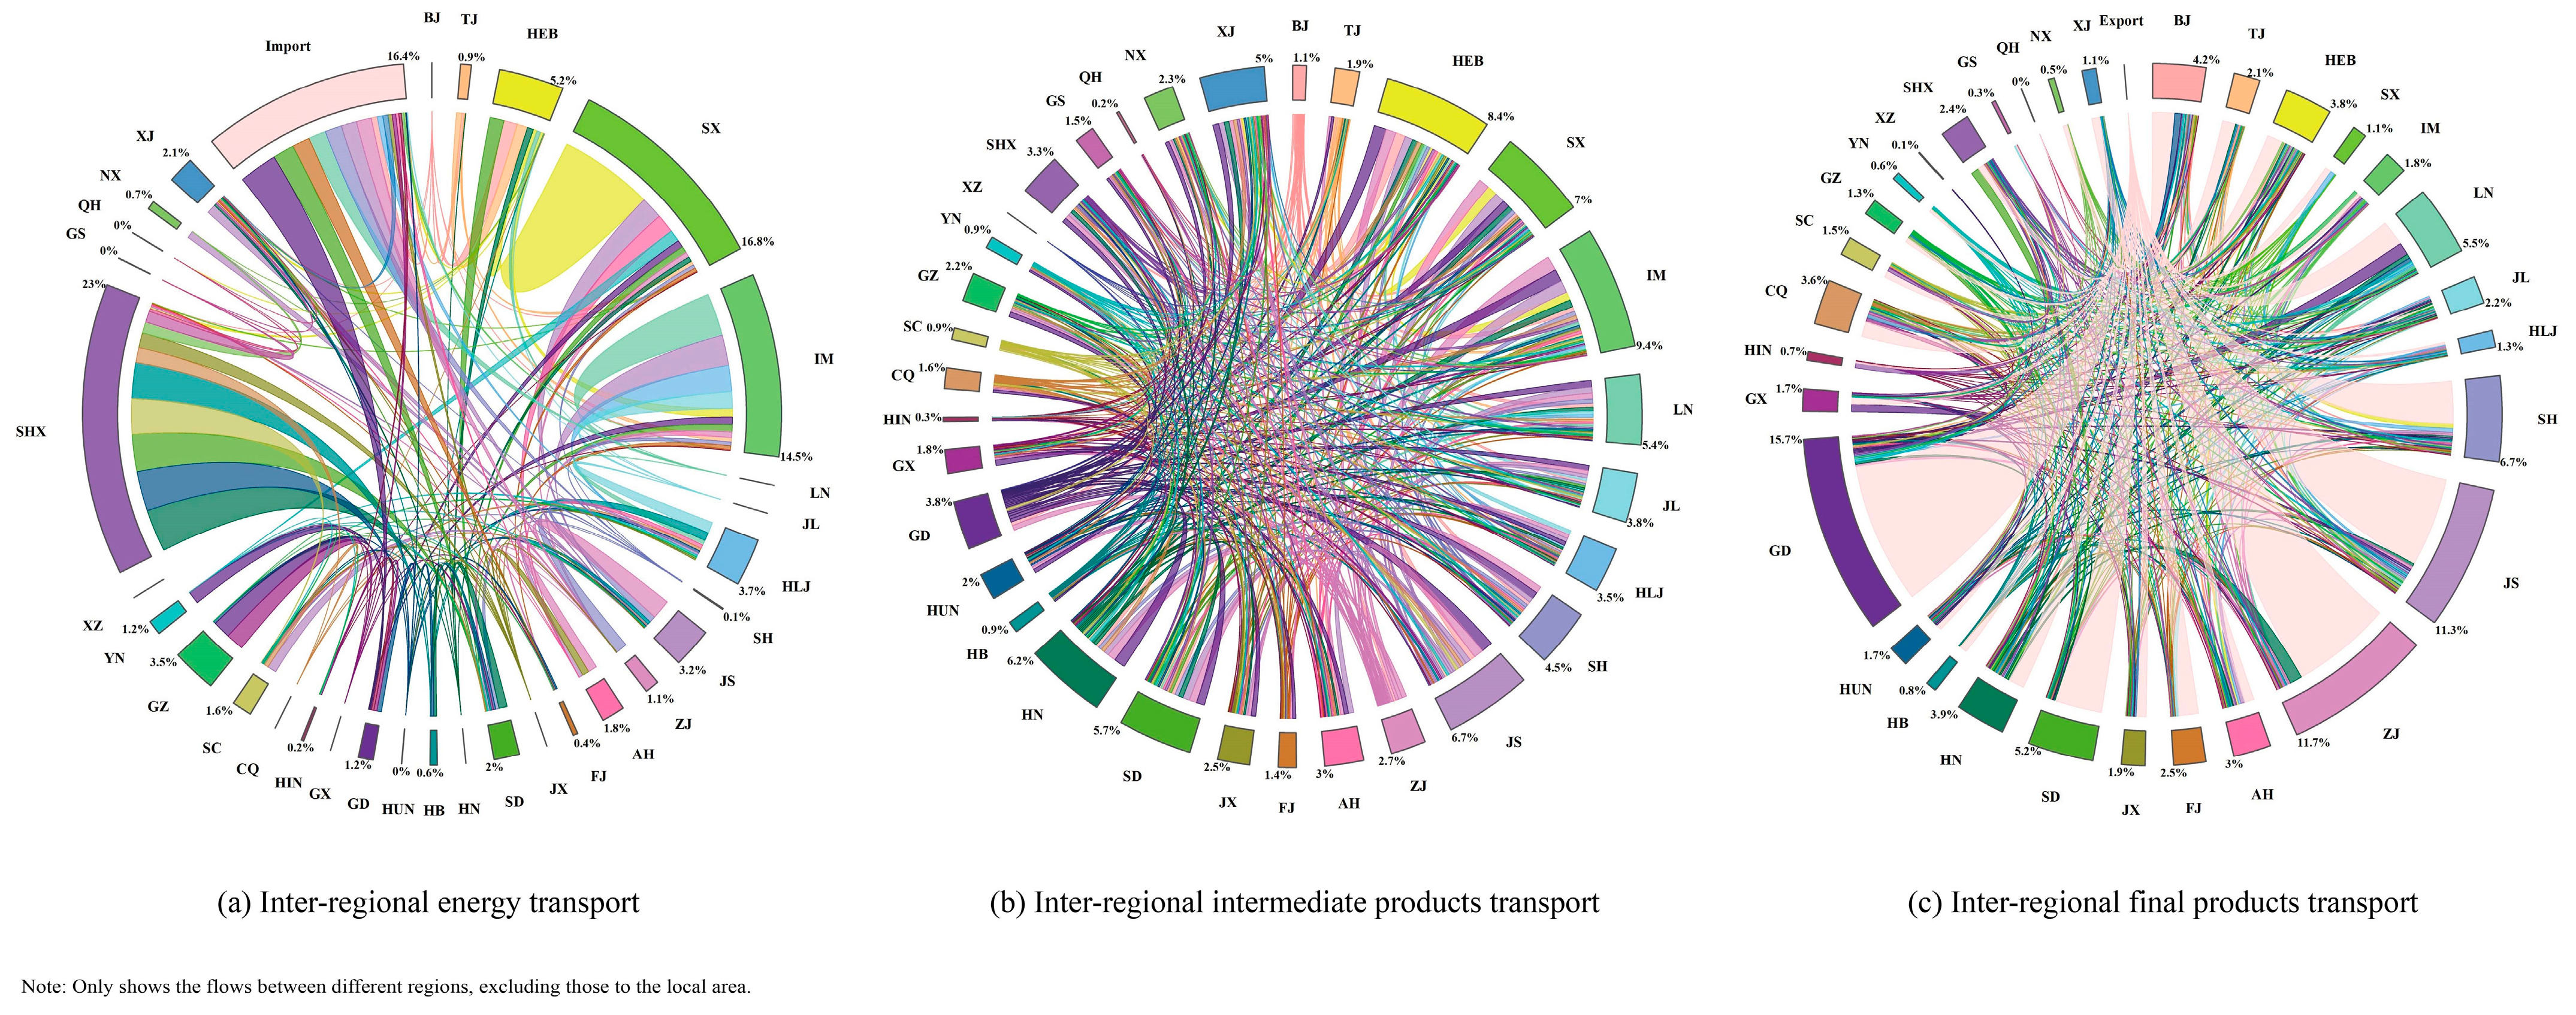
The Sankey diagram reveals the inter-regional transmission of ERCERs. We further explore these spatial shifts across three key inter-provincial links: energy, intermediate products, and final products separately, identifying the major transfer directions. Figure 7 presents the transmission of ERCERs associated with these three categories among different regions. Combining this with the Sankey diagram, notably, 49.6% of energy-embodied ERCERs are transferred across regions to satisfy the non-local direct energy consumption demand, with a prominent flow from the main coal-producing regions in the middle reaches of the Yellow River to the northern and eastern coastal provinces. The top three transmission routes are from Shanxi to Hebei, Inner Mongolia to Jiangsu, and Shaanxi to Shandong. For inter-regional flows of intermediate products, 36.3% of ERCERs are transferred to non-local provinces, primarily from North China to the eastern and southern coastal regions. The three most prominent flows are from Inner Mongolia to Zhejiang, Hebei to Guangdong, and Shanxi to Jiangsu. These originating regions are characterized by coal-based, energy-intensive heavy industries, such as steel production in Hebei, contributing to high ERCER outflows for economic development. In the case of final product transport, 16.9% of ERCERs are transmitted domestically to meet the final demands of other regions, while 23.3% are associated with exports to foreign markets, primarily from export-oriented regions like Guangdong, Zhejiang, and Jiangsu.
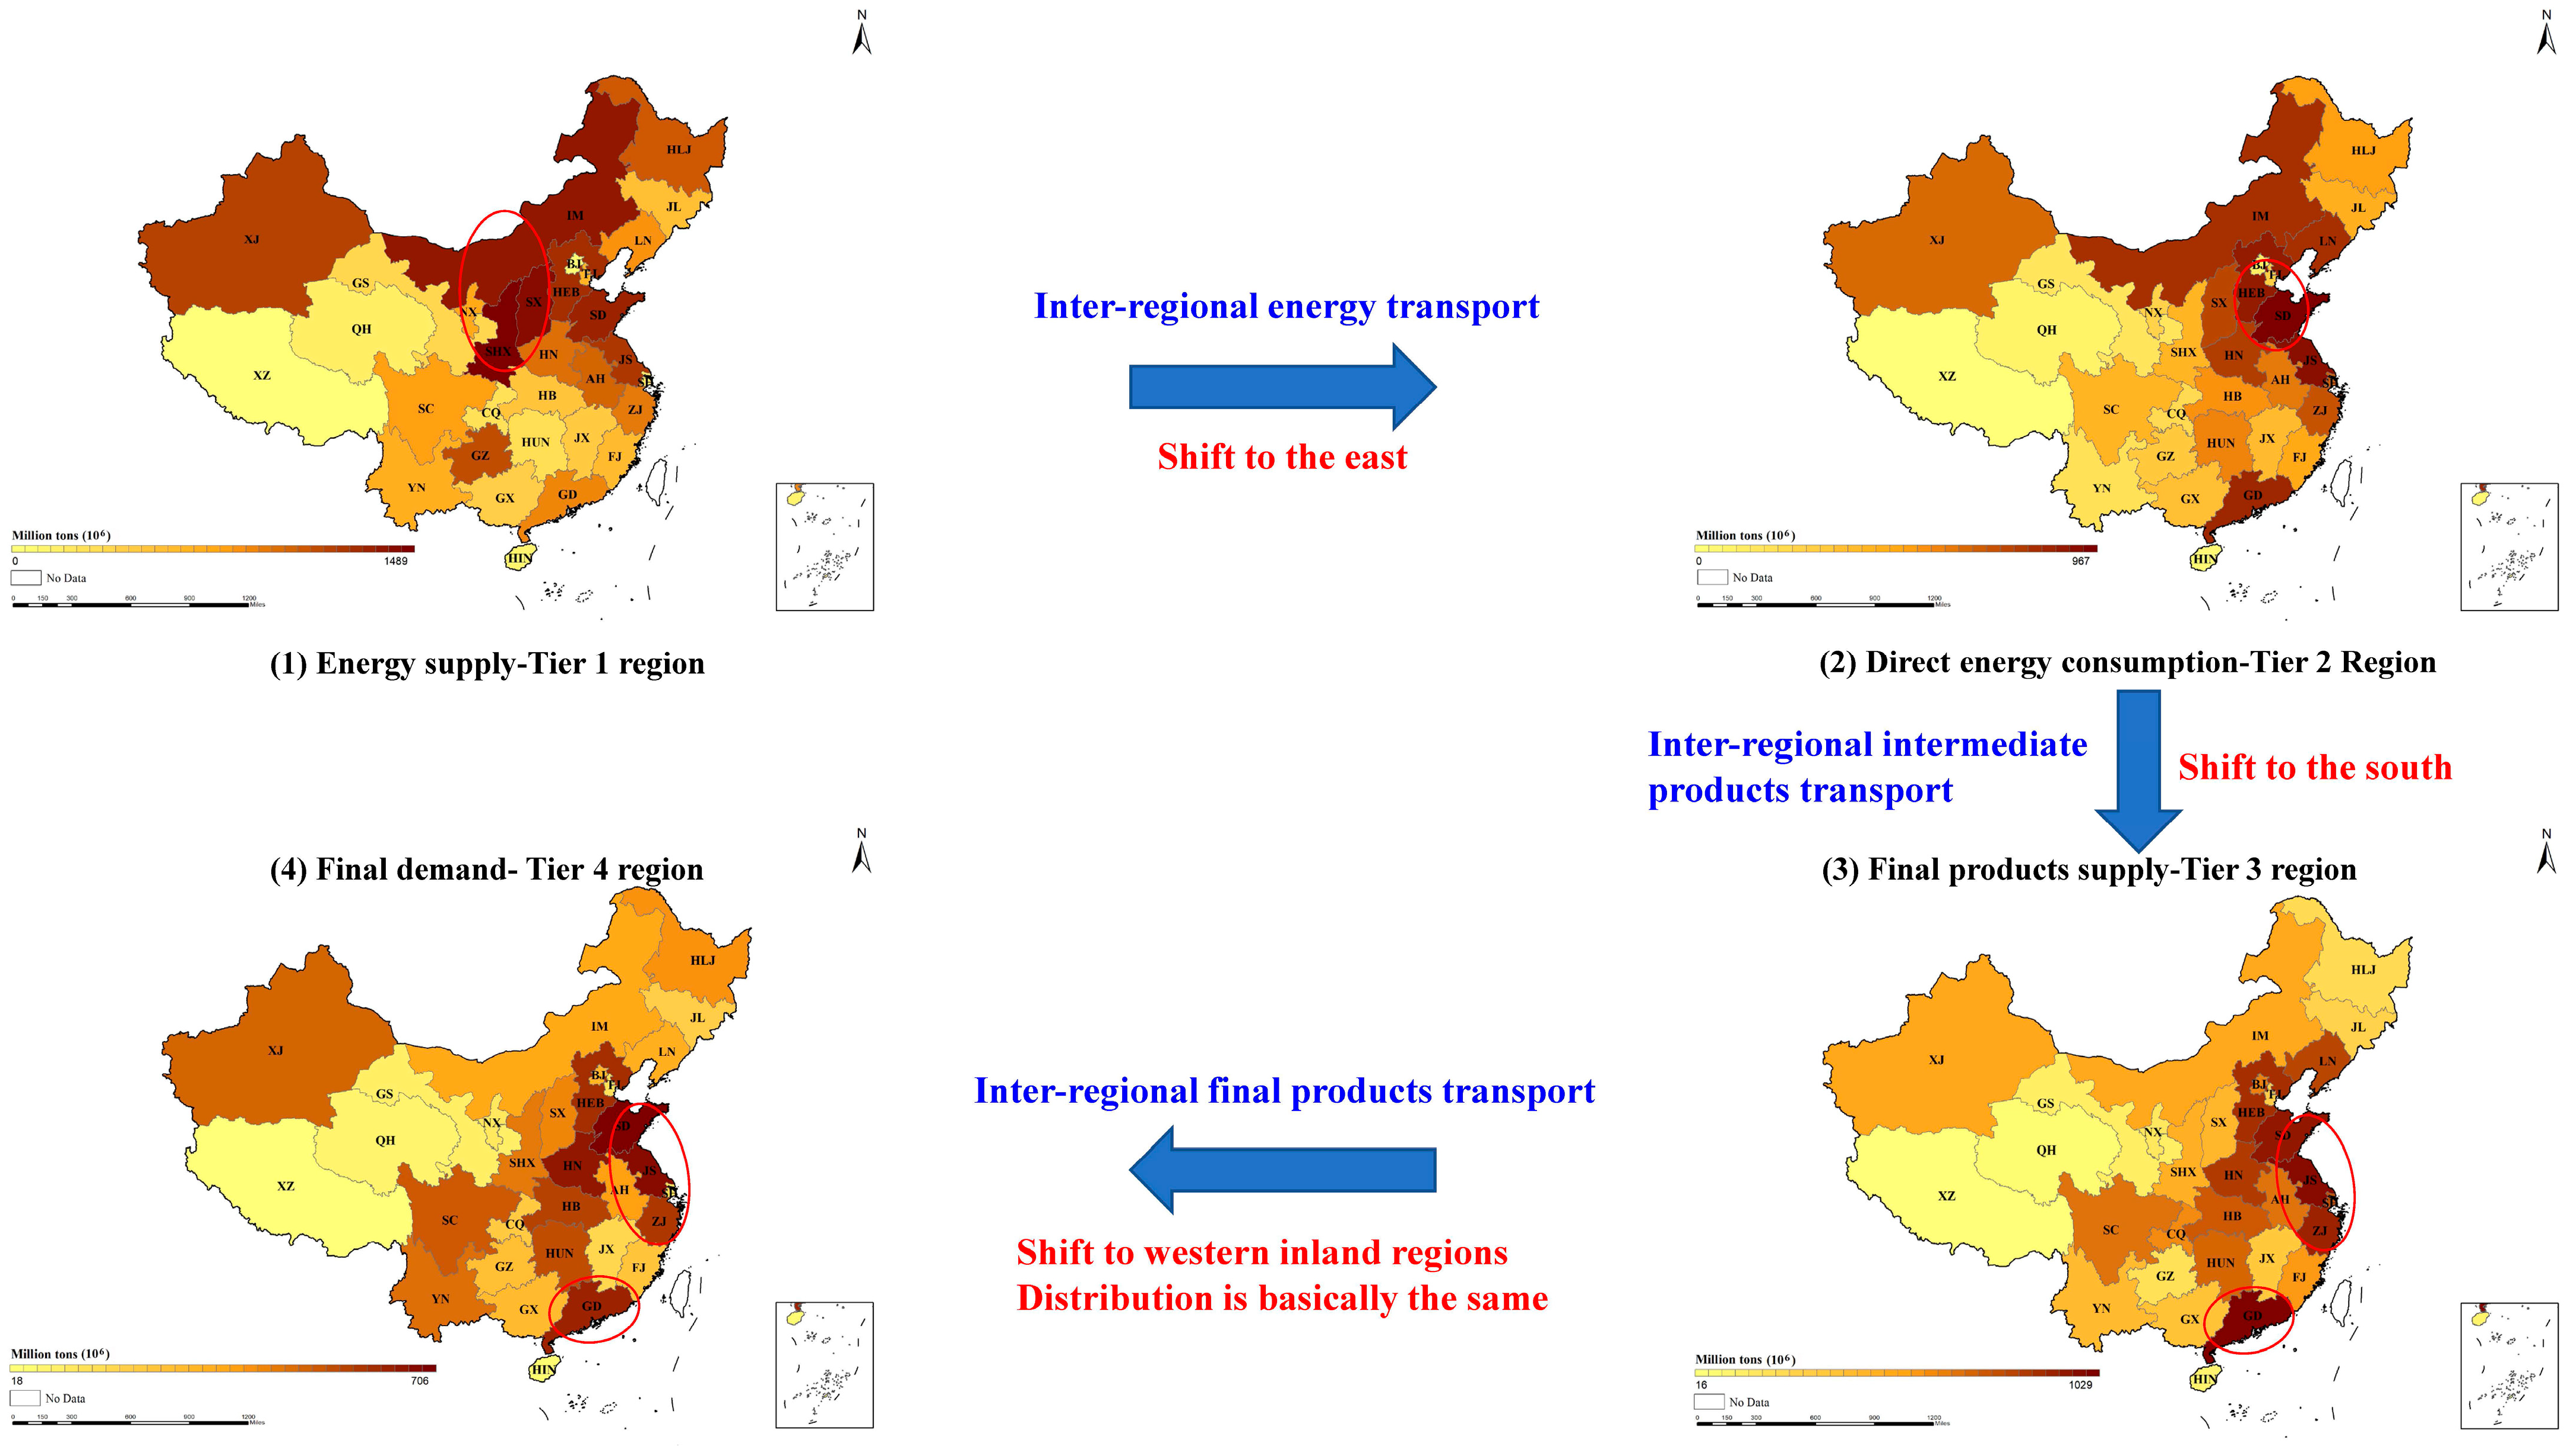
From the above analysis, although the majority of ERCERs associated with the inter-regional transport of energy, intermediate products, and final products remain within their region of origin, accounting for 50.4%, 63.7% and 59.8%, respectively, there are still clear patterns of spatial redistribution following cross-regional transfers, as highlighted in Section 3.1. The overall spatial shifts and distribution of ERCERs are visualized in Figure 8. It can be concluded that China’s ERCER transmissions follow three notable spatial shifts: (1) carbon transfer, driven by the eastward shift in energy from inland coal-producing regions to coastal consumption regions; (2) initial ERCERs transfer, accompanying the transport of intermediate products from the north to the eastern and southern coast provinces; (3) final ERCERs transfer, resulting from the flow of final products to foreign countries and to central and western provinces.
Exploring the underlying causal mechanisms, the spatial transmission of ERCERs in China is shaped mainly by three interrelated forces: the historical inertia of an export-oriented economy, regional industrial division of labor, and resource endowments. First, the export-oriented economic growth model has had a lasting impact. Since China’s reform and opening up, integration into the global market has driven a steady rise in the export share of GDP, from 7.8% in 1978 to a peak of 35.5% in 2006 (World Bank data) [56]. Considering imports, the overall trade dependence is even higher. With geographic advantages and policy support, eastern and southern coastal provinces became the main hubs of final product manufacturing, offering high value-added goods and benefiting from first-mover advantages through easier access to foreign capital, technology, and markets [57]. Second, energy endowments have concentrated coal resources in western and northern provinces such as Shanxi, Shaanxi, and Inner Mongolia. These provinces function as the upstream energy suppliers, providing energy to support national industrial demand. Third, the regional industrial division of labor has reinforced the spatial transfer of ERCERs. Northern provinces, rich in resources and heavy industry, were developed as centers for intermediate products such as steel, cement, and chemicals, which are energy-intensive and low in value-added [58,59]. These products flow to the eastern and southern coastal regions, where they are processed into final, high-value goods for both domestic consumption and export. This historical trajectory established a persistent spatial pattern: the west provides energy, the north produces intermediate products, and the east and south coastal provinces manufacture final products. By 2017, these long-standing dynamics continued to impact the spatial transmission of ERCERs observed in this study, explaining the sequential flows of ERCERs along China’s energy supply chain.

4.3. Discussion on Responsibility Decomposition of Regional Direct Carbon Emission

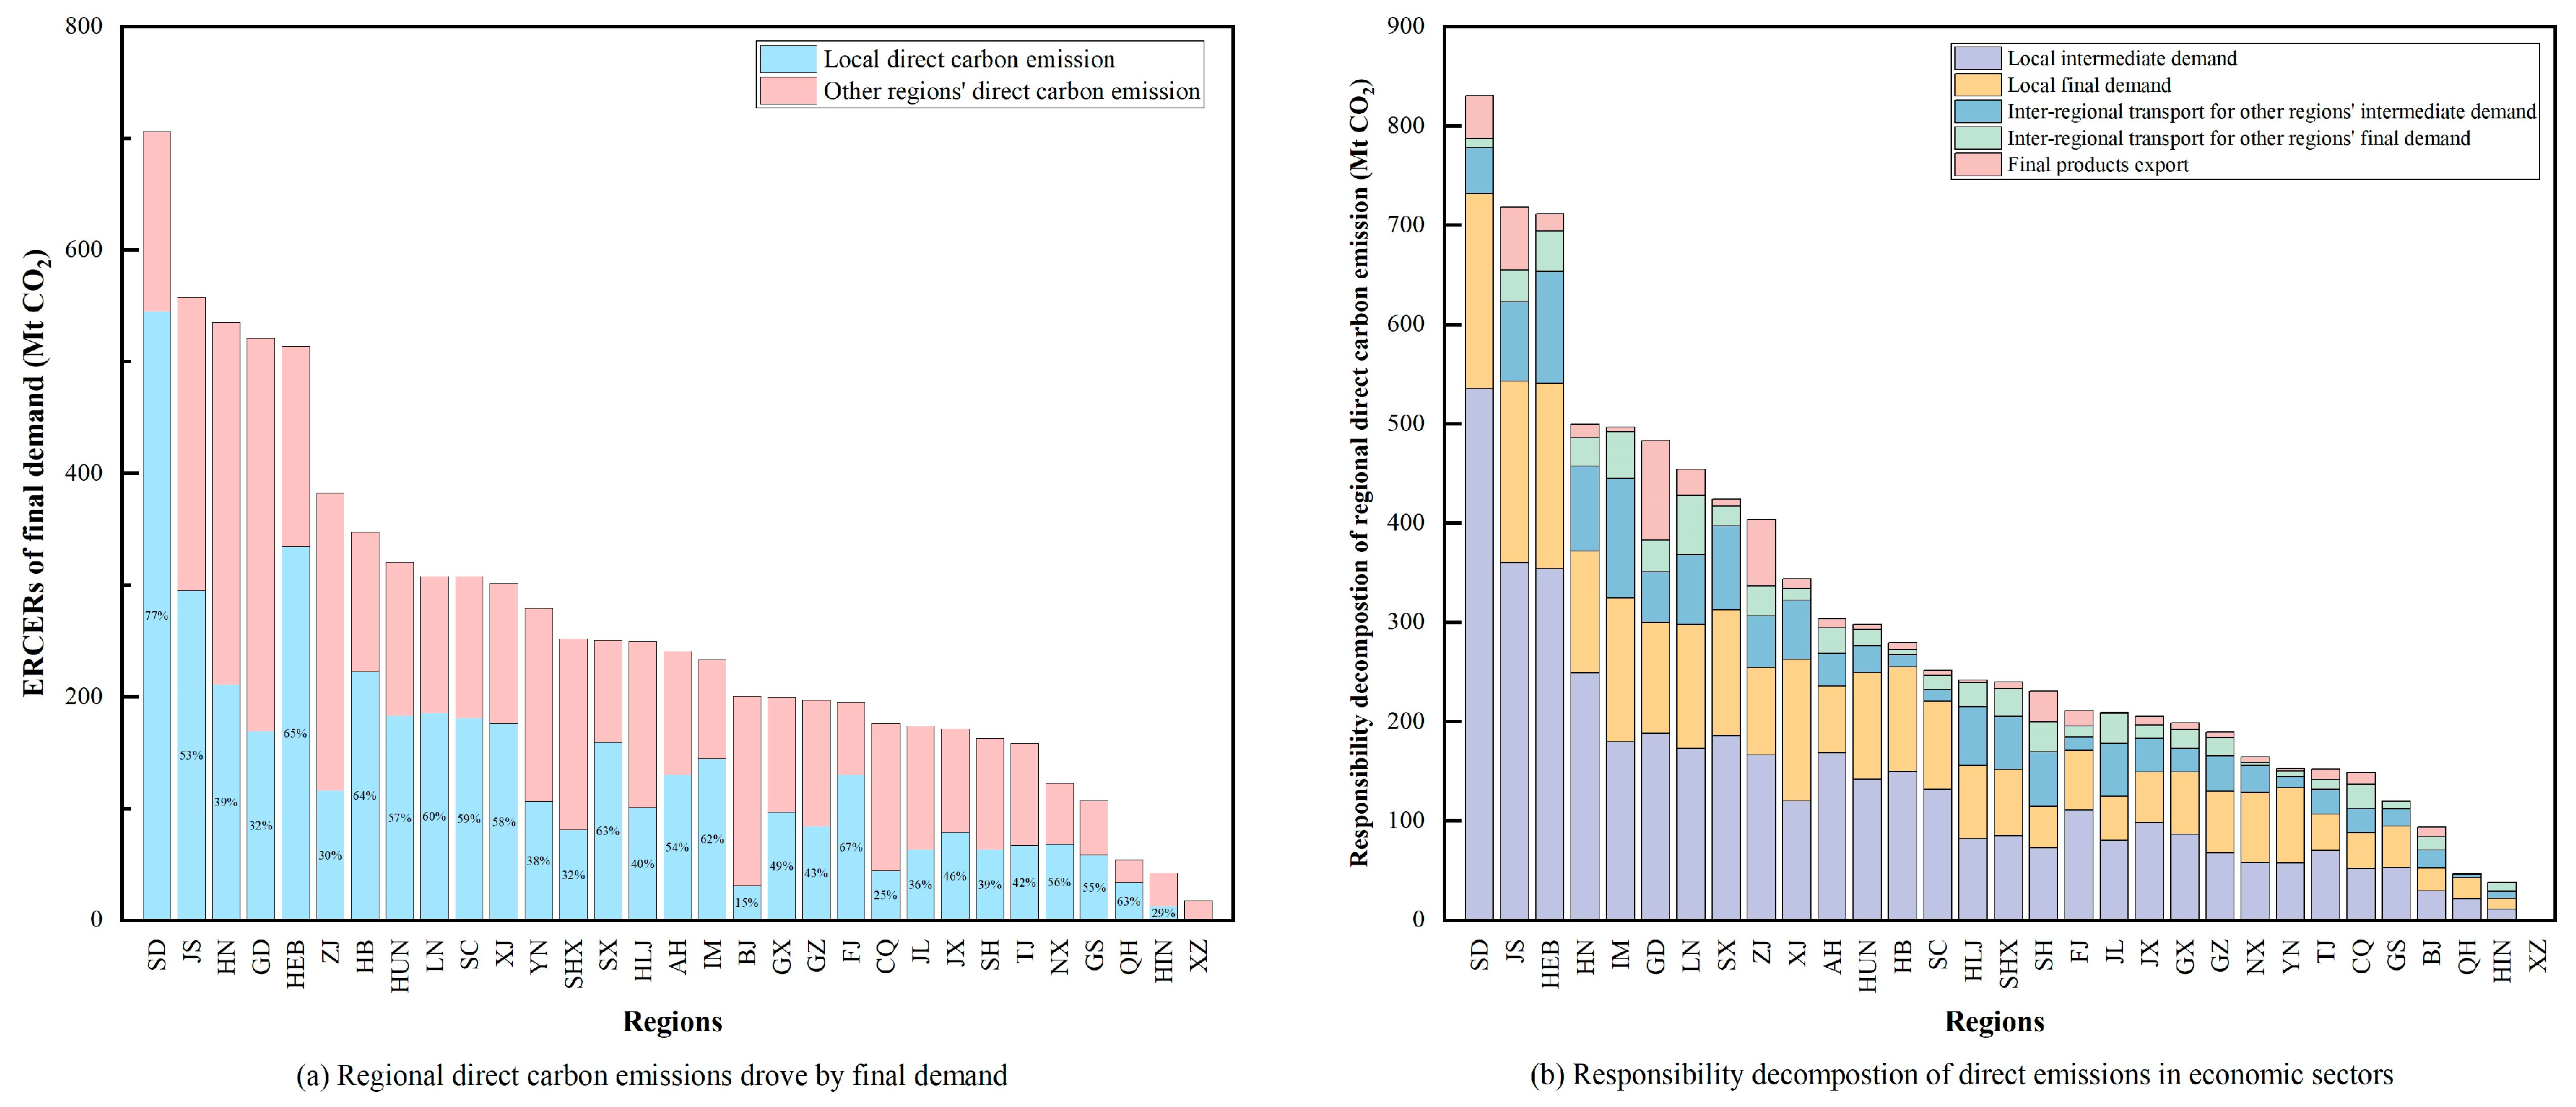
In Tier 2 regions, the ERCERs of end-use sectors represent physically direct carbon emissions. This study decomposes how the final demand in Tier 4 regions drives these direct emissions of Tier 2 regions, as shown in Figure 9a. Among all regions, Shandong exhibits the highest ERCERs attributed to the final demand, with 77.2% of those emissions occurring locally—the highest proportion nationwide. In contrast, only 15.4% of ERCERs driven by Beijing’s final demand occurred within the region itself. These findings suggest that regions with a lower proportion of locally induced ERCERs from final demand generally fall into two categories: (1) regions with highly developed service-oriented economies, such as Beijing and Shanghai, where the final demand is less reliant on local industrial products; (2) regions where a substantial share of the final demand is directed toward gross capital formation, which requires large quantities of industrial intermediate products. As a result, these regions, such as Jilin, Chongqing, and Yunnan, import significant amounts of embodied ERCERs from other provinces through inter-regional trade in intermediate and final products.
Based on the economic usage allocation of total output in the MRIO table, we further conduct responsibility allocation for direct carbon emissions in Tier 2 regions, as shown in Figure 9b. Nationwide, direct emissions from end-use sectors are predominantly driven by local economic demand, with emissions associated with intermediate demand significantly exceeding those related to the final demand and exports. Across the country, an average of 45.3% of direct carbon emissions are allocated to producing final products for local intermediate demand, 28.2% to local final demand, 14.3% to inter-regional transport of intermediate products, 6.8% to inter-regional transport of final products, and 5.5% to exports. Specifically, Shandong stands out with the highest direct carbon emissions, contributing 540 Mt to local intermediate demand and 200 Mt to local final demand. Hebei leads in carbon emissions from intermediate products transport, totaling to 110 Mt, while Liaoning records the highest emissions from final products transport at 60 Mt. Guangdong ranks first in emissions linked to export, reaching 100 Mt.
In the allocation of economic responsibility for direct carbon emissions across economic sectors, the production of intermediate products plays a dominant role. This is primarily due to the high energy intensity of industries such as steel and cement, whose outputs are predominantly used as intermediate inputs in subsequent production processes. In contrast, the share of direct carbon emissions allocated to final products, the “last step” in the industrial value chain, is considerably lower. In practical economic activities, intermediate products function as foundational inputs for the production of final products, which ultimately serve to meet the human demand for commodities and services. Within this framework, carbon emission reductions can be approached from three key dimensions: (1) improving energy efficiency in the production of energy- and carbon-intensive intermediate products, particularly in regions like Hebei and Shandong; (2) enhancing economic efficiency in intermediate input–output processes, i.e., increasing the efficiency of intermediate input utilization to produce the same quantity of final products with fewer resources, as observed in Guangdong and Jiangsu; and (3) managing final demand by curbing the growth in consumption of high-carbon commodities and promoting a shift towards products with lower carbon footprints.

4.4. Classification of Provinces According to ERCERs Transfer

Based on the patterns of ERCER flows across the three inter-regional transport stages, the 31 provinces and municipalities in China can be classified into seven distinct categories, as shown in Table 3:
(1)
Category 1: Hubei, Guangdong, and Yunnan. These regions are characterized by a net inflow of ERCERs across all three transport stages since they consistently depend on external sources for both energy and commodities. From another perspective, in economically meeting the final demand of these regions, other provinces effectively shoulder a portion of their direct and embodied ERCERs.
(2)
Category 2: Tianjin, Zhejiang, Sichuan, Henan, and Qinghai. Similarly to Category 1, these regions show a net inflow of ERCERs in both energy and economic products transport (i.e., intermediate and final products transport), though not necessarily across all three links.
(3)
Category 3: Beijing, Jiangsu, Hainan, Chongqing, Gansu, and Ningxia. These regions demonstrate a net inflow of ERCERs in energy transport, alongside both net inflow and outflow in economic products transport.
(4)
Category 4: Fujian, Jiangxi, Hunan, and Guangxi. These regions exhibit a net inflow of ERCERs in energy transport and an approximately balanced flow in economic products transport.
(5)
Category 5: Hebei, Shandong, Shanghai, Anhui, Liaoning, and Jilin. These regions show a net inflow of ERCERs in energy transport but a net outflow in economic products transport. In particular, Liaoning and Jilin show a net outflow of ERCERs in both intermediate and final product transport, implying that they undertake a portion of the ERCERs for other regions.
(6)
Category 6: Heilongjiang and Xizang. These provinces are characterized by a self-sufficient energy supply and a net inflow of final products.
(7)
Category 7: Guizhou, Shanxi, Shaanxi, Xinjiang, and Inner Mongolia. These regions serve as China’s core energy supply bases, with substantial net outflows of ERCERs in intermediate product transport. However, they tend to exhibit net inflows in final product transport, reflecting a structural asymmetry between energy export and consumption-driven imports.
The varying roles of provinces and municipalities reflect their distinct positions within the national energy–economic system and underscore the heterogeneity in ERCERs allocation. For instance, among regions classified in Categories 1 through 5, a notable net inflow of ERCERs in energy transport is observed, indicating that the majority of provinces rely on external sources to meet their energy needs. Specifically, regions in Categories 1 and 2 exhibit a net inflow of ERCERs in both intermediate and final product trade, suggesting two key implications: (1) Economic final demand in these regions exceeds their local production capacity; (2) the ERCERs embodied in their final demand are significantly greater than their direct emissions from local energy consumption.
These observations highlight the importance of clearly identifying the functional roles of each province and municipality within the national multi-regional energy–economic system. Moreover, we underscore the need to establish more equitable and scientifically grounded mechanisms for the regional allocation of ERCERs considering their roles and inter-regional transmission. This is an essential step for achieving coordinated energy–economic development and advancing national carbon neutrality goals.

4.5. Implications Under Recent Dual Carbon Policies of China

The present study relies on 2017 data, the latest year for which a consistent MRIO table and provincial energy accounts are available. Nevertheless, China’s energy and carbon governance have evolved markedly since the “dual carbon” pledge announced in 2020. Several recent policies may reshape ERCER transmission patterns. First, the construction of large-scale wind and solar power bases is transforming the energy supply. These projects are concentrated in western China, such as Inner Mongolia, Xinjiang, Gansu, Qinghai, Ningxia, and Shaanxi [60]. These regions, formerly the country’s major suppliers of high-carbon coal, are now expected to increase the output of low-carbon electricity. China has pledged to install more than 1200 GW of wind and solar power capacity by 2030, which has been achieved in 2024, six years ahead of schedule [61]. This rapid expansion of renewables is accelerating the decarbonization of the national energy supply chain. Second, regional power grid restructuring is lowering ERCERs associated with inter-regional energy transport. The expansion of long-distance, ultra-high-voltage transmission projects under “West-to-East power delivery” has significantly enhanced interprovincial electricity flows, while simultaneously reducing the average carbon intensity of traded power. This transition is particularly beneficial for the sustainable development of central and eastern provinces, which are heavily dependent on imported electricity. Third, the energy consumption structure may be reshaped by the growing share of low-carbon electricity. The intermittency of wind and solar generation, coupled with spatial mismatches between power supply in the west and demand in the east, has intensified the challenge of electricity absorption in western provinces. Beyond building additional transmission projects, promoting local consumption provides another solution. Power-intensive industries, such as aluminum smelting, silicon production, and data centers, may relocate to western regions to take advantage of abundant, low-cost renewable electricity. This shift not only alleviates grid balancing pressures but also contributes to regional industrial restructuring in line with China’s low-carbon transition and sustainable development.
In addition, the deployment of green electricity will generate significant economic value, primarily through regional development and fiscal benefits. For eastern coastal provinces, importing renewable electricity reduces long-term abatement costs by delivering not only energy but also the embodied “green value,” while simultaneously improving air quality. For western inland provinces, hosting large-scale renewable projects creates new investment opportunities, employment, tax revenues, and alternative growth pathways, thereby partly offsetting the decline in coal demand. Although substantial investments are required in transmission infrastructure and system flexibility, including energy storage, demand-side response, and the construction of a national unified electricity market, the system-level benefits from fuel displacement and carbon avoidance are expected to dominate in the long term.

4.6. Caparision with Existing Research and International Cases

Previous studies on China’s regional carbon transfers have primarily concentrated on the energy-consumption side. For example, Liu et al. [16] analyzed regional embodied carbon emission transfers in 2007, 2015, and 2017, which provides a close comparison to our research. Their results show that the top five provinces in Tier 2 (direct energy consumption) in 2017 were Shandong, Hebei, Jiangsu, Inner Mongolia, and Guangdong, a ranking highly consistent with our findings. However, in Tier 4 (final demand), their top five shifted to Jiangsu, Henan, Zhejiang, Guangdong, and Hebei, accounting for 38.8% of the total. In contrast, our study identified Shandong, Jiangsu, Henan, Guangdong, and Hebei with a nearly identical share of 39.4%. This discrepancy may arise from our inclusion of ERCERs embodied in imported products from foreign countries. Regarding spatial transmission patterns, they also observed that carbon emissions embodied in the final demand exhibit a “high in the east, low in the west” distribution. Moreover, they noted that carbon emissions embodied in intermediate products largely exceed those in final products, alongside a distinct pattern of carbon emission outsourcing from eastern and southern coastal regions to western regions. These findings align broadly with our results. The main distinction lies in their omission of a holistic analysis on ERCER transmissions across the entire energy supply chain. Specifically, their analysis did not account for the roles of regional energy supply, inter-regional energy transmission, and cross-border imports and exports, which are explicitly incorporated in our study.
In the international context, China’s inter-provincial ERCER transfers share both similarities and differences with other major economies. Within the European Union in 2017, cross-country carbon transfers primarily flowed from the north and east toward the west. Energy- and resource-intensive productions were concentrated in eastern and northern Europe, supplying intermediate products, while the more developed western member states, particularly Germany, acted as major producers of final products and as the primary final consumer market [62]. This pattern closely mirrors China’s “west-to-east” carbon transfer, whereby resource-rich inland regions supply energy and intermediate products to developed coastal regions. A similar dynamic has also been observed in the United States, where net carbon inflow regions are concentrated in the more developed east and west coastal states, such as New England, New York, the Mid-Atlantic, Florida, and California, while net carbon outflow regions are located mainly in the central states, including the South Central, the Mountain states, and Texas [63]. These parallels highlight the structural consistency of carbon transfer patterns across large, regionally diverse economies despite differences in energy resources, industrial structures, and policy frameworks. Nevertheless, the scale of China’s ERCER transfers is far larger, shaped by its coal-dominated energy endowment and the historical inertia of its export-oriented growth model, which makes its spatial transmission patterns more pronounced than those observed in the EU or the United States.

5. Conclusions

This study develops an EA-MRIO method by integrating EAA with an EE-MRIO model, helping to understand the transmission of ERCERs among multiple regions from the energy-economic nexus perspective. Using China’s 31 provinces and municipalities in 2017 as a case study, we outline a holistic picture of the flow and transmission of ERCERs across regions, from the energy-production side to the energy-consumption side. This provides systematic references and policy recommendations for the allocation of ERCERs in multi-regional settings.
The main findings of the study are summarized as follows:
(1)
Nationally, investment constitutes the largest share of ERCERs in the final demand at 42%, followed by domestic consumption at 34.8% and exports at 23.3%. And the share of ERCERs embodied in investment exceeds 50% in almost all regions. A comprehensive assessment of energy and commodity flows reveals that the ERCERs embodied in China’s exports are broadly equivalent to that embodied in its imports, showing a balance of ERCERs embodied in international trade.
(2)
Current policies, whose carbon accounting rely primarily on end-use energy consumption, tend to disproportionately burden energy-producing provinces such as Hebei, Shanxi, and Inner Mongolia. In contrast, when ERCERs are allocated based on final demand, export-oriented provinces such as Guangdong and Jiangsu bear a substantially greater share of the emissions burden.
(3)
The spatial transmission pattern of ERCERs is charactered as the flows of ERCERs that originate in North China, initially move toward the eastern coastal regions, and subsequently extend southward, and are finally transferred to foreign countries and to central and western provinces.
(4)
Nationally, direct carbon emissions from economic sectors are primarily driven by local demand (73.5%), followed by inter-regional transport (21.1%) and export demand (5.5%). Notably, export-induced emissions are heavily concentrated in eastern coastal provinces, particularly Guangdong, Jiangsu, and Zhejiang.
Based on the research findings, the following policy recommendations are proposed:
(1)
Adopt a coordinated, demand-oriented approach to ERCERs allocation. Regional carbon emissions are fundamentally driven by economic final demand. Therefore, advancing low-carbon development requires a nationally coordinated strategy that considers the regional division of labor. This entails formulating comprehensive policies for the equitable allocation and regulation of ERCERs across all regions and sectors of the energy–economic system.
(2)
Accelerate the development and deployment of non-fossil fuel electricity in eastern provinces. Promoting non-fossil energy usage, especially clean electricity, in the eastern coastal provinces represents one of the most effective pathways for reducing carbon emissions at present.
(3)
Focus on industrial energy consumption, particularly coal. Controlling energy consumption within the industrial sector, with particular emphasis on coal usage, should remain a central priority for energy conservation and emission reduction efforts. This is especially critical in regions with coal-intensive heavy industries, such as Hebei, Shanxi, etc.
(4)
Mange investment planning in western regions. As infrastructure and capacity expansion continues in western provinces, it is essential to integrate long-term, low-carbon planning into investment strategies. This will help mitigate the risk of excessive carbon emissions associated with fixed capital formation and avoid locking in high-emission trajectories.
This study holds several implications for future research. First, our analysis is based on a static MRIO table for a single year. Future work can employ dynamic, time-series MRIO data to examine the long-term temporal and spatial evolution of ERCERs among multiple regions. Second, integrating sector-level technological progress and energy transition scenarios into the EA-MRIO method would be a potential avenue to evaluate their impact on decarbonization. Third, while this study is constrained to provincial-level data due to the availability of consistent MRIO tables and energy accounts, future research could benefit from finer-grained, city-level data once such datasets become available, enabling more precise allocation of ERCERs and deeper insights into regional energy–economic linkages. Finally, our framework can be extended to the global scale, providing valuable perspectives on transboundary carbon responsibilities.

Supplementary Materials

The following supporting information can be downloaded at: https://www.mdpi.com/article/10.3390/su17188166/s1, Table S1: Inter-regional energy transport coefficient table; Table S2: CO2 emission factors of electricity.

Author Contributions

Conceptualization, Y.Y., Y.Z. and L.M.; methodology, Y.Y., Y.Z. and H.Y.; formal analysis, Y.Y.; data curation, Y.Y.; writing—original draft preparation, Y.Y.; writing—review and editing, Y.Z., H.Y., C.H.C., L.M., S.C. and Z.L.; supervision, L.M. and Z.L. All authors have read and agreed to the published version of the manuscript.

Funding

This research was funded by the Carbon Neutrality and Energy System Transformation (CNEST) Program led by Tsinghua University, the Major Program of the National Social Science Foundation of China (Grant No. 21&ZD133), and the National Natural Science Foundation of China (W2442026 & W2433112). This research was also supported by the ASEAN Talented Young Scientist Program of Guangxi (ATYSP2023008, ATYSP2025023), the Guangxi Philosophy and Social Science Research Project (23CYJ021), the GUAT Special Research Project on the Strategic Development of Distinctive Interdisciplinary Fields (TS2024511), and the Guilin University of Aerospace Technology (KX202207601).The authors would also like to acknowledge the support of Guangxi High-Level Talent Program (Guirencaiban [2025] 41#), Guangxi's First Batch of Qingmiao Talent Universal Support Program for Scientific Research Start-up Fund.

Institutional Review Board Statement

Not applicable.

Informed Consent Statement

Not applicable.

Data Availability Statement

Data will be made available on request.

Acknowledgments

The authors gratefully thank the support of the Carbon Neutrality and Energy System Transformation (CNEST) Program led by Tsinghua University, the Tsinghua-Rio Tinto Joint Research Centre for Resources, Energy and Sustainable Development, and the support from BP through the Phase IV Collaboration between Tsinghua and BP.

Conflicts of Interest

The authors declare the following financial interests/personal relationships which may be considered as potential competing interests: Yunlong Zhao, Honghua Yang are employed by the company China Electric Power Planning & Engineering Institute and China Electric Power Research Institute, State Grid Corporation of China, separately. The remaining authors declare that the research was conducted in the absence of any commercial or financial relationships that could be construed as a potential conflict of interest.

Abbreviations

The following abbreviations are used in this manuscript:
ERCERsenergy-related carbon emission responsibilities
MRIOmulti-regional input-output
EA-MRIOenergy allocation induced MRIO
EAAenergy allocation analysis
EE-MRIOenvironmentally extended input-output
Mtmillion tons

Appendix A

Table A1. Abbreviations table of China’s 31 provinces and municipalities.
Province and MunicipalityAbbreviationProvince and MunicipalityAbbreviation
BeijingBJHubeiHB
TianjinTJHunanHUN
HebeiHEBGuangdongGD
ShanxiSXGuangxiGX
Inner MongoliaIMHainanHIN
LiaoningLNChongqingCQ
JilinJLSichuanSC
HeilongjiangHLJGuizhouGZ
ShanghaiSHYunnanYN
JiangsuJSXizangXZ
ZhejiangZJShaanxiSHX
AnhuiAHGansuGS
FujianFJQinghaiQH
JiangxiJXNingxiaNX
ShandongSDXinjiangXJ
HenanHN
Table A2. Relationship between the integrated sectors and the original sectors in the MRIO table.
Integrated SectorsOriginal 42 Sectors from MRIO Table
AgricultureS1 Agriculture, Forestry, Animal Husbandry, and Fishery
IndustryS2 Mining and washing of coal, S3 Extraction of petroleum and natural gas, S4 Mining and processing of metal ores, S5 Mining and processing of nonmetal and other ores, S6 Food and tobacco processing, S7 Textile industry, S8 Manufacture of leather, fur, feather, and related products, S9 Processing of timber and furniture, S10 Manufacture of paper, printing, and articles for culture, education, and sport activity, S11 Processing of petroleum, coking, and processing of nuclear fuel, S12 Manufacture of chemical products, S13 Manufacture of non-metallic mineral products, S14 Smelting and processing of metals, S15 Manufacture of metal products, S16 Manufacture of general purpose machinery, S17 Manufacture of special purpose machinery, S18 Manufacture of transport equipment, S19 Manufacture of electrical machinery and equipment, S20 Manufacture of communication equipment, computers, and other electronic equipment, S21 Manufacture of measuring instruments, S22 Other manufacturing and waste resources, S23 Repair of metal products, machinery, and equipment, S24 Production and distribution of electric power and heat power, S25 Production and distribution of gas, and S26 Production and distribution of tap water
ConstructionS27 Construction
Traditional servicesS28 Wholesale and retail trades, S30 Accommodation and catering
Transport servicesS29 Transport, storage, and postal services
Other servicesS31 Information transfer, software, and information technology services, S32 Finance, S33 Real estate, S34 Leasing and commercial services, S35 Scientific research, S36 Polytechnic services, S37 Administration of water, environment, and public facilities, S38 Resident, repair and other services, S39 Education, S40 Health care and social work, S41 Culture, sports, and entertainment, and S42 Public administration, social insurance, and social organizations

References

  1. IPCC Climate Change 2023: Synthesis Report. Contribution of Working Groups I, II and III to the Sixth Assessment Report of the Intergovernmental Panel on Climate Change; Core Writing Team, Lee, H., Romero, J., Eds.; IPCC: Geneva, Switzerland, 2023; pp. 35–115. [Google Scholar]
  2. Institute for Carbon Neutrality Tsinghua University. 2024 Global Carbon Neutrality Annual Progress Report; Institute for Carbon Neutrality, Tsinghua University: Beijing, China, 2024; pp. 3–45. [Google Scholar]
  3. Institute for Carbon Neutrality Tsinghua University. 2023 Global Carbon Neutrality Annual Progress Report; Institute for Carbon Neutrality, Tsinghua University: Beijing, China, 2023; pp. 5–49. [Google Scholar]
  4. Zhou, C.; Xiang, X.; Zhu, B.; Wang, Z. Mapping carbon reduction: A cross-continental study of alliance strategies. iScience 2024, 27, 109412. [Google Scholar] [CrossRef]
  5. Tan, F.; Yang, J.; Zhou, C. Historical review and synthesis of global carbon neutrality research: A bibliometric analysis based on R-tool. J. Clean. Prod. 2024, 449, 141574. [Google Scholar] [CrossRef]
  6. Kang, J.; Wei, Y.; Liu, L.; Han, R.; Yu, B.; Wang, J. Energy systems for climate change mitigation: A systematic review. Appl. Energ. 2020, 263, 114602. [Google Scholar] [CrossRef]
  7. Yang, X.; Wang, Z.; Zhang, Y.; Niu, M. Empirical study of China’s provincial carbon emission responsibility allotment: Credit or penalty? Environ. Sci. Pollut. Res. 2020, 27, 40512–40524. [Google Scholar] [CrossRef] [PubMed]
  8. Yang, D.; Guo, R.; O'Connor, P.; Zhou, T.; Zhang, S.; Meng, H.; Wan, M.; Dai, C.; Ma, W. Embodied carbon transfers and employment-economic spillover effects in China’s inter-provincial trade. Front. Environ. Sci. 2023, 11. [Google Scholar] [CrossRef]
  9. Zhao, N.; Xu, L.; Malik, A.; Song, X.; Wang, Y. Inter-provincial trade driving energy consumption in China. Resour. Conserv. Recycl. 2018, 134, 329–335. [Google Scholar] [CrossRef]
  10. Xia, Q.; Wu, X.; Wu, S.; Ma, X. Unraveling the effect of domestic and foreign trade on energy use inequality within China. Renew. Sustain. Energy Rev. 2023, 183, 113472. [Google Scholar] [CrossRef]
  11. Zhai, M.; Huang, G.; Liu, L.; Xu, X.; Guan, Y.; Fu, Y. Revealing environmental inequalities embedded within regional trades. J. Clean. Prod. 2020, 264, 121719. [Google Scholar] [CrossRef]
  12. Zhou, D.; Zhou, X.; Xu, Q.; Wu, F.; Wang, Q.; Zha, D. Regional embodied carbon emissions and their transfer characteristics in China. Struct. Change Econ. D 2018, 46, 180–193. [Google Scholar] [CrossRef]
  13. Wang, Z.; Yang, Y.; Wang, B. Carbon footprints and embodied CO2 transfers among provinces in China. Renew. Sustain. Energy Rev. 2018, 82, 1068–1078. [Google Scholar] [CrossRef]
  14. Zhen, W.; Li, J. The formation and transmission of upstream and downstream sectoral carbon emission responsibilities: Evidence from China. Sustain. Prod. Consum. 2021, 25, 563–576. [Google Scholar] [CrossRef]
  15. Wang, Z.; Peng, H.; Meng, J.; Zheng, H.; Li, J.; Huo, J.; Chen, Y.; Wen, Q.; Ma, X.; Guan, D. Enormous inter-country inequality of embodied carbon emissions and its driving forces in South America. Glob. Environ. Change 2024, 89, 102944. [Google Scholar] [CrossRef]
  16. Liu, X.; Cifuentes-Faura, J.; Shi, W.; Tian, C. Exploring the Carbon Emission Transfers Pathway to Address the Issue of Sustainable Development: A Multi-Regional Input–Output Perspective. Sustain. Dev. 2025, 33, 5676–5703. [Google Scholar] [CrossRef]
  17. Song, J.; Hu, X.; Wang, X.; Yuan, W.; Wang, T. The spatial characteristics of embodied carbon emission flow in Chinese provinces: A network-based perspective. Environ. Sci. Pollut. Resour. 2022, 29, 34955–34973. [Google Scholar] [CrossRef] [PubMed]
  18. Zhang, B.; Qiao, H.; Chen, Z.M.; Chen, B. Growth in embodied energy transfers via China’s domestic trade: Evidence from multi-regional input–output analysis. Appl. Energ. 2016, 184, 1093–1105. [Google Scholar] [CrossRef]
  19. Murphy, R. What is undermining climate change mitigation? How fossil-fuelled practices challenge low-carbon transitions. Energy Res. Soc. Sci. 2024, 108, 103390. [Google Scholar]
  20. Chong, C.H.; Gao, Y.; Ma, L.; Li, Z.; Ni, W.; Zhou, X.; Cristiano, S.; Meng, F.; Zhang, W.; Yan, N.; et al. A supply chain allocation method for environmental responsibility based on fossil energy as the anchor for carbon responsibility. J. Clean. Prod. 2023, 416, 137904. [Google Scholar] [CrossRef]
  21. Chong, C.H.; Tan, W.X.; Ting, Z.J.; Liu, P.; Ma, L.; Li, Z.; Ni, W. The driving factors of energy-related CO2 emission growth in Malaysia: The LMDI decomposition method based on energy allocation analysis. Renew. Sustain. Energy Rev. 2019, 115, 109356. [Google Scholar] [CrossRef]
  22. Ma, L.; Chong, C.; Zhang, X.; Liu, P.; Li, W.; Li, Z.; Ni, W. LMDI Decomposition of Energy-Related CO2 Emissions Based on Energy and CO2 Allocation Sankey Diagrams: The Method and an Application to China. Sustainability 2018, 10, 344. [Google Scholar] [CrossRef]
  23. Chong, C.; Liu, P.; Ma, L.; Li, Z.; Ni, W.; Li, X.; Song, S. LMDI decomposition of energy consumption in Guangdong Province, China, based on an energy allocation diagram. Energy 2017, 133, 525–544. [Google Scholar] [CrossRef]
  24. Chong, C.H.; Zhou, X.; Zhang, Y.; Ma, L.; Bhutta, M.S.; Li, Z.; Ni, W. LMDI decomposition of coal consumption in China based on the energy allocation diagram of coal flows: An. update for 2005–2020 with improved sectoral resolutions. Energy 2023, 285, 129266. [Google Scholar] [CrossRef]
  25. Zhao, Y.; Ma, L.; Li, Z.; Ni, W. A Calculation and Decomposition Method Embedding Sectoral Energy Structure for Embodied Carbon: A Case Study of China’s 28 Sectors. Sustainability 2022, 14, 2593. [Google Scholar] [CrossRef]
  26. Zhao, Y.; Kong, G.; Chong, C.H.; Ma, L.; Li, Z.; Ni, W. How to Effectively Control Energy Consumption Growth in China’s 29 Provinces: A Paradigm of Multi-Regional Analysis Based on EAALMDI Method. Sustainability 2021, 13, 1093. [Google Scholar] [CrossRef]
  27. Heinonen, J.; Ottelin, J.; Guddisardottir, A.K.; Junnila, S. Spatial consumption-based carbon footprints: Two definitions, two different outcomes. Environ. Res. Commun. 2022, 4, 25006. [Google Scholar] [CrossRef]
  28. Wen, W.; Wang, Q. Re-examining the realization of provincial carbon dioxide emission intensity reduction targets in China from a consumption-based accounting. J. Clean. Prod. 2020, 244, 118488. [Google Scholar] [CrossRef]
  29. Karakaya, E.; Yilmaz, B.; Alatas, S. How production-based and consumption-based emissions accounting systems change climate policy analysis: The case of CO2 convergence. Environ. Sci. Pollut. Res. 2019, 26, 16682–16694. [Google Scholar] [CrossRef]
  30. Wang, X.; Tang, X.; Zhang, B.; McLellan, B.C.; Lv, Y. Provincial Carbon Emissions Reduction Allocation Plan in China Based on Consumption Perspective. Sustainability 2018, 10, 1342. [Google Scholar] [CrossRef]
  31. Xie, R.; Hu, G.; Zhang, Y.; Liu, Y. Provincial transfers of enabled carbon emissions in China: A supply-side perspective. Energ. Policy 2017, 107, 688–697. [Google Scholar] [CrossRef]
  32. Peters, G.P. From production-based to consumption-based national emission inventories. Ecol. Econ. 2008, 65, 13–23. [Google Scholar] [CrossRef]
  33. Du, Y.; Liu, H.; Huang, H. Bibliometric Analysis of Research Progress and Trends on Carbon Emission Responsibility Accounting. Sustainability 2024, 16, 3721. [Google Scholar] [CrossRef]
  34. Chen, W.; Lei, Y.; Feng, K.; Wu, S.; Li, L. Provincial emission accounting for CO2 mitigation in China: Insights from production, consumption and income perspectives. Appl. Energ. 2019, 255, 113754. [Google Scholar] [CrossRef]
  35. Zhou, H.; Ping, W.; Wang, Y.; Wang, Y.; Liu, K. China’s initial allocation of interprovincial carbon emission rights considering historical carbon transfers: Program design and efficiency evaluation. Ecol. Indic. 2021, 121, 106918. [Google Scholar] [CrossRef]
  36. Wang, M.; Kuusi, T. Trade flows, carbon leakage, and the EU Emissions Trading System. Energ. Econ. 2024, 134, 107556. [Google Scholar] [CrossRef]
  37. Bai, H.; Zhang, Y.; Wang, H.; Huang, Y.; Xu, H. A Hybrid Method for Provincial Scale Energy-related Carbon Emission Allocation in China. Environ. Sci. Technol. 2014, 48, 2541–2550. [Google Scholar] [CrossRef]
  38. Cheng, Y.; Tan, X.; Gu, B.; Huang, C.; Yan, H.; Niu, M. Emphasizing egalitarianism in the allocation of China’s provincial carbon emission allowances. J. Clean. Prod. 2023, 395, 136403. [Google Scholar] [CrossRef]
  39. Qin, Q.; Liu, Y.; Li, X.; Li, H. A multi-criteria decision analysis model for carbon emission quota allocation in China’s east coastal areas: Efficiency and equity. J. Clean. Prod. 2017, 168, 410–419. [Google Scholar] [CrossRef]
  40. Zhang, Y. Provincial responsibility for carbon emissions in China under different principles. Energ. Policy 2015, 86, 142–153. [Google Scholar] [CrossRef]
  41. Zhu, Q.; Xu, C.; Pan, Y.; Wu, J. Identifying critical transmission sectors, paths, and carbon communities for CO2 mitigation in global supply chains. Renew. Sustain. Energy Rev. 2024, 191, 114183. [Google Scholar] [CrossRef]
  42. Fang, G.; Huang, M.; Zhang, W.; Tian, L. Exploring global embodied carbon emissions transfer network—An analysis based on national responsibility. Technol. Forecast. Soc. 2024, 202, 123284. [Google Scholar] [CrossRef]
  43. Chen, B.; Li, J.S.; Wu, X.F.; Han, M.Y.; Zeng, L.; Li, Z.; Chen, G.Q. Global energy flows embodied in international trade: A combination of environmentally extended input–output analysis and complex network analysis. Appl. Energ. 2018, 210, 98–107. [Google Scholar] [CrossRef]
  44. Ju, H.; Zeng, G.; Zhang, S. Inter-provincial flow and influencing factors of agricultural carbon footprint in China and its policy implication. Environ. Impact Asses. 2024, 105, 107419. [Google Scholar] [CrossRef]
  45. Stadler, K.; Wood, R.; Bulavskaya, T.; Södersten, C.; Simas, M.; Schmidt, S.; Usubiaga, A.; Acosta-Fernández, J.; Kuenen, J.; Bruckner, M.; et al. EXIOBASE 3: Developing a Time Series of Detailed Environmentally Extended Multi-Regional Input-Output Tables. J. Ind. Ecol. 2018, 22, 502–515. [Google Scholar] [CrossRef]
  46. Yang, H.; Ma, L.; Li, Z. A Method for Analyzing Energy-Related Carbon Emissions and the Structural Changes: A Case Study of China from 2005 to 2015. Energies 2020, 13, 2076. [Google Scholar] [CrossRef]
  47. Yang, X.; Yang, H.; Arras, M.; Chong, C.H.; Ma, L.; Li, Z. Unveiling the Energy Transition Process of Xinjiang: A Hybrid Approach Integrating Energy Allocation Analysis and a System Dynamics Model. Sustainability 2024, 16, 4704. [Google Scholar] [CrossRef]
  48. Tukker, A.; Poliakov, E.; Heijungs, R.; Hawkins, T.; Neuwahl, F.; Rueda-Cantuche, J.M.; Giljum, S.; Moll, S.; Oosterhaven, J.; Bouwmeester, M. Towards a global multi-regional environmentally extended input–output database. Ecol. Econ. 2009, 68, 1928–1937. [Google Scholar] [CrossRef]
  49. Ronald, E.M.; Peter, D.B. Input-Output Analysis: Foundations and Extensions, 2nd ed.; Cambridge University Press: Cambridge, UK, 2009. [Google Scholar]
  50. National Bureau of Statistics of China China Energy Statistical Yearbook 2018, 1st ed.; China Statistics Press: Beijing, China, 2019; pp. 128–307.
  51. Li, T.; Liu, P.; Li, Z. A multi-period and multi-regional modeling and optimization approach to energy infrastructure planning at a transient stage: A case study of China. Comput. Chem. Eng. 2020, 133, 106673. [Google Scholar] [CrossRef]
  52. Li, T.; Li, Z.; Li, W. Scenarios analysis on the cross-region integrating of renewable power based on a long-period cost-optimization power planning model. Renew. Energ. 2020, 156, 851–863. [Google Scholar] [CrossRef]
  53. Li, T.; Liu, P.; Li, Z. Quantitative relationship between low-carbon pathways and system transition costs based on a multi-period and multi-regional energy infrastructure planning approach: A case study of China. Renew. Sustain. Energy Rev. 2020, 134, 110159. [Google Scholar] [CrossRef]
  54. China Electricity Council 2018 China Electric Power Yearbook, 1st ed.; China Electric Power Press: Beijing, China, 2018.
  55. Xing, R.; Luo, Z.; Zhang, W.; Xiong, R.; Jiang, K.; Meng, W.; Meng, J.; Dai, H.; Xue, B.; Shen, H.; et al. Household fuel and direct carbon emission disparity in rural China. Environ. Int. 2024, 185, 108549. [Google Scholar] [CrossRef]
  56. World Bank Group Exports of Goods and Services (% of GDP)—China. Available online: https://data.worldbank.org/indicator/NE.EXP.GNFS.ZS?locations=CN (accessed on 23 August 2025).
  57. Zhu, Q.; Xu, C.; Lee, C. Trade-induced carbon-economic inequality within China: Measurement, sources, and determinants. Energ. Econ. 2024, 136, 107731. [Google Scholar] [CrossRef]
  58. Zhang, W.; Yang, M.; Ge, J.; Wang, G. Inter-provincial embodied carbon emission space and industrial transfer paths in China. PLoS ONE 2024, 19, e0300478. [Google Scholar] [CrossRef]
  59. Han, M.; Yao, Q.; Lao, J.; Tang, Z.; Liu, W. China’s intra- and inter-national carbon emission transfers by province: A nested network perspective. Sci. China Earth Sci. 2020, 63, 852–864. [Google Scholar] [CrossRef]
  60. Notice on the Issuance of the List of Large-Scale Wind and Photovoltaic Power Base Construction Projects Focusing on Desert, Gobi, and Arid Regions (First Batch). Available online: https://hbdrc.hebei.gov.cn/tzgl_1235/202309/W020230906816478743683.pdf (accessed on 23 August 2025).
  61. China’s Total Installed Capacity of Wind and Solar Power Exceeds 1.2 Billion Kilowatts, Fulfilling Its Promise Six Years Ahead of Schedule. Available online: https://www.nea.gov.cn/2024-11/08/c_1310787160.htm (accessed on 23 August 2025).
  62. Hennequin, T.; Hilbers, J.P.; Wilting, H.C.; Ivanova, O.; Kuenen, J.J.P.; Hauck, M.; van Zelm, R.; Huijbregts, M.A.J. Greenhouse gas footprints of economic sectors at the subnational European scale. J. Clean. Prod. 2025, 514, 145761. [Google Scholar] [CrossRef]
  63. Caron, J.; Metcalf, G.; Reilly, J. The CO2 Content of Consumption Across US Regions: A Multi-Regional Input-Output (MRIO) Approach. Energ. J. 2017, 38, 1–22. [Google Scholar] [CrossRef]
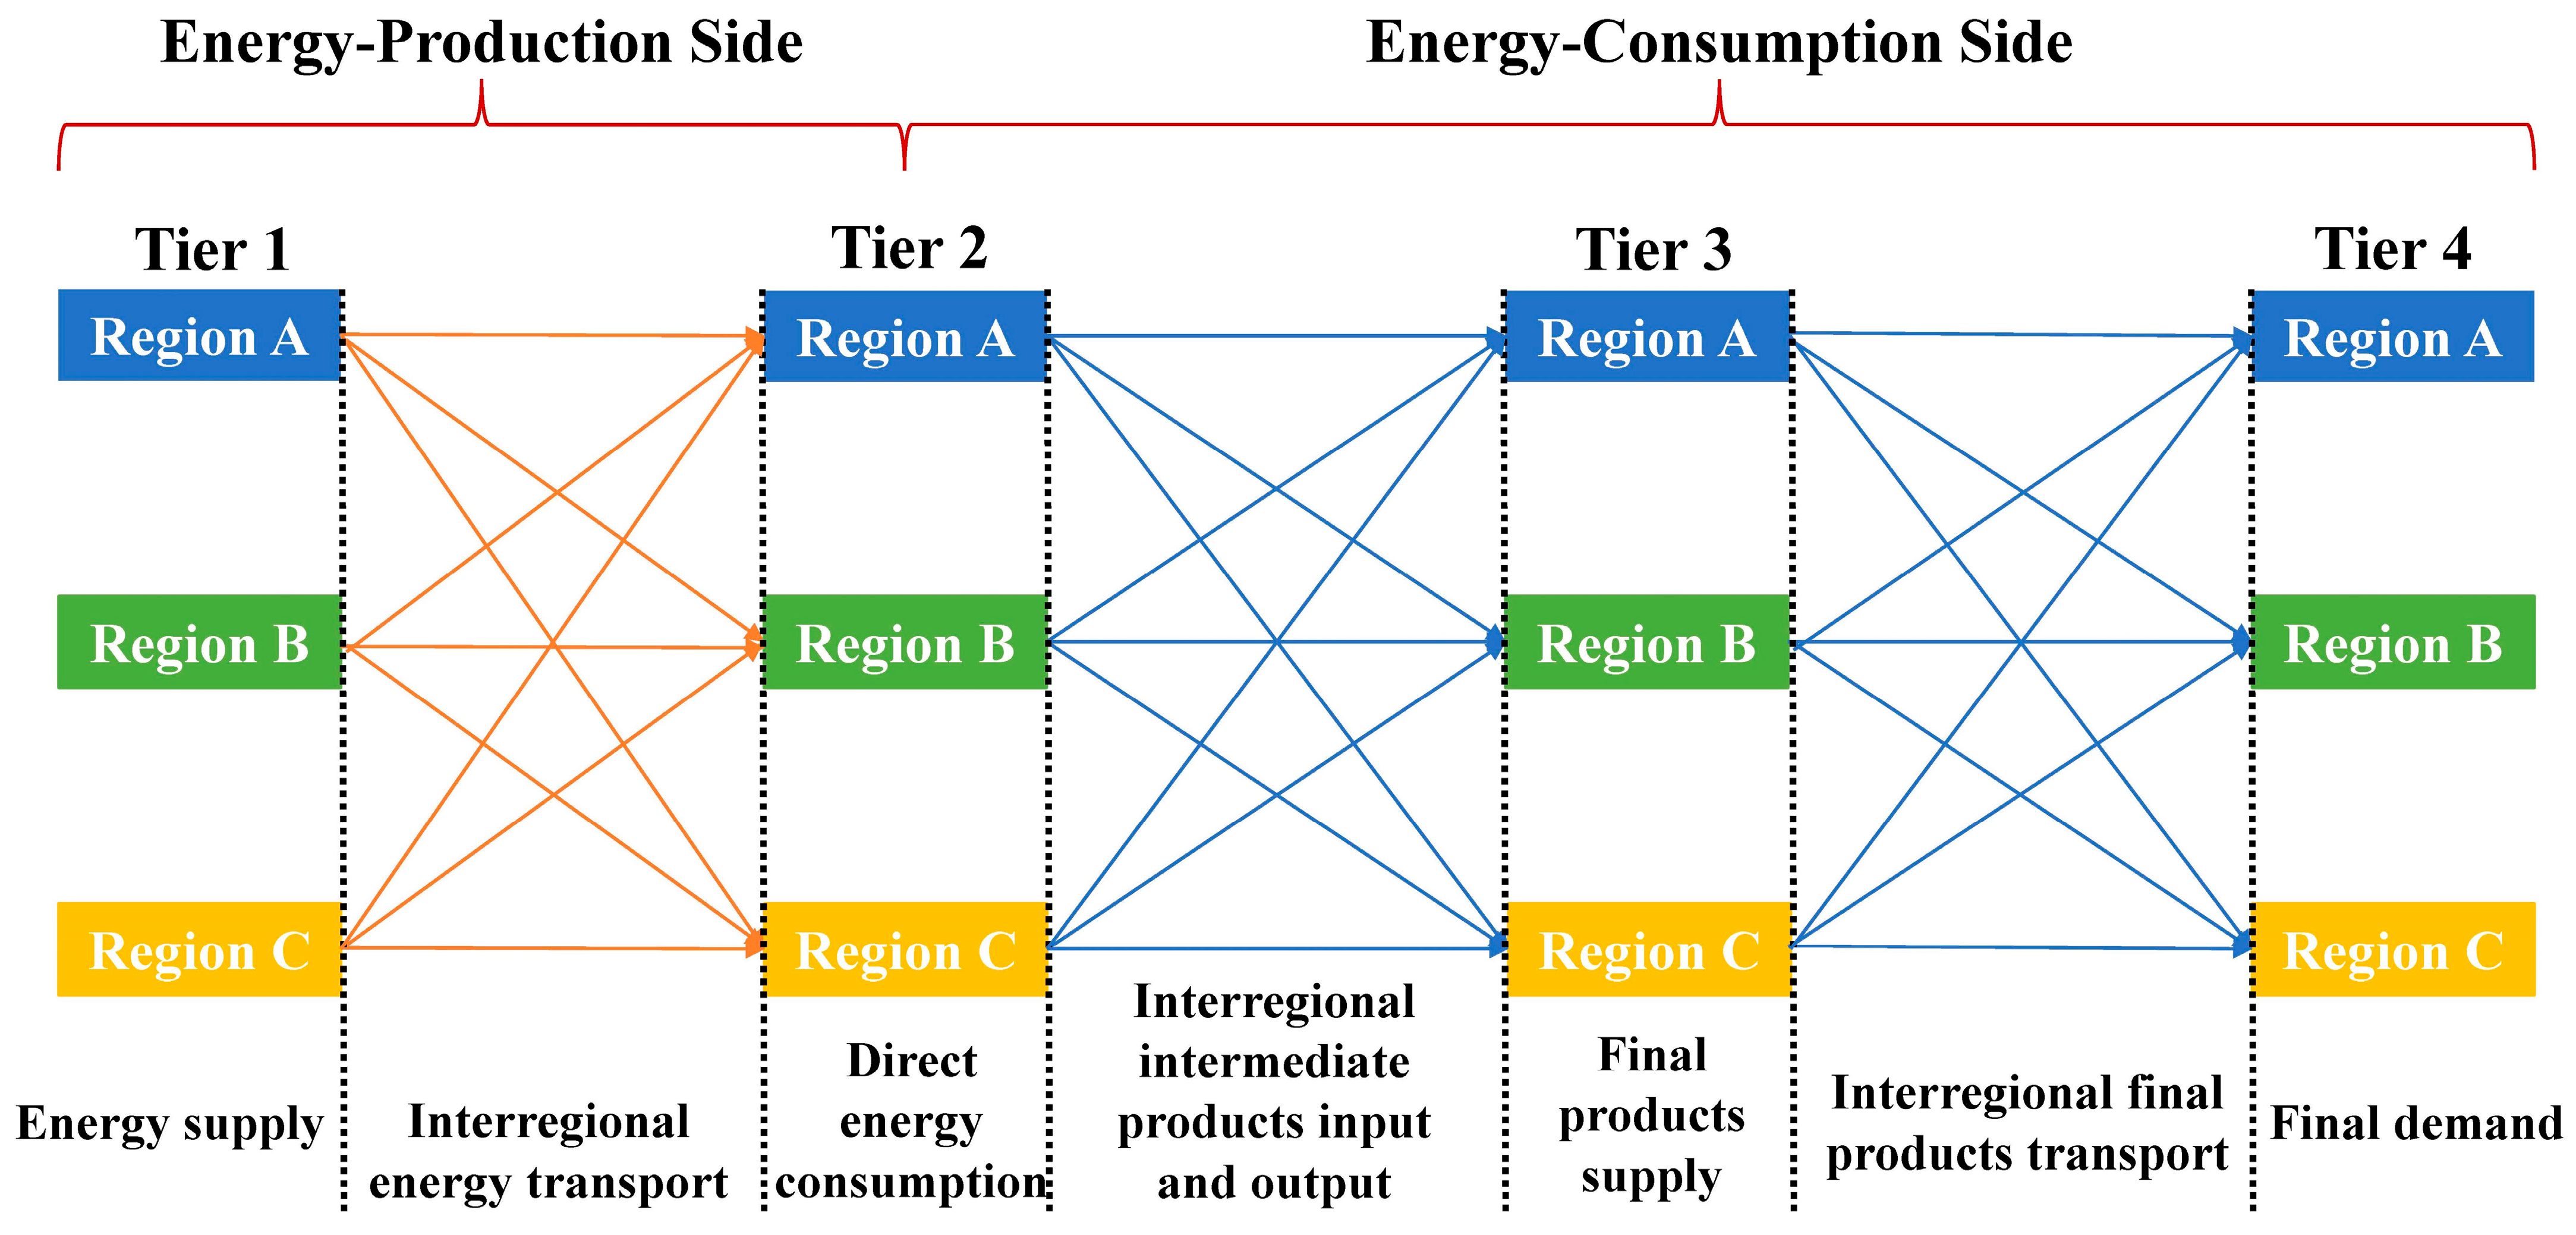
Figure 1. The framework of multi-regional energy supply chain.
Sustainability 17 08166 g001
Figure 2. The EE-MRIO model for measuring ERCERs on energy-consumption side.
Sustainability 17 08166 g002
Figure 3. Sankey diagram of China’s ERCERs transmission in 2017.
Sustainability 17 08166 g003
Figure 4. ERCERs of direct energy consumption in Tier 2 regions.
Sustainability 17 08166 g004
Figure 5. ERCERs of final products supply in Tier 3 regions.
Sustainability 17 08166 g005
Figure 6. ERCERs of final demand in Tier 4 regions.
Sustainability 17 08166 g006
Figure 7. Inter-regional transmission of ERCERs in energy, intermediate products, and final products transport.
Sustainability 17 08166 g007
Figure 8. Spatial shift and distribution of ERCERs in different tier regions.
Sustainability 17 08166 g008
Figure 9. Decomposition of ERCERs in final demand and direction carbon emissions in economic sectors.
Sustainability 17 08166 g009
Table 1. Inter-regional energy transport coefficient table of energy variety p.
Consumption
Supply
Region 1Region 2Region mExport
Region 1 λ p 11 λ p 12 λ p 1 m λ p 1 E
Region 2 λ p 21 λ p 22 λ p 2 m λ p 2 E
Region m λ p m 1 λ p m 2 λ p m m λ p m E
Import λ p M 1 λ p M 2 λ p M m 0
Table 2. CO2 emission factors of various energy varieties (unit: tCO2/tce).
Energy VarietyCoalOilNatural Gas
CO2 emissions factor2.661.731.56
Table 3. Classification of regions.
CategoryRegionEnergy TransportIntermediate Products TransportFinal Products TransportCharacteristics
1HB+++All three links exhibit a net inflow of ERCERs
GD+++
YN+++
2TJ++ Both energy and economic products transport exhibit a net inflow of ERCERs
ZJ++
SC++
HN+ +
QH+ +
3BJ++Energy transport represents a net inflow of ERCERs, whereas economic products transport involves both net inflows and outflows of ERCERs
JS++
HIN++
CQ++
GS++
NX++
4FJ+ Energy transport exhibits a net inflow of ERCERs, whereas economic products transport shows a balance
JX+
HUN+
GX+
5HEB+ Energy transport exhibits a net inflow of ERCERs, whereas economic products transport shows a net outflow of ERCERs
SD+
SH+
AH+
LN+
JL+
6HLJ +Energy is basically self-sufficient
XZ ++
7GZ +Energy transport exhibits a net outflow of ERCERs; intermediate products transport tends to involve an outflow of ERCERs, whereas final products transport tends to involve an inflow
SHX
SX+
XJ+
IM
Note: “+” represents a net inflow, “−” represents a net outflow, and null means a balance between inflow and outflow.
Disclaimer/Publisher’s Note: The statements, opinions and data contained in all publications are solely those of the individual author(s) and contributor(s) and not of MDPI and/or the editor(s). MDPI and/or the editor(s) disclaim responsibility for any injury to people or property resulting from any ideas, methods, instructions or products referred to in the content.