Article

Impact of Sub-Cloud Evaporation on Precipitation in Tropical Monsoon Islands

1
College of Geography and Environmental Science, Hainan Normal University, Haikou 571158, China
2
Key Laboratory of Earth Surface Processes and Environmental Change of Tropical Islands, Haikou 571158, China
*
Author to whom correspondence should be addressed.
Sustainability 2025, 17(18), 8161; https://doi.org/10.3390/su17188161
Submission received: 5 July 2025 / Revised: 28 August 2025 / Accepted: 9 September 2025 / Published: 10 September 2025

Abstract

Sub-cloud evaporation changes the isotopic composition of precipitation, which greatly reduces the reliability of precipitation isotopic data as precipitation simulation data. This study employed the precipitation isotope datasets of Haikou in northern Hainan Island from June 2020 to February 2024 to quantitatively study the influence of sub-cloud evaporation on precipitation isotopes in tropical islands. Due to the sub-cloud evaporation, the slope of the local meteoric water line (LMWL: δ2H = 8.33δ18O + 14.33) is lower than the average slope of the theoretical LMWL (8.48). The average value of the residual ratios of raindrop after evaporation (f) is 86%. The complex and unstable sources of water vapor result in no obvious seasonal variations in the atmospheric humidity, which in turn leads to no obvious seasonal variations in Δd and f. The humid and hot environmental conditions reduced the impact of sub-cloud evaporation on precipitation isotopes. The two main uncertainties in the simulation of below-cloud evaporation are the influence of recycled water vapor on precipitation isotopes and the Stewart model’s assumption that raindrops at the cloud base achieve isotopic equilibrium with the surrounding water vapor, as it is difficult to realize. The results of this study are of great significance for improving the accuracy of precipitation simulation in tropical monsoon islands.

Graphical Abstract

1. Introduction

Tropical islands, due to their unique geographical location and climate sensitivity, have become key areas for revealing the interactions between the atmosphere, ocean and land [1,2,3]. The spatio-temporal differentiation characteristics of the precipitation on tropical islands profoundly influence the ecosystem vulnerability and regional sustainability [4,5]. However, simulating the precipitation over tropical islands with high resolution still presents challenges due to significant technical difficulties [6]. As natural tracers of the water cycle process, precipitation isotopes (δ2H and δ18O) have unique diagnostic functions in precipitation simulation studies [7,8,9,10]. The precipitation isotope fractionation characteristics (such as the Rayleigh fractionation equation) can quantitatively analyze the properties of water vapor sources, the phase change history of transportation paths, and the microphysical processes of local precipitation formation, thereby providing a physical mechanism verification benchmark for water cycle parameterization schemes in climate models [8,11,12]. However, the current application of isotopes in models still faces challenges relating to the interference of sub-cloud evaporation, uncertainties pertaining to fractionation coefficients during phase change, and the mixing of reevaporated water vapor from the land surface [13,14,15,16].
Research on precipitation isotopes in tropical islands is relatively scarce compared with that of other regions. However, previous studies have shown that, from the perspective of event scale, the changes in the isotopic composition of precipitation on tropical islands are mainly affected by precipitation weather systems (such as cold front precipitation, tropical convective precipitation, tropical cyclone precipitation, etc.) [17,18,19]. Precipitation from different weather systems has distinct water vapor sources, leading to significant differences in their isotopic compositions. On a longer time scale, variation in the isotopic composition of precipitation in tropical islands depends on the precipitation process in the surrounding areas. It is controlled by multiple factors, including the seasonal variation in the climate characteristics of water vapor sources, often showing a certain seasonal variation periodicity [20,21,22,23]. However, regardless of the timescale, the sub-cloud evaporation process is an important process affecting the isotopic composition of precipitation on tropical islands [24,25].
The unique high-temperature and high-humidity environment, coupled with frequent shallow convective precipitation systems on tropical islands, causes significant sub-cloud evaporation when raindrops pass through the unsaturated environment beneath the clouds. This process can lead to abnormal enrichment of precipitation isotopes (δ2H and δ18O) and systematic shift in stable isotope signals (d-excess) in liquid water by altering the raindrop size distribution and the isotope fractionation [25,26,27]. Deepening the research on the sub-cloud evaporation of precipitation in tropical islands can not only optimize the relevant parameters of precipitation models. It can also provide theoretical support for the sustainable utilization and management of regional water resources [2,28,29]. However, the research on the influence of sub-cloud evaporation on precipitation mainly focuses on arid and semi-arid areas and temperate regions [30,31,32,33]. Quantitative studies on the tropical islands are still insufficient.
Hainan Island is a typical tropical island located in the northern margin of the tropics, belonging to the tropical monsoon climate. The significant spatial and temporal variations in precipitation lead to extremely high uncertainties in precipitation forecasting and hydrological simulation [34,35]. However, until now, precipitation isotope monitoring data in this region is extremely scarce, and the impact of sub-cloud evaporation on regional precipitation is not well understood. Therefore, based on the precipitation isotope data of Hainan Island, this study aims to (1) estimate the impact of sub-cloud evaporation on precipitation in tropical monsoon islands; (2) analyze the factors influencing sub-cloud evaporation of precipitation in tropical monsoon islands; (3) and explore the sources of its uncertainties.

2. Materials and Methods

2.1. Study Area

Hainan Island is a typical continental island located in the south of China, on the northern edge of the tropics. It is located between 18°09′ and 20°10′ north latitude and 108°03′ and 111°03′ east longitude (Figure 1). The total area of the island is 33,920 km2, and the coastline around the island measures 1528 km. The entire island is pear-shaped, and its long axis extends from northeast to southwest. The terrain is high in the center and low in the surrounding areas, with Wuzhishan Mountain in the central part of the island as the core, and a circular layered landform has gradually formed around it, consisting of mountains, hills, tablelands, and plains. Hainan Island has a typical tropical monsoon climate, characterized by distinct dry and rainy seasons. There is less precipitation in winter and spring, and more precipitation in summer and autumn. Tropical cyclones contribute significantly to precipitation. The annual temperature range is small with the annual average temperature is high, for example, in 2023, the average temperature was 25.4 °C, 0.6 °C higher than normal. The average temperature is the lowest in January, at 18.4 °C, and the highest average temperature occurs in July, at 29.3 °C (Figure 1). The total annual precipitation was 1776.5 mm, 3.4% less than the long-term average annual value. The precipitation during the rainy season (from May to November) accounts for 93.0% of the total annual precipitation. In 2023, the island was affected by a total of 5 tropical cyclones and 14 regional rainstorm processes (Hainan Meteorological Information Service Network: http://hi.cma.gov.cn/zfxxgk/zwgk/jgyzn/jgsz/zsdw/202008/t20200812_4609353.html (accessed on 10 September 2024).

2.2. Datasets

2.2.1. Precipitation Isotope Data

Precipitation samples were collected in the atmospheric park of Hainan Normal University using standard rain gauges; the collection began in June 2020 and is still ongoing. The data used in this study cover the period from June 2020 to February 2024, with a total of 298 rainwater samples were collected in 10 mL clean and dry brown glass sampling bottles with threaded caps after each precipitation event. We also simultaneously recorded the amount of precipitation before sampling. The number of precipitation samples in each month is shown in Figure 1a. All samples were collected for three replicates. After the samples were collected, they were immediately sealed with parafilm and stored in a refrigerator at −18 °C before measuring the stable isotope composition of hydrogen and oxygen. The samples were measured at the Institute of Geographic Sciences and Natural Resources Research, Chinese Academy of Sciences, using the Picarro L2140-i ultra-high precision liquid water and water vapor isotope analyzer. The measurement indicators included the isotopic compositions of 18O and 2H. To eliminate the memory effect, each sample was injected six times. The data affected by residues in the first two injections were discarded, and the subsequent stable values were taken as the final result. The stable water isotopes were expressed as a δ notation per mil (‰) difference from the Vienna standard mean ocean water (VSMOW) [36]. The measurement precision of δ18O was 0.025‰, and that of δD as 0.100‰.

2.2.2. Meteorological Data

The daily meteorological data of Haikou from June 2020 to February 2024 were downloaded from the China Meteorological Data Service Center (https://data.cma.cn/ (accessed on 10 September 2024)). The dataset includes daily precipitation, daily average temperature, daily maximum temperature, daily minimum temperature, daily average relative humidity, and daily minimum relative humidity.

2.3. Methods

2.3.1. The Slope of the Theoretical Local Meteoric Water Line (LMWL) and Theoretical Local Evaporation Line (LEVL)

(1)
The slope of the theoretical LMWL
After raindrops form, they quickly separate from the gas phase of the cloud cluster, and this process is accompanied by the Rayleigh equilibrium fractionation process [37]:
R i R 0 i = 1 + δ i 1 + δ 0 i = f α i 1
where i is O 18 and H 2 . R and R 0 are the isotope ratios of the evaporating water and the initial water, respectively. δ and δ0 are the isotope compositions of the evaporating water and the initial water, respectively. f is the evaporation rate, and α is the equilibrium fractionation coefficient of isotopes.
Take the logarithm of Formula (1):
δ 18 O δ 18 O 0 α 18 1 ln f
δ 2 H δ 2 H 0 α 2 1 ln f
Then, the slope of the theoretical LMWL:
S = δ 2 H δ 2 H 0 δ 18 O δ 18 O 0 α 2 1 α 18 1
The slope of the theoretical LMWL assumes isotopic equilibrium during rainfall formation, ignoring the supersaturated conditions within the cloud and the sub-cloud evaporation. The greater the difference between the theoretical slope of LMWL and the actual slope of LMWL, the more intense the sub-cloud evaporation [37].
Under the equilibrium condition of water vapor exchange, the equilibrium fractionation coefficient α is controlled by the absolute temperature (T/K). The calculation formula is as follows [38]:
1 0 3 ln 18 α = 1.137 × 1 0 6 / T 2 0.4156 × 1 0 3 / T 2.0667
1 0 3 ln 2 α = 24.844 × 1 0 6 / T 2 76.248 × 1 0 3 / T + 52.612
(2)
The slope of the theoretical LEVL
The slope of the theoretical LEVL can be derived from the isotope composition of precipitation ( δ P ) and the isotope composition of water vapor ( δ A ) [39,40,41,42]. The higher the slope of the theoretical LEVL, the more intense the surface evaporation.
S L E V L = h · 10 3 · δ A 10 3 · δ P + 1 + 10 3 · δ P · 10 3 · ε h 10 3 · ε H h · 10 3 · δ A 10 3 · δ P + 1 + 10 3 · δ P · 10 3 · ε h 10 3 · ε O
where ε is the total enrichment coefficient.
ε = ε e q / α + ε d i f f
where ε e q is the equilibrium enrichment coefficient; ε d i f f is the kinetic enrichment coefficient.
ε i e q = 1000   *   α i 1
According to the Craig–Gordon model, the kinetic enrichment coefficient ( ε i d i f f ), which represents the isotope fractionation caused by molecular diffusion, can be calculated using the Formula [43]:
ε i d i f f = n Θ 1 h N 1 D m D m i 1000 = n Θ 1 h N Δ i d i f f
where n 0.5 n 1 is a factor reflecting the characteristics of the air boundary layer at the evaporation surface. For natural water in the natural state, n = 0.5, for evaporation in a static air layer, such as soil and leaf evaporation, n = 1 [44,45]. The value of Θ ranges from 0.5 to 1. For small water bodies where the evaporated water vapor does not disturb the ambient humidity, Θ = 1, and the lower limit for large water bodies is Θ = 0.5 [45]. Δ i d i f f represents the maximum depletion of H 2 and O 18 in the diffusion layer. Merlivat (1978) calculated the molecular diffusion coefficients of (H218O)/(H216O) and ((1H2HO))/(1H2O) [46]. As D m D m i is equal to 0.9727 ± 0.0007 and 0.9757 ± 0.0009, respectively, for O18 and H2, Δ 18 d i f f = 28.5 ‰, Δ 2 d i f f = 25.5 ‰. h N is the normalized relative humidity, which can be calculated according to the following Formula [45]:
h N = h p S A T a i r p S A T w a t e r
where h is the relative humidity; p S A T a i r and p S A T w a t e r are the actual water vapor pressure at air temperature and the saturated water vapor pressure at water temperature, respectively.

2.3.2. Calculation of the Sub-Cloud Evaporation

Influenced by sub-cloud evaporation, the isotopic composition of surface precipitation differs from that of raindrops at cloud base. Stewart (1975) assumed that raindrops at cloud base reached isotopic equilibrium with the surrounding water vapor [47]. The difference between the d-excess of surface precipitation and the d-excess of raindrops at cloud base is Δd:
Δ d = 1 γ 2 α 2 f β 2 1 8 1 γ 18 α 18 f β 18 1
where 2α and 18α are equilibrium fractionation factors. f represents the residual ratio of raindrop after evaporation. γ 2 , γ 18 , β 2 and β 18 are defined by Stewart (1975) as [47]
γ 2 = α 2 h 1 α 2 D 2 D 2 n 1 h
γ 18 = α 18 h 1 α 18 D 18 D 18 n 1 h
β 2 = 1 α 2 D 2 D 2 n 1 h α 2 D 2 D 2 n 1 h
β 18 = 1 α 18 D 18 D 18 n 1 h α 18 D 18 D 18 n 1 h
where h is the relative humidity. With reference to Merlivat (1978), D 2 D 2 and D 18 D 18 are taken as 1.024 and 1.0289, respectively, and n = 0.58 [46].
f can be considered as the ratio of the mass of raindrops when they fall to the ground ( m e n d ) to the original mass of raindrops at cloud base ( m 0 ).
f = m e n d m 0 = m e n d m e n d + m e v
where m e v is the mass lost by raindrops due to evaporation during their fall.
m e v = r e v t
where r e v is the rate of mass evaporation loss of raindrops. t is the time taken for raindrops to fall from the cloud base to the ground.
Assuming that raindrops fall at a constant speed [48,49], the raindrop fall time is
t = H c v e n d
where H c is the falling height of raindrops (cloud base height), and v e n d is the terminal velocity of raindrop fall.
The terminal velocity v e n d (cm/s) of raindrops upon landing can be calculated using the method proposed by Best (1950) [50]:
v e n d = 958 exp 0.0354 H 1 exp D 1.77 1.147 , 0.3 D < 6.0 188 exp 0.0256 H 1 exp D 0.304 1.819 , 0.05 D < 0.3 2840 D 2 exp ( 0.0172 H ) , D < 0.05
where D is the diameter of the raindrop (mm) and H is the precipitation height (km), using the cloud base height used here.
The diameter of raindrops (D) is calculated using the empirical formula also proposed by Best (1950) [50]:
1 F = e D A I p n
where F is the proportion of liquid water in the atmosphere with a diameter smaller than D; I is the precipitation intensity (mm/h); and the parameters n, A, and p are constants, taking 2.25, 1.30, and 0.232, respectively.
The evaporation loss rate of raindrop mass r e v can be expressed as [51]
r e v = 4 π r 1 + K r S D ρ a ρ b = Q 1 Q 2
Q 1 = 4 π r 1 + K r S
Q 2 = D ρ a ρ b
where r is the raindrop radius (cm). K is a dimensionless quantity representing the ratio of the actual heat for measuring water vapor exchange to energy. S’ is the effective thickness of the raindrop outer wall. ρ a and ρ b are the vapor density of the evaporating water on the surface of the falling raindrop and the density of the surrounding air, respectively.
Q1 (cm) is insensitive to environmental humidity. It is mainly controlled by raindrop diameter and surrounding air temperature. Q2 ( g c m s e c ( ) ) is mainly controlled by humidity and raindrop diameter. Kinzer and Gunn (1951) determined the values of Q1 and Q2 through experiments under different conditions of temperature (0–40), raindrop diameter (0.01–0.44 cm), and relative humidity (10–100%) [51], but no specific mathematical relationships were derived. This paper uses bilinear interpolation to derive Q1 and Q2 under different conditions [31].

2.3.3. Hybrid Single-Particle Lagrangian Integrated Trajectory (HYSPLIT) Model

The HYSPLIT is a complete system which was developed by the Air Resources Laboratory of the National Oceanic and Atmospheric Administration for computing air parcel trajectories and simulate dispersion, chemical transformation, and deposition. This study utilized the HYSPLIT model to simulate the sources of water vapor in precipitation on Hainan Island. We used the dataset from Global Data Assimilation System (GDAS), with a spatial resolution of 1° × 1° [52]. The backward duration was set as 6 d. For each 6 h interval, if the specific humidity of the following time interval increases by more than 0.2 g/kg when compared to that in the previous time interval, the air parcel location at the previous time interval is identified as an evaporative source [52].

2.3.4. Assessment of Uncertainty

The uncertainty of the impact of sub-cloud evaporation on precipitation isotopes ( W ) can be calculated by the following methods [53]:
W = W δ 1 δ l o w e r δ u p p e r 2 + W δ 2 δ l o w e r δ u p p e r 2 + + W δ n δ l o w e r δ u p p e r 2 2
where δ l o w e r and δ u p p e r are, respectively, the study area Δd, which derived from the lower and upper limits of the input parameters, including the changes in temperature, relative humidity and precipitation. The W δ n of different terms represents the uncertainty of d-excess in each variable of Δd, which is caused by different input parameters.

3. Results

3.1. Temporal Variation in Precipitation Isotopes

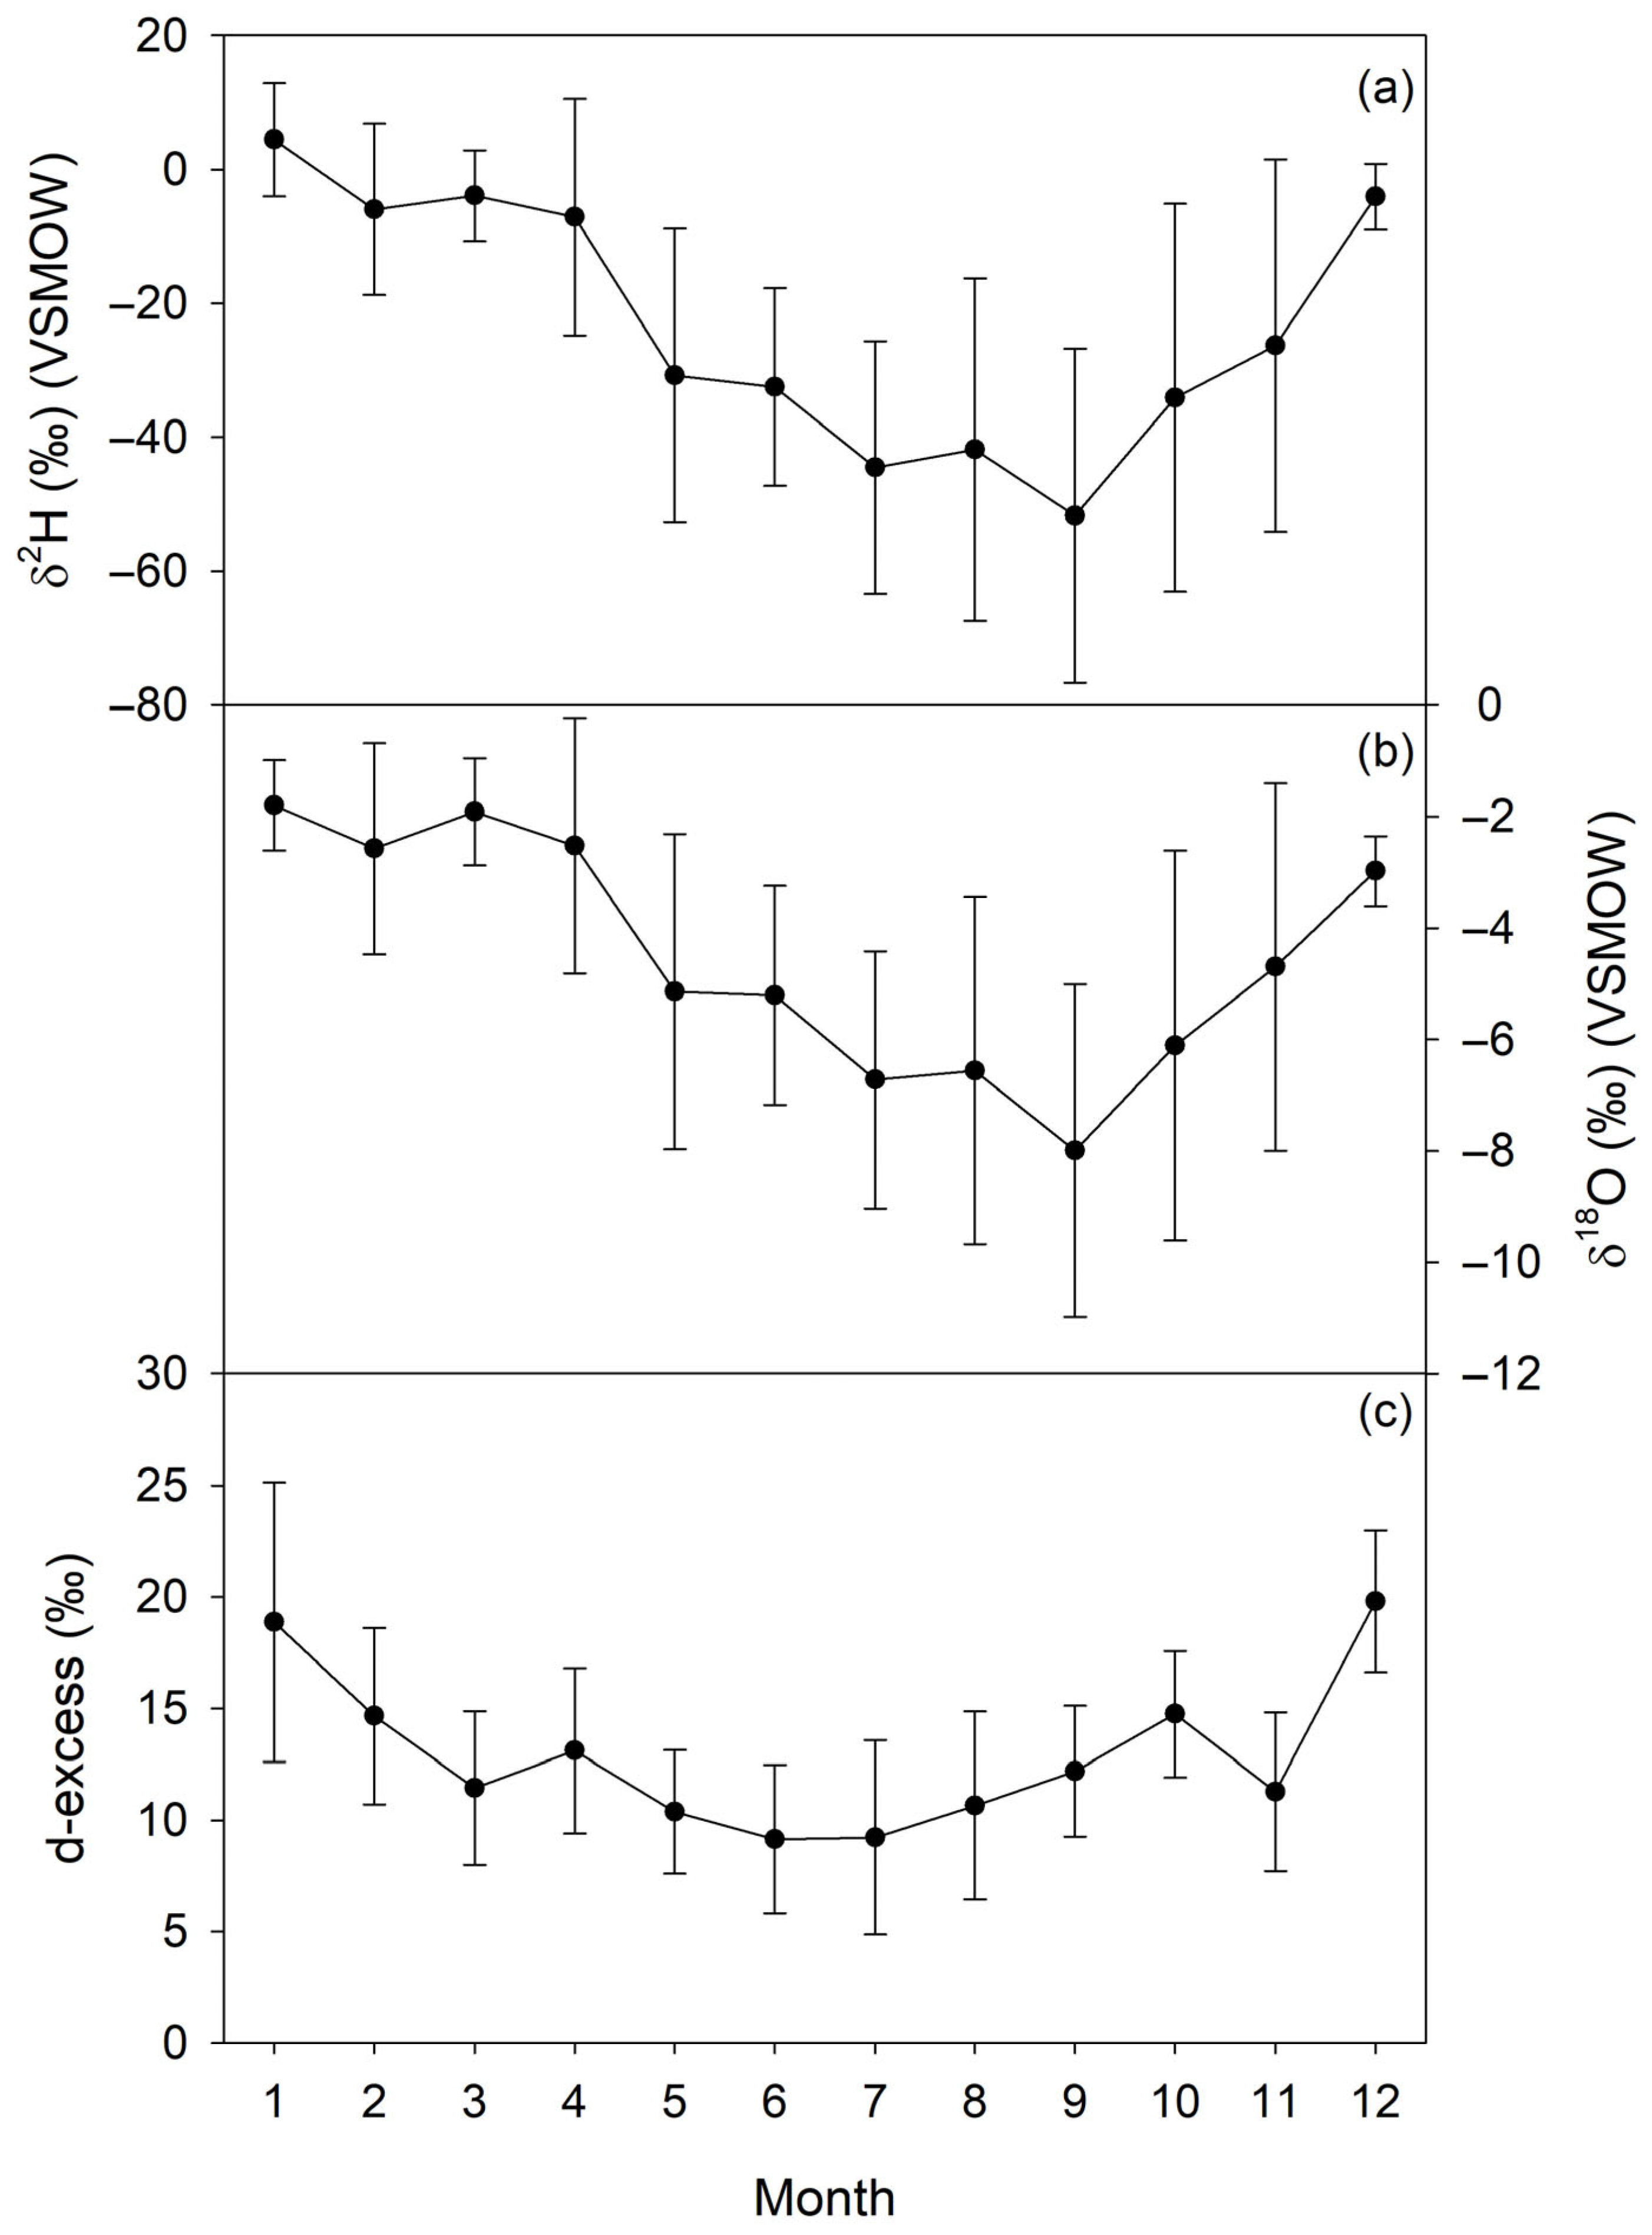
The monthly mean values of δ2H vary from −66.09‰ to 15.35‰, with an overall average of −26.66‰ (Figure 2). The monthly mean values of δ18O range from −9.16‰ to −1.24‰, with an overall average of −4.92‰. The variation range of d-excess is from −0.22‰ to 25.24‰, with an overall average of 12.69‰. There are unimodal seasonal variation characteristics for δ2H, δ18O, and d-excess of precipitation in Hainan Island. The monthly averages of δ2H and δ18O are high from December to April of the following year, and low from May to November, with the lowest in September and the highest in January. The d-excess is the highest in January (with a monthly mean of 18.88‰) and December (19.80‰), while from May to August, it is close to 10‰. In other months, it is higher than 11‰ but lower than 15‰. δ2H and δ18O are not correlated with relative humidity, but negatively correlated with air temperature, precipitation amount, and raindrop diameter (Figure 3). D-excess is not correlated with precipitation amount, negatively correlated with air temperature and raindrop diameter, and positively correlated with relative humidity.

3.2. Slopes of the Theoretical LMWL and LEVL

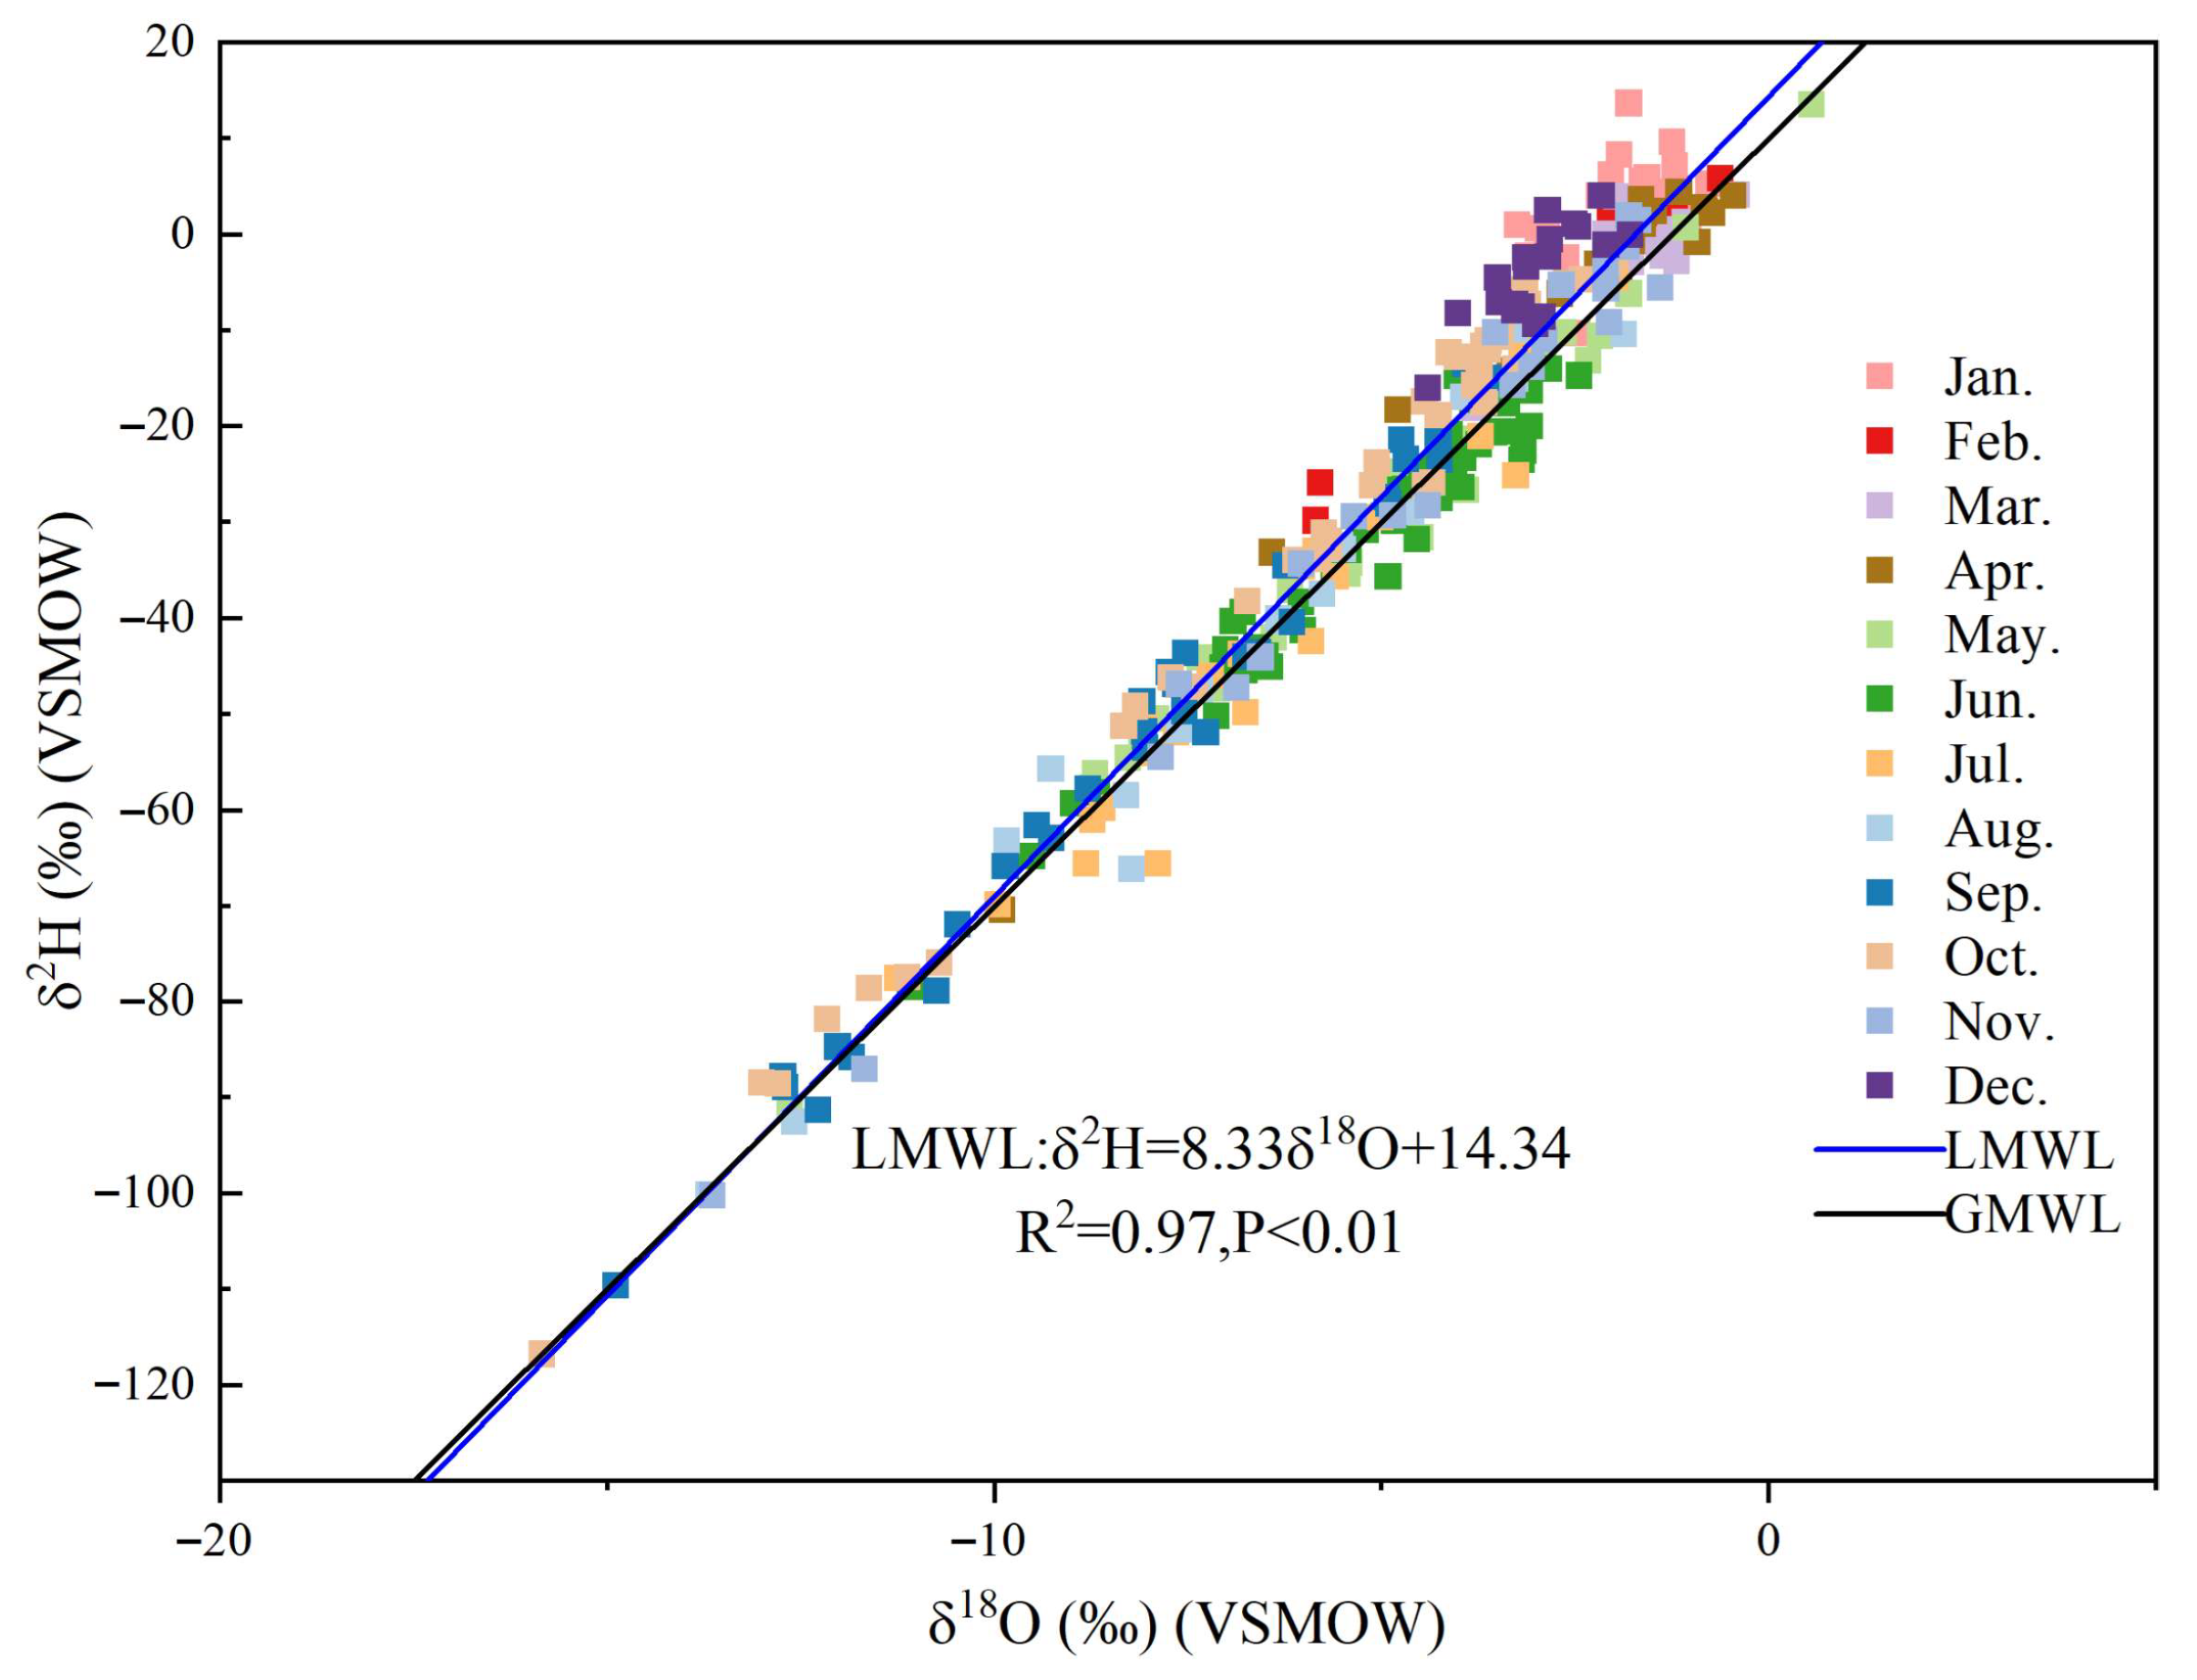
The LMWL in Hainan Island is δ2H = 8.33δ18O + 14.33 (Figure 4). The slope is slightly higher than the global meteoric water line (GMWL: δ2H = 8δ18O + 10) [54], but it is slightly lower than the average slope of the theoretical LMWL (8.48) (Table 1), indicating that precipitation is affected by the sub-cloud evaporation [26,37,55,56].
The slope of the LMWL in Hainan Island shows obvious seasonal variations. It is higher in the rainy season, among which the value from August to November is higher than 8, and lower than 8 in other months (Table 1). However, the slope of the theoretical LMWL is higher than 8 throughout the year, but slightly lower in the rainy season due to the high temperature. The average slope of the LEVL is 2.98, and is also characterized by higher values in the dry season and lower values in the rainy season. This is also due to the higher temperature in the rainy season.

3.3. Sub-Cloud Evaporation

The variation range of raindrop diameters in Hainan Island is 0.59–2.70 mm, with an average value of 1.58 mm. The seasonal variation is similar to the precipitation characteristics, with raindrop diameters larger in the rainy season and smaller in the dry season (Figure 5a). The variation range of the f in Hainan Island is 33–100%, with an annual average value of 86%. In addition to all the monthly average values being higher than 80%, with no obvious seasonal variation trend (Figure 5b). The Δd range from 0.37‰ to 5.68‰ (with an average value of 2.28‰), also with no significant seasonal variation trend (Figure 5c).

4. Discussion

4.1. Influencing Factors of Sub-Cloud Evaporation: Temperature, Relative Humidity and Precipitation

Both the sub-cloud evaporation calculation formula and numerous existing studies indicate that sub-cloud evaporation is primarily influenced by factors such as air temperature, relative humidity, and precipitation intensity. In Calgary, Alberta, Canada, which is influenced by both temperate continental climate and mountain climate, the slope of the LMWL decreases as precipitation decreases [57], which indicates that small precipitation events are more affected by sub-cloud evaporation. Graf’s (2019) study also points out that the greater the rainfall intensity, the weaker the sub-cloud evaporation [58]. The simulation results of Salamalikis (2016) indicate that relative humidity is an ideal indicator of the sub-cloud evaporation effect [26]. In the arid region of northwestern China influenced by a temperate continental climate, the intensity of sub-cloud evaporation during precipitation increases with the decrease in precipitation, the rise in temperature, and the reduction in relative humidity [31,59,60]. Against the background of climate warming, there is a risk that sub-cloud evaporation will increasingly impact on precipitation in arid regions [60]. The Shiyang River Basin, also located in the arid region of northwestern China, exhibits obvious spatio-temporal variations in sub-cloud evaporation [61]. In terms of time, the intensity of sub-cloud evaporation follows the order: summer < autumn < winter < spring. Spatially, the evaporation intensity in mountainous areas is lower than that in oases and deserts. In mountainous areas, the evaporation intensity decreases with the increase in altitude, while the evaporation intensity is reduced near reservoirs. In summary, the higher the relative humidity, the weaker the sub-cloud evaporation. In the Yangtze River Basin, there are also significant spatio-temporal differences in sub-cloud evaporation [62]. However, in general, when the rainfall is less than 5 mm, the temperature is higher than 30 °C, vapor pressure is lower than 3 hPa, relative humidity is between 50% and 60%, the raindrop diameter is between 0.5 and 1 mm, and the sub-cloud secondary evaporation effect is most obvious. In Xi’an, which is located in the temperate monsoon climate zone, the results of sub-cloud evaporation simulated by different models all show that relative humidity is the most sensitive parameter [53]. In general, the sub-cloud evaporation of precipitation in mainland China is positively correlated with air temperature and negatively correlated with relative humidity [63]. In arid and semi-arid regions of China, it is much greater than that in humid and semi-humid regions. However, under cold-dry or hot-humid conditions, the impact of sub-cloud evaporation on precipitation isotopes can be weaken. Over the past 50 years, due to the combined effect of rising temperatures and decreasing relative humidity, the sub-cloud evaporation effect has intensified in cold regions and arid regions of China, particularly on the Qinghai–Tibet Plateau and in Inner Mongolia. However, Sarkar et al. (2023), analyzed the sub-cloud evaporation of rainfall in the winter trade wind zone in the North Atlantic by simulating the changes in raindrop size, relative humidity, and rain isotope composition using a one-dimensional steady-state model, and found that relative humidity itself cannot reflect well the sub-cloud evaporation of rain [64]. However, the existing studies on sub-cloud evaporation of precipitation mainly focus on the temperate continental climate or temperate arid environment, which is significantly different from the hot and humid environment of Hainan Island.
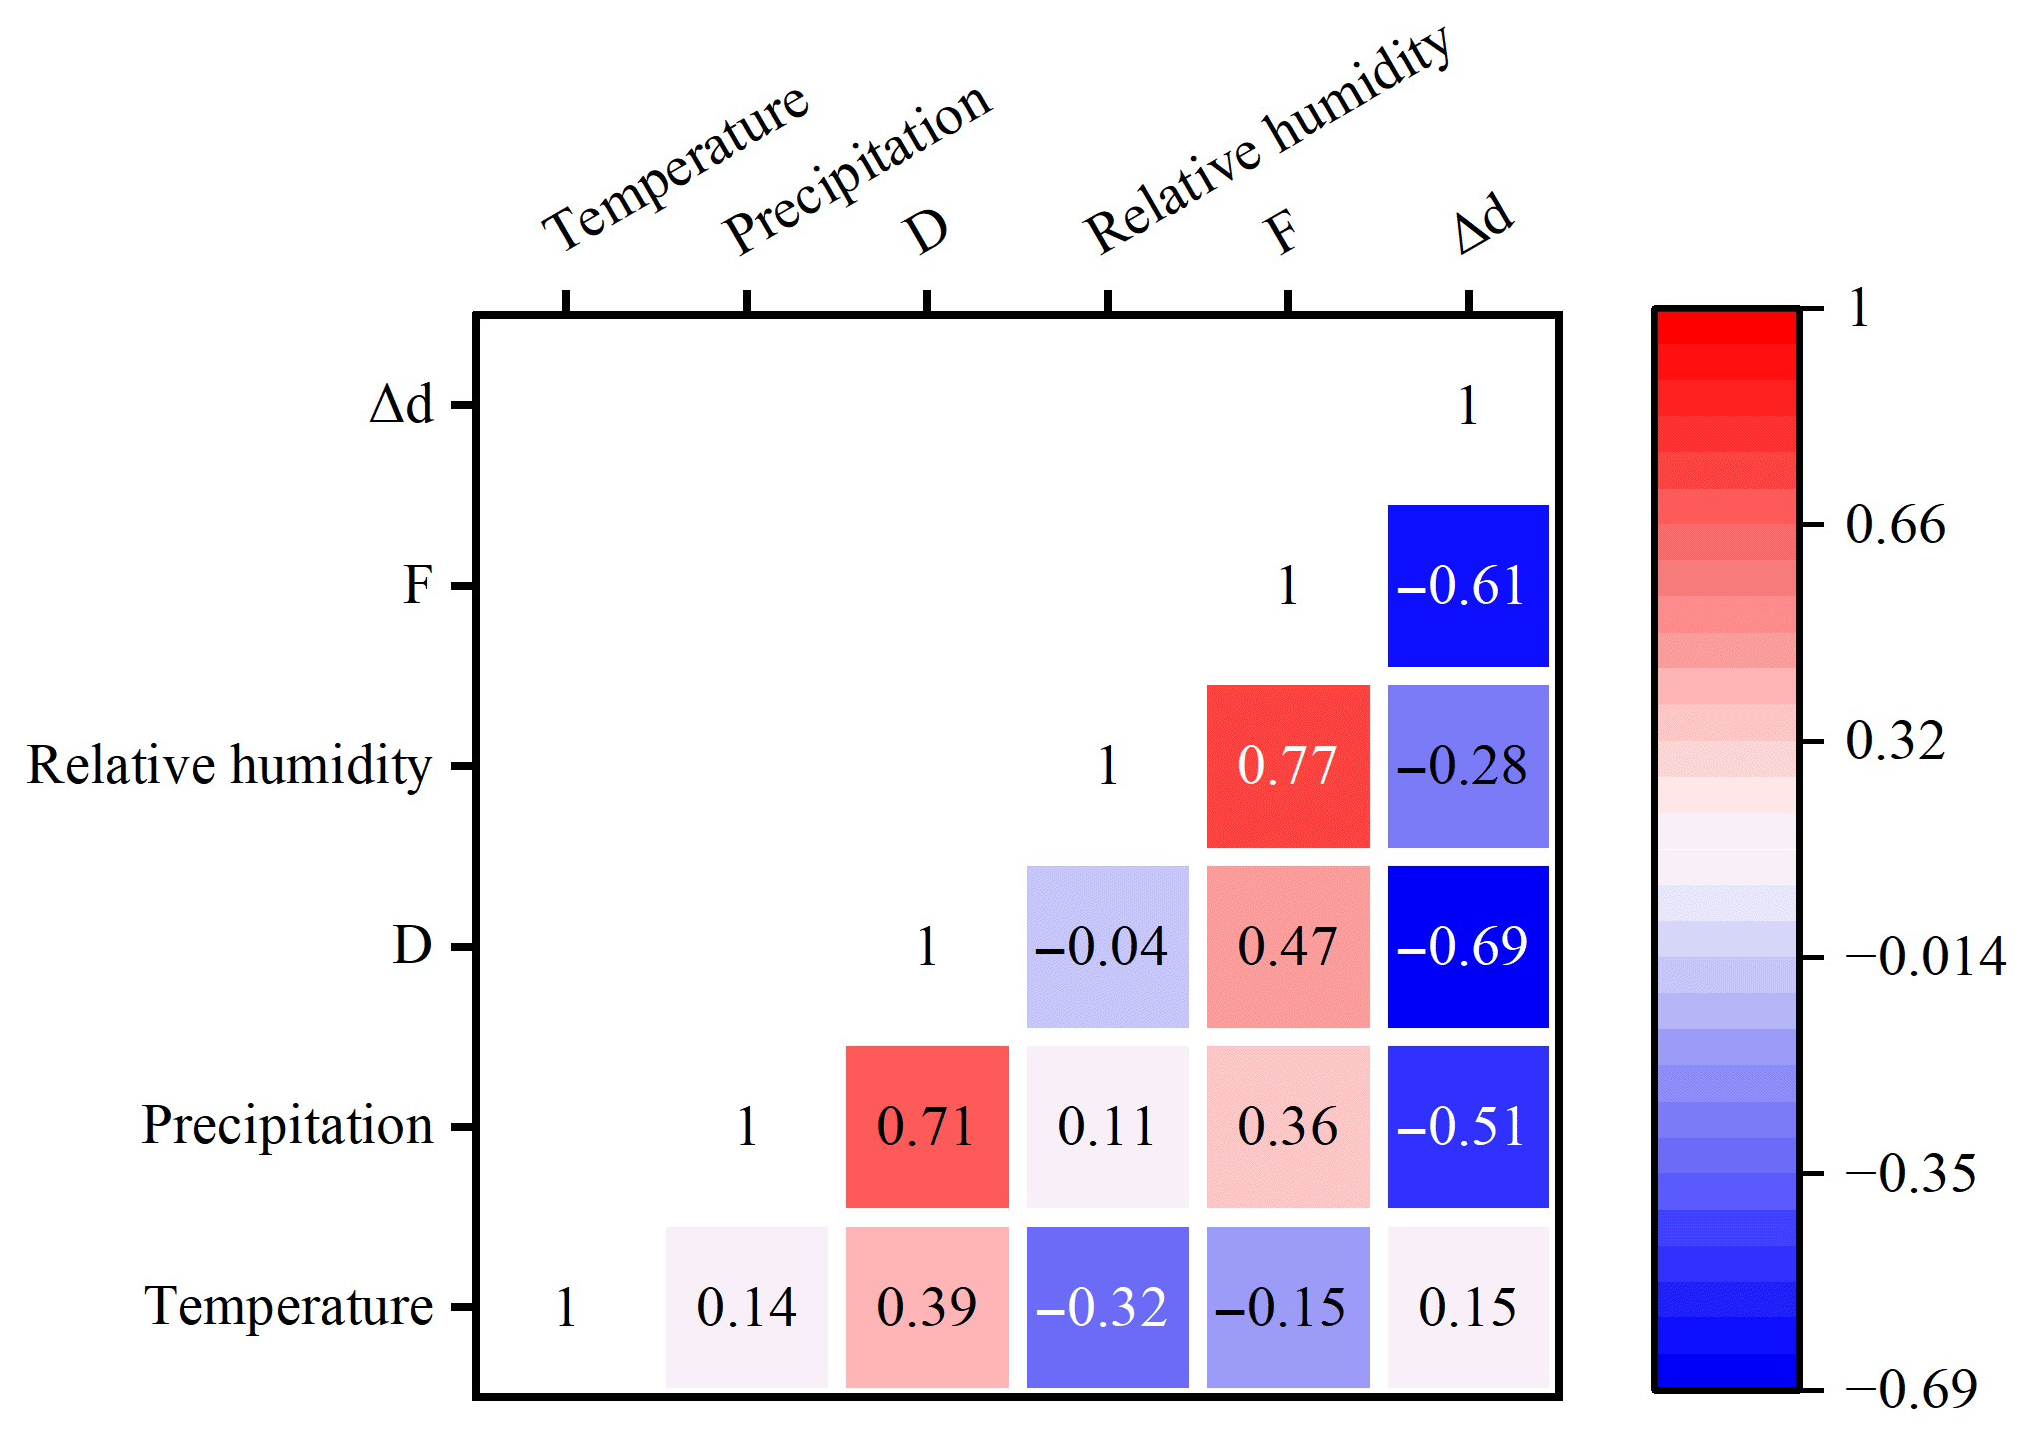
The f in Hainan Island shows a significant positive correlation with precipitation, raindrop diameter, and atmospheric relative humidity, and a significant negative correlation with air temperature (Figure 6). However, except for the high correlation coefficient with atmospheric relative humidity (R = 0.77), the correlation coefficients with other factors are all below 0.5. It indicates that, like other regions as mentioned above, the sub-cloud evaporation of precipitation in Hainan Island is most sensitive to changes in relative humidity [26,53,63]. Δd is negatively correlated with the f (R = −0.61, p < 0.01), indicating that the more intense the sub-cloud evaporation of precipitation is, the greater the variation in d-excess. Δd is positively correlated with air temperature and negatively correlated with precipitation, raindrop diameter, and atmospheric relative humidity, but it is highly correlated with raindrop diameter (R = −0.69, p < 0.01) and precipitation (R = −0.51, p < 0.01) (Figure 6). However, the seasonal variations in the f and Δd of precipitation are not consistent with the seasonal variations in raindrop diameter and atmospheric relative humidity (Figure 2 and Figure 5), indicating that a single meteorological factor cannot explain the effects of sub-cloud evaporation on precipitation isotopes in Hainan Island. This is different from the temperate continental climate or temperate arid climate regions with low humidity as mentioned above.
Analysis combining two meteorological factors reveals that the Δd of precipitation in Hainan Island shows a significant decreasing trend with the increase in atmospheric relative humidity and raindrop diameter (Figure 7a), or with the increase in raindrop diameter and precipitation (Figure 7c). However, with the increase in atmospheric relative humidity and precipitation (Figure 7b), although Δd also shows a decreasing trend, it is not significant. This further indicates that under hot and humid climatic conditions, the influence of sub-cloud evaporation on precipitation isotopes may be weakened [26,63]. This might be because that the humid and hot environmental conditions are conducive to the diffusion and exchange of rain vapor, which could promote the isotopic balance between raindrops and vapor [65].
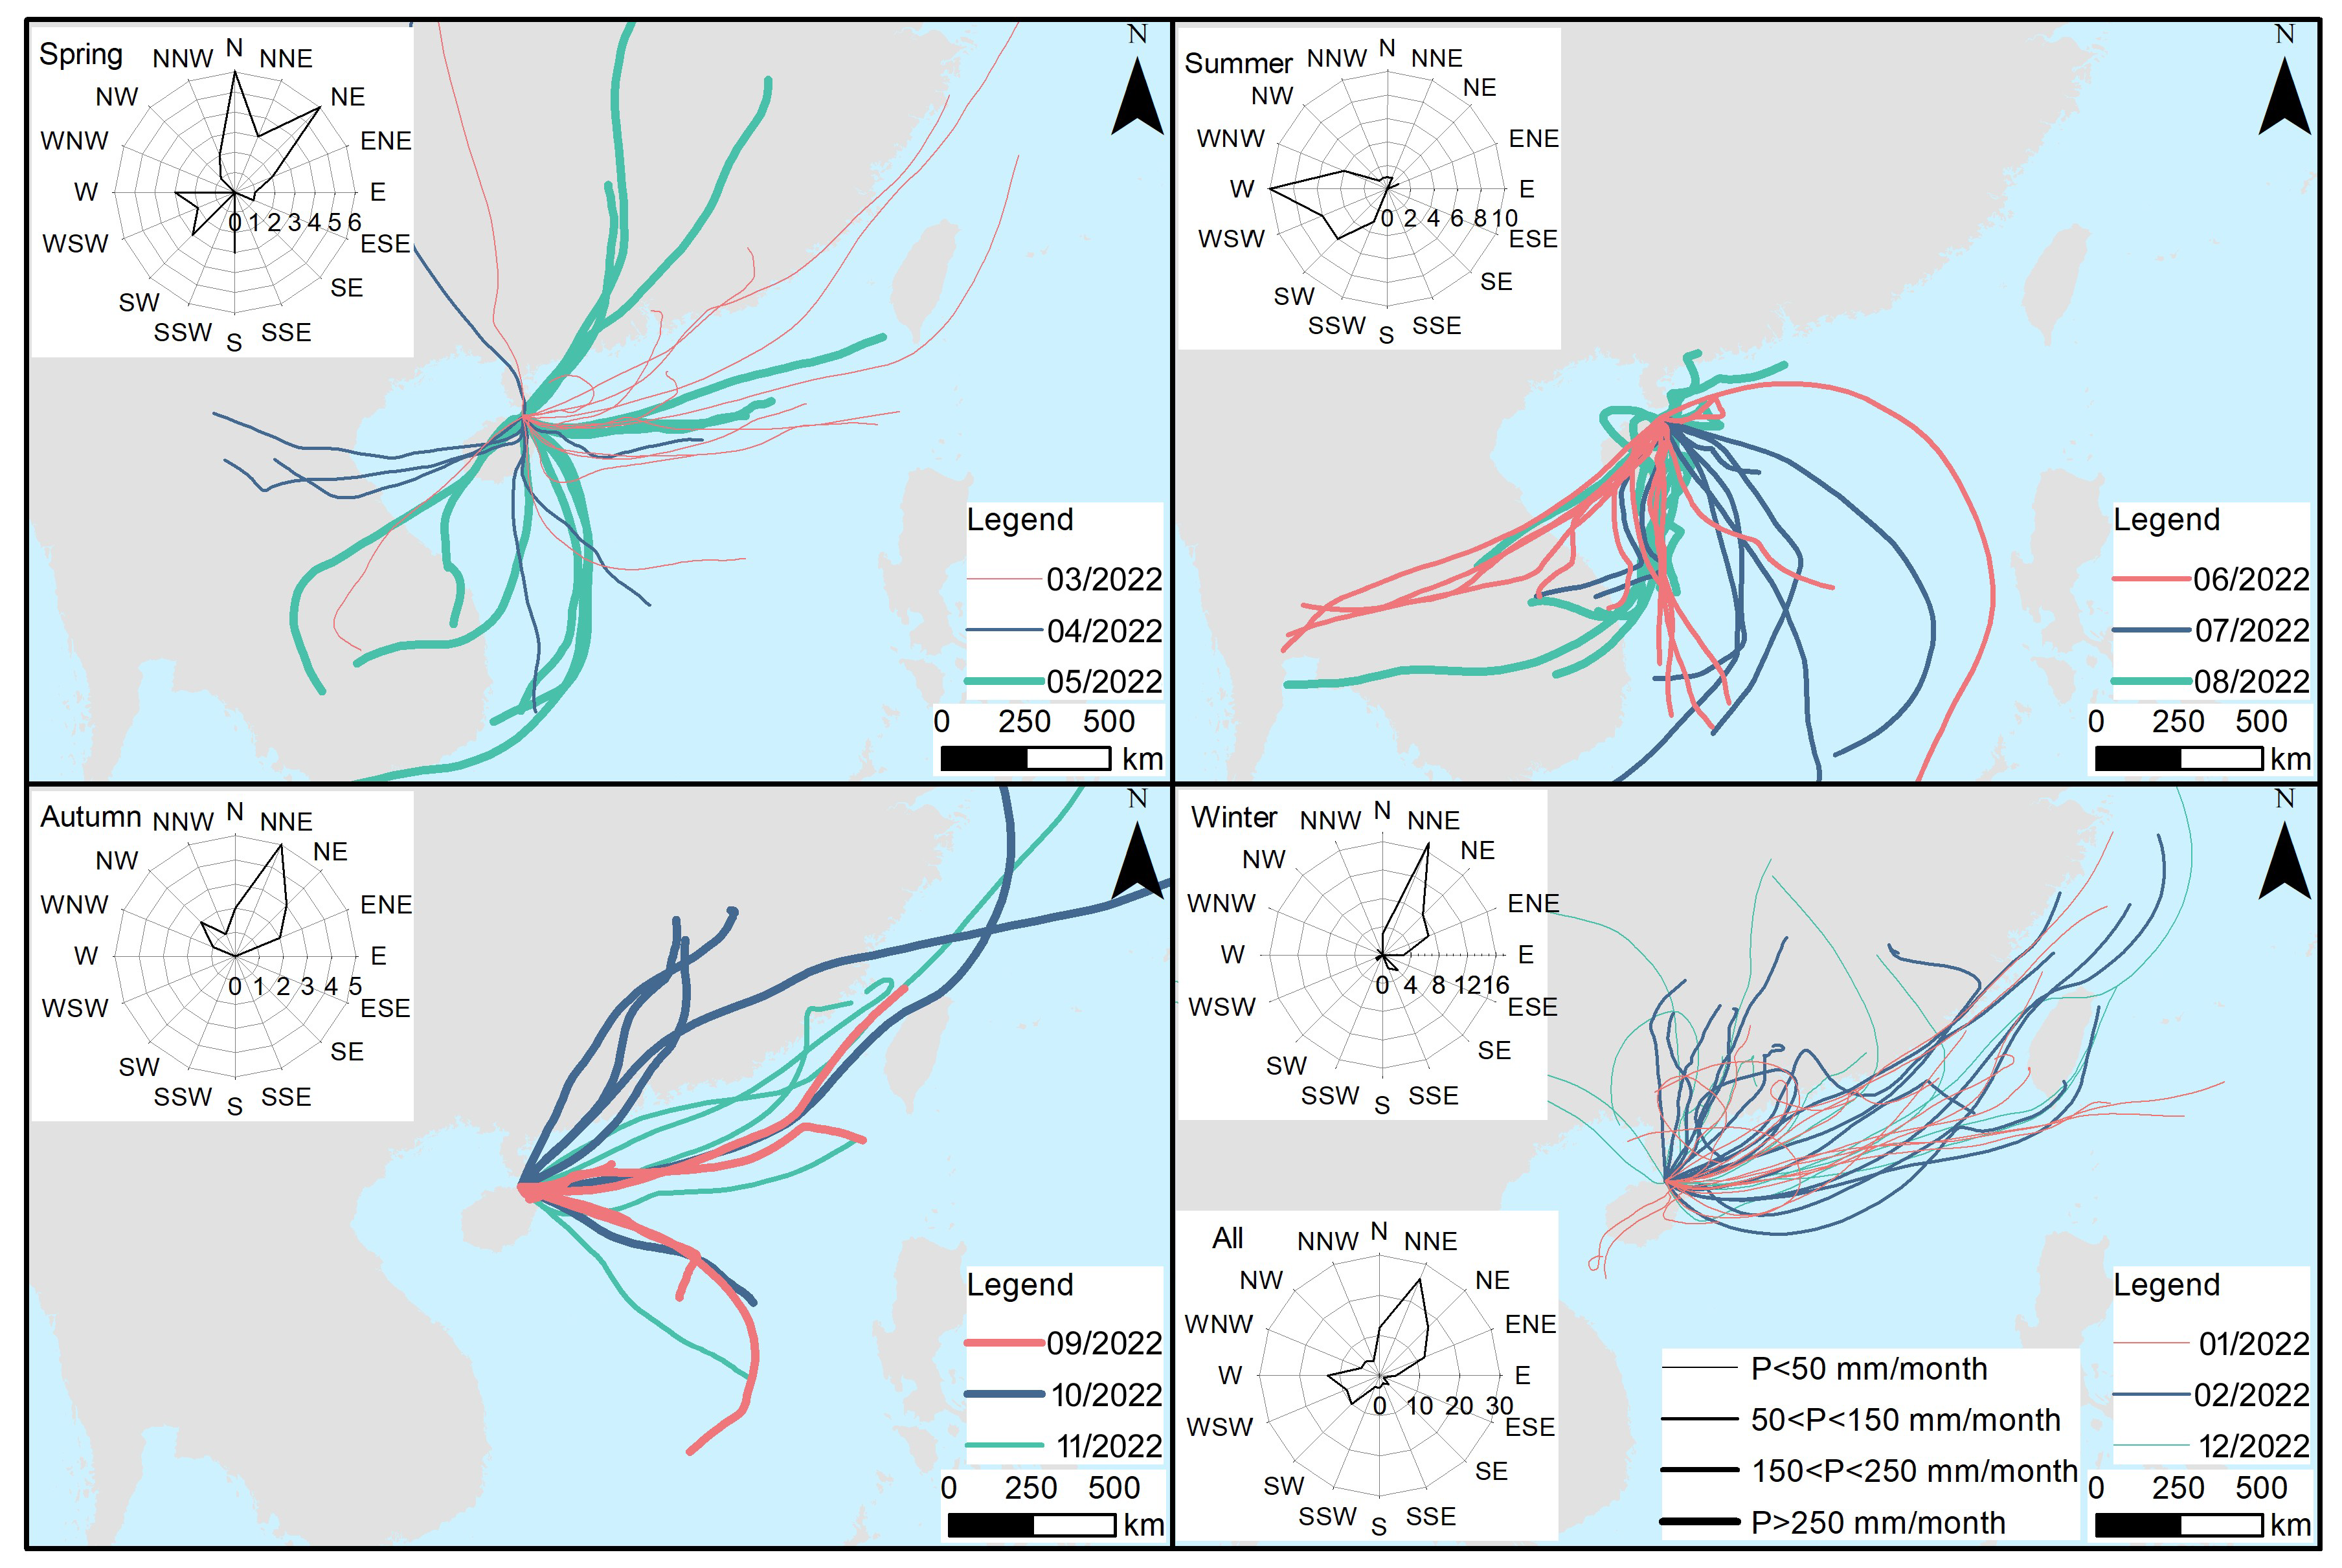
The f and Δd of precipitation in Hainan Island do not show obvious seasonal trends, which is different from regions affected by temperate continental climate or temperate arid climate [31,57,59,60,66,67]. It is also different from the humid climate areas in eastern China that are influenced by temperate monsoon climate or subtropical monsoon climate [30,53,62,63,68]. Even it is different from Singapore, which is also influenced by the tropical monsoon climate [65]. This might be related to the unique geographical location of Hainan Island. Although the region is influenced by the tropical monsoon climate, with relatively obvious seasonal variations in temperature and precipitation, the relative humidity does not have the same seasonal variation characteristics as temperature and precipitation (Figure 1b). Moreover, Hainan Island is located on the northern edge of the tropics, close to the Eurasian continent, and is significantly influenced by the continents. Its precipitation water vapor sources are also deeply influenced by the Eurasian continent. Besides the water vapor brought by the monsoon, water vapor from the continent also accounts for a large proportion (Figure 8). The different water vapor sources not only affects the isotopic characteristics of precipitation due to the different meteorological conditions in the source areas, but may also have an impact on factors such as temperature and relative humidity during precipitation, thereby causing the sub-cloud evaporation on precipitation. However, due to the limitations of data and observational conditions, the reason why there is no obvious seasonal trend in f and Δd of precipitation on Hainan Island still needs further study.

4.2. Uncertainty Analysis

The slope of the theoretical LEVL in Hainan Island shows a weak but significant negative correlation with precipitation (Figure 9a), atmospheric relative humidity (Figure 9b), and air temperature (Figure 9c). That is, the greater the precipitation, the higher the relative humidity, and the higher the air temperature, the lower the slope of the theoretical LEVL of precipitation. The average slope of the LEVL in Hainan Island is 2.98. This seems to indicate that the greater the precipitation, the higher the relative humidity, and the higher the air temperature, the more vigorous the surface evaporation. This is actually because during the rainy season in Hainan Island, the air temperature is high, leading to a large evaporation potential. Meanwhile, there is abundant precipitation, providing sufficient sources for evaporation. Although the atmospheric relative humidity is also high, the air is far from saturated, and surface evaporation is vigorous. Isotopic exchange between precipitation particles and ascending water vapor in clouds can also cause changes in the isotopic composition of precipitation [69], thereby increasing the uncertainty in simulating sub-cloud evaporation [53,70,71]. Generally, d-excess is influenced by moisture source conditions, is negatively correlated with relative humidity, and is positively correlated with sea surface temperature [71]. However, in Hainan Island, D-excess is not correlated with precipitation, negatively correlated with air temperature and raindrop diameter, and positively correlated with relative humidity. Previous studies also have shown that water recycling can increase d-excess [53,70,71], which further confirms that the precipitation isotopes in Hainan Island are influenced by water vapor recycling. That is, the mixing of a large amount of recycled water vapor caused by strong surface evaporation with precipitation water vapor, leads to the change in precipitation isotopes. It becomes one of the uncertainty factors in the simulation of sub-cloud evaporation in Hainan Island. Therefore, further research is needed in the future to investigate the impact of recycled water vapor on precipitation isotopes in Hainan Island.
The Stewart model assumes that raindrops at the cloud base are isotopic equilibrium with surrounding water vapor [47]. However, in an open system, when water vapor has just detached from the liquid surface yet remains very close to it, the water vapor and liquid water are in a state of thermodynamic equilibrium at the atomic level only at the precise moment when the vapor detaches from the liquid surface. Once departing from this equilibrium region, kinetic fractionation due to diffusion will immediately occur between isotopic water molecules of different masses. In an open system, not all the water vapor escaping from the liquid surface due to evaporation will return to the original instantaneous equilibrium system; instead, a portion of it will detach from the system. Thus, the isotopic composition of liquid water in this instantaneous equilibrium state will continue to change as the evaporation process proceeds [43,72].
In addition to the above two sources of uncertainty, Stewart model uses surface meteorological parameters to invert cloud base parameters. It is assumed that the atmospheric column below the cloud is uniform, yet in actual open systems, it is often not the case [48,49]. However, the uncertainty variation range of Δd in the study area calculated according to Formula (25) is 0.86–0.88. So, despite various uncertainties in Stewart’s below-cloud evaporation model, the model retrieves the isotopic composition of raindrops at cloud base through the isotopic composition of surface precipitation and meteorological parameters. When the datasets of the cloud base height and raindrop diameter are available, the model results will have high reference value. In the future, it is necessary to take full use of remote sensing data to monitor the relative humidity and the isotopic composition of water vapor at different altitudes to establish vertical profiles of relative humidity, isotopic composition of water vapor, raindrop diameter, and air temperature, to improve the estimation accuracy of the sub-cloud evaporation on precipitation.

5. Conclusions

To analyze the impact of sub-cloud evaporation on precipitation in tropical monsoon islands, combined with Stewart model, this study estimated the effect of sub-cloud evaporation on precipitation, analyzed its influencing factors, and discussed the sources of the uncertainty based on event-scale precipitation isotope data from June 2020 to February 2024 in Haikou City, northern Hainan Island.
(1)
Influenced by below-cloud evaporation, the slope of the LMWL (δ2H = 8.33δ18O + 14.33) is slightly lower than the average slope of the theoretical LMWL (8.48). There is no significant seasonal variation trend in Δd and f due to the effect of complex water vapor sources.
(2)
On the one hand, the sub-cloud evaporation of precipitation is most sensitive to changes in relative humidity; on the other hand, it is difficult to use a single meteorological factor to explain the sub-cloud evaporation of precipitation in the study area as the humid and hot environmental conditions could reduce the impact of sub-cloud evaporation on precipitation isotopes.
(3)
The exchange of precipitation isotopes with large amounts of recirculating water vapor results in changes in the isotopic composition of precipitation, which is an important source of uncertainty in sub-cloud evaporation simulations. In addition, the relatively strict assumption of the Stewart model that raindrops at the cloud base have reached isotopic equilibrium with the surrounding water vapor is also a potential source of uncertainty in below-cloud evaporation simulations.

Author Contributions

H.C.: Conceptualization, Methodology, Software, Validation, Formal analysis, Visualization, Writing—original draft, Writing—review & editing, Supervision, Project administration, Funding acquisition. D.L.: Conceptualization, Writing—review & editing, Supervision, Project administration, Funding acquisition. L.Z. and M.Z.: Investigation, Resources, Data curation, Visualization. All authors have read and agreed to the published version of the manuscript.

Funding

This research was funded by Hainan Provincial Natural Science Foundation of China (grant numbers 423RC476 and 425MS079). It is also supported by Education Department of Hainan Province (grant numbers Hnjgzc2023-16 and Hnky2025ZC-1).

Institutional Review Board Statement

The study was conducted according to the guidelines of the Declaration of Helsinki. The approval of an Institutional Review Board Statement is not required for this kind of study.

Informed Consent Statement

Informed consent was obtained from all subjects involved in the study.

Data Availability Statement

All datum required to reproduce these findings can be obtained by contacting the corresponding author.

Conflicts of Interest

The authors declare no conflicts of interest.

References

  1. Messié, M.; Petrenko, A.; Doglioli, A.M.; Martinez, E.; Alvain, S. Basin-scale biogeochemical and ecological impacts of islands in the tropical Pacific Ocean. Nat. Geosci. 2022, 15, 469–474. [Google Scholar] [CrossRef]
  2. Wang, Y.-H.; Chen, W.-T.; Wu, C.-M. Novel perspectives on multiple-peak diurnal convection over a tropical mountainous island from idealized large-eddy simulations. Npj Clim. Atmos. Sci. 2024, 7, 325. [Google Scholar] [CrossRef]
  3. Boyle, M.J.W.; Bonebrake, T.C.; Dias da Silva, K.; Dongmo, M.A.K.; Machado França, F.; Gregory, N.; Kitching, R.L.; Ledger, M.J.; Lewis, O.T.; Sharp, A.C.; et al. Causes and consequences of insect decline in tropical forests. Nat. Rev. Biodivers. 2025, 1, 315–331. [Google Scholar] [CrossRef]
  4. Good, P.; Chadwick, R.; Holloway, C.E.; Kennedy, J.; Lowe, J.A.; Roehrig, R.; Rushley, S.S. High sensitivity of tropical precipitation to local sea surface temperature. Nature 2021, 589, 408–414. [Google Scholar] [CrossRef]
  5. Song, F.; Dong, H.; Wu, L.; Leung, L.R.; Lu, J.; Dong, L.; Wu, P.; Zhou, T. Hot season gets hotter due to rainfall delay over tropical land in a warming climate. Nat. Commun. 2025, 16, 2188. [Google Scholar] [CrossRef]
  6. Shiogama, H.; Watanabe, M.; Kim, H.; Hirota, N. Emergent constraints on future precipitation changes. Nature 2022, 602, 612–616. [Google Scholar] [CrossRef]
  7. Kathayat, G.; Sinha, A.; Tanoue, M.; Yoshimura, K.; Li, H.; Zhang, H.; Cheng, H. Interannual oxygen isotope variability in Indian summer monsoon precipitation reflects changes in moisture sources. Commun. Earth Environ. 2021, 2, 96. [Google Scholar] [CrossRef]
  8. Sha, L.; Tian, L.; Sha, L.; Li, Y.; Wang, X.; Hu, P.; Liang, Q.; Zong, B.; Duan, P.; Cheng, H. Triple oxygen isotope compositions reveal transitions in the moisture source of West China Autumn Precipitation. Commun. Earth Environ. 2024, 5, 188. [Google Scholar] [CrossRef]
  9. Cui, Y.; Tian, L.; Cai, Z.; Wang, S. Spatially inhomogeneous response of precipitation δ18O in China to ENSO cycles. Npj Clim. Atmos. Sci. 2025, 8, 164. [Google Scholar] [CrossRef]
  10. Thirumalai, K.; Clemens, S.C.; Rosenthal, Y.; Conde, S.; Bu, K.; Desprat, S.; Erb, M.; Vetter, L.; Franks, M.; Cheng, J.; et al. Extreme Indian summer monsoon states stifled Bay of Bengal productivity across the last deglaciation. Nat. Geosci. 2025, 18, 443–449. [Google Scholar] [CrossRef]
  11. Xia, Z.; Surma, J.; Winnick, M.J. The response and sensitivity of deuterium and 17O excess parameters in precipitation to hydroclimate processes. Earth-Sci. Rev. 2023, 242, 104432. [Google Scholar] [CrossRef]
  12. Liang, Q.; Sha, L.; Li, J.; Zhang, J.; Wang, X.; Zhou, S.; Lin, F.; Xue, Y.; Duan, R.; He, Y.; et al. Seasonal Variations and Controls on Triple Oxygen and Hydrogen Isotopes in Precipitation-A Case Study From Monitoring in Southwest China. J. Geophys. Res.-Atmos. 2024, 129, e2023JD040654. [Google Scholar] [CrossRef]
  13. Koppa, A.; Rains, D.; Hulsman, P.; Poyatos, R.; Miralles, D.G. A deep learning-based hybrid model of global terrestrial evaporation. Nat. Commun. 2022, 13, 1912. [Google Scholar] [CrossRef]
  14. Sun, C.; Tian, L.; Shanahan, T.M.; Partin, J.W.; Gao, Y.; Piatrunia, N.; Banner, J. Isotopic variability in tropical cyclone precipitation is controlled by Rayleigh distillation and cloud microphysics. Commun. Earth Environ. 2022, 3, 50. [Google Scholar] [CrossRef]
  15. Da Silva, N.A.; Haerter, J.O. Super-Clausius–Clapeyron scaling of extreme precipitation explained by shift from stratiform to convective rain type. Nat. Geosci. 2025, 18, 382–388. [Google Scholar] [CrossRef]
  16. Jackson, L.S.; Birch, C.E.; Chagnaud, G.; Marsham, J.H.; Taylor, C.M. Daily rainfall variability controls humid heatwaves in the global tropics and subtropics. Nat. Commun. 2025, 16, 3461. [Google Scholar] [CrossRef] [PubMed]
  17. Conroy, J.; Noone, D.; Cobb, K.; Moerman, J.; Konecky, B. Paired stable isotopologues in precipitation and vapor: A case study of the amount effect within western tropical Pacific storms. J. Geophys. Res.-Atmos. 2016, 121, 3290–3303. [Google Scholar] [CrossRef]
  18. Torri, G.; Nugent, A.; Popp, R. The Isotopic Composition of Rainfall on a Subtropical Mountainous Island. J. Hydrometeorol. 2023, 24, 761–781. [Google Scholar] [CrossRef]
  19. Sánchez-Murillo, R.; Herrera, D.; Farrick, K.; Esquivel-Hernández, G.; Sánchez-Gutiérrez, R.; Barberena-Moncada, J.; Guatemala-Herrera, J.; Flores-Meza, Y.; Cerón-Pineda, R.; Gil-Urrutia, L.; et al. Stable isotope tempestology of tropical cyclones across the North Atlantic and Eastern Pacific Ocean basins. Ann. N. Y. Acad. Sci. 2025, 1543, 145–165. [Google Scholar] [CrossRef] [PubMed]
  20. Kurita, N.; Ichiyanagi, K.; Matsumoto, J.; Yamanaka, M.; Ohata, T. The relationship between the isotopic content of precipitation and the precipitation amount in tropical regions. J. Geochem. Explor. 2009, 102, 113–122. [Google Scholar] [CrossRef]
  21. Wei, Z.; Lee, X.; Liu, Z.; Seeboonruang, U.; Koike, M.; Yoshimura, K. Influences of large-scale convection and moisture source on monthly precipitation isotope ratios observed in Thailand, Southeast Asia. Earth Planet. Sci. Lett. 2018, 488, 181–192. [Google Scholar] [CrossRef]
  22. Vimeux, F.; Risi, C.; Barthe, C.; François, S.; Cauquoin, A.; Jossoud, O.; Metzger, J.; Cattani, O.; Minster, B.; Werner, M. Is the Isotopic Composition of Precipitation a Robust Indicator for Reconstructions of Past Tropical Cyclones Frequency? A Case Study on Réunion Island From Rain and Water Vapor Isotopic Observations. J. Geophys. Res.-Atmos. 2024, 129, e2023JD039794. [Google Scholar] [CrossRef]
  23. He, S.; Jackisch, D.; Samanta, D.; Yi, P.; Liu, G.; Wang, X.; Goodkin, N. Understanding Tropical Convection Through Triple Oxygen Isotopes of Precipitation From the Maritime Continent. J. Geophys. Res.-Atmos. 2021, 126, e2020JD033418. [Google Scholar] [CrossRef]
  24. Schmitt, S.; Riveros-Iregui, D.; Hu, J. The role of fog, orography, and seasonality on precipitation in a semiarid, tropical island. Hydrol. Process. 2018, 32, 2792–2805. [Google Scholar] [CrossRef]
  25. Zhang, Y.; He, S.; Wee, B.; LeGrande, A.; Wang, J.; Goodkin, N.; Wang, X. Precipitation 17O-Excess Altered During Tropical Convection: Evidence From Monsoon Cold Surges in Singapore. J. Geophys. Res.-Atmos. 2024, 129, e2023JD040437. [Google Scholar] [CrossRef]
  26. Salamalikis, V.; Argiriou, A.A.; Dotsika, E. Isotopic modeling of the sub-cloud evaporation effect in precipitation. Sci. Total Environ. 2016, 544, 1059–1072. [Google Scholar] [CrossRef]
  27. Dansgaard, W. Stable isotopes in precipitation. Tellus 1964, 16, 436–468. [Google Scholar] [CrossRef]
  28. Zhang, M.; Gao, Y.; Ge, J. Different responses of extreme and mean precipitation to land use and land cover changes. Npj Clim. Atmos. Sci. 2025, 8, 175. [Google Scholar] [CrossRef]
  29. Cheng, L.-W.; Yu, C.-K.; Chen, S.-P. Identifying mechanisms of tropical cyclone generated orographic precipitation with Doppler radar and rain gauge observations. Npj Clim. Atmos. Sci. 2025, 8, 35. [Google Scholar] [CrossRef]
  30. Wang, S.; Shi, Y.; Xing, M.; Wu, H.; Pang, H.; Lei, S.; Wang, L.; Zhang, M. Quantifying the below-cloud evaporation of raindrops using near-surface water vapour isotopes: Applications in humid and arid climates in East Asia. J. Hydrol. 2024, 638, 131561. [Google Scholar] [CrossRef]
  31. Wang, S.J.; Zhang, M.J.; Che, Y.J.; Zhu, X.F.; Liu, X.M. Influence of Below-Cloud Evaporation on Deuterium Excess in Precipitation of Arid Central Asia and Its Meteorological Controls. J. Hydrometeorol. 2016, 17, 1973–1984. [Google Scholar] [CrossRef]
  32. Chen, F.; Chen, J.; Wang, S.; Wu, X.; Zhang, Q.; Gao, M.; Kang, X.; Pu, Z.; Zhang, D. Below-cloud evaporation effect on stable water isotopes in precipitation at the eastern margin of Qinghai-Tibet Plateau. Hydrol. Process. 2022, 36, e14699. [Google Scholar] [CrossRef]
  33. Ye, L.; Zhu, G.; Chen, L.; Qiu, D.; Jiao, Y.; Li, R.; Lu, S.; Yang, J. Influence of below-cloud evaporation on stable isotopes of precipitation in the Yellow River source region. Hydrol. Process. 2024, 38, e15064. [Google Scholar] [CrossRef]
  34. Zhou, X.; Xu, K.; Ashok, K.; Shi, J.; Zhang, L.; Yu, J.-Y.; Liu, B.; Tam, C.-Y.; Xu, H.; Wang, W. Compound marine heatwaves and tropical cyclones delay the onset of the Bay of Bengal summer monsoon. Npj Clim. Atmos. Sci. 2025, 8, 162. [Google Scholar] [CrossRef]
  35. Utsumi, N.; Kim, H. Observed influence of anthropogenic climate change on tropical cyclone heavy rainfall. Nat. Clim. Change 2022, 12, 436–440. [Google Scholar] [CrossRef]
  36. Craig, H. Standard for Reporting Concentrations of Deuterium and Oxygen-18 in Natural Waters. Science 1961, 133, 1833–1834. [Google Scholar] [CrossRef]
  37. Criss, R.E. Principles of Stable Isotope Distribution; Oxford University Press: Oxford, UK, 1999. [Google Scholar]
  38. Majoube, M. Fractionnement en oxygène 18 et en deutérium entre l’eau et sa vapeur. J. De Chim. Phys. 1971, 68, 1423–1436. [Google Scholar] [CrossRef]
  39. Skrzypek, G.; Mydlowski, A.; Dogramaci, S.; Hedley, P.; Gibson, J.J.; Grierson, P.F. Estimation of evaporative loss based on the stable isotope composition of water using Hydrocalculator. J. Hydrol. 2015, 523, 781–789. [Google Scholar] [CrossRef]
  40. Gibson, J.J.; Birks, S.J.; Jeffries, D.; Yi, Y. Regional trends in evaporation loss and water yield based on stable isotope mass balance of lakes: The Ontario Precambrian Shield surveys. J. Hydrol. 2017, 544, 500–510. [Google Scholar] [CrossRef]
  41. Bam, E.K.P.; Ireson, A.M. Quantifying the wetland water balance: A new isotope-based approach that includes precipitation and infiltration. J. Hydrol. 2019, 570, 185–200. [Google Scholar] [CrossRef]
  42. Zhu, G.F.; Guo, H.W.; Qin, D.H.; Pan, H.X.; Zhang, Y.; Jia, W.X.; Ma, X.G. Contribution of recycled moisture to precipitation in the monsoon marginal zone: Estimate based on stable isotope data. J. Hydrol. 2019, 569, 423–435. [Google Scholar] [CrossRef]
  43. Craig, H.; Gordon, L.I. Deuterium and oxygen 18 variations in the ocean and marine atmosphere. In Stable Isotopes in Oceanographic Studies and Paleotemperature; Consiglio Nazionale Delle Ricerche, Laboratorio Di Geologia Necleare: Spoleto, Italy, 1956. [Google Scholar]
  44. Gonfiantini, R. Environmental isotopes in lake studies. In Handbook of Environmental Isotope Geochemistry; Springer: Berlin, Germany, 1986. [Google Scholar]
  45. Gat, J.R.; Mook, W.G.; Meijer, H.J. Stable isotopes processes in the water cycle. In Environmental isotopes in the Hydrological Cycle (Principles and Applications); Atmospheric Water; UNESCO and IAEA: Paris, France, 2001; pp. 17–40. [Google Scholar]
  46. Merlivat, L. Molecular Diffusivities Of (H2o)-O-1 6 Hd16o, And (H2o)-O-18 In Gases. J. Chem. Phys. 1978, 69, 2864–2871. [Google Scholar] [CrossRef]
  47. Stewart, M.K. Stable Isotope Fractionation Due to Evaporation And Isotopic-Exchange of Falling Waterdrops—Applications to Atmospheric Processes and Evaporation Of Lakes. J. Geophys. Res. 1975, 80, 1133–1146. [Google Scholar] [CrossRef]
  48. Pruppacher, H.; Klett, J.; Wang, P. Microphysics of Clouds and Precipitation. Aerosol Sci. Technol. 1998, 28, 381–382. [Google Scholar] [CrossRef]
  49. Yang, J. Physics of Clouds and Precipitation; China Meteorological Press: Beijing, China, 2011. [Google Scholar]
  50. Best, A.C. The size distribution of raindrops. Q. J. R. Meteorol. Soc. 1950, 76, 16–36. [Google Scholar] [CrossRef]
  51. Kinzer, G.D.; Gunn, R. The Evaporation, Temperature And Thermal Relaxation-Time Of Freely Falling Waterdrops. J. Meteorol. 1951, 8, 71–83. [Google Scholar] [CrossRef]
  52. Chen, H.; Chen, Y.; Li, D.; Li, W.; Yang, Y. Identifying water vapor sources of precipitation in forest and grassland in the north slope of the Tianshan Mountains, Central Asia. J. Arid. Land 2022, 14, 297–309. [Google Scholar] [CrossRef]
  53. Xing, M.; Liu, W.G.; Hu, J.; Wang, Z. A set of methods to evaluate the below-cloud evaporation effect on local precipitation isotopic composition: A case study for Xi’an, China. Atmos. Chem. Phys. 2023, 23, 9123–9136. [Google Scholar] [CrossRef]
  54. Craig, H. Isotopic Variations In Meteoric Waters. Science 1961, 133, 1702–1703. [Google Scholar] [CrossRef]
  55. Clark, I.; Fritz, P. Environmental Isotopes in Hydrogeology; Lewis Publishers: New York, NY, USA, 1997. [Google Scholar]
  56. Araguas-Araguas, L.; Froehlich, K.; Rozanski, K. Stable isotope composition of precipitation over southeast Asia. J. Geophys. Res.-Atmos. 1998, 103, 28721–28742. [Google Scholar] [CrossRef]
  57. Peng, H.; Mayer, B.; Harris, S.; Krouse, H.R. The influence of below-cloud secondary effects on the stable isotope composition of hydrogen and oxygen in precipitation at Calgary, Alberta, Canada. Tellus Ser. B-Chem. Phys. Meteorol. 2007, 59, 698–704. [Google Scholar] [CrossRef]
  58. Graf, P.; Wernli, H.; Pfahl, S.; Sodemann, H. A new interpretative framework for below-cloud effects on stable water isotopes in vapour and rain. Atmos. Chem. Phys. 2019, 19, 747–765. [Google Scholar] [CrossRef]
  59. Chen, F.; Zhang, M.; Wang, S.; Ma, Q.; Zhu, X.; Dong, L. Relationship between sub-cloud secondary evaporation and stable isotopes in precipitation of Lanzhou and surrounding area. Quat. Int. 2015, 380, 68–74. [Google Scholar] [CrossRef]
  60. Chen, H.; Chen, Y.; Li, D.; Li, W. Effect of sub-cloud evaporation on precipitation in the Tianshan Mountains (Central Asia) under the influence of global warming. Hydrol. Process. 2020, 34, 5557–5566. [Google Scholar] [CrossRef]
  61. Zhu, G.; Zhang, Z.; Guo, H.; Zhang, Y.; Yong, L.; Wan, Q.; Sun, Z.; Ma, H. Below-Cloud Evaporation of Precipitation Isotopes over Mountains, Oases, and Deserts in Arid Areas. J. Hydrometeorol. 2021, 22, 2533–2545. [Google Scholar] [CrossRef]
  62. Xiao, H.; Zhang, M.; Zhang, Y.; Huang, Z.; Yao, X.; Wang, J.; Han, T.; Su, P. Sub-Cloud Secondary Evaporation in Precipitation Stable Isotopes Based on the Stewart Model in Yangtze River Basin. Atmosphere 2021, 12, 575. [Google Scholar] [CrossRef]
  63. Wang, S.; Jiao, R.; Zhang, M.; Crawford, J.; Hughes, C.E.; Chen, F. Changes in Below-Cloud Evaporation Affect Precipitation Isotopes During Five Decades of Warming Across China. J. Geophys. Res.-Atmos. 2021, 126, e2020JD033075. [Google Scholar] [CrossRef]
  64. Sarkar, M.; Bailey, A.; Blossey, P.; de Szoeke, S.; Noone, D.; Meléndez, E.; Leandro, M.; Chuang, P. Sub-cloud rain evaporation in the North Atlantic winter trade winds derived by pairing isotopic data with a bin-resolved microphysical model. Atmos. Chem. Phys. 2023, 23, 12671–12690. [Google Scholar] [CrossRef]
  65. He, S.; Jackisch, D.; Feng, L.; Samanta, D.; Wang, X.; Goodkin, N. Uncovering Below Cloud Rain-Vapor Interactions During Tropical Rain Events Through Simultaneous and Continuous Real-Time Monitoring of Rain and Vapor Isotopes. J. Geophys. Res.-Atmos. 2024, 129, e2023JD040084. [Google Scholar] [CrossRef]
  66. Wang, L.; Wang, S.; Zhang, M.; Duan, L.; Xia, Y. An hourly-scale assessment of sub-cloud evaporation effect on precipitation isotopes in a rainshadow oasis of northwest China. Atmos. Res. 2022, 274, 106202. [Google Scholar] [CrossRef]
  67. Kong, Y.; Pang, Z.; Froehlich, K. Quantifying recycled moisture fraction in precipitation of an arid region using deuterium excess. Tellus Ser. B-Chem. Phys. Meteorol. 2013, 65, 19251. [Google Scholar] [CrossRef]
  68. Sun, C.; Chen, W.; Chen, Y.; Cai, Z. Stable isotopes of atmospheric precipitation and its environmental drivers in the Eastern Chinese Loess Plateau, China. J. Hydrol. 2020, 58, 124404. [Google Scholar] [CrossRef]
  69. Friedman, I.; Machta, L.; Soller, R. Water vapor exchange between a water droplet and its environment. Journ. Aeophys Res. 1962, 67, 2761–2770. [Google Scholar] [CrossRef]
  70. Froehlich, K.; Kralik, M.; Papesch, W.; Rank, D.; Scheifinger, H.; Stichler, W. Deuterium excess in precipitation of Alpine regions—Moisture recycling. Isot. Environ. Health Stud. 2008, 44, 61–70. [Google Scholar] [CrossRef] [PubMed]
  71. Crawford, J.; Hollins, S.E.; Meredith, K.T.; Hughes, C.E. Precipitation stable isotope variability and subcloud evaporation processes in a semi-arid region. Hydrol. Process. 2017, 31, 20–34. [Google Scholar] [CrossRef]
  72. Gat, J.R. Oxygen and hydrogen isotopes in the hydrologic cycle. Annu. Rev. Earth Planet. Sci. 1996, 24, 225–262. [Google Scholar] [CrossRef]
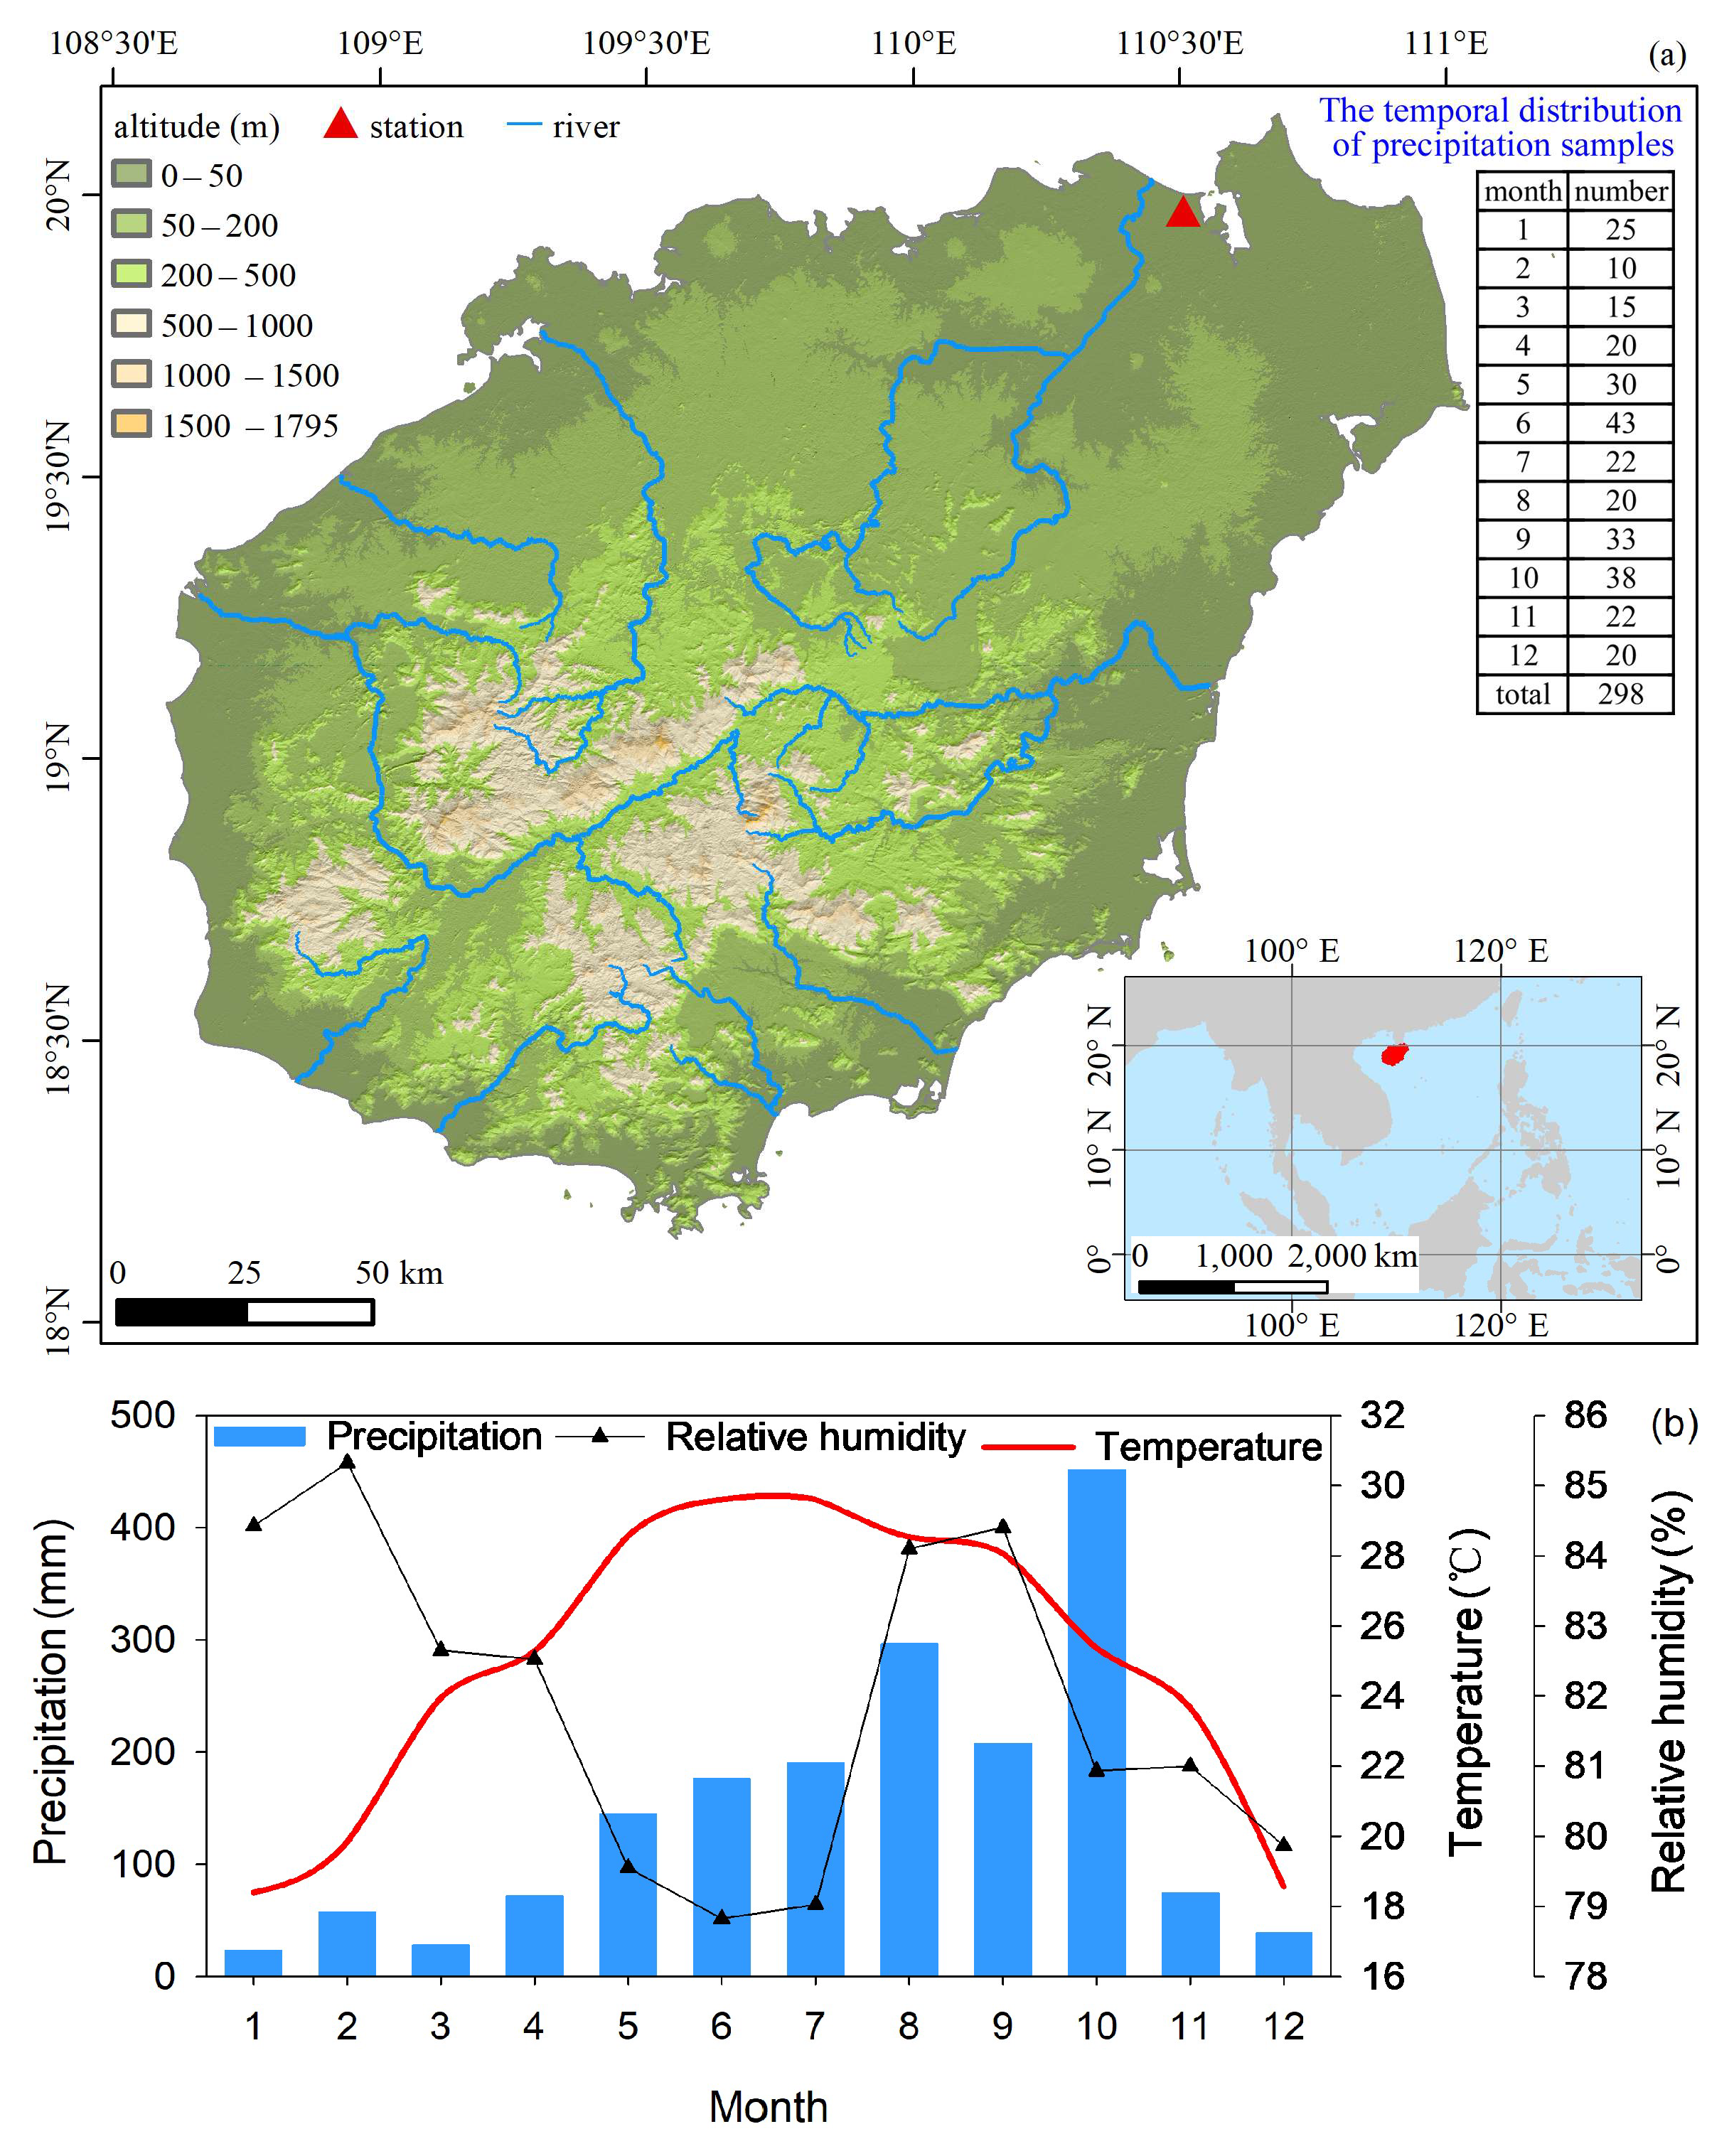
Figure 1. (a) Study area map, including precipitation sampling points and the temporal distribution of precipitation samples. (b) The 2023 temporal variation in temperature, precipitation and relative humidity in the study area.
Sustainability 17 08161 g001
Figure 2. The monthly variation in (a) δ2H, (b) δ18O, and (c) d-excess in precipitation over Hainan Island from June 2020 to February 2024.
Sustainability 17 08161 g002
Figure 3. Correlation between precipitation isotope composition and air temperature, precipitation amount, atmospheric relative humidity, and raindrop diameter (D) in Hainan Island.
Sustainability 17 08161 g003
Figure 4. The relationship between δ2H and δ18O of precipitation.
Sustainability 17 08161 g004
Figure 5. Temporal distribution characteristics of (a) f, (b) Δd, and (c) raindrop diameter (D) in Hainan Island.
Sustainability 17 08161 g005
Figure 6. Correlation analysis of f and Δd with relative humidity, raindrop diameter, precipitation, and temperature.
Sustainability 17 08161 g006
Figure 7. The variations in Δd under (a) different relative humidities and different raindrop diameters, (b) different relative humidities and different precipitation intensities, and (c) different raindrop diameters and different precipitation amounts. The 3D spatial positions are represented by red dots. The scatter plot between Δd and relative humidity is re-projected in green. The scatter plots between Δd and raindrop diameter in panel (a) (or precipitation intensity in panel (b), or air temperature in panel (c) are re-projected in blue. The scatter plots between relative humidity and raindrop diameter in panel (a) (or precipitation intensity in panel (b), or air temperature in panel (c) are re-projected in pink.
Sustainability 17 08161 g007
Figure 8. Spatial and temporal distributions of the trajectories of Haikou for each precipitation event from June 2020 to February 2024 in different seasons.
Sustainability 17 08161 g008
Figure 9. The relationships between the slope of the theoretical LEVL in Hainan Island and (a) precipitation, (b) atmospheric relative humidity, and (c) air temperature. The red lines are the fitted lines. The pink areas are the 95% confidence bands of the fitted lines.
Sustainability 17 08161 g009
Table 1. The monthly slopes of LMWL, theoretical LMWL and theoretical LEVL.
MonthSlope of the LMWLSlope of the Theoretical LMWLSlope of the Theoretical LEVL
17.058.883.85
26.578.802.75
36.348.543.04
47.578.513.11
57.698.412.84
67.368.312.86
77.978.312.84
88.118.352.56
98.328.362.71
108.268.442.81
118.398.482.98
126.258.823.33
mean8.338.482.98
Disclaimer/Publisher’s Note: The statements, opinions and data contained in all publications are solely those of the individual author(s) and contributor(s) and not of MDPI and/or the editor(s). MDPI and/or the editor(s) disclaim responsibility for any injury to people or property resulting from any ideas, methods, instructions or products referred to in the content.