Article

Coordination in Energy Platforms: How Fairness Concerns and Market Power Shape Pricing and Profitability

Department of Economics and Research, Institute of the Digital Economy, School of Business, East China University of Science and Technology, Shanghai 200237, China
*
Author to whom correspondence should be addressed.
Sustainability 2025, 17(18), 8144; https://doi.org/10.3390/su17188144
Submission received: 14 August 2025 / Revised: 4 September 2025 / Accepted: 6 September 2025 / Published: 10 September 2025
(This article belongs to the Section Economic and Business Aspects of Sustainability)

Abstract

In current energy studies, renewable energy platforms and thermal power platforms can operate under two distinct frameworks: a coordinated framework, where the renewable platform relies on the thermal platform for integrated dispatch and operational support; and a non-coordinated mode, where each platform manages generation independently and engages in competition. This paper develops a two-stage game-theoretic framework to systematically analyze pricing and profitability in a 2-by-2-by-2 scenario topology structured along three key dimensions: whether platforms are coordinated, whether consumers exhibit fairness concerns, and whether a dominant platform possesses market power. Our analysis reveals that (1) coordinated operation not only enhances system reliability but also intensifies competition, leading to lower prices and lower profits under some circumstances; (2) fairness concerns also reduce platform’s user base, optimal price and profitability; and (3) when a dominant platform leads pricing, both tend to raise prices to protect market share, whereas simultaneous pricing leads to lower prices. These findings highlight the importance of coordination, fairness, and market power in platform pricing and offer regulatory insights for the design of more resilient, sustainable, and equitable energy platform markets.

1. Introduction

1.1. Research Background

The United Nations Sustainable Development Goals (SDGs) emphasize the importance of sustainable energy. In particular, SDG 7 (affordable and clean energy) advocates for universal access to reliable and sustainable energy, while SDG 12 (responsible consumption and production) encourages more efficient and responsible use of resources [1]. As China deepens its electricity market reforms, recent policies have emphasized encouraging retail competition, promoting fairness and transparency in transactions, and gradually expanding consumer options in electricity procurement [2,3]. These changes, coupled with advances in digital technologies and smart grid infrastructure, have fostered the emergence of platform-based electricity trading. Recent literature highlights the economic implications of electricity platform operations [4,5,6,7], which function as key intermediaries by enabling consumers to choose between providers, particularly between emerging green electricity platforms and traditional thermal power platforms [8,9].
Based on the inherent nature of the electricity sources, green electricity platforms offer low-carbon energy and align with long-term sustainability goals. They are often favored by environmentally conscious users [10]. However, these platforms typically face challenges such as limited generation predictability [11,12]. Thermal platforms, by contrast, offer a stable energy supply but face mounting decarbonization pressure.
Competition between the two types of platforms can raise concerns about pricing fairness. Under the merit-based dispatch rule, renewable generation’s near-zero marginal costs lead to lower prices for green electricity compared with thermal power [13]. In addition, the generation cost of photovoltaic power, a type of green electricity, has reached or fallen below the benchmark feed-in tariff for coal-fired power [14]. These price differences have prompted fairness concerns among customers. Meanwhile, competition is also shaped by market power disparities. In some cases, regulatory authorities may require both platforms to set prices simultaneously. However, depending on the market power dynamics, the regulator may allow the dominant platform to set the price first, with another platform following [15,16].
Alongside competition, coordination between platforms is also observed. Due to the intermittency of renewable sources, green platforms often require operational support from thermal platforms, especially for real-time dispatch balancing [17]. In such scenarios, the green electricity platform purchases electricity from the thermal platform and uses digital tools such as algorithmic dispatch to ensure reliability and flexibility [18]. In contrast, some studies explore cases where renewable platforms operate entirely independently, without relying on conventional generation support, examining the technical and economic feasibility of such autonomous operation. For instance, local smart grids can balance supply and demand through power storage [19,20], demand response [19,20], and peer-to-peer trading [21], without relying on coordination with traditional energy sources or fuel-based peaking power. Although such designs of non-coordinated mode are oriented toward future energy systems, it is important to account for them in modeling so that different operational scenarios can be assessed and their potential implications understood.
These phenomena provide realistic foundations for modeling platform competition and coordination in this study. Within this context, three dimensions will shape market outcomes and long-term platform sustainability:
  • The existence or absence of coordination between platforms;
  • Competition and market power asymmetries across platforms;
  • Consumers’ fairness concerns, i.e., their sensitivity to price differences between two platforms.
These factors jointly influence platform pricing, consumer participation, and profit allocation. We develop a platform coordination model involving a green platform, a thermal platform, and a large number of heterogeneous consumers. This model considers four cases, based on whether coordination is present and whether consumers exhibit fairness concerns. The four cases are: (i) coordination with fairness concern (Model CW); (ii) no coordination with fairness concern (Model NW); (iii) coordination without fairness concern (Model CO); and (iv) no coordination without fairness concern (Model NO).
In addition, we adopt a Stackelberg model to represent the situation when the green platform is dominant, and a Nash model for the cases in which both platforms hold comparable market power. Moreover, this paper also conducts numerical analysis and comparative analysis regarding the effects of core factors on optimal outcomes.

1.2. Related Literature

This paper draws upon three lines of the existing research: coordination in energy platforms, fairness concerns, and market power.
Many scholars have studied the coordination between platforms. Coordination plays a crucial role in power grids, particularly in the integration and operation of cross-border and domestic regional electricity markets [22,23]. Some scholars have also examined the interaction between renewable energy and traditional power systems [24,25,26]. Existing literature has examined the role of centralized grids in peak-shaving for renewable energy and the coordination of power dispatch to ensure the secure and stable operation of the electricity system [17,18]. As mentioned before, the intermittency of power generated by wind and solar photovoltaic panels makes electricity dispatch more necessary, as production must match consumption in real-time. Under some conditions, renewable energy sources can meet the entire demand, while in other situations, conventional generating sources are needed to fill the gap. For instance, refs. [27,28] proposed a framework for integrating centralized and distributed energy resources, emphasizing the need for further investments in more digitized and resilient grids. Regarding cases without coordination, [18,19,20,21] analyzed scenarios where platforms operate entirely independently.
The second stream of relevant literature focuses on the causes, proxy variables, and consequences of fairness concerns. Regarding the causes, the authors of [29] investigated fairness concerns arising from the allocation of distributed energy resource (DER) investment costs into electricity prices, and they used a game model to show that active consumers who invest in DERs sacrifice the interests of non-investing consumers. Additionally, some literature [30] considered fairness concerns related to intertemporal consumption, where users compare current prices with historical price information, generating fairness concerns during this comparison. In terms of proxy variables for measuring fairness concerns, some studies [31,32] proposed using differences in prices to assess fairness among consumers on different platforms, and [33] also investigated the same effect within energy communities. Some studies also modeled fairness concerns from the perspective of utilities, which refers to participants obtaining more benefits from participating in the local electricity markets compared to other alternatives [34]. Moreover, the authors of [35] also focused on the impartial energy decision-making, including the benefits and costs, and [36] introduced the proportional fairness in energy allocation and profit sharing in the energy community. The consequences of fairness concerns are often captured by adding to the users’ utility function. The authors of [37] showed that these concerns lead to a reduction in service prices, final service demand, and profit potential.
Finally, numerous studies focused on the causes, descriptions, and consequences of market power in electricity markets. The authors of [38] analyzed market power in electricity markets and argued that an increase in concentration is a potential cause of greater market power. In addition, [39] discussed how the rise in market power leads to excessively high electricity prices. Their arguments played a significant role in the liberalization and marketization of the electricity sector. Existing research mainly emphasizes leader–follower relationships and often employs the Stackelberg framework to analyze competition in electricity markets, which is widely used to examine hierarchical decision-making processes among multiple agents in various contexts. Some papers defined the market power from a supplier-customer perspective, e.g., [40] formulated the multi-leader and multi-follower Stackelberg game approach for studying the trading among multiple energy retailers and consumers. Similarly, according to [15], the Independent System Operator, who allocates demand and prices, is considered the leader, while the demand response aggregator firms, which submit bid quantities, act as followers. Some papers illustrated market power from a resource-based perspective. For instance, [16] considered that the prosumer equipped with a thermal unit is viewed as a leader, and the prosumers with intermittent renewable energy sources act as followers. On the other hand, the authors [41] considered both the Stackelberg first-mover advantage and simultaneous pricing, with these two market structures leading to different results. The comparisons between related work and this paper are shown in Table 1.
While previous studies have explored various forms of dispatch coordination in electricity markets, less attention has been given to how source-based pricing influences consumer choices, especially when platforms differ in their generation types and strategic behavior. In particular, the combined effects of fairness concerns, market structure, and platform coordination remain underexplored. These gaps motivate the following research questions:
  • How do fairness concerns affect customer choices and pricing decisions of the platform? Can the emergence of fairness concerns improve the unfair conditions between platforms?
  • In different models, how does market power influence the pricing strategies? What are the implications for price levels and profit distribution when one platform takes the lead?
  • How does coordination through power dispatch change the pricing strategies? In what ways do coordinate and non-coordinate modes lead to different outcomes in pricing decisions?
The difficulty of this research lies in how to construct a game model to solve for the user mass, optimal pricing, and profitability of the two differentiated platforms under different scenarios. This paper proposes a comprehensive framework to address these issues systematically.

1.3. Contribution

To the best of our knowledge, there is no prior work that considers both fairness concerns and market power together in influencing customer choice in the energy market. This paper offers the following contributions:
  • We fill a literature gap by analyzing how fairness considerations and market power together shape platform pricing strategies. Prior research typically focuses on one or the other, but rarely both simultaneously.
  • We introduce consumer heterogeneity by distinguishing between green consumers and traditional non-green consumers, and model their platform selection based on individual rationality and incentive-compatibility constraints.
  • We extend the framework in [41] by allowing platform collaboration via power dispatch, offering fresh insights into the pricing and market dynamics resulting from inter-platform cooperation.
In sum, all the main conclusions of this paper are rigorously derived through mathematical modeling and validated through numerical simulations. Moreover, the findings align with economic intuition and real-world contexts.
The remainder of this paper is organized as follows. Section 2 presents the research methods. Section 3 proposes the model and equilibrium analysis. Numerical analysis is given in Section 4. Furthermore, Section 5 provides a discussion and Section 6 ends with conclusions. Finally, proofs of all lemmas and corollaries are presented in the Appendix.

2. Research Method

Market participants in this paper include electricity platforms and customers. As mentioned before, there are two types of source-based platforms, thermal platforms and renewable platforms. In this paper’s context, it is assumed that there is no hierarchical relationship between the thermal platform and the green platform; both platforms operate independently, meaning they have the autonomy to set their own pricing decisions. Customers are rational—even though some papers characterized some irrational behavior models that consider the users as myopic, this paper only focuses on rational behavior.

2.1. Game Theoretic Modeling

Game theory models typically characterize the strategic interactions among different parties, where each player’s outcome depends not only on their own choices but also on the choices of others. To attract consumers, the two types of energy platforms will compete in terms of user numbers and pricing. Their competition triggers a new game, prompting the platforms to study how consumer scale and pricing can reach equilibrium, while focusing on fairness in electricity pricing and cooperation in electricity dispatch.
The game sequence of the model described in this paper is divided into two stages, as shown in Figure 1: in the first stage, each platform sets the price of its source-based electricity. In the second stage, after observing the price differences between platforms, consumers will weigh the tradeoff according to the nature of the two platforms and choose which platform to join.
Specifically, in the first stage, each platform sets the price of its source-based electricity. We further consider the sequence of actions between the two platforms. To capture different market structures, we consider two types of pricing games between platforms. In the Nash model, both platforms set their prices simultaneously, without knowing the other’s decision in advance. This reflects a setting with symmetric market power. In contrast, the Stackelberg model assumes an asymmetric structure, where one platform acts as a leader and sets its price first, while the other platform, as a follower, sets its price after observing the leader’s decision. This sequential structure captures the dynamics of strategic advantage arising from market dominance or better information.
The methodology of backward induction is commonly used to solve the game-theoretic models [41]. It involves analyzing the game from the final stage and solving backward to determine equilibrium strategies. In this context, consumers first observe the electricity prices set by the platforms and then decide which platform to join based on their preferences and constraints.

2.2. Customer Choice Modeling

Customer choice modeling normally follows the rule that customers are rational, as mentioned before, using two constraints to illustrate:
(1) The individual rationality (IR) constraint ensures that the utility of selecting a platform is greater than or equal to 0 ( U c n 0 and U c e 0 );
(2) While the incentive compatibility (IC) constraint ensures that the utility of selecting the green platform is no lower than the utility the consumer would receive by choosing the thermal platform, i.e., U c n U c e [41].
Back to the game, in the second stage, exhibit heterogeneity in their consumption habits and individual preferences. Consumers are assumed to be non-strategic users, meaning they are price takers. However, they exhibit heterogeneity in their consumption habits and individual preferences, which is captured as their valuations v in the model.
Another factor that influences customers’ choice is their fairness concern. Some prioritize green electricity consumption and are unaffected by fairness concerns, while others, as traditional electricity consumers, may be concerned about fairness due to higher electricity prices. With the growing emphasis on sustainability and the expansion of distributed renewable energy, price fairness has become a prominent issue. Specifically, fairness in electricity pricing means that all customers should pay equally for the same product, electricity [42,43]. However, renewable energy, is less costly to produce compared to electricity from conventional sources [13]. As a result, users who remain on traditional energy platforms may pay higher prices, i.e., p e > p n , leading to concerns over the fairness. This assumption is also consistent with the context of China’s ongoing electricity market reform. The policy calls for generation-side grid parity, where the cost per unit of photovoltaic electricity is equal to or lower than that of conventional energy, allowing green electricity to compete with thermal electricity without relying on government subsidies [14].

2.3. Platform Coordination Modeling

Platform coordination modeling is common in platform research because, in the energy market, consumers’ utility functions are influenced by whether coordination exists between platforms. Specifically, a buyer’s utility from choosing a platform can be divided into two components: the economic preference factor, which balances between economic cost and customer comfort, and the loss-adjusted factor, which accounts for potential outages occurring [44]. The meanings of these two components are interpreted as follows:
The larger economic preference factor λ means that consumers place more emphasis on economic efficiency, showing greater willingness to sacrifice comfort in order to lower electricity costs. A smaller λ indicates consumers are less concerned about costs and instead give priority to reducing the discomfort caused by power outages or equipment delays. The economic preference factor is represented by a certain probability ( λ ), meaning that the user is able to purchase electricity from the green electricity platform, but there is also a risk, meaning that due to supply fluctuations, the user may not be able to buy the unit of electricity. In this case, with probability ( 1 λ ), the user will need to return to the traditional grid platform to purchase electricity, which is more costly but ensures comfort.
The loss-adjusted factor δ represents the net utility after accounting for losses, reflecting the residual value once the loss from being unable to purchase electricity is incurred. It can also be interpreted as a loss-adjusted factor that incorporates the waiting costs and the diminished instant gratification of usage comfort experienced by users, as pointed out by [44].
Figure 2 illustrates the real scenario where the two platforms may either coordinate or operate independently. The 2-by-2-by-2 scenario topology for energy coordination is shown in Figure 3, which captures the three dimensions that affect the user’s choice and optimal outcomes. Table 2 further clarifies the classification used in the game theory model in this paper. The definitions of the related symbols are shown in Table 3.

3. Model Setup and Equilibrium Analysis

Without loss of generality, this paper considers that a buyer (or consumer) only needs to purchase one unit of electricity. In the model, v represents the reservation value of the consumer joining the platform, which follows a uniform distribution on [0, 1]. The user’s decision involves weighing the fact that the traditional platform offers a stable electricity supply, but at a slightly higher price.
The graphical display of the rationale behind consumers’ platform choices is illustrated in Figure 4, and the detailed derivation is provided in Appendix A.

3.1. Platform’s Pricing Strategy Under Fairness Concern and Power Dispatch (Model CW)

We first consider the scenario where both fairness concern and power dispatch are present, corresponding to the (Yes, Yes) case in Table 2, hereafter referred to as CW. The utility functions for joining platforms are given by:
U c n = λ v p n + δ 1 λ v p e
U c e = v p e μ ( p e p n )
Considering the indifference points between choosing platform e and n, the user base can be derived, see Appendix A.
The profit functions are defined identically across all four cases, mainly focusing on the user bases and source-based electricity prices:
π e = D e   p e ,
and   π n = D n   p n .

3.1.1. Stackelberg Game Model (F, CW)

Considering the differences in market power, the green energy platform can only ‘passively’ consider the fairness concerns of the traditional power platform.
Lemma 1.
The optimal pricing decisions are given as follows:
  p e F , C W = ( 1 λ ) ( 1 δ ) 2 + μ λ 2 δ 1 λ
p n F , C W = ( 1 λ ) ( 1 δ ) 2 ( 2 + μ λ 2 δ 1 λ )   ,
and the profits of a green platform (hereafter referred to as an e-platform) and thermal platform (also referred to as an n-platform) are given by:
π e F , C W = ( 1 λ ) ( 1 δ ) 4 + 2 μ 2 λ 4 δ 1 λ ,
a n d   π n F , C W = ( 1 λ ) ( 1 δ ) ( δ μ + λ 1 + 1 δ μ ) 4 ( δ + λ δ λ ) ( 2 + μ λ 2 δ 1 λ ) 2
Corollary 1.
The comparative analysis reveals the following conclusions: the e-platform’s user base decreases with μ , while the n-platform’s increases: D e C W μ < 0 and D n C W μ > 0 ; both platforms’ prices fall as μ rises: p e F , C W μ < 0 and p n F , C W μ < 0 ; the e-platform’s profit decreases with μ : π e F , C W μ < 0 , while the n-platform’s profit declines with μ (i.e., π n F , C W μ < 0 ) only if δ exceeds a critical value.
Proof of Lemma 1 and Corollary 1. See Appendix A.

3.1.2. Nash Model of Simultaneous Pricing (T, CW)

Under this case, the e-platform and n-platform simultaneously decide their electricity prices under the Nash equilibrium model.
Lemma 2.
The optimal pricing decisions are given as follows:
  p e T , C W = 2 ( 1 λ ) ( 1 δ ) 4 4 δ 1 λ λ + 3 μ
p n T , C W = ( 1 λ ) ( 1 δ ) 4 4 δ ( 1 λ ) λ + 3 μ ,
and the profits of e-platform and n-platform are given by:
π e T , C W = 4 ( 1 λ ) ( 1 δ ) ( 1 + μ δ 1 λ ) ( 4 4 δ ( 1 λ ) λ + 3 μ ) 2
π n T , C W = ( 1 λ ) ( 1 δ ) ( μ δ + λ 1 + 1 δ μ ) 4 4 δ 1 λ λ + 3 μ 2 ( λ + δ λ δ )
Corollary 2.
The optimal price of the e-platform and n-platform decreases with μ: p e T , C W μ < 0 and p n T , C W μ < 0 ; similar to the above case of Stackelberg game model, the e-platform’s profit decreases with μ : π e T , C W μ < 0 , while the n-platform’s profit declines with μ (i.e., π n T , C W μ < 0 ) only when λ exceeds a critical value.
Proof of Lemma 2 and Corollary 2. See Appendix A.
By taking the derivatives of the optimal electricity prices for both platforms with respect to the fairness concern coefficient, we find that the marginal impact of the fairness concern coefficient on the electricity prices of both platforms is negative.
The economic implication is that when the economic preference factor λ exceeds a certain critical value, or interpreted as when the probability of successfully purchasing from a green platform is relatively high, an increase in fairness concern by one unit will not lead users to switch to the n-platform.

3.2. Platform’s Pricing Strategy Without Fairness Concern but with Power Dispatch (Model NW)

Secondly, we analyze the case where power dispatch exists but consumers are unaware of the fairness concern, aligning with the (No, Yes) case in Table 2, simply noted as NW.
Similar to Model CW, the utility functions for joining platform e and n under Model NW are given by:
U c n = λ v p n + δ 1 λ v p e
U c e = v p e
By considering the indifference points between choosing platform e   and   n , we derive the user base (see Appendix B).

3.2.1. Stackelberg Game Model (F, NW)

Given the e-platform’s first-mover advantage, it determines the price first. Subsequently, the n-platform seller sets its price based on the price established by the e-platform.
Lemma 3.
The optimal pricing decisions are given as follows:
  p e F , N W = ( 1 λ ) ( 1 δ ) 2 λ 2 δ 1 λ
p n F , N W = ( 1 λ ) ( 1 δ ) 2 ( 2 λ 2 δ 1 λ ) ,
and the profits of e-platform and n-platform are given by:
π e F , N W = ( 1 λ ) ( 1 δ ) 4 2 λ 4 δ 1 λ
  π n F , N W = ( 1 λ ) ( 1 δ ) λ 4 ( 2 λ 2 δ 1 λ ) 2 ( δ + λ δ λ )   ,

3.2.2. Nash Model of Simultaneous Pricing (T, NW)

After the e-platform and n-platform decide their electricity price simultaneously, they can obtain their profit function.
Lemma 4.
By backward induction, the optimal pricing decisions are given as follows:
p e T , N W = 2 ( 1 λ ) ( 1 δ ) 4 4 δ ( 1 λ ) λ
p n T , N W = ( 1 λ ) ( 1 δ ) 4 4 δ ( 1 λ ) λ
and the profits of e-platform and n-platform are given by:
π e T , N W = 4 ( 1 λ ) ( 1 δ ) ( 1 δ ( 1 λ ) ) ( 4 4 δ ( 1 λ ) λ ) 2  
π n T , N W = λ ( 1 λ ) ( 1 δ ) 4 4 δ 1 λ λ 2 ( λ + δ λ δ )
Proof of consumers’ platform choices under model NW, Lemma 3 and Lemma 4. See Appendix B.

3.3. Platform’s Pricing Strategy with Fairness Concern but Without Power Dispatch (Model CO)

Next, we examine the case where fairness concerns are present among consumers, but power dispatch is absent, which corresponds to the(Yes, No) setting in Table 2, for brevity, denoted as CO.
Similar to Model CW, the utility functions for joining platform e and n under Model NW are given by:
U c n = λ v p n
U c e = v p e μ ( p e p n )
The user base is determined by analyzing the indifference points between choosing platform e and n , as detailed in Appendix C.

3.3.1. Stackelberg Game Model (F, CO)

Given the e-platform’s first-mover advantage, it determines the price first. Subsequently, the n-platform seller sets its price based on the price established by the e-platform.
Lemma 5.
The optimal pricing decisions are given as follows:
  p e F , C O = 1 λ 2 + μ λ
p n F , C O = 1 λ 2 ( 2 + μ λ )
and the profits of e-platform and n-platform are given by:
π e F , C O = 1 λ 4 2 λ + 2 μ
π n F , C O = ( 1 λ ) ( 1 + μ ) 4 ( 2 λ + μ ) 2  
Corollary 3.
In scenario CO, the e-platform’s user base decreases while the n-platform’s increases with μ : D e C O μ < 0 and D n C O μ > 0 . Moreover, both platforms’ prices and profits decline with μ , with the partial derivative given by: p e F , C O μ < 0 , p n F , C O μ < 0 , π e F , C O μ < 0 and π n F , C O μ < 0 .
Proof of consumers’ platform choices under model CO, Lemma 5 and Corollary 3. See Appendix C.

3.3.2. Nash Model of Simultaneous Pricing (T, CO)

After the e-platform and n-platform decide their electricity price simultaneously, they can obtain their profit function.
Lemma 6.
By backward induction, the optimal pricing decisions are given as follows:
  p e T , C O = 2 ( 1 λ ) 4 + 3 μ λ
p n T , C O = 1 λ 4 + 3 μ λ
and the profits of e-platform and n-platform are given by:
π e T , C O = 4 ( 1 λ ) ( 1 + μ ) ( 4 + 3 μ λ ) 2
π e T , C O = ( 1 λ ) ( 1 + μ ) ( 4 + 3 μ λ ) 2
Corollary 4.
The optimal price of the e-platform and n-platform decreases with μ : p e T , C O μ < 0 and p n T , C O μ < 0 ; The optimal profit of the two platforms also decreases with μ , respectively, with the partial derivative formulated as follows: π e T , C O μ < 0 and π n T , C O μ < 0 .
Proof of Lemma 6 and Corollary 4. See Appendix C.

3.4. Platform’s Pricing Strategy Without Fairness Concern or Power Dispatch (Model NO)

Lastly, we examine the case where neither fairness concern nor power dispatch is considered, i.e., the (No, No) case in Table 2, termed NO in the remainder of the discussion.
Similar to Model CW, the utility functions for joining platform e and n under Model NW are given by:
U c n = λ v p n
U c e = v p e
Considering the indifference points between choosing platform e and n , we derive the corresponding user base, which is presented in Appendix D.

3.4.1. Stackelberg Game Model (F, NO)

Given the e-platform’s first-mover advantage, it determines the price first. Subsequently, the n-platform seller sets its price based on the price established by the e-platform.
Lemma 7.
The optimal pricing decisions are given as follows:
  p e F , N O = 1 λ 2 λ
p n F , N O = 1 λ 2 ( 2 λ )
and the profits of e-platform and n-platform are given by:
π e F , N O = 1 λ 2 ( 2 λ )
    π n F , N O = 1 λ 4 ( 2 λ ) 2

3.4.2. Nash Model of Simultaneous Pricing (T, NO)

After the e-platform and n-platform decide their electricity price simultaneously, they can obtain their profit function.
Lemma 8.
Based on backward induction, the optimal pricing decisions are given as follows:
  p e T , N O = 2 ( 1 λ ) 4 λ
  p n T , N O = 1 λ 4 λ
and the profits of e-platform and n-platform are given by:
π e T , N O = 4 ( 1 λ ) ( 4 λ ) 2
π n T , N O = ( 1 λ ) ( 4 λ ) 2
Proof of consumers’ platform choices under model NO, Lemma 7 and Lemma 8. See Appendix D.
In sum, the optimal equilibrium solutions for the four scenarios are presented in Table 4. It is observed that: if μ = 0 , model CW reduces to model NW; if δ = 0 , model CW simplifies to model CO; if μ = 0 and δ = 0 , model CW degenerates to model NO. These relationships reflect the underlying logical structure of the models considered in this paper, where model CW serves as the most general form and the others emerge as special cases under specific parameter conditions.

4. Numerical Analysis

In this section, numerical simulations will be conducted to examine the impact of factors on the optimal pricing of the platform and its profits. We used MATLAB 2022a to conduct numerical analysis. Table 5 summarizes the core parameters analyzed in this section, and the reasons for the settings are illustrated below.

4.1. Impact of Market Power on the Optimal Solution

We first conduct a numerical experiment that compares the prices and platform profit outcomes under different models, with and without market power. These comparisons aim to illustrate how the introduction of market power influences the price and profitability under the Stackelberg and Nash models as discussed in Section 3.
To satisfy the assumptions and specific conditions of this study, we set μ = 0.35 and vary λ from 0.85 to 1 and δ from 0.5 to 1, while keeping all other parameters constant. The selection of parameter μ = 0.35   follows [41], and we also conduct a robustness check by setting it to μ = 0.55 and μ = 0.75 separately, finding that the conclusions remain unchanged. The range of λ   comes from the proof of Corollary 1 and Corollary 2, which require λ > 0.8 to obtain economically intuitive properties. For δ ’s range, a recent study shows that during power outages, over 60% households would be able to cover about half of their essential energy needs by using the back-up home batteries [45]. This indicates that, even under the worst-case of no coordination, the utility loss can be mitigated by 50%. Therefore, when coordination is considered, the loss-adjusted factor should reasonably be set greater than 0.5.
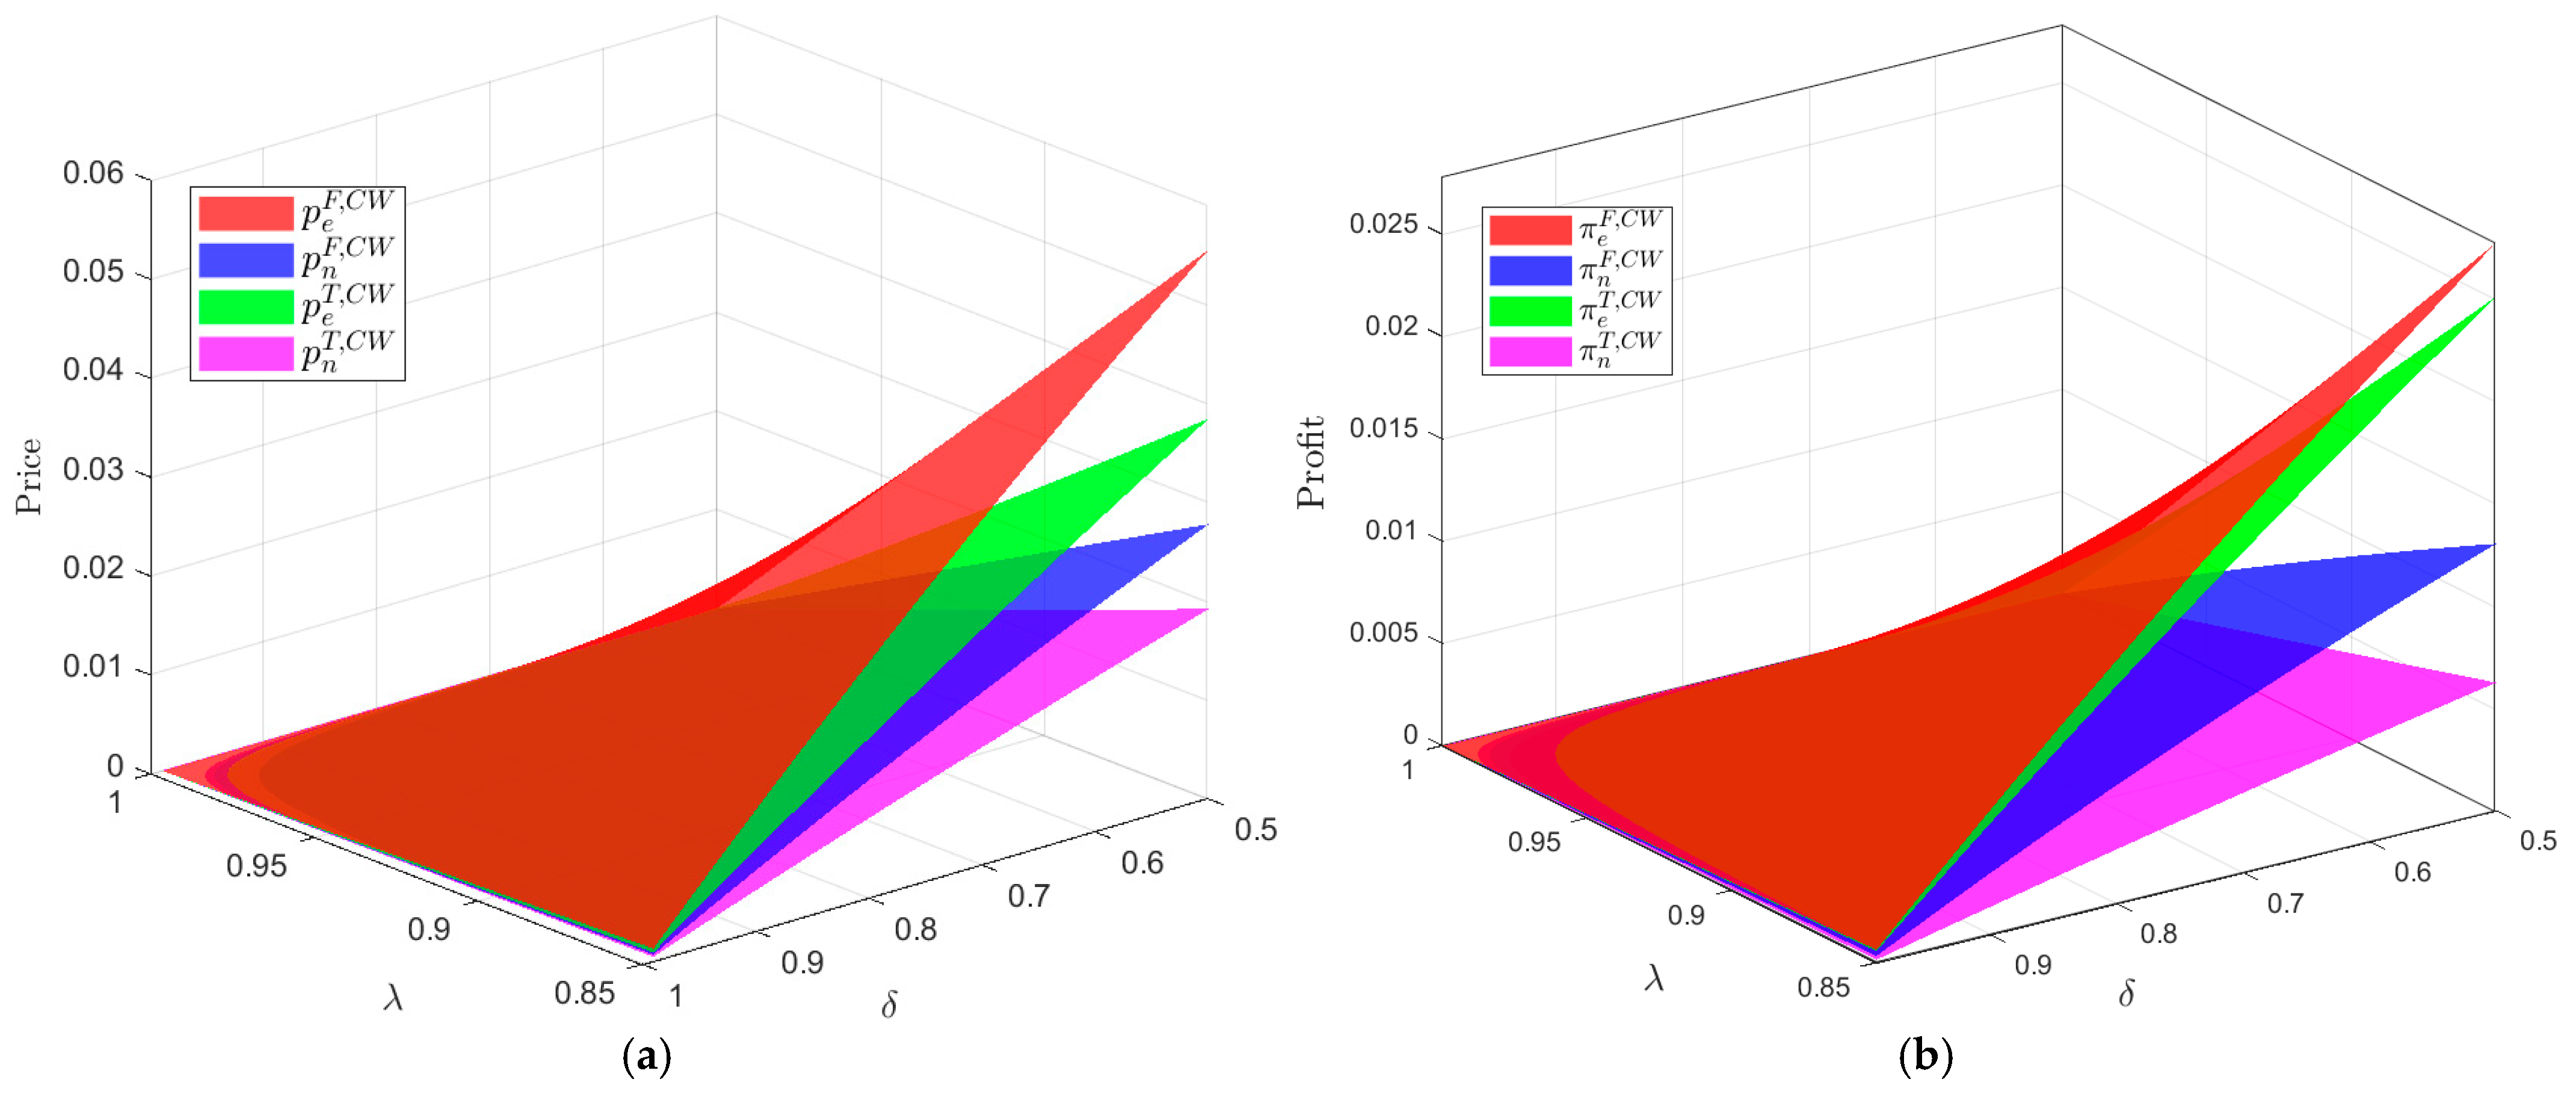
As featured in Figure 5a, the following relationship can be derived: when the traditional platform has a first-mover advantage (with market power), both platforms set high prices. However, when both platforms set prices simultaneously (no market power), they both opt for lower prices. Mathematical proof of these facts is shown in Corollary 5, which can be found in Appendix E. Figure 5b reveals the same trends regarding the effect of market power on platform profits: ceteris paribus, the profits increase when a platform has market power.

4.2. Impact of Fairness Concern on the Optimal Solution

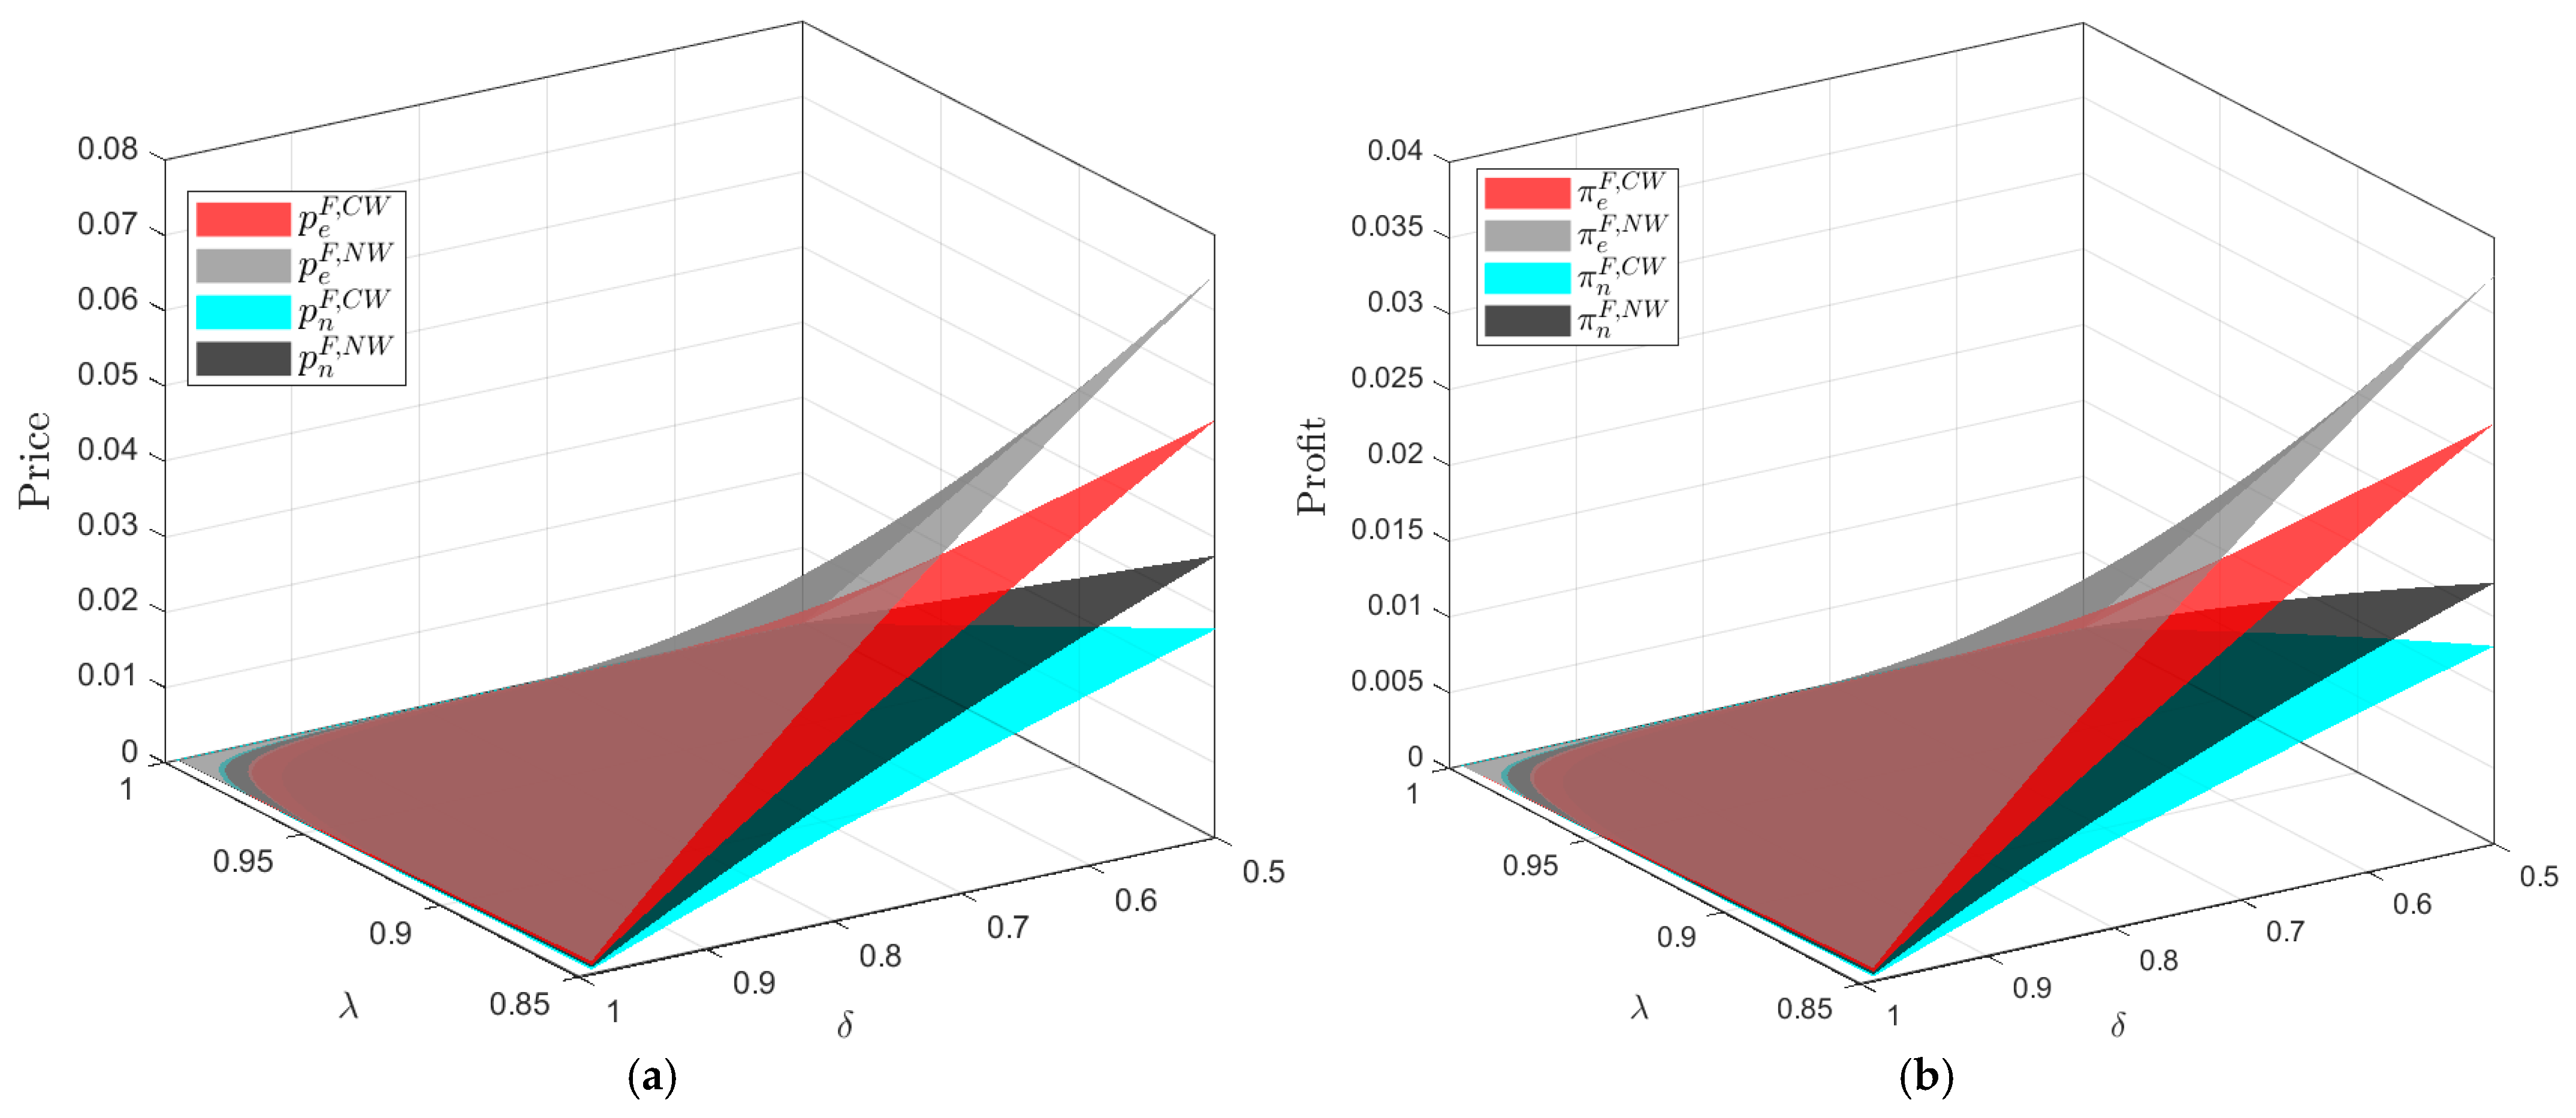
We then numerically analyze how the presence of fairness concerns affects the pricing and profits of the source-based platforms in models CW and NW, when electricity dispatch exists in both models. To conform to the assumptions and defined conditions, the parameters set are the same as those in Section 4.1, and the comparison is shown in Figure 6. It is observed that when consumers have fairness concerns, platform pricing tends to decrease, which leads to lower corresponding profits.

4.3. Impact of Energy Dispatch Coordination on the Optimal Solution

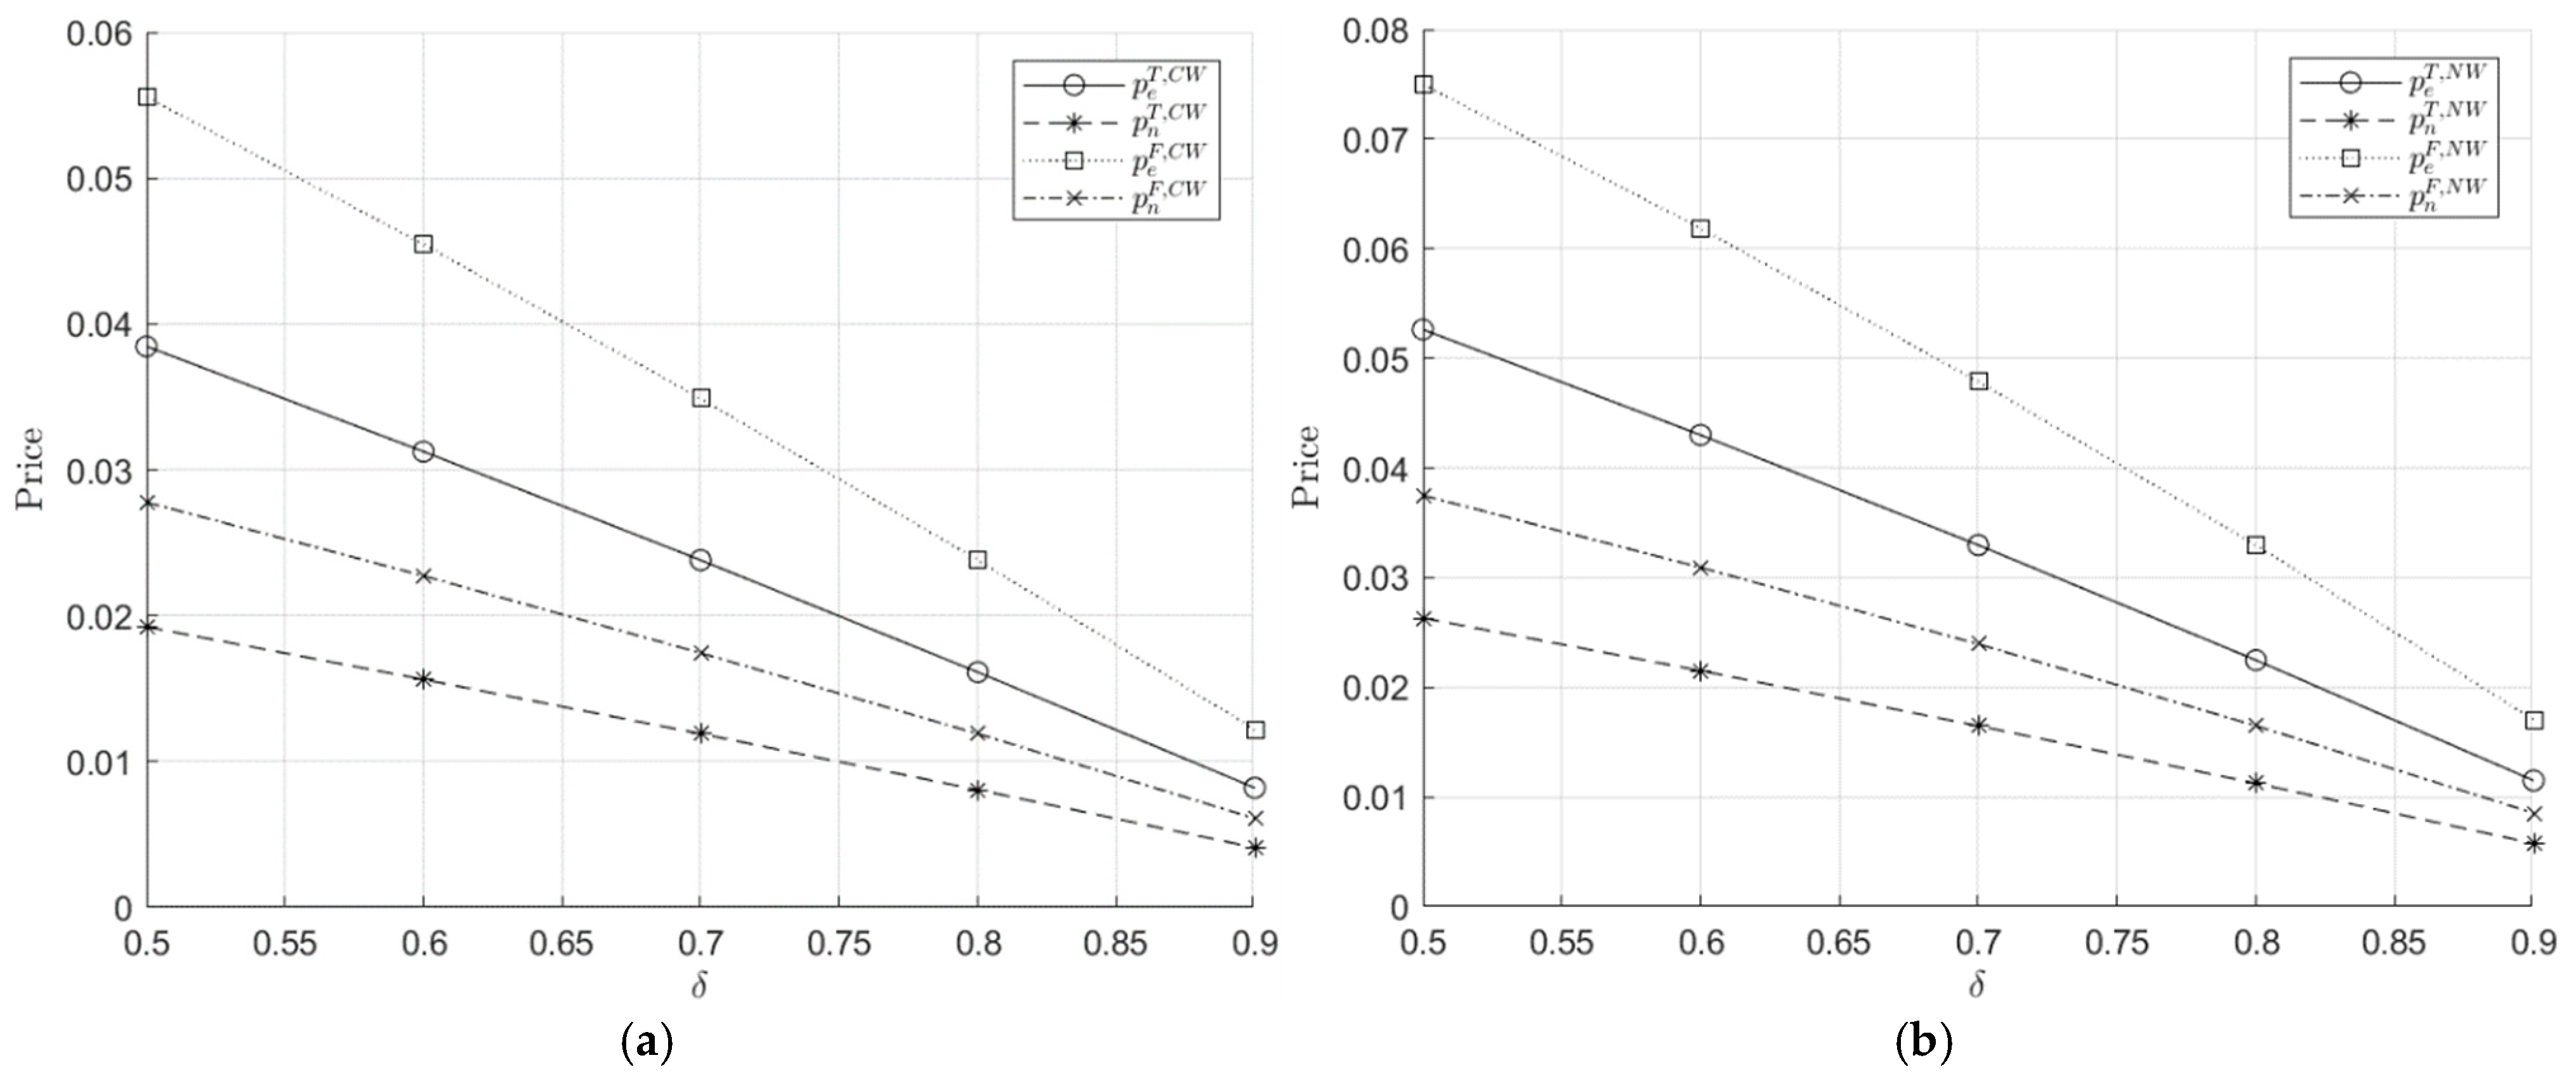
Additionally, this study also analyzes the impact of dispatch coordination between the green platform and the thermal platform on platform pricing. Next, Figure 7 shows how changes in the loss-adjusted factor affect electricity prices.
In Figure 7, the probability of buyer users successfully purchasing electricity from the green platform is set as λ = 0.85 , which comes from the proof of Corollary 1. And the fairness concern parameters are borrowed from [41], where it is assumed that μ = 0.35 . In both the CW and NW models, when dispatch exists and the loss-adjusted factor is large, the platform’s optimal pricing decreases. The optimal platform pricing with and without fairness concerns is captured in Figure 7a,b. The larger loss-adjusted factor indicates that users are more tolerant of losses, so platforms set lower prices to attract more users to expand market share.
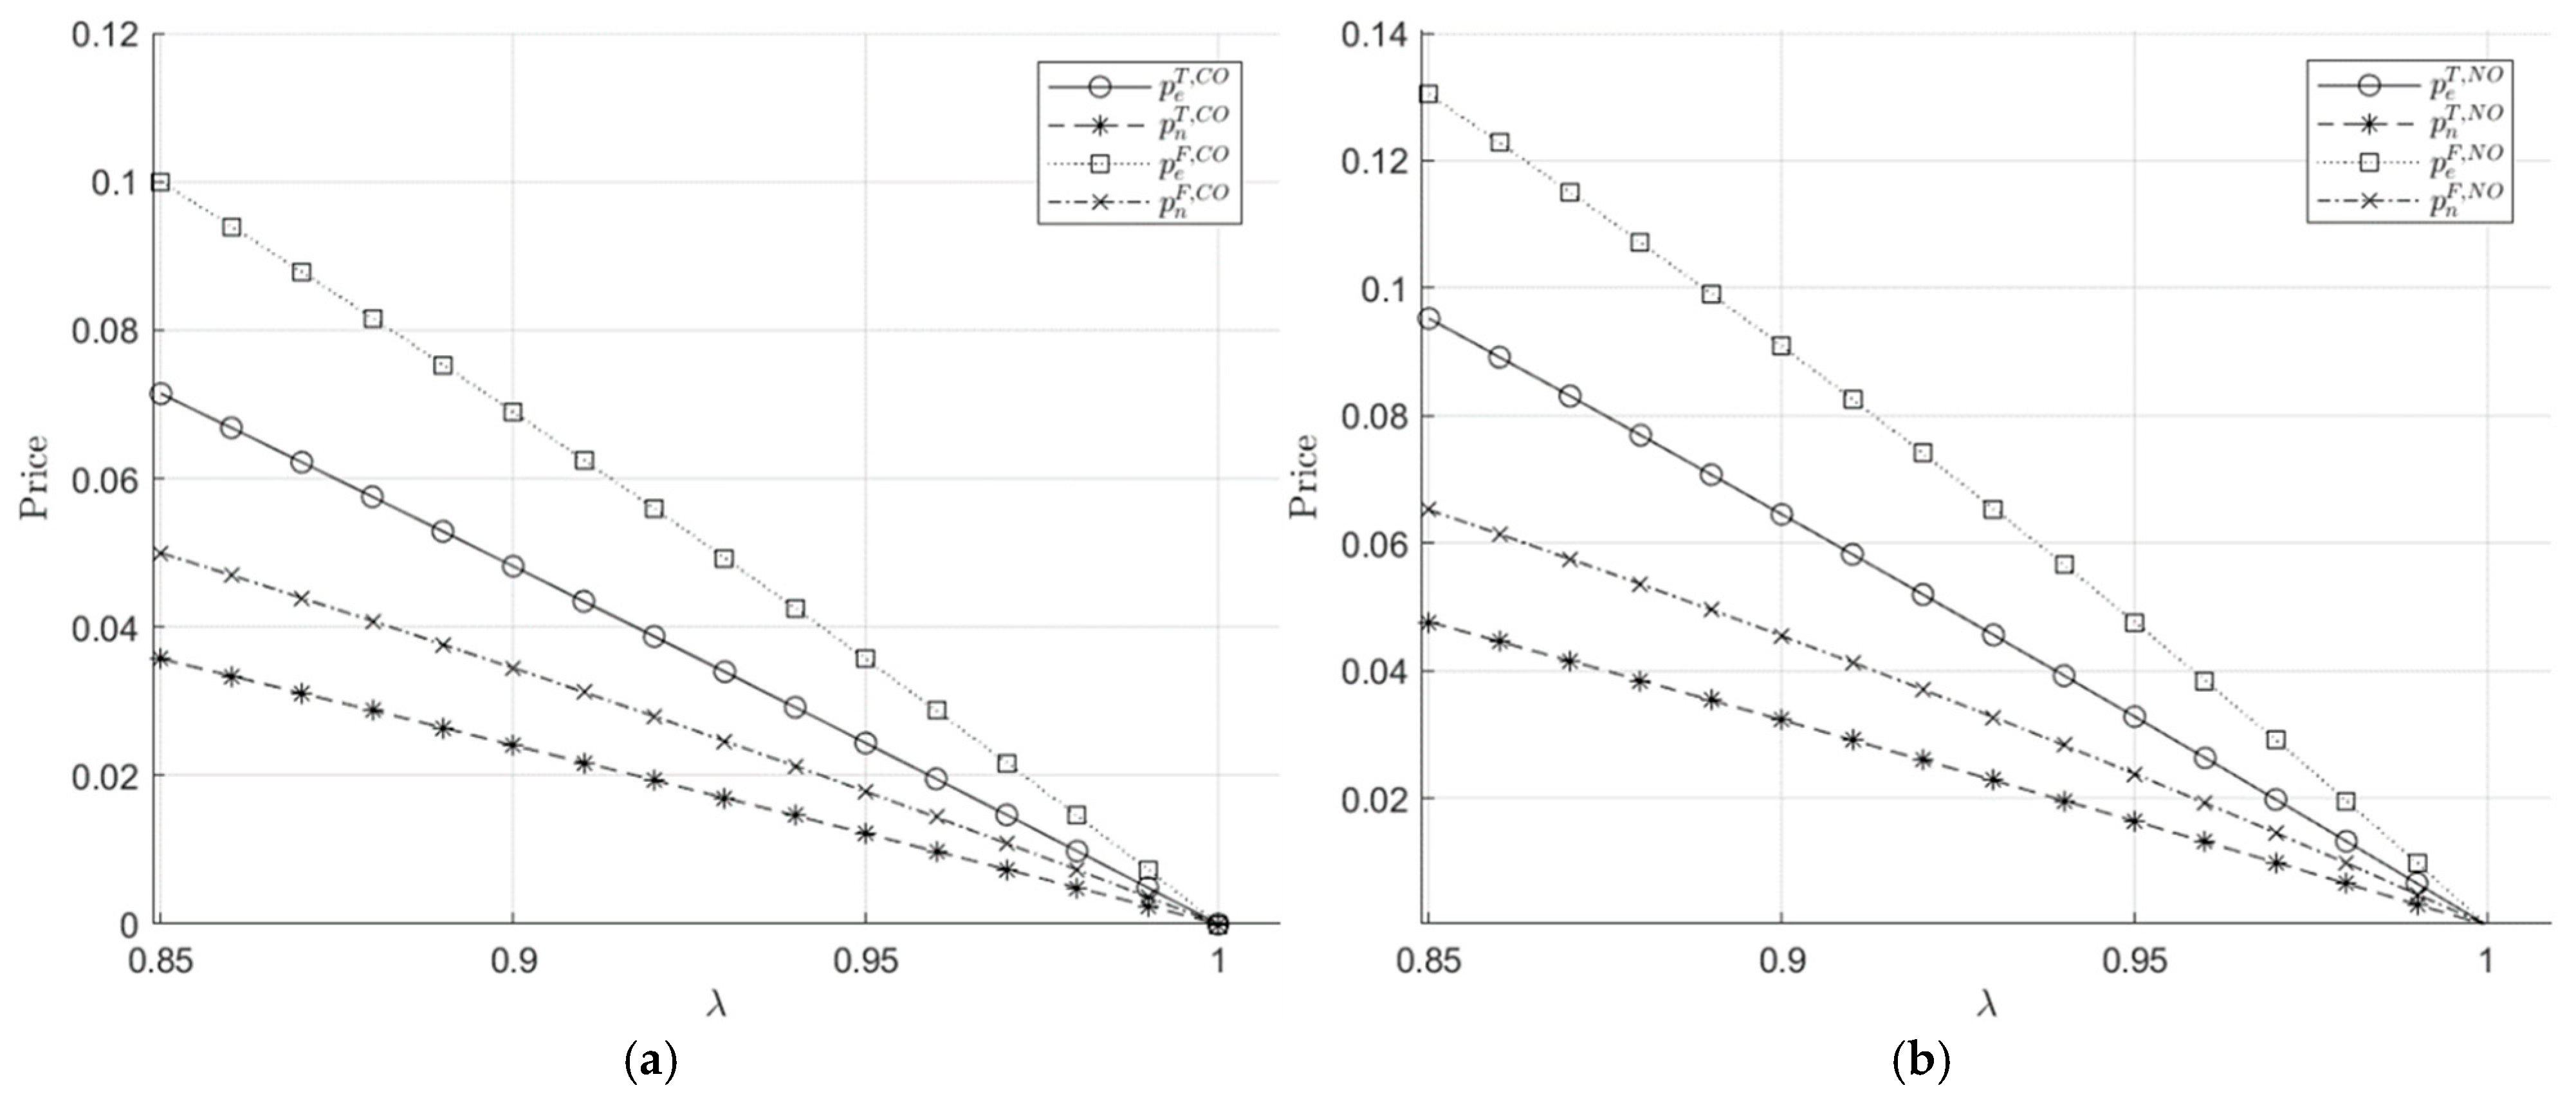
When electricity dispatch is NOT considered, the loss-adjusted factor δ does not exist in the model. Then we aim to clarify how changes in the economic preference factor affect electricity prices, as illustrated in Figure 8. For models CO and NO, as the probability of users successfully purchasing electricity ( λ ) from the green energy platform increases, the platform’s optimal pricing decreases. An increased success probability indicates that the green energy platform’s disadvantages are diminishing, leading to more intense competition between the two platforms. This heightened competition drives prices down for both platforms, and when the green energy platform’s success probability approaches 1, the prices of the two platforms tend to converge, meaning that the thermal platform has no advantage. From the aspect of economic preference factor, it is concluded that customers’ preference for lower cost (economic preference factor λ is higher) at the expense of comfort leads to lower electricity price.

4.4. Differential Impact of Fairness Concerns on Platform Profitability

Finally, this paper further clarifies the extent to which customer fairness concerns affect platform profitability. While fairness concerns, like dispatch coordination and market power, can also be considered in terms of presence or absence as illustrated in the previous section, here we analyze the effects of fairness concerns from another perspective, viewing them as intensity variables.
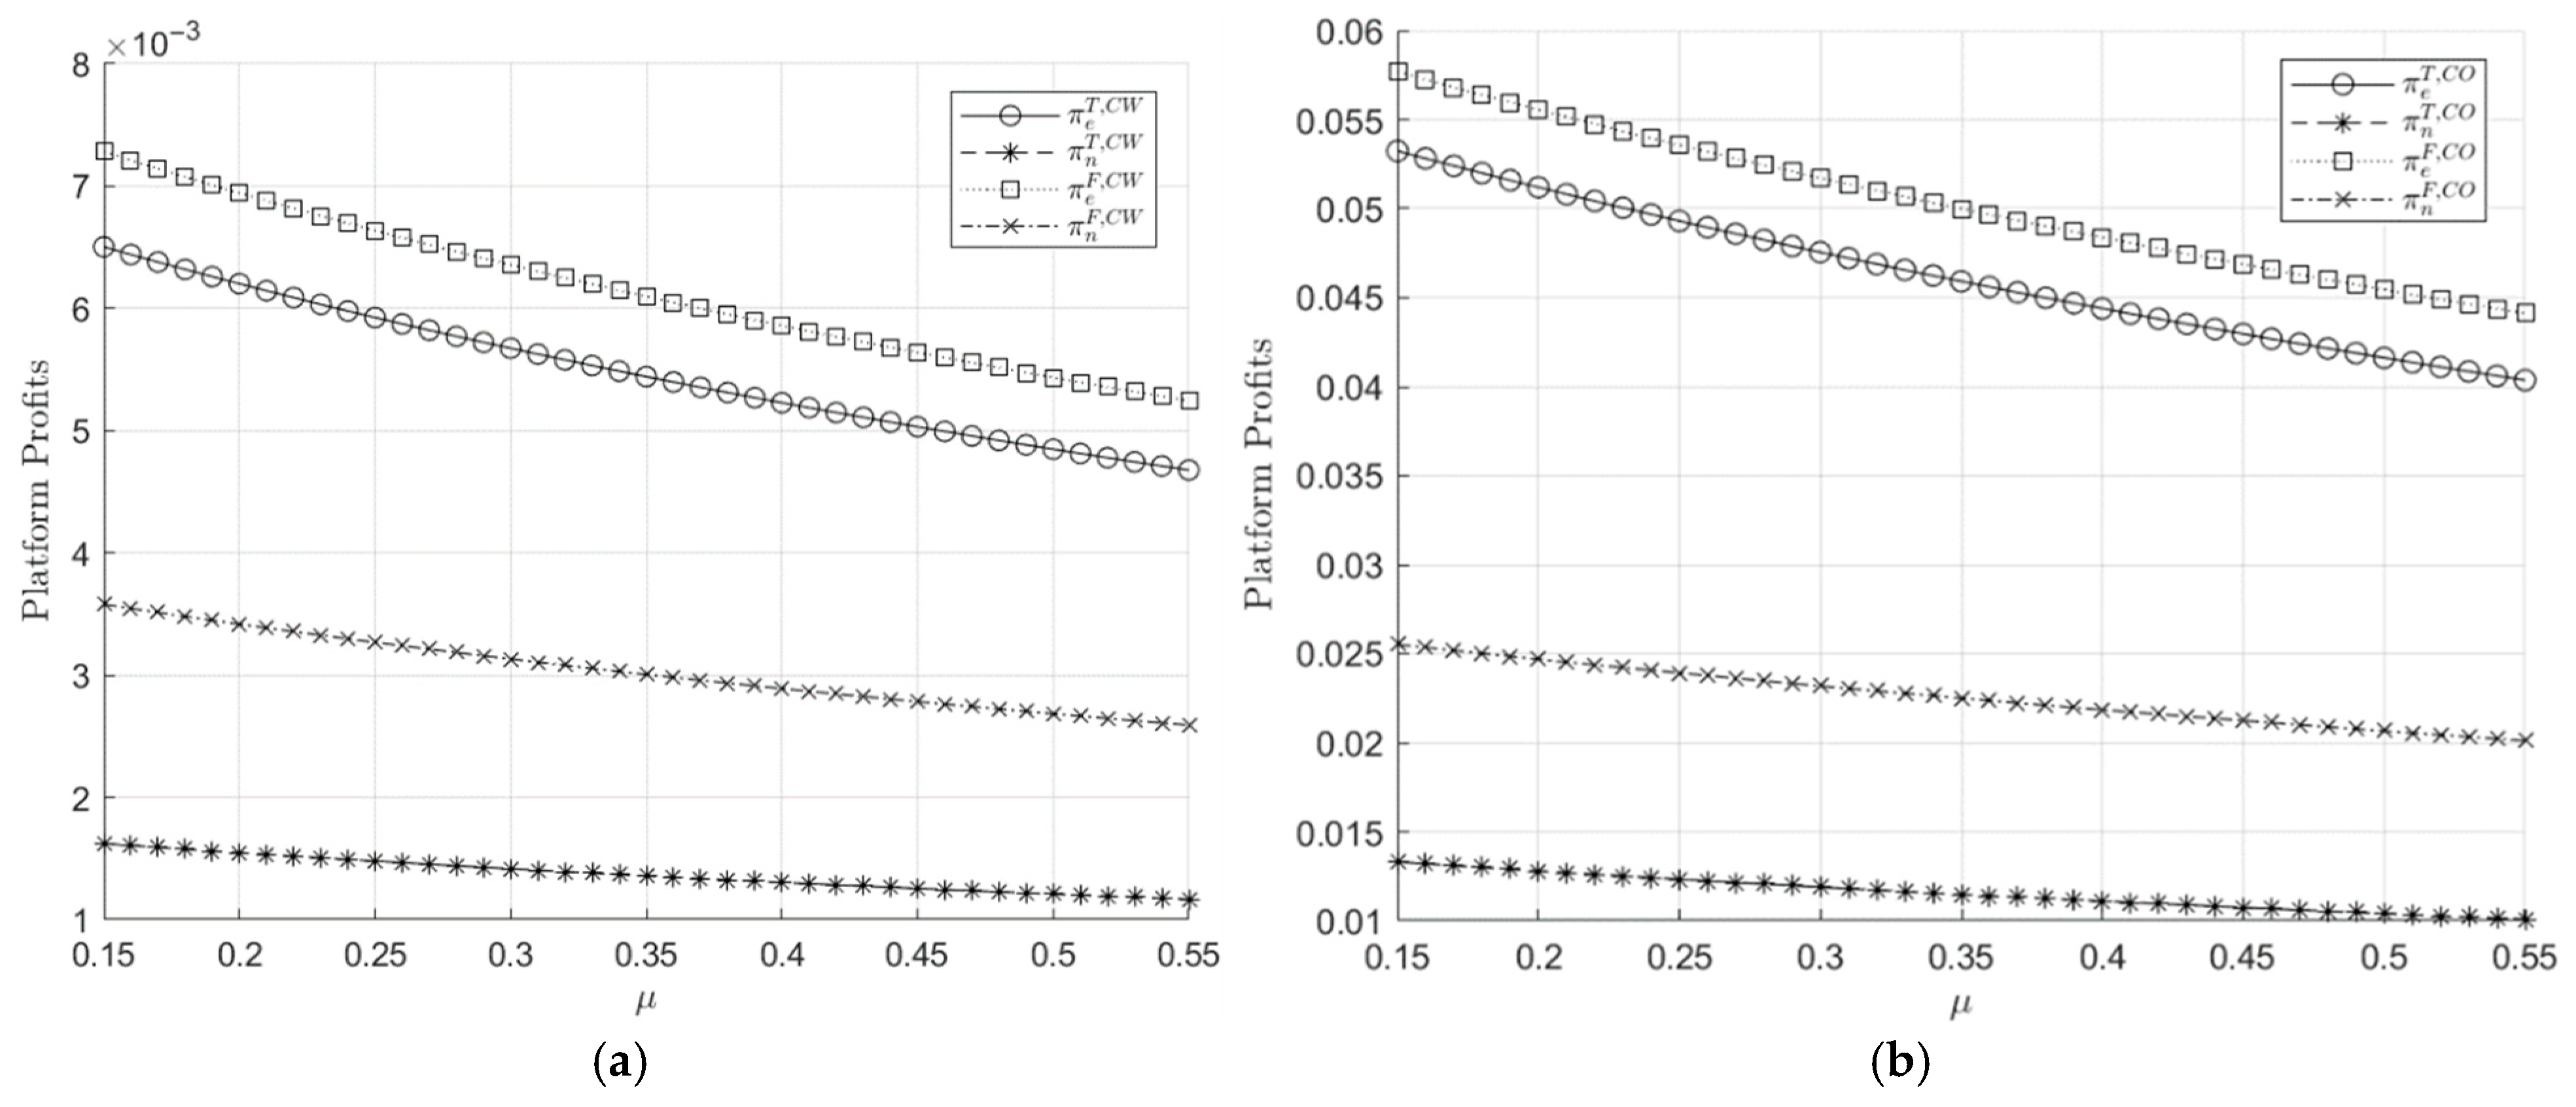
For models CW and CO, when considering fairness concerns, we aim to clarify how changes in the intensity of fairness concerns affect platform profits. We focus on the range of fairness concerns with the value of μ ( 0.15 ,   0.55 ) , and additionally consider the ranges of μ ( 0.35 ,   0.75 ) and μ ( 0.75 ,   1 ) . We find that the overall trends among the key function values remain unchanged. The probability of buyer users successfully purchasing electricity from green platform is set as λ = 0.85 , and the loss-adjusted factor is set as δ = 0.9 in Figure 9a. However, in Figure 9b, no electricity dispatch is assumed; therefore, the only parameter assumed here is that λ = 0.85 .
From Figure 9, it is concluded that platform profits decrease as the fairness concern coefficient increases. High fairness concerns imply that consumers are sensitive to price gaps, which intensifies competition between the two platforms and reduces their profits. These numerical simulation results are consistent with the conclusions drawn from Corollary 1 to Corollary 4 regarding the impact of fairness concerns on profits.

5. Discussion

5.1. Discussion of Findings

Combining all of the mathematical derivative results and numerical simulations mentioned before, we further conducted the comparative analysis under different scenarios, obtaining the following conclusions regarding three main factors: fairness concern, dispatch coordination, and market power.
(1)
By analyzing the equilibrium solutions shows that, ceteris paribus, prices under fairness concerns are lower than those without. When comparing CW with NW in Figure 7, or comparing CO with NO in Figure 8, the results suggest that when fairness concerns exist, platforms compensate users economically by offering lower prices.
(2)
According to Figure 9, in the presence of dispatch coordination (CW), both platforms’ prices and profits are lower than in the absence of coordination (CO). When coordination exists between platforms, if combined with a higher economic preference factor and a higher loss-adjusted factor, the comparative advantage of thermal power declines and competition intensifies, leading to lower electricity prices. Therefore, the profits under the coordination case are also lower.
(3)
As shown in Figure 9a, under the scenario where electricity dispatch exists, the profit of e-platform is always greater than that of n-platform, π e T , C W > π n T , C W and π e F , C W > π n F , C W . Given the same platform, the profit from simultaneous pricing by a platform is always lower than the profit of e-platform when it has a first-mover advantage, π e T , C W < π e F , C W and π n T , C W < π n F , C W .
(4)
Without considering resource dispatch, changes in the fairness concern coefficient have a similar impact on platform profits. The numerical simulations in Figure 9b also show that under the absence of resource dispatch, the profit of e-platform remains higher than that of n-platform, π e T , C O > π n T , C O and π e F , C O > π n F , C O . Given the same platform, the profit from simultaneous pricing by both platforms is always lower than the profit of e-platform when it holds a first-mover advantage, π e T , C O < π e F , C O and π n T , C O < π n F , C O . The intuitive results align with the findings of [41].

5.2. Managerial Implications

This section offers managerial insights for regulators and policymakers from the perspective of three main influencing factors.
The first key policy insight concerns the role of fairness concerns in shaping user participation and platform outcomes. Our analysis indicates that stronger fairness preferences among users, such as concerns about price disparities, can lead to reduced user masses, lowering overall platform prices and profits. Regulators should take fairness not only as a social ideal but as an economic factor influencing market equilibrium. For instance, it is important to set the goals to ensure transparency in pricing and promote equal access to different source-based platform services.
The second policy implication arises from the nature of platform coordination. While coordination between platforms can improve overall electricity supply resilience, it also reduces the comparative advantage of thermal power and intensifies competition under some conditions, leading to lower prices and profits. To maintain the sustainability of electricity platforms, regulators may trade off between system resilience and platform profitability. Properly governed coordination can enhance efficiency without undermining competition, as demonstrated in the ENTSO-E electricity market in Europe.
Finally, our findings underscore the importance of addressing market power in platform-based electricity markets. In our model, traditional platforms consistently outperform green electricity platforms when they can set prices first or exert stronger control over resources. Regulatory authorities in emerging economies should implement measures to promote competition, facilitate the entry of energy market suppliers, and prevent anti-competitive practices to protect consumers.

5.3. Research Limitations and Future Work

The limitations of this study are as follows: (1) This paper models user decision-making from the perspective of incentive compatibility, assuming that users decide whether to join the platform based on rational decision-making. Future research could modify the model by considering bounded rationality such as the effect of consumer inertia on platform choice [46]. In addition, future studies could integrate more comprehensive stochastic analysis of consumer behavior to capture the complexity of uncertainty in preferences and decision-making. (2) The model in this paper focuses solely on fairness concerns regarding two types of electricity prices, but does not consider the fairness concerns of in-platform profits. Dual fairness concerns are discussed in different contexts [47]. Future research could introduce the concept of profit fairness between platforms and explore how platforms can adjust their pricing strategies to achieve fair profit distribution. Furthermore, extending the analysis to a dynamic, repeated-game framework would provide a more complete understanding of the reality. (3) For simplicity, this paper does not consider other transmission costs or cost sharing between platforms [48]. It is expected that if the green platform compensates the thermal platform for services under the coordination case, the thermal platform’s market power will increase, which in turn may lead both platforms to set higher prices, as discussed previously. Future research could extend this model by explicitly incorporating empirical validation with real-world data, such as cost-sharing cases, which would further strengthen the robustness and applicability of the conclusions. (4) This paper concentrates on the case of two-platform competition. If multiple competitors of the same type are introduced, the model would need to be revised. It can also be anticipated that intensified competition reduces market power, which in turn may lead both platforms to set lower prices, consistent with the earlier discussion. In summary, we will further address the above limitations by exploring the three main directions in future research.

6. Conclusions

This paper examines an energy platform coordination model in which customers choose between competing platforms to meet their electricity demand. It analyzes platform optimal pricing strategies while incorporating fairness concerns and market power. Corresponding to the questions mentioned earlier, the conclusions drawn in this paper are as follows: (1) the user base and optimal price decrease as fairness concerns increase; (2) for the influence of market power on pricing strategies, this paper finds that when the traditional platform possesses a first-mover advantage, it tends to set higher prices to maintain market dominance. Then, the new platform that seeks to compete may also adopt high pricing strategies. Conversely, in the scenario where both platforms set prices simultaneously, a tendency toward lower prices is observed; (3) coordination reduces profits under the conditions where the likelihood of consumers successfully purchasing electricity from a green platform ( λ ) is high, which reflects the intensified competition between the two source-based platforms.
In addition to theoretical contributions, the practical significance of this study lies in supporting China’s electricity market reform, which aims to introduce competitive electricity sales entities, establish a fair, open, and orderly market, and gradually liberalize consumer choice. From the comparison of profits across different cases, we conclude that market power, fairness concerns and platform coordination are key factors influencing the sustainable operation of the electricity platform. Therefore, we can derive the implication that regulators should consider measures to increase price transparency, ensuring a competitive and resilient electricity market.
This study has some limitations, which suggest promising directions for future research. For instance, future studies could include the stochastic factor in consumer choices or consider bounded rationality, validate the model with real-world data, and introduce multiple competitors with dynamic interactions through repeated games.

Author Contributions

Writing—original draft preparation, A.W.; methodology, L.K. and A.W.; formal analysis, A.W.; writing—review and editing, L.K. and A.W.; supervision, L.K. All authors have read and agreed to the published version of the manuscript.

Funding

The authors would like to thank the National Natural Science Foundation of China under Grant 72073044, the Key Project of National Funds of Social Science of China under Grant 20AJY008, the Major Project of National Funds of Social Science of China under Grant 20&ZD060, and the Major Project of National Funds of Social Science of China under Grant 24ZDA026 for their supports of the project.

Data Availability Statement

No data were created or analyzed in this study.

Conflicts of Interest

The authors declare no conflicts of interest.

Abbreviations

The following abbreviations are used in this manuscript:
CWConsidering fairness concern and with power dispatch
COConsidering fairness concern, excluding power dispatch
NWNo fairness concern and with power dispatch
NONo fairness concern, excluding power dispatch

Appendix A

Proof of customer’s choice.
According to the IC and IR constraints as mentioned before, U c n 0 means that:
v > λ p n + 1 λ δ p e δ 1 λ + λ ,
λ p n + ( 1 λ ) δ p e λ + 1 λ δ > λ p n + ( 1 λ ) δ p n λ + 1 λ δ = [ λ + 1 λ δ ] p n λ + 1 λ δ = p n ,
and it is concluded that v > p n . The economic intuition is that if some consumers prioritize green electricity consumption, it means that their reservation value is higher than the price of green electricity. For simplicity, let the critical point at which a user’s reservation value exceeds p n be denoted as v c n , meaning that the user chooses green platform.
Similarly, U c e 0 means that v > p e + μ ( p e p n ) , then we obtain:
p e + μ p e p n > p e + μ p e p e = p e
and it is concluded that v > p e . The economic intuition is the same as that mentioned under U c n 0 . For simplicity, let the critical point at which a user’s reservation value exceeds p e be denoted as v c e .
U c n U c e implies that customers will choose the green platform rather than the thermal platform, as the utility obtained from the former is greater. Rearranging the inequality, we obtain that:
v > p e + μ ( p e p n ) λ p n ( 1 λ ) δ p e ( 1 λ ) ( 1 δ ) ,
then it is calculated as follows:
p e + μ ( p e p n ) λ p n ( 1 λ ) δ p e ( 1 λ ) ( 1 δ ) > p e + μ ( p e p e ) λ p e ( 1 λ ) δ p e ( 1 λ ) ( 1 δ ) = p e .
Therefore, the indifference point at which buyers are equally willing to choose between the two platforms lies on the side of p e . For simplicity, let the critical point at which a user’s reservation values for choosing the green platform and the thermal platform are the same be noted as v e n .
Since p e > p n , we can conclude that v e n > v c e > v c n according to the inequalities as follows:
v e n v c e = 1 1 λ 1 δ p e + μ p e p n λ p n 1 λ δ p e 1 λ 1 δ > p e λ + δ λ δ p e λ + δ λ δ 1 λ 1 δ = 0 ,
and   v c n = λ p n + ( 1 λ ) δ p e λ + ( 1 λ ) δ < λ p e + ( 1 λ ) δ p e λ + ( 1 λ ) δ = p e < p e + μ ( p e p n ) = v c e
Hence, as illustrated in Figure 1, users with valuation v v c n , v c e   choose the green platform, as it is the only option yielding a positive payoff. In the interval ( v e n , 1 ] , users switch to the thermal platform, which offers a higher payoff than the green platform. In the intermediate range ( v c e , v e n ) , both platforms provide positive payoffs, but the green platform still yields the higher one. Although users in this range are eligible to join the e-platform (as their valuation exceeds v c e ), they prefer the green platform because its payoff remains higher up until the indifference point v e n .
This ordering v e n > v c e > v c n captures how user choice transitions as valuation increases and reflects differences in platform utility. Therefore, the user masses for joining the e-platform and n-platform in equilibrium are, respectively, as illustrated in Figure 1. The user masses of the two platforms under scenario CW are as follows:
D e C W = 1 p e + μ p e p n λ p n 1 λ δ p e 1 λ 1 δ and   D n C W = p e + μ ( p e p n ) λ p n ( 1 λ ) δ p e ( 1 λ ) ( 1 δ ) λ p n + 1 λ δ p e λ + 1 λ δ
The proof of user mass under other models (Model NW, CO, and NO) is consistent with that of the current model. □
Proof of Lemma 1.
The profit functions of the thermal platform and green platform are given by:
π e = p e ( 1 p e + μ ( p e p n ) λ p n ( 1 λ ) δ p e ( 1 λ ) ( 1 δ ) ) ,
and   π n = p n ( p e + μ ( p e p n ) λ p n ( 1 λ ) δ p e ( 1 λ ) ( 1 δ ) λ p n + ( 1 λ ) δ p e λ + ( 1 λ ) δ ) .
Following the decision sequence, the Stackelberg equilibrium solution is derived using backward induction. First, the first-order partial derivatives of π n with respect to p n are calculated,
π n p n = ( λ 1 + ( 1 δ ) μ + δ μ ) ( p e 2 p n ) ( 1 λ ) ( 1 δ ) ( δ + λ δ λ ) ,
and set it equal to zero, then the equation is solved for p n : p n = 0.5 p e .
Next, the previously obtained results are substituted into the thermal platform’s profit function, yielding the following outcome:
π e = p e ( μ λ + 2 2 δ 1 λ ) p e 2 2 ( 1 λ ) ( 1 δ ) .
We then take the first-order derivatives of π e with respect to p e , setting the results equal to zero. Finally, substituting the equilibrium solutions p e into the earlier equation provides the complete set of equilibrium solutions, as shown in Lemma 1. □
Proof of Corollary 1.
Taking the first-order derivative of π e F , C W and π n F , C W with respect to μ for the model CW, results in:
π e F , C W μ = 1 + δ + λ λ δ 2 2 2 δ λ + 2 λ δ + μ 2 < 0 ,
π n F , C W μ = 1 λ 1 δ 2 δ 2 1 λ 2 + λ λ + μ δ λ 1 ( 2 + 3 λ + μ ) 4 ( δ λ + δ λ ) 2 2 δ λ + 2 λ δ + μ 3 ,
Rearranging the inequality 2 δ 2 1 λ 2 + λ λ + μ > δ λ 1 2 + 3 λ + μ or equivalently when
μ > δ λ 1 2 + 3 λ 2 δ 2 1 λ 2 λ 2 δ + λ δ λ ,
We further verify that when λ exceeds the critical value of 2/3, the right-hand side of the inequality becomes negative, which implies that the condition on μ is automatically satisfied. Under such conditions, the partial derivative of π n F , C W with respect to μ is less than 0:
π n F , C W μ < 0 .
Proof of Lemma 2.
Taking the first-order derivative of with respect to p e and p n for the model CW leads to:
π e p e = 1 2 p e 1 + μ + δ 1 + λ + 2 p e 2 λ p e + λ p n 1 + μ p n ( 1 λ ) ( 1 δ ) = 0 ,
π n p n = ( δ μ λ ( δ μ μ 1 ) ) ( p e 2 p n ) ( 1 λ ) ( 1 δ ) ( δ + λ δ λ ) = 0 ,
Then the equations are set to zero, respectively, and the system of equations is solved to determine the optimal electricity price under the model CW. Then, substituting the equilibrium solution into the before-mentioned equation, we can obtain all the equilibrium solutions as shown in Lemma 2. □
Proof of Corollary 2.
Taking the first-order derivative of D e T , C W and D n T , C W with respect to μ for the model CW, results in:
D e C W μ = ( p e p n ) ( 1 λ ) ( 1 δ ) < 0 ,
D n C W μ = p e p n ( 1 λ ) ( 1 δ ) > 0 .
Taking the first-order derivative of π e T , C W and π n T , C W with respect to μ for the model CW, results in:
π e T , C W μ = 4 1 λ 1 δ 2 2 δ 1 λ + λ + 3 μ 4 4 δ 1 λ λ + 3 μ 3 < 0 ,
π n T , C W μ = 1 λ 1 δ 4 δ 2 1 λ 2 + λ 2 + λ + 3 μ δ λ 1 ( 4 + 5 λ + 3 μ ) δ + λ δ λ 4 4 δ 1 λ λ + 3 μ 3 ,
Rearranging the inequality 4 δ 2 1 λ 2 + λ 2 + λ + 3 μ > δ λ 1 ( 4 + 5 λ + 3 μ ) yields that:
μ > δ λ 1 4 + 5 λ 4 δ 2 1 λ 2 λ ( 2 + λ ) 3 δ + λ δ λ ,
Under our maintained parameter assumptions, the denominator is strictly positive, so the direction of the inequality is preserved. We further verify that for the critical value λ > 0.8 , the right-hand side is negative, and thus the condition on μ is automatically satisfied.
The partial derivative of π n T , C W with respect to μ is less than 0:
π n T , C W π n μ < 0 .
Taking the first-order derivative of p e T , C W and p n T , C W with respect to μ for the model CW, results in:
p e T , C W μ = 6 1 λ 1 δ 4 4 δ 1 λ λ + 3 μ 2 < 0 ,
p n T , C W μ = 3 1 λ 1 δ 4 4 δ 1 λ λ + 3 μ 2 < 0 ,
and   p e T , C W μ > p n T , C W μ
This result indicates that an increase in users’ fairness concerns will result in a larger-scale price reduction on the e-platform. □

Appendix B

Proof of the customer’s choice.
Based on the customer’s utility function, we can conclude that v e n > v c e > v c n , as shown by the following inequalities:
v e n = p e λ p n ( 1 λ ) δ p e ( 1 λ ) ( 1 δ ) > p e λ p e ( 1 λ ) δ p e ( 1 λ ) ( 1 δ ) = p e = v c e ,
and   v c n = λ p n + ( 1 λ ) δ p e λ + ( 1 λ ) δ < λ p e + ( 1 λ ) δ p e λ + ( 1 λ ) δ = p e = v c e .
Hence, the optimal choice for the customer follows. The user masses of the two platforms under scenario NW are shown below:
D e N W = 1 p e λ p n ( 1 λ ) δ p e ( 1 λ ) ( 1 δ ) ,
and   D n N W = p e λ p n ( 1 λ ) δ p e ( 1 λ ) ( 1 δ ) λ p n + 1 λ δ p e λ + 1 λ δ   .
Proof of Lemma 3.
The profit functions of the thermal platform and the green platform are given by:
π e = p e ( 1 p e λ p n ( 1 λ ) δ p e ( 1 λ ) ( 1 δ ) ) ,
and   π n = p n ( p e λ p n ( 1 λ ) δ p e ( 1 λ ) ( 1 δ ) λ p n + ( 1 λ ) δ p e λ + ( 1 λ ) δ ) ,
Following the decision sequence, the Stackelberg equilibrium solution is derived using backward induction. First, the first-order partial derivatives of π n with respect to p n are calculated, π n p n = λ ( p e 2 p n ) ( 1 λ ) ( 1 δ ) ( δ + λ δ λ ) and set it equal to zero, then the equation is solved for p n : p n = 0.5 p e .
Next, the previously obtained results are substituted into the thermal platform’s profit function, yielding the following outcome:
π e = p e + ( λ 2 + 2 δ 1 λ ) p e 2 2 ( 1 λ ) ( 1 δ ) .
We then take the first-order derivatives of π e with respect to p e , setting the results equal to zero.
Finally, substituting the equilibrium solutions p e into the earlier equation provides the complete set of equilibrium solutions, as shown in Lemma 3. □
Proof of Lemma 4.
Taking the first-order derivative of with respect to p e and p n for the model CW leads to:
π e p e = 1 2 p e + δ 1 + λ + 2 p e 2 λ p e + λ ( p n 1 ) ( 1 λ ) ( 1 δ ) = 0 ,
π n p n = λ ( p e 2 p n ) ( 1 λ ) ( 1 δ ) ( δ + λ δ λ ) = 0 ,
and the equations are set to zero, respectively, and the system of equations is solved to determine the optimal electricity price under the model NW. Then, substituting the equilibrium solution into the before-mentioned equation, we can obtain all the equilibrium solutions as shown in Lemma 4. □

Appendix C

Proof of the customer’s choice.
Based on the customer’s utility function, we can conclude that v e n > v c e > v c n , as shown by the following inequalities:
v e n = p e ( μ + 1 ) ( λ + μ ) p n 1 λ > p e ( μ + 1 ) ( λ + μ ) p e 1 λ = p e = v c e
and   v c e = p e μ + 1 μ p n > p n μ + 1 μ p n = p n = v c n .
Hence, the optimal choice for the customer is obtained. The user masses of the two platforms under scenario CO are given below:
D e C O = 1 p e ( μ + 1 ) ( λ + μ ) p n 1 λ ,
and   D n C O = p e ( μ + 1 ) ( λ + μ ) p n 1 λ p n   .
Proof of Lemma 5.
The profit functions of the thermal platform and the green platform are given by:
π e = p e ( 1 p e μ + 1 λ + μ p n 1 λ ) ,
π n = p n ( p e ( μ + 1 ) ( λ + μ ) p n ( 1 λ ) p n ) ,
Following the decision sequence, the Stackelberg equilibrium solution is derived using backward induction. First, the first-order partial derivatives of π n with respect to p n are calculated, π n p n = ( 1 + μ ) ( p e 2 p n ) 1 λ and set it equal to zero, then the equation is solved for p n : p n = 0.5 p e .
Next, the previously obtained results are substituted into the thermal platform’s profit function, yielding the following outcome π e = p e + ( λ 2 μ ) p e 2 2 ( 1 λ ) .
We then take the first-order derivatives of π e with respect to p e , setting the results equal to zero.
Finally, substituting the equilibrium solutions p e into the earlier equation provides the complete set of equilibrium solutions, as shown in Lemma 5. □
Proof of Corollary 3.
Taking the first-order derivative of π e F , C O and π n F , C O with respect to μ for the model CO results in:
π e F , C O μ = 1 λ ( 2 + μ λ ) 2 < 0 ,
π n F , C O μ = ( 1 λ ) ( μ + λ ) 4 ( 2 + μ λ ) 3 < 0 ,
Taking the first-order derivative of p e F , C O and p n F , C O with respect to μ for the model CO results in:
p e F , C O μ = 1 λ ( 2 + μ λ ) 2 < 0 ,
p n F , C O μ = 1 λ 2 ( 2 + μ λ ) 2 < 0 .
Proof of Lemma 6.
Taking the first-order derivative of with respect to p e and p n for the model CW leads to:
π e p e = 1 2 μ + 1 p e λ + ( μ + λ ) p n 1 λ = 0
π n p n = μ + 1 ( p e 2 p n ) 1 λ = 0
and the equations are set to zero, respectively, and the system of equations is solved to determine the optimal electricity price under the model CO.
Then, substituting the equilibrium solution into the afore-mentioned equation, we can obtain all the equilibrium solutions as shown in Lemma 6. □
Proof of Corollary 4.
Taking the first-order derivative of D e T , C O and D n T , C O with respect to μ for the model CO results in:
D e C O μ = p e p n 1 λ < 0 ,
D n C O μ = p e p n 1 λ > 0
Taking the first-order derivative of π e T , C O and π n T , C O with respect to μ for the model CO results in:
π e T , C O μ = 4 ( 1 λ ) ( 2 + 3 μ + λ ) ( 4 + 3 μ λ ) 3 < 0 ,
π n T , C O μ = 1 λ 2 + 3 μ + λ 4 + 3 μ λ 3 < 0 ,
Taking the first-order derivative of p e T , C O and p n T , C O with respect to μ for the model CO results in:
p e T , C O μ = 6 ( 1 λ ) ( 4 + 3 μ λ ) 2 < 0 ,
p n T , C O μ = 3 ( 1 λ ) ( 4 + 3 μ λ ) 2 < 0 ,
and p e T , C O μ > p n T , C O μ also holds in the same way as shown in the model CW. □

Appendix D

Proof of customer’s choice.
Based on the customer’s utility function, we can conclude that v e n > v c e > v c n , as shown by the following inequalities: v e n = p e λ p n 1 λ > p e λ p e 1 λ = p e = v c e , and v c e = p e > p n = v c n . Hence, the customer’s optimal choice follows. The user masses of the two platforms under scenario NO are presented as follows:
D e N O = 1 p e λ p n 1 λ ,
and   D n N O = p e λ p n 1 λ p n   .
Proof of Lemma 7.
The profit functions of the thermal platform and the green platform are given by:
π e = p e ( 1 p e λ p n 1 λ ) ,
π n = p n ( p e λ p n 1 λ p n ) ,
Following the decision sequence, the Stackelberg equilibrium solution is derived using backward induction. First, the first-order partial derivatives of π n with respect to p n are calculated, π n p n = p e 2 p n 1 λ and set it equal to zero, then the equation is solved for p n : p n = 0.5 p e .
Next, the previously obtained results are substituted into the thermal platform’s profit function, yielding the following outcome π e = p e 1 0.5 λ p e 2 1 λ .
We then take the first-order derivatives of π e with respect to p e , setting the results equal to zero.
Finally, substituting the equilibrium solutions p e into the earlier equation provides the complete set of equilibrium solutions, as shown in Lemma 7. □
Proof of Lemma 8.
Taking the first-order derivative of with respect to p e and p n for the model NO leads to:
π e p e = 1 λ 2 p e + λ p n 1 λ = 0 ,
π n p n = p e 2 p n 1 λ = 0 ,
and the equations are set to zero, respectively, and the system of equations is solved to determine the optimal electricity price under the model NO. Then, substituting the equilibrium solution of into the before-mentioned equation, we can obtain all the equilibrium solutions as shown in Lemma 8. □

Appendix E

Proof of Corollary 5.
Since p e = 2 p n , we only need to compare the optimal pricing p e under the two market power cases, namely, first-mover advantage or simultaneous pricing. Based on the most complex CW model, if p e T , C W < p e F , C W , i.e., 2 ( 1 λ ) ( 1 δ ) 4 4 δ 1 λ λ + 3 μ < ( 1 λ ) ( 1 δ ) 2 + μ λ 2 δ 1 λ = 2 ( 1 λ ) ( 1 δ ) 4 4 δ 1 λ + 2 μ 2 λ holds, the proof is complete. Therefore, we only need to prove condition 3 μ λ > 2 μ 2 λ . Since 3 μ λ 2 μ 2 λ = μ + λ is evidently greater than 0, the proof is complete. □

References

  1. United Nations. The 17 Goals. Available online: https://sdgs.un.org/goals (accessed on 8 August 2025).
  2. Cheng, X.; Liu, P.; Zhu, L. The Impact of Electricity Market Reform on Renewable Energy Production. Energy Policy 2024, 194, 114306. [Google Scholar] [CrossRef]
  3. Zeng, M.; Yang, Y.; Wang, L.; Zhang, X. The Power Industry Reform in China 2015: Policies, Evaluations and Solutions. Renew. Sustain. Energy Rev. 2016, 57, 94–110. [Google Scholar] [CrossRef]
  4. Kong, L.; Lu, K.; Xie, J.; Zhu, Z. Competitive strategies for differentiated services of power trading platforms under the situation of release of electricity selling market. Comput. Ind. Eng. 2025, 203, 110956. [Google Scholar] [CrossRef]
  5. Zeng, Y.; Wei, X.; Yao, Y.; Xu, Y.; Sun, H.; Chan, W.; Feng, W. Determining the pricing and deployment strategy for virtual power plants of peer-to-peer prosumers: A game-theoretic approach. Appl. Energy 2023, 345, 121349. [Google Scholar] [CrossRef]
  6. Steadman, S.; Bennato, A.R.; Giulietti, M. Would you like to trade your energy? A comparative survey experiment on energy trading platforms. Energy J. 2024, 45, 1–24. [Google Scholar] [CrossRef]
  7. Guo, S.; Feng, T. Blockchain-based smart trading mechanism for renewable energy power consumption vouchers and green certificates: Platform design and simulation. Appl. Energy 2024, 369, 123351. [Google Scholar] [CrossRef]
  8. Menzel, T.; Teubner, T. Green Energy Platform Economics—Understanding Platformization and Sustainabilization in the Energy Sector. Int. J. Energy Sect. Manag. 2021, 15, 456–475. [Google Scholar] [CrossRef]
  9. Kufeoglu, S.; Liu, G.; Anaya, K.; Pollitt, M. Digitalisation and New Business Models in Energy Sector; Cambridge Working Papers in Economics; Cambridge University: Cambridge, UK, 2019; Available online: https://www.jstor.org/stable/pdf/resrep30431.pdf (accessed on 8 August 2025).
  10. Kowalska-Pyzalska, A. An Empirical Analysis of Green Electricity Adoption among Residential Consumers in Poland. Sustainability 2018, 10, 2281. [Google Scholar] [CrossRef]
  11. Ambec, S.; Crampes, C. Electricity Provision with Intermittent Sources of Energy. Resour. Energy Econ. 2012, 34, 319–336. [Google Scholar] [CrossRef]
  12. Dorsey-Palmateer, R. Effects of Wind Power Intermittency on Generation and Emissions. Electr. J. 2019, 32, 25–30. [Google Scholar] [CrossRef]
  13. Reguant, M. The Efficiency and Sectoral Distributional Impacts of Large-Scale Renewable Energy Policies. J. Assoc. Environ. Resour. Econ. 2019, 6, 129–168. [Google Scholar] [CrossRef]
  14. Wang, C.; Chen, H.; Wang, Z.; Gao, Y.; Zhang, G. Economic Assessment and Grid Parity Analysis of Photovoltaic Power Generation Considering Tradable Green Certificate. Appl. Energy 2025, 382, 125282. [Google Scholar] [CrossRef]
  15. Motalleb, M.; Siano, P.; Ghorbani, R. Networked Stackelberg Competition in a Demand Response Market. Appl. Energy 2019, 239, 680–691. [Google Scholar] [CrossRef]
  16. Yin, S.; Ai, Q.; Li, Z.; Zhang, Y.; Lu, T. Energy Management for Aggregate Prosumers in a Virtual Power Plant: A Robust Stackelberg Game Approach. Int. J. Electr. Power Energy Syst. 2020, 117, 105605. [Google Scholar] [CrossRef]
  17. Ambec, S.; Crampes, C. Decarbonizing Electricity Generation with Intermittent Sources of Energy. J. Assoc. Environ. Resour. Econ. 2019, 6, 1105–1134. [Google Scholar] [CrossRef]
  18. Hotaling, C.; Bird, S.; Heintzelman, M.D. Willingness to Pay for Microgrids to Enhance Community Resilience. Energy Policy 2021, 154, 112248. [Google Scholar] [CrossRef]
  19. Mazur, Ł.; Cieślik, S.; Czapp, S. Trends in Locally Balanced Energy Systems without the Use of Fossil Fuels: A Review. Energies 2023, 16, 4551. [Google Scholar] [CrossRef]
  20. Weitemeyer, S.; Kleinhans, D.; Vogt, T.; Agert, C. Integration of Renewable Energy Sources in Future Power Systems: The Role of Storage. Renew. Energy 2015, 75, 14–20. [Google Scholar] [CrossRef]
  21. Zhang, C.; Wu, J.; Zhou, Y.; Cheng, M.; Long, C. Peer-to-Peer Energy Trading in a Microgrid. Appl. Energy 2018, 220, 1–12. [Google Scholar] [CrossRef]
  22. Crampes, C.; von Der Fehr, N.H.M. Decentralised cross-border interconnection. Energy J. 2023, 44, 147–169. [Google Scholar] [CrossRef]
  23. Park, D.; Kaffine, D.T. Do competitive markets clean up the US electricity sector?: Evidence from the Southwest Power Pool. Energy J. 2025, 46, 99–125. [Google Scholar] [CrossRef]
  24. Das, U.; Nandi, C.; Mandal, S.; Bhattacharjee, S. A systematic literature review on hybrid energy systems. Energy Environ. 2023, 34, 3417–3449. [Google Scholar] [CrossRef]
  25. Al-Awami, A.T.; El-Sharkawi, M.A. Coordinated Trading of Wind and Thermal Energy. IEEE Trans. Sustain. Energy 2011, 2, 277–287. [Google Scholar] [CrossRef]
  26. Zeng, M.; Yang, Y.; Fan, Q.; Liu, Y.; Zou, Z. Coordination between Clean Energy Generation and Thermal Power Generation under the Policy of “Direct Power-Purchase for Large Users” in China. Util. Policy 2015, 33, 10–22. [Google Scholar] [CrossRef]
  27. Gautier, A.; Jacqmin, J.; Poudou, J.C. The Prosumers and the Grid. J. Regul. Econ. 2018, 53, 100–126. [Google Scholar] [CrossRef]
  28. Gautier, A.; Jacqmin, J.; Poudou, J.C. The Energy Community and the Grid. Resour. Energy Econ. 2025, 82, 101480. [Google Scholar] [CrossRef]
  29. Martín-Utrilla, F.D.; Chaves-Ávila, J.P.; Cossent, R. Decision Framework for Selecting Flexibility Mechanisms in Distribution Grids. Econ. Energy Environ. Policy 2022, 11, 71–92. [Google Scholar] [CrossRef]
  30. Yang, Z.; Fu, X.; Gao, P.; Chen, Y. Fairness Regulation of Prices in Competitive Markets. Manuf. Serv. Oper. Manag. 2024, 26, 1897–1917. [Google Scholar] [CrossRef]
  31. Schittekatte, T.; Meeus, L. Least-Cost Distribution Network Tariff Design in Theory and Practice. Energy J. 2020, 41, 119–156. [Google Scholar] [CrossRef]
  32. Soares, J.; Lezama, F.; Faia, R.; Limmer, S.; Dietrich, M.; Rodemann, T.; Ramos, S.; Vale, Z. Review on Fairness in Local Energy Systems. Appl. Energy 2024, 374, 123933. [Google Scholar] [CrossRef]
  33. Gasca, M.V.; Rigo-Mariani, R.; Debusschere, V.; Sidqi, Y. Fairness in Energy Communities: Centralized and Decentralized Frameworks. Renew. Sustain. Energy Rev. 2025, 208, 115054. [Google Scholar] [CrossRef]
  34. Dynge, M.F.; Cali, U. Distributive energy justice in local electricity markets: Assessing the performance of fairness indicators. Appl. Energy 2025, 384, 125463. [Google Scholar] [CrossRef]
  35. Rios-Ocampo, M.A.; Romero, J.C.; Centeno, E.; Mora, S. A just energy transition is not just a transition: Framing energy justice for a quantitative assessment. Energy Res. Soc. Sci. 2025, 119, 103900. [Google Scholar] [CrossRef]
  36. Musilek, P.; Hussain, A. Equity-oriented power sharing and demand response for enhancing green energy access in mixed communities. Energy Build. 2024, 308, 114029. [Google Scholar] [CrossRef]
  37. Chen, L.; Wang, Y.; Zeng, L.; Jiang, J.; Zhu, X.; Peng, J. Logistics Service Decision for E-Commerce Supply Chain with Fairness Concern under Uncertain Environment. Int. J. Gen. Syst. 2024, 54, 1–36. [Google Scholar] [CrossRef]
  38. Müsgens, F. Quantifying Market Power in the German Wholesale Electricity Market Using a Dynamic Multi-Regional Dispatch Model. J. Ind. Econ. 2006, 54, 471–498. [Google Scholar] [CrossRef]
  39. Borenstein, S.; Bushnell, J.B.; Wolak, F.A. Measuring Market Inefficiencies in California’s Restructured Wholesale Electricity Market. Am. Econ. Rev. 2002, 92, 1376–1405. [Google Scholar] [CrossRef]
  40. Liu, X.; Wang, Q.; Wu, C. A Stackelberg Game Approach for Heterogeneous Energy Market in Integrated Energy System. Int. J. Energy Res. 2021, 45, 1038–1054. [Google Scholar] [CrossRef]
  41. Zhou, C.; Li, X.; Ren, Y.; Yu, J. How Do Fairness Concern and Power Structure Affect Competition between E-Platforms and Third-Party Sellers? IEEE Trans. Eng. Manag. 2023, 71, 7479–7495. [Google Scholar] [CrossRef]
  42. Crowley, B.; Kazempour, J.; Mitridati, L. How Can Energy Communities Provide Grid Services? A Dynamic Pricing Mechanism with Budget Balance, Individual Rationality, and Fair Allocation. Appl. Energy 2025, 382, 125154. [Google Scholar] [CrossRef]
  43. Ansarin, M.; Ghiassi-Farrokhfal, Y.; Ketter, W.; Collins, J. A Review of Equity in Electricity Tariffs in the Renewable Energy Era. Renew. Sustain. Energy Rev. 2022, 161, 112333. [Google Scholar] [CrossRef]
  44. Chandra, R.; Banerjee, S.; Radhakrishnan, K.K.; Panda, S.K. Transactive Energy Market Framework for Decentralized Coordination of Demand Side Management within a Cluster of Buildings. IEEE Trans. Ind. Appl. 2021, 57, 3385–3395. [Google Scholar] [CrossRef]
  45. Sun, T.; Feng, Y.; Zanocco, C.; Flora, J.; Majumdar, A.; Rajagopal, R. Solar and battery can reduce energy costs and provide affordable outage backup for US households. Nat. Energy 2025, 10, 1025–1040. [Google Scholar] [CrossRef]
  46. Yun, G.; Zheng, Q.P.; Bai, L.; Pasiliao, E.L. Robust Pricing for Demand Response under Bounded Rationality in Residential Electricity Distribution. Eur. J. Oper. Res. 2025, 324, 654–668. [Google Scholar] [CrossRef]
  47. Deng, Z.; Shaharudin, M.R.; Shariff, S.; Tseng, M. Optimal Decisions in an Authorized Remanufacturing Closed-Loop Supply Chain under Dual-Fairness Concerns. Sustainability 2024, 16, 7609. [Google Scholar] [CrossRef]
  48. Chen, Z.; Khalilpour, K.; Yao, Q. Coordinating Risk Aversion and Pricing Strategies in Green Supply Chains: A Study of Manufacturer Competition. Sustainability 2024, 16, 11284. [Google Scholar] [CrossRef]
Figure 1. Sequences of events in the game.
Sustainability 17 08144 g001
Figure 2. Energy coordination versus independent operation.
Sustainability 17 08144 g002
Figure 3. The 2-by-2-by-2 scenario topology for energy coordination.
Sustainability 17 08144 g003
Figure 4. Customer’s choice under IC and IR constraints.
Sustainability 17 08144 g004
Figure 5. (a) Impact of market power on the optimal pricing; (b) Impact of market power on the profit.
Sustainability 17 08144 g005
Figure 6. (a) Impact of fairness concern on the optimal pricing; (b) Impact of fairness concern on the profit.
Sustainability 17 08144 g006
Figure 7. (a) Impact of the loss-adjusted factor on pricing under coordination case CW; (b) Impact of the loss-adjusted factor on pricing under coordination case NW.
Sustainability 17 08144 g007
Figure 8. (a) Impact of the economic preference factor on pricing under no coordination case CO; (b) Impact of the economic preference factor on pricing under no coordination case NO.
Sustainability 17 08144 g008
Figure 9. (a) Impact of the extent of fairness concern on platform’s profit under the case CW; (b) Impact of the extent of fairness concern on platform’s profit under the case CO.
Sustainability 17 08144 g009
Table 1. Summary of the related literature.
ReferencesDispatch CoordinationMarket PowerFairness Concern Platform Competition Modelling
[22,23,26]
[29]
[30]
[32]
[33]
[38]
[39]
[41]
This paper
Table 2. Model Structure Description.
With Power DispatchWithout Power Dispatch
Fairness concern(Yes, Yes)(Yes, No)
Fairness neutral(No, Yes)(No, No)
Table 3. Parameter and Variable Description.
NotationDescription
Subscript e , n e , n means thermal “electricity” platform and “new” green platform, separately
Superscript T , F T denotes simultaneous pricing, whereas F means the presence of the first-mover advantage
Parameter v The reservation value of the buyer when joining either of the platforms
λ The economic preference factor, proxied as the probability of a consumer successfully purchasing electricity from a green platform
δ The loss-adjusted coefficient for the consumer when switching to the thermal platform
μ Fairness concerns the sensitivity of consumers when joining a thermal platform
Utility Function U c e , U c n The utility of consumers “choosing” platform e or n
v c e , v c n , v e n v c e and v c n are the critical points for consumers “choosing” platform e or n under IR; v e n represents the indifference point between choosing e or n under IC
Decision variables D e , D n The user base for joining the platform e or n
p e , p n Electricity price in platform e and n
π e , π n Profit function in platform e and n
Table 4. Comparison analysis of the optimal outcomes.
EquilibriumModel CWModel NWModel COModel NO
Stackelberg pricing of e-platform ( 1 λ ) ( 1 δ ) 2 + μ λ 2 δ 1 λ ( 1 λ ) ( 1 δ ) 2 λ 2 δ 1 λ 1 λ 2 + μ λ 1 λ 2 λ
Stackelberg pricing of n-platform ( 1 λ ) ( 1 δ ) 2 ( 2 + μ λ 2 δ 1 λ ) ( 1 λ ) ( 1 δ ) 2 ( 2 λ 2 δ 1 λ ) 1 λ 2 ( 2 + μ λ ) 1 λ 2 ( 2 λ )
Nash pricing of
e-platform
2 ( 1 λ ) ( 1 δ ) 4 4 δ 1 λ λ + 3 μ 2 ( 1 λ ) ( 1 δ ) 4 4 δ ( 1 λ ) λ 2 ( 1 λ ) 4 + 3 μ λ 2 ( 1 λ ) 4 λ
Nash pricing of
n-platform
( 1 λ ) ( 1 δ ) 4 4 δ ( 1 λ ) λ + 3 μ ( 1 λ ) ( 1 δ ) 4 4 δ ( 1 λ ) λ 1 λ 4 + 3 μ λ 1 λ 4 λ
e-platform profit
under Stackelberg
( 1 λ ) ( 1 δ ) 4 + 2 μ 2 λ 4 δ 1 λ ( 1 λ ) ( 1 δ ) 4 2 λ 4 δ 1 λ 1 λ 4 2 λ + 2 μ 1 λ 2 ( 2 λ )
n-platform profit
under Stackelberg
( 1 λ ) ( 1 δ ) ( δ μ + λ 1 + 1 δ μ ) 4 ( δ + λ δ λ ) ( 2 + μ λ 2 δ 1 λ ) 2 ( 1 λ ) ( 1 δ ) λ 4 ( 2 λ 2 δ 1 λ ) 2 ( δ + λ δ λ ) ( 1 λ ) ( 1 + μ ) 4 ( 2 λ + μ ) 2 1 λ 4 ( 2 λ ) 2
e-platform profit
under Nash
4 ( 1 λ ) ( 1 δ ) ( 1 + μ δ 1 λ ) ( 4 4 δ ( 1 λ ) λ + 3 μ ) 2 4 ( 1 λ ) ( 1 δ ) ( 1 δ ( 1 λ ) ) ( 4 4 δ ( 1 λ ) λ ) 2 4 ( 1 λ ) ( 1 + μ ) ( 4 + 3 μ λ ) 2 4 ( 1 λ ) ( 4 λ ) 2
n-platform profit
under Nash
( 1 λ ) ( 1 δ ) ( μ δ + λ 1 + 1 δ μ ) 4 4 δ 1 λ λ + 3 μ 2 ( λ + δ λ δ ) λ ( 1 λ ) ( 1 δ ) 4 4 δ 1 λ λ 2 ( λ + δ λ δ ) ( 1 λ ) ( 1 + μ ) ( 4 + 3 μ λ ) 2 ( 1 λ ) ( 4 λ ) 2
Table 5. Key parameters in the numerical analysis.
ParametersMeaningValue Ranges
λ The economic preference factor, proxied as the probability of a consumer successfully purchasing electricity from a green platform>0.8
δ The consumer loss-adjusted coefficient accounts for the residual part of the value after considering the losses>0.5
μ Fairness concern(0, 1), with 0.35 used in some cases
Disclaimer/Publisher’s Note: The statements, opinions and data contained in all publications are solely those of the individual author(s) and contributor(s) and not of MDPI and/or the editor(s). MDPI and/or the editor(s) disclaim responsibility for any injury to people or property resulting from any ideas, methods, instructions or products referred to in the content.