Abstract
Amid intensifying global climate change, coastal cities are facing increased heat stress. The sea breeze plays a crucial role in mitigating the urban heat island effect and improving outdoor thermal comfort, warranting detailed investigation of its spatiotemporal impacts. This research, conducted in Sendai, Japan, combines the Weather Research and Forecasting (WRF) model with the Rayman thermal comfort model to assess the spatiotemporal evolution of the Physiological Equivalent Temperature (PET) on typical sea breeze days, exploring heat stress patterns. The findings indicate significant PET reductions in the area due to sea breeze influence, although high heat stress persists in urban centers. The coastal zone (0–4 km) experiences the longest period of low heat stress, whereas the inland zone (20–26 km) suffers from poor thermal comfort. Heat stress intensifies in the northwestern inland regions, while improvement progresses from the coast inland. Vegetated areas reach low heat stress states earlier than built-up areas; both coastal and urban zones quickly revert to “no heat stress” conditions. The results demonstrate that the cooling effect of sea breezes decreases with distance, its efficacy hindered by urban environments, whereas vegetated lands prolong comfort inland. These insights are crucial for planning thermal environments in coastal cities.
1. Introduction
Global climate change has increased the frequency and intensity of extreme temperature events, with high temperatures posing well-documented threats to human health—particularly for vulnerable populations like the elderly and those with underlying conditions [1,2]. The World Health Organization (WHO) has explicitly linked high temperatures to elevated risks of premature death [3].
Thermal comfort reflects an individual’s subjective psychological state of satisfaction with the thermal environment, a state of consciousness when an individual perceives the thermal environment as satisfactory. Distinct yet related, thermal sensation is a subjective description of the “cold” or “hot” properties of a thermal environment [4]. Thermal comfort is primarily influenced by environmental parameters such as air temperature, humidity, wind speed, and radiant temperature [5]. However, the perception of comfort can vary among individuals, influenced by factors such as age, gender, cultural background, geographical location, and climatic conditions [6]. Different populations or groups, due to variations in physiological characteristics or cultural backgrounds, may have different thermal comfort needs. For example, children and the elderly often face challenges in thermoregulation [7,8]. Moreover, outdoor thermal comfort is not only directly related to physical and mental health [9] and behavioral patterns but also plays a crucial role in promoting outdoor activities, enhancing social interaction [10], and driving sustainable urban development [11]. Studies indicate that outdoor thermal comfort is one of the key environmental factors influencing residents’ willingness to participate in outdoor activities [12].
Owing to the advantages of transportation accessibility and economic agglomeration effects, major global economic activities are predominantly concentrated in coastal regions, resulting in over half of the global population (approximately 3 billion people) residing in coastal urban areas [13]. Sea breeze, a mesoscale circulation driven by thermal differences between land and sea, primarily functions by transporting relatively cool and moist maritime air inland [14]. Leveraging its cooling and humidifying effects, sea breeze can effectively mitigate human heat stress responses, thereby creating a more comfortable thermal environment in coastal cities [15]. Comparative studies have demonstrated that the presence of sea breezes significantly enhances outdoor thermal comfort [16], while their absence exacerbates discomfort during hot periods [17], highlighting the necessity for in-depth investigation of this phenomenon. It is noteworthy that the mechanisms through which sea breezes impact urban thermal environments are complex. Numerous studies [18,19,20] have explored the interaction between sea breezes and urban settings, consistently indicating that the cooling effect of sea breezes contributes to the weakening of Urban Heat Island (UHI) intensity, thus effectively improving outdoor thermal comfort conditions in cities. For instance, research by Emmanuel and Johansson in Colombo, Sri Lanka, confirmed that the absence of sea breezes during hot afternoons leads directly to a thermally uncomfortable environment [17]. Similarly, Lopes et al. found in Madeira, Portugal, that areas affected by sea breezes typically exhibit higher daytime thermal comfort levels [16]. However, current research on the impact of summer sea breezes on outdoor thermal comfort in coastal cities, particularly regarding their spatial and temporal distribution characteristics, remains insufficiently explored.
This study focuses on the city of Sendai, one of Japan’s twenty “designated cities” and a part of its major urban system, which is also a typical coastal city. It is notable that alongside urban expansion and population growth, there has been a significant upward trend in the annual average temperature, with a rate of increase reaching 2.3 °C per century, according to statistical data. Geographically, Sendai is located on the Pacific coast of northeastern Japan (latitude 38.16° N, longitude 140.9° E) and is characterized by a humid subtropical climate (Köppen climate classification Cfa) [21]. The city’s topography is distinguished by a high western area that descends eastward, with the Ōu Mountains (elevation > 300 m) to the west, creating a surrounding mountainous environment; the elevation rises from the coastal plains in the east (20–50 m) to the mountains in the west, with an approximate elevation difference of 200 m. Given the significant impact of the proximity to the coast on the sea breeze’s thermoregulatory effects on coastal cities [22], this study divides the research area into three zones (Figure 1c): a coastal zone (0–7 km from the coast), an urban zone (7–15 km from the coast), and an inland zone (more than 15 km from the coast to the boundary of the study area). The topographic map reveals that Sendai exhibits a broad coastal and narrow inland triangular shape, with the urban and inland zones surrounded by mountains and well-covered by vegetation. As a typical coastal city, Sendai experiences prevalent sea breezes during the summer. Extensive research has confirmed that the sea breeze has a significant cooling effect, particularly on the low-altitude urban areas in the eastern plains. This characteristic is crucial for mitigating the UHI effect and improving thermal comfort [23].
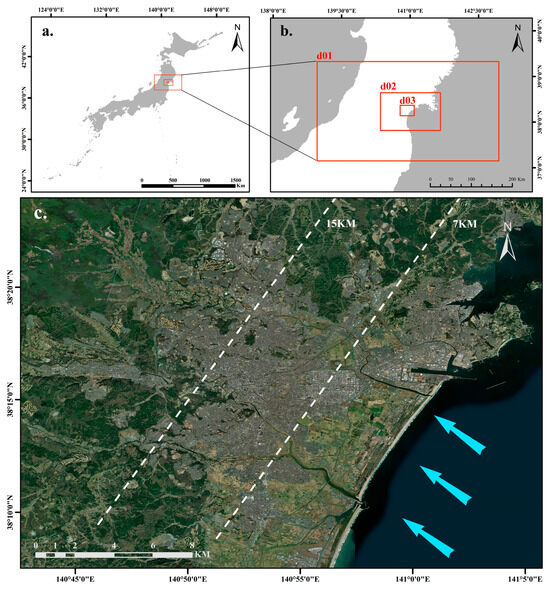
Figure 1.
Geographic extent and numerical modeling grid. (a) Map of Japan. (b) Nested domains. (c) Satellite view of Domain 3, showing the coastal zone (0–7 km), urban zone (7–15 km), and inland zone (>15 km). Arrows indicate the direction of the sea breeze.
In the present study, we employed the Weather Research and Forecasting (WRF) model to simulate the meteorological elements on a typical summer day characterized by sea breeze in Sendai, Japan. The simulation results were subsequently used as initial parameters in the Rayman model to analyze the output values of the Physiological Equivalent Temperature (PET). To interpret the PET findings clearly, thermal sensation levels were applied to categorize these results. The research specifically focused on examining the impact of the sea breeze’s development at three critical time intervals on thermal comfort. Specifically, this study seeks to examine how sea breezes affect the spatiotemporal patterns of outdoor thermal comfort in different zones (coastal, urban, and inland) and over different underlying surfaces (built-up vs. vegetated areas) within coastal cities. The primary objectives are to achieve the following: (1) quantify the spatial distribution characteristics of heat stress levels at different times during the sea breeze day; (2) investigate the differential regulatory effects of the inland penetration of the sea breeze front on thermal comfort in the coastal, urban, and inland zones; and (3) evaluate the influence of the urban built environment versus natural vegetated surfaces on the cooling effect of the sea breeze.
The findings indicate that initially, when the sea breeze reaches the coast, the wind speed is relatively low, insufficient to effectively mitigate the rise in PET values. As the sea breeze penetrates inland, there is a gradual decrease in the PET values across the study area; by evening, as temperatures drop and the sea breeze begins to wane, the overall PET values show a downward trend, although the urban center consistently maintains relatively higher PET values. Previous research has confirmed the influence of proximity to the coast on the sea breeze’s regulation of thermal comfort in coastal cities. This study further substantiates that areas closer to the coast typically maintain lower levels of heat stress for longer durations. More importantly, considering Sendai’s unique geographical features, surrounded by verdant mountainous areas with an inland zone at its extremity, this study reveals that in the evening, despite being farther from the sea, the extreme inland zone maintains a lower level of heat stress for a longer period compared to closer urban areas. Similarly, green areas equidistant to the urban zone consistently enter and maintain lower heat stress levels sooner than the urban zones. Under the influence of the sea breeze, the percentage increase in heat stress levels in urban and inland zones is relatively higher, whereas coastal zones exhibit comparatively lower levels. When significant improvements in thermal comfort are noted, coastal zones and urban areas show more pronounced enhancements relative to the inland zone, and they also reach the no heat stress level earlier. Overall, this study aims to assess the outdoor thermal comfort conditions in the coastal city of Sendai during sea breeze days, highlighting how the levels of heat stress vary with distance from the sea and surrounding environments (urban/green/terrain). The findings are intended to provide theoretical and technical references for enhancing outdoor thermal comfort in Sendai.
2. Methodology
The methodology of this study is divided into the following two primary segments: (i) the simulation of meteorological parameters on a typical sea breeze day using the WRF model, and (ii) the computation of thermal comfort indices.
2.1. Simulation of Meteorological Parameters on a Sea Breeze Day
To obtain simulation results at an urban scale, this research employs the advanced research version of the Weather Research and Forecasting Model (ARW-WRF), which was jointly developed by the National Center for Atmospheric Research (NCAR) and the National Centers for Environmental Prediction (NCEP). The model is utilized to predict the impacts of land use/land cover changes and urban morphology on the UHI effect. The WRF model is a fully compressible, non-hydrostatic model (with an optional hydrostatic runtime) [24] and is capable of effectively simulating large mesoscale phenomena such as sea breezes and valley flows at coarse resolutions [25].
The simulation configuration includes three nested domains (as depicted in Figure 1b). The outermost domain (d01) consists of a 37 × 28 grid with a spatial resolution of 9 km; the middle domain (d02) comprises a 43 × 34 grid, with a resolution of 3 km; the core computational domain (d03) features a uniform grid of 31 columns by 28 rows, at a resolution of 1 km—this resolution is extensively applied in numerical studies of urbanization and sea breeze effects [26,27]. Vertically, the model is structured into 30 layers, incorporating an urban canopy model [28] and the WSM6 microphysics scheme. Multiple schemes for the Planetary Boundary Layer (PBL) are available, and systematic comparisons of these schemes have been documented in the literature [29]; for this simulation, the Mellor–Yamada–Janjic scheme was selected. The radiative processes employ the Rapid Radiative Transfer Model for General Circulation Models (RRTMG) long-wave scheme and the Dudhia short-wave scheme. The land surface data utilized are the 1 km resolution spatial digital land information released by the government of Japan. The initial boundary conditions for the simulation are derived from the NCEP Final Operational Global Analysis data (FNL).
Model validation has been previously conducted, with the results published in our recent paper [30]. These results confirm the reliability of this model as a predictive tool for assessing local climate and thermal environmental changes; thus, the current study did not repeat the validation process. The simulation period was set from 1 August to 10 August 2016. Based on the characteristics of the sea breeze in Sendai on that day (5 August 2016), this day was selected as the typical sea breeze day, representative of most sea breeze days in Sendai. The main physical parameters of the model are listed in Table 1.

Table 1.
The main physical parameters of the model are listed.
2.2. Calculation of Thermal Comfort
Thermal comfort, defined as the subjective state of satisfaction with the thermal environment experienced by the human body, fundamentally differs from indices purely representing the physical thermal environment, such as air temperature or ground surface temperature [31]. The quantification of this state necessitates the utilization of bioclimatic indices [9], which amalgamate environmental physical parameters (such as air temperature, solar radiation, humidity, and wind speed) and human factors (including metabolic rate and clothing). The mechanisms influencing thermal comfort can be categorized into three types: physical environmental parameters, psychological factors (such as expectations and adaptability), and physiological characteristics (including age, gender, and activity level) [32]. Over the past century, more than 165 thermal comfort indices have been proposed to meet the quantification needs of various climatic regions [33]. Common evaluative systems include the Effective Temperature (ET) [34], Wet Bulb Globe Temperature (WBGT) [35], Predicted Mean Vote/Predicted Percentage Dissatisfied (PMV/PPD) [36], Standard Effective Temperature (SET) [37], PET [38], and the Universal Thermal Climate Index (UTCI) [39], with PET, UTCI, and SET being most widely applied in studies of outdoor environments [40].
In this study, PET is selected as the index for evaluating thermal comfort. PET is defined as the air temperature, under standard indoor conditions (mean radiant temperature equal to air temperature, wind speed at 0.1 m·s−1, and vapor pressure at 12.0 hPa), at which the human skin temperature, core temperature, and sweating rate achieve a state of energy balance that is equivalent in thermal effect to actual outdoor conditions [41]. The significance of PET lies in its foundation on the Munich Energy Balance Model for Individuals (MEMI) [38], representing the thermal state perceived by the human body through skin and core temperatures, expressed in equivalent degrees Celsius.
The selection of the PET index is predicated on its triple advantages in outdoor environments: Firstly, this index has been successfully deployed for the assessment of urban thermal environments characterized by complex shading patterns, demonstrating precise predictive capabilities [42]. Secondly, its congruence with actual population responses has been verified through surveys across multiple climatic regions [43], a feature that generic indices such as UTCI lack empirical support for. Thirdly, according to the German VDI 3787 Part 2 standard [44], PET has been established as the official biometeorological assessment tool in urban and regional planning. Such studies typically employ microclimate simulation tools like ENVI-met5.7, RayMan1.2, and SOLWEIG1.0 [45]. This research calculates PET using the RayMan model (Version 1.2) [41], which is developed based on the guidelines of VDI 3787. Input parameters include air temperature (Ta), relative humidity (RH), wind speed (v), cloud cover, spatiotemporal coordinates, and surface albedo. Standardized settings are as follows: adult height of 1.75 m, weight of 75 kg (body surface area 1.9 m2), metabolic rate of 80 W (standing posture), and clothing insulation of 0.9 clo (business attire) [46].
PET calculations incorporate simulation outputs from the Weather Research and Forecasting (WRF) model into the RayMan model. Air temperature data are acquired by converting the thermodynamic temperature at 2 m height (T2, in Kelvin) outputted by WRF; the downward shortwave radiation flux (SWDOWN) is directly used as shortwave radiation data; the horizontal wind speed is derived from the east (U10) and north (Q10) wind components at 10 m height simulated by WRF, computed using the Pythagorean theorem as follows:
Relative humidity is calculated from WRF output specific humidity (q), along with known pressure (p) and temperature (T2), as outlined in:
where w is vapor pressure (Pa), ws is saturated vapor pressure (Pa), and T0 is the reference temperature (typically 273.16 K).
Different ranges of PET values correspond to varying degrees of human thermal sensation. To interpret the PET results clearly, this study classifies the PET values according to the thermal sensation levels specified in Table 2.
Table 2.
Thermal perception classes for human beings. Based on PET ranges, different thermal sensations and heat stress levels were defined, which are represented by distinct colors.
3. Results and Discussion
3.1. PET and Wind Field
In Sendai, the elevated temperatures experienced during the summer are effectively mitigated by the Pacific sea breeze, which also accompanies shifts in humidity [47]. This cooling effect can potentially influence human thermal comfort. However, the cooling capabilities of the sea breeze and their scope and intensity vary with the movement of the sea breeze. Figure 2, Figure 3 and Figure 4 illustrate the distribution of PET and wind field across three critical periods during a typical sea breeze day (5 August 2016) in Sendai: 2 h after the sea breeze onset (07:00 and 08:00), during the peak period of the sea breeze (11:00 to 15:00), and 2 h after the sea breeze begins to wane (18:00 and 19:00). The timing of sea breeze movements is defined in reference to existing studies [22].
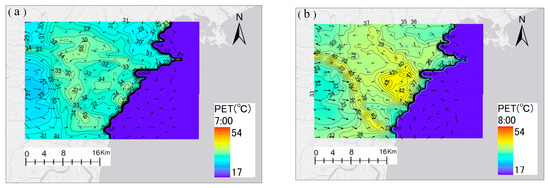
Figure 2.
PET and wind field on a typical sea breeze day in Sendai (5 August 2016), showing (a) 07:00 and (b) 08:00. The arrow sizes indicate wind strength (m/s).
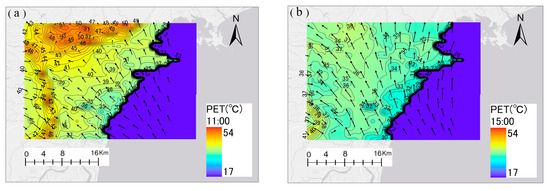
Figure 3.
PET and wind field on a typical sea breeze day in Sendai (5 August 2016), showing (a) 11:00 and (b) 15:00. The arrow sizes denote wind strength (m/s).
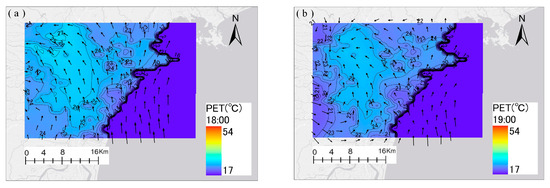
Figure 4.
PET and wind field on a typical sea breeze day in Sendai (5 August 2016), showing (a) 18:00 and (b) 19:00. Arrow sizes indicate wind strength (m/s).
At 07:00 (Figure 2a), the temperature difference between the sea and land is already apparent, and a weak sea breeze begins to form. At this time, the PET values are relatively high (34–36 °C), displaying a dispersed distribution with an average wind speed of 0.27 m/s. By 08:00 (Figure 2b), PET values generally increase, with high-value zones showing regional clustering characteristics. This is particularly evident in coastal areas, where localized high-value (40–43 °C) and low-value (28–29 °C) zones form, and the average wind speed slightly increases to 0.49 m/s.
As the sea breeze progresses, a clear gradient distribution in thermal comfort becomes evident within the study area. By 11:00 (Figure 3a), the sea breeze continues to impact the land, with an average wind speed of 2.12 m/s. A significant gradient difference in thermal comfort is formed between the coastal low-value zones (27–35 °C) and the inland high-value zones (45–51 °C), as well as the western high-value zones (43–47 °C). At this time, the wind speed at the edge of the inland high-value zones markedly decreases, and the wind direction also shows a significant reduction. By 15:00 (Figure 3b), the sea breeze has penetrated the entire study area, with an average wind speed increasing to 3.04 m/s. The thermal comfort in the coastal low-value zones (19–33 °C) is further enhanced, while the comfort in inland high-value zones (36–38 °C) shows notable improvement, now comparable to that of the urban center. However, the PET values in the urban center remain higher than those in surrounding areas.
In the evening, the sea breeze gradually weakens, and the wind speed continues to decline. As shown in Figure 4, the average wind speed decreases to 2.08 m/s by 18:00 (Figure 4a) and further reduces to 1.25 m/s by 19:00 (Figure 4b). Observations indicate that during this time, thermal comfort levels across the study area are generally high, but spatial differentiation is evident. Along the coastal low-value zone, PET values range from 14 to 23 °C, and in the peripheral green zones around the urban center as well as the inland zones, PET values are between 23 and 25 °C, all of which are lower than those in the urban center, where PET values remain between 25 and 27 °C. This persistent elevation in PET values in the urban center suggests that thermal comfort there continues to be lower compared to the surrounding areas.
3.2. Evaluation of Heat Stress Levels Using PET
An analysis based on the distribution map of heat stress reveals that the spatiotemporal evolution of heat stress within the study area can be divided into four distinct phases:
- (1)
- Overall Ascending Phase (07:00–12:00), as shown in Figure 5a–f.
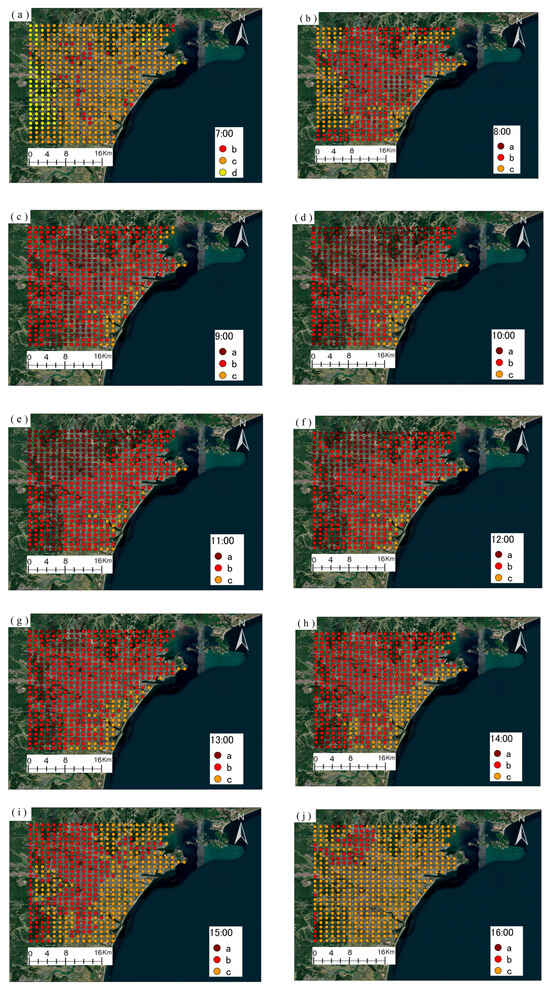
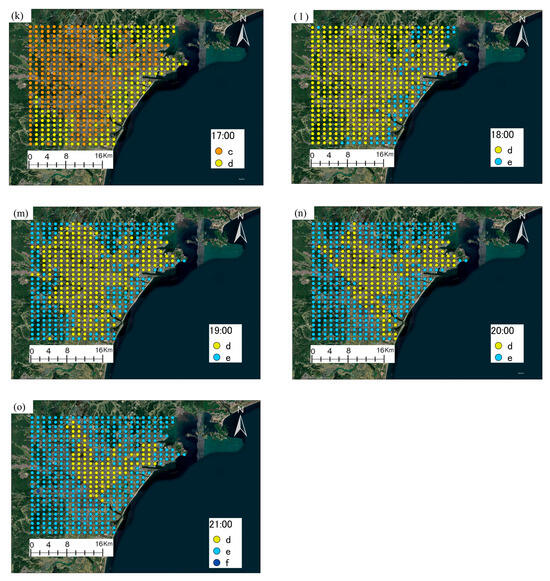 Figure 5. Distribution map of heat stress levels. Subfigures (a–o) sequentially represent the spatial distribution of heat stress levels within the study area from 07:00 to 21:00.
During this period, there is a trend of increasing heat stress levels. The coastal zone primarily maintains lower levels of heat stress. Specifically, from 08:00 (Figure 5b), Level A heat stress first appears in the coastal area and subsequently extends to the northern and western parts of the study area (Figure 5c–f). The northern region experiences a continuous expansion and northward shift of heat stress; the western region shows minor changes, generally shifting westward, while the remaining areas of the study area mainly sustain Levels B and C. The early appearance and expansion of Level A heat stress in coastal and western inland areas reflect the initial phase of sea breeze penetration, which is not yet sufficient to counteract the rising thermal load in these regions.
- (2)
- Low-Level Expansion Phase Along the Coast (13:00–15:00), as shown in Figure 5g–i.
This phase is characterized by a significant expansion of Level C heat stress along the coast. As the range of Level C expands, areas classified under Level B gradually decrease. This expansion of lower heat stress levels along the coast indicates the strengthening of the sea breeze’s cooling effect, which begins to significantly improve thermal comfort in coastal areas.
- (3)
- Low-Level Peripheral Expansion Phase (15:00–18:00), as shown in Figure 5i–l.
During this period, the low-level heat stress areas exhibit a convergence trend from the periphery towards the urban center. By 15:00 (Figure 5i), Level C extends from the coastal and peripheral vegetation areas towards the center; by 16:00 (Figure 5j), Level C covers the majority of the study area. Starting at 17:00 (Figure 5k), Level D also spreads from the coastal and peripheral vegetation areas towards the urban center; by 18:00 (Figure 5l), Level D becomes dominant, nearly occupying the entire study area, and Level E begins to appear in the coastal zone. The progressive inland penetration of lower heat stress levels demonstrates the delayed but eventual mitigation of heat stress in urban centers, while vegetated areas facilitate earlier and more sustained thermal comfort improvement.
- (4)
- High-Level Maintenance Phase in the Urban Center (19:00–21:00), as shown in Figure 5m–o.
This phase primarily features the continuous spread of Level E heat stress from the periphery towards the urban center, with high-level areas gradually contracting. The persistence of higher heat stress levels in the urban center highlights the urban heat island effect, which prolongs thermal discomfort despite the overall cooling trend in peripheral and vegetated areas.
In summary, the coastal zone typically exhibits lower levels of heat stress (indicative of higher thermal comfort) earlier; from 19:00 onwards, the thermal comfort in the urban center is significantly lower than in the surrounding areas, reflecting a pronounced UHI effect characteristic.
Figure 6 compiles data from the 7:00 to 21:00 time period, detailing the duration of various heat stress levels experienced across different regions, delineated at 2 km intervals from the coast to inland areas. These heat stress levels are determined based on the average PET values for each region. The analysis reveals that within the 0–2 km range, Level B heat stress persists for the shortest duration (2 h), while Level C heat stress lasts the longest (8 h). Both the 2–4 km and 4–6 km ranges exhibit identical durations for Level B (6 h) and Level C (4 h) heat stress. Additionally, all regions within the 0–4 km range experience Level E (no heat stress) for 4 h, representing the longest duration across the entire area. The duration of Level B heat stress extends by 1 h in the 6–12 km range compared to the 4–6 km range. Starting from the 12–14 km range, Level A heat stress (the most severe) occurs, lasting for 1 h; subsequent regions continue to experience Level A, with the 16–20 km range enduring for 2 h and all other areas for 3 h. Notably, within the 26–34 km range, the duration of Level E heat stress extends to 3 h, indicating a decrease in thermal comfort as distance from the coast increases, contrary to previous findings suggesting lower thermal comfort further inland.
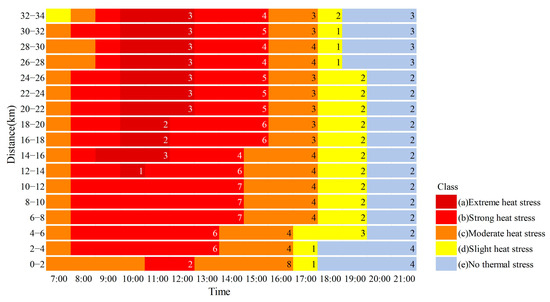
Figure 6.
Duration of each heat stress level at various distances from the coast. Distances are indicated in kilometers from the coast.
The results can be summarized to highlight the following key characteristics:
Coastal Area (0–4 km): Level E heat stress accumulates for the longest duration, with no occurrence of Level A, suggesting relatively higher daytime thermal comfort in this region.
Mid-Distance Area (20–26 km): Level A heat stress accumulates for the longest duration, while Level E accumulates for the shortest, indicating relatively lower daytime thermal comfort in this region.
Distant Area (>26 km): Despite the long duration of Level A heat stress, the duration of Level E significantly extends compared to the 4–26 km areas, suggesting a potential relative thermal comfort advantage in the evenings.
Spatial Distribution of Level A: Begins in the 12 km area, primarily occurring between 9:00 and 12:00.
Temporal and Spatial Characteristics of Level E: Predominantly appears in the late afternoon to evening periods, with Level E first appearing at 18:00 in the 0–4 km area. The duration of Level E in the 26–34 km area is significantly longer than in the 4–26 km regions.
In summary, the coastal zone exhibits the highest overall daytime thermal comfort, while the inland zone shows a relative thermal comfort advantage in the evening. Generally, the urban zone (typically corresponding to the mid-distance range) exhibits relatively lower thermal comfort.
3.3. Variation in Heat Stress Levels Under the Influence of Sea Breeze
The study area exhibits temporal characteristics in the levels of heat stress. To assess the impact of the sea breeze on heat stress levels, this study conducted a comparative analysis of the changes in heat stress levels 1 h after the influence of the sea breeze compared to the hour prior.
The changes in levels can be categorized into three states: decrease, maintain, and increase.
- (1)
- Decrease in Levels: This indicates an improvement in thermal comfort. Areas where a decrease occurs earlier correspond to regions where improvements in thermal comfort are also earlier.
- (2)
- Maintaining Levels: This state can be differentiated into maintaining relatively high levels and maintaining relatively low levels.
Maintaining High Levels: If this occurs during a period when the overall heat stress levels in the study area are rising, it suggests that this region entered a high-level state earlier than others (i.e., relatively lower thermal comfort). Conversely, if it occurs during a period of overall decrease, it indicates that there is no improvement in thermal comfort in that area. Both scenarios demonstrate that the sea breeze did not enhance thermal comfort in these regions.
Maintaining Low Levels: If this occurs during a period when the overall heat stress levels are rising, it indicates that thermal comfort is maintained in that area (i.e., the sea breeze suppressed an increase in levels). If it occurs during a period of overall decrease, it suggests that this region entered a lower level state earlier than others (i.e., relatively higher thermal comfort), reflecting the sustained effect of the sea breeze in enhancing thermal comfort in that area.
- (3)
- Increase in Heat Stress Levels: Indications of decreased thermal comfort.
Heat stress levels predominantly increase between 08:00 and 11:00 (Figure 7a–d). At 08:00 (Figure 7a), nearly the entire study area is in a state of increasing heat stress levels, indicating that the initial stage of sea breeze penetration is accompanied by insufficient wind speed to counteract rising PET values; thereafter, the regions experiencing an increase are primarily concentrated on the northern and western sides of the inland zone (Figure 7b,c), suggesting these areas are less influenced by the sea breeze during its early development.
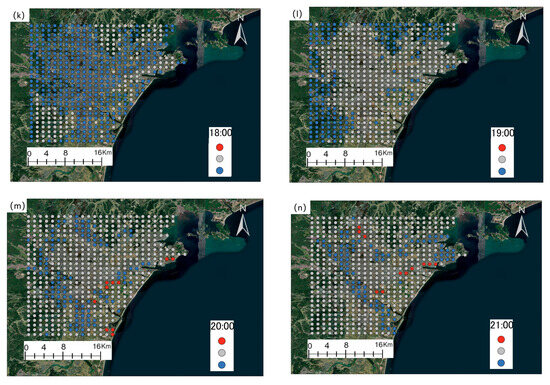
Figure 7.
Distribution map of changes in heat stress levels in the study area 1 h after the impact of the sea breeze compared to the previous hour. Red dots indicate an increase by one level, gray dots indicate no change, and blue dots indicate a decrease by one level. The subfigures (a–n) represent the distribution of changes in heat stress levels in the study area from 07:00 to 21:00, one hour after sea breeze impact compared to the previous hour.
The characteristics of areas with decreasing heat stress levels are as follows: At 08:00, compared to 07:00, nearly the entire area is in a state of increasing levels, with no decreases observed (Figure 7a), reflecting the dominance of solar heating before significant sea breeze influence. By 09:00 (Figure 7b), localized high-value zones along the coast experience a decrease in levels, attributed to these areas having reached their peak levels by 08:00, which then align with surrounding areas by 09:00, reflecting the initial effects of the sea breeze. This suggests that the sea breeze begins to exert a localized cooling effect on the coastal area by 09:00. From 10:00 to 14:00 (Figure 7c–g), areas with decreasing levels are mainly concentrated on the northern and western parts of the inland zone, causing high-level areas to gradually shift northward and westward. This indicates a progressive inland penetration of the sea breeze’s cooling influence from the northwest direction. Between 13:00 and 15:00 (Figure 7f–h), the coastal zone begins to consistently experience a decrease in levels, with the extent of decrease gradually expanding, indicating a significant impact of the sea breeze along the coast. From 15:00 to 18:00 (Figure 7h–k), the decrease in levels in the urban center consistently occurs later than in the surrounding green zones and some parts of the inland zone by about 1 h, with the decrease in the inland zone appearing to gradually permeate. This demonstrates the delayed response of the urban center to sea breeze cooling, likely due to the urban heat island effect and surface properties. During this period, from 17:00 to 18:00 (Figure 7j,k), the coastal zone continues to decrease and is the first to reach a state of no heat stress. This demonstrates the prolonged cooling benefit of sea breezes in proximate coastal regions. From 19:00 to 21:00 (Figure 7l–n), the decreasing areas spread from the periphery towards the urban center. This reflects the gradual inland propagation of cooling effects even as the sea breeze weakens.
The characteristics of areas maintaining high levels are as follows: At 08:00 (Figure 7a), scattered areas within the city continually maintain high levels due to their premature elevation at 07:00; until 14:00 (Figure 7g), the northern and western sides of the inland zone consistently maintain the highest levels. This persistent maintenance of high heat stress underscores the limited regulatory effect of the sea breeze in these inland and urban areas during the daytime. At 15:00 (Figure 7h), the highest level decreases to Level B. As previously mentioned, the decrease in levels in the urban center consistently occurs later than in the coastal and surrounding areas. Therefore, between 17:00 and 19:00 (Figure 7j–l), the urban center maintains relatively high levels; moreover, from 19:00 until 21:00 (Figure 7l–n), the areas in the urban center maintaining higher levels gradually decrease in size, reflecting the delayed regulatory effect of the sea breeze on thermal comfort in the urban center. This pattern highlights the impediment of urban morphology on the efficient penetration and cooling capacity of sea breezes.
Areas consistently maintaining low levels are always found in the coastal zone. From 10:00 to 14:00 (Figure 7c–g), the urban zone maintains a level lower than Level A, designated as Level B, but consistently higher than the levels in the coastal zone. After Level A disappears at 15:00 (Figure 7h), the surrounding green zones in the urban center and the coastal zone simultaneously maintain lower levels. From a spatial distribution perspective, this reflects the diminished regulatory effect of the sea breeze in the urban center.
As previously delineated, the distance from the coastline is a critical determinant in the modulatory effects exerted by sea breezes. This section extends the analysis by quantitatively assessing and comparing the shifts in heat stress levels 1 h post the influence of sea breezes across three distinct geographical zones at varying distances from the coast.
From a temporal perspective, during the 07:00 to 08:00 interval (Figure 8A), all three zones demonstrated a trend of decreasing lower-tier stress levels (Level C and D) and increasing higher-tier stress levels (Level A and B). Among these, the urban zone displayed the most substantial shift, with a significant decrease in lower-tier and increase in higher-tier stress levels; the coastal zone followed with a smaller magnitude of change when compared to the urban zone; the inland zone exhibited the smallest variation in stress levels, indicating that the decrease in comfort was most pronounced in the urban zone and least in the inland zone. The urban zone experiences the most significant early increase in heat stress, highlighting its vulnerability to rapid thermal discomfort compared to coastal and inland areas. In the subsequent 09:00 to 10:00 period (Figure 8B), the transformation from lower to higher stress tiers continued, albeit at a significantly reduced rate. Specifically, at 09:00, the urban zone still showed the highest rate of change; by 10:00 (Figure 8C), the change rate in the inland zone had become the most significant, while the coastal zone consistently showed the lowest rate of change between the two time points. The inland zone demonstrates a delayed but substantial response to increasing heat stress, indicating the progressive inland penetration of thermal discomfort following sea breeze development.
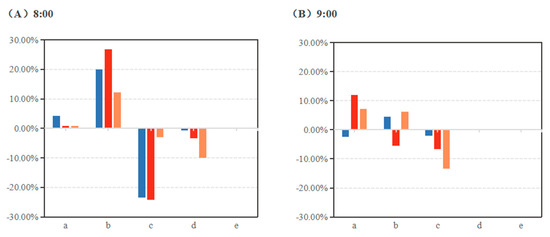
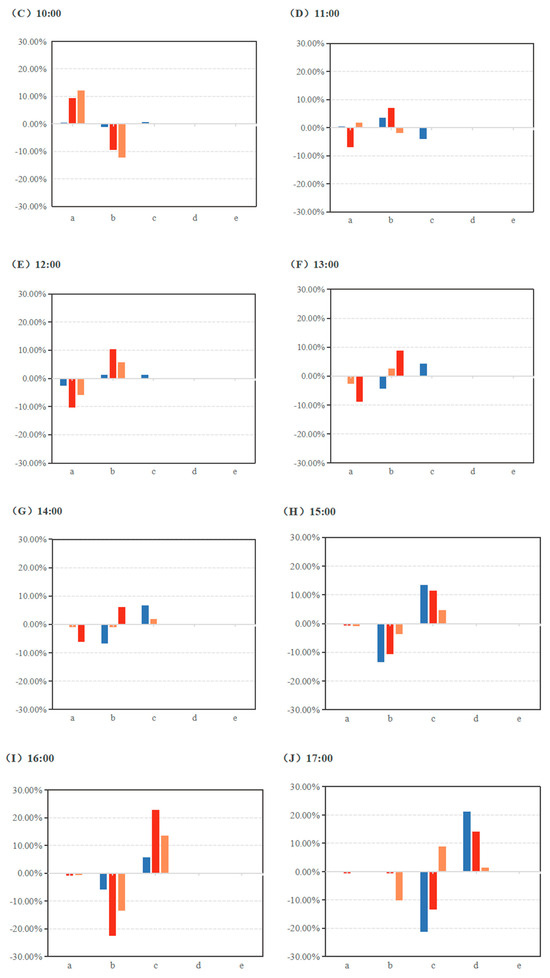
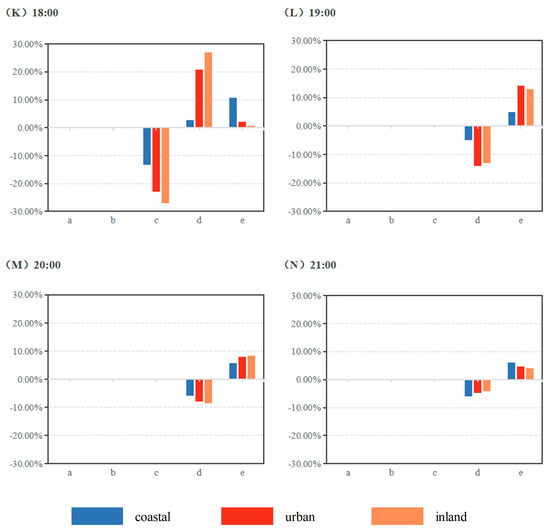
Figure 8.
Hourly variation in proportional distribution of stress levels within coastal, urban, and inland zones. Subfigures (A–N) sequentially represent the hourly variation in the proportional distribution of stress levels from 08:00 to 21:00 across coastal, urban, and inland zones.
During the 11:00 to 14:00 interval (Figure 8D–G), a transformation from higher-tier (Level A) to lower-tier (Level B) stress levels was observed, although the overall magnitude of change during this period was relatively minor. Specifically, the urban zone was the first to exhibit a trend of higher-tier to lower-tier transformation at 11:00, while the other two zones continued to show a shift from lower to higher stress levels. By 12:00, the proportion of higher-tier stress levels began to decrease in all areas, transitioning towards lower-tier stress levels, with the coastal zone experiencing an increase in Level C stress levels. This reflects that during this period, the sea breeze has penetrated into the urban zone, and the regulatory effect of the sea breeze is most pronounced in the coastal zone.
During the period from 15:00 to 19:00 (Figure 8H–L), the observed areas consistently exhibit a trend of transitioning from higher to lower stress levels, with significant variations in the extent of change across different zones. Specifically, the coastal zone demonstrates the greatest magnitude of change at 15:00 and 17:00, while the urban zone shows the most substantial changes at 16:00 and 19:00; the inland zone experiences its largest shift at 18:00. Notably, by 18:00, the coastal and urban zones are the first to exhibit Level E (no heat stress), with the coastal zone having a higher proportion of Level E. By 19:00, Level E also begins to appear in the urban and inland zones. The coastal zone shows the most effective and rapid recovery to no heat stress conditions, underscoring the strongest regulatory influence of sea breezes in this region.
In the 20:00–21:00 interval (Figure 8M,N), all three regions continue to show a decrease in heat stress levels, transitioning from higher to lower levels, with no significant differences in the extent of improvement. During the evening, the thermal comfort improvements become uniformly distributed across all zones, indicating a diminished spatial differentiation in sea breeze impacts late in the day.
Overall, the period from 08:00 to 10:00 marks a significant exacerbation of heat stress levels, with the urban and inland zones experiencing relatively greater increases. From 11:00 to 14:00, there are initial signs of alleviation in heat stress conditions, though the degree of relief remains low across all areas. Starting from 15:00, the trend of alleviation in heat stress significantly intensifies, displaying notable regional differentiation: both the coastal and urban zones have faster rates and greater magnitudes of alleviation compared to the inland zone, and they also reach the no heat stress level earlier. These results indicate that the coastal zone is most strongly regulated by sea breezes, evidenced by the smallest increase in temperature during the warming phase, the fastest rate of relief during the cooling phase, and the earliest entry into the no heat stress state; conversely, the urban zone is the least affected by the regulatory effects of sea breezes.
4. Conclusions
This study systematically assessed the characteristics of thermal comfort variations in coastal cities under typical sea breeze conditions. Employing the PET as an evaluative metric, three critical periods during the development of the sea breeze were selected to quantitatively analyze its impact on thermal comfort. The influence was further interpreted in detail from a spatiotemporal perspective based on heat stress levels. The findings indicate the following:
- (1)
- At the onset of the sea breeze, wind speeds are lower, leading to an increase in PET. As the sea breeze penetrates inland, there is a significant reduction in regional PET. By evening, as the sea breeze dissipates, temperatures decrease, generally lowering PET values, though the urban core consistently maintains relatively higher PET levels.
- (2)
- Spatial analysis from the coastline: Within a 0–4 km range from the coast, periods of lower heat stress levels persist the longest. Starting from 12 km from the coast, the highest level of heat stress (Level A) begins to appear; in the evening, areas beyond 26 km experience longer durations of lower heat stress levels compared to the 4–26 km interval. In contrast, the 20–26 km range endures the longest durations of higher heat stress levels and the shortest durations of lower levels, resulting in the poorest relative thermal comfort.
- (3)
- An increase in heat stress levels primarily occurs between 08:00 and 11:00, concentrated in the northwestern inland areas. The decline in levels starts along the coast and progresses inland, reaching the urban core later than the surrounding vegetated areas. The inland zones maintain high levels of heat stress for the longest duration, followed by urban core areas; lower levels of heat stress are primarily concentrated in the coastal and vegetated peripheries of the city. This indicates that the sea breeze’s cooling effect on thermal comfort diminishes with distance and is weakened by urban surface characteristics.
- (4)
- For hourly variations in heat stress levels across zones, during overall phases of increasing heat stress levels, the urban and inland zones exhibit a significantly higher rise compared to the coastal zone. When significant thermal environment improvements occur (decline in heat stress levels), the coastal and urban zones show greater amelioration, and their recovery to “no heat stress” levels occurs earlier than in the inland zones.
The innovative contributions of this study are threefold: (1) Methodologically, the coupling of the WRF and RayMan models enabled cross-scale simulation from regional climate to human thermal perception, generating high-resolution spatiotemporal PET maps. (2) Mechanistically, it revealed the attenuation of the sea breeze cooling effect with distance, its weakening by urban surfaces, the prolonging effect of vegetation, and the unique phenomenon of better thermal comfort in the extreme inland zone during the evening. (3) Practically, the provided thermal comfort maps offer precise spatial guidance for climate-adaptive planning in coastal cities.
This study quantified the regulation of outdoor heat stress by summer sea breezes in Sendai, Japan, using a coupled WRF-Rayman model and PET index, providing insights for thermal environment studies in coastal cities. Several future research directions are suggested. First, higher-resolution simulations incorporating urban morphological parameters (e.g., building height and street canyon orientation) and dynamic land-use data could strengthen the WRF urban canopy model and its coupling with Rayman, clarifying the impact of urban structure on the sea breeze cooling effect—particularly in high-density urban cores with persistent high PET. Applying this approach to multiple coastal cities under similar climates would improve generalizability. Furthermore, integrating spatiotemporal heat stress patterns with socio-economic data (e.g., population distribution and vulnerable groups) could support a heat–health risk assessment framework, providing a scientific basis for planning strategies such as green infrastructure and climate adaptation.
This study has limitations inherent to its mesoscale approach: The WRF simulation results are influenced by the choice of parameterization schemes; the PET index does not account for population differences or behavioral adaptation; and the 1 km resolution cannot resolve micro-scale urban morphology features. The findings represent area-averaged conditions pertinent to macro-scale planning. Future research should integrate multi-scale modeling and field observations to elucidate micro-scale mechanisms.
Author Contributions
Conceptualization, S.P.; data curation, S.P.; formal analysis, H.W.; funding acquisition, H.W.; methodology, S.P.; project administration, H.W.; resources, H.W.; software, S.P.; supervision, H.W.; validation, S.P.; visualization, S.P.; writing—original draft, S.P.; writing—review and editing, S.P. All authors have read and agreed to the published version of the manuscript.
Funding
This research was funded by the Scientific Research Project of Higher Education in Anhui Province (Grant No. 2024AH051851), the Talent Research Initiation Fund Project of Tongling University (Grant No. 2023tlxyrc27), the Horizontal Research Project of Tongling University (Grant No. 2024tlxyxdz251), and the JSPS KAKENHI grant (No. JP19K04734).
Data Availability Statement
The original contributions presented in this study are included in this article. Further inquiries can be directed to the corresponding author(s).
Acknowledgments
We thank Hironori Watanabe of Tohoku Institute of Technology for providing the data. We also thank the Anhui government and Tongling University for providing funds.
Conflicts of Interest
The authors declare that they have no known competing financial interests or personal relationships that could have appeared to influence the work reported in this paper.
Abbreviations
The following abbreviations are used in this manuscript:
| PET | Physiological Equivalent Temperature |
| WRF | Weather Research and Forecasting |
| OTC | Outdoor thermal comfort |
| Ta | Air temperature |
| V | Wind speed |
| RH | Relative humidity |
| TP | Thermal perception |
References
- Synnefa, A.; Haddad, S.; Rajagopalan, P.; Santamouris, M. SI: Survivability under overheating: The impact of regional and global climate change on the vulnerable and low-income population. Climate 2020, 8, 122. [Google Scholar] [CrossRef]
- Guo, Y.; Gasparrini, A.; Armstrong, B.G.; Tawatsupa, B.; Tobias, A.; Lavigne, E.; Coelho, M.D.S.Z.S.; Pan, X.; Kim, H.; Hashizume, M.; et al. Heat wave and mortality: A multicountry, multicommunity study. Environ. Health Perspect. 2017, 125, 087006. [Google Scholar] [CrossRef]
- Gasparrini, A.; Guo, Y.; Hashizume, M.; Lavigne, E.; Zanobetti, A.; Schwartz, J.; Tobias, A.; Tong, S.; Rocklöv, J.; Forsberg, B.; et al. Mortality risk attributable to high and low ambient temperature: A multicountry observational study. Lancet 2015, 386, 369–375. [Google Scholar] [CrossRef]
- ASHRAE Standard 55-2017; Thermal Environmental Conditions for Human Occupancy. American Society of Heating Refrigerating and Air-Conditioning Engineers: Georgia, Atlanta, 2017.
- Cheung, T.; Schiavon, S.; Parkinson, T.; Li, P.; Brager, G. Analysis of the accuracy on PMV–PPD model using the ASHRAE global thermal comfort database II. Build. Environ. 2019, 153, 205–217. [Google Scholar] [CrossRef]
- Sansaniwal, S.K.; Mathur, J.; Garg, V.; Gupta, R. Review of studies on thermal comfort in Indian residential buildings. Sci. Technol. Built Environ. 2020, 26, 727–748. [Google Scholar] [CrossRef]
- Schweiker, M.; Fuchs, X.; Becker, S.; Shukuya, M.; Dovjak, M.; Hawighorst, M.; Kolarik, J. Challenging the assumptions for thermal sensation scales. Build. Res. Inf. 2017, 45, 572–589. [Google Scholar] [CrossRef]
- Schinasi, L.H.; Bloch, J.R.; Melly, S.; Zhao, Y.; Moore, K.; De Roos, A.J. High ambient temperature and infant mortality in Philadelphia, Pennsylvania: A case–crossover study. Am. J. Public Health 2020, 110, 189–195. [Google Scholar] [CrossRef] [PubMed]
- de Freitas, C.R.; Grigorieva, E.A. A comprehensive catalogue and classification of human thermal climate indices. Int. J. Biometeorol. 2015, 59, 109–120. [Google Scholar] [CrossRef]
- Lai, D.; Chen, B.; Liu, K. Quantification of the influence of thermal comfort and life patterns on outdoor space activities. Build. Simul. 2020, 13, 113–125. [Google Scholar] [CrossRef]
- Tian, Y.; Hong, B.; Zhang, Z.; Wu, S.; Yuan, T. Factors influencing resident and tourist outdoor thermal comfort: A comparative study in China’s cold region. Sci. Total Environ. 2022, 808, 152079. [Google Scholar] [CrossRef]
- Geng, Y.; Hong, B.; Du, M.; Yuan, T.; Wang, Y. Combined effects of visual-acoustic-thermal comfort in campus open spaces: A pilot study in China’s cold region. Build. Environ. 2022, 209, 108658. [Google Scholar] [CrossRef]
- Al-hagla, K.S.; El-sayad, Z.T. Using simulation methods to investigate the impact of urban form on human comfort. Case study: Coast of Baltim, North Coast, Egypt. Alex. Eng. J. 2019, 58, 273–282. [Google Scholar] [CrossRef]
- Atkinson, B. Meso-Scale Atmospheric Circulations; Academic Press: London, UK, 1981. [Google Scholar]
- Ng, E. Policies and technical guidelines for urban planning of high-density cities–air ventilation assessment (AVA) of Hong Kong. Build. Environ. 2009, 44, 1478–1488. [Google Scholar] [CrossRef]
- Lopes, A.; Lopes, S.; Matzarakis, A.; Alcoforado, M.J. The influence of the summer sea breeze on thermal comfort in Funchal (Madeira). A contribution to tourism and urban planning. Meteorol. Z. 2011, 20, 553–564. [Google Scholar] [CrossRef]
- Emmanuel, R.; Johansson, E. Influence of urban morphology and sea breeze on hot humid microclimate: The case of Colombo, Sri Lanka. Clim. Res. 2006, 30, 189–200. [Google Scholar] [CrossRef]
- He, B.J.; Ding, L.; Prasad, D. Outdoor thermal environment of an open space under sea breeze: A mobile experience in a coastal city of Sydney, Australia. Urban Clim. 2020, 31, 100567. [Google Scholar] [CrossRef]
- Umezaki, A.S.; Ribeiro, F.N.D.; de Oliveira, A.P.; Soares, J.; de Miranda, R.M. Numerical characterization of spatial and temporal evolution of summer urban heat island intensity in São Paulo, Brazil. Urban Clim. 2020, 32, 100615. [Google Scholar] [CrossRef]
- Yamamoto, Y.; Ishikawa, H. Influence of urban spatial configuration and sea breeze on land surface temperature on summer clear-sky days. Urban Clim. 2020, 31, 100578. [Google Scholar] [CrossRef]
- Zhu, M.; Atkinson, B.W. Observed and Modelled Climatology of the Land-Sea Breeze Circulation over the Persian Gulf. Int. J. Climatol. 2004, 24, 883–905. [Google Scholar] [CrossRef]
- Peng, S.; Watanabe, H. Analysis and maping of sea breeze event time in coastal cities: A case study of Sendai. Atmosphere 2022, 13, 1484. [Google Scholar] [CrossRef]
- Junimura, Y.; Watanabe, H. Study on the effects of sea breeze for decreasing urban air temperatures in summer. J. Environ. Eng. 2008, 73, 93–99. [Google Scholar] [CrossRef]
- Avolio, E.; Federico, S.; Miglietta, M.M.; Lo Feudo, T.; Calidonna, C.R.; Sempreviva, A.M. Sensitivity analysis of WRF model PBL schemes in simulating boundary-layer variables in southern Italy: An experimental campaign. Atmos. Res. 2017, 192, 58–71. [Google Scholar] [CrossRef]
- Xue, L.; Edwards, R.; Huggins, A.; Lou, X.; Rasmussen, R.; Tessendorf, S.; Holbrook, P.; Blestrud, D.; Kunkel, M.; Glenn, B.; et al. WRF large-eddy simulations of chemical tracer deposition and seeding effect over complex terrain from groundand aircraft-based Agl generators. Atmos. Res. 2017, 190, 89–103. [Google Scholar] [CrossRef]
- Miao, Y.; Liu, S.; Chen, B.; Zhang, B.; Wang, S.; Li, S. Simulating Urban Flow and Dispersion in Beijing by Coupling a CFD Model with the WRF Model. Adv. Atmos. Sci. 2013, 30, 1663–1678. [Google Scholar] [CrossRef]
- Zheng, Y.; Miao, Y.; Liu, S.; Chen, B.; Zheng, H.; Wang, S. Simulating Flow and Dispersion by Using WRF-CFD Coupled Model in a Built-up Area of Shenyang, China. Adv. Meteorol. 2015, 2015, 528618. [Google Scholar] [CrossRef]
- Kusaka, H.; Hara, M.; Takane, Y. 48 Urban climate projection by the WRF model at 3-km horizontal grid increment: Dynamical downscaling and predicting heat stress in the 2070’s August for Tokyo, Osaka, and Nagoya metropolises. J. Meteorol. Soc. Japan 2012, 90, 47–63. [Google Scholar] [CrossRef]
- Xie, B.; Fung, J.C.; Chan, A.; Lau, A. Evaluation of nonlocal and local planetary boundary layer schemes in the WRF model. J. Geophys. Res. Atmos. 2012, 117, D12103. [Google Scholar] [CrossRef]
- Peng, S.; Watanabe, H. Reproducibility Analysis of WRF Model in Urban Climate Research, A Case Study of Sendai. J. Asian Urban Environ. 2022, 91–94. [Google Scholar]
- Wang, Y. Field Measurement and Thermal Comfort of Hangzhou Guo Zhuang. Master’s Thesis, Zhejiang Agriculture & Forestry University, Hangzhou, China, 2019. [Google Scholar]
- Parsons, K. The effects of hot, moderate, and cold environments on human health, comfort and performance. In Human Thermal Environments; Taylor & Francis: London, UK, 2003. [Google Scholar]
- Kumar, P.; Sharma, A. Study on importance, procedure, and scope of outdoor thermal comfort-a review. Sustain. Cities Soc. 2020, 61, 102297. [Google Scholar] [CrossRef]
- Ye, F. Natural Environment Location and Area; Huang, L., Ed.; Shenzhen Yearbook, Editorial Office of Shenzhen Yearbook, Yearbook: Shenzhen, China, 2019; pp. 21–22. [Google Scholar]
- Armstrong, L.E.; Epstein, Y.; Greenleaf, J.E.; Haymes, E.M.; Hubbard, R.W.; Roberts, W.O.; Thompson, P.D. American College of Sports Medicine position stand. Heat and cold illnesses during distance running. Med. Sci. Sports Exerc. 1996, 28, i–x. [Google Scholar] [CrossRef]
- Ergonomics of the Thermal Environment-Analytical Determination and Interpretation of Thermal Comfort Using Calculation of the PMV and PPD Indices and Local Thermal Comfort Criteria; ISO: Geneva, Switzerland, 2005.
- Gagge, A.P.; Fobelets, A.P.; Berglund, L.G. A standard predictive Index of human reponse to thermal enviroment, Transactions/American Society of Heating. Refrig. Air-Cond. Eng. 1986, 92, 709–731. [Google Scholar]
- Höppe, P. The physiological equivalent temperature—A universal index for the biometeorological assessment of the thermal environment. Int. J. Biometeorol. 1999, 43, 71–75. [Google Scholar] [CrossRef]
- Bröde, P.; Fiala, D.; Błażejczyk, K.; Holmér, I.; Jendritzky, G.; Kampmann, B.; Tinz, B.; Havenith, G. Deriving the operational procedure for the universal thermal climate index (UTCI). Int. J. Biometeorol. 2012, 56, 481–494. [Google Scholar] [CrossRef]
- Li, J.; Liu, N. The perception, optimization strategies and prospects of outdoor thermal comfort in China: A review. Build. Environ. 2020, 170, 106614. [Google Scholar] [CrossRef]
- Matzarakis, A.; Rutz, F.; Mayer, H. Modelling radiation fluxes in simple and complex environments: Basics of the RayMan model. Int. J. Biometeorol. 2010, 54, 131–139. [Google Scholar] [CrossRef]
- Thorsson, S.; Honio, T.; Lindberg, F.; Eliasson, L.; Lim, E.M. Thermal comfort and outdoor activity in Japanese urban public places. Environ. Behav. 2007, 39, 660–684. [Google Scholar] [CrossRef]
- Nikolopoulou, M.; Lykoudis, S. Use of outdoor spaces and microclimate in a Mediterranean urban area. Build. Environ. 2007, 42, 3691–3707. [Google Scholar] [CrossRef]
- VDI 3787 Part 2; Environmental Meteorology—Methods for the Human Biometeorological Evaluation of Climate and Air Quality for Urban and Regional Planning. VDI: Düsseldorf, Germany, 1998.
- Matzarakis, A.; Rutz, F.; Mayer, H. Modelling radiation fluxes in simple complex environments-application of the RayMan model. Int. J. Biometeorol. 2007, 51, 323–334. [Google Scholar] [CrossRef]
- Mayer, H.; Höppe, P. Die Bedeutung des Waldes für die Erholung aus der Sicht der Humanbioklimatologie. Forstwiss. Cent. 1984, 103, 125–131. [Google Scholar] [CrossRef]
- Peng, S.; Kon, Y.; Watanabe, H. Effects of sea breeze on urban areas using computation fluid dynamic—A case study of the range of cooling and humidity effects in Sendai, Japan. Sustainability 2022, 14, 1074. [Google Scholar] [CrossRef]
Disclaimer/Publisher’s Note: The statements, opinions and data contained in all publications are solely those of the individual author(s) and contributor(s) and not of MDPI and/or the editor(s). MDPI and/or the editor(s) disclaim responsibility for any injury to people or property resulting from any ideas, methods, instructions or products referred to in the content. |
© 2025 by the authors. Licensee MDPI, Basel, Switzerland. This article is an open access article distributed under the terms and conditions of the Creative Commons Attribution (CC BY) license (https://creativecommons.org/licenses/by/4.0/).