Article

Impact of the Xiaolangdi Reservoir Operation on Water–Sediment Transport and Aquatic Organisms in the Lower Yellow River During Flood Events

by
Xueqin Zhang
1,2,
Min Zhang
3,4,*,
Chunjin Zhang
3,4,
Zanying Sun
3,4 and
Binhua Zhao
5
1
Key Laboratory of Water Cycle and Related Land Surface Processes, Institute of Geographic Sciences and Natural Resources Research, Chinese Academy of Sciences, Beijing 100101, China
2
University of Chinese Academy of Sciences, Beijing 100049, China
3
Yellow River Institute of Hydraulic Research, Yellow River Conservancy Commission, Zhengzhou 450003, China
4
Key Laboratory of Lower Yellow River Channel and Estuary Regulation, Ministry of Water Resources, Zhengzhou 450003, China
5
State Key Laboratory of Water Engineering Ecology and Environment in Arid Area, Xi’an University of Technology, Xi’an 710048, China
*
Author to whom correspondence should be addressed.
Sustainability 2025, 17(18), 8136; https://doi.org/10.3390/su17188136
Submission received: 5 July 2025 / Revised: 31 August 2025 / Accepted: 5 September 2025 / Published: 10 September 2025
(This article belongs to the Special Issue Ecological Water Engineering and Ecological Environment Restoration)

Abstract

The operation of reservoirs has prompted rivers to transition from natural ecosystems to “natural–artificial” composite ecosystems, which has not only altered the water–sediment processes but has also affected river ecology in the downstream river channels. To reveal the impact of the Xiaolangdi Reservoir (China) on sediment transport and aquatic organisms in the Lower Yellow River (LYR), this article analyzes the changes in the water–sediment processes and sediment transport characteristics prior to and following the reservoir construction, based on measured water–sediment data of 688 floods from 1960 to 2023. It derives a theoretical formulation for the sediment delivery ratio (SDR) of flood events based on the sediment transport rate equation and evaluates the living environment of aquatic organisms in the LYR. The results indicate that after the construction of Xiaolangdi Reservoir, the frequency of floods with an average flow discharge below 1000 m3/s increased from 26.08% to 37.42%, and the frequency of floods with an average sediment concentration below 20 kg/m3 increased from 46.34% to 89.03%. The SDR of flood events significantly correlates positively with the average flow discharge and the water load variation coefficient. Conversely, it negatively correlates with the average sediment concentration and the incoming sediment coefficient. The sediment transport capacity of various river reaches in the LYR gradually increases along the direction of the river channel. The use of Xiaolangdi Reservoir has enhanced sediment transport in the upper LYR reach while decreasing it in the lower reach, aligning the overall sediment transport capacity of the downstream river channel. Additionally, the water–sediment process of the flood events following the completion of the Xiaolangdi Reservoir construction has improved the living environment for aquatic organisms, which is conducive to restoring biodiversity and improving the ecological environment of the river. The research results have enriched the understanding of the impact of reservoir construction on downstream water–sediment transport and aquatic organisms in sandy rivers, providing technical support for the health and sustainable development of rivers.

1. Introduction

Since the dawn of human civilization, society has constructed a history of survival and growth around rivers, developing methods to utilize water resources and mitigate water shortages and drought disasters by creating reservoirs [1]. Since the 1950s, the construction of large-scale reservoirs has been pursued worldwide [2]. There are over 45,000 large reservoirs, each exceeding a height of 15 m, which are primarily distributed across 140 countries [3,4]. The construction of river reservoirs has altered downstream water–sediment dynamics, disrupting the original hydrological balance [5] and prompting various adjustments in the sediment transport characteristics and river ecology of downstream rivers [6]. These impacts are evident not only in major rivers such as the Mississippi [7], Colorado [8], Yellow [9,10], and Yangtze [11,12], but also in numerous smaller river systems. Following the construction of reservoirs on alluvial rivers, the processes and mechanisms of sediment transport in downstream rivers have consistently been a topic of significant interest among river scholars and engineers [5,13]. The impact of large reservoirs on sediment transport characteristics is mainly observed in water–sediment conditions and channel boundaries [14,15]. Regarding water–sediment conditions, the incoming water is primarily defined by flood interception, lowered peak flow discharges, water storage during periods of abundance to aid drier seasons, and a notable increase in mid-flow discharge duration. In contrast, the incoming sediment demonstrates a significant decrease in both the downstream sediment load and the size of the suspended fine-grained particles [4]. Concerning riverbed boundaries, on one hand, after constructing the reservoir, it will intercept sediment, and the downstream channel will receive insufficient fine sediment recharge. This causes the river to continue eroding, resulting in the coarsening of the riverbed. As the riverbed resistance increases, the flow velocity decreases, resulting in a significant reduction in sediment transport efficiency [16]. On the other hand, the observations of continuous erosion show that the downstream channel has both lateral widening and increased depth. However, the overall depth increase is substantially greater than the corresponding width increase, indicating that the river continues to erode downward mainly [13,17]. From the near-dam section onward, the flood discharge capacity continues to increase significantly [17,18]. In addition, the construction and operational management of reservoirs lead to the redistribution of water and sediment [19], which alters the processes of river material transport [20], hydrological cycle [21], and biological life activities [22], resulting in changes in the ecological structure of the river environment. The effects of reservoir operations on downstream sediment transport and aquatic organisms are a crucial concern when developing water and sediment control measures aligned with current river erosion and aggradation patterns. This also aims to enhance the water environment in the basin, which remains a crucial issue in water science both nationally and internationally [5,6,23].
The LYR begins at Tiexie, located downstream of the Xiaolangdi Reservoir (China). Subsequently, two major tributaries converge into the mainstream river: the Yiluo River and the Qin River, traversing the North China Plain before ultimately discharging into the Bohai Sea near Lijin [9,10]. The Yellow River is characterized by relatively low discharge and an exceptionally high sediment concentration, resulting in an imbalance between water and sediment. Historically, large sediment loads have accumulated in the LYR, forming the famous “hanging river on the ground” [24,25]. The Xiaolangdi Reservoir started impounding water in October 1999. The water and sediment regulation of the reservoir reshaped the downstream river reach. This effectively reduced aggradation in the LYR and restored the sediment transport capacity [26,27]. Fish habitat stabilization is essential for the recovery of fish resources, and proper flows are a key hydrologic factor in maintaining habitat scale [28]. In the 1990s, the LYR frequently dried up, causing severe damage to fish resources [29]. In recent years, the ecological regulation of the Xiaolangdi Reservoir has enhanced the protection of the ecological base flow at key cross-sections along the downstream river channel, from approximately 56% in the 1990s to 100% today [30,31]. At the same time, through continuous water and sediment regulation, the flow capacity of the river channel has increased from 1800 m3/s in 2002 to 4700 m3/s in 2024, providing a stable habitat for fish growth and reproduction [23]. Research indicates that since the water and sediment regulation of Xiaolangdi Reservoir, the biodiversity of fish in the LYR has undergone substantial recovery [30]. The impact of reservoir construction on river sustainability is mainly reflected in water–sediment transport, as well as river ecology [23,24]. The sediment transport characteristics and changes in the river ecological environment in the LYR, due to the construction and operational management of the Xiaolangdi Reservoir, have consistently captured attention. Accurately predicting the sediment transport process and its distribution along the LYR is crucial for enhancing river management strategies, optimizing reservoir operation methods, and improving the river ecological environment [9,10].
The objectives of scientific river channel management involve maintaining the stability of river channel morphology, optimizing water resource allocation, ensuring flood control safety, and supporting ecological balance [27]. The characteristics of sediment transport within river channels form the fundamental basis for the scientific management and governance of fluvial systems, and the sediment delivery ratio (SDR) is a comprehensive indicator for describing these characteristics [32,33]. Floods are a fundamental aspect of river channel water–sediment processes, serving as the primary periods for downstream sediment transport. They are influenced by various factors, including reservoir operations, river morphology, and river regulation projects [34]. Through the continuous use of sediment interception and the regulation of water–sediment in Xiaolangdi Reservoir, the reservoir’s operation mode influences the hydrodynamic conditions and sediment processes during flood events. Studying the SDR during floods can reveal how reservoir operations affect the sediment transport characteristics of downstream rivers [32,33]. In recent years, numerous experts and researchers have conducted comprehensive investigations into the sediment transport dynamics during flood events. The establishment of the SDR equation is generally approached through two primary methodologies: One approach involves identifying the key influencing factors and subsequently validating the derived equation through direct statistical regression analysis using the measured SDR [35,36,37,38,39,40]. The alternative approach entails deriving the structural form of the SDR equation based on its functional relationship with the sediment transport rate, followed by parameter calibration using measured data. The final analytical expression of the equation is thus systematically derived [32,33,41,42]. Current research has given little attention to analyzing the impact of the Xiaolangdi Reservoir’s operation on the SDR during flood events, resulting in a limited understanding of the sediment transport dynamics of the river channel before and after the reservoir’s construction. Regarding the ecological effects of the Xiaolangdi Reservoir, since 2008, the impact of its operation on downstream fish resources has been the focus of attention. Researchers surveyed the composition and distribution of fish in the LYR [43], assessing fish resources during water and sediment regulation [44]. This provided supportive data for evaluating the ecological effects of the Xiaolangdi Reservoir. Systematic research investigating the ecological impacts of the Xiaolangdi Reservoir on downstream riverine environments remains insufficient. In summary, the construction of the Xiaolangdi Reservoir directly influences the sustainability of sediment transport and the ecology of downstream rivers. Based on these studies [13,23,25], this article presents a simple theoretical formulation for the SDR during flood events that directly reflects the impact of reservoir operation, providing a basis for understanding the comprehensive effect of Xiaolangdi Reservoir operation on sediment transport and aquatic organisms in the downstream river channel.
This article is based on measured water–sediment data in the LYR from 1960 to 2023. It compares and studies the water–sediment processes and sediment transport characteristics of the LYR prior to and following the construction of the Xiaolangdi Reservoir. The factors related to water and sediment conditions that influence the SDR of flood events are investigated. A theoretical formulation for the SDR of flood events is developed from the sediment transport rate equation. Following the completion of the Xiaolangdi Reservoir construction, the sediment transport characteristics of each reach of the LYR are analyzed, and the ecological environment of aquatic organisms is assessed. The research findings will provide a theoretical basis and scientific support for improving downstream river management strategies, optimizing reservoir operation modes, and enhancing the river’s ecological environment.

2. Study Area and Reservoir Operation

2.1. Overview of the Study Area

The Yellow River is the second-longest river in China. The Lower Yellow River (LYR) originates from Tiexie on the southeast slope of the Loess Plateau and joins the Bohai Sea near Lijin, which stretches approximately 758 km, as shown in Figure 1. The Lower Yellow River mainstream is monitored by seven hydrological stations: Huayuankou, Jiahetan, Gaocun, Sunkou, Aishan, Luokou, and Lijin (China). The LYR is characterized as “wide at the top and narrow at the bottom” and “steep at the top and flat at the bottom” [35,39]. Xiaoheiwu Station is the abbreviated form of Xiaolangdi Station, Wuzhi Station, and Heishiguan Station. Xiaolangdi Station is situated on the mainstream of the Yellow River, Wuzhi Station is located on the Qin River, and Heishiguan Station is positioned on the Yiluo River [25]. The LYR is typically segmented into three distinct reaches based on their geomorphological characteristics: wandering reach (Tiexie-Gaocun), transitional reach (Gaocun-Aishan), and meandering reach (Aishan-Lijin) [45], as shown in Figure 1. The wandering river reach is approximately 275 km long, with a gradient ranging from 1.7 to 2.7‱. The elevation difference between the channel and the adjacent floodplain is relatively minor, while the river channel exhibits a notably straight morphology, characterized by a low sinuosity coefficient of 1.15. The floodplain of the meandering river reach covers 80% of the total river area, which is substantially greater in area compared to that of the river channel. This riverbed reach undergoes considerable erosion and aggradation during the flood season, and the main stream frequently shifts [46]. The transitional river reach is approximately 165 km long, featuring a gradient of 1.1 to 1.7‱. The river reach features relatively narrow, flat riverbeds with a height difference of over 3 m between the riverbed and the riverbank. Although the river’s position fluctuates slightly, it remains relatively stable compared to the meandering reach of the river. The meandering river reach is approximately 318 km long, with a gradient of approximately 1.0‱. The channel is relatively narrow and deep, showing a considerable elevation difference of about 4 to 5 m between the channel and the floodplain [25]. Since the 1950s, measures have been taken in the LYR to control the river regime through the construction of river regulation projects. As of 2023, roughly 70% of the total river length is affected by river regulation projects, which play a key role in managing the river regime. The main river bends have been effectively controlled, and the lateral swing amplitude of the river channel is generally small [24,27,47]. Considering the characteristics of river channel evolution, this article categorizes the downstream river channel into four distinct reaches: Tiexie-Huayuankou (T-H reach), Huayuankou-Gaocun (H-G reach), Gaocun-Aishan (G-A reach), and Aishan-Lijin (A-L reach).

2.2. Operational Mode of the Xiaolangdi Reservoir

The Xiaolangdi Reservoir is situated at the outlet of the final gorge section within the middle reaches of the Yellow River. The reservoir has a total storage capacity of 126.5 × 10⁸ m3 and governs a drainage basin spanning 694,000 km2, which accounts for 92.3% of the entire Yellow River basin. It regulates over 90% of the basin’s water load and intercepts 100% of its sediment load, functioning as a critical component within the comprehensive sediment management system of the river [48].
Longyangxia, Wanjiazhai, Sanmenxia, and Xiaolangdi constitute pivotal components of the reservoir system in the Yellow River Basin [45]. The Longyangxia Reservoir is located in the upstream of the Yellow River within Gonghe County, Qinghai Province, approximately 2600 km upstream of the Xiaolangdi Reservoir [49]. Wanjiazhai and Sanmenxia Reservoirs are situated upstream of the Xiaolangdi Reservoir, located approximately 1100 km and 130 km along the river channel from Xiaolangdi Reservoir, respectively [50]. Since the reservoir commenced water storage operations in October 1999, the operational management and regulation strategies of the Xiaolangdi Reservoir have progressively evolved from an initial single-reservoir approach of “storing clear water while discharging turbid water” to an integrated water and sediment regulation system that coordinates multiple large-scale reservoirs situated along the upper reaches of the river channels. The morphology of the riverbed and the sediment transport dynamics in the downstream reach have undergone substantial alterations. The water and sediment regulation of the Yellow River is accomplished through the coordinated operation of key reservoirs, including Wanjiazhai, Sanmenxia, and Xiaolangdi, which effectively removes sediment from these reservoirs to maintain channel capacity and facilitate sediment transport downstream to mitigate aggradation and optimize river channel morphology [51]. Since the inaugural water and sediment regulation experiment was implemented in 2002, a total of 15 pre-flood season water and sediment regulation operations and 16 flood season water and sediment regulation operations have been continuously carried out by 2024, resulting in increased riverbed erosion and enhanced flow capacity in the LYR [9,24].

3. Data and Methods

3.1. Data

This article collects measured water–sediment data from ten hydrological stations (Xiaolangdi, Huayuankou, Jiahetan, Gaocun, Sunkou, Aishan, Luokou, Lijin, Wuzhi, and Heishiguan, as shown in Figure 1) from 1960 to 2023. The data is sourced from the “Yellow River Basin Hydrological Yearbook” and the “Yellow River Sediment Bulletin” [52,53]. This article uses data from 688 floods from 1960 to 2023, with average flow discharge ranging from 507 to 6778 m3/s and average sediment concentrations ranging from 0.0 to 340.98 kg/m3. When the average flow discharge of the flood event is below 500 m3/s, the flood process has a weak sediment transport effect, and there are no flood events with high sediment concentration [32,33,54]. The selection criteria for flood events in this study are designed to exclude prolonged low-flow processes while prioritizing flood hydrographs exhibiting pronounced rising and falling limbs, with a minimum mean discharge threshold of 500 m3/s. The classification criteria for flood events adhere to the principles established in the “Documented data of fluvial processes of the Lower Yellow River” [54]. The selected flood events are representative of diverse water–sediment interaction combinations, and the theoretical formulation for SDR established using these data has a wide range of applications.
The LYR comprises a total of 340 large cross-sections, with cross-sections surveyed biannually—once prior to and once following the flood season each year. A total of 126 sets of cross-sectional morphology data were used in this article. The cross-sectional morphology and bed sediment particle size data are both from the “Yellow River Basin Hydrological Yearbook” [52].

3.2. Methods

The SDR serves as a crucial indicator for characterizing sediment transport dynamics [33,39]. It denotes the proportion of the output sediment load relative to the input sediment load over a specified time period, reflecting the comprehensive sediment transport capacity and the erosion and aggradation dynamics of the specified river reach [32]. The SDR is expressed as follows:
SDR = W s , out / W s , in
Here Ws,in is the imported sediment load, 108 t; Ws,out is the exported sediment load, 108 t. When SDR > 1, the river reach is predominantly characterized by erosion; when SDR < 1, the river reach is predominantly characterized by aggradation; when SDR = 1, the river reach attains a dynamic equilibrium between erosion and aggradation.
Due to sediment diversion caused by human activities in downstream rivers, the SDR derived from Equation (1) usually indicates the apparent SDR rather than the true one, thus diminishing its original importance. Given the significant sediment diversion in the downstream river channel, it is essential to restore the sediment load at the outlet cross-section of the river reach [32]. The following equation can be used to calculate the actual SDR under natural conditions and accurately describe the sediment transport characteristics of the river reach.
SDR a = W s , out + W s , d W s , i n
Here, SDRa is the actual SDR; Ws,d is the sediment transport diversion, 108 t. Sediment transport diversion data are sourced from the “Yellow River Basin Hydrological Yearbook” [52]. This article employs Equation (2) to calculate the SDR.
The incoming sediment coefficient represents the sediment concentration per unit flow discharge:
ξ = S i n / Q i n
where Sin is the inlet sediment concentration, kg/m3; Qin is the import flow discharge, m3/s. The sediment concentration per unit flow discharge is greater if the incoming sediment coefficient is larger. This may result in the river channel becoming supersaturated, leading to aggradation. Conversely, it may exist in a sub-saturated state, resulting in scouring [24].
The water load variation coefficient is defined as the ratio of the outlet water load to the inlet water load:
η = W w , o u t / W w , i n
where Ww,in and Ww,out are the inlet water load and outlet water load, 108 m3. A water load variation coefficient exceeding 1.0 indicates that the outflow at the outlet cross-section surpasses the inflow at the inlet cross-section. Conversely, the coefficient below 1.0 indicates that the water load at the outlet cross-section is lower than that at the inlet cross-section. This article calculates the water load variation coefficient at the scale of a flood event.
The flood wave propagates from the Xiaolangdi Reservoir to Huayuankou, Gaocun, Aishan, and Lijin stations in 1, 2, 4, and 5 days, respectively. When selecting the flood event at Xiaoheiwu Station, the corresponding flood processes for 1, 2, 4, and 5 days are applied to the flood events at Huayuankou, Gaocun, Aishan, and Lijin, thus ensuring the completeness of the flood event [55].

4. Results

4.1. Water–Sediment Characteristics of Flood Events in Downstream Rivers

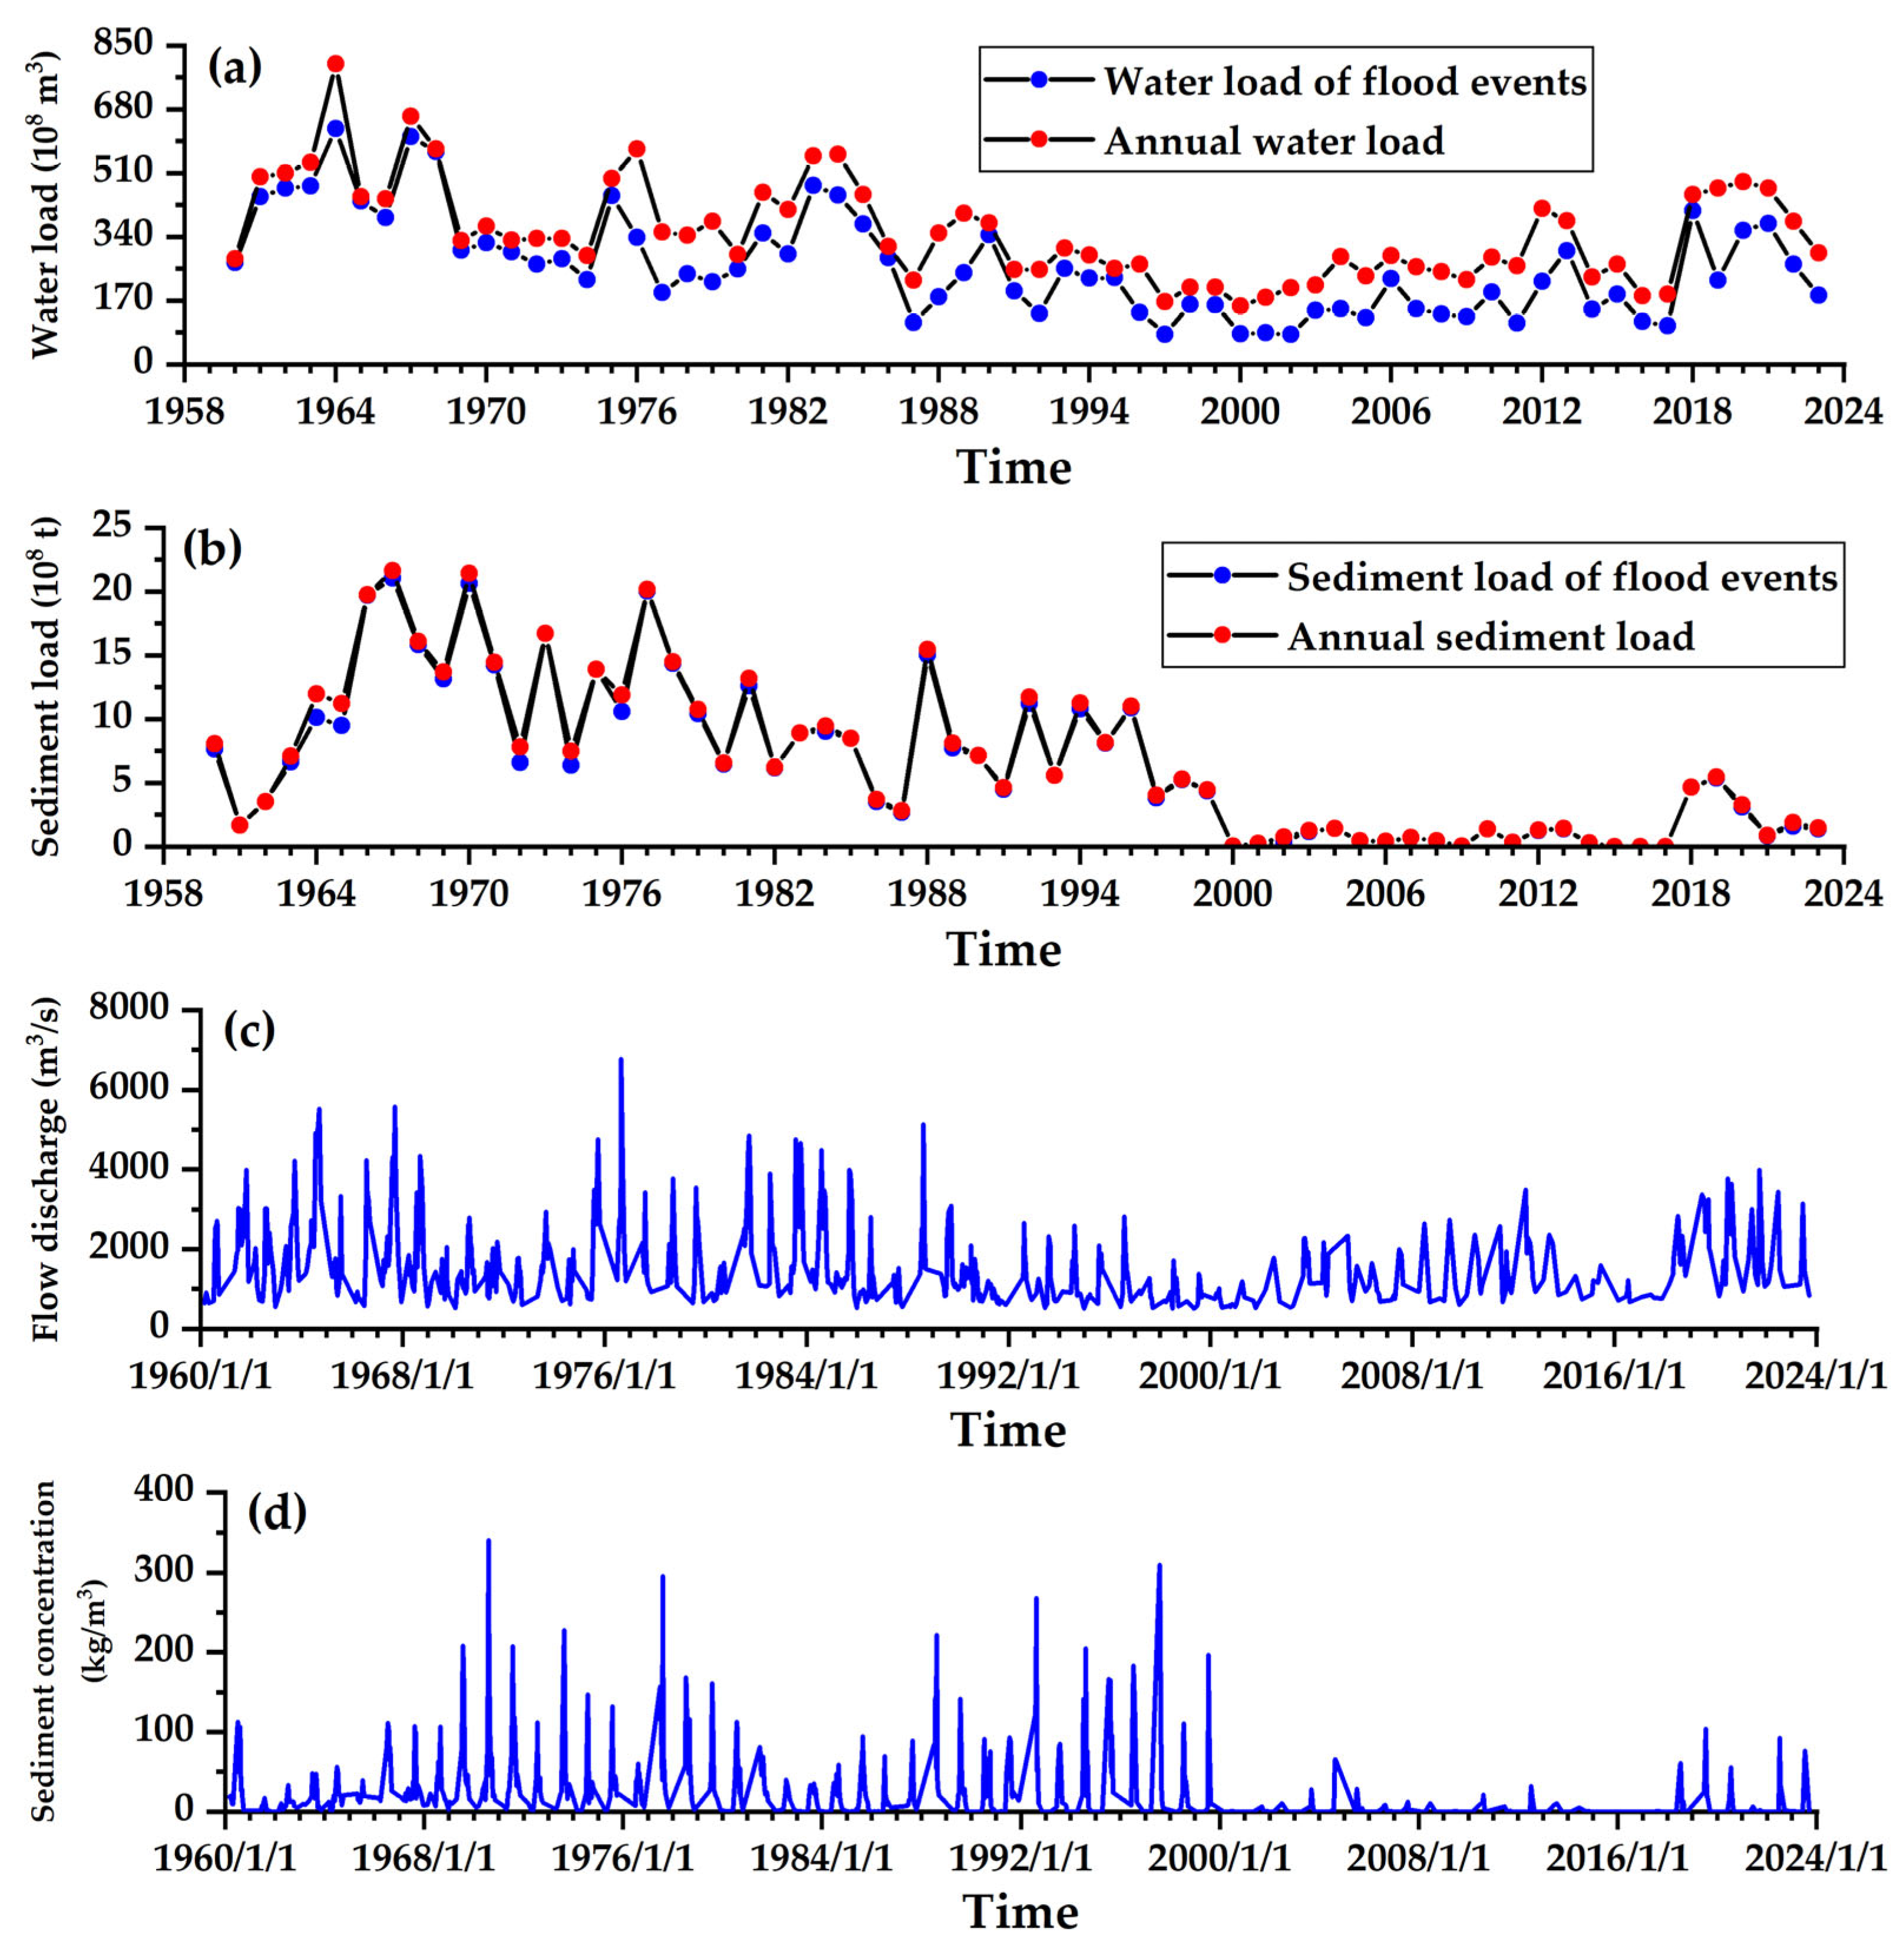
Figure 2 illustrates the water–sediment dynamics during the flood events in the LYR. From 1960 to 2023, the annual water load into the LYR initially exhibited a declining trend before subsequently increasing, attaining a minimum value of 156 × 108 m3 around the year 2000. Flood events contribute approximately 72% of the average annual water load, as indicated in Figure 2a. From 1960 to 2023, the annual sediment load into the LYR has decreased. Flood events contribute approximately 94% of the average annual sediment load, as illustrated in Figure 2b.
Prior to the construction of the Xiaolangdi Reservoir, average flow discharges entering the downstream river channel varied between 507 and 6778 m3/s. In contrast, the average flow discharge was adjusted to a range of 519 to 3992 m3/s following its construction. Prior to the construction of Xiaolangdi Reservoir, the flow discharge entering the downstream river channel showed fluctuating changes. However, after the construction of Xiaolangdi Reservoir, the range of average flow discharge entering the downstream river channel significantly decreased, and the flow was controlled within 4000 m3/s, as shown in Figure 2c. Before the Xiaolangdi Reservoir’s construction, the sediment concentration variation in the downstream river channel floods ranged from 0.0 to 340.98 kg/m3. In contrast, this variation decreased from 0.0 to 103.71 kg/m3 after its construction. Prior to the construction of Xiaolangdi Reservoir, the flood events in the downstream river channel could be regarded as a ‘natural flood’. During this period, the channel faced considerable sediment load, resulting in frequent floods with high sediment concentrations. Following the completion of the Xiaolangdi Reservoir construction, it adopted a “long-term sediment regulation and timely precipitation flushing” mode, significantly reducing the occurrence of high sediment concentration floods. This is due to the reservoir’s water storage and sediment interception significantly reducing the sediment concentration of flood events flowing downstream, as shown in Figure 2d.
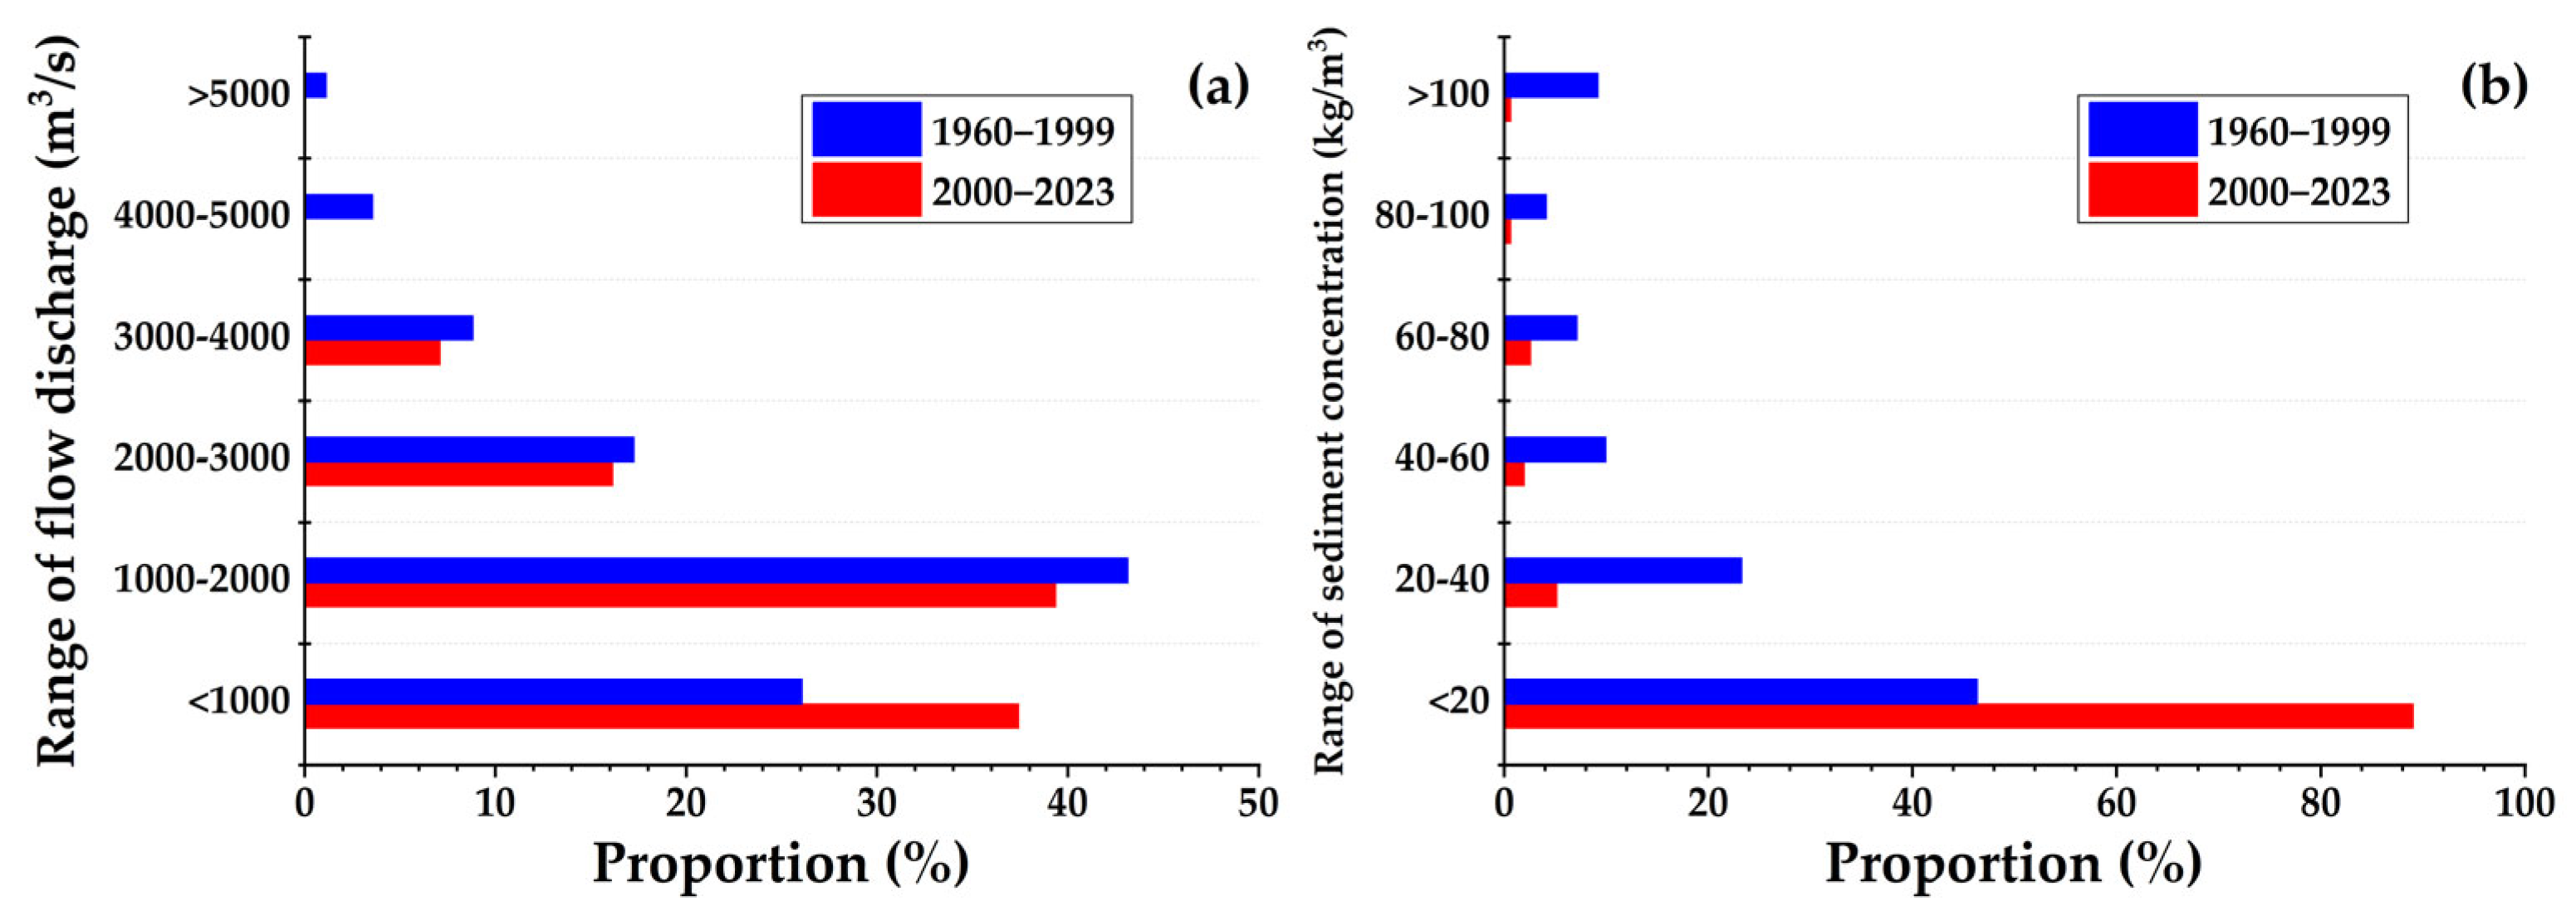
Figure 3 shows the proportions of different flow discharge levels and sediment concentration levels for flood events. Prior to and following the construction of the Xiaolangdi Reservoir, the proportions of three flow discharge ranges—1000 to 2000 m3/s, 2000 to 3000 m3/s, and 3000 to 4000 m3/s—entering the downstream river channel exhibited negligible variation. In contrast, the proportions of flow discharge ranging below 1000 m3/s and above 4000 m3/s exhibited significant differences. Prior to the construction of the Xiaolangdi Reservoir, the proportion of flood events with flow discharge below 1000 m3/s was 26.08%, which was lower than the proportion of the same flow discharge category after the reservoir was constructed (37.42%). Flood events with flow discharge above 4000 m3/s accounted for 4.69% of all flood events, which is significantly higher than the proportion of flood events with the same flow discharge after the Xiaolangdi Reservoir was constructed (0.0%), as shown in Figure 3a. Prior to the construction of the Xiaolangdi Reservoir, floods characterized by sediment concentrations below 20 kg/m3 accounted for approximately 46.34% of all flood events, which was significantly lower than the proportion of floods with the same sediment concentration level after the reservoir was constructed (89.03%). For the Yellow River, a river with relatively high sediment concentrations, floods characterized by sediment concentrations below 20 kg/m3 are generally considered to be low sediment concentration floods [56,57], indicating that following the completion of the Xiaolangdi Reservoir construction, the sediment concentration of floods entering the downstream area was generally lower, almost resembling a clear water erosion pattern. The proportion of flood events with sediment concentrations above 20 kg/m3 was consistently lower than that before the reservoir’s construction, particularly for sediment concentrations above 100 kg/m3, as shown in Figure 3b. In summary, following the completion of the Xiaolangdi Reservoir construction, the flow discharge and sediment concentration of floods have decreased significantly, demonstrating the reservoir’s water storage and sediment retention functions [58].

4.2. Spatiotemporal Distribution of Sediment Delivery Ratio

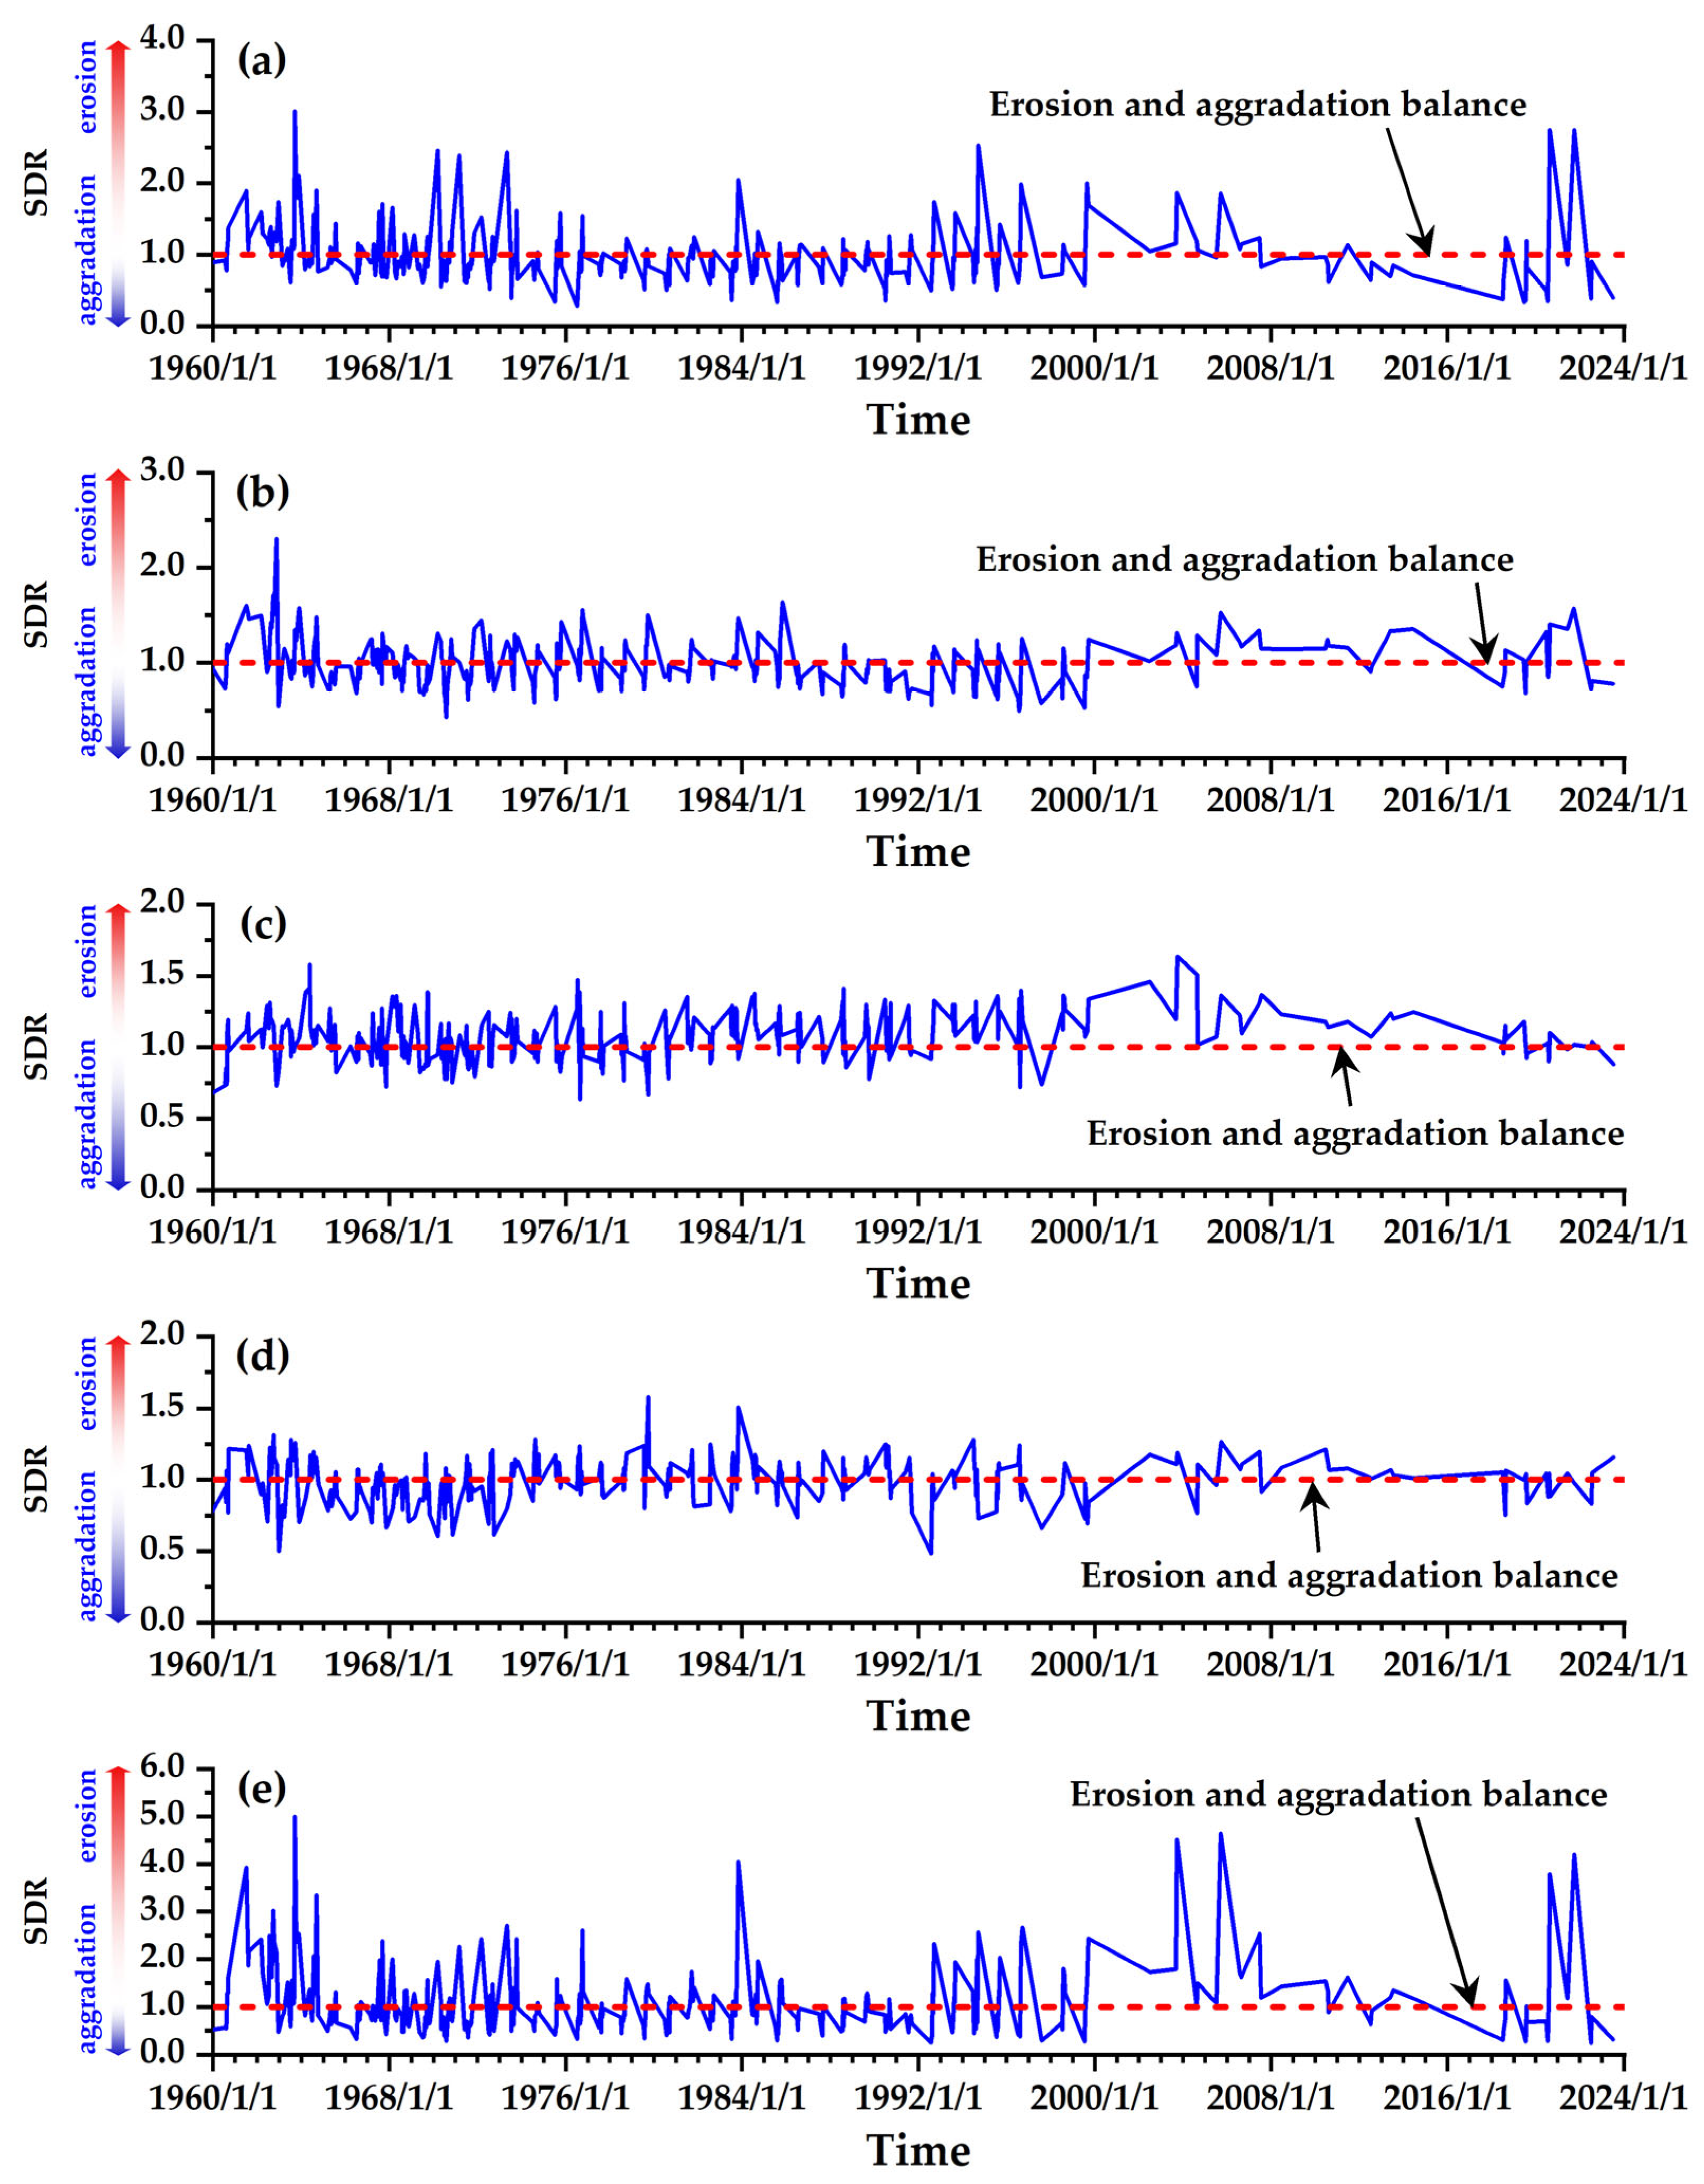
Figure 4 shows the spatial–temporal variation in the SDR during flood events. The water–sediment conditions affect the variation in the SDR of the LYR. In years with higher flow discharge and less sediment, river channels tend to erode, resulting in the SDR exceeding 1.0. On the contrary, in years with less discharge and more sediment, the river channel undergoes aggradation, and the SDR remains below 1.0 [59]. The relationship between water and sediment during flood flow downstream significantly changes, leading to notable differences in the spatiotemporal variation in the SDR.
Prior to the construction of Xiaolangdi Reservoir, the SDRs of floods showed significant fluctuations over time. Following the completion of the Xiaolangdi Reservoir construction, the median particle diameter of bed sediment in the downstream river channel increased by 1 to 2 times [38,40]. The overall trend of the SDR has decreased over time due to the coarsening of the riverbed. Comparing SDRs across different river reaches, the ratio for the reach from Tiexie to Huayuankou varied the most (0.277 to 3.012). In contrast, the variation from Aishan to Lijin was the least (0.222 to 1.578), as shown in Figure 4a–d.
In the reach from Tiexie to Lijin, the Sanmenxia Reservoir was operated for water storage and sediment retention purposes from 1960 to 1964. Except for the discharge of fine-grained sediment through density currents during the flood season, the flow discharge into the downstream river channel was mainly clear water, resulting in a relatively high SDR. Between 1964 and 1973, the Sanmenxia Reservoir transitioned its operational focus from “water storage and sediment retention” to “flood regulation and sediment discharge”, resulting in a significant sediment load being released downstream. The unfavorable combination of “more water with little sediment and little water with more sediment” led to considerable aggradation, and the SDR was below 1.0. From 1981 to 1985, the water load exceeded the annual water load by 6%, whereas the sediment load was 50% below the annual sediment load, attributable to reduced precipitation in the middle reaches and the expanded management scope of the basin. The LYR exhibited a hydrological pattern characterized by “increased water flow with reduced sediment load”, with the SDR gradually increasing [60]. Following the completion of the Longyangxia Reservoir in 1986, water–sediment conditions downstream have worsened considerably, and both water load and sediment load have exhibited a consistent declining trend, leading to the SDR below 1.0 [49]. Prior to the construction of Xiaolangdi Reservoir, the overall SDR of the river reach from Tiexie to Lijin was less than 1.0, indicating a trend of aggradation. From 1961 to 1964 and from 1981 to 1985, the SDR exceeded 1.0, indicating that the downstream river channel was eroded. The Xiaolangdi Reservoir commenced operations in 2000, with the initiation of water and sediment regulation in 2002, resulting in changes to downstream water–sediment conditions. Between 2000 and 2006, a yearly trend emerged in water load and sediment load; the scouring efficiency improved significantly, and the SDR increased. Following 2006, the water load fluctuated, and the sediment load and scouring efficiency declined slightly. Consequently, there was a minor decrease in the SDR compared to the period before 2006. Between 2018 and 2023, Xiaolangdi Reservoir implemented a water level reduction strategy to enhance sediment discharge. This led to a significant amount of sediment being released, causing extensive siltation in the downstream river channel. Approximately 90% of the sediment was deposited in the reach from Tiexie to Huayuankou [54,61]. The supply of fine sediment throughout the entire downstream channel has increased, the bed erodibility has risen, and the SDR of the reach has improved. The erosion load from Tiexie to Lijin is the sum of the erosion loads of all individual reaches, and the SDR of the entire reach attains its maximum, as shown in Figure 4e.

4.3. Analysis of Factors Affecting the Sediment Delivery Ratio of Flood Events

Figure 5 shows the variation in water–sediment factors affecting the SDR during flood events in different reaches. Many factors affect the SDR of the LYR, and the mechanisms are complex. Previous studies have indicated that the main factors influencing a river reach’s SDR include average flow discharge [33,35,38], average sediment concentration [33,38,40], the incoming sediment coefficient [32,33,35,41,42], and the water load variation coefficient [33,41]. This article explores the four water–sediment factors that most significantly influence the SDR.
Regarding average flow discharge, due to the numerous diversion gates in the LYR, the flow discharge of flood events decreases along the river. From Tiexie to Lijin, the flow discharge range gradually widens across each reach, with the broadest range observed in the reach from Aishan to Lijin, as shown in Figure 5a. Regarding sediment concentration, comparing the period prior to and following the construction of the Xiaolangdi Reservoir, in the reach from Tiexie to Huayuankou, the variance and standard deviation of sediment concentration of flood events have changed from the maximum to the minimum, with a narrower data distribution range. In contrast, in the reach from Aishan to Lijin, the variance and standard deviation of sediment concentration of flood events have changed from the minimum to the maximum, with a broader data distribution range, as shown in Figure 5b. Regarding the incoming sediment coefficient, the comparison prior to and following the construction of the Xiaolangdi Reservoir in the reach from Tiexie to Huayuankou shows that the distribution of the incoming sediment coefficient for flood events has shifted from being dispersed to more concentrated, as shown in Figure 5c. Regarding the water load variation coefficient, in the reach from Tiexie to Huayuankou, the concentration of the water load variation coefficient during flood events is the highest, while in the reach from Aishan to Lijin, the concentration is the lowest, as shown in Figure 5d.
By comparing Pearson’s correlation coefficients of the SDR and water–sediment conditions in each river reach prior to and following the construction of the Xiaolangdi Reservoir, it can be seen that, except the reach from Tiexie to Huayuankou, factors such as the average flow discharge and the water load variation coefficient in the other three river reaches are significantly positively correlated with the SDR. Notably, the water load variation coefficient strongly correlates with the SDR. The average sediment concentration and the incoming sediment coefficient in each river reach exhibit a statistically significant negative correlation with the SDR. Furthermore, the incoming sediment coefficient exhibits a strong correlation with the SDR, as indicated in Table 1.
Since the reach above Gaocun is characterized as “wide and shallow”, its sediment transport capacity is relatively low. This reach exhibits a “high inflow, high sedimentation, and high discharge” sediment transport characteristic, with the majority of the sedimented silt primarily distributed along the floodplains. The downstream reach of Gaocun is characterized by a “narrow and deep” channel morphology, exhibiting relatively high sediment transport capacity and a “high inflow, high discharge” sediment transport pattern [62]. In summary, the erosion and aggradation processes in the river downstream of Gaocun are primarily determined by the average sediment concentration. In contrast, the average flow discharge affects the upstream reach of Gaocun. Thus, the correlation coefficient between average flow discharge and the SDR exhibits an increasing trend along the river channel. Conversely, the correlation coefficient between average sediment concentration and the SDR demonstrates a decreasing trend along the river channel. Since the width-to-depth ratio of the reach from Huayuankou to Gaocun is slightly greater than that of the reach from Tiexie to Huayuankou, the sediment transport capacity within the Huayuankou-Gaocun reach is relatively limited, resulting in heightened sensitivity of the SDR to variations in the average sediment concentration within this river reach. Consequently, the correlation coefficient between the SDR and the average sediment concentration in the Huayuankou-Gaocun reach exhibits a significantly higher value compared to that in the Tiexie-Huayuankou reach. The incoming sediment coefficient defines sediment transport characteristics, and this physical quantity equates to the SDR; therefore, the correlation between the two is strong. The reach above Gaocun is too broad and shallow, and the relationship between sediment transport capacity and average sediment concentration in this reach is stronger. At the same time, the reach from Aishan to Lijin is too narrow and deep, and the correlation between sediment transport capacity and average flow discharge in this reach is stronger. The cross-sectional morphology of the reach from Gaocun to Aishan varies between being “wide and shallow” and “narrow and deep.” The correlation between sediment transport capacity and the incoming sediment coefficient (Ratio of average sediment concentration to average flow discharge) is more pronounced. The correlation coefficient between the incoming sediment coefficient and the SDR of each reach exhibits a clear spatial trend characterized by alternating increases and decreases along the channel. The distribution of the water load variation coefficient from 1960 to 2023 during flood events in the reaches from Tiexie to Huayuankou, from Huayuankou to Gaocun, from Gaocun to Aishan, and from Aishan to Lijin were 1.009, 0.923, 0.918, and 0.833, respectively. Overall, the performance of the water load variation coefficient decreased along the channel, leading to a gradual increase in its influence on the SDR. For this reason, it is believed that the closer an alluvial river reach is to the estuary, the stronger the correlation between the water load variation coefficient and the SDR.
Considering the impact of reservoir operations, the correlation coefficients between the average sediment concentration, the incoming sediment coefficient, and the SDR have increased slightly. In contrast, the correlation coefficients between the average flow discharge and the SDR have exhibited a slight decline relative to the prior to construction of the Xiaolangdi Reservoir. The main reason for this is that the water load entering downstream, both prior to and subsequent to the operation of the Xiaolangdi Reservoir, was slightly reduced. Simultaneously, the sediment load flowing downstream the channel exhibited a sharp decrease, resulting in a progressive rise in the SDR’s sediment load dependency. Compared to prior to the construction of the Xiaolangdi Reservoir, the water load variation coefficient in the upstream reach of Gaocun decreased significantly after the reservoir was constructed, while the decrease in the water load variation coefficient in the reach downstream of Gaocun was relatively small. This caused a significant increase in how much the upstream reach of Gaocun depended on the water load variation coefficient, resulting in a higher correlation between the water load variation coefficient and the SDR.

4.4. Impact of the Xiaolangdi Reservoir Operation on the Sediment Delivery Ratio of Flood Events

The relationship between flow discharge and sediment transport rate is typically well-defined and exhibits a relatively consistent correlation [35,36]. A certain flow discharge has a certain sediment transport rate, as shown in the following Equation [35]:
Q s , o u t = K Q o u t α
where Qs,out is the outlet cross-section sediment transport rate, kg/s; Qout is the outlet cross-sectional flow discharge, m3/s; K is the coefficient, which is related to the early erosion and aggradation of the riverbed; α is the index. The values of K and α vary across different river reaches.
The relationship between sediment transport rate and flow discharge generally characterizes the sediment transport capacity in alluvial river reaches [35]. However, for alluvial rivers in the LYR with sandy and fine sediments, this connection exhibits a relatively scattered pattern, as represented by the equation [35]. As early as the 1960s, many scholars proposed that the sediment transport rate in the river channel is not only a function of flow discharge but also closely associated with sediment concentration. Qian et al. [35] proposed that the sediment transport dynamics of the LYR exhibit distinct characteristics compared to those of rivers with low sediment concentrations. They determined that both the flow discharge and sediment concentration at the inlet cross-section significantly affect the sediment transport rate at the outlet cross-section.
Q s , o u t = K Q o u t α S i n β
where Sin is the sediment concentration at the inlet cross-section, kg/m3; β is an index that is closely related to the cross-sectional morphology of river channel.
By modifying Equation (1), we can obtain:
SDR = W s , o u t W s , i n = Q s , o u t Δ T Q s , i n Δ T = Q s , o u t Q i n S i n
where Qs,in is the sediment transport rate at the inlet, kg/s; Qin is the flow discharge at the inlet, m3/s; ∆T is the duration of the flood event, s.
By substituting Equation (6) into Equation (7), we can derive the theoretical formulation for the SDR:
SDR = K Q o u t α S i n β Q i n S i n = K W w , o u t W w , i n α S i n Q i n β 1 Q i n α + β 2
By substituting Equations (3) and (4) into Equation (8), we can obtain the following:
SDR = K Q o u t α S i n β Q i n S i n = K η α ξ β 1 Q i n α + β 2
Equation (9) shows that the SDR is related to physical quantities such as ζ, η, and Qin. In Equation (9), the sample data from the flood event does not take into account the artificial diversion of water load and sediment load from the downstream river channel. Therefore, restoring the SDR and water load at the outlet cross-section in the equation above is essential.
According to Equation (9), the theoretical formulation for the SDR of the Tiexie to Lijin reach is derived using a stepwise regression method. This article utilizes 688 flood events as sample data, omitting the discrete points with significant standard residuals. The parameters K, β − 1, and α are 0.084, −0.773, and 1.761, respectively, and the null hypothesis is rejected, as the p-value derived from the t-test is statistically significant (p < 0.05). However, α + β − 2 equals 0.016, and the t-test yields a p-value exceeding 0.05, suggesting that the parameter α + β − 2 fails to pass the hypothesis test. Therefore, the Qα+β−2 term in the regression analysis can be rounded. When the Qα+β−2 term is discarded, the parameters K, β − 1, and α are 0.072, −0.624, and 1.647, respectively, based on the regression analysis. These parameters successfully pass the hypothesis test, with a p-value from the t-test less than 0.05. The fitting coefficient is 0.873, and the theoretical formulation for the SDR of the reach from Tiexie to Lijin is represented as follows:
SDR = 0.072 η 1.647 ξ 0.624 ,   R 2 = 0.837
Based on Equation (10), the fundamental structural form of the SDR can be derived as follows:
SDR = K η α ξ β 1
From Equation (11), the key factors influencing the SDR are the incoming sediment coefficient and the water load variation coefficient, which align with the main conclusions in Section 4.3. To analyze the influence of water–sediment conditions on downstream sediment transport characteristics prior to and following the construction of the Xiaolangdi Reservoir, this article develops theoretical formulation of SDR for the reach from Tiexie to Lijin during two periods: 1960~1999 and 2000~2023, based on the basic form of Equation (11).
Between 1960 and 1999, the LYR recorded 533 flood events, characterized by an average flow discharge ranging from 507 to 6778 m3/s and an average sediment concentration spanning from 0.0 to 340.98 kg/m3. The average flow discharge and sediment concentration observed at Xiaoheiwu Station were adopted as the water–sediment conditions at the inlet cross-section. In contrast, the average flow discharge and sediment concentration observed at Lijin Station represented the water–sediment conditions at the outlet cross-section. In 1960~1999, the theoretical formulation for the SDR in the reach from Tiexie to Lijin can be stated as follows:
SDR = 0.067 η 1.628 ξ 0.643 ,   R 2 = 0.786
Between 2000 and 2023, the LYR experienced 155 flood events, with an average flow discharge ranging from 519 to 3992 m3/s and an average sediment concentration varying from 0.0 to 103.71 kg/m3. During 2000~2023, the theoretical formulation of the SDR in the reach from Tiexie to Lijin is as follows:
SDR = 0.118 η 1.525 ξ 0.513 ,   R 2 = 0.831
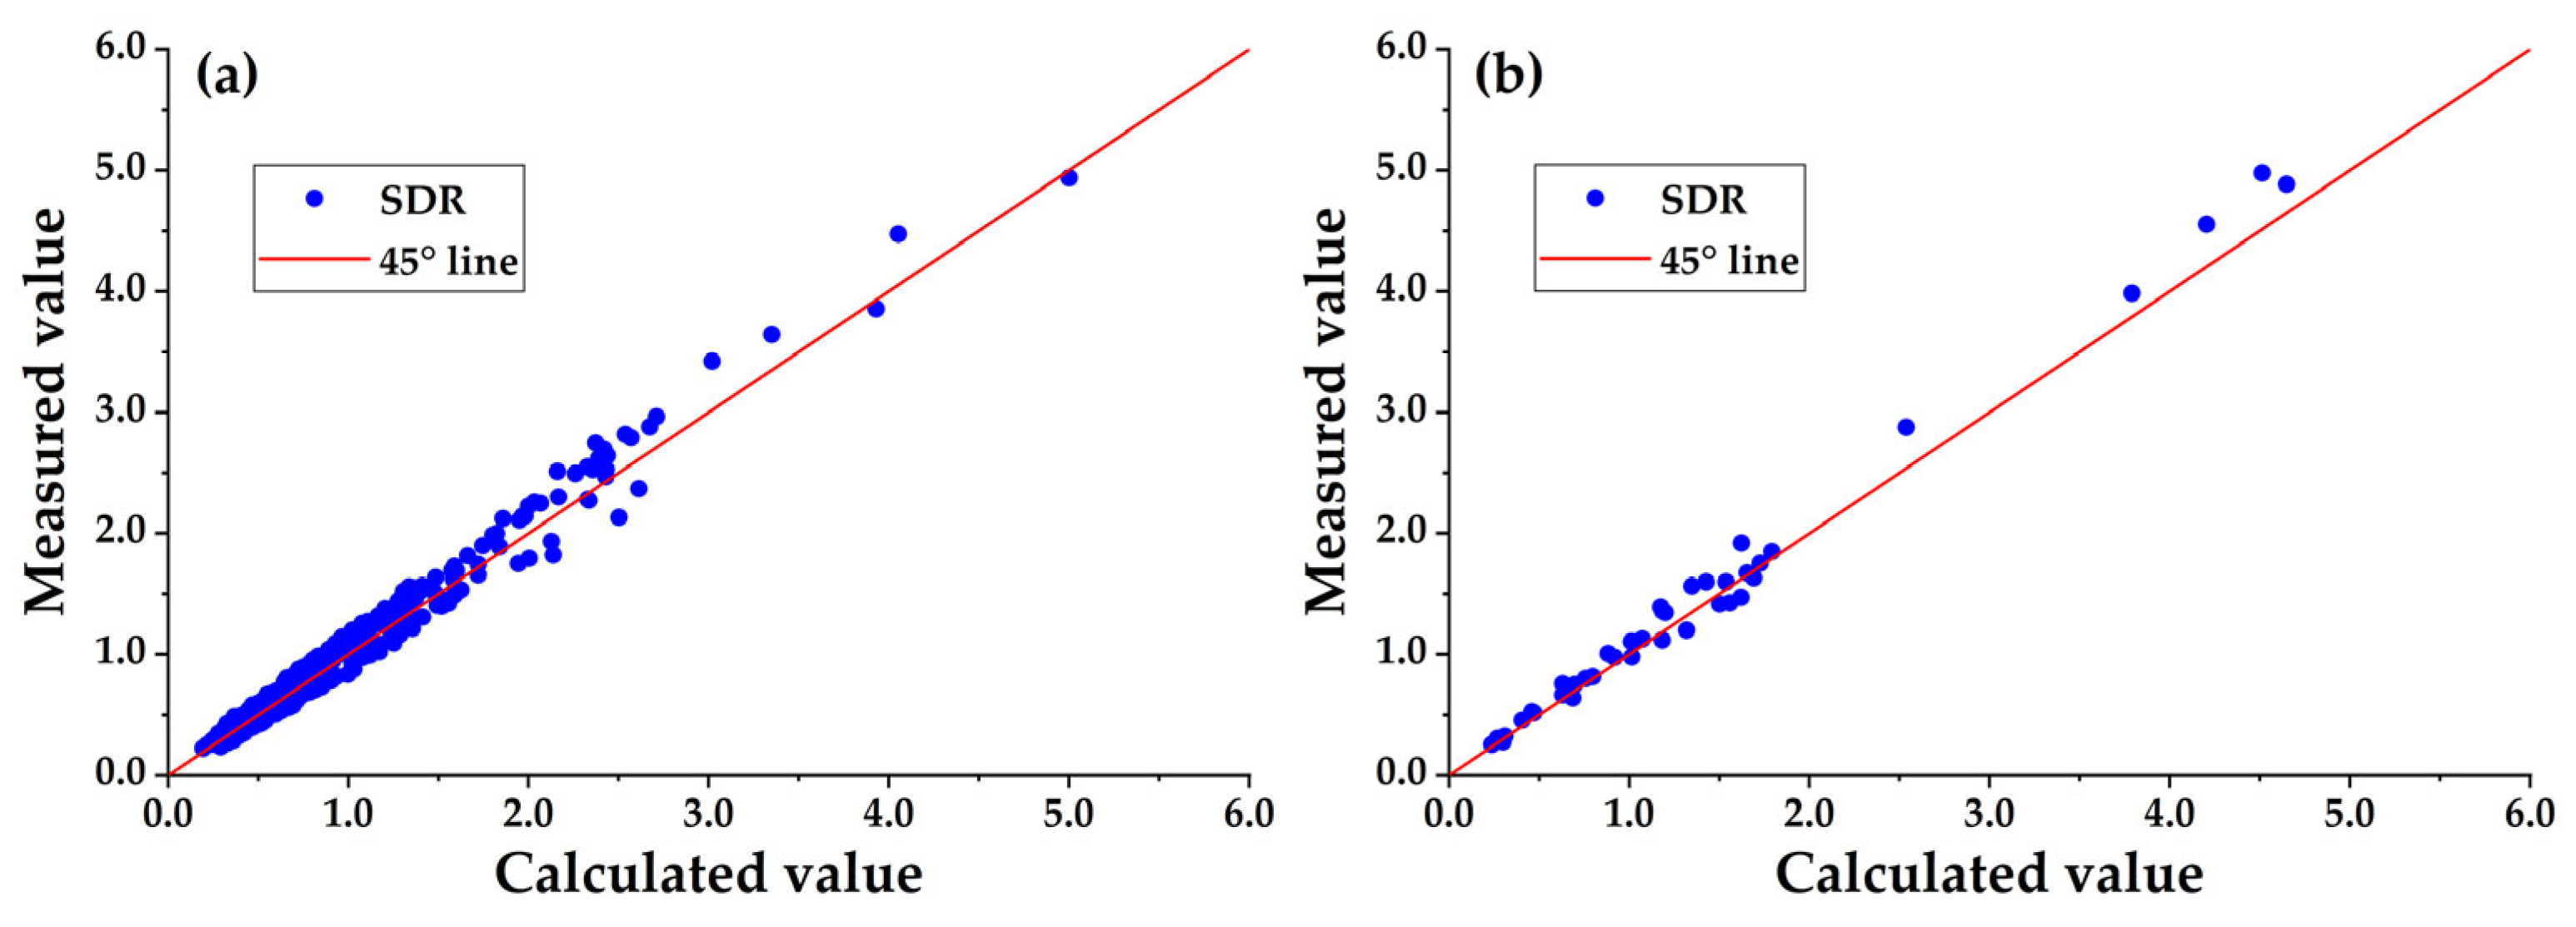
Figure 6 compares the measured and calculated SDRs in the reach from Tiexie to Lijin. The SDR measurements from the Tiexie to Lijin reach during both periods are evenly distributed around the 45° line, with an average error of 8.7%. The analysis confirms that this theoretical formulation for the SDR effectively captures the key characteristics of flood discharge and sediment transport processes along the entire downstream channel.
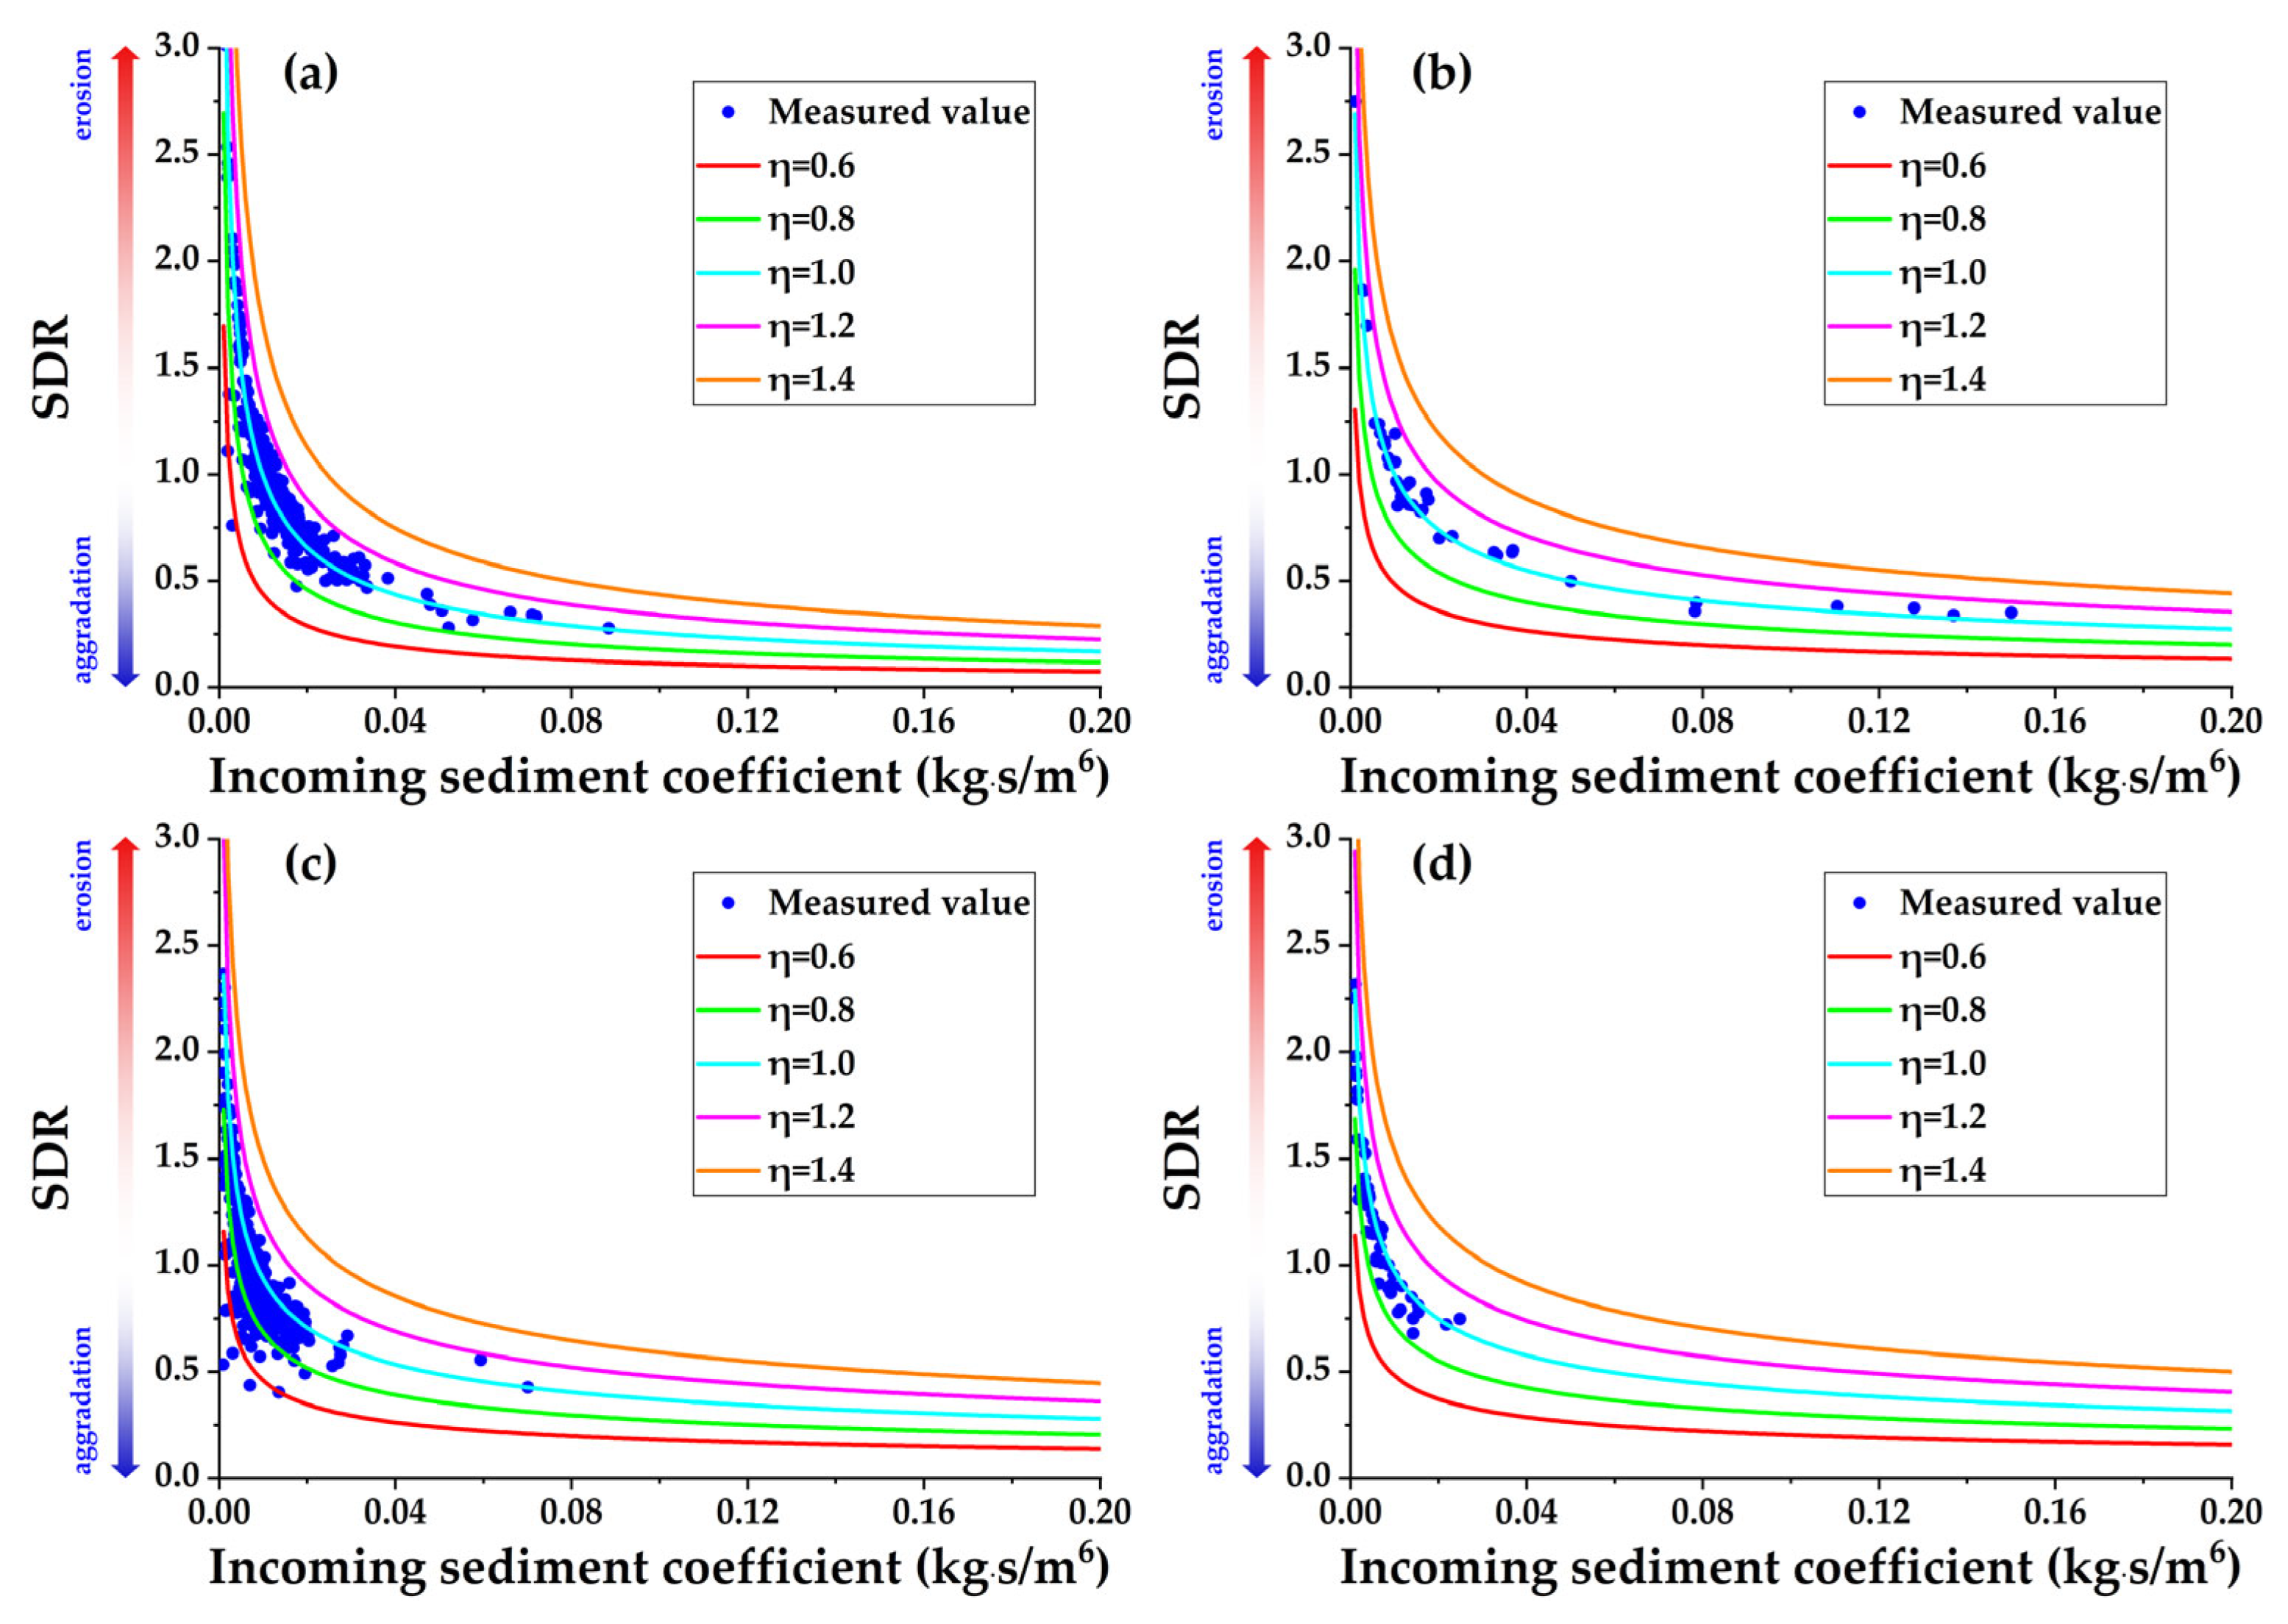
Based on the theoretical formulation of the SDR of flood events in the Tiexie to Lijin reach prior to and following the construction of the Xiaolangdi Reservoir, the SDRs for the Tiexie to Huayuankou reach, Huayuankou to Gaocun reach, Gaocun to Aishan reach, and Aishan to Lijin reach were fitted. The parameter fitting results are shown in Table 2.
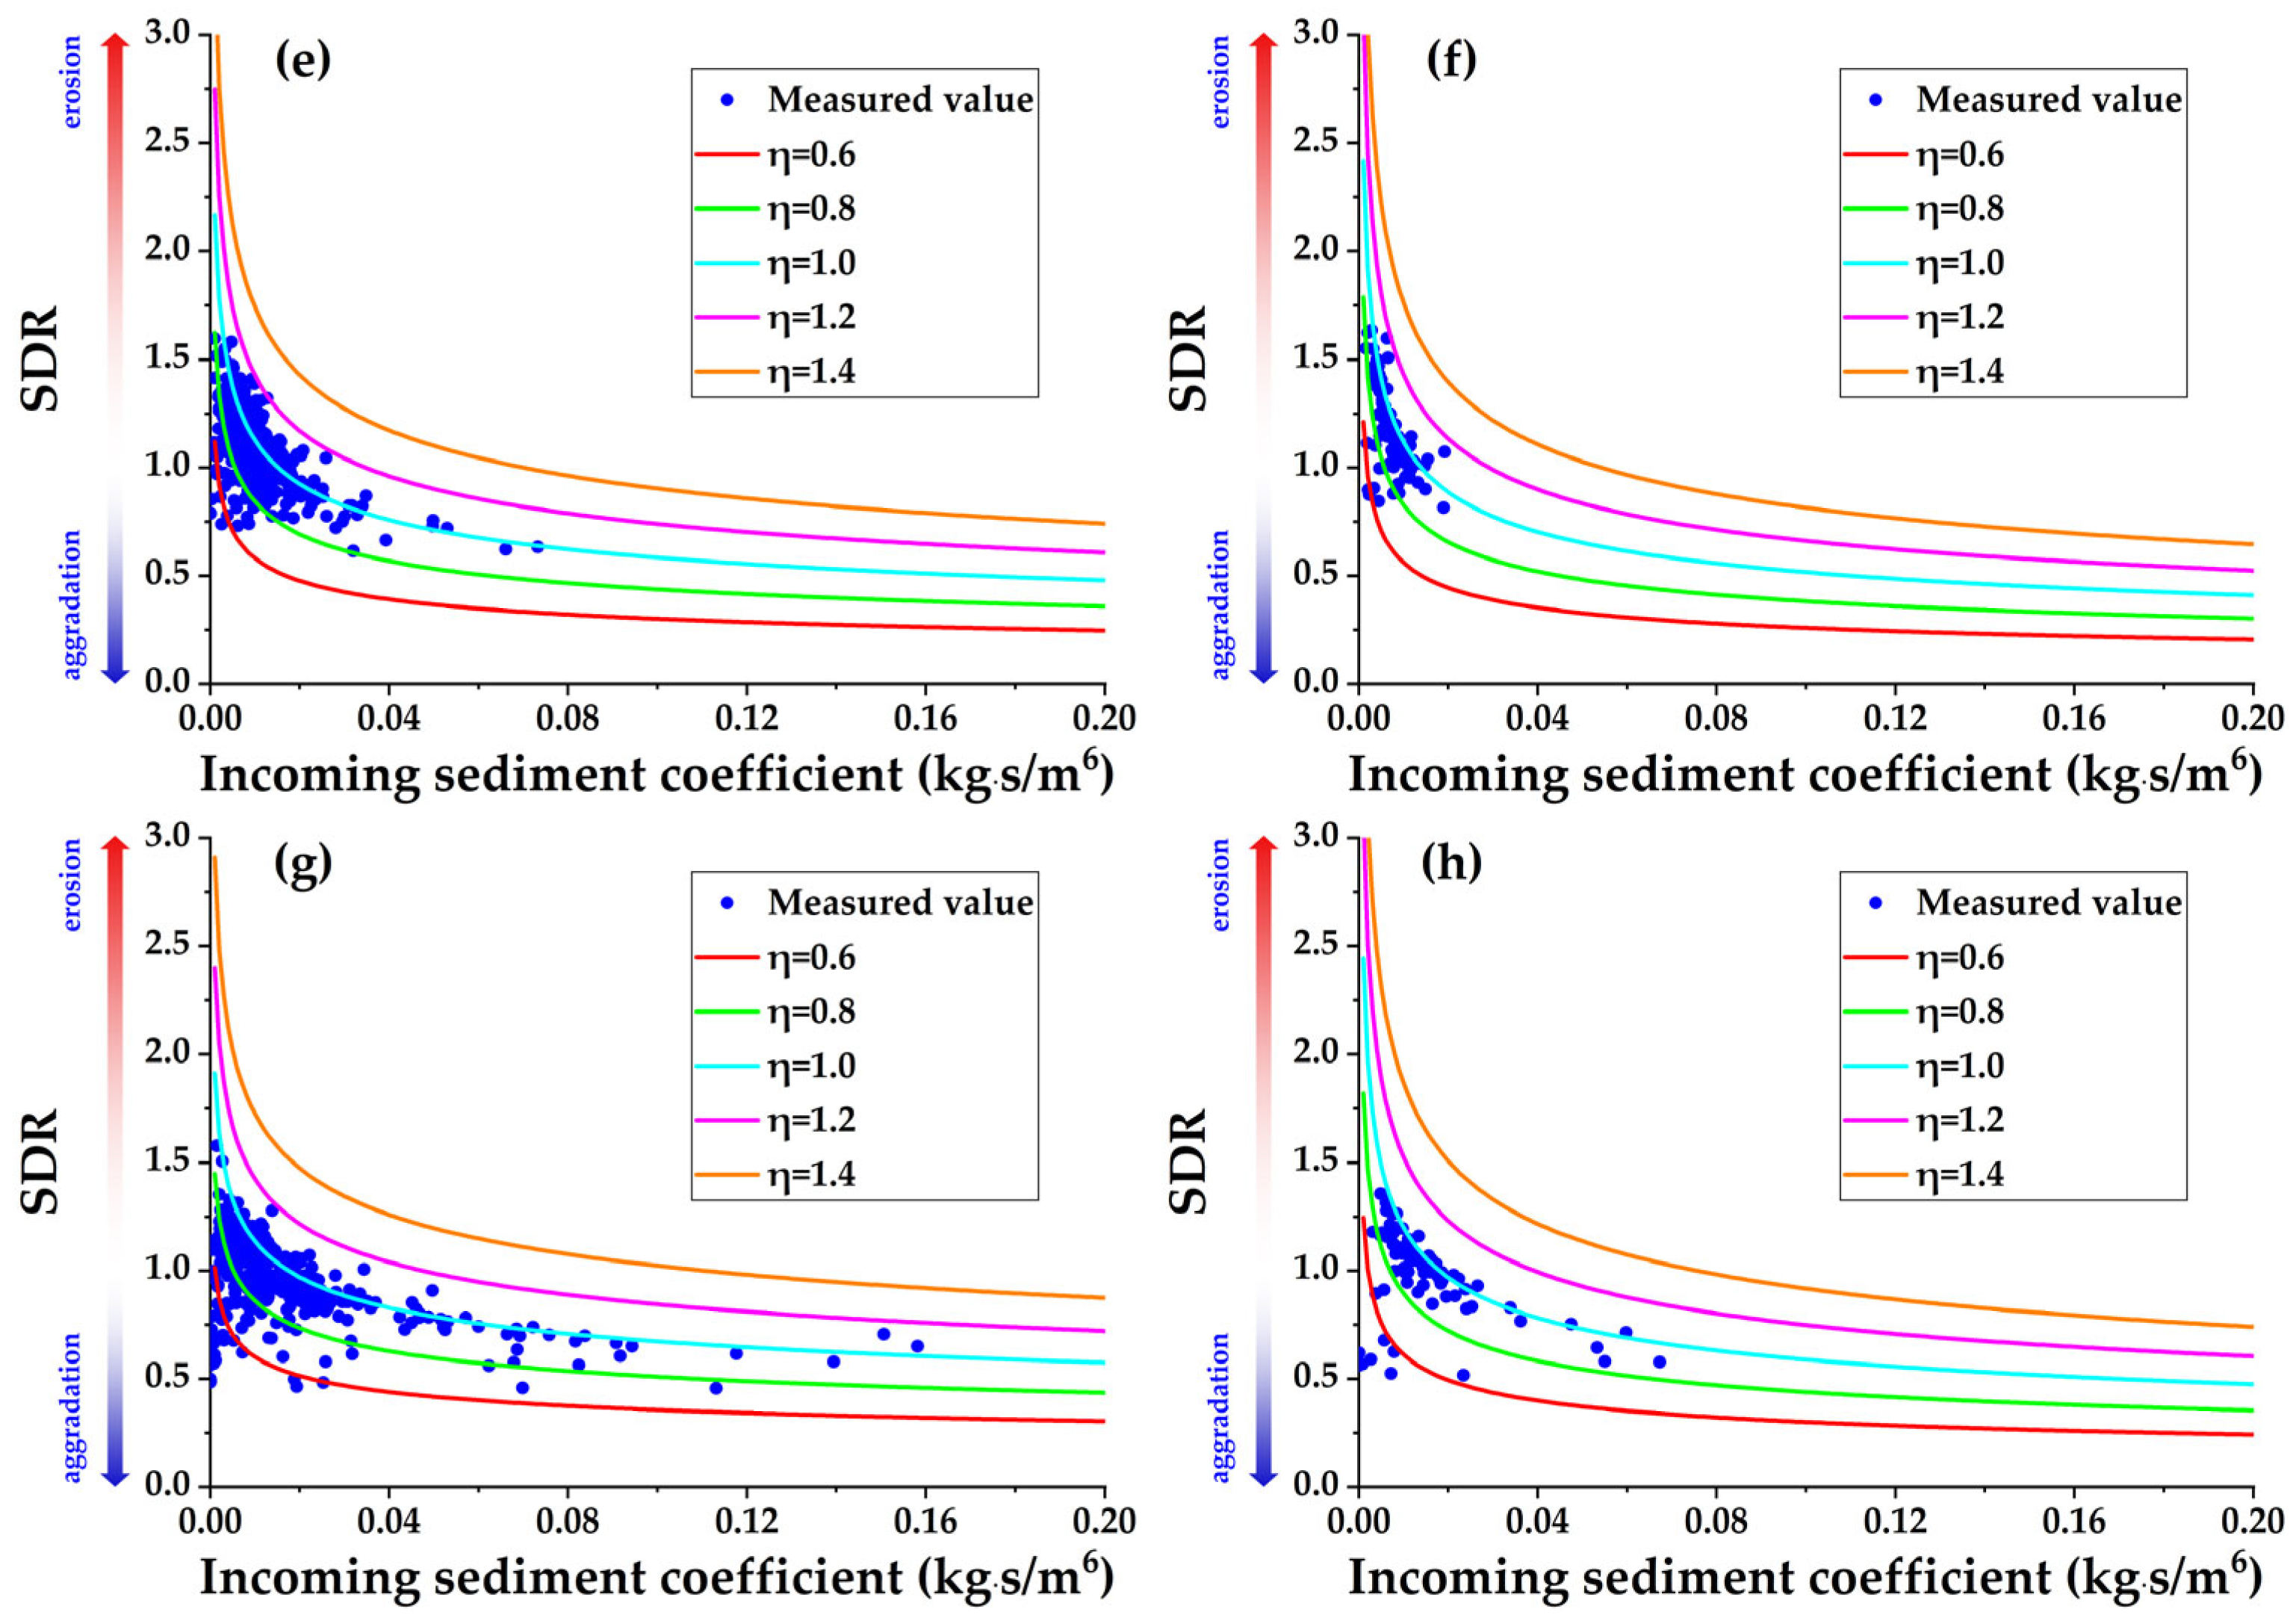
Figure 7 presents the relationship of the incoming sediment coefficient with the SDR across various river reaches during flood events. The figure illustrates that the SDR exhibits an exponential decline as the incoming sediment coefficient increases. In addition, based on the theoretical formulation between water–sediment factors and the SDR in different reaches, it is calculated that as the water load variation coefficient increases, the SDR also shows an increasing trend. The scatter points of the incoming sediment coefficient and SDR in different reaches are mainly concentrated on the curve with a water load variation coefficient of 1.0, indicating that the water load variation coefficient of most flood events in each river reach is primarily concentrated between 0.9 and 1.1.
To further compare the relationship of the SDR with the incoming sediment coefficient prior to and following the construction of the Xiaolangdi Reservoir, the water load variation coefficient was set to 1, as shown in Figure 8. When the incoming sediment coefficient remains below 0.02 kg∙s/m6, the differences in SDRs across various river reaches are minimal. Conversely, when the incoming sediment coefficient exceeds 0.02 kg∙s/m6, the disparity in SDRs among the different river reaches becomes pronounced.
Following the completion of the Xiaolangdi Reservoir construction, the reach downstream of the reservoir is primarily characterized by “clear water”, while the riverbed morphology upstream of Gaocun is mainly adjusted through erosion and incision, with the cross-sectional morphology transitioning from “wide and shallow” to “narrow and deep.” Since the cross-sectional shape exerts a substantial influence on sediment transport capacity, following the completion of the Xiaolangdi Reservoir construction, when the incoming sediment coefficient exceeds 0.02 kg∙s/m6, the SDR in the reaches from Tiexie to Huayuankou and from Huayuankou to Gaocun is relatively high, as illustrated in Figure 8a,b. In the reach below Gaocun, both the cross-sectional morphology and the river gradient slightly changed, while the median particle diameter of bed sediment has increased from 0.082 mm to 0.112 mm, indicating a substantial coarsening of the riverbed. The particle size of the bed sediment will become the primary factor influencing the river’s sediment transport capacity [31]. Given the substantial impact of riverbed coarsening on sediment transport capacity subsequent to the construction of the Xiaolangdi Reservoir, when the incoming sediment coefficient exceeds 0.02 kg∙s/m6, the SDR in the Gaocun to Aishan reach and the Aishan to Lijin reach will decrease, as shown in Figure 8c,d.
When the inflow and outflow water load at the upstream and downstream cross-sections of the river reach are equal, and the SDR remains at 1.0 prior to and following the construction of the Xiaolangdi Reservoir, the incoming sediment coefficients for the erosion and aggradation balance are as follows: approximately 0.01 kg∙s/m6 above Gaocun, 0.015 kg∙s/m6 from Gaocun to Aishan, and 0.02 kg∙s/m6 from Aishan to the Lijin River. This indicates a gradual increase in the incoming sediment coefficient under balanced sediment transport conditions along the LYR. When the inflow and outflow water load at the upstream and downstream cross-sections of the river reach are equal, and the incoming sediment coefficient exceeds 0.02 kg·s/m6, there are notable differences in the SDRs of each river reach prior to the construction of Xiaolangdi Reservoir; that is, the sediment transport capacity varies significantly among the river reaches (Figure 8e). However, after the completion of the Xiaolangdi Reservoir, the SDR of each river reach will be more concentrated, and the sediment transport capacity of various river reaches will exhibit greater consistency (Figure 8f).

4.5. Impact of the Xiaolangdi Reservoir Operation on Aquatic Organisms During Flood Events

The river ecosystem refers to a system of biological communities and their aquatic environment in a specific area, where the members create an organized functional complex through energy exchange and material cycling [63,64]. The construction and operation of the Xiaolangdi Reservoir has substantially modified the aquatic habitat within the downstream river channel. The identified impacts are seen in the following aspects:
(1)
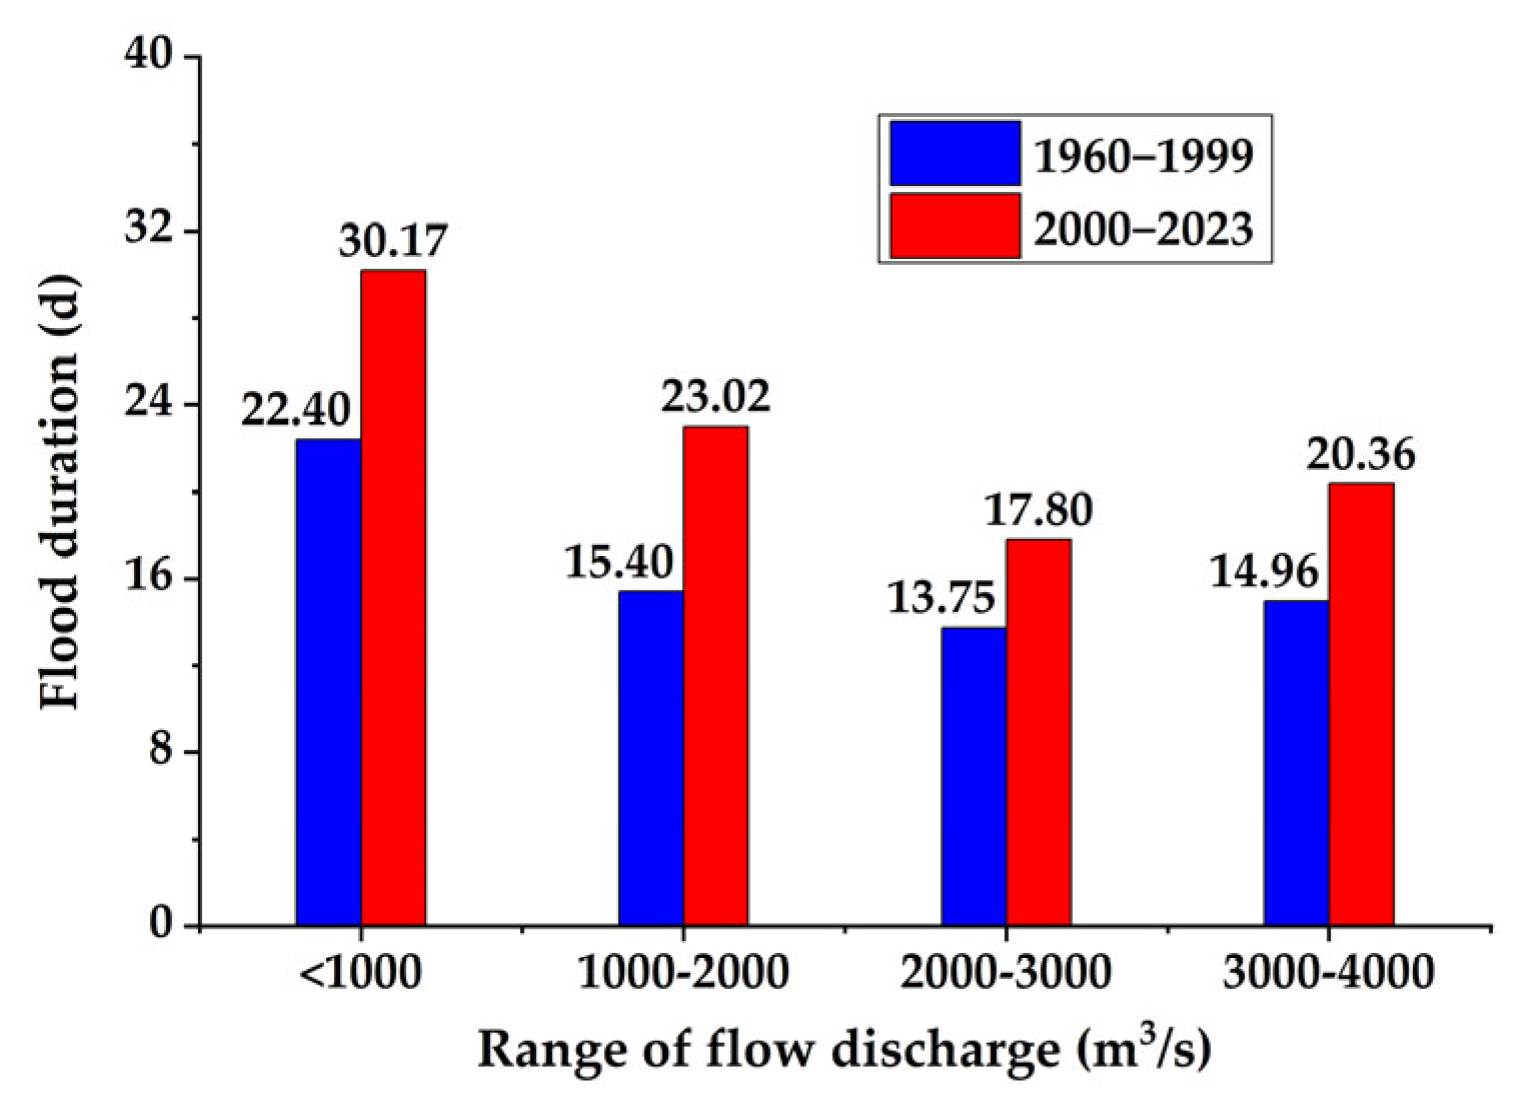
Figure 9 shows the duration of flood events at different flow discharges. The sudden increases and decreases in flood flow discharges can significantly alter flow velocities, which is extremely detrimental to the survival and reproduction of aquatic organisms [23]. Following the completion of the Xiaolangdi Reservoir construction, the average flow discharge of flood events has generally remained below 4000 m3/s. Accordingly, this article compares and analyzes the average duration of four types of flood events (less than 1000 m3/s, 1000–2000 m3/s, 2000–3000 m3/s, and 3000–4000 m3/s), indicating that the average duration of the four types of flood events has increased by approximately 40%. The duration of flood events has increased, reducing the frequency of sudden increases and decreases in flood flow discharge. This has resulted in relatively gradual changes in flow discharge, improving the adaptability of aquatic organisms to flow velocity and providing a more stable environment for fish and aquatic plants.
(2)
Figure 10 shows the variation in the median particle diameter of suspended sediment. Prior to the construction of the Xiaolangdi Reservoir, the median particle diameter of suspended sediment entering the LYR has exhibited a statistically significant decreasing trend since the 1980s, and has remained largely stable since then. Following the completion of the Xiaolangdi Reservoir construction, the interannual variability of the median particle diameter of suspended sediment significantly increased, displaying a general upward trend over time, as illustrated in Figure 10. Research shows that fine sediment smaller than 0.15 mm easily blocks fish gills. The finer the sediment particles, the easier it is to block the gills [30]. Following the completion of the Xiaolangdi Reservoir construction, the median particle diameter of suspended sediment exhibited a slight increase, while the occurrence of sediment blocking fish gills decreased, creating a more suitable environment for fish survival.
(3)
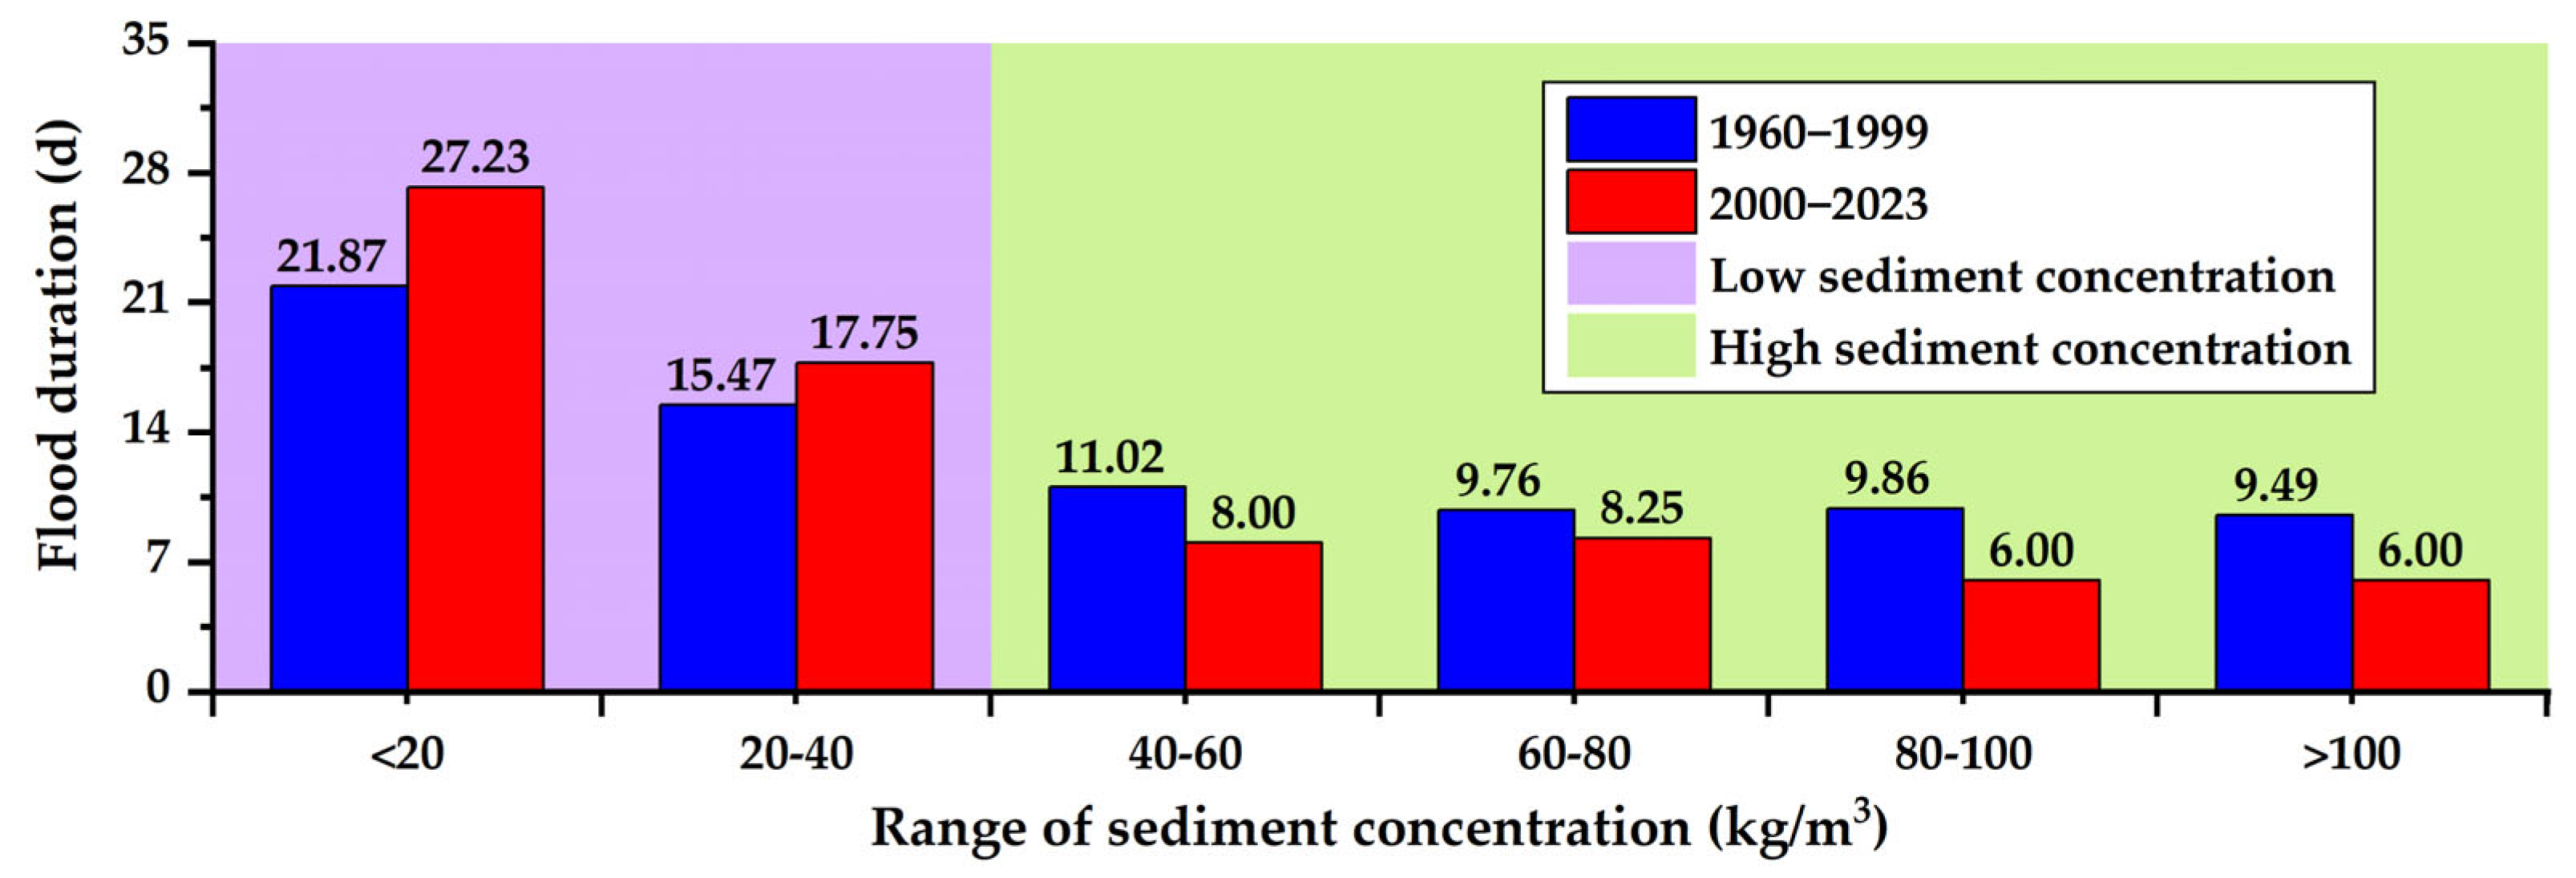
Figure 11 shows the duration of flood events at different sediment concentrations. Following the completion of the Xiaolangdi Reservoir construction, the frequency and duration of high sediment concentration floods have diminished, as illustrated in Figure 11. Compared to the pre- and post-operation of the Xiaolangdi Reservoir, the duration of floods at sediment levels of 40~60 kg/m3 decreased from 11.02 days to 8 days, the duration of floods at 60~80 kg/m3 decreased from 9.76 days to 8.25 days, the duration of floods at 80~100 kg/m3 decreased from 9.86 days to 6 days, and the duration of floods with sediment concentrations exceeding 100 kg/m3 decreased from 9.49 days to 6 days. Han et al. [23] proposed that dissolved oxygen concentration in water is negatively correlated with sediment concentration. This means that when the sediment concentration exceeds 30 kg/m3, the dissolved oxygen concentration in the river will decrease to 2.5 mg/L. The demand for dissolved oxygen content in water by common fish ranges from 2.5 to 5.0 mg/L. When the dissolved oxygen concentration in rivers drops to 2.5 mg/L, fish survival will be significantly impacted, and fish may even die from hypoxia [65]. The water and sediment regulation of the Xiaolangdi Reservoir has resulted in a reduction in sediment concentration and a high dissolved oxygen level in the downstream river, which are conducive to fish survival, thereby enhancing the environment for fish survival and reproduction.
(4)
Following the completion of the Xiaolangdi Reservoir construction, the downstream river channel has consistently maintained a low sediment concentration or clear water conditions for an extended period. Compared to the periods prior to and following the construction of the Xiaolangdi Reservoir, the duration of floods characterized by sediment concentrations below 20 kg/m3 increased from 21.87 days to 27.23 days, while the duration of floods with sediment concentrations between 20 and 40 kg/m3 rose from 15.47 days to 17.75 days. This trend indicates an increase in the duration of floods below 40 kg/m3, as shown in Figure 11. Previous studies have demonstrated that elevated sediment concentrations in river systems contribute to increased water turbidity, thereby reducing light transmittance and attenuating underwater light penetration. This diminishes photosynthetic activity in aquatic and riparian vegetation within the river channel, ultimately inhibiting plant growth and potentially leading to mortality [23,29]. The operation of the Xiaolangdi Reservoir has resulted in the sustained maintenance of low sediment concentrations or clear water conditions in the downstream river channel over an extended period, increasing the river’s light transmittance and consequently enhancing the living environment for aquatic plants in the river channel.
In summary, the operation of the reservoir has modified the water–sediment dynamics and sediment transport processes in the downstream river channel during flood events, thereby improving the living environment for aquatic organisms, which is conducive to restoring biodiversity and improving the ecological environment of the river. Previous research has examined the positive impacts of the Xiaolangdi Reservoir on the downstream riverine ecological environment through multiple disciplinary perspectives [66]. However, the regulation and operation of reservoirs also have some negative effects on downstream rivers, such as reducing floodplain floods, which leads to a decrease in wetland areas, disrupts the balance of ecosystems, and limits the supply of sediment to estuaries, causing coastal erosion and retreat.

5. Discussion

5.1. Rationality Analysis of Fitting Equation Parameters

Table 3 shows the α + β values of each river reach prior to and following the construction of the Xiaolangdi Reservoir. For the parameters α and β, Qian et al. [35] concluded that during the non-flood season, when the Sanmenxia Reservoir releases clear water, the sediment transport rate exhibits a proportional relationship to the square of the flow discharge, specifically, α = 0 and β = 2. During the flood season, when the sediment concentration is high, the sediment transport rate equations for Gaocun and Sunkou Stations have α + β values of 1.96 and 1.94, respectively. Zhang and Liang [67] found that α + β equals 1.96 and 2.08 in the sediment transport rate equation for the Gaocun and Lijin Stations during the flood season, respectively. Zhao and Zhou [68] analyzed the flood data during the flood season in the LYR. They demonstrated that the sediment transport rate equations for the Gaocun, Aishan, and Lijin hydrologic stations yielded α + β coefficients of 1.94, 2.03, and 2.05, respectively. Meanwhile, Leopold and Maddock [69] and Knighton [70] indicate that α + β varies around 2.0. The above research results primarily involve the LYR [35,67,68]. Therefore, when the fitting values of α + β in each river during the two periods are equal to 2.0, it proves that the fitting parameters are reasonable.

5.2. Uncertainty of the Sediment Delivery Ratio

The SDR effectively indicates a river’s erosion and aggradation characteristics over a specified period, thereby demonstrating the river’s capacity for sediment transport under particular boundary conditions [27,39]. This article’s theoretical formulation for the sediment transport ratio elucidates the characteristics of sediment discharge in relation to water–sediment conditions. However, the variation in the measured data around the fitting curve reflects the inherent uncertainty of the SDR relationship. The uncertainty in the SDR of floods entering downstream rivers can be attributed to the following reasons:
(1)
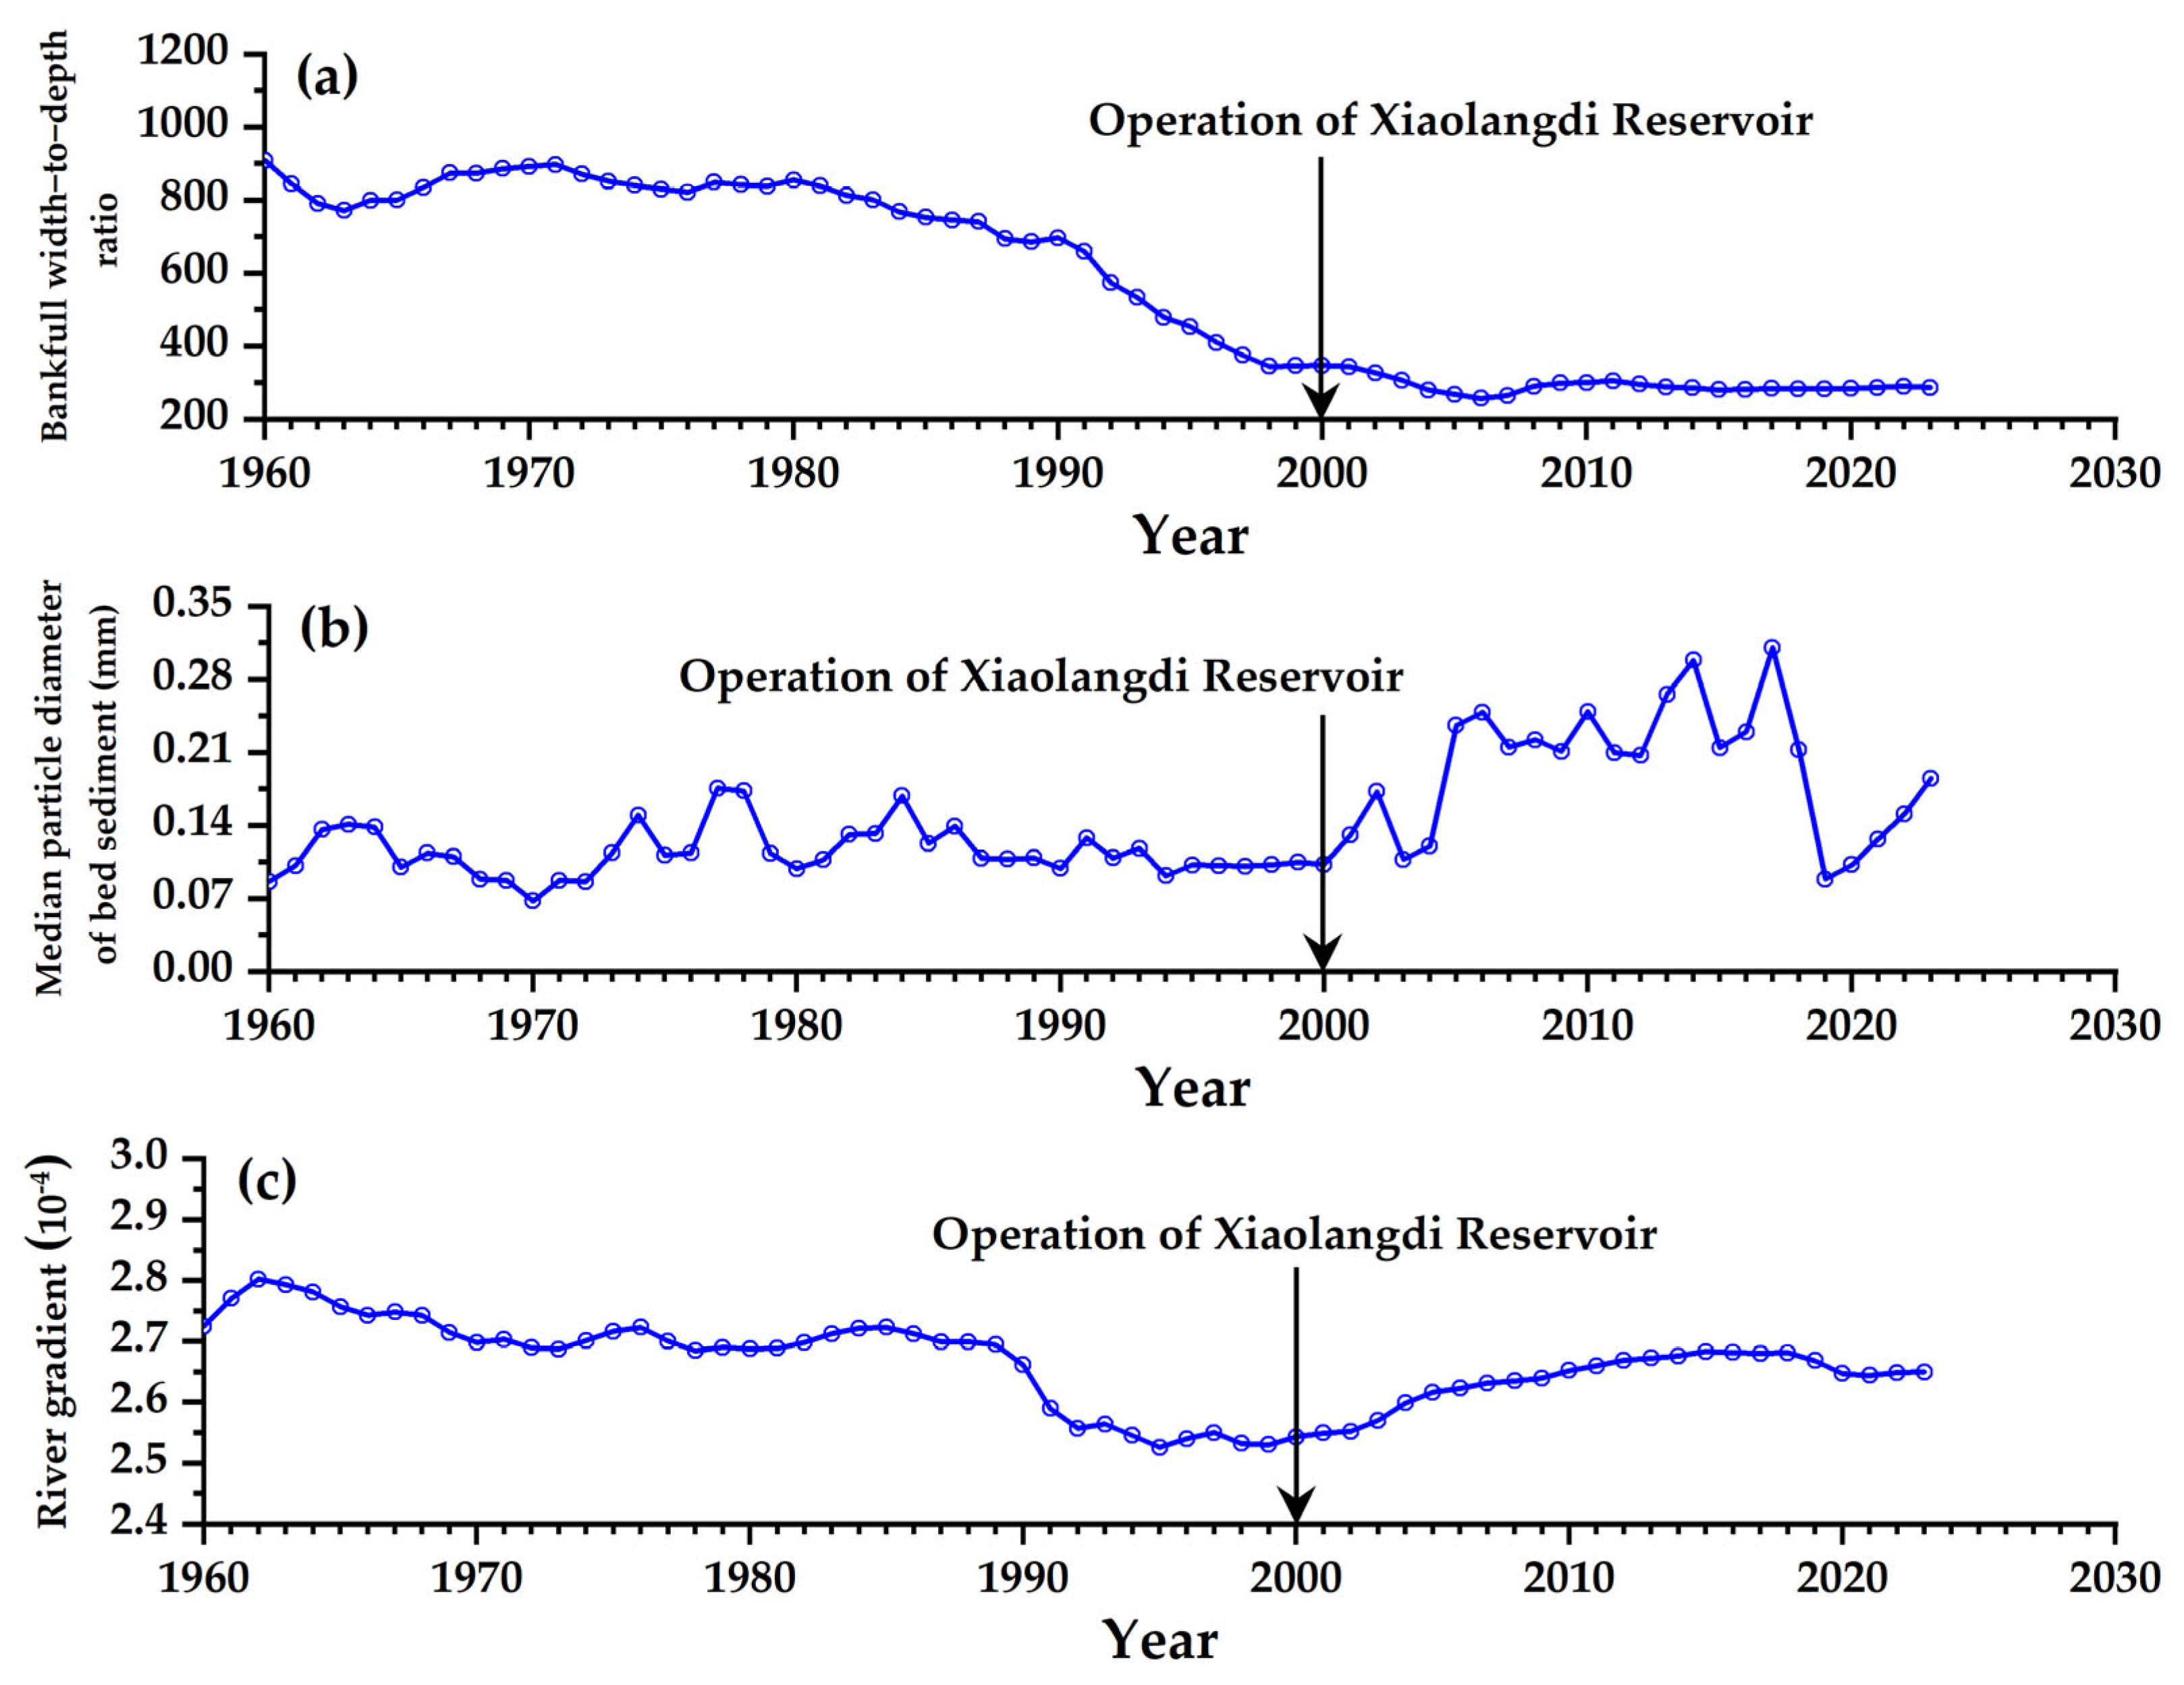
Riverbed boundary conditions: Regarding the primary channel cross-section morphology, following the completion of the Xiaolangdi Reservoir construction, under identical flow discharge conditions, the bankfull width-to-depth ratio of the riverbed progressively diminishes, with the cross-sectional morphology exhibiting a tendency toward a more “narrow and deep” configuration, as shown in Figure 12a. Under identical discharge conditions, a ‘narrow and deep’ river channel exhibits a higher sediment transport capacity compared to a ‘wide and shallow’ river channel [39,62]. Concerning the bed sediment particle size, prior to the construction of the Xiaolangdi Reservoir, the riverbed was primarily silty, displaying a high proportion of fine particles. Following the completion of the Xiaolangdi Reservoir construction, the riverbed underwent continuous erosion, resulting in a gradual increase in the median particle diameter of bed sediment [13], as shown in Figure 12b. The river gradient shows a trend of first decreasing and then increasing, with the minimum river gradient occurring in 2000, as shown in Figure 12c. Although the gradient adjustment range of the LYR is relatively limited, the influence of river gradient on the fluvial sediment transport capacity cannot be ignored [9,71].
(2)
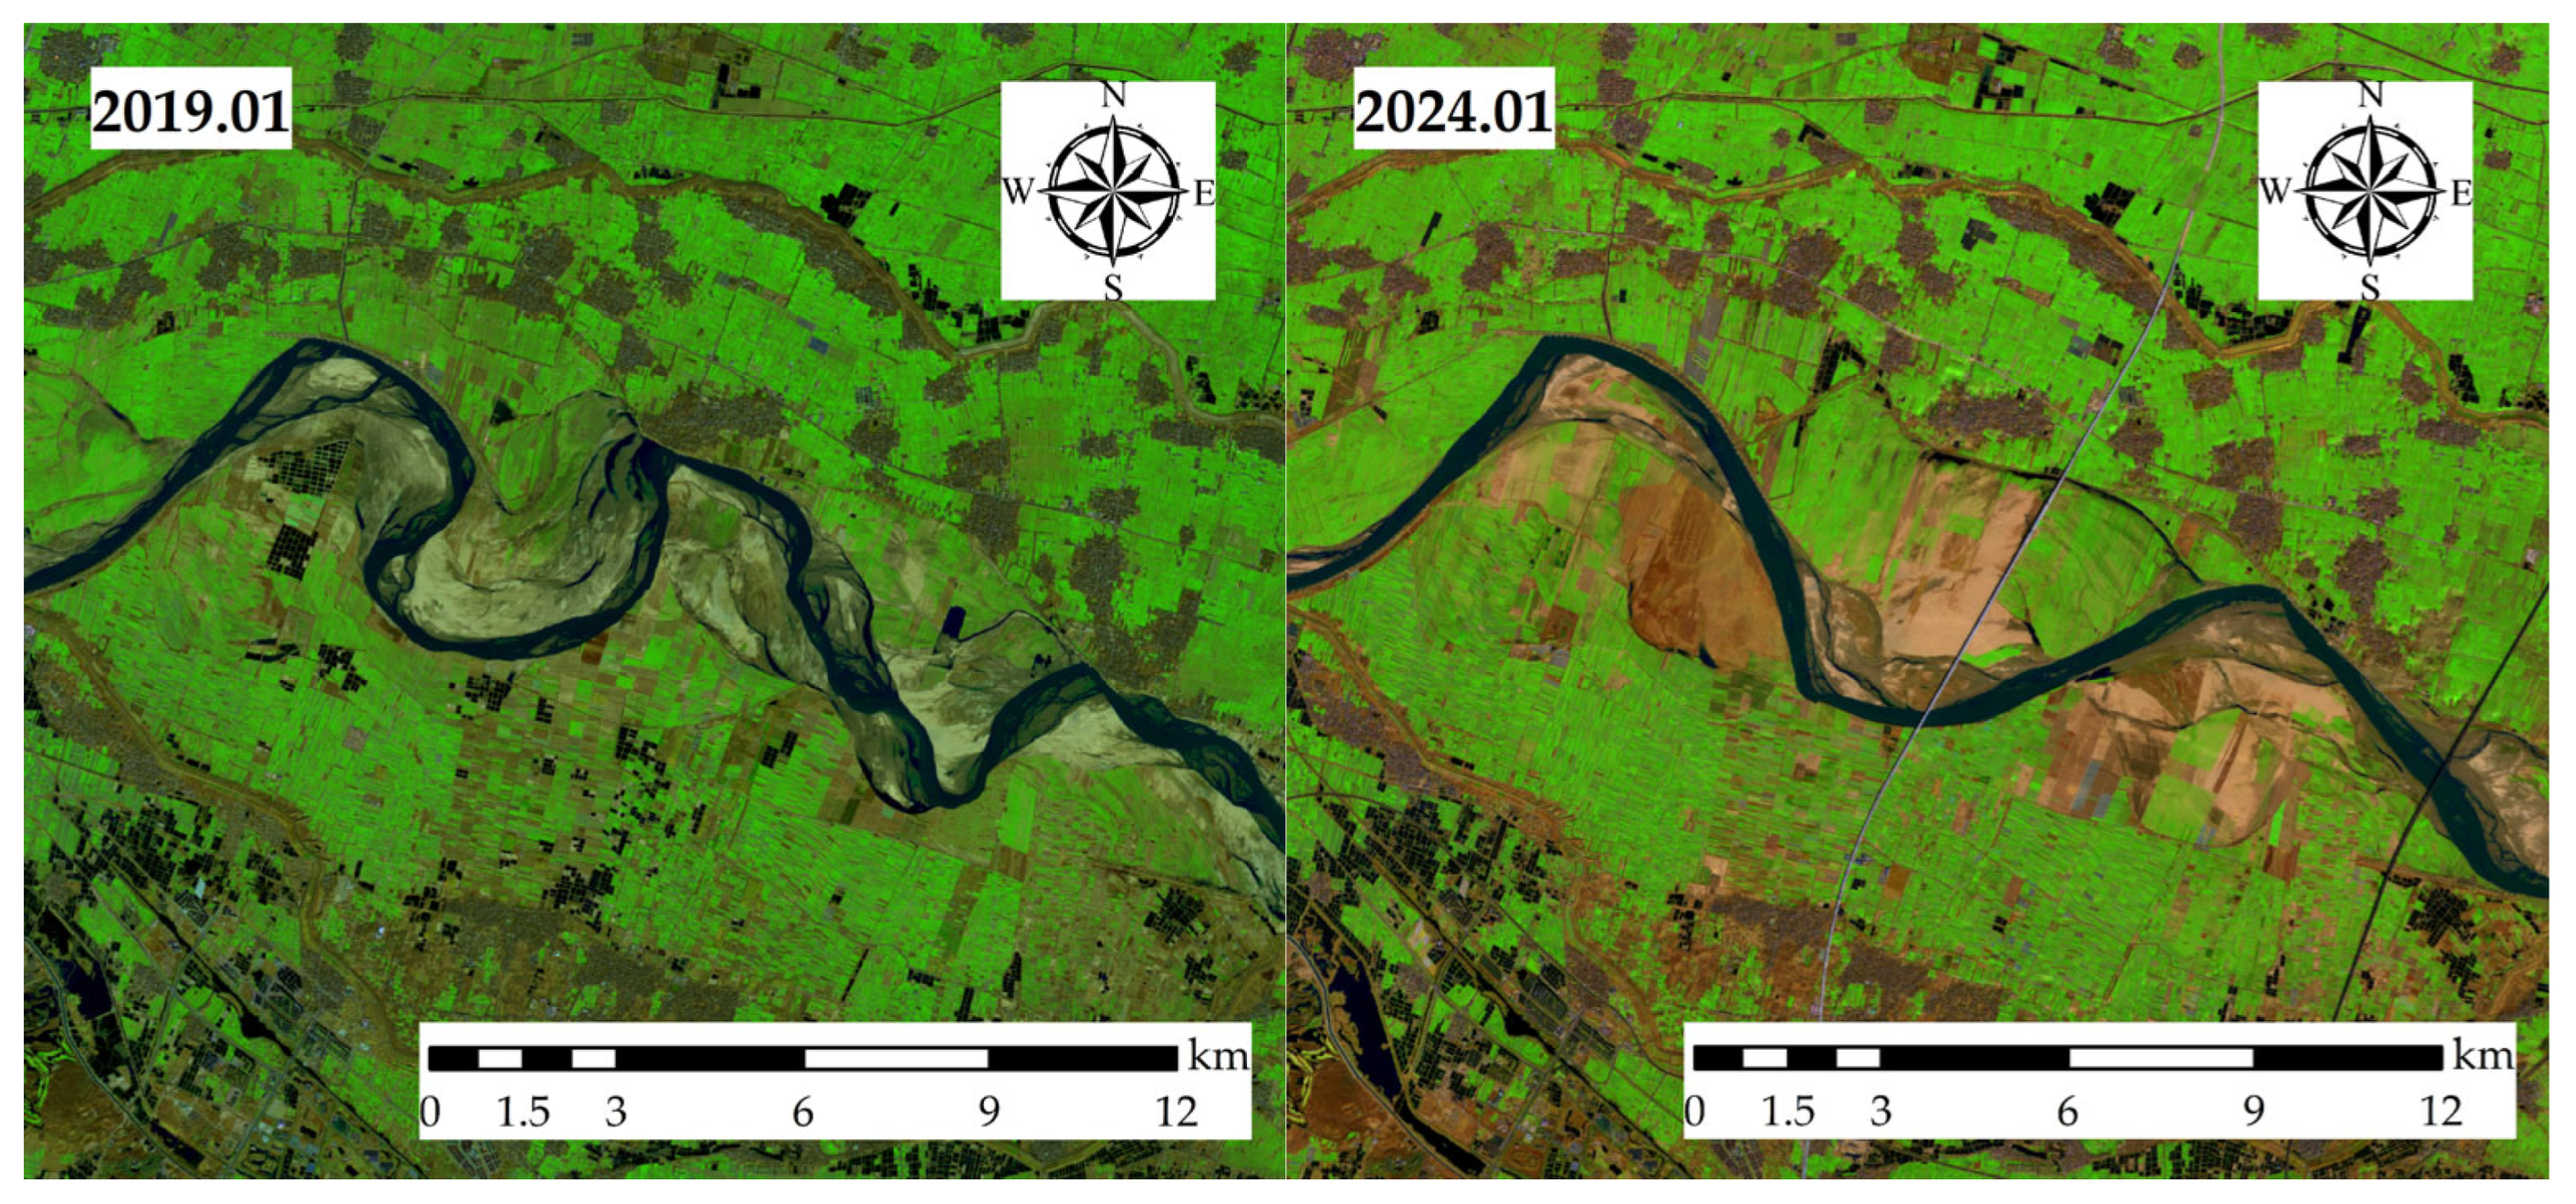
The change in river regime: The LYR has numerous deformed river bays, including the reach from Sanguanmiao to Weitan, as illustrated in Figure 13. The reach from Sanguanmiao to Weitan is located between Huayuankou and Gaocun and is a typical wandering river channel, approximately 50 km upstream from the Huayuankou hydrological station [72]. During a significant flood, local river reaches can experience top flushing and back-flow, significantly impacting the river’s sediment transport capacity. Bend cutting can mitigate the negative impacts of deformed river bays and rapidly enhance the river’s sediment transport capacity [65,72].
The operation of the Xiaolangdi Reservoir has significantly modified the hydro-sediment regime, including the incoming sediment coefficient, flood duration, and the particle size distribution of suspended sediments, but it has also significantly impacted the river channel boundaries. This includes the river channel’s cross-sectional morphology, bed sediment particle size, and river gradient. The influence of channel boundary conditions on the SDR cannot be ignored [32]. Currently, some scholars have studied the impact of river cross-sectional morphology on river sediment transport capacity, establishing a comprehensive relationship between flood SDR, cross-sectional morphology, and water–sediment factors [39]. To reduce the uncertainty of the theoretical formulation of the SDR during flood events in the LYR, a more in-depth analysis of the impact of river channel boundary conditions on this ratio is essential. Additionally, it is crucial to understand the complex interrelationships between river sediment transport capacity, water–sediment dynamics, and river channel boundary conditions.

6. Conclusions

This article is based on measured water–sediment data of 688 floods in the LYR from 1960 to 2023. It compares and analyzes the water–sediment processes and sediment transport characteristics of the LYR prior to and following the construction of the Xiaolangdi Reservoir. Based on the sediment transport rate equation, theoretical formulations for the SDR of different river reaches during the two periods of 1960~1999 and 2000~2023 were derived and fitted. The study also analyzed the impact of the Xiaolangdi Reservoir on sediment transport and aquatic organisms in the downstream river channel. The conclusions of the study are as follows:
(1)
Following the completion of the Xiaolangdi Reservoir construction, the average flow discharge of downstream floods has decreased, with 80% of floods concentrated below 2000 m3/s, and the proportion of floods below 1000 m3/s has increased to 37.42%. The frequency of high sediment floods has significantly decreased, accompanied by a notable decline in the number of flood events with an average sediment concentration exceeding 100 kg/m3. Floods with an average sediment concentration below 20 kg/m3 represent about 89.03%, nearing clear water erosion.
(2)
Prior to the construction of the Xiaolangdi Reservoir, the SDR during flood events varied significantly across different river reaches. Following the completion of the Xiaolangdi Reservoir construction, as the degree of bed sediment coarsening intensified, the SDR typically exhibited a declining trend over time, and the trend of SDR was primarily determined by the operational modes of the reservoir.
(3)
The main factors identified as affecting the SDR during flood events in the LYR include average flow discharge, average sediment concentration, incoming sediment coefficient, and water load variation coefficient. The average flow discharge and water load variation coefficient exhibit a statistically significant positive correlation with the SDR, whereby the water load variation coefficient demonstrates a comparatively stronger correlation with the SDR. Conversely, the average sediment concentration and incoming sediment coefficient show a statistically significant negative correlation with the SDR, with the incoming sediment coefficient exhibiting a more pronounced correlation with the SDR.
(4)
The operation of the Xiaolangdi Reservoir has enhanced the sediment transport capacity in the upstream reach of Gaocun, while simultaneously reducing it in the downstream reach below Gaocun. Overall, reservoir operations have enhanced the consistency of flood discharge and sediment transport capacities across various river reaches in the LYR.
(5)
After the construction of Xiaolangdi Reservoir, the duration of flood events with sediment concentrations over 40 kg/m3 has decreased, while the duration of events with sediment concentrations below 40 kg/m3 has increased. On the one hand, this elevates the dissolved oxygen concentration in the water, thereby optimizing the aquatic habitat for fish. On the other hand, this amplifies the light transmittance of the water column, consequently enhancing the survival rates of aquatic organisms in the downstream river channel.

Author Contributions

Conceptualization, X.Z.; Methodology, C.Z.; Software, X.Z.; Validation, M.Z.; Formal analysis, X.Z.; Investigation, C.Z.; Resources, M.Z.; Data curation, Z.S.; Writing—original draft, X.Z.; Writing—review & editing, X.Z.; Supervision, B.Z.; Funding acquisition, M.Z. All authors have read and agreed to the published version of the manuscript.

Funding

This work was supported by the National Natural Science Foundation of China (U2243220), the Basic R&D Special Fund of the Central Government for Non-profit Research Institutes, Grant/Award (HKY-JBYW-2024-18), and the Science and Technology Development Fund of the Yellow River Institute of Hydraulic Research (202418).

Institutional Review Board Statement

Not applicable.

Informed Consent Statement

Not applicable.

Data Availability Statement

All data reported in the manuscripts are available from the corresponding author upon justified request.

Conflicts of Interest

The authors declare no conflicts of interest.

References

  1. Graf, W.L. Dam nation: A geographic census of American dams and their large-scale hydrologic impacts. Water Resour. Res. 1999, 35, 1305–1311. [Google Scholar] [CrossRef]
  2. Geoffrey, E.P.; Gurnell, A.M. Dams and geomorphology: Research progress and future directions. Geomorphology 2005, 71, 27–47. [Google Scholar] [CrossRef]
  3. Zarfl, C.; Lumsdon, A.E.; Berlekamp, J.; Tydecks, L.; Tockner, K. A global boom in hydropower dam construction. Aquat. Sci. 2015, 77, 161–171. [Google Scholar] [CrossRef]
  4. Ma, H.B.; Nittrouer, J.A.; Fu, X.D.; Parker, G.; Zhang, Y.F.; Wang, Y.J.; Wang, Y.J.; Lamb, M.P.; Cisneros, J.; Best, J.; et al. Amplification of downstream flood stage due to damming of fine-grained rivers. Nat. Commun. 2022, 13, 3054. [Google Scholar] [CrossRef]
  5. Csiki, S.J.; Rhoads, B.L. Influence of four run-of-river dams on channel morphology and sediment characteristics in Illinois, USA. Geomorphology 2014, 206, 215–229. [Google Scholar] [CrossRef]
  6. Naito, K.; Ma, H.B.; Nittrouer, J.A.; Zhang, Y.F.; Wu, B.S.; Wang, Y.J.; Fu, X.D.; Parker, G. Extended Engelund–Hansen type sediment transport relation for mixtures based on the sand-silt-bed Lower Yellow River, China. J. Hydraul. Res. 2019, 57, 770–785. [Google Scholar] [CrossRef]
  7. Walling, D.E.; Fang, D. Recent trends in the suspended sediment loads of the world’s rivers. Glob. Planet Change 2003, 39, 111–126. [Google Scholar] [CrossRef]
  8. Benn, P.C.; Erskine, W.D. Complex channel response to flow regulation: Cudgegong River below Windamere Dam, Australia. Appl. Geogr. 1994, 14, 153–168. [Google Scholar] [CrossRef]
  9. An, C.G.; Moodie, A.J.; Ma, H.B.; Fu, X.D.; Zhang, Y.F.; Naito, K.; Parker, G. Morphodynamic model of the lower Yellow River: Flux or entrainment form for sediment mass conservation? Earth Surf. Dyn. 2018, 6, 989–1010. [Google Scholar] [CrossRef]
  10. Zhang, X.Q.; Qiao, W.B.; Lu, Y.H.; Huang, J.F.; Xiao, Y.M. Quantitative analysis of the influence of the Xiaolangdi Reservoir on water and sediment in the middle and lower reaches of the Yellow River. Int. J. Environ. Res. Public Health 2023, 20, 4351. [Google Scholar] [CrossRef]
  11. Maren, D.S.V.; Yang, S.L.; He, Q. The impact of silt trapping in large reservoirs on downstream morphology: The Yangtze River. Ocean. Dyn. 2013, 63, 691–707. [Google Scholar] [CrossRef]
  12. Wang, C.Y.; Yang, Y.P.; Zheng, J.H.; Zhu, L.L.; Wang, J.J.; Yang, S.F. Transport characteristics and driving mechanism of coarse and fine grained sediment from Three Gorges Reservoir to downstream of dam. J. Basic Sci. Eng. 2024, 32, 787–800. [Google Scholar] [CrossRef]
  13. Wang, Y.J.; Wang, Q.; Liu, Y.H.; Liu, G.; Jiang, E.H. Morphological effects of the operation of Xiaolangdi Reservoir on the Lower Yellow River in recent years. J. Hydraul. Eng. 2024, 55, 505–515. [Google Scholar]
  14. Collier, M.; Webb, R.H.; Schmidt, J.C. Dams and Rivers: A Primer on the Downstream Effects of Dams; US Department of the Interior, US Geological Survey: Denver, CO, USA, 1996; Volume 1126.
  15. Stecca, G.; Zolezzi, G.; Hicks, D.M.; Surianc, N. Reduced braiding of rivers in human-modified landscapes: Converging tra-jectories and diversity of causes. Earth-Sci. Rev. 2019, 188, 291–311. [Google Scholar] [CrossRef]
  16. Brenna, A.; Surian, N.; Mao, L. Response of a gravel-bed river to dam closure: Insights from sediment transport processes and channel morphodynamics. Earth Surf. Process. Landf. 2020, 45, 756–770. [Google Scholar] [CrossRef]
  17. Germanovski, D.; Ritter, D.F. Tributary response to local base level lowering below a dam. Regul. Rivers: Res. Manag. 1988, 2, 11–24. [Google Scholar] [CrossRef]
  18. Casado, A.; Peiry, J.L.; Campo, A.M. Geomorphic and vegetation changes in a meandering dryland river regulated by a large dam, Sauce Grande River, Argentina. Geomorphology 2016, 268, 21–34. [Google Scholar] [CrossRef]
  19. Chen, J.X.; Jiang, R.F.; Chen, Y. Evaluation on the health of river ecosystem under the cascade development of reservoirs. J. Hydraul. Eng. 2015, 46, 334–340. [Google Scholar]
  20. Li, Z.; Chen, Y.B.; Li, C.; Guo, J.S.; Xiao, Y.; Lu, L.H. Advances of Eco-environmental Effects and Adaptive Management in River Cascading Development. Adv. Earth Sci. 2018, 33, 675–686. [Google Scholar] [CrossRef]
  21. Kuang, W.H.; Du, G.M.; Lu, D.S.; Dou, Y.Y.; Li, X.Y.; Zhang, S.; Chi, W.F.; Dong, J.W.; Chen, G.S.; Yin, Z.R.; et al. Global observation of urban expansion and land-cover dynamics using satellite big-data. Sci. Bull. 2020, 66, 297–300. [Google Scholar] [CrossRef]
  22. Serafim-junior, M.; Lansac-tôha, F.A.; Lopes, R.M.; Perbiche-Neves, G. Continuity effects on rotifers and microcrustaceans caused by the construction of a downstream reservoir in a cascade series (Iguaçu River, Brazil). Braz. J. Biol. 2016, 76, 279–291. [Google Scholar] [CrossRef]
  23. Han, B.; Zhang, C.; Gao, Y.N.; Ying, Y.M.; Tian, S.M.; Zou, Q.Y.; Zhao, L.D.; Jing, Y.C. A study on the ecological effects of water and sediment regulation by Xiaolangdi Reservoir. Sci. Sin. (Technol.) 2025, 55, 968–979. [Google Scholar] [CrossRef]
  24. Hu, C.H. Changes in runoff and sediment loads of the Yellow River and its management strategies. J. Hydroelectr. Eng. 2016, 35, 1–11. [Google Scholar]
  25. Wang, G.Q.; Zhong, D.Y.; Wu, B.S. Future trend of Yellow River sediment changes. China Water Resour. 2020, 1, 9–12+32. [Google Scholar]
  26. Wang, H.; Yang, Z.; Saito, Y.; Liu, J.P.; Sun, X.; Wang, Y. Stepwise decreases of the Huanghe (Yellow River) sediment load (1950–2005): Impacts of climate change and human activities. Glob. Planet Change 2007, 57, 331–354. [Google Scholar] [CrossRef]
  27. Deng, A.J.; An, C.G.; Chen, J.G.; Tang, Y. Channel evolution and systematic governance of lower Yellow River after the op-eration of Xiaolangdi Reservoir. Water Resour. Dev. Res. 2025, 25, 1–9+32. [Google Scholar]
  28. Zhang, J.; Che, X.; Jia, G.C.; Tian, C.F.; Chen, X.L. Effects of artificial dams on hydrodynamic characteristics of fish habitats in upper reaches of Yangtze River. Trans. Chin. Soc. Agric. Eng. (Trans. CSAE) 2021, 37, 140–146. [Google Scholar] [CrossRef]
  29. Liu, H.B.; Jian, H.R. Investigation on fish resources in the lower reaches of the Yellow River. J. Anhui Agric. Sci. 2019, 47, 110–112, 131. [Google Scholar]
  30. Baiyin, B.L.G.; Chen, X.R. Research progress of impacts of sediment flushing on downstream fish. J. Sediment. Res. 2012, 12, 74–80. [Google Scholar]
  31. Zhai, G.; Ren, P.; Zhang, R.H.; Wang, B.; Zhang, M.X.; He, T.T.; Zhang, J.L. Evaluation of land ecological security and driving factors in the Lower Yellow River Flood Plain based on quality, structure and function. Sci. Rep. 2025, 15, 2674. [Google Scholar] [CrossRef]
  32. Fu, X.D.; Jiang, L.W.; Wu, B.S.; Hu, C.H.; Wang, G.Q.; Fei, X.J. Sediment delivery ratio and its uncertainties on flood event scale: Quantification for the Lower Yellow River. Sci. Sin. (Technol.) 2010, 40, 349–357. [Google Scholar] [CrossRef]
  33. Zhang, Y.Y.; Wu, B.S.; Fu, X.D. Characteristics of sediment transport by flood events in the lower Yellow River. J. Hydroelectr. Eng. 2012, 31, 70–76. [Google Scholar]
  34. Bussi, G.; Dadson, S.J.; Bowes, M.J.; Whitehead, P.G. Seasonal and interannual changes in sediment transport identified through sediment rating curves. J. Hydrol. Eng. 2017, 22, 06016016. [Google Scholar] [CrossRef]
  35. Qian, N.; Zhang, R.; Li, J.F.; Hu, W.D. A perliminary study on the mechanism of self-regulation of sediment transport capacity in the Lower Huang He (The Yellow River). Acta Geogr. Sin. 1981, 2, 143–156. [Google Scholar]
  36. Han, Q.W. Some rules of sediment transportation and deposition-scouring in the Lower Yellow River. J. Sediment. Res. 2004, 3, 1–13. [Google Scholar]
  37. Liang, Z.Y.; Liu, J.X.; Zhang, H.J. Investigation on the sedimentation relation between the upper and lower reaches from the flow-sediment combination in the lower Yellow River. J. Sediment. Res. 2004, 4, 15–19. [Google Scholar]
  38. Xu, J.X. Study on high-efficient sediment-transporting floods in the Lower Yellow River. J. Sediment. Res. 2009, 6, 54–59. [Google Scholar]
  39. Cheng, Y.F.; Xia, J.Q.; Zhou, M.R.; Wang, Y.Z. Response of sediment delivery ratio to the incoming flow-sediment regime and channel geometry in the braided reach of the Lower Yellow River. Acta Geogr. Sin. 2021, 76, 127–138. [Google Scholar] [CrossRef]
  40. Li, X.P.; Tian, Y.; Zhang, C.P.; Wang, F.Y. Study on characteristics of flood scour and fill and high efficient sediment transport of the Lower Yellow River. J. Sediment. Res. 2024, 49, 34–41. [Google Scholar]
  41. Wu, B.S.; Zhang, Y.F. Analysis on sediment transport in the Lower Yellow River. J. Sediment. Res. 2007, 1, 30–35. [Google Scholar]
  42. Fei, X.J.; Fu, X.D.; Zhang, R. Study on sediment delivery ratio rate of silting and characteristic of sediment transport of the Lower Yellow River channel. Yellow River 2009, 31, 6–8+11+132. [Google Scholar]
  43. Jie, Z.L.; Zhu, W.J. Research on the impact and countermeasures of water and sediment adjustment in Xiaolangdi Reservoir on fishery resources in the lower Yellow River. Henan Fish. 2010, 1, 7–9. [Google Scholar]
  44. Cong, X.R.; Li, X.Q.; Dong, G.C.; Sun, L.F.; Ke, H.; Ren, Y.P. Fish community pattern and diversity affected by water and sediment regulation in Shandong section of the Yellow River. Acta Hydrobiol. Sin. 2024, 48, 889–900. [Google Scholar]
  45. Wang, Y.Z.; Xia, J.Q.; Deng, S.S.; Zhou, M.R.; Wang, Z.H.; Xu, X.Z. Numerical simulation of bank erosion and accretion in a braided reach of the Lower Yellow River. Catena 2022, 217, 106456. [Google Scholar] [CrossRef]
  46. Zhang, G.M.; Wang, P.; Geng, X.; Shen, G.Q.; Zhang, Y.F. Bed form morphology in transitional reaches of the lower Yellow River and its influence on movable bed resistance. J. Lake Sci. 2025, 37, 1059–1069. [Google Scholar] [CrossRef]
  47. Niu, Y.G.; Li, Y.Q.; Zhang, J.P. Discussion on construction of river training engineering of the Lower Yellow River under the new situation. Yellow River 2024, 46, 39–41+78. [Google Scholar]
  48. Liu, Y.C.; Xia, J.Q.; Zhou, M.R.; Cheng, Y.F.; Deng, S.S.; Miao, C.Y. Response of braiding intensity in a braided reach of the Lower Yellow River to upstream damming. Glob. Planet. Change 2025, 253, 104911. [Google Scholar] [CrossRef]
  49. Wu, W.; Dong, Y.H.; Li, C.; Chen, H.; Ren, L.; Xu, S. Vertical distribution characteristics and source apportionment of nitrogen in the Longyangxia Reservoir in the upper reaches of the Yellow River. PLoS ONE 2025, 20, e0326038. [Google Scholar] [CrossRef]
  50. Liu, G.; Jiang, E.H.; Li, D.L.; Li, J.Y.; Wang, Y.J.; Zhao, W.J.; Yang, Z. Annual multi-objective optimization model and strategy for scheduling cascade reservoirs on the Yellow River mainstream. J. Hydrol. 2025, 659, 133306. [Google Scholar] [CrossRef]
  51. Li, G.Y. Regulation of water and sediment for the Yellow River based on joint operation of reservoirs and artificial interven-tion. J. Hydraul. Eng. 2006, 12, 1439–1446. [Google Scholar]
  52. Hydrology Bureau of the Ministry of Water Resources of the People’s Republic of China. Hydrological data of the Yellow River Basin. Hydrological Yearbook of the People’s Republic of China (1960–2023); Hydrology Bureau of Water Resources Ministry: Beijing, China, 2023.
  53. Yellow River Conservancy Commission of the Ministry of Water Resources. Yellow River Sediment Bulletin (2008–2023); Yellow River Conservancy Commission of the Ministry of Water Resources: Zhengzhou, China, 2023.
  54. Yellow River Conservancy Comission Institute of Hydraulics. Documented Data of Fluvial Processes of the Lower Yellow River; Yellow River Conservancy Comission Institute of Hydraulics: Zhengzhou, China, 1987.
  55. Chen, C.X.; Zhu, C.H.; Zhao, X.; Gao, X.; Luo, Q.S. Scouring and silting law of the Lower Yellow River and water and sediment regulation indicators after the regulation of Xiaolangdi Reservoir. Adv. Water Sci. 2024, 35, 606–616. [Google Scholar]
  56. Liu, J.X.; Liu, H.Z.; Fu, J.; Li, B.G.; Li, R.R. Water-Sediment Classification Management in the Middle and Lower Reaches of the Yellow River; The Yellow River Water Conservancy Press: Zhengzhou, China, 2020. [Google Scholar]
  57. Xu, H.J.; Liang, D.; Li, Y.; Huang, Z.; Liu, J.Z.; Bai, Y.C. Threshold of efficient sediment transport based on boundary resistance energy dissipation and river bed stability index. J. Hydrol. 2025, 661, 133840. [Google Scholar] [CrossRef]
  58. Zhou, M.R.; Xia, J.Q.; Deng, S.S.; Li, Z.W. Sediment transport capacity of low sediment-laden flows. J. Hydraul. Res. 2022, 60, 996–1008. [Google Scholar] [CrossRef]
  59. Song, X.L.; Zhong, D.Y.; Xu, H.J.; Bai, Y.C.; Zhang, J.L. Stable diffusion-evolution tendencies of the Lower Yellow River corridor during floods in the 21st century. J. Hydrol. 2024, 638, 131449. [Google Scholar] [CrossRef]
  60. Hu, R.N. Analysis of water and sediment runoff in Yellow River and adjustment in lower reaches during 1981–1985. Yellow River 1986, 4, 8–11. [Google Scholar]
  61. Sheng, G.Q.; Zhang, Y.F.; Wang, P.; Zhang, G.M. Impacts of sediment flushing of Xiaolangdi Reservoir on fluvial processes in the Lower Yellow River. Adv. Water Sci. 2024, 35, 927–937. [Google Scholar]
  62. Qi, P.; Qi, H.H.; Sun, Z.Y.; Zhang, Y.F. Cross-section geometry and sediment transport characteristics of Lower Yellow River. J. Sediment. Res. 2010, 6, 9–15. [Google Scholar]
  63. Allen, D.C.; Datry, T.; Boersma, K.S.; Bogan, M.T.; Boulton, A.J.; Bruno, D.; Busch, M.H.; Costigan, K.H.; Dodds, W.K.; Fritz, K.M.; et al. River ecosystem conceptual models and non-perennial rivers: A critical review. Wiley Interdiscip. Rev.-Water 2020, 7, e1473. [Google Scholar] [CrossRef]
  64. Petsch, D.K.; Cionek, V.D.; Thomaz, S.M.; dos Santos, N.C.L. Ecosystem services provided by river-floodplain ecosystems. Hydrobiologia 2023, 850, 2563–2584. [Google Scholar] [CrossRef]
  65. Pan, M.Q.; Guo, Y.F.; Wang, L.P. River regulation scheme for Jiubao-Weitan reach of lower Yellow River. Yellow River 2019, 41, 34–36. [Google Scholar]
  66. Wang, R.L.; Huang, J.H.; Ge, L.; Feng, H.J.; Li, R.N. Study of ecological flow based on the relationship between cyprinusy carpio habitat hydrological and ecological response in the lower Yellow River. J. Hydraul. Eng. 2020, 51, 1175–1187. [Google Scholar]
  67. Zhang, D.R.; Liang, Z.Y. Review of studies on relation between channel silting and water diversion of the Lower Yellow River. J. Sediment. Res. 1995, 2, 32–42. [Google Scholar]
  68. Zhao, Y.A.; Zhou, W.H. Summary on “basic development law and prospect prediction of the lower reaches of the Yellow River”. Yellow River 1996, 9, 4–9+61. [Google Scholar]
  69. Leopold, L.B.; Maddock, T. The hydraulic geometry of stream channels and some physiographic implications. United States Geol. Surv. Prof. Pap. 1953, 252, 57. [Google Scholar]
  70. Knighton, A.D. Variations in at-a-station hydraulic geometry. Am. J. Sci. 1975, 275, 186–218. [Google Scholar] [CrossRef]
  71. Fei, X.J.; Shu, A.P.; Wang, L. Quantifying geometric relation and suspended sediment transport in the Lower Yellow River. J. Hydraul. Eng. 2025, 56, 739–746. [Google Scholar]
  72. Zhang, C.J.; Zhang, M.; Yao, W.Y.; Li, Y.; Ma, D.F. Mainstream swing rule and its driving mechanism in the Sanguanmiao to Weitan reach of the Lower Yellow River. J. Basic Sci. Eng. 2023, 31, 1110–1124. [Google Scholar]
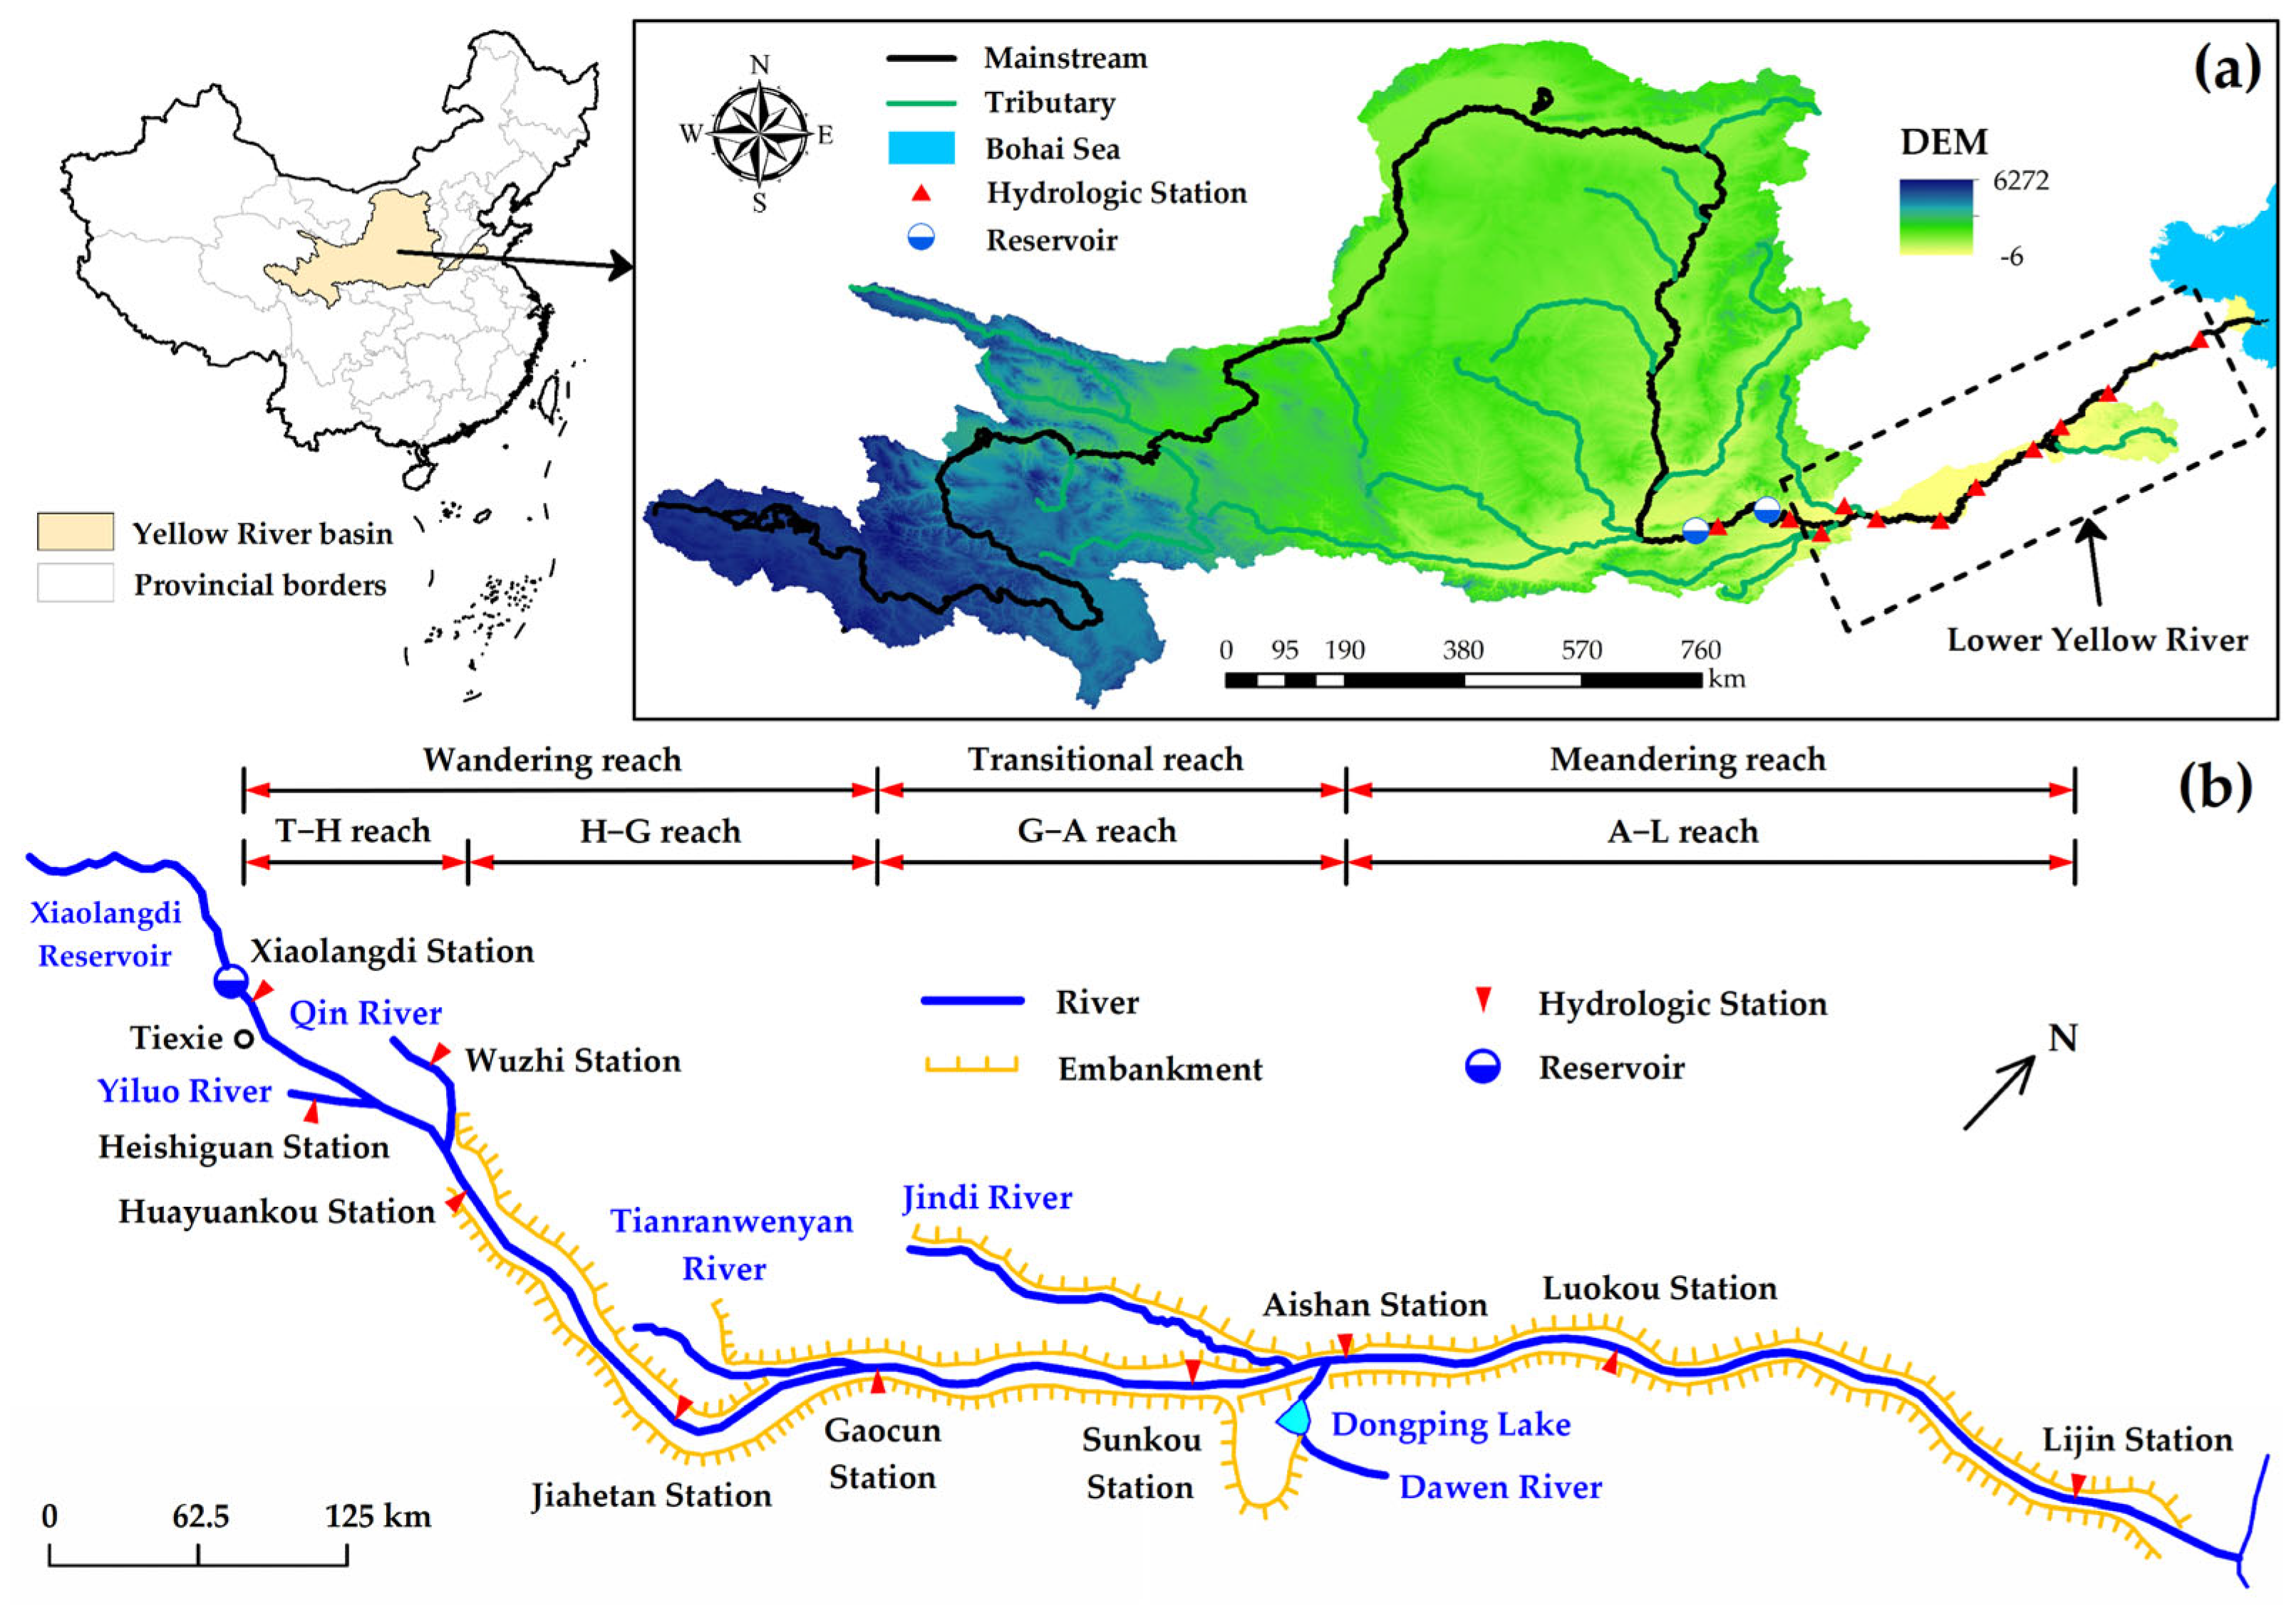
Figure 1. The location of the study area. (a) The Yellow River Basin. (b) Schematic of the LYR.
Sustainability 17 08136 g001
Figure 2. Water–sediment processes of flood events entering the LYR. (a) Water load. (b) Sediment load. (c) Average flow discharge. (d) Average sediment concentration.
Sustainability 17 08136 g002
Figure 3. Proportion of flow discharge and corresponding sediment concentration ranges of flood events entering the LYR. (a) Proportion of flow discharge ranges. (b) Proportion of sediment concentration ranges.
Sustainability 17 08136 g003
Figure 4. Spatiotemporal variation in SDR during flood events. (a) Tiexie-Huayuankou reach. (b) Huayuankou-Gaocun reach. (c) Gaocun-Aishan reach. (d) Aishan-Lijin reach. (e) Tiexie-Lijin reach.
Sustainability 17 08136 g004
Figure 5. Variation in water–sediment factors in different reaches. (a) Average flow discharge. (b) Average sediment concentration. (c) Incoming sediment coefficient. (d) Water load variation coefficient.
Sustainability 17 08136 g005
Figure 6. Comparison of measured versus calculated SDR values in the Tiexie to Lijin reach. (a) 1960−1999. (b) 2000−2023.
Sustainability 17 08136 g006
Figure 7. Relationship of the incoming sediment coefficient with the SDR across various river reaches during flood events. (a). Tiexie-Huayuankou during 1960~1999. (b) Tiexie-Huayuankou during 2000~2023. (c) Huayuankou-Gaocun during 1960~1999. (d) Huayuankou-Gaocun reach during 2000~2023. (e) Gaocun-Aishan during 1960~1999. (f) Gaocun-Aishan during 2000~2023. (g) Aishan-Lijin during 1960~1999. (h) Aishan-Lijin during 2000~2023.
Sustainability 17 08136 g007aSustainability 17 08136 g007b
Figure 8. Relationship of the incoming sediment coefficient with the SDR during flood events prior to and following the construction of the Xiaolangdi Reservoir. (a) Tiexie–Huayuankou reach. (b) Huayuankou–Gaocun reach. (c) Gaocun–Aishan reach. (d) Aishan–Lijin reach. (e) Typical reaches during 1960–1999. (f) Typical reaches during 2000–2023.
Sustainability 17 08136 g008aSustainability 17 08136 g008b
Figure 9. Duration of flood events at different flow discharges.
Sustainability 17 08136 g009
Figure 10. Median particle diameter of suspended sediment.
Sustainability 17 08136 g010
Figure 11. Duration of flood events with different ranges of sediment concentration.
Sustainability 17 08136 g011
Figure 12. Boundary conditions of Tiexie to Huayuankou reach. (a) Bankfull width−to−depth ratio. (b) Median particle diameter of bed sediment. (c) River gradient.
Sustainability 17 08136 g012
Figure 13. Reach from Sanguanmiao to Weitan in different periods.
Sustainability 17 08136 g013
Table 1. Pearson’s correlation coefficients between the SDR and water–sediment factors in different reaches.
Typical
Period
Water–Sediment
Conditions
Different Reaches
Tiexie-
Huayuankou
Huayuankou-
Gaocun
Gaocun-
Aishan
Aishan-
Lijin
Tiexie-
Lijin
1960~1999Average flow discharge0.0420.179 *0.415 **0.566 **0.131 **
Average sediment concentration−0.423 **−0.481 **−0.323 **−0.079 **−0.373 **
Incoming sediment coefficient−0.427 **−0.578 **−0.632 **−0.522 **−0.394 **
Water load variation coefficient0.0660.321 **0.663 **0.884 **0.243 **
2000~2023Average flow discharge0.0240.162 *0.401 **0.558 **0.121 **
Average sediment concentration−0.432 **−0.488 **−0.346 **−0.102 **−0.379 **
Incoming sediment coefficient−0.434 **−0.591 **−0.638 **−0.543 **−0.397 **
Water load variation coefficient0.0740.344 **0.612 **0.823 **0.284 **
NOTE: * indicates a statistically significant correlation at the 0.05 significance level (bilateral), and ** indicates a statistically significant correlation at the 0.01 significance level (bilateral).
Table 2. Parameters for fitting the equation relating SDRs to water–sediment conditions in different reaches of flood events.
Typical PeriodReachTheoretical Formulation ParameterR2
Kαβ − 1
1960~1999Tiexie−Huayuankou0.0651.604−0.5910.814
Huayuankou−Gaocun0.1461.395−0.4030.833
Gaocun−Aishan0.3031.296−0.2850.802
Aishan−Lijin0.3991.244−0.2270.836
Tiexie−Lijin0.0671.628−0.6430.786
2000~2023Tiexie−Huayuankou0.1371.417−0.4310.813
Huayuankou−Gaocun0.1731.369−0.3740.826
Gaocun−Aishan0.2391.351−0.3350.809
Aishan−Lijin0.2891.317−0.3090.867
Tiexie−Lijin0.1181.525−0.5130.831
Table 3. α + β values of each river reach prior to and following the construction of the Xiaolangdi Reservoir.
ReachTypical Period
1960~19992000~2023
Tiexie-Huayuankou2.0131.986
Huayuankou-Gaocun1.9921.995
Gaocun-Aishan2.0112.016
Aishan-Lijin2.0172.008
Tiexie-Lijin1.9852.012
Disclaimer/Publisher’s Note: The statements, opinions and data contained in all publications are solely those of the individual author(s) and contributor(s) and not of MDPI and/or the editor(s). MDPI and/or the editor(s) disclaim responsibility for any injury to people or property resulting from any ideas, methods, instructions or products referred to in the content.