Article

Precipitation Changes and Future Trend Predictions in Typical Basin of the Loess Plateau, China

1
State Key Laboratory of Soil Erosion and Dryland Farming on Loess Plateau, Institute of Soil and Water Conservation, Northwest A&F University, No. 26 Xinong Road, Xianyang 712100, China
2
Tianshui Experimental Station on Soil and Water Conservation, No. 60 Park Road, Tianshui 741000, China
3
Institute of Water Resources and Hydroelectric Engineering, Xi’an University of Technology, No. 5 South Jinhua Road, Xi’an 710048, China
4
GEOVIS Earth Technology Co., Ltd., Hefei 230000, China
5
Xi’an Mineral Resources Investigation Centre of the China Geological Survey, No. 66 West Fengqi Road, Xi’an 710048, China
6
Key Laboratory of Natural Resource Element Coupling and Effects, Ministry of Natural Resources, Natural Resources and Earth System Science, Beijing 100055, China
*
Author to whom correspondence should be addressed.
Sustainability 2025, 17(14), 6267; https://doi.org/10.3390/su17146267
Submission received: 28 May 2025 / Revised: 30 June 2025 / Accepted: 7 July 2025 / Published: 8 July 2025
(This article belongs to the Special Issue Ecological Water Engineering and Ecological Environment Restoration)

Abstract

This study analyzes precipitation patterns and future trends in the Kuye River Basin in the context of climate change, providing a scientific foundation for water resource management and ecological protection. Using methods such as the Mann–Kendall test, Pettitt test, and complex Morlet wavelet analysis, this study examines both interannual and intra-annual variability in historical precipitation data, identifying abrupt changes and periodic patterns. Future projections are based on CMIP5 models under RCP4.5 and RCP8.5 scenarios, forecasting changes over the next 30 years (2023–2052). The results reveal significant spatiotemporal variability in precipitation, with 88.16% concentrated in the summer and flood seasons, while only 1.07% falls in winter. The basin’s multi-year average precipitation is 445 mm, exhibiting stable interannual variability, but with a significant increase starting in 2006. Projections indicate that the average annual precipitation will rise to 524.69 mm from 2023 to 2052, with a notable change point in 2043. Precipitation is expected to increase spatially from northwest to southeast. This research underscores the importance of understanding precipitation dynamics in managing drought and flood risks. It highlights the role of soil and water conservation and vegetation restoration in improving water resource efficiency, supporting sustainable development, and guiding climate adaptation strategies.

1. Introduction

Precipitation is a vital component of the hydrological cycle, directly influencing the water resources of ecosystems, soil quality, and the development of human societies [1]. Climate forecasting plays a crucial role in understanding and responding to changes in precipitation, particularly in the context of challenges posed by climate change [2]. Accurate precipitation predictions not only assist governments and management agencies in formulating sound water resource management policies but also provide a scientific basis for agricultural production, urban planning, and ecological protection. As global climate change intensifies, the trends in precipitation are becoming increasingly complex. Therefore, a thorough investigation into the spatiotemporal characteristics of precipitation is essential to sustainable development at both regional and global scales [3].
Previous studies have extensively explored the spatiotemporal characteristics of precipitation, primarily from mathematical and statistical perspectives involving model construction and data analysis [4]. Although methods such as time series analysis, regression models, and climate simulations have elucidated the seasonal variations in precipitation within monsoon regions, these studies often overlook the complexity of climate change and its multiple influencing factors. Purely mathematical predictive methods lack a mechanistic understanding of changes in the climate system, which restricts the accuracy and reliability of precipitation forecasts [5]. Consequently, there is an urgent need to integrate an understanding of climatic mechanisms into mathematical models to more comprehensively assess trends in precipitation and their impacts.
Climate system models are the most important tools for studying the mechanisms of climate change and predicting future climate variability. Over the last several decades, significant advancements in climate modeling have been made through the collaborative efforts of scientists worldwide, leading to widespread applications [6,7,8]. The Coupled Model Intercomparison Project (CMIP), developed from the Atmospheric Model Intercomparison Project (AMIP), has undergone several phases, culminating in the initiation of the fifth phase, CMIP5, in September 2008 [9]. CMIP5 aims to address prominent scientific issues that arose during the IPCC’s fourth assessment process. Compared to CMIP3, this phase incorporates interdecadal near-term forecasting experiments and has undergone substantial improvements based on SRES (Special Report on Emissions Scenarios) scenarios, employing more reasonable parameterization schemes, flux handling methods, and coupling technologies to enhance the simulation and predictive capabilities of climate models, thereby deepening the mechanistic understanding of climate system changes [10].
The Kuye River Basin, as a typical continental monsoon climate zone, exhibits unique precipitation characteristics, with rainfall concentrated primarily during the summer and flood season, leading to a highly uneven spatiotemporal distribution of water resources within the basin. Therefore, an in-depth study of precipitation characteristics in the Kuye River Basin not only aids in revealing the hydrological dynamics of the region but also provides an essential reference for understanding precipitation patterns in similar climatic zones. CMIP5 climate models are widely used in global climate change research [11]. However, current studies on climate change in the Kuye River Basin are mostly focused on the combined effects of precipitation, runoff, and human activities, with few studies using CMIP5 for precipitation forecasting. Analyzing the precipitation variations in the Kuye River Basin using CMIP5 can offer an empirical foundation for scientifically devising water resource management strategies and ecological protection measures, thereby promoting regional sustainable development and environmental protection.

2. Materials and Methods
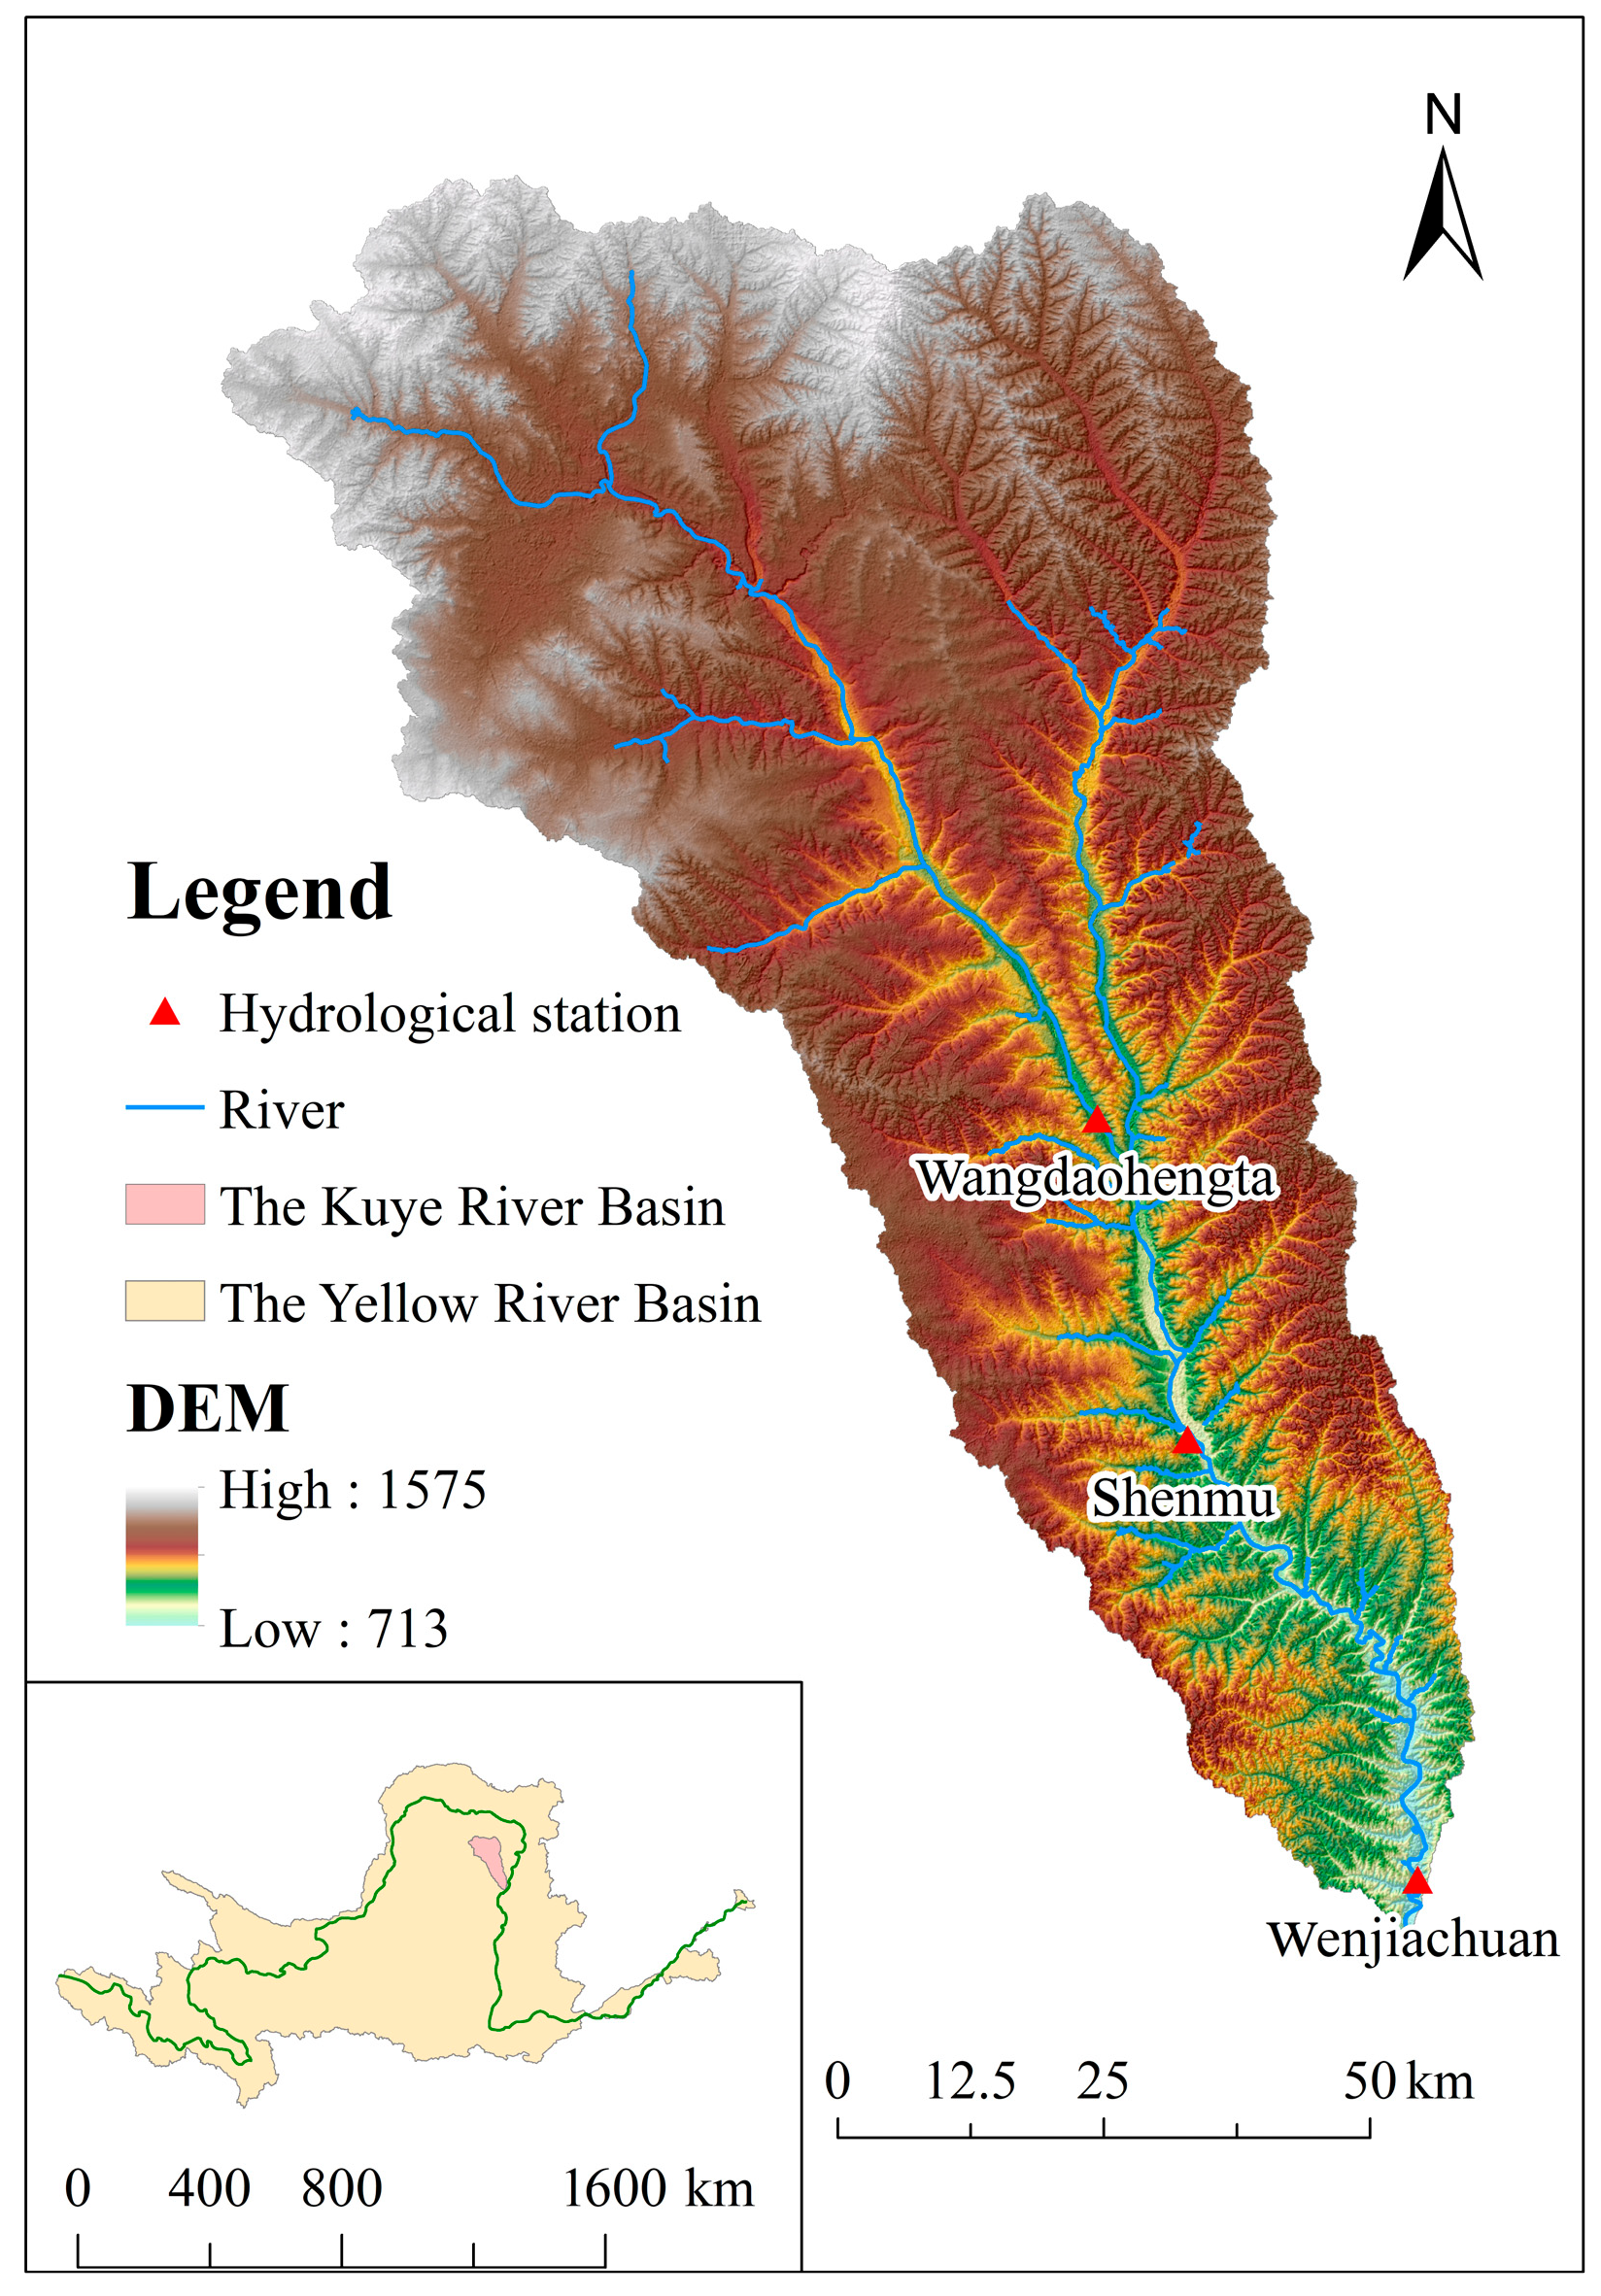
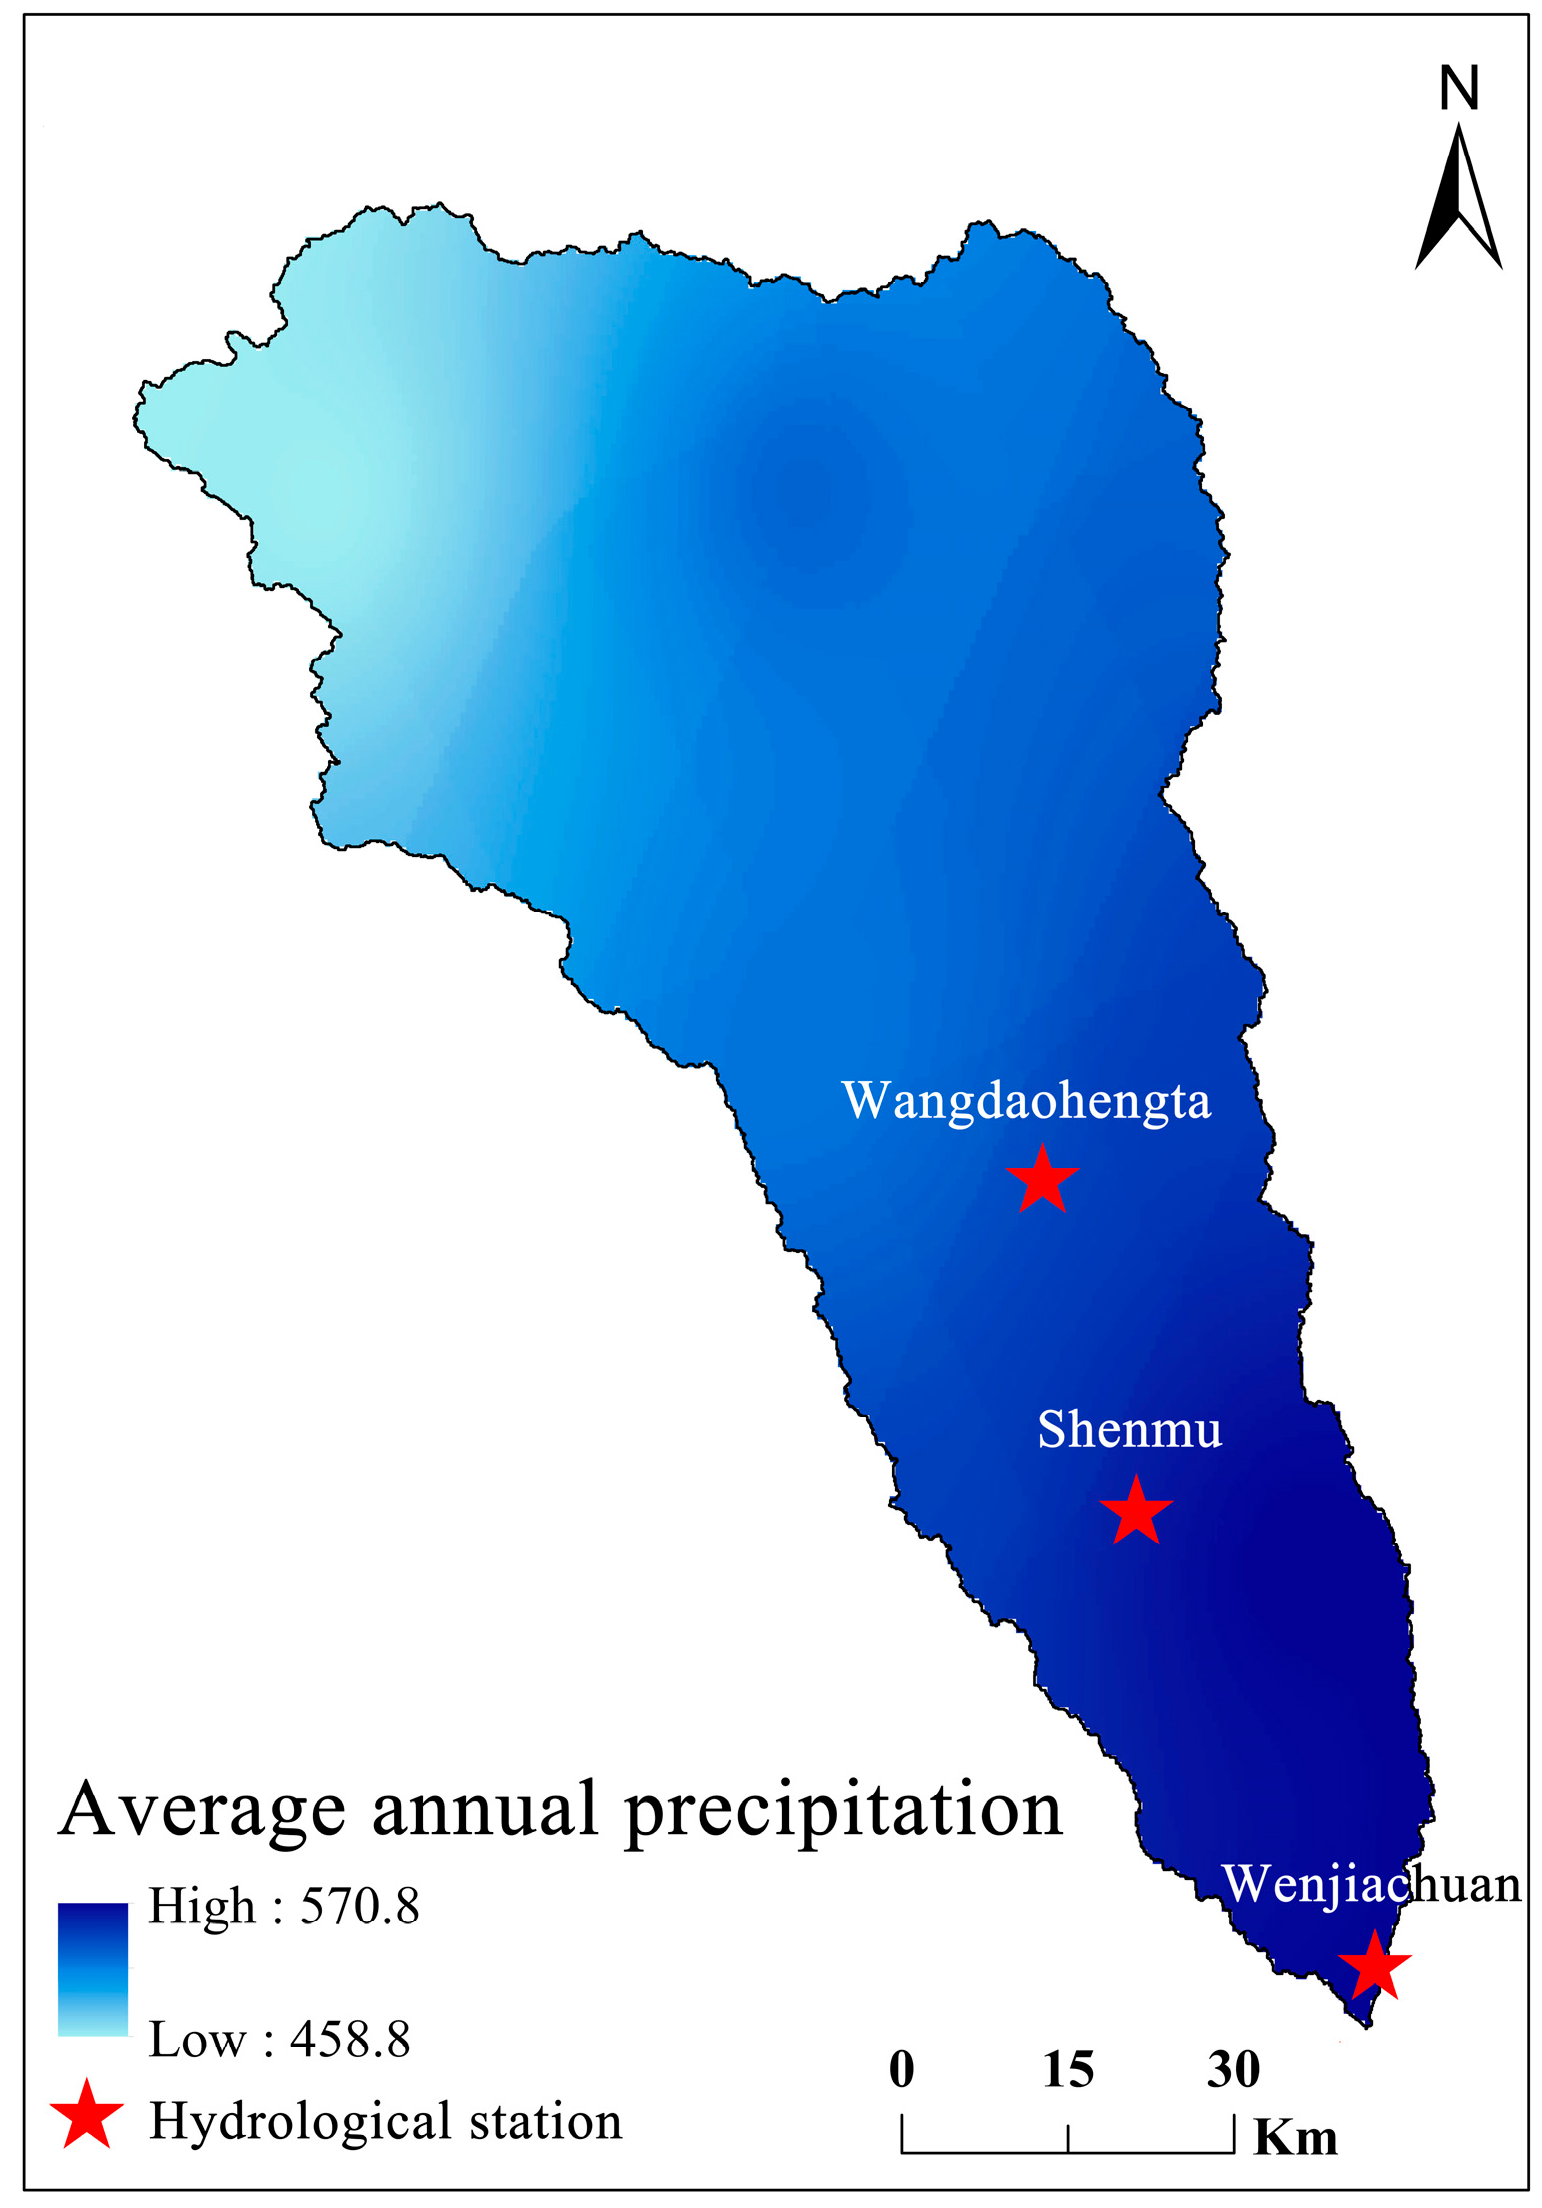
2.1. Study Area

The Kuye River Basin is located in northwestern China, spanning both Shaanxi Province and the Inner Mongolia Autonomous Region, and lies in the central part of the Loess Plateau. Covering an area of approximately 3471 square kilometers, the river flows from south to north into the Yellow River, serving as one of its significant tributaries (Figure 1).
The basin exhibits a temperate continental climate, marked by distinct seasonal variations. The average annual precipitation ranges from 400 to 500 mm, with the majority occurring during the summer months, often manifesting as intense rainfall events. This seasonal concentration of precipitation significantly exacerbates soil erosion issues in the region. The mean annual temperature in the basin typically falls between 9 °C and 11 °C, resulting in cold winters and hot summers. Additionally, the region experiences high evaporation rates, leading to low water resource utilization efficiency. The annual streamflow is markedly influenced by seasonal variations, with peak flows observed during the summer and considerably reduced flows observed in winter. This pronounced seasonal variation underscores the basin’s hydrological dynamics and the challenges associated with water resource management.
The Kuye River Basin is primarily characterized by a complex topography dominated by loess hills and gullies, with steep slopes and a north-to-south gradient in elevation. The loess layer is thick and loose, rendering it highly susceptible to erosion. The soil types in the basin are mainly loessial, exhibiting moderate fertility but weak erosion resistance. The vegetation is representative of a transitional zone between temperate grasslands and desert steppe, with relatively low coverage, primarily consisting of shrubs and herbaceous plants. While recent reforestation initiatives have led to some recovery in vegetative cover, the overall vegetation status remains insufficient to effectively mitigate soil erosion in the region.

2.2. Data Sources

Rainfall data were obtained from the Yellow River Basin Hydrological Yearbook. Daily precipitation data were collected from three hydrological stations in the Kuyue River Basin between 1960 and 2019: Wangdaohengta, Shenmu, and Wengjiachuan.

2.3. Methodology for Calculating Ecological Building Potential

1.
Analysis of Precipitation Change Characteristics
Precipitation characteristics within a watershed often exhibit temporal variability, which can generally be categorized into interannual and intra-annual variations. The former reflect changes in the total precipitation over time, while the latter capture the distribution of precipitation elements within a given year. Established methodologies exist for the trend analysis of time series data, with common statistical methods including moving averages, trend regression tests, Mann–Kendall tests, and rescaled range (R/S) analysis. Given that a single precipitation series is a classic example of a time series, this study employs trend regression tests and Mann–Kendall tests to assess the trend in watershed precipitation data. The trend regression test not only determines the linear trend in precipitation but also provides the rate of increase or decrease over the study period, while the Mann–Kendall test [12] serves as a means of complementary verification for trend detection.
The trend regression test uses the year as the independent variable and specific precipitation elements as the dependent variable, applying the least-squares method to derive the sample regression curve. The goodness of fit between the sample and the regression curve is reflected by the coefficient of determination and the adjusted coefficient of determination, while an F-test is conducted for the significance testing of the overall linear trend. A positive or negative regression coefficient indicates an upward or downward trend, respectively; when the coefficient equals zero, the series is deemed trendless. The Mann–Kendall test assesses the correlation between variables through the ranks of the time series, thereby mitigating the influence of outliers and facilitating an objective determination of temporal trends. The test utilizes the Z-value for trend analysis, where positive (negative) values indicate an upward (downward) trend, with the statistic Z following a standard normal distribution.
Due to the inherent limitations of various methods for identifying abrupt changes in time series data, discrepancies often arise in the detected change points when relying solely on one method. In this study, the cumulative deviation method is initially employed to ascertain periods of change in watershed precipitation, followed by the application of the Pettitt test [13,14], ordered clustering method [15], and sliding t-test [16] to confirm these change points. Additionally, complex Morlet wavelet analysis [17] is utilized to identify periodicity in hydrological sequences. The complex Morlet wavelet, characterized by its continuity and the simultaneous presence of both imaginary and real components, effectively eliminates spurious oscillations while reflecting the phase and amplitude. Consequently, it is commonly applied in the analysis of hydrological sequence periodicity. This method treats the hydrological sequence as a given signal and performs continuous wavelet transformation (CWT) to obtain corresponding wavelet coefficients, thereby analyzing the time–frequency characteristics of the hydrological sequence.
2.
Future Precipitation Change Patterns and Trends
This study utilizes future precipitation data from four climate models included in CMIP5: HadGEm3-RA, YSU-RSM, SNU-MM5, and RegCM. Each climate model encompasses two Representative Concentration Pathways (RCPs): RCP4.5 (moderate-emission scenario) and RCP8.5 (high-emission scenario). The analysis is based on these eight future climate scenarios.
Given the varying applicability of different climate models, it is essential to select those that align with the actual climatic conditions of the Kuye River Basin. To more accurately reflect future precipitation in the basin, the inverse distance weighting method is employed to interpolate the eight future climate scenarios. This approach calculates the basin-averaged precipitation for the years 2006–2019 under each model. The interpolated values are then compared with the observed multi-year average precipitation for the Kuye River Basin. The selection of climate models and emission scenarios is determined using absolute errors and percentage biases.
From Table 1, it can be observed that the multi-year average of the measured precipitation in the Kuye River Basin from 2006 to 2019 exhibits the smallest error when compared to the simulated multi-year average precipitation values from the HadGEm3-RA climate model under the RCP8.5 high-emission scenario. Therefore, the future precipitation predicted under the HadGEm3-RA climate model and the RCP8.5 high-emission scenario is selected for forecasting precipitation in the Kuye River Basin.

3. Results and Analyses

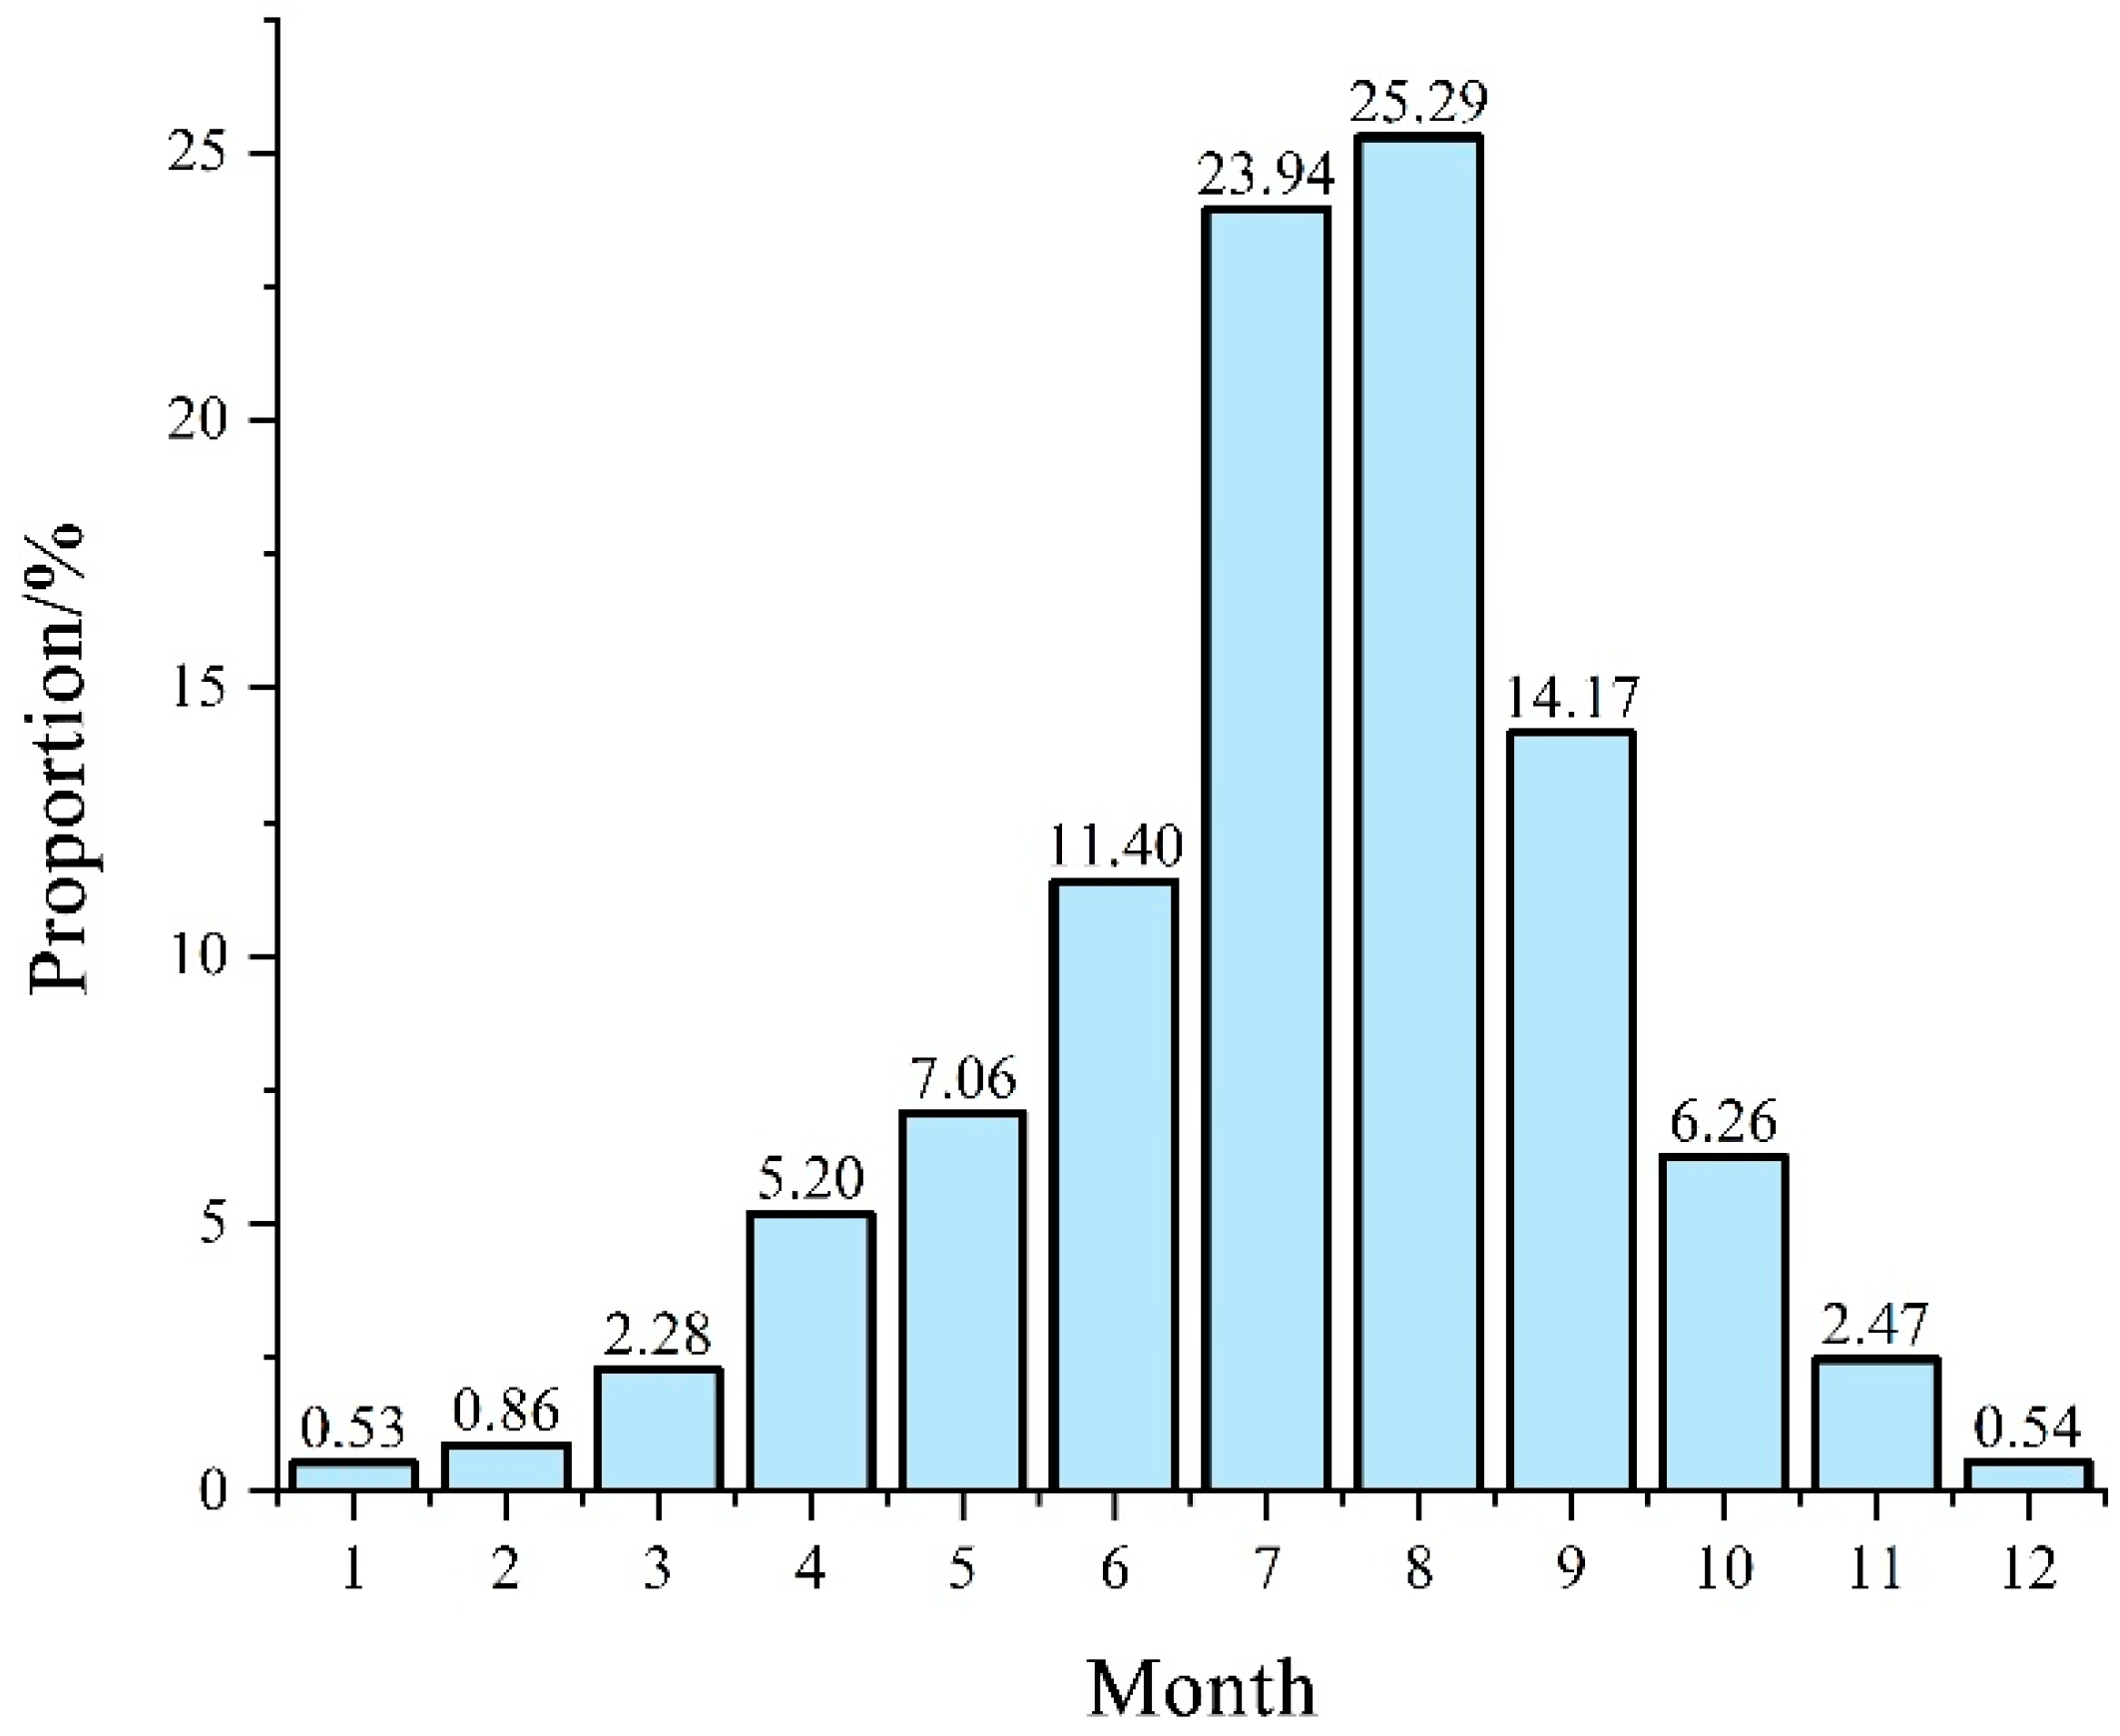
3.1. Intra-Annual Variation Characteristics of Precipitation

According to climatic characteristics, the Kuye River Basin is divided by month into spring (March to May), summer (June to August), autumn (September to November), winter (December to February of the following year), the wet season (May to October), and the dry season (November to April of the following year). An analysis of precipitation variation during each time period in the Kuye River Basin is presented in Table 2.
According to Table 2 and Figure 2, the maximum monthly precipitation at the Wenjiachuan Hydrological Station occurs in July and August, with the total precipitation for these two months accounting for 49.23% of the annual total. Conversely, the minimum monthly precipitation is observed in December and January, representing only 1.07% of the annual total. Summer precipitation constitutes 60.62% of the total annual precipitation, while flood season precipitation accounts for 88.16%, significantly exceeding the precipitation during the non-flood season. Overall, the Kuye River Basin exhibits substantial intra-annual variability in precipitation, with a coefficient of variation of 1.00, demonstrating distinct characteristics in flood and non-flood periods. The primary sources of precipitation in the basin are summer and flood season rains. This pattern is largely attributable to the continental monsoon climate influencing the Kuye River Basin, characterized by dry and less rainy springs, early frost in autumn, and cold winters with little snow and scarce precipitation, while summer often brings heavy rainfall concentrated from April to October.

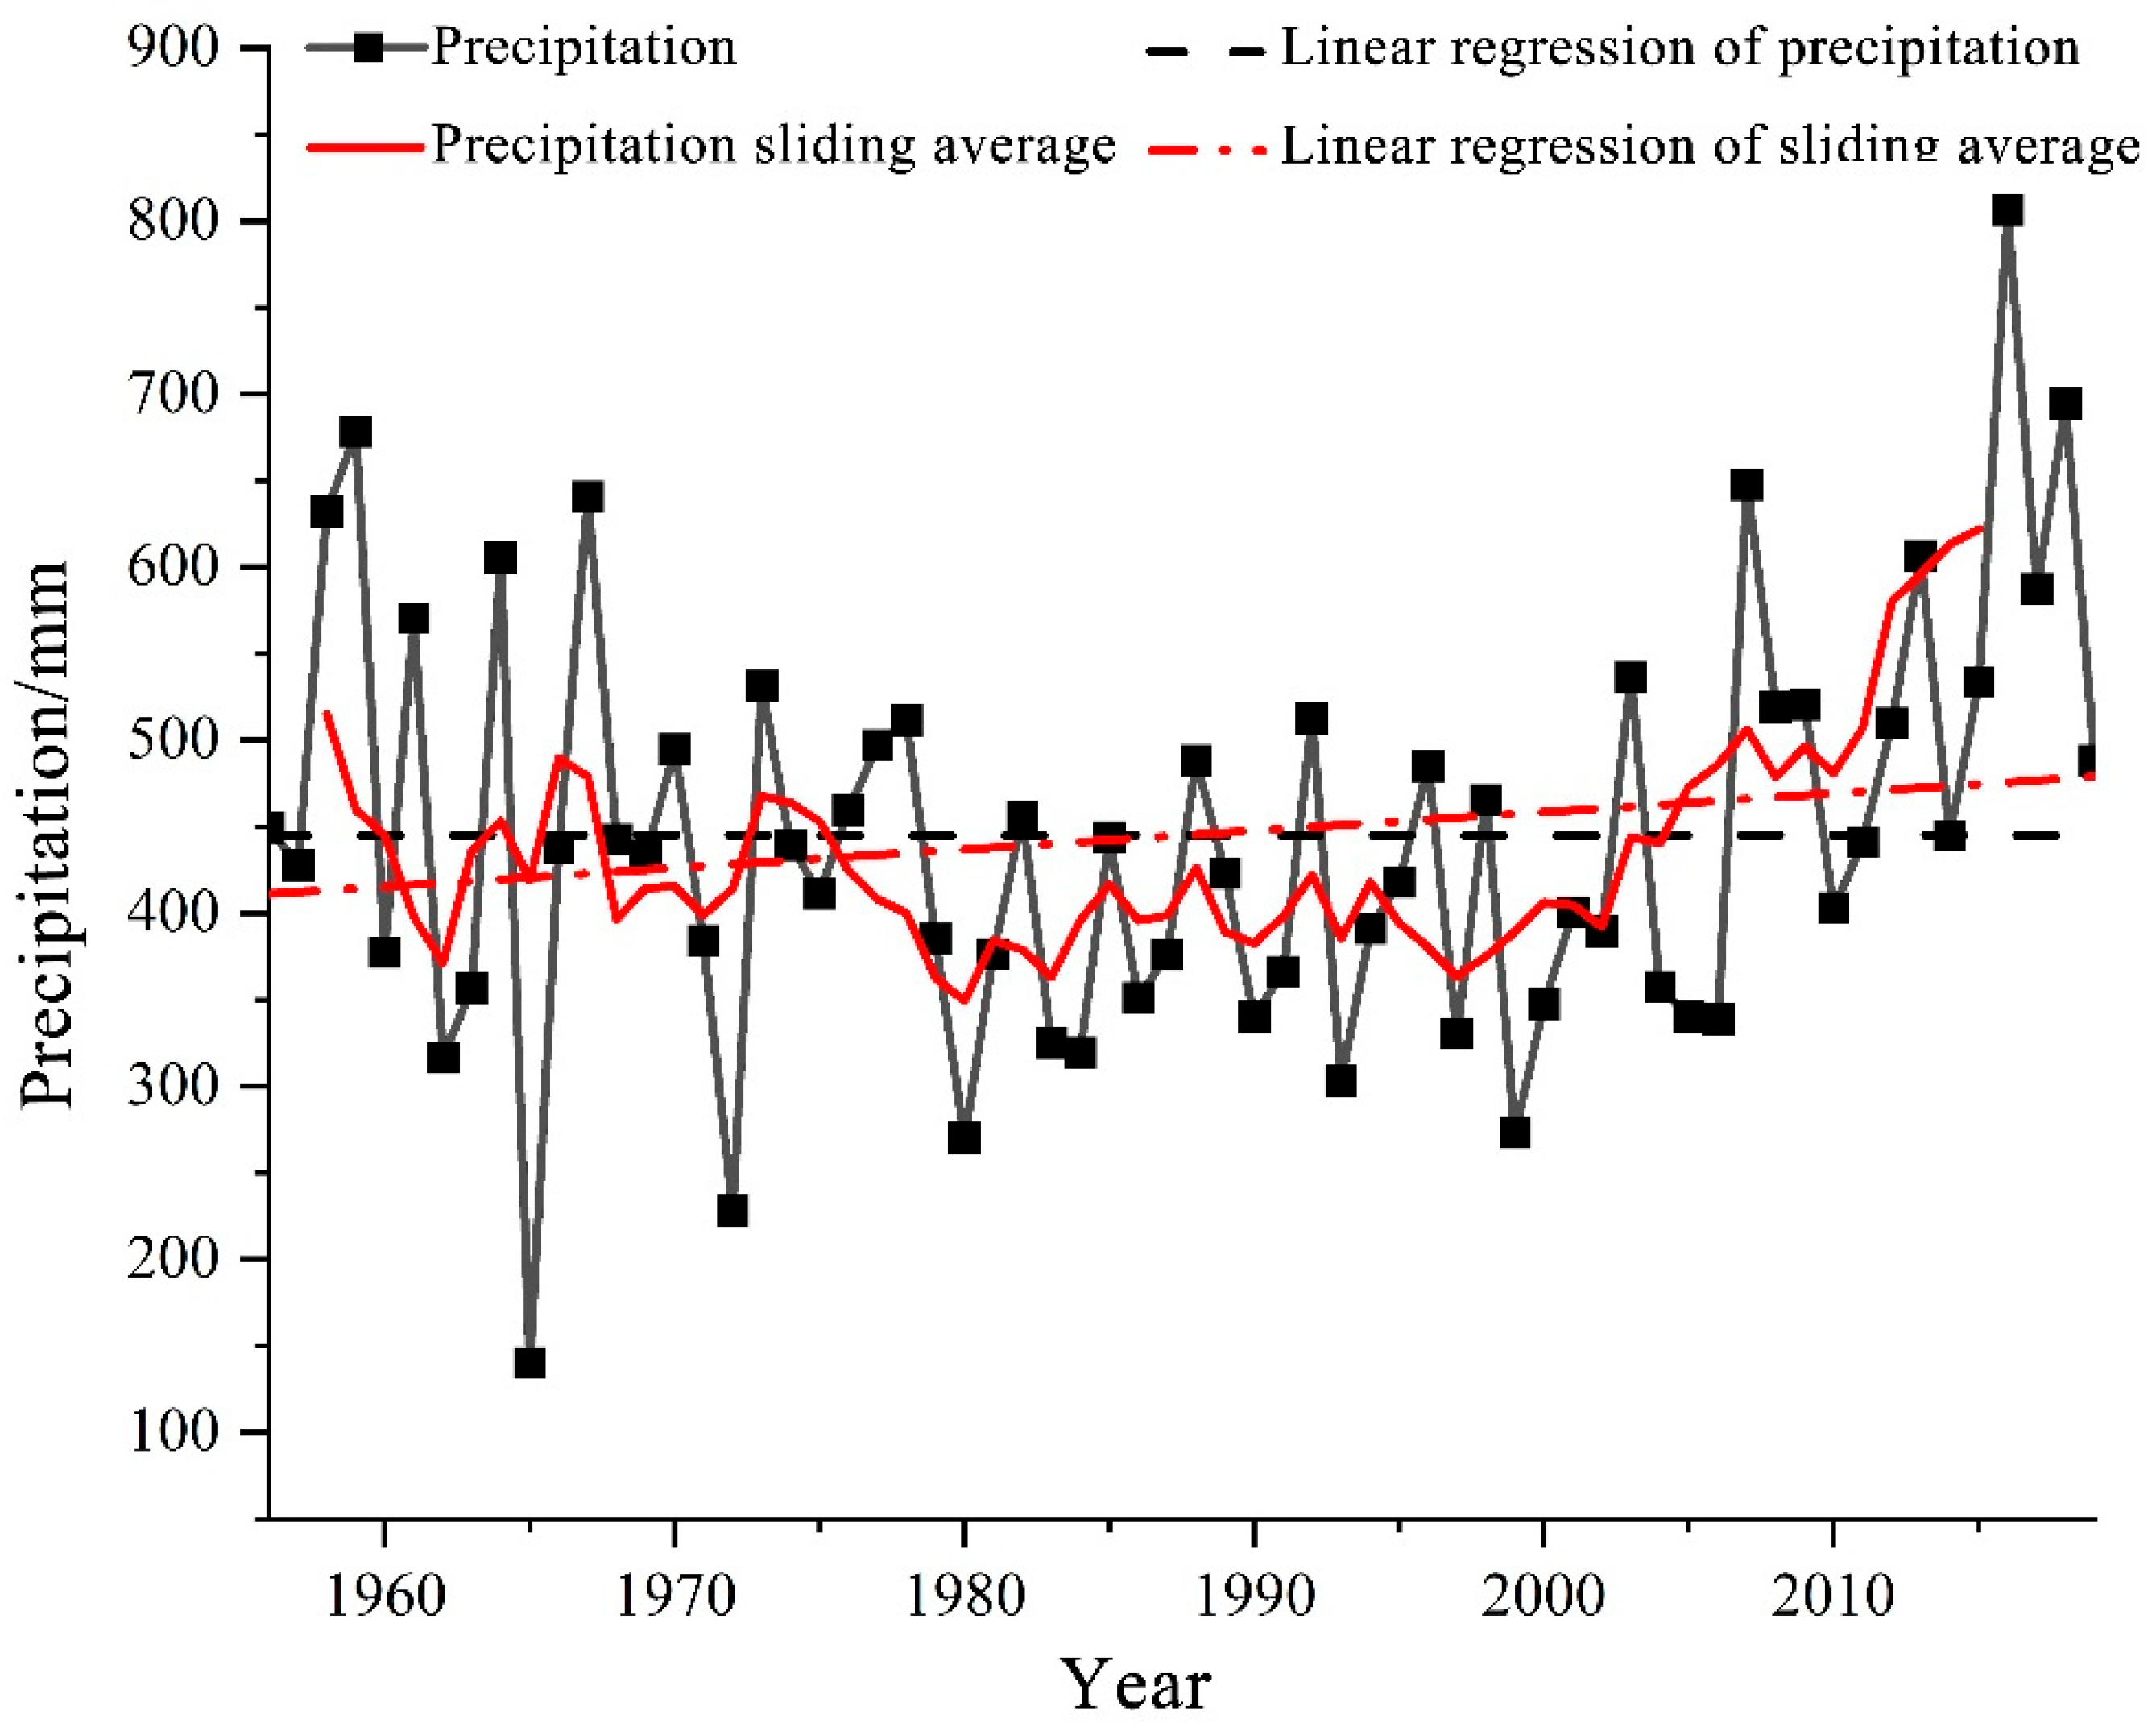
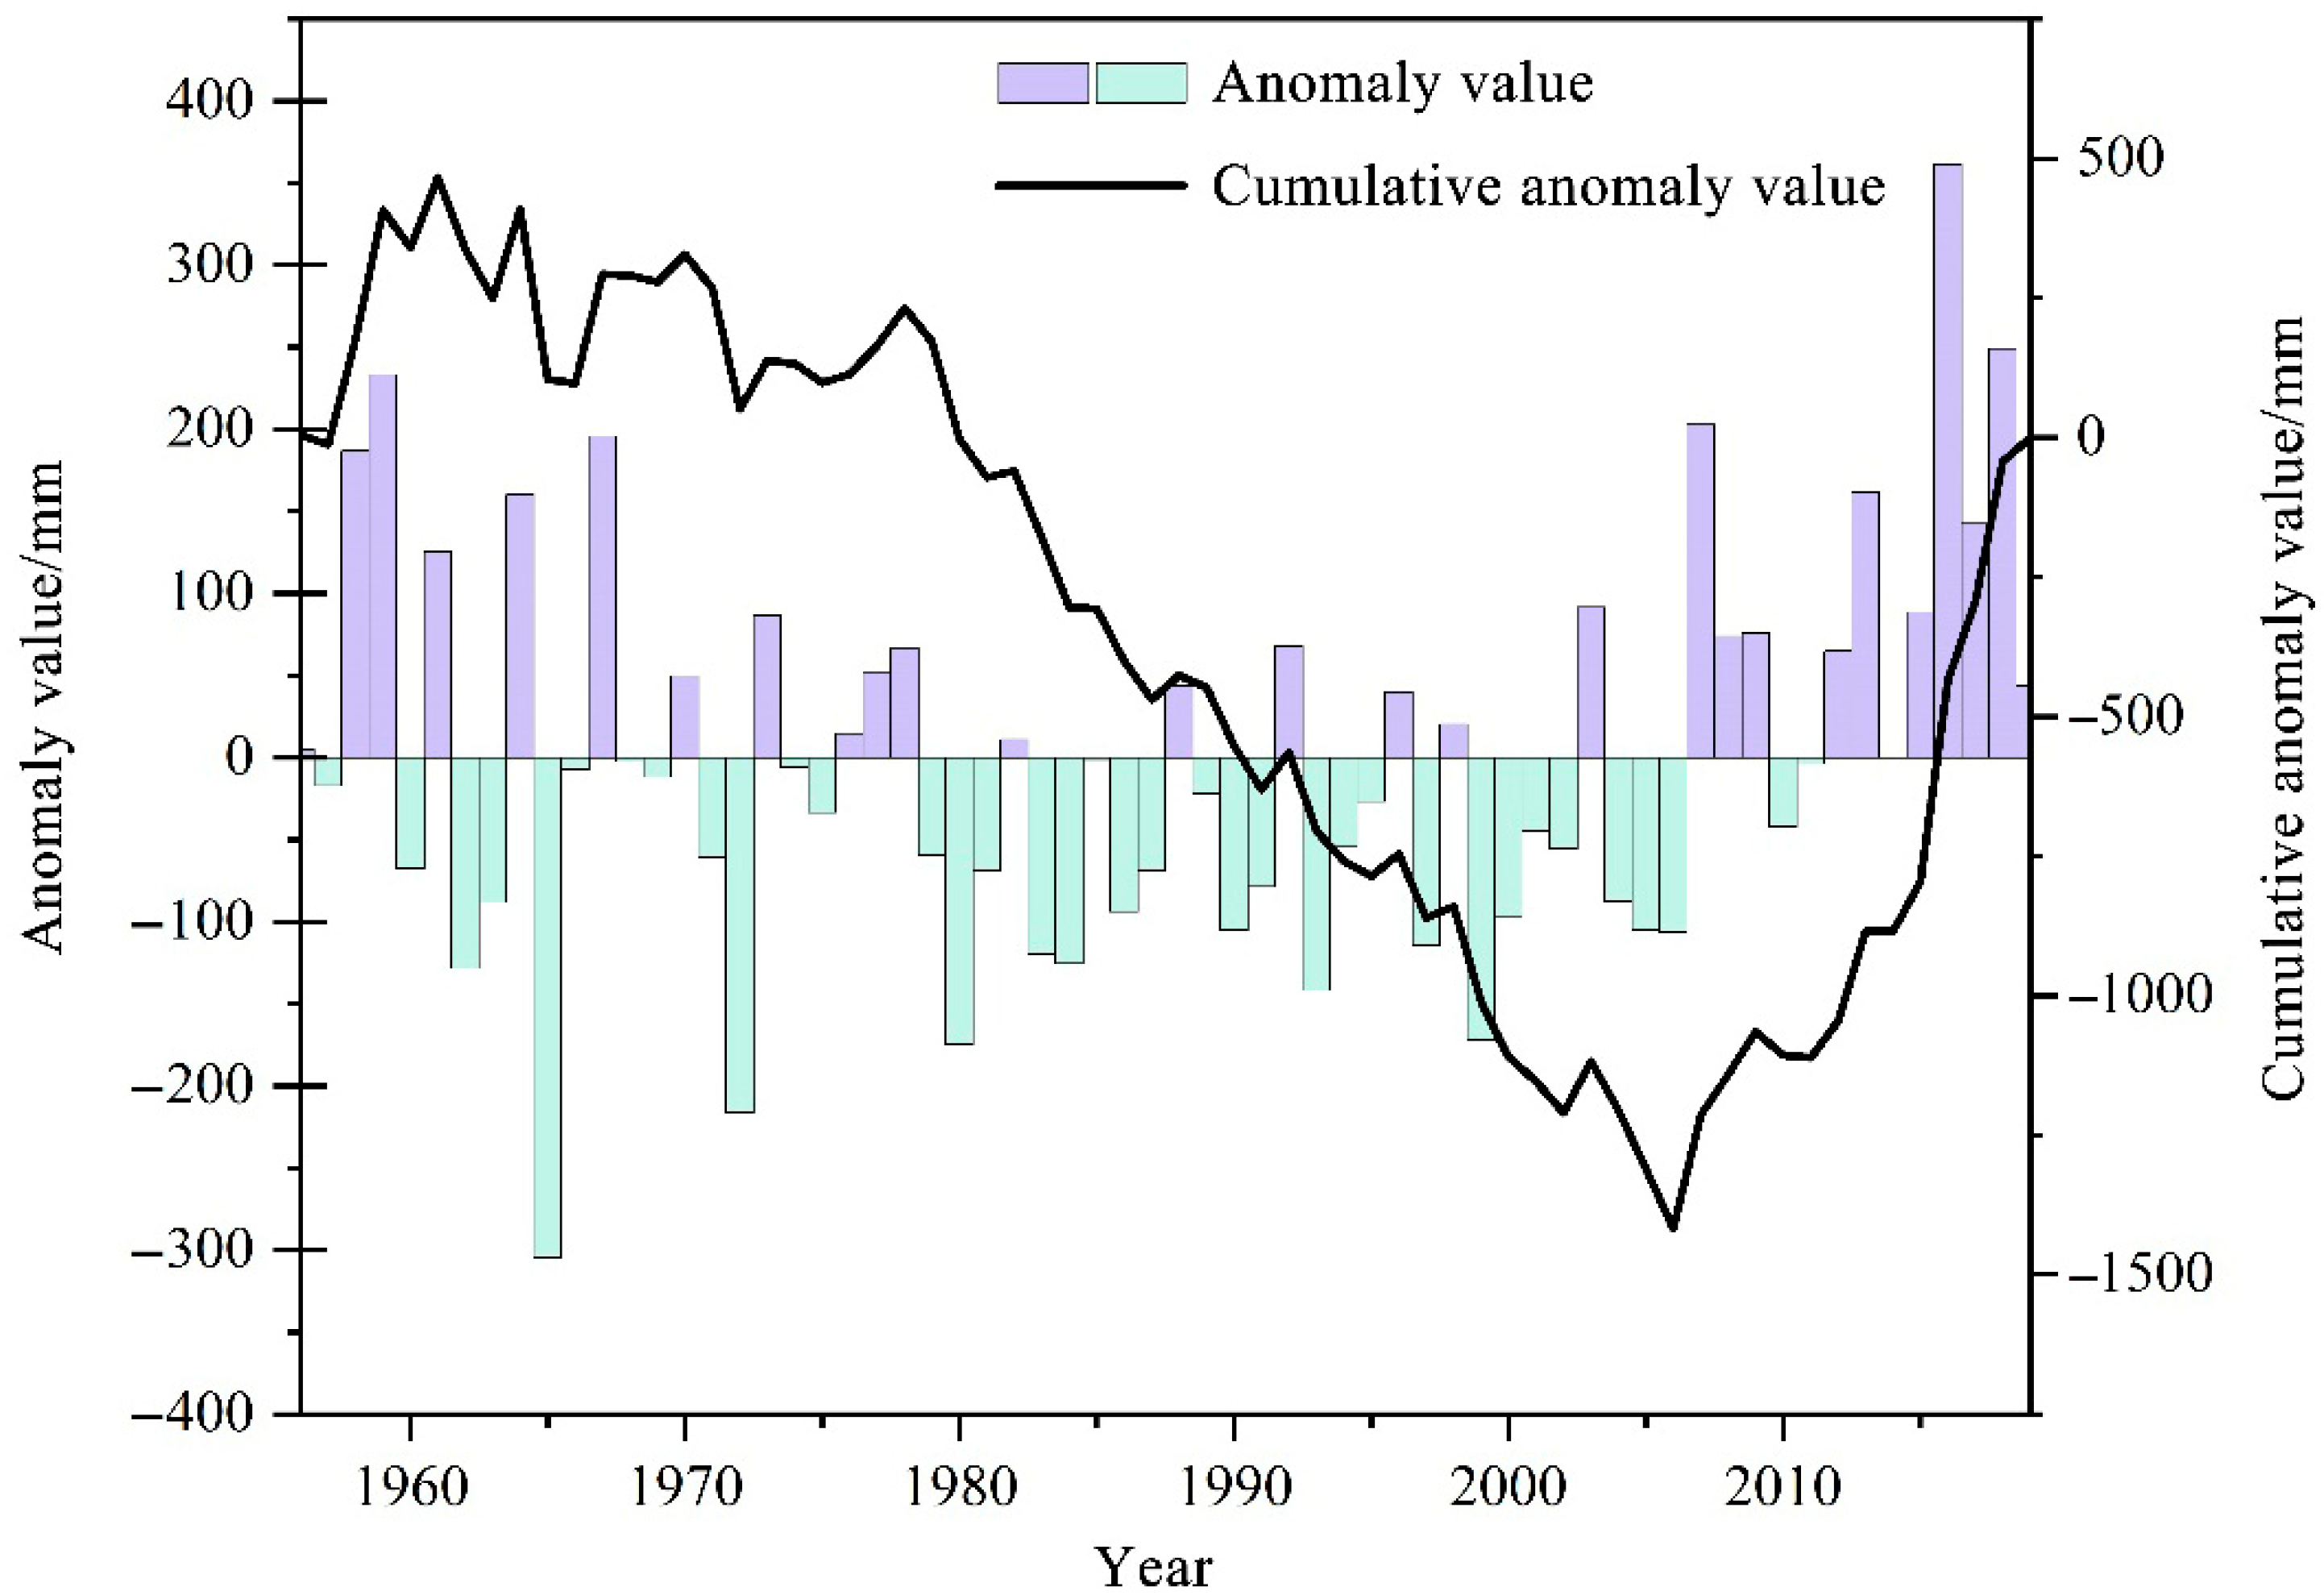
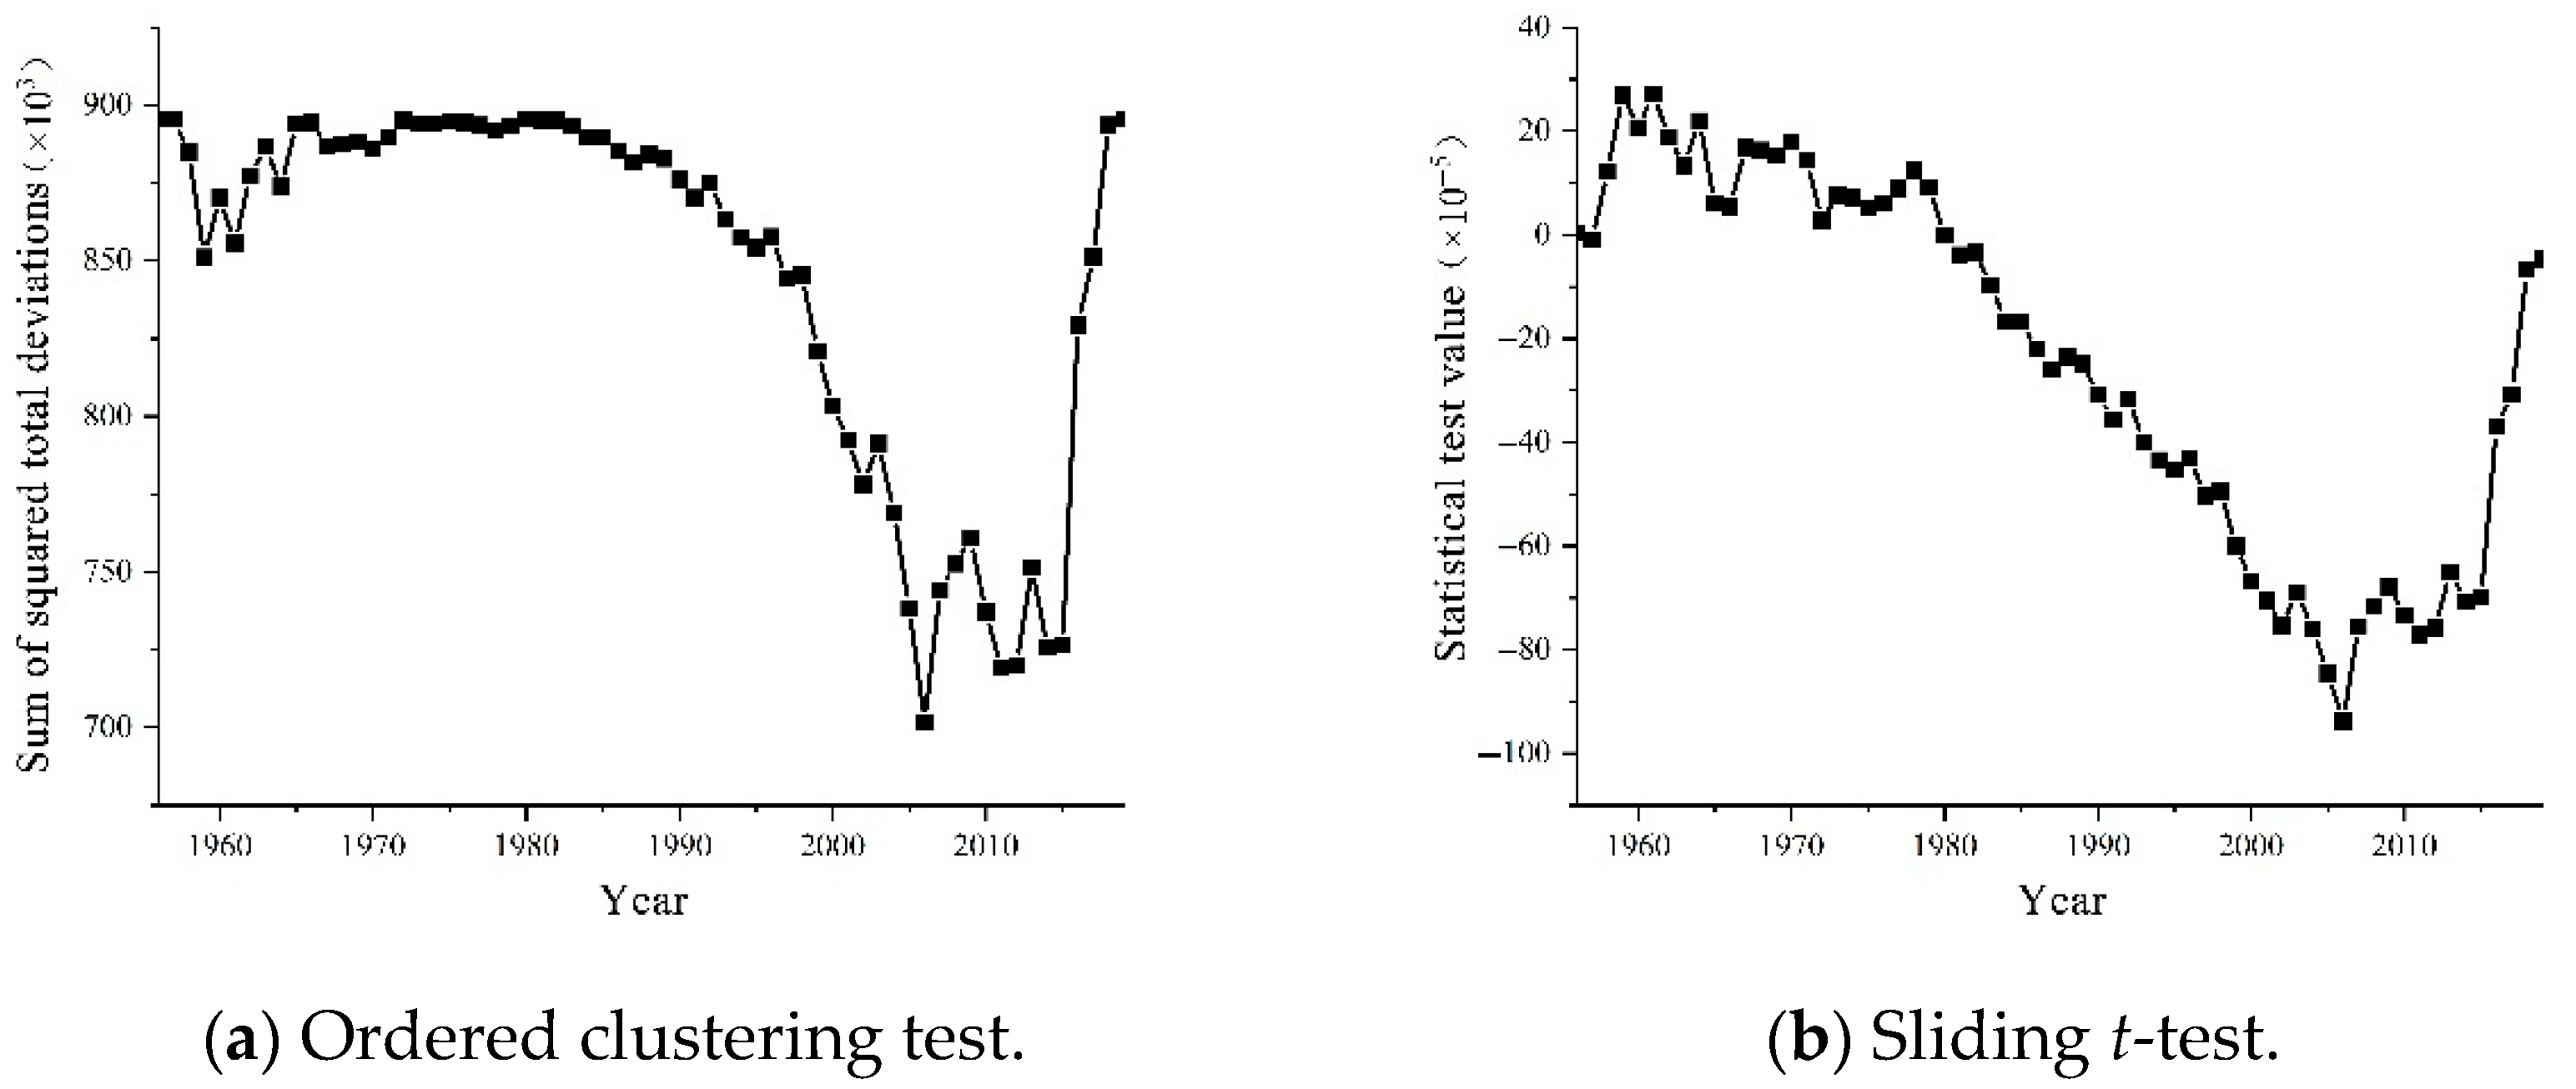
3.2. Interannual Variation Characteristics of Precipitation

The multi-year average precipitation in the Kuye River Basin is 445 mm, with the highest recorded precipitation of 806.5 mm in 2016 and the lowest of 140.2 mm in 1965. The coefficient of variation (Cv) is 0.27, indicating relatively small interannual variability. Figure 3 illustrates the interannual variation process curve for precipitation in the Kuye River Basin. The linear trend line shows that precipitation levels have generally fluctuated around the trend line over the years, with no significant changes observed between different years. The five-year moving average curve for annual precipitation indicates an overall upward trend; prior to 2002, the changes are not pronounced, while a significant increasing trend is evident after 2002. A Mann–Kendall (M-K) trend test conducted on the annual precipitation series yielded a Z-value of 1.095 and a p-value of 0.2735, demonstrating that the annual precipitation in the basin exhibits a non-significant upward trend.
Figure 4 presents the annual precipitation anomaly process for the Kuye River Basin. The anomaly chart indicates that there are 27 years with precipitation above the multi-year average and 37 years below the average, showing no distinct positive or negative patterns. The cumulative anomaly value curve reveals that precipitation can be categorized into three phases: a stable period, an increasing period, and a decreasing period. From 1956 to 1978, precipitation changes were stable, with no significant variations. The period from 1979 to 2006 marked a declining phase in precipitation, with 2006 witnessing the highest peak, where the cumulative anomaly reached its maximum. From 2007 to 2019, the cumulative anomaly value curve exhibited an upward trend. It is evident that around 2006, the trend in annual precipitation changes in the Kuye River Basin underwent a transformation.
The sliding t-test, ordered clustering method, and Pettitt test were employed to analyze the variation in abrupt change points in the annual precipitation series of the Kuye River Basin, as shown in Figure 5. The Pettitt test yielded a p-value of 0.024, indicating that the change point occurred in 2006. Additionally, based on the results from the sliding t-test and ordered clustering analysis, it is concluded that the changes in annual precipitation in the Kuye River Basin are highly significant, with the change point identified in 2006.
The interannual variation in precipitation in the Kuye River Basin from 1956 to 2019 exhibits multiple periodic characteristics, specifically cycles of 5 years and 2 years, as illustrated in Figure 6. The black line in the figure outlines the area that passes the 0.05 noise test and is statistically significant. The 2-year cycle appears between 1960 and 1970, while the 5-year cycle is approximately observed between 2002 and 2008. Periodicity is less pronounced during other periods.

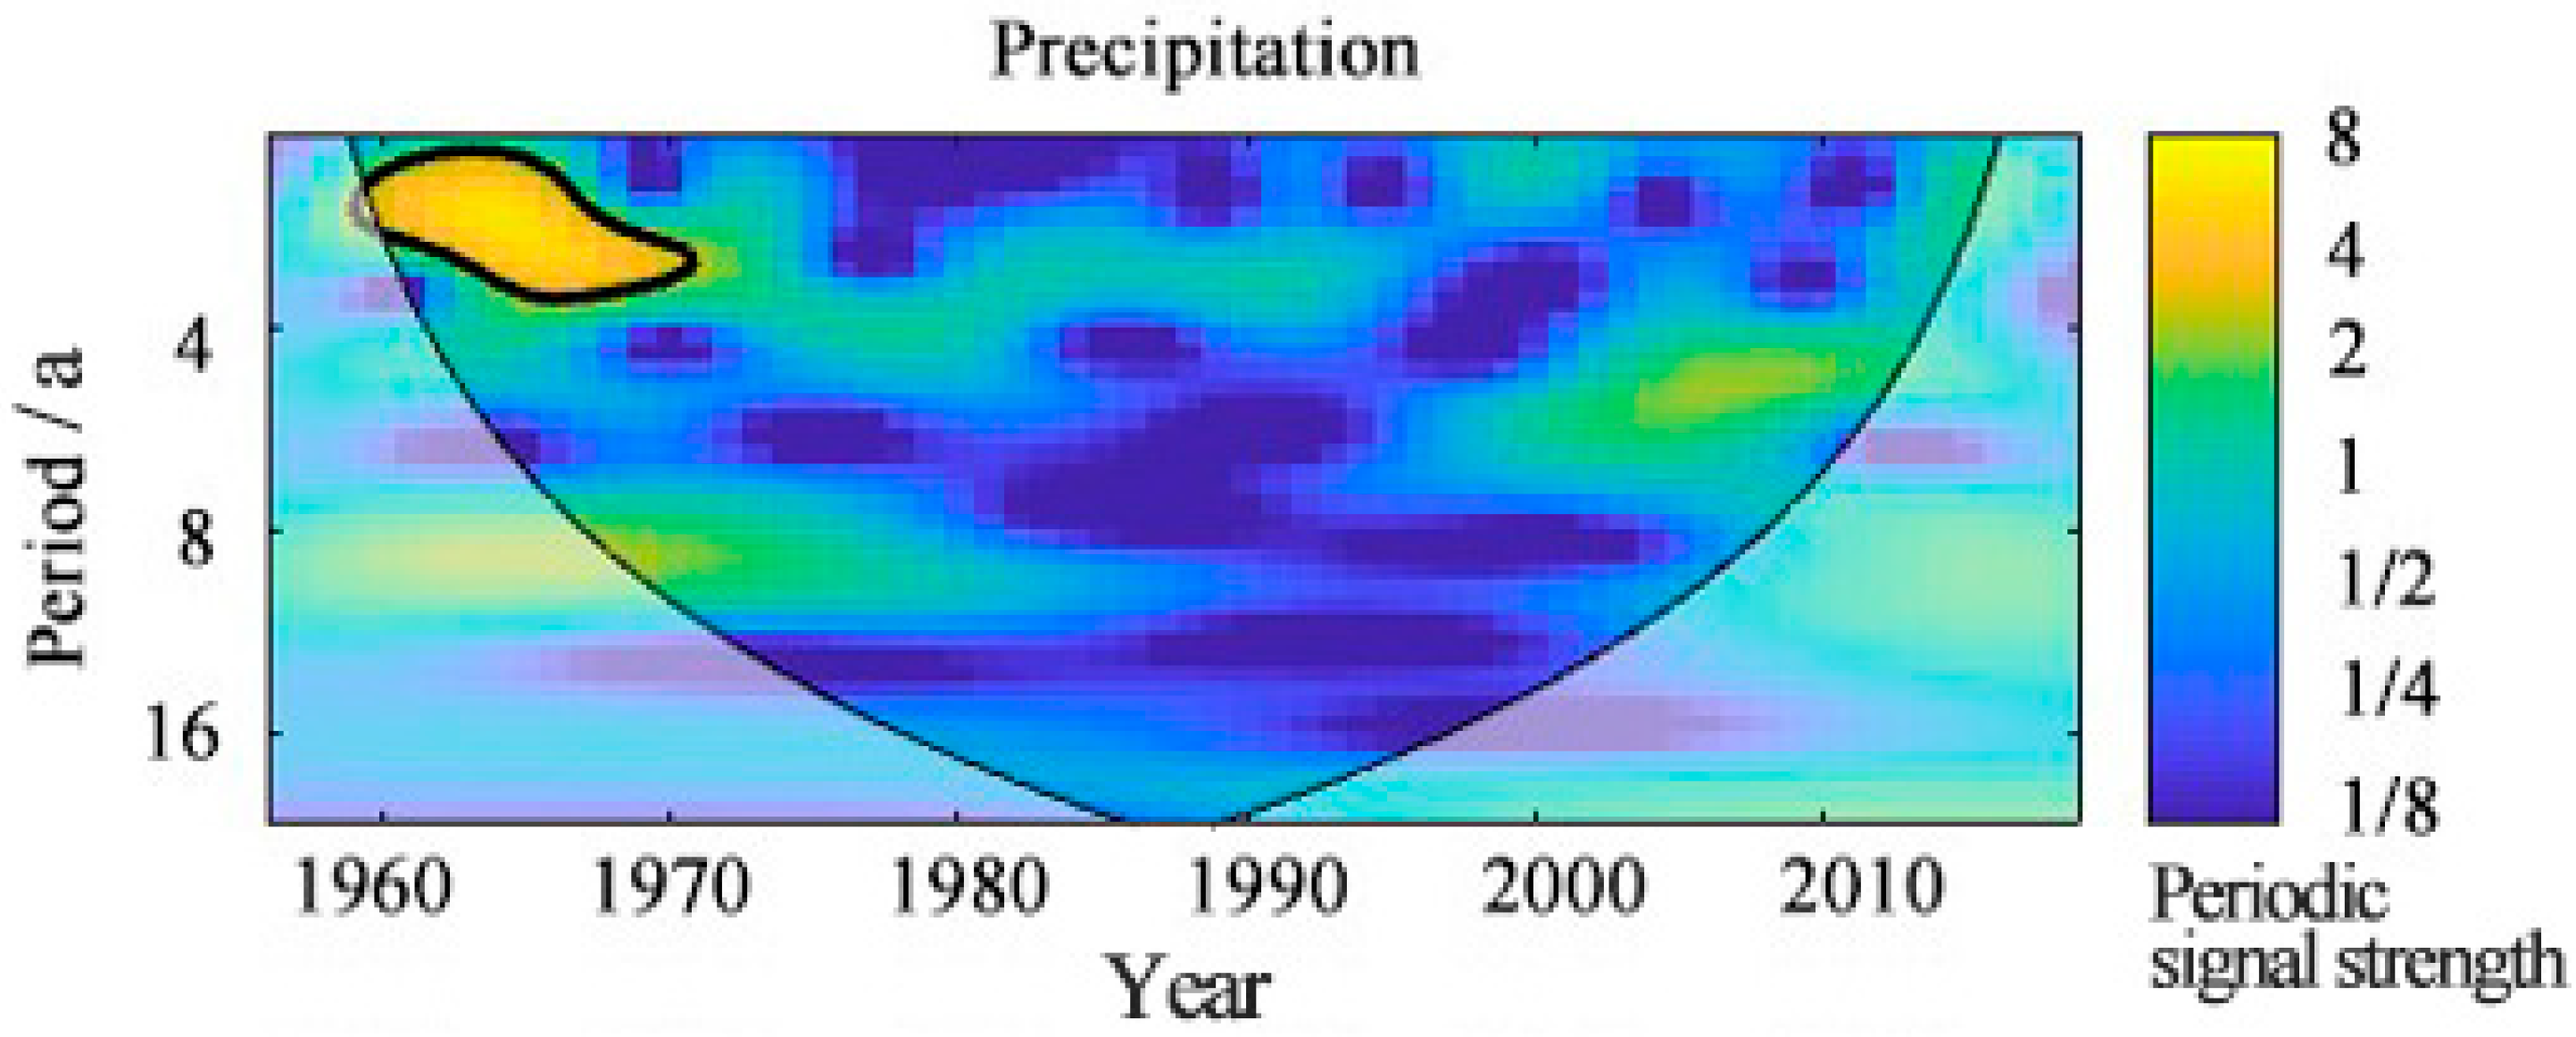
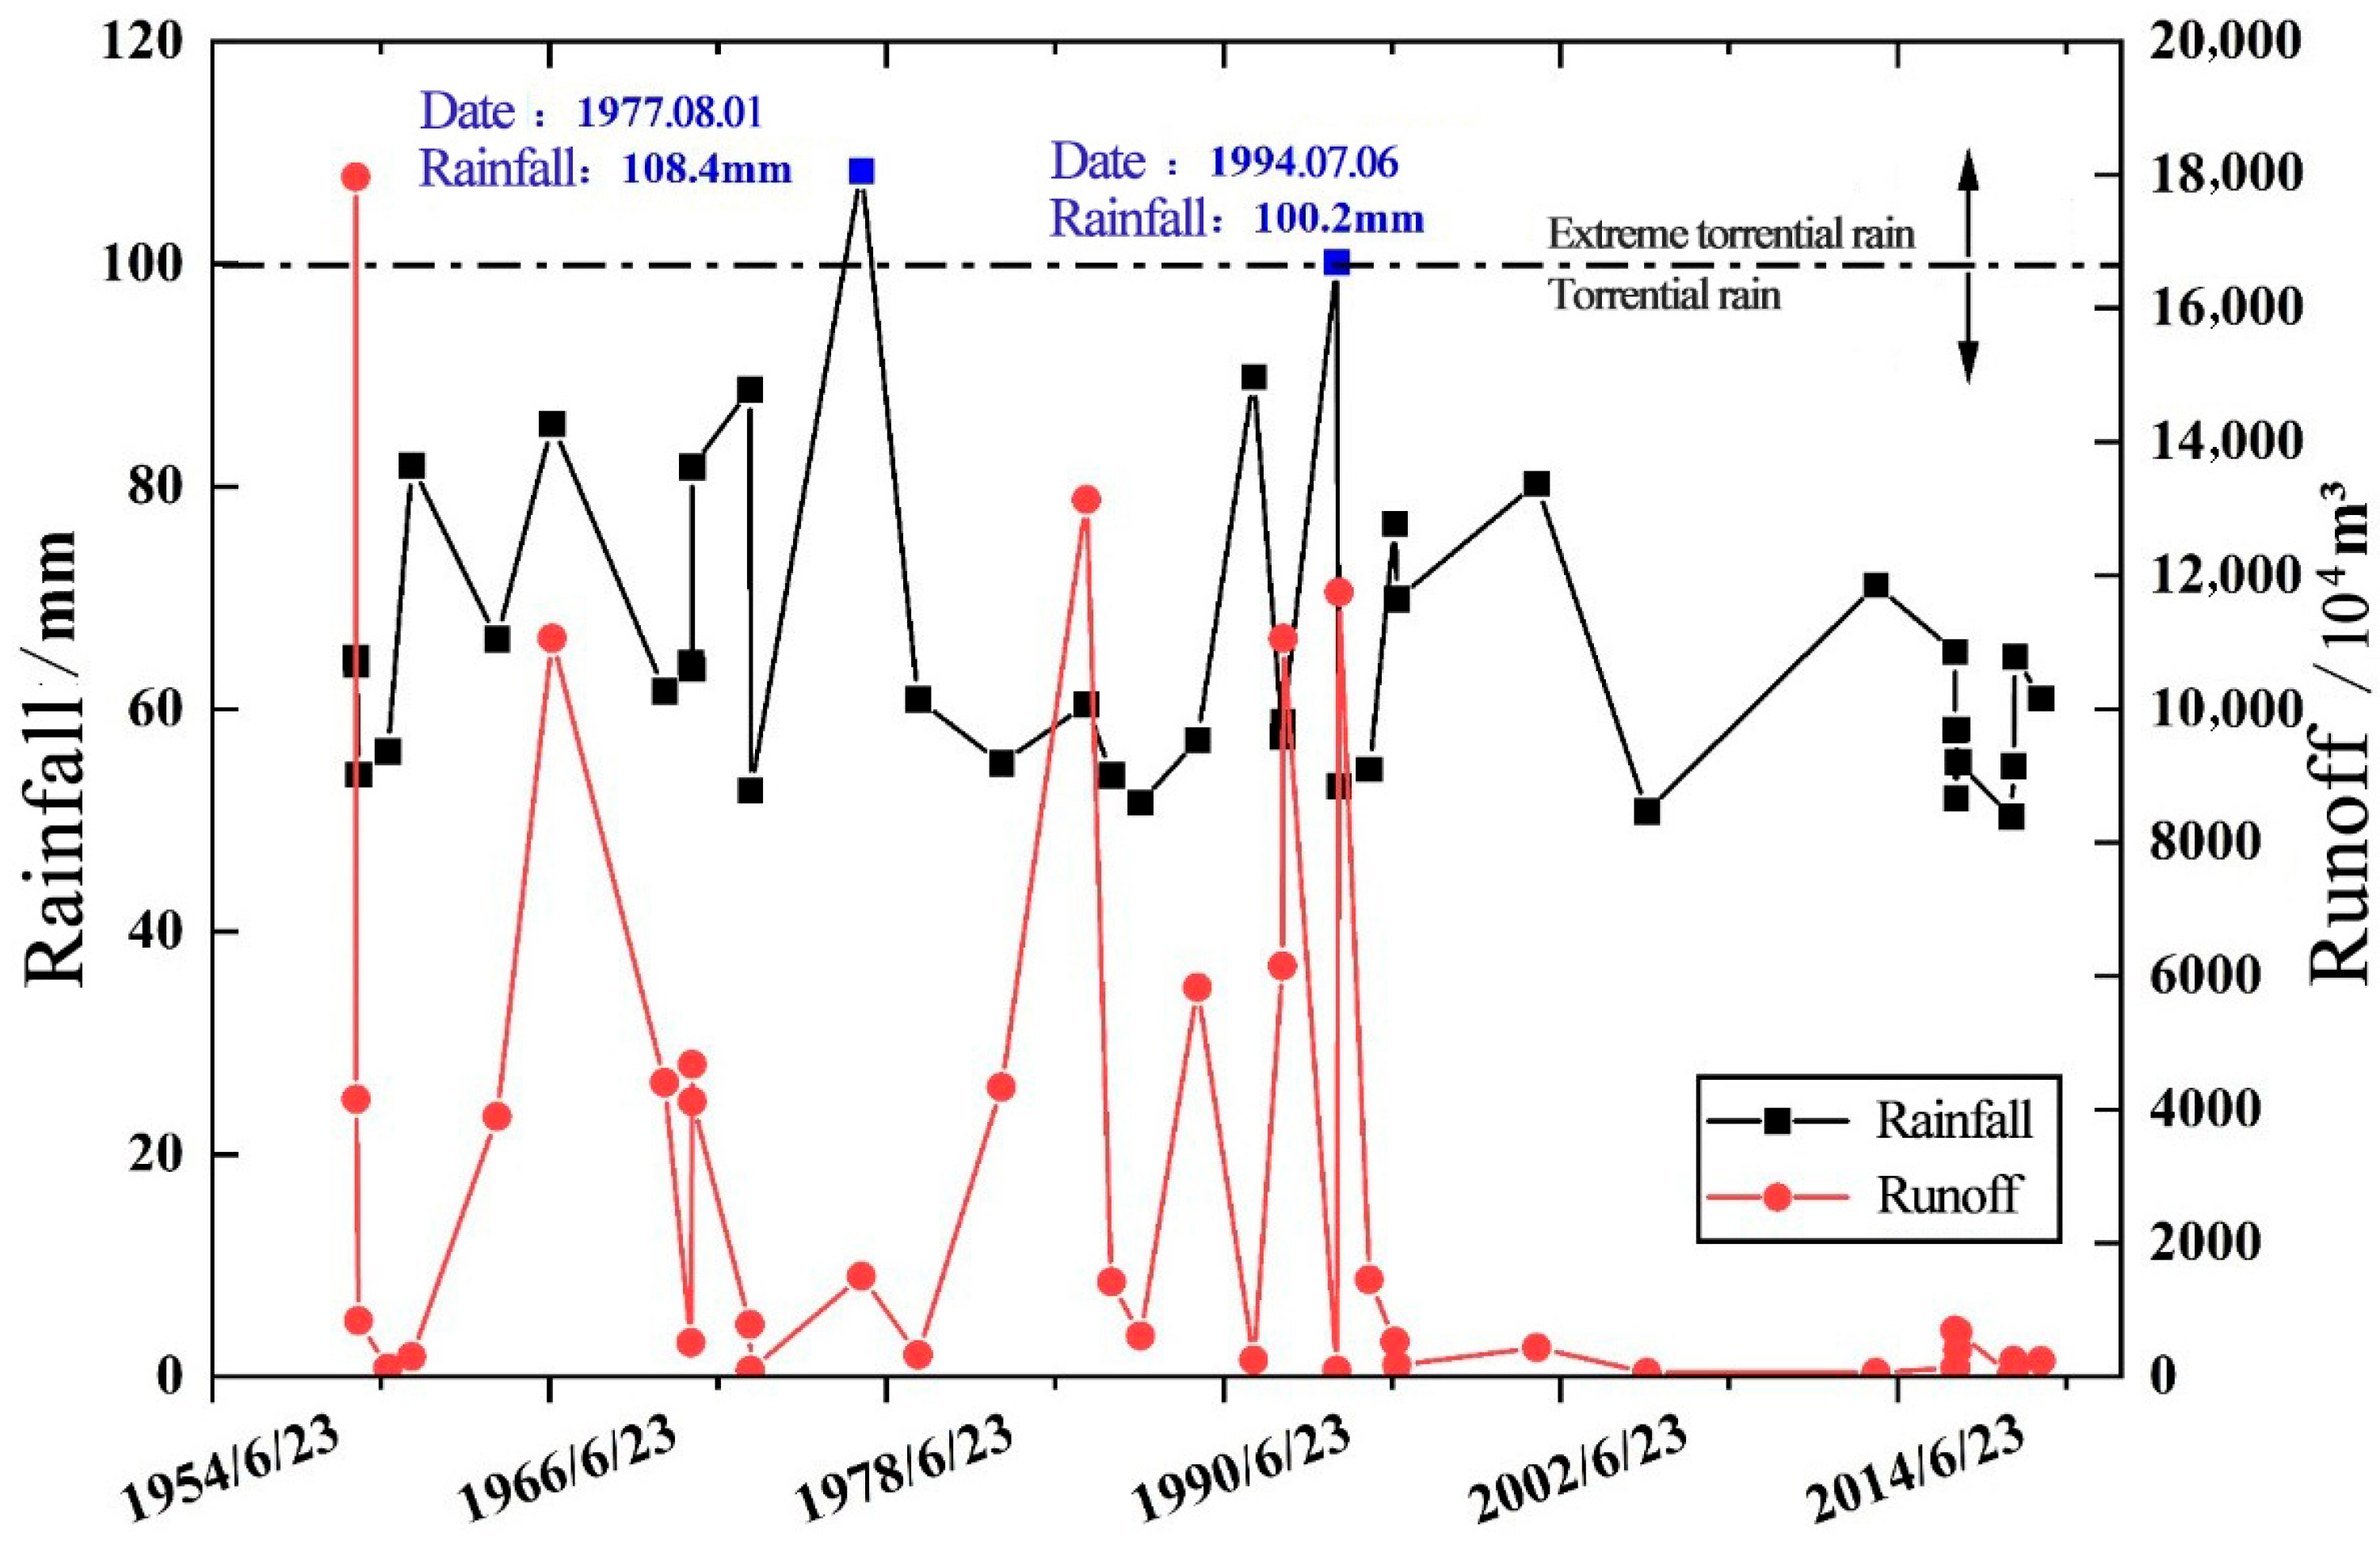
3.3. Extreme Rainfall Analysis

The daily rainfall data set, spanning from 1956 to 2019, encompassed three sites: Shenmu, Wangdao Hengta, and Wengjia River in the basin. The Thales polygon method was employed to calculate the daily rainfall in the Kuye River Basin, and a systematic classification of rainfall types was undertaken. The statistical outcomes are presented in Table 3. As illustrated in Table 3, two significant precipitation events occurred in the Kuye River Basin between 1956 and 2019, on 1 August 1977 (108.4 mm) and 6 July 1994 (100.2 mm) (Figure 7). Among these, for the maximum flow on 1 August 1977, heavy rainfall reached 8480 m3/s, and the area was covered by rainfall exceeding 50 mm (5120 km2), which accounted for two-thirds of the total basin area. The precipitation at the core of the heavy rainfall was 172 mm, with a maximum 4 h rainfall of 87 mm recorded at the center. The analysis of the figure indicates that both heavy rainfall and runoff in the Kuye River Basin have exhibited a downward trend to varying degrees. Since the 1990s, no significant floods have occurred with daily rainfall amounts exceeding 100 mm. The implementation of large-scale soil and water conservation measures in the Kuye River Basin has led to a significant reduction in runoff at the outlet of the basin since 1996.

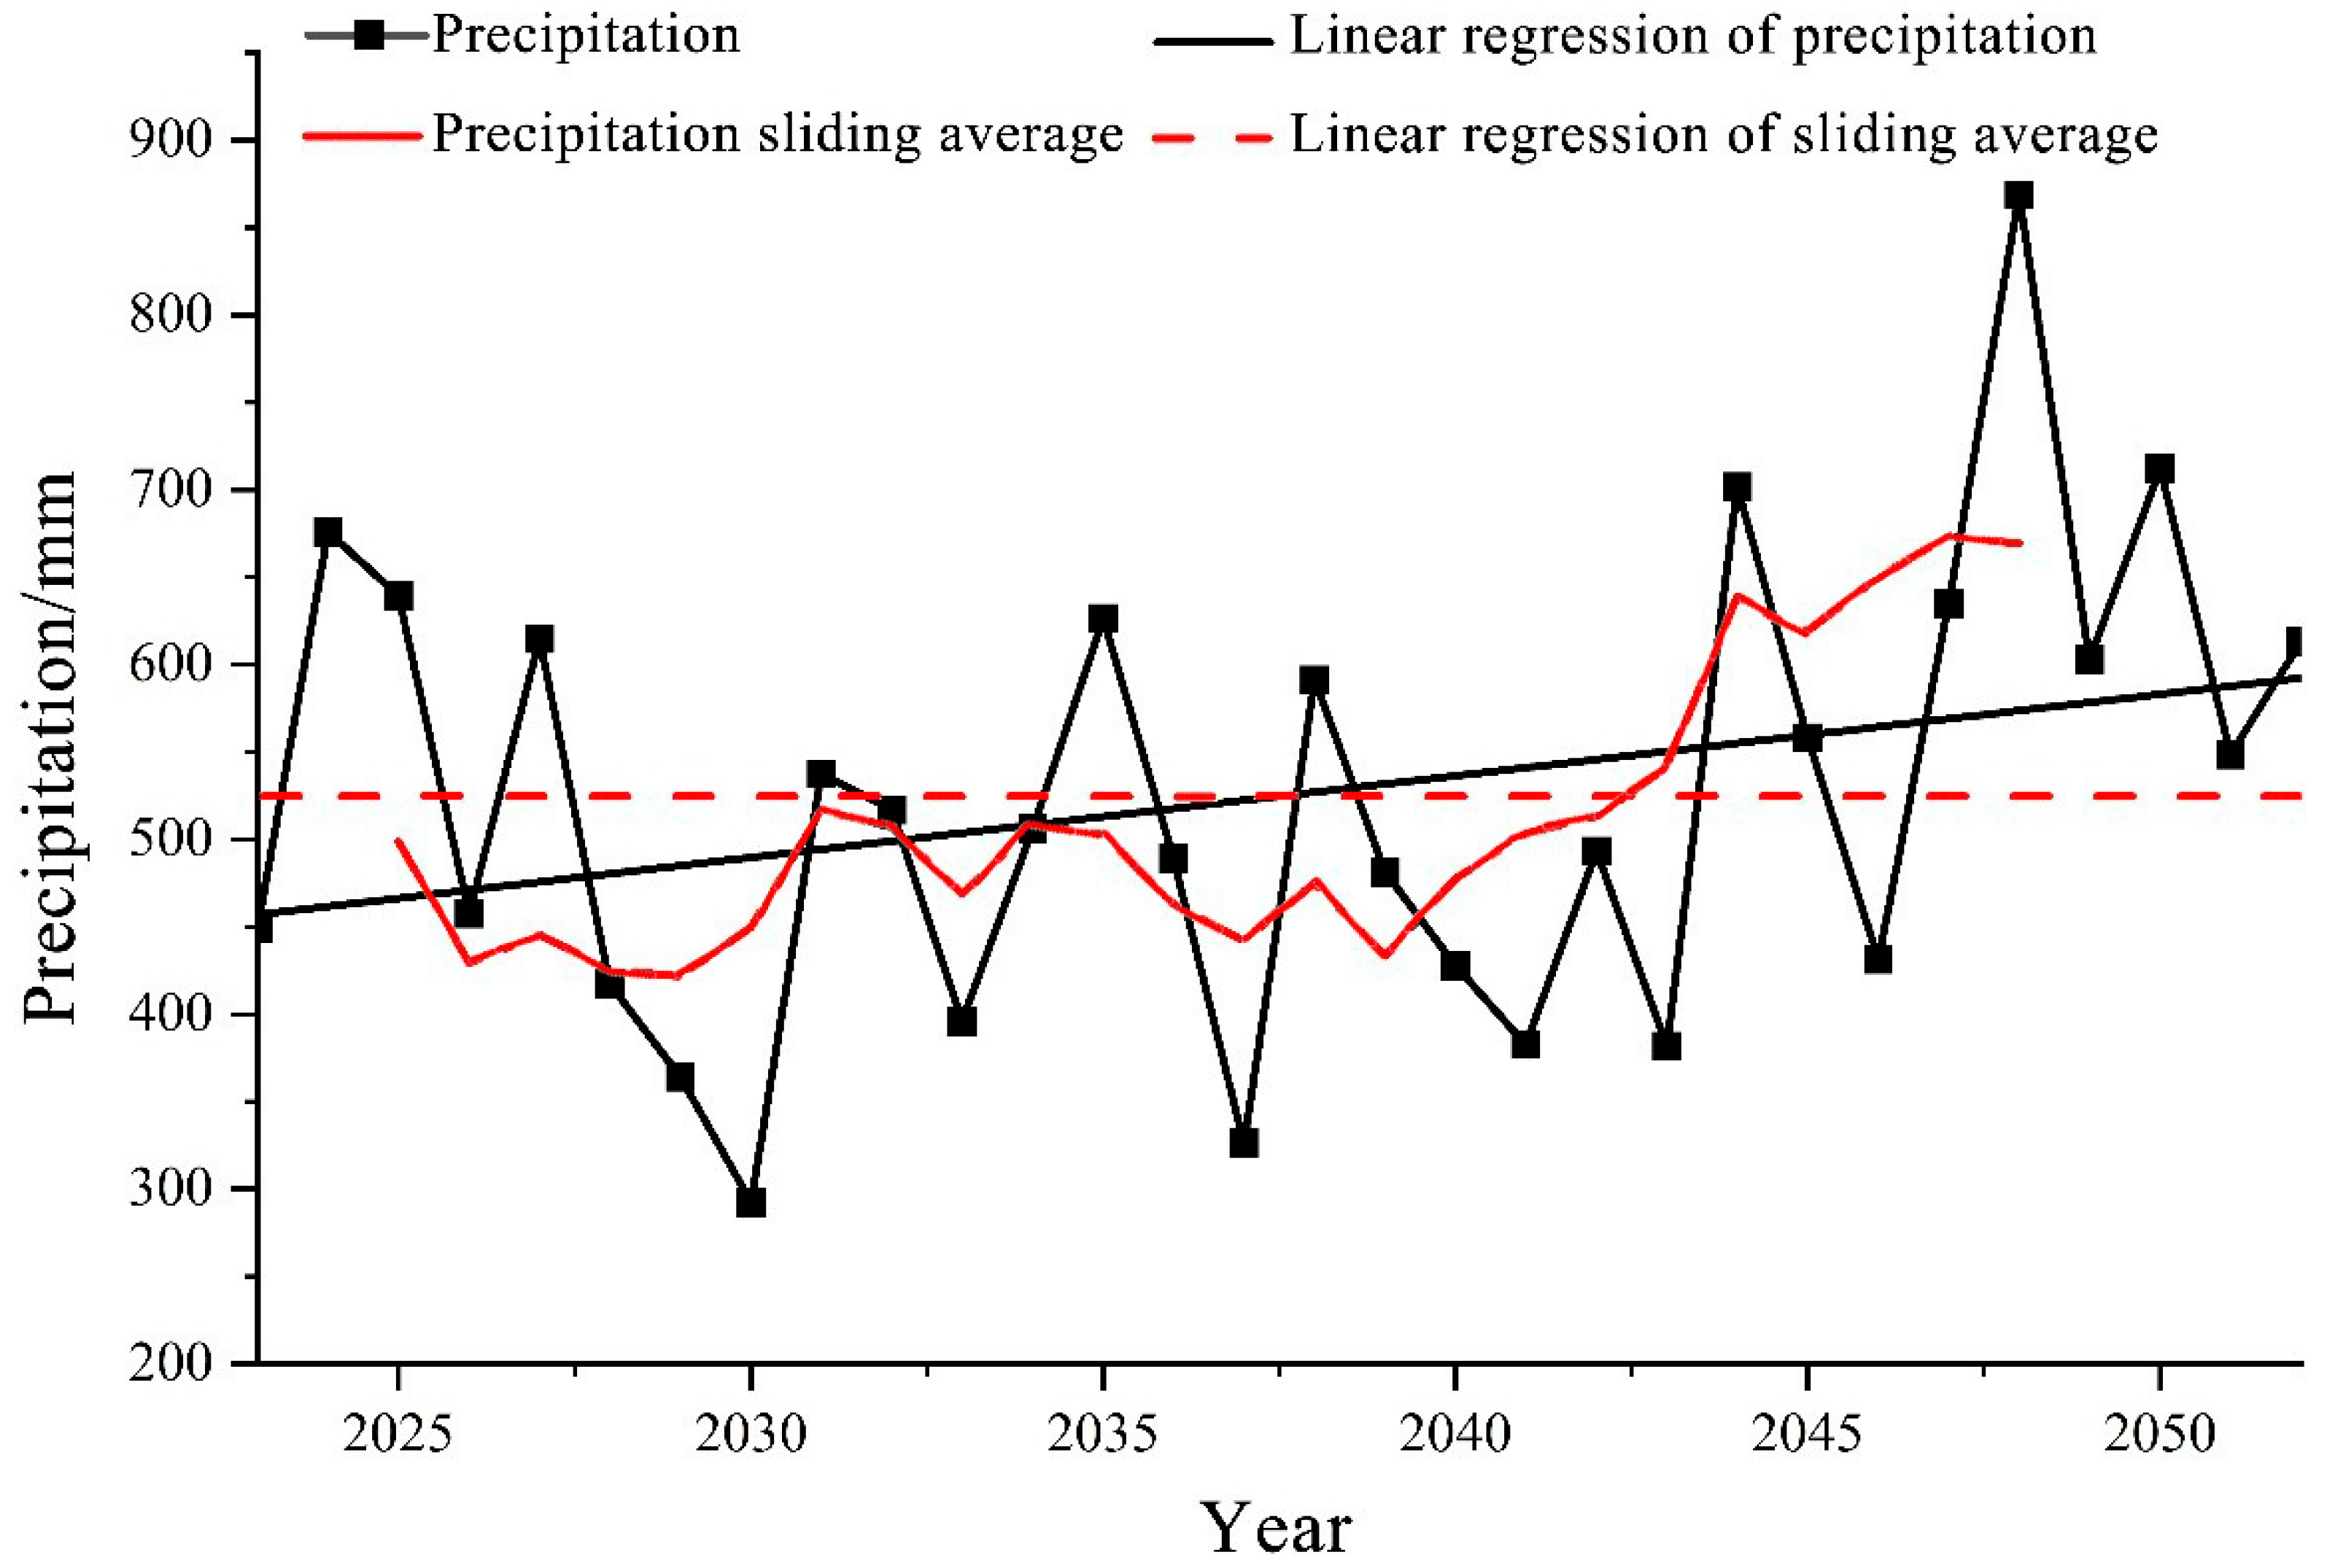
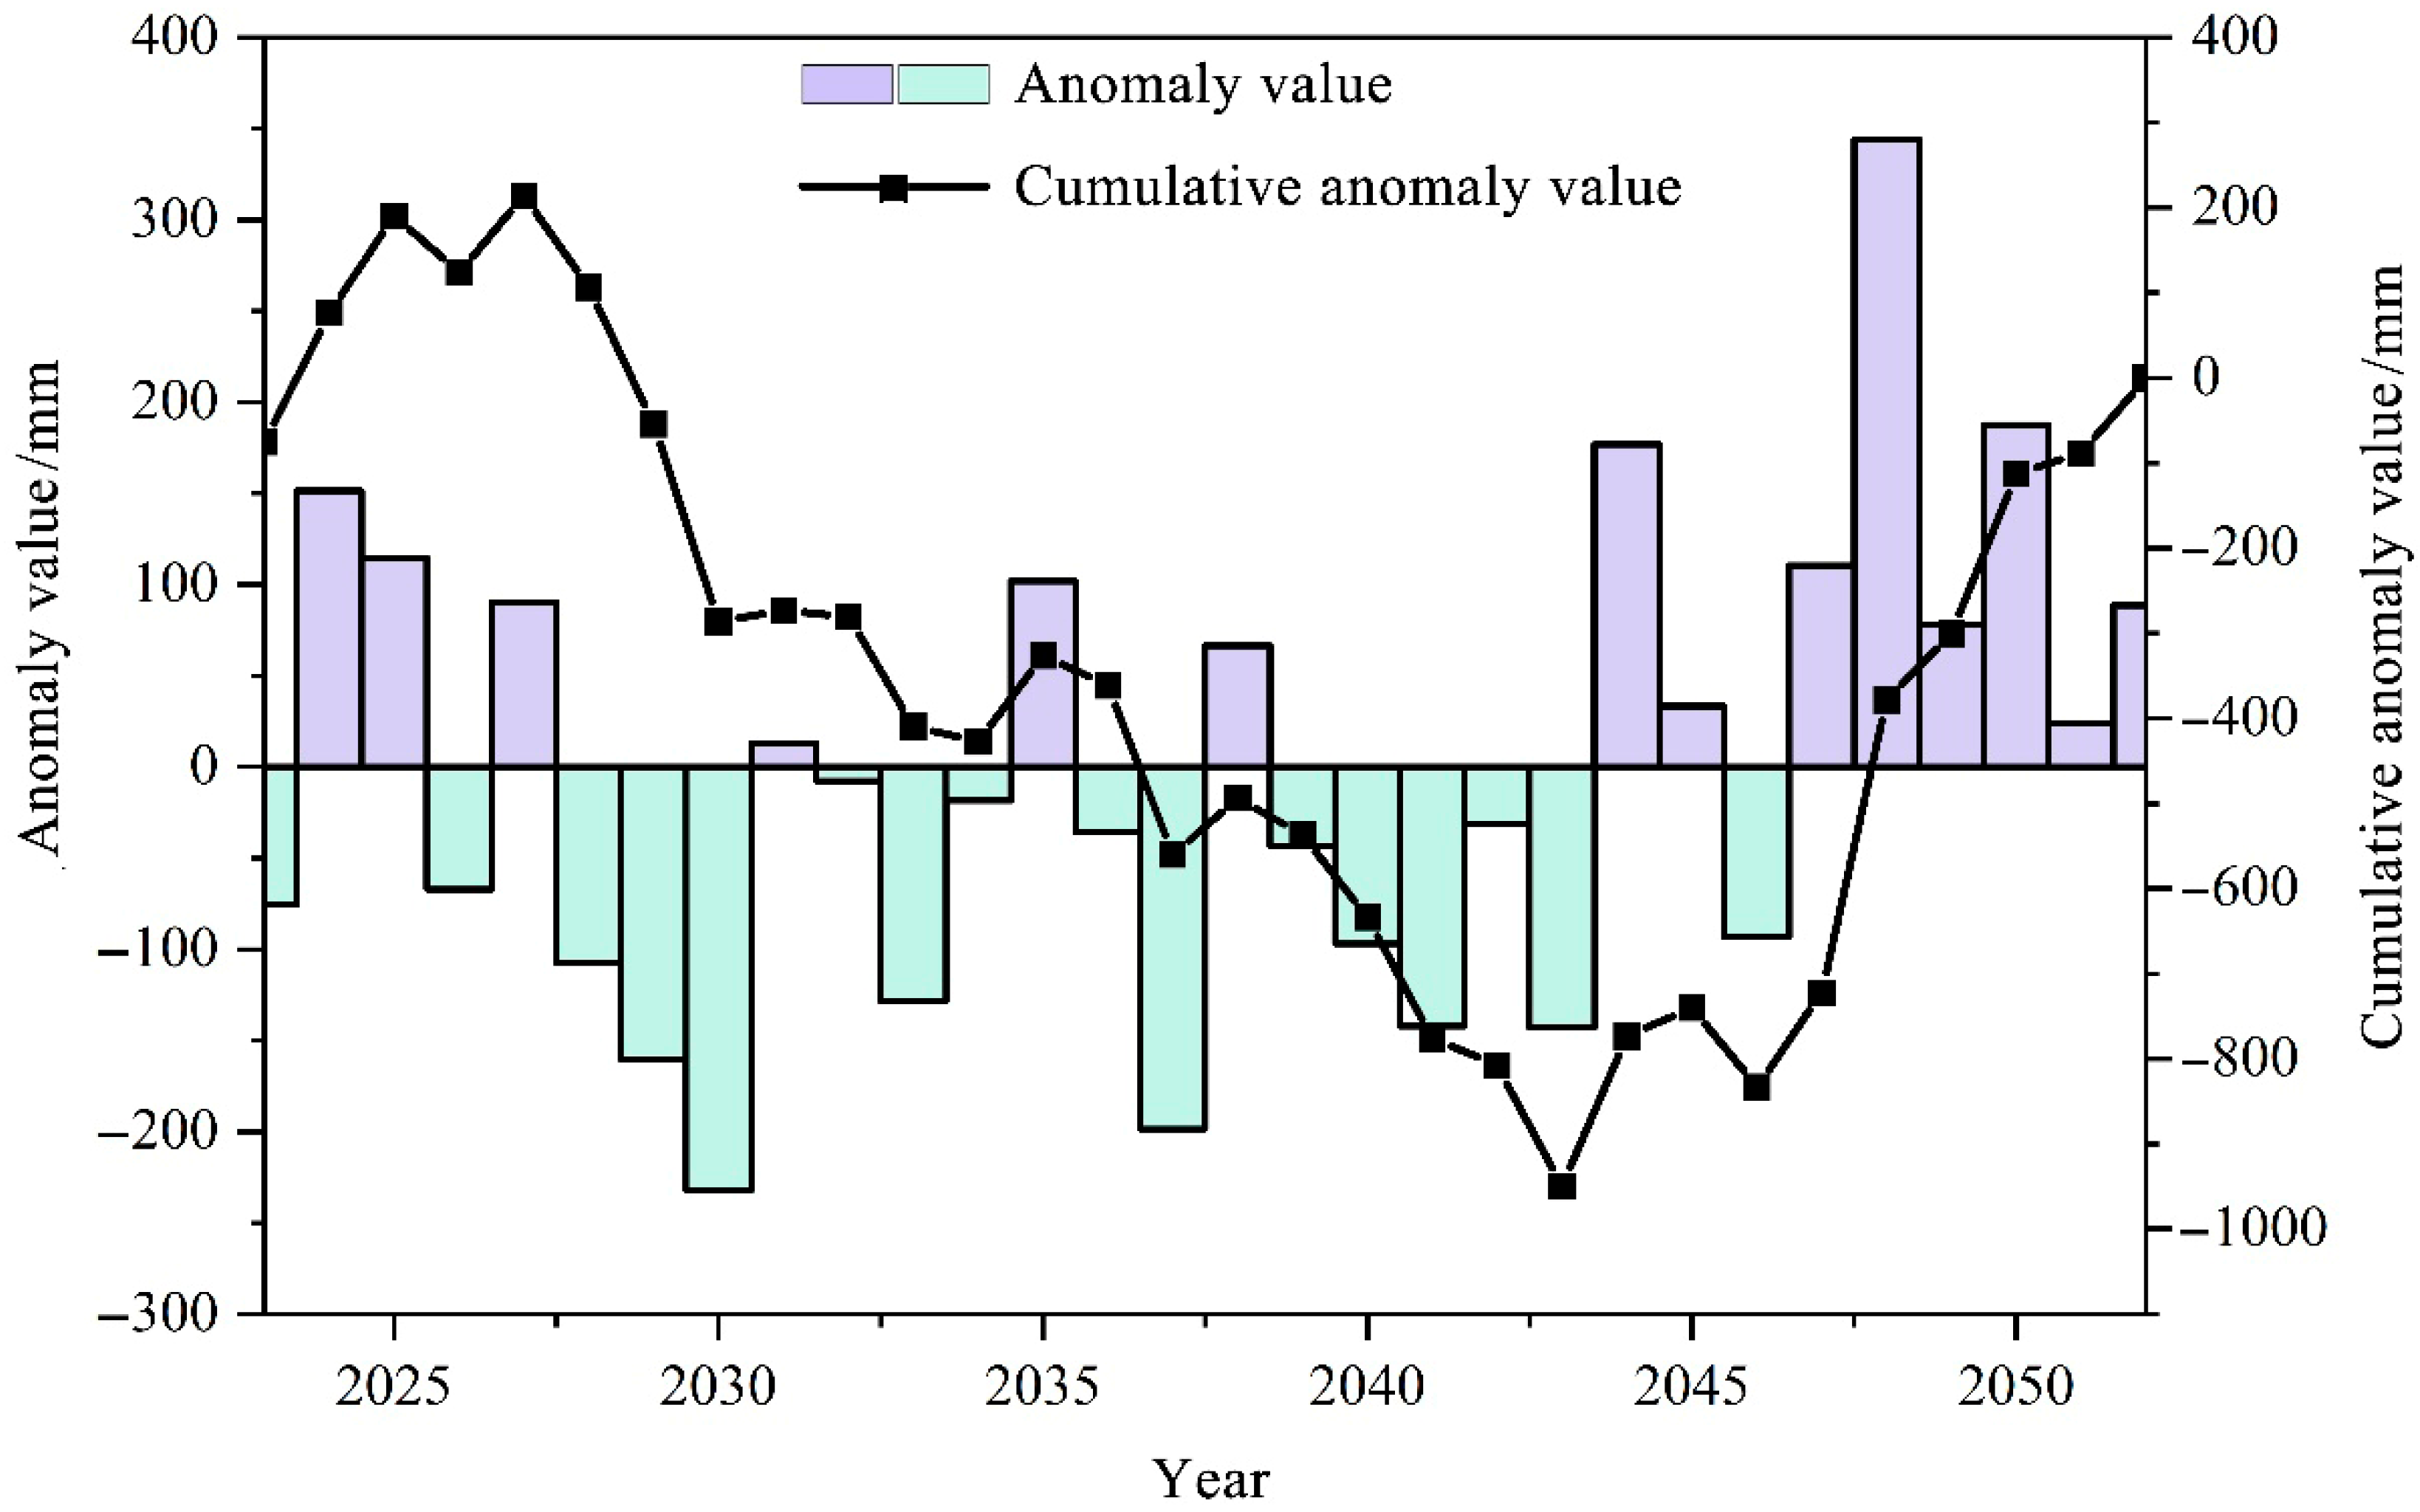
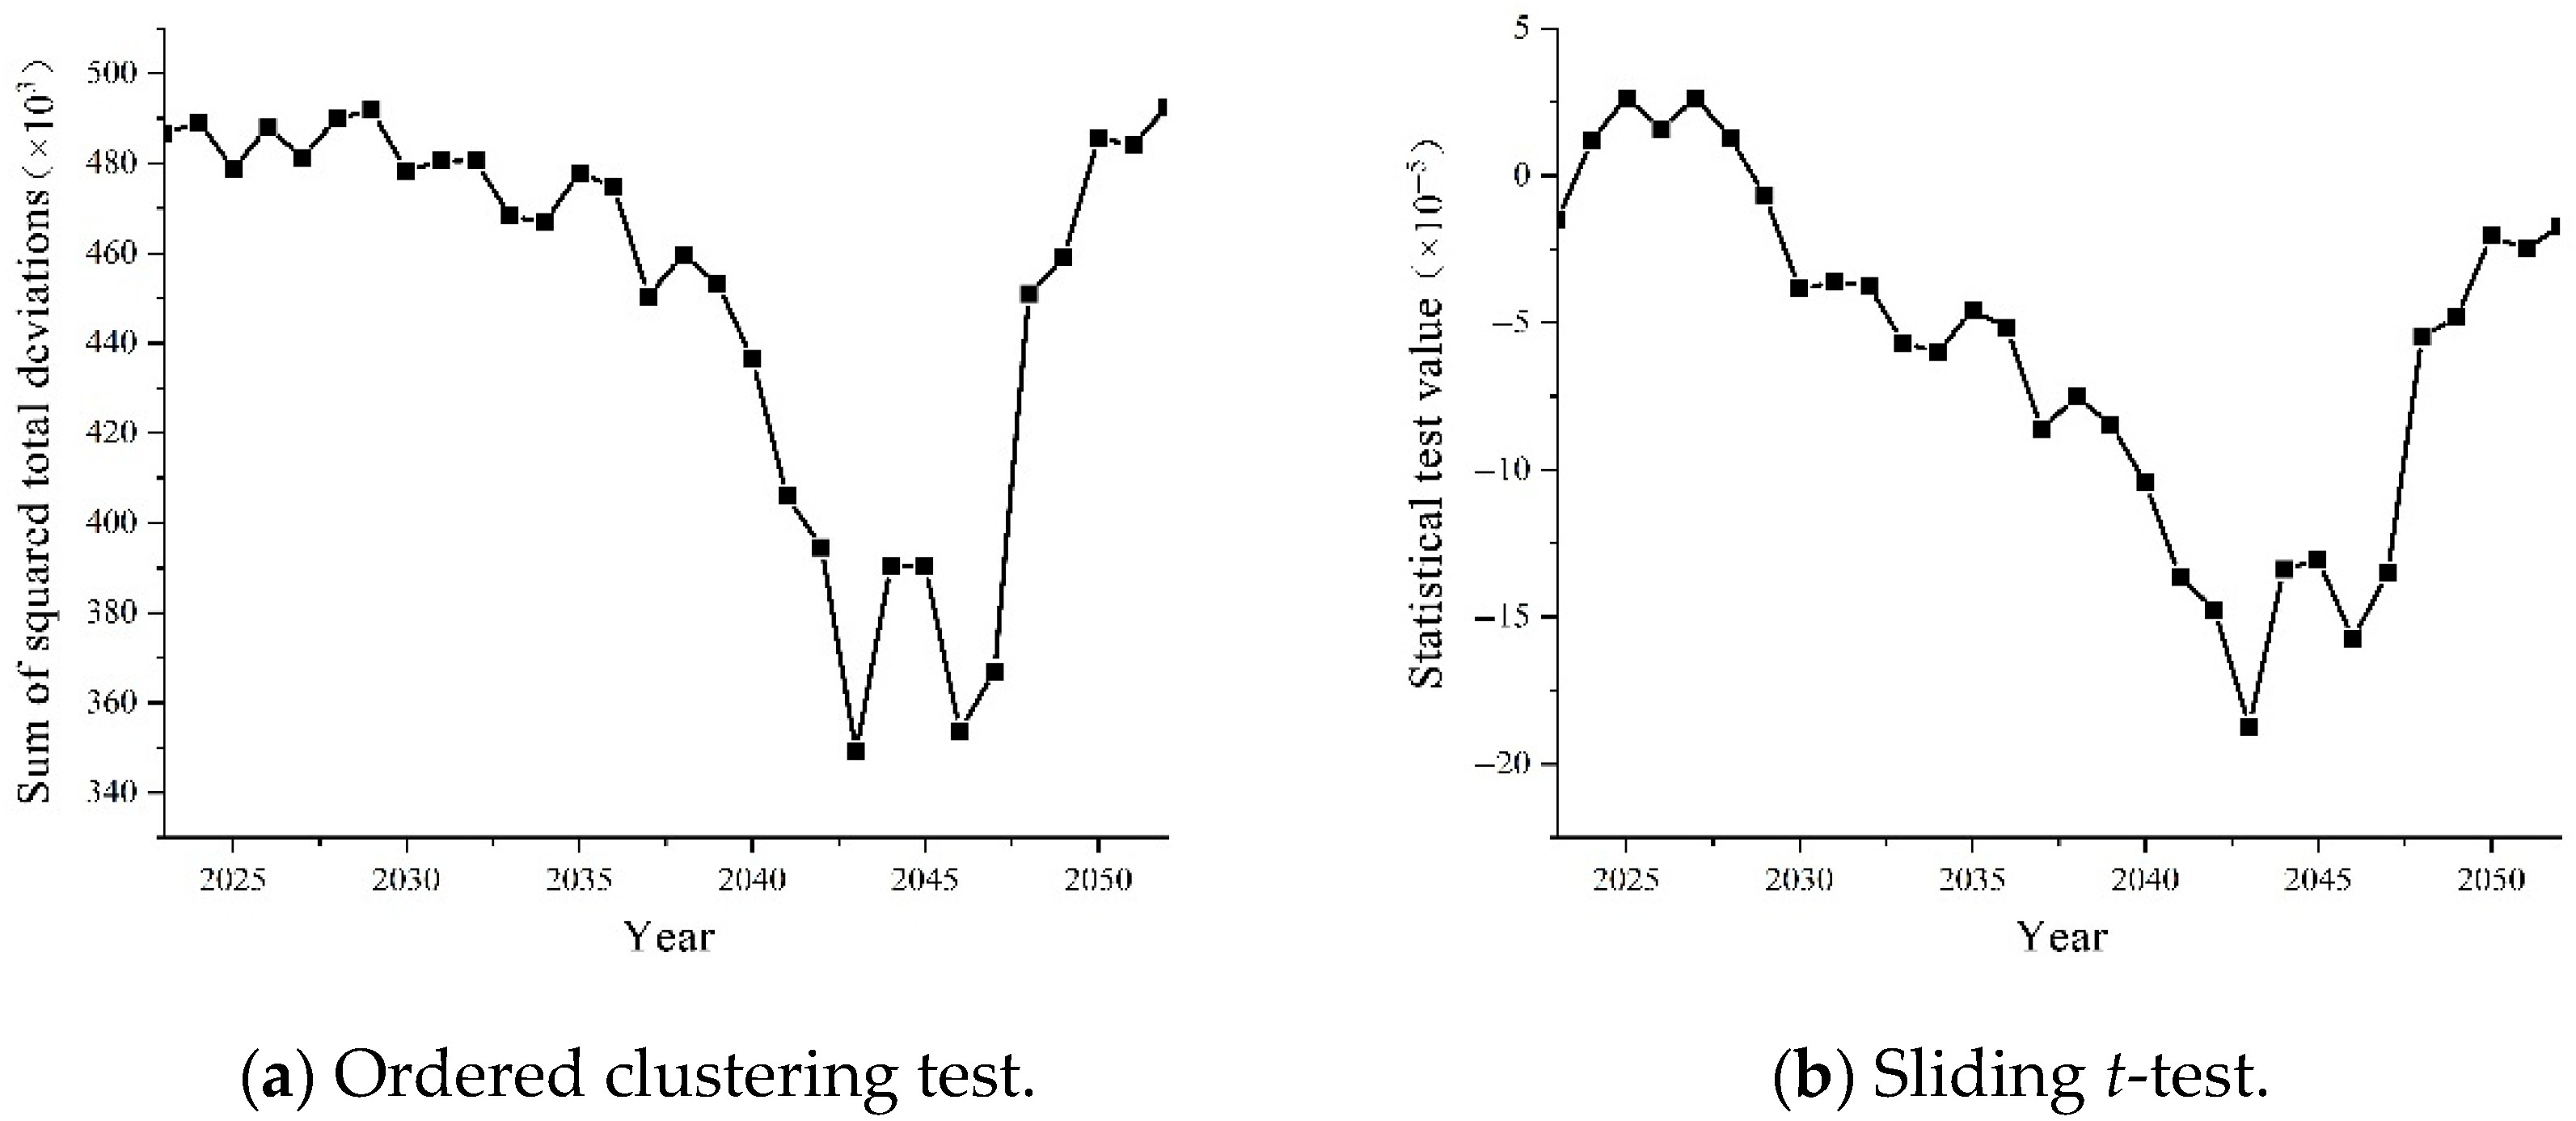
3.4. Future Variation Characteristics of Precipitation

The annual precipitation for the Kuye River Basin from 2023 to 2052 under the HadGEm3-RA climate model and RCP8.5 high-emission scenario was calculated. The interannual variation curve for annual precipitation during this period is shown in Figure 8. The multi-year average precipitation over the next 30 years is projected to be 524.69 mm, with a maximum of 868.83 mm occurring in 2048 and a minimum of 292.61 mm in 2030. The coefficient of variation (Cv) is 0.24, indicating relatively small interannual variability. The linear trend line graph and five-year moving average curve for future precipitation suggest an overall upward trend from 2023 to 2052. A Mann–Kendall (M-K) trend test conducted on the future precipitation series yielded a Z-value of 1.2846 and a p-value of 0.1989, demonstrating that the annual precipitation over the next 30 years will exhibit a non-significant increasing trend.
Figure 9 presents the anomaly process for annual precipitation for the Kuye River Basin over the next 30 years. The anomaly chart indicates that there are 14 years with precipitation above the multi-year average and 16 years below the average, showing no distinct positive or negative patterns. The cumulative anomaly value curve suggests that precipitation can be categorized into two phases: an increasing period and a decreasing period. The period from 2023 to 2043 is identified as a declining phase, with the lowest peak occurring in 2043, reaching its minimum cumulative anomaly. From 2044 to 2052, the cumulative anomaly value curve exhibits an upward trend. It is evident that around 2043, the trend in annual precipitation changes in the Kuye River Basin underwent a transformation.
A variation analysis of abrupt change points in the future annual precipitation series of the Kuye River Basin was conducted using the sliding t-test, ordered clustering method, and Pettitt test, as shown in Figure 10. The Pettitt test yielded a p-value of 0.0773, indicating that the change point occurred in 2043. Additionally, considering the results from the sliding t-test and ordered clustering analysis, it was concluded that the changes in annual precipitation in the Kuye River Basin were significant, with the change point identified in 2043.
Based on the spatial distribution data for the multi-year average precipitation in the Kuye River Basin from 2023 to 2052 (Figure 11), precipitation is expected to be unevenly distributed over the next 30 years. There is an increasing trend in precipitation from the northwest to the southeast. The areas with the least precipitation are primarily concentrated in the northwestern region of the basin, characterized by sandy conditions, with a multi-year average precipitation of approximately 458 mm. In contrast, the regions with the highest precipitation are mainly located near Wenjiacuan in the southern part of the basin, where the multi-year average precipitation is around 570 mm.

4. Discussion

4.1. Causes of Recent Changes in Precipitation

The Kuye River Basin is located in the arid and semi-arid region of the middle reaches of the Yellow River, with slightly different climates in the north and south. According to Köppen–Geiger Classification, the Kuye River Basin is classified into two types: a cold semi-arid climate (BSk) for areas near the river and with higher altitude, and a monsoon-influenced hot-summer humid continental climate (DWa) for the rest. Due to its high altitude and location in the transition zone between the Loess Plateau and the Mu Us Desert, the northern part of the basin receives less precipitation. The southern part of the Kuye River Basin is influenced by a continental monsoon climate, where strong summer precipitation is primarily driven by monsoons, leading to a significant increase in rainfall during July and August. During this period, warm oceanic air masses bring moisture that is uplifted, resulting in precipitation that accounts for 49.23% of the total annual rainfall. In contrast, the winter months (December to January) experience low temperatures and sparse precipitation, contributing only 1.07% to the annual total. The relatively small interannual variability also reflects the precipitation patterns dominated by the monsoon [18]. Additionally, the hydrological cycle in the Kuye River Basin contributes to seasonal variations in precipitation. High temperatures and increased evaporation in summer facilitate precipitation formation, while evaporation and transpiration processes may enhance local humidity during the summer peak, further promoting rainfall [19].
In 2006, a significant El Niño phenomenon occurred, characterized by abnormal increases in sea surface temperatures that influence atmospheric circulation and precipitation patterns. During El Niño events, elevated tropical ocean temperatures transport moisture to land during the monsoon season, further increasing precipitation. Additionally, El Niño can impact global and regional atmospheric circulation, potentially altering precipitation patterns in the Kuye River Basin, including changes in intensity and frequency [20].
At the same time, the periodicity observed in the study exhibits localized characteristics. The 1960s coincided with a transitional period in the global climate system (IPCC AR6 Chapter 3), during which the weakening of the North Atlantic thermohaline circulation may have led to a decline in the stability of the East Asian circulation, causing short-term oscillations (such as the 2-year cycle) to manifest only during specific time periods.
Moreover, increasing human activities such as urbanization and agricultural expansion may affect local climatic conditions through land-use changes [21]. For example, urbanization can lead to the heat island effect, altering precipitation distribution patterns [22], while irrigation and land development associated with agriculture may influence the basin’s water cycle and precipitation characteristics [23]. The 2020 Shaanxi Province Hydrological Yearbook shows that coal mining in the Kuyi River Basin has increased by more than 300% since 2000. Large-scale underground mining voids may alter local evapotranspiration–precipitation feedback, thereby masking natural cycle signals. Numerical simulations show that subsidence areas can inhibit convective precipitation by 15–20% [24].
Consequently, we further analyzed changes in land-use patterns in the Kuye River Basin (Table 4). Although significant increases in developed land and decreases in unused land may lead to heat island effects and localized climatic changes, the coefficient of variation for interannual precipitation in the basin remains relatively low, indicating overall stability in annual precipitation levels. This suggests that while urbanization may impact the spatiotemporal distribution of precipitation, it does not necessarily lead to significant changes in annual precipitation on an interannual scale. Furthermore, the conversion of arable land and grasslands can influence evaporation and transpiration processes, potentially altering local microclimatic conditions. However, the multi-year average precipitation in the Kuye River Basin remains relatively stable at 445 mm, showing no significant upward or downward trend. This indicates that while land-use changes may affect precipitation distribution, the overall precipitation levels in the basin are still predominantly influenced by larger climatic factors.
The soil and water conservation efforts in the Kuye River Basin began in the 1950s, making it one of the earliest regions in China to implement such measures [25]. In recent years, the region has adhered to localized strategies, vigorously promoting afforestation, grass planting, windbreak and sand-fixing projects, flood diversion, and dam-building to intercept silt. Additionally, the comprehensive management of small watersheds has been actively pursued. By 2010, the total area managed for soil erosion amounted to 3173 km2, with more than 1360 silt detention dams and over 1580 small-scale water retention and soil conservation projects constructed. Afforestation, grass planting, and windbreak projects have significantly improved vegetation coverage in the basin. This change has not only enhanced soil and water conservation effectiveness but also improved the soil’s capacity to retain moisture. Healthy vegetation effectively reduces surface runoff, increases soil permeability, and enhances rainfall infiltration, indirectly influencing the basin’s precipitation and hydrological cycle [26].
Silt detention dams and small-scale water retention and soil conservation projects have also increased water retention and infiltration, thereby raising the groundwater levels and soil moisture. This retained moisture provides plants with necessary water during periods of insufficient rainfall, enhancing transpiration, which helps to maintain local humidity and promotes precipitation formation [27].
In conclusion, the seasonal and interannual variations in precipitation in the Kuye River Basin reflect the complex interactions between climate systems, land use, and the hydrological cycle. The spatiotemporal variations in precipitation are not solely the result of climate change but are also closely related to regional characteristics and human activities. Soil and water conservation efforts have contributed to improving the soil’s water retention capacity, increasing the efficiency of precipitation utilization, and fostering the sustainable development of the region’s ecological environment.

4.2. Causes of Future Changes in Precipitation

The variation coefficient (Cv) of multi-year precipitation in the Kuye River Basin is 0.24, indicating relatively small interannual precipitation fluctuations. This suggests that although there are fluctuations, the overall precipitation remains relatively stable. This stability may be attributed to the basin’s soil and water conservation measures, vegetation cover, and water resource management, which help to mitigate extreme precipitation variations. According to the cumulative anomaly curve, the future 30-year precipitation trend can be divided into two periods: a rising phase (2044–2052) and a declining phase (2023–2043). This cyclical variation may be related to the intrinsic variability of the climate system and external climatic factors, such as the El Niño phenomenon and monsoon activities, which contribute to significant precipitation changes across different periods [28]. The abrupt change in precipitation observed in 2043 signifies a notable shift in precipitation patterns around that year. This shift could be influenced by global climate system changes, anomalies in oceanic temperatures, or intensified human activities within the basin, such as urbanization and agricultural transitions, leading to sharp precipitation fluctuations.
(1) The influence of terrain on the spatial distribution of precipitation
The Kuye River Basin’s unique topography plays an important role in regulating the spatial distribution of precipitation. The northwestern part of the basin is higher than the southeastern part. These differences in elevation lead to marked spatial variations in precipitation distribution. The southeastern Wengjiachuan area is located on the windward slope of the summer monsoon. When warm, moist air currents encounter terrain elevation, they are prone to forming orographic precipitation. This results in significantly higher precipitation in the Wengjiachuan area, with an average annual precipitation of approximately 570 mm. In contrast, the northwestern wind and sand area is situated on the leeward slope. The subsidence and warming effect of air currents inhibits precipitation formation in this region, resulting in lower average annual precipitation, at around 458 mm. Additionally, the basin’s complex, hilly terrain may enhance local convective activity, making the southeastern region more prone to short-term, heavy afternoon rainfall in the summer. Research indicates that, in monsoon climate zones, the terrain has a particularly pronounced modulatory effect on precipitation distribution.
(2) The synergistic effect of topography and climate factors
The variation in precipitation is closely linked to the hydrological cycle within the basin. Climate change may alter processes such as evaporation, transpiration, and soil moisture, and these feedback mechanisms further impact the distribution and intensity of precipitation, resulting in different future precipitation trends [29].
Over the next 30 years, the spatial distribution of precipitation in the Kuye River Basin will be uneven, driven by multiple factors. Firstly, the topographical features result in lower precipitation in the northwest sandstorm-prone areas, where higher altitudes and arid climates prevail, while the southeastern Wenjiachuan region, with relatively lower altitudes, experiences increased precipitation due to the stronger influence of the monsoon. Secondly, the continental climate of the basin causes drier conditions in the northwest during spring and autumn, leading to lower precipitation, while the southeastern region, influenced by maritime climates, experiences frequent rainfall, particularly in the summer and flood seasons. Additionally, the northwest’s sparse vegetation cover and poor soil moisture retention capabilities limit precipitation infiltration and retention, whereas the southeast benefits from better vegetation conditions, aiding water retention. Human activities, such as land-use changes and urbanization, further exacerbate the uneven precipitation distribution. Dam-building in the sandstorm-prone areas of the northwest is less common than in the hilly gully regions, meaning that soil and water conservation efforts in the southeast may contribute to improved water retention and utilization. Lastly, differing hydrological characteristics across the basin, such as evaporation, transpiration, and surface water flow, also influence precipitation distribution, with the higher precipitation in the southeast further promoting a favorable hydrological cycle, enhancing the region’s precipitation advantages.
In summary, the changes in precipitation patterns and uneven spatial distribution in the Kuye River Basin from 2023 to 2052 are influenced by a complex interplay of factors, including topography, climatic characteristics, vegetation, soil properties, and human activities. These factors collectively contribute to the complexity and uncertainty of future precipitation patterns, reflecting the intricate relationship between the basin’s hydrological environment and climate change.

4.3. Discussion of Uncertainty

This study systematically analyzed precipitation changes in the Kuye River Basin based on CMIP5 climate models. This analysis is of great value in revealing the spatiotemporal characteristics of precipitation changes in the basin. However, there are still some uncertainties that need to be discussed in depth. With respect to the selection of climate models, although CMIP5 models have been extensively utilized in climate change research, they exhibit certain limitations in terms of physical process parameterization and spatial resolution in comparison to the more recent generation of CMIP6 models. The HadGEM3-RA model utilized in this study demonstrated satisfactory performance in short-term validation; however, the employment of a solitary model might not entirely capture the distinctions between models. It is noteworthy that this study conducted a thorough analysis of precipitation sequences using rigorous statistical test methods (e.g., the Mann–Kendall trend test and the Pettitt abrupt change test). These methods have the advantages of being less demanding on data distribution and having strong resistance to interference. This enables the effective identification of the trend and abrupt change characteristics of precipitation changes.
With regard to the data foundation, this study incorporated long-term meteorological observation data within the basin, spanning a period exceeding 60 years, thereby establishing a substantial data foundation for the analysis of long-term precipitation trends. However, it is crucial to acknowledge the potential impact of the uneven spatial distribution of meteorological stations on spatial precipitation analysis, particularly in the northwestern regions where stations are sparsely distributed. In terms of analytical methods, this study innovatively combined multiple statistical methods (trend regression, sliding t-test, ordered clustering, etc.) for cross-validation. This approach effectively reduces the uncertainty associated with a single method and enhances the reliability of abrupt change point identification.
In the present study, topographical factors were given significant consideration. The present study analyzed the relationship between the northwest–southeast topographical gradient and precipitation distribution in the watershed. The analysis revealed a significant influence of topographical elevation on spatial precipitation differentiation. This finding is of great value in understanding the mechanisms behind regional precipitation formation. However, given the 30 m resolution of the DEM data utilized, there are still limitations in depicting micro-topographical features. Subsequent studies that integrate higher-resolution LiDAR data are anticipated, to further refine the accuracy in analyzing the terrain–precipitation relationship.
With regard to the impact of human activity, this study systematically examined the potential effects of soil and water conservation projects and vegetation restoration measures on the watershed’s water cycle. This comprehensive analytical perspective has significant practical implications. However, the dynamic impacts of urbanization and its interactions with climate change require further quantitative analysis. A comprehensive analysis employing multiple methods and perspectives was utilized to conduct a thorough investigation into the characteristics and trends of precipitation changes within the Kuye River Basin. This comprehensive analysis yielded a comprehensive understanding of the subject. The findings of this study have the potential to offer a scientific foundation for the management of regional water resources and the implementation of ecological protection measures. However, given the inherent uncertainty surrounding climate change predictions, it is recommended that more climate model results be combined in practical applications and downscaling methods be used to further improve prediction accuracy. This would better serve the formulation of regional sustainable development strategies.

5. Conclusions

This study examines precipitation changes in the Kuye River Basin and forecasts future precipitation characteristics and distribution, leading to the following conclusions:
  • (1) Precipitation in the Kuye River Basin is primarily concentrated during the summer months (July–August) and the flood season (May–October). These two months account for 49.23% of the annual precipitation, while the flood season contributes a substantial 88.16%. In contrast, winter months (December–January) experience the least precipitation, comprising only 1.07% of the annual total, reflecting the pronounced influence of the continental monsoon climate.
  • (2) The multi-year average precipitation is 445 mm, characterized by relatively low interannual variability (coefficient of variation, Cv = 0.27), and exhibits an overall fluctuating upward trend. Notably, the year 2006 marked a regime shift in precipitation, after which a significant increase was observed, largely driven by natural phenomena (e.g., El Niño) and anthropogenic activities (e.g., soil and water conservation efforts).
  • (3) From 2023 to 2052, the multi-year average precipitation is projected to reach 524.69 mm, indicating a general upward trend. The coefficient of variation (Cv) for interannual variability is expected to decrease to 0.24, suggesting limited fluctuations. The year 2043 is identified as a potential point for a future precipitation regime shift, beyond which an increase in precipitation is anticipated. Spatially, precipitation is expected to exhibit a pattern of decreasing amounts in the northwest and increasing amounts in the southeast.
  • (4) The changes in precipitation are influenced by multiple factors, including climate change scenarios, the stability of the basin’s hydrological characteristics, topography, and anthropogenic activities such as soil and water conservation efforts. Among these, climatic factors are identified as the predominant influence, serving as the key driver of alterations in precipitation patterns throughout the basin. Moreover, human activities, particularly soil and water conservation measures, have a positive impact on enhancing local microclimates within the basin.

Author Contributions

B.L., Methodology, Writing—original draft; Q.L., Data curation; P.L., Writing—review and editing, Funding acquisition; Z.L., Conceptualization; J.G., Data curation; J.M., Methodology; B.W., Resources; X.L., Resources. All authors have read and agreed to the published version of the manuscript.

Funding

This study was supported by the National Natural Science Foundation of China (U2243201) and the Natural Science Basic Research Program of Shaanxi (Program No. 2024JC-YBQN-0306).

Institutional Review Board Statement

Not applicable.

Informed Consent Statement

Not applicable.

Data Availability Statement

The original contributions presented in this study are included in the article.

Acknowledgments

We sincerely thank all the co-authors for their significant contributions to the completion of this manuscript. Special thanks are extended to the editors and anonymous reviewers for their valuable comments and suggestions, which greatly improved the quality of this work. We are also grateful for the insightful discussions and oral communications from our colleagues.

Conflicts of Interest

Author Jiajia Guo was employed by the GEOVIS Earth Technology Co., Ltd. The remaining authors declare that the research was conducted in the absence of any commercial or financial relationship that could be construed as a potential conflict of interest.

References

  1. Zuo, H.; Lv, S.; Hu, Y. Variations Trend of Yearly Mean Air Temperature and Precipitation in China in the Last 50 Years. Plateau Meteorol. 2004, 2, 238–244. (In Chinese) [Google Scholar]
  2. Hu, J. Working Together to Address the Challenges of Climate Change—Remarks at the Opening Ceremony of the United Nations Climate Change Summit. Resour. Habitant Environ. 2009, 20, 13–15. [Google Scholar] [CrossRef]
  3. Li, G.; Harrison, S.; Bartlein, P.; Izumi, K.; Prentice, I. Precipitation scaling with temperature in warm and cold climates: An analysis of CMIP5 simulations. Geophys. Res. Lett. 2013, 40, 4018–4024. [Google Scholar] [CrossRef]
  4. Li, Q.; Yang, M.; Wan, G.; Wang, X. Spatial and temporal precipitation variability in the source region of the Yellow River. Environ. Earth Sci. 2016, 75, 594. [Google Scholar] [CrossRef]
  5. Zeng, Q. Mathematical problems in prediction and controlling of climate and environmental systems. Clim. Environ. Res. 2002, 7, 1–6. [Google Scholar] [CrossRef]
  6. Diffenbaugh, N.; Scherer, M. Using climate impacts indicators to evaluate climate model ensembles: Temperature suitability of premium winegrape cultivation in the United States. Clim. Dyn. 2013, 40, 709–729. [Google Scholar] [CrossRef]
  7. Plaga, L.; Bertsch, V. Methods for assessing climate uncertainty in energy system models—A systematic literature review. Appl. Energy 2023, 331, 120384. [Google Scholar] [CrossRef]
  8. Zhou, T.; Zou, L.; Wu, B.; Jin, C.; Song, F.; Chen, X.; Zhang, L. Development of earth/climate system models in China: A review from the Coupled Model Intercomparison Project perspective. J. Meteorol. Res. 2014, 28, 762–779. [Google Scholar] [CrossRef]
  9. Stevens, B. A Perspective on the Future of CMIP. AGU Adv. 2024, 5, e2023AV001086. [Google Scholar] [CrossRef]
  10. Klein, C.; Jackson, L.; Parker, D.; Marsham, J.; Taylor, C.; Rowell, D.; Guichard, F.; Vischel, T.; Famien, A.; Diedhiou, A. Combining CMIP data with a regional convection-permitting model and observations to project extreme rainfall under climate change. Environ. Res. Lett. 2021, 16, 104023. [Google Scholar] [CrossRef]
  11. Guo, X.; Xun, X.; Liu, D.; Zhang, M.; Chen, H.; Bao, F. Impacts of climate change and human activities on vegetation cover during the growing season in the Kuye River Basin. Trans. Chin. Soc. Agric. Eng. 2025, 41, 304–313. [Google Scholar] [CrossRef]
  12. Mann, H.B. Nonparametric test against trend. Econom. J. Econom. Soc. 1945, 13, 245–259. [Google Scholar] [CrossRef]
  13. Pettitt, A.N. A Non-Parametric Approach to the Change-Point Problem. J. R. Stat. Soc. 1979, 28, 126–135. [Google Scholar] [CrossRef]
  14. Pettitt, A.N. A simple cumulative sum type statistic for the change-point problem with zero-one observations. Biometrika 1980, 67, 79–84. [Google Scholar] [CrossRef]
  15. Ding, J. Statistical extrapolation of disturbance points in flood time series. Eng. J. Wuhan Univ. 1986, 5, 38–43. (In Chinese) [Google Scholar]
  16. Fu, C.; Wang, Q. The definition and detection of the abrupt climate change. Sci. Atmos. Sin. 1992, 16, 482–492. (In Chinese) [Google Scholar]
  17. Feng, Y.; Zhu, J. Analysis on Runoff Change and the Driving Force of the Liaohe River Basin Based on Morlet Wavelet. Res. Soil Water Conserv. 2019, 26, 208–215. (In Chinese) [Google Scholar]
  18. Hui, K.L. Monsoonal Precipitation in a Model Hierarchy: Impact of Continental Geometry and Global Warming. Ph.D. Thesis, California Institute of Technology, Pasadena, CA, USA, 2022. [Google Scholar] [CrossRef]
  19. Ma, Q.; Li, Z.; Lei, H.; Chen, Z.; Liu, J.; Wang, S.; Su, T.; Feng, G. Interannual Variability of Extreme Precipitation during the Boreal Summer over Northwest China. Remote Sens. 2023, 15, 785. [Google Scholar] [CrossRef]
  20. Alexander, L.; Uotila, P.; Nicholls, N. Influence of sea surface temperature variability on global temperature and precipitation extremes. J. Geophys. Res. 2009, 114, D18116. [Google Scholar] [CrossRef]
  21. Krashevska, V.; Stiegler, C.; June, T.; Widyastuti, R.; Knohl, A.; Scheu, S.; Potapov, A. Land-use change shifts and magnifies seasonal variations of the decomposer system in lowland tropical landscapes. Ecol. Evol. 2022, 12, e9020. [Google Scholar] [CrossRef]
  22. Wang, J.; Feng, J.; Yan, Z.; Hu, Y.; Jia, G. Nested high-resolution modeling of the impact of urbanization on regional climate in three vast urban agglomerations in China. J. Geophys. Res. Atmos. 2012, 117, D21103. [Google Scholar] [CrossRef]
  23. Nguyen, Q.; Ngo, H.; Vu, M. Climate change induced the altering in precipitation characteristics across the rice cultivation paddies of Vietnam. Mausam 2024, 75, 659–668. [Google Scholar] [CrossRef]
  24. Zheng, L.; Zhu, L.; Wang, W.; Guo, L.; Chen, B. Land Subsidence Related to Coal Mining in China Revealed by L-Band InSAR Analysis. Int. J. Environ. Res. Public Health 2020, 17, 1170. [Google Scholar] [CrossRef] [PubMed]
  25. Zhou, S.; Liu, L.; Shi, F. Making Soil and Water Conservation Regionalization with Quantitative Analysis of Multiple Factors—Taking the Kuyehe and Gushanchuan Watersheds as An Example. J. Soil Water Conserv. 1993, 7, 35–45. (In Chinese) [Google Scholar]
  26. Yuan, F. Hydrological Processes Modeling Considering the Effect of Vegetation. Ph.D. Dissertation, Hohai University, Nanjing, China, 2006. [Google Scholar]
  27. Xu, X.; Yan, P.; Liang, X. The Water Resources Effect of Typical Soil-saving Dams in Wudinghe River Drainage Basin—A Case Study in Xindian, Jiuyuan and Peijiamao Ditch. J. Arid Land Resour. Environ. 2008, 22, 78–83. (In Chinese) [Google Scholar]
  28. Song, W.; Wang, Q. CP El Nino and PDO Variability Affect Summer Precipitation over East China. Adv. Meteorol. 2020, 2020, 2747194. [Google Scholar] [CrossRef]
  29. Tsvetkova, O.V. Uncertainty in Climatic Change Impacts on Multiscale Watershed Systems. Ph.D. Dissertation, University of Massachusetts Amherst, Amherst, MA, USA, 2013. [Google Scholar] [CrossRef]
Figure 1. Geographic location of the Kuye River Basin.
Sustainability 17 06267 g001
Figure 2. Intra-annual distribution of precipitation in the Kuye River Basin.
Sustainability 17 06267 g002
Figure 3. Variation process line graph for annual precipitation in the Kuye River Basin.
Sustainability 17 06267 g003
Figure 4. Process line graph of annual precipitation anomalies in the Kuye River Basin.
Sustainability 17 06267 g004
Figure 5. Analysis of abrupt change points in annual precipitation in the Kuye River Basin.
Sustainability 17 06267 g005
Figure 6. Periodicity analysis of annual precipitation in the Kuye River Basin.
Sustainability 17 06267 g006
Figure 7. Statistics for heavy rainfall runoff in the Kuye River Basin from 1956 to 2019.
Sustainability 17 06267 g007
Figure 8. Variation process line graph for annual precipitation in the Kuye River Basin from 2023 to 2052.
Sustainability 17 06267 g008
Figure 9. Process line graph for annual precipitation anomalies in the Kuye River Basin from 2023 to 2052.
Sustainability 17 06267 g009
Figure 10. Testing for abrupt change points in future precipitation in the Kuye River Basin over the next 30 years.
Sustainability 17 06267 g010
Figure 11. Spatial distribution of multi-year average precipitation in the Kuye River Basin.
Sustainability 17 06267 g011
Table 1. Comparison of multi-year average precipitation in the Kuye River Basin (2006–2019) under various scenarios.
Climate ModelEmission ScenarioMulti-Year Average Precipitation/mmAbsolute Error/mmPercentage Bias/%
HadGEm3-RARCP4.5513.106.731.33%
RCP8.5511.655.281.04%
YSU-RSMRCP4.5468.4037.977.50%
RCP8.5437.0169.3613.70%
SNU-MM5RCP4.5346.40159.9731.59%
RCP8.5256.21250.1549.40%
RegCMRCP4.5487.9618.413.64%
RCP8.5442.0164.3612.71%
Observed Value/506.37//
Table 2. Statistical table of intra-annual distribution of precipitation in the Kuye River Basin.
MonthAverage Precipitation/mmProportionPeriodAverage Precipitation/mmProportion
12.380.53%Spring64.6814.53%
23.840.86%Summer269.860.62%
310.152.28%Autumn101.8922.89%
423.135.20%Winter8.691.95%
531.417.06%Wet Season392.115988.16%
650.7211.4%Dry Season52.658511.84%
7106.5423.94%
8112.5425.29%
963.0514.17%
1027.856.26%
1110.982.47%
122.410.54%
Table 3. Statistics for rainfall types in the Kuyi River Basin from 1956 to 2019.
RainfallRainfall TypeNumber of Days
<10 mmLight rain22,661
10–25 mmModerate rain522
25–50 mmHeavy rain153
50–100 mmTorrential rain38
100–250 mmExtreme torrential rain2
>250Extreme heavy rain0
Table 4. Transfer matrix of land-use types in the Kuye River Basin from 1980 to 2015 (km2).
Land-Use Types2015Total
CroplandForest LandGrass LandWatershedConstruction LandUnused Land
1980Cropland1344.6666.00197.705.49105.104.671723.60
Forest land3.02312.6737.092.2726.401.53382.99
Grass land94.9974.404787.526.55373.3762.035398.84
Watershed3.738.1419.71194.0628.887.33261.86
Construction land0.390.202.590.0977.710.1081.09
Unused land21.6315.43393.412.4738.93389.66861.52
Total1468.43476.835438.01210.93650.39465.328709.91
Disclaimer/Publisher’s Note: The statements, opinions and data contained in all publications are solely those of the individual author(s) and contributor(s) and not of MDPI and/or the editor(s). MDPI and/or the editor(s) disclaim responsibility for any injury to people or property resulting from any ideas, methods, instructions or products referred to in the content.

