Article

Segmental Calibration of Soil–Tool Contact Models for Sustainable Tillage Using Discrete Element Method

School of Engineering, Northeast Agricultural University, Harbin 150030, China
*
Author to whom correspondence should be addressed.
These authors contributed equally to this work and should be considered co-first authors.
Sustainability 2025, 17(18), 8126; https://doi.org/10.3390/su17188126
Submission received: 25 July 2025 / Revised: 30 August 2025 / Accepted: 1 September 2025 / Published: 9 September 2025

Abstract

In support of sustainable agricultural practices and soil conservation in black soil regions, the accurate modeling of soil–machine interactions is essential for optimizing tillage operations and minimizing environmental impacts. To achieve the precise calibration of interaction parameters between black soil and soil-engaging components, this paper proposes an innovative segmented calibration method to determine the discrete element parameters for interactions between black soil and agricultural machinery parts. The Hertz–Mindlin with Johnson–Kendall–Roberts (JKR) Cohesion contact model in the discrete element method (DEM) software was employed, using a two-stage calibration process. In the first stage, soil particle contact parameters were optimized by combining physical pile angle tests with multi-factor simulations guided by Design-Expert, resulting in the optimal parameter set (JKR surface energy 0.46 J/m2, restitution coefficient 0.51, static friction coefficient 0.65, rolling friction coefficient 0.13). In the second stage, based on validated soil parameters, the soil–65Mn steel interaction parameters were precisely calibrated (JKR surface energy 0.29 J/m2, restitution coefficient 0.55, static friction coefficient 0.64, rolling friction coefficient 0.07). Simulation results showed that the error between simulated and measured pile angles was less than 0.5%. Additionally, verification through rotary tillage operation tests comparing simulated and measured power consumption demonstrated that within the cutter roller speed range of 150–350 r·min−1, the power error remained below 0.5 kW. Ground surface flatness was introduced as a supplementary validation indicator, and the differences between simulated and measured values were small, further confirming the accuracy of the DEM model in capturing soil–tool interaction and predicting tillage quality. This paper not only enhances the accuracy of DEM-based modeling in agricultural engineering but also contributes to the development of eco-efficient tillage tools, promoting sustainable land management and soil resource protection.

1. Introduction

Sustainable agricultural production has emerged as a fundamental strategy for addressing global food security challenges and serves as a critical pathway toward achieving the United Nations’ Sustainable Development Goal 2 (Zero Hunger). Enhancing the sustainability of agricultural systems requires a comprehensive understanding and accurate simulation of the interaction mechanisms between soil and machinery. Such mechanisms constitute the essential foundation for optimizing tillage efficiency, reducing energy consumption, and safeguarding soil structure, thereby maintaining land productivity. Moreover, they directly contribute to the steady improvement of crop yields and the long-term transformation of agriculture toward sustainability. Consequently, strengthening both the research and practical application of soil–machine interactions is of paramount importance in supporting the dual objectives of ensuring food security and promoting sustainable agricultural development. Given the complexity and variability of soil, computer simulations are increasingly employed to model soil–tool interactions and analyze microscopic mechanical behaviors during contact processes [1,2]. By contributing to the development of efficient and sustainable tillage technologies, this paper supports the achievement of SDG 2 by promoting higher agricultural productivity and resilience in food systems. Discrete Element Modeling is a numerical method used for modeling the mechanical behavior of granular materials [3]. The method simplifies granular materials into a collection of particles with mass and shape [3], addressing interactions between individual particles and between particles and boundaries, thereby revealing the physical interaction properties between particles and boundaries [4]. Precise models of soil–tool interactions are crucial for designing and optimizing soil-engaging components. However, during the operation of soil-engaging components, the soil–machinery interaction is directly influenced by soil properties and dynamic behaviors, with significantly varying effects across different soil types. Therefore, before researching the interaction between agricultural implements and soil using the DEM [5], the primary task is to calibrate the simulation parameters between soil particles and between soil and soil-engaging components. The calibration of DEM simulation parameters ensures the accuracy of simulation results and enables the precise prediction of the interaction between soil-engaging components and soil particles.
To date, researchers worldwide have conducted studies on soil parameter calibration and soil–machine interactions using the DEM. Aikins et al. employed the Hysteretic Spring and Linear Cohesion models to calibrate the static and rolling friction coefficients of highly cohesive soil through repose angle tests and validated the accuracy of the parameter calibration between the furrow opener and soil particles through a furrow test [6]. Mustafa et al. [7] utilized the Hertz–Mindlin and Hysteretic Spring contact models to analyze soil plastic deformation under both cohesive and non-cohesive conditions through slope-climbing tests. Shi et al. [8] calibrated model parameters for farmland soil at six moisture levels by leveraging the advantages of the delayed elasticity model and linear adhesion model and validated the model’s effectiveness through duckbill planting trials. In summary, scholars both domestically and internationally have made progress in calibrating interaction parameters between soil particles and between soil and soil-engaging components using the DEM. They calibrated parameters such as soil static friction, rolling friction, restitution coefficient, and adhesion using various contact models. The accuracy of these parameters was validated through angle-of-repose tests, shear tests, and furrow tests.
This paper provides strong theoretical and methodological support for calibrating simulation parameters between soil particles and between soil–engaging components. However, in discrete element model calibration, most existing studies have not fully considered the combined influence of these two types of interactions on the calibration results. Significance tests are often used to identify key parameters, and yet, some parameters are overlooked in this process.
During soil–engaging component interactions, the primary contacts occur both between the tool and soil particles and among the soil particles themselves. For example, in rotary tillage, the blades cut and throw the soil, leading to fragmentation, compression, and collisions between particles. These processes involve complex and simultaneous interactions between the tool and soil, as well as among the soil particles.
If all the parameters obtained in the DEM model are considered, the number of experiments will be multiplied geometrically by too many factors in the design of the multi-factor test, and the number of experiments can be greatly reduced and the research efficiency can be improved by considering all factors through segmented calibration. The segmented method completes the parameter calibration between soil and soil and between soil and components in turn, in which the parameters after soil–soil calibration can be applied separately to other scenarios, and the application of parameters after calibration is more flexible.
The angle of repose, as an important parameter characterizing the macroscopic properties of particle flow and friction, plays a significant role in the parameter calibration of discrete element method (DEM) simulations. The sensitivity of the repose angle to the interparticle static friction coefficient, rolling friction coefficient, and the friction coefficient between particles and contacting materials varies with different measurement methods. Therefore, selecting an appropriate measurement method is necessary to ensure the accuracy of parameter calibration [9]. Wang et al. [10] calibrated the DEM parameters for corn straw powder using the injection method based on the particle accumulation angle, and the accuracy of the calibrated JKR model parameters was verified through comparative tests on the mold pore compression ratio. Wen et al. [11] conducted Plackett–Burman multi-factorial significance screening tests on four particle characteristic testing methods, the split cylinder method, tilting method, plate extraction method, and inclined plane method, demonstrating that the significant factors and the degree of their significance in the measurement results were affected by the testing methods. Xiang et al. [12] completed the calibration of simulation parameters for southern clay loam through stacking tests, and the effectiveness of the calibrated parameters was validated through the cavity formation experiment. Peng et al. [13,14] proposed a method based on the injection principle in which granular materials were slowly poured through a funnel orifice. During this process, the particles underwent collisions, static friction, and dynamic friction until forming a stable repose angle. This method was used to calibrate the DEM parameters of feed particles. Its feasibility was demonstrated through simulations and physical tests, which showed a high degree of similarity in the repose angle formed by particle clusters. Ma et al. [4] employed the Hertz–Mindlin with JKR Cohesion contact model within the DEM to study heavy clay soils with moisture contents of 12.46% ± 1.5 and 17.15% ± 1%. Using the soil repose angle as the response variable, they calibrated the contact parameters of soil–soil and soil–engaging components (65Mn, UHMW-PE, and PE). These studies demonstrated that the rational use of repose angle measurement methods can effectively improve the accuracy of parameter calibration in DEM, ensure the physical significance of key parameters, and optimize the contact model settings in simulation, thereby improving the reliability and engineering applicability of the results.
Although domestic and international studies have extensively focused on calibrating soil–soil interaction parameters, research on the contact parameters between soil and soil-engaging components made of different materials remains relatively limited. In practical operations, complex interactions occur simultaneously between soil particles and between soil and machinery components, and their combined effects critically influence DEM simulation accuracy. The scientific problem addressed in this study was, therefore, how to develop a reliable DEM parameter calibration method that accurately captured the mechanical behavior of high-water-content cohesive soils interacting with components of different materials, while maintaining the physical significance of the parameters, to improve the precision and engineering applicability of soil–tool interaction simulations.
To address this problem, a numerical model of soil–tool interaction was constructed based on the Hertz–Mindlin with JKR Cohesion contact model, and a segmented calibration method was proposed. First, physical repose angle tests and multi-factor simulations were employed to optimize soil–soil contact parameters such as surface energy and friction coefficients. Subsequently, the optimized soil particle parameters were applied in multi-factor simulation tests to calibrate soil–component contact parameters, thereby establishing a systematic DEM parameter calibration framework. This stepwise approach effectively reduced coupling-induced errors inherent in conventional full-parameter calibration while ensuring that the calibrated parameters retained clear physical significance. The reliability of the proposed method was further validated by simulating rotary tiller cutter operations and comparing the predicted power consumption with ground surface flatness.
The segmented calibration method addressed the problem by breaking the process into distinct stages. This technique involved sequentially completing the parameter calibration for soil–soil interactions and then for soil-component interactions. A key advantage of this approach was that the parameters determined from the soil–soil calibration could be independently applied to other scenarios. This modularity not only drastically cut down on the total number of experiments but also enhanced the flexibility of how the calibrated parameters were used. In this study, all soil–soil contact parameters were calibrated using the segmented approach, which allowed them to be extracted and directly applied in subsequent analyses involving soil–component interactions, thus providing a robust basis for further research. These advantages make the method not only a technical improvement in DEM parameter calibration but also a practical tool for the research and development of key agricultural machinery components. The method is primarily intended for agricultural machinery manufacturers and researchers in agricultural engineering. They provide reliable parameter sets for the virtual prototyping of soil-engaging components, which can reduce physical trial-and-error costs. The calibrated model can effectively capture adhesive interactions both among soil particles and at the soil–tool interface, which are critical in field operations such as pre-sowing furrow opening, where excessive adhesion often leads to poor furrow quality and increased energy consumption. By enabling virtual simulations before physical prototyping and field testing, the method allows the reliable prediction of operational outcomes and optimization of implement design, helping reduce adhesion, improve furrow quality, and lower energy requirements. In this way, it not only shortens the development cycle and reduces costs but also supports the development of green, energy-efficient, and environmentally responsible agricultural machinery. By providing reliable parameter sets for virtual prototyping of soil-engaging components, this work contributes to sustainable soil management and advances environmentally friendly mechanized farming practices.

2. Materials and Methods

2.1. Test Material

(1)
Materials in the calibration experiment
The soil samples used in this study were collected from the experimental field of Northeast Agricultural University (126.726° E, 45.743° N) in Heilongjiang Province, northeastern China, where the soil type is classified as black soil (Mollisols under the Food and Agriculture Organization of the United Nations (FAO) system), a fertile and highly cohesive soil rich in organic matter, widely distributed in Northeast China and of great importance for agricultural production due to its high fertility and strong structure. The physical experiments were conducted under controlled laboratory conditions, with an ambient temperature of 22 ± 2 C and relative humidity of 55 ± 5%, to minimize the influence of environmental factors on soil properties [15]. To determine the soil moisture content, the wet-basis method was employed using a DHG-9030 Blue pard oven (manufactured by Blue pard Instruments Co., Ltd., Shanghai, China.), following ASTM D2216-19 standards [16] for soil moisture measurement, yielding a moisture content of 17.2% ± 0.8%. The soil moisture content was set based on the average field condition (17.2% ± 0.8%) in black soil regions during the tillage season to ensure realistic applicability [4]. The elastic modulus of the black soil was measured as 1 × 10⁶ Pa with a Poisson’s ratio of 0.46 using a BAJ-2 strain-controlled direct shear apparatus (manufactured by Nanjing Soil Instrument Factory Co., Ltd., Nanjing, China.), in accordance with ASTM D3080/D3080M-11 [17]. Soil density was determined via liquid displacement using toluene as the displacement liquid to account for water absorption effects, following ISO 17892-2:2014 [18] procedures, yielding a bulk soil density of 1.56 g/cm3. According to national agricultural machinery standards, the absolute moisture content of the soil should be 15–25%. A predetermined amount of water was added to achieve the target moisture content. Bulk density and soil moisture were monitored during the experiment as 1.30 g/cm3 and 16.31%, respectively. The soil shear modulus was measured as 1 × 10⁸ Pa using a triaxial testing system, following ASTM D4767-11 [19].
Considering that materials for soil-engaging components in agricultural machinery are predominantly 65Mn steel, this study selected 65Mn steel as the tool material. The choice was justified because 65Mn steel is widely used in rotary tillage blades due to its high hardness and wear resistance [20]. Based on literature reviews, the density, Poisson’s ratio, and shear modulus of 65Mn steel were determined as 7.865 × 10³ kg/m3, 0.3, and 7.9 × 10¹⁰ Pa, respectively [21]. The terrain was selected to represent typical farmland in Northeast China, which is predominantly on flat plains. The physical experiment on the accumulation angle setup employed in this study consisted of a funnel, support column, size plate, and base, as illustrated in Figure 1.
(2)
Verification of the materials in the experiment
The experiment was conducted in the soil bin at Northeast Agricultural University. The soil bin measured 80 m long × 3 m wide, with a soil depth of 1.5 m. The rotary tiller used in the experiment was the 1GKN-160 model, with specific parameters listed in Table 1. This rotary tiller was equipped with 36 IT225 GB-standard [22] curved blades (18 on the left and 18 on the right, installed symmetrically).

2.2. Test Methods

2.2.1. Calibration of Soil Interparticle Parameters

(1)
Selection of interparticle contact model in discrete element method
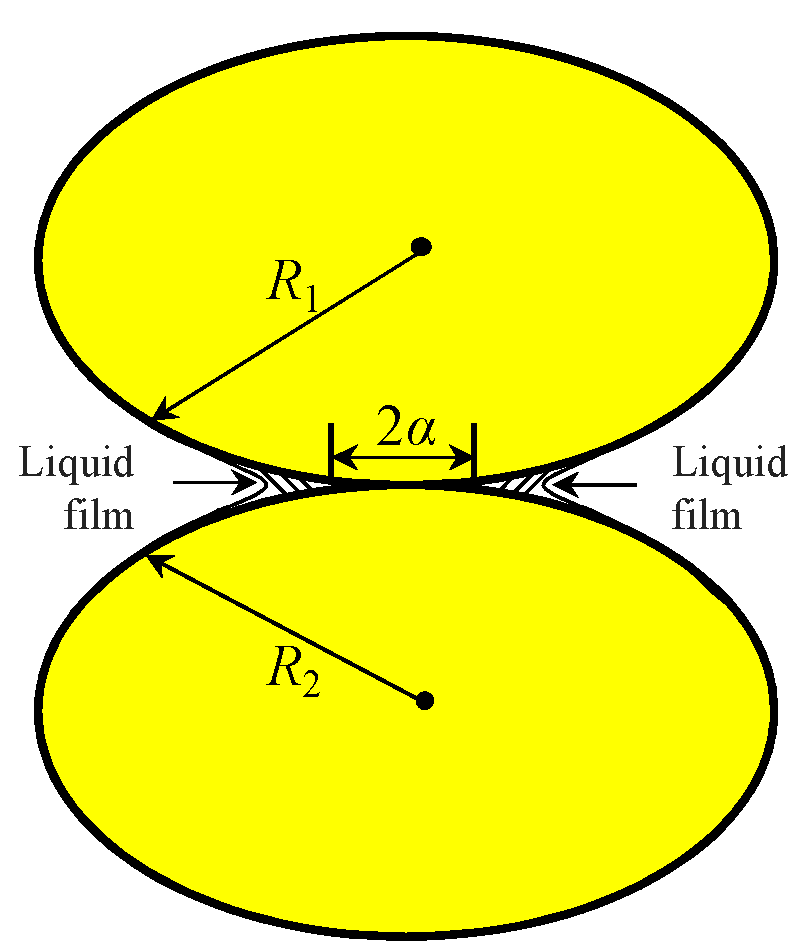
The interparticle contact parameters of the soil were calibrated by combining physical experiments on accumulation angle with EDEM simulation experiments. The Hertz–Mindlin with JKR Cohesion model (hereinafter referred to as the JKR model) is a contact model that accounts for van der Waals forces between particles. Building on the Hertz contact theory, this model incorporates the Johnson–Kendall–Roberts (JKR) theory, enabling the calculation of cohesive forces between moist particles and simulating the agglomeration effects of high-moisture particle groups. For the high-moisture black soil in Northeast China, which exhibits inherent cohesion between particles, the JKR model was selected to simulate the cohesive interactions between black soil particles under high moisture conditions. This model was applied for parameter calibration in discrete element simulations. As illustrated in Figure 2, the normal force FJKR in the JKR model is related to parameters such as surface energy and particle overlap.
The calculation is expressed in Formula (1), where all variables are defined as follows.
F JKR = 4 π γ E α 3 2 + 4 E 3 R α 3
where FJKR represents the normal force between particles while γ denotes the surface energy of the particle. The variables E and R correspond to the elastic modulus and equivalent radius of the particle, respectively.
(2)
Physical experiment on accumulation angle for soil particles
The accumulation angle (also known as the rest angle) was a critical macroscopic parameter characterizing the flow and frictional properties of granular materials. In this study, precise measurements were obtained through standardized accumulation angle experiments, as shown in Figure 3a. The experiment utilized black soil samples with a strictly controlled moisture content of 17.2 ± 0.8%. After grinding and sieving through a 4 mm mesh to ensure particle uniformity, the soil was experimented on using a custom-built accumulation angle apparatus. The procedure included the following. Soil particles were uniformly dropped onto a water platform via a funnel to form a stable accumulation. A four-directional synchronized imaging system was employed to record the accumulation morphology. Data analysis was performed using MATLAB (R2024b) image processing algorithms, including grayscale conversion, binarization and noise reduction, and boundary extraction. The boundary line equation of the accumulation profile was obtained through linear regression fitting. The slope of this line was then used to compute the accumulation angles in four directions by applying the arctangent function (arctan). The average of the four directional accumulation angles was taken as the final measured value for the accumulation angle of the image.
(3)
Multi-factor simulation experiment for calibration of interparticle contact parameters in discrete element method
A discrete element simulation model was established based on the dimensions of the physical accumulation angle experiment setup. The funnel had a top diameter of 192 mm, bottom diameter of 50 mm, and a height of 274 mm while the base plate was a 400 mm × 400 mm square. The soil particle diameters were set to 2–4 mm [17]. The fundamental soil parameters in the simulation matched those measured in Section 2.1 of this study. To isolate the calibration of interparticle contact parameters, all entity properties in the simulation model were characterized by soil parameters, thereby eliminating interference from other materials.
In studies on the calibration of simulation parameters for agricultural materials, this experimental method has already been demonstrated in the literature [4,9,12] to efficiently and accurately reproduce experimental results. In this work, given that the reasonable ranges for the parameters of soil–soil and soil-component interactions had been well-established in the literature and confirmed by our preliminary simulation trials, selecting the Box–Behnken design, whose points operate entirely within the predefined factor levels, avoided testing parameter combinations that were physically unrealistic. Furthermore, to account for any potential impact of the Box–Behnken design on result precision, post-calibration verification through physical experiments was essential. Each treatment was independently repeated three times (n = 3) to reduce random variation, and the average values were used for subsequent analysis, ensuring reproducibility and reliability. Through preliminary simulation trials and references to previous literature, the level values for each factor were determined as listed in Table 2 [4,23]. All experimental results were subjected to error analysis using the Z-score method, as calculated by Equation (2). Any data point with an absolute Z-score greater than 3 was identified as an outlier, and discarded, and the corresponding experiment was repeated. The qualified data were retained for subsequent normality testing and analysis of variance (ANOVA).
Z = X i μ σ
where Z represents the standard score, Xi represents the outcome of the i-th experiment, μ represents the average value, and σ represents the standard deviation.

2.2.2. Calibration of Contact Parameters Between Black Soil and Soil-Engaging Components

(1)
Physical accumulation angle experiment for soil-engaging component–soil particle interactions
Using the accumulation angle experiment apparatus described in Section 2.1, soil particles were released through a funnel to collide with a 65Mn steel base plate, forming a soil pile as shown in Figure 3b. Following the same method outlined in Section 2.2.1, the arctangent function (arctan) was applied to the slopes of the four-directional pile boundaries derived from linear regression. The average of these four values was taken as the final accumulation angle measurement for the image.
The discrete element simulation model from Section 2.2.1 was employed, with intrinsic parameters for both the soil and 65Mn steel soil-engaging components set to match those in Section 2.1. The calibrated interparticle soil contact parameters from Section 2.2.1 were retained while the material of the apparatus was changed to 65Mn steel to calibrate contact parameters between soil particles and soil-engaging components. The JKR surface energy, collision recovery coefficient, static friction coefficient, and rolling friction coefficient between soil particles and the soil-engaging components were selected as factors, with the accumulation angle as the evaluation index. Based on preliminary simulations and references to the literature, the level values for each factor were determined as listed in Table 3 [4,23].

2.3. Validation Experiment

The relative error between simulation and physical experiments serves as a critical criterion for evaluating the accuracy of the discrete element model and its parameters. Simulation parameters were set based on the optimal parameter set calibrated from soil particles and black soil–component interactions. The simulation model was established based on the 1GKN-160 rotary tiller used in physical experiments, adopting the same blade shaft rotational speeds and forward speed as in the field trials. The operational speed of the rotary tiller was set to 1 km/h, and the blade shaft rotational speed was tested at five levels: 150, 200, 250, 300, and 350 r/min. After completing both physical and simulation experiments, power consumption and ground surface flatness were measured from the same set of trials. The relative error of power consumption was calculated to validate the accuracy of the calibrated discrete element simulation parameters. Ground surface flatness was introduced as a supplementary validation indicator, quantified by measuring the proportion of soil effectively displaced or crushed during tillage. A smaller Sd indicated higher ground surface flatness and better tillage quality. Based on the acquired data, ground surface flatness was calculated using Equations (3) and (4), with five equidistant points selected on the tilled soil surface after each operation for evaluation, allowing a comprehensive assessment of soil–tool interaction performance.
d = i = 1 n d i n
S d = i = 1 n ( d i d ) 2 n 1
where Sd represents the ground surface flatness (mm), di represents the vertical distance from each part of the ground to the standard surface (mm), and d represents the average value of the distance from all measurement points to the standard surface (mm).

3. Results

3.1. The Results and Analysis of the Calibration Test of Contact Parameters Between Soil Particles

The simulation results are shown in Table 4.
Prior to conducting the analysis of variance, a normality test was carried out for the soil–soil repose angle data. The results showed that the significance values of both the Kolmogorov–Smirnov and Shapiro–Wilk tests were greater than 0.05, indicating that the soil–soil repose angle data followed a normal distribution, as shown in Table 5.
The analysis of variance for the experimental results presented in Table 4 was conducted and is summarized in Table 6. It was demonstrated that the soil accumulation angle–soil contact parameter regression model exhibited an exceptionally high level of significance (p < 0.0001), indicating that the accumulation angle could be reliably explained by the selected soil contact parameters. Among the four experimental factors, x1 (surface energy), x2 (coefficient of restitution), x3 (static friction coefficient), and x4 (rolling friction coefficient) were all identified as significant contributors to the accumulation angle variation, with their influence hierarchy ranked as x3 > x1 > x2 > x4. This suggests that the static friction coefficient (x3) plays the dominant role in determining the soil accumulation angle, reflecting the fact that interparticle resistance to sliding is the primary factor controlling soil pile stability. Surface energy (x1) and the coefficient of restitution (x2) were also found to exert extremely significant effects, which can be attributed to their influence on particle cohesion and energy dissipation during collision, respectively. By contrast, rolling friction (x4) had a relatively weaker but still notable effect on soil stacking behavior.
With respect to interaction terms, x1x3 and x1x4 were observed to display significant impacts, highlighting the coupled effect of surface energy with interparticle sliding and rolling resistance. This indicates that cohesive forces act in combination with frictional properties to alter the soil accumulation angle more significantly than when acting alone. Regarding quadratic terms, x 4 2 was revealed to possess extremely significant influence (p < 0.0001), suggesting that rolling friction exhibits a non-linear effect on pile stability, especially at higher values. Additionally, x 1 2 was identified as moderately significant, implying that cohesion shows a threshold behavior beyond which its marginal effect on accumulation angle diminishes. Other quadratic terms were determined to be irrelevant.
Following the elimination of non-significant terms, the regression model relating soil contact parameters to the accumulation angle was rigorously fitted using Design-Expert software (version 13), as expressed in Equation (5). The model achieved a coefficient of determination of R2 = 0.947, thereby confirming that the fitted equation is both meaningful and credible for predicting soil accumulation behavior based on calibrated contact parameters.
y = 37.34 + 1.59 x 1 1.18 + 1.98 + 0.80 x 4 2.38 x 1 x 3 1.75 x 1 + 1.22 x 1 2 1.52 x 4 2

3.1.1. Interaction Effect of Contact Parameters Between Soil Particles

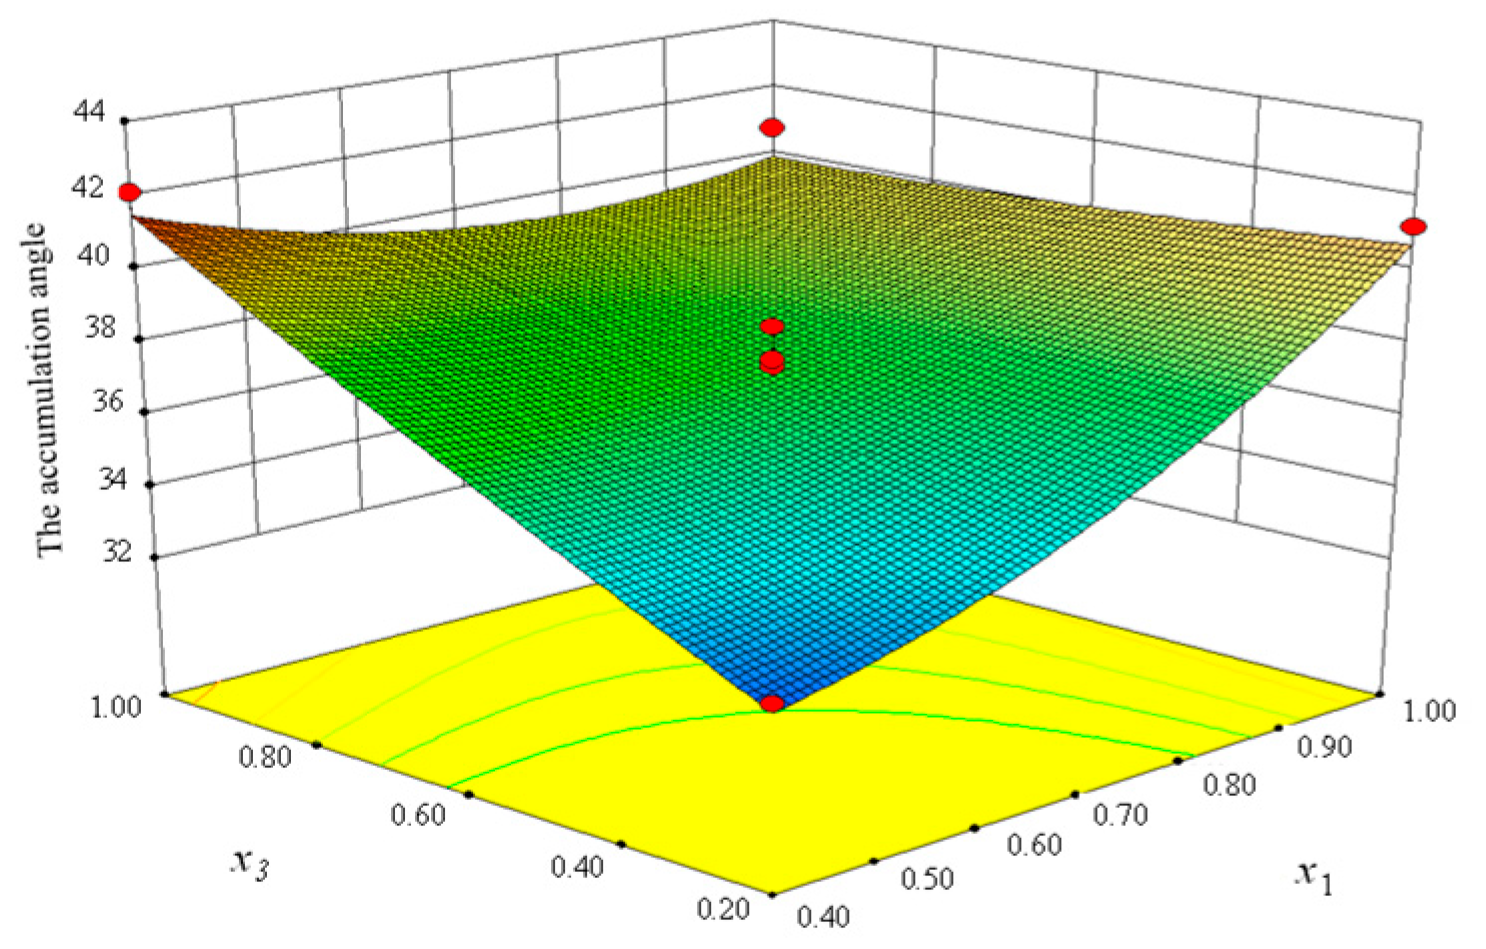
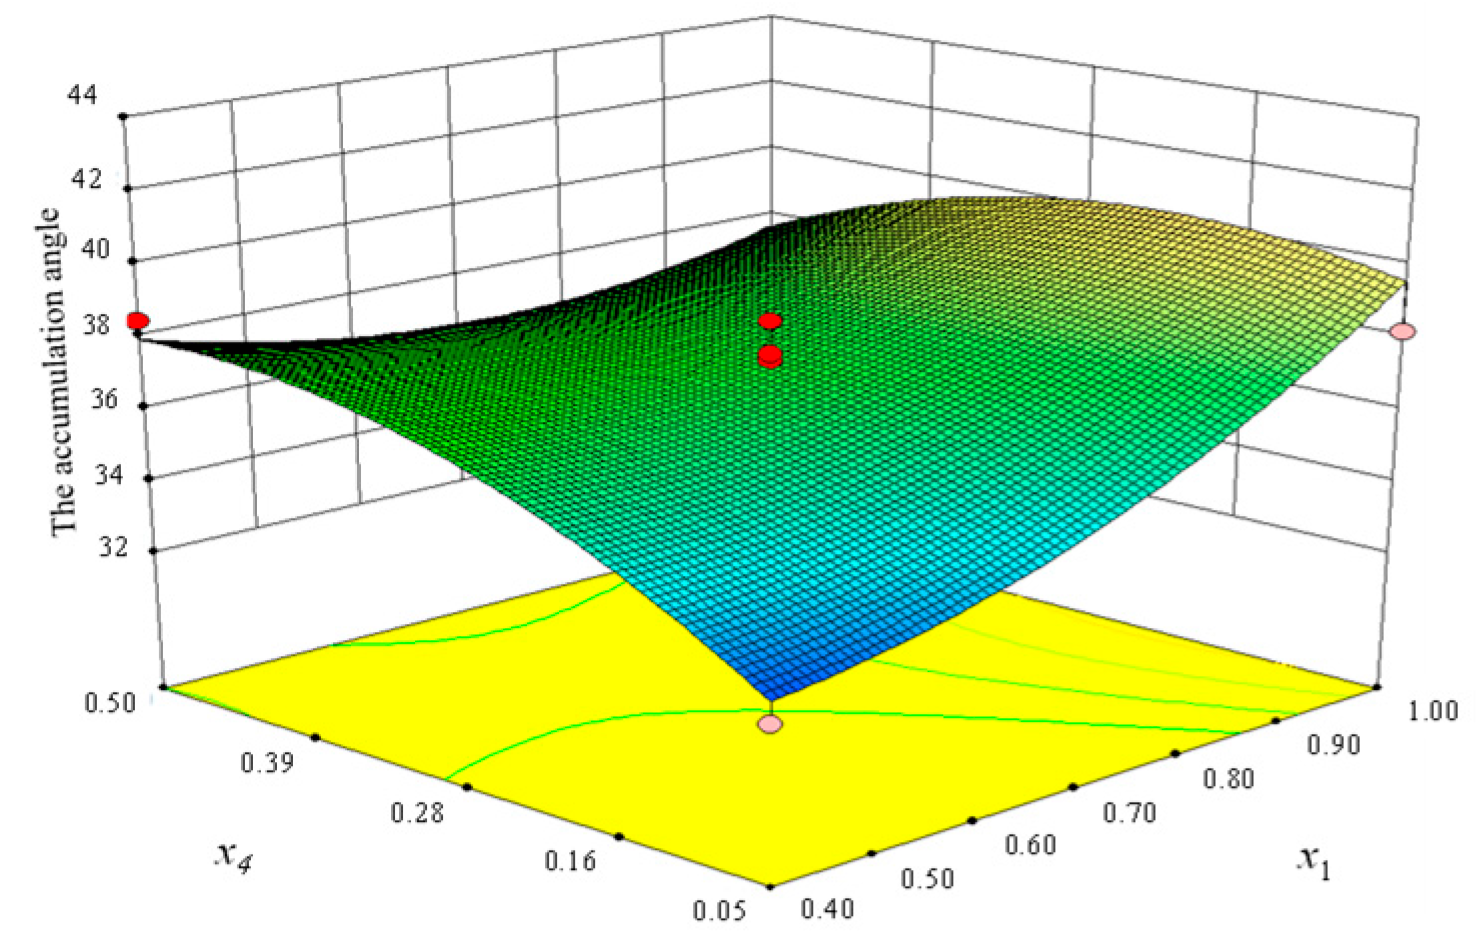
The accumulation angle was selected as the response variable in this experimental investigation. Through the analysis of variance, the interaction terms (x1x3, x1x4) of JKR surface energy (x1), static friction factor (x3), and rolling friction factor (x4) between the soil particles on the accumulation angle were highly significant (p < 0.01). To elucidate the underlying mechanism, interaction response surface plots were constructed and subsequently analyzed, through which the interactive effects of various influencing factors on the response value were further examined.
(1)
The interaction between JKR surface energy and static friction coefficient
When the static friction coefficient (x3) was relatively high (x3 = 1.0), an increase in the JKR surface energy (x1) was initially found to significantly suppress the growth of the accumulation angle as shown in Figure 4. This suppression was attributed to the restriction of particle slippage caused by the elevated static friction. Under these conditions, a further increase in the JKR surface energy (x1) led to an enhancement in the rigidity of particle aggregates, which in turn resulted in a reduction in the natural repose stability of the accumulation angle. However, when the JKR surface energy (x1) exceeded a critical threshold, an upward trend in the accumulation angle was observed. This trend was ascribed to the strengthened interparticle cohesion induced by the increased JKR surface energy (x1) while the high static friction (x3) continued to inhibit particle slippage. The synergistic effect of these two factors was found to significantly enhance the stability of the soil pile. In contrast, when the static friction coefficient was low (x3 = 0.2), the positive effect of the JKR surface energy (with a coefficient of +1.59) became dominant. The cohesive forces promoted particle aggregation, and the accumulation angle was observed to increase with increasing JKR surface energy. This indicated that under low-friction conditions, the dominant role of surface energy was fully manifested [12,24].
(2)
The interaction between JKR surface energy and rolling friction coefficient
When the JKR surface energy was maintained at a high level (x1= 1.0 J/m2), an increase in the rolling friction coefficient (x4) resulted in a declining trend in the accumulation angle as illustrated in Figure 5. This behavior was attributed to the suppression of particle rolling induced by the elevated rolling friction, which limited particle rearrangement and impeded the formation of a densely packed structure. Moreover, the high JKR surface energy (x1) implied strong interparticle cohesion, which promoted the development of stable but loosely arranged aggregates rather than densely interlocked configurations. Consequently, under such conditions, the restricted particle reorganization due to the increased rolling friction coefficient resulted in a reduced accumulation angle. When the JKR surface energy was maintained at a low level (x1 = 0.4 J/m2), the interparticle cohesive forces were relatively weak, and particle interactions were primarily governed by frictional effects. Under these circumstances, an increase in the rolling friction coefficient (x4) further suppressed particle rolling, limiting slippage and positional adjustment. This restriction facilitated the formation of more stable aggregates, resulting in the increased accumulation angle. Therefore, under low-JKR-surface-energy conditions, particle flow behavior was predominantly influenced by frictional parameters, with enhanced rolling friction further constraining relative motion between particles, ultimately leading to the greater accumulation angle [12,24].

3.1.2. Optimal Combination Optimization and Verification of Contact Parameters Between Soil Particles

The left and right boundary equations were determined through physical experiments in Section 2.2.1, and their expressions are given in Equations (6) and (7), with the corresponding inclination angles measured as 35.07° and 35.37°, respectively. The accumulation angle of black soil was ultimately measured as 35.2° through experimental evaluation. This value was adopted as the optimization target, and the regression model for the soil accumulation angle was iteratively optimized using Design-Expert software, through which multiple optimal solutions were obtained. Based on these optimization results, interparticle contact parameters were systematically configured, and simulation tests for the soil accumulation angle were subsequently conducted. A parameter set exhibiting the highest consistency with the physical experimental results was rigorously identified, comprising a JKR surface energy of 0.46 J/m2, collision recovery coefficient of 0.51, static friction coefficient of 0.65, and rolling friction coefficient of 0.13. Numerical simulations executed using this parameter combination yielded the accumulation angle of 35.2°, which was found to be identical to the physical experimental measurement. The equivalence between the simulated and experimental soil accumulation patterns was further visually confirmed through comparative analysis, as explicitly illustrated in Figure 6.
y = 0.7021 x + 741.1382
y = 0.7103 x + 221.4673

3.2. Calibration Test Results and Analysis of Contact Parameters Between Black Soil and Soil-Engaging Components

The simulation test results are presented in Table 7.
Similarly, for the soil–component repose angle data, the Kolmogorov–Smirnov and Shapiro–Wilk test results also yielded significance values greater than 0.05, confirming that these data conformed to a normal distribution and were appropriate for subsequent ANOVA, as shown in Table 8.
An analysis of variance was conducted on the test results in Table 7, with the outcomes summarized in Table 9. The results showed that the p-value for the soil accumulation angle–soil contact parameter model was less than 0.0001, indicating that the regression model was highly significant. Among the four experimental factors, x5, x6, x7, and x8, all had extremely significant effects on the accumulation angle, with the influence order ranked as x7 > x5 > x6 > x8. Physically, this suggests that parameter x7, which primarily governs the rolling resistance between soil particles, plays the dominant role in stabilizing soil aggregates and directly determines the stacking angle. Parameter x5, associated with cohesive forces, also contributes substantially by affecting the tendency of soil particles to adhere, while x6 and x8 (related to restitution and friction) exert relatively smaller but still non-negligible influences.
In addition, significant interaction effects were observed for x5x7 and x5x8, implying that the combined influence of soil cohesion and rolling friction has a pronounced effect on soil pile stability. The quadratic terms x 5 2 and   x 8 2 were also extremely significant, indicating that excessive increases or decreases in cohesion and static friction beyond their optimal ranges could cause non-linear changes in the accumulation angle. By contrast, the quadratic effects of other parameters were negligible.
After removing the insignificant terms, the regression model describing the relationship between soil interparticle contact parameters and the accumulation angle was fitted using Design-Expert software, as expressed in Equation (8). The model exhibited excellent goodness-of-fit (R2 = 0.957), demonstrating both its strong statistical reliability as well as its ability to capture the underlying physical mechanisms governing soil particle accumulation.
y = 35.16 + 1.62 x 5 1.23 + 1.98 + 1.07 x 8 2.35 x 5 x 7 1.77 x 5 + 1.36 x 5 2 1.78 x 8 2

3.2.1. Interaction Effects of Contact Parameters at Soil–Implement Interface

(1)
Interaction between JKR surface energy and static friction coefficient
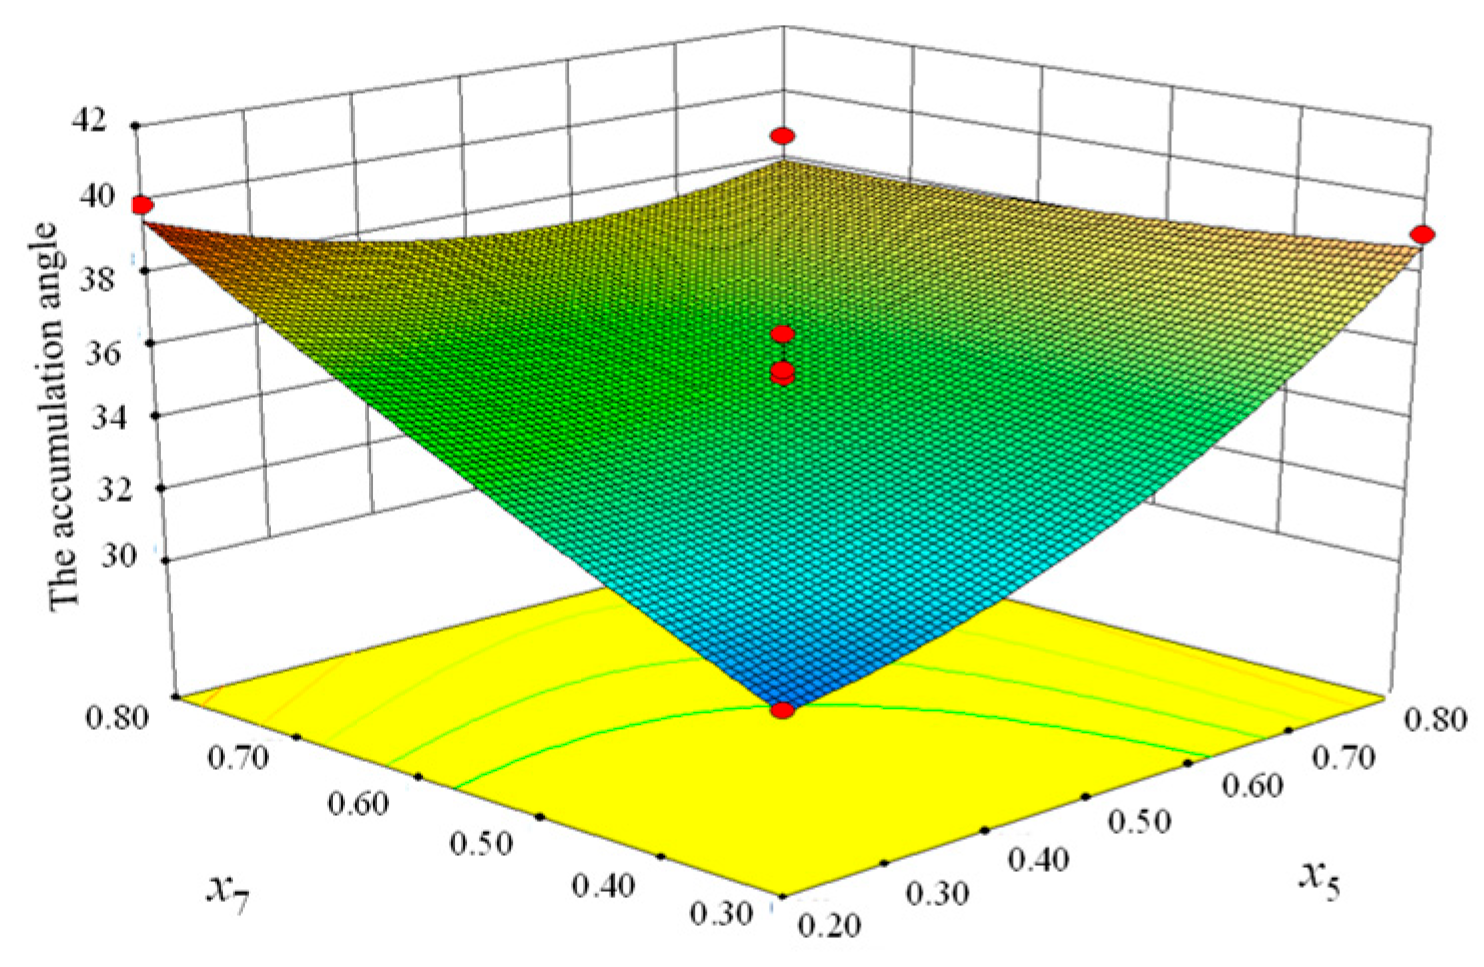
As shown in Figure 7, the interaction between JKR surface energy (x5) and static friction coefficient (x7) exhibited a distinct curved surface trend in its effect on the accumulation angle. When JKR surface energy was at a low level (x5 = 0.2 J/m2), the accumulation angle was significantly affected by variations in the static friction coefficient (x7), which increased significantly with higher static friction coefficients. This occurred because the weaker interparticle adhesion forces made particle stability primarily dependent on static friction. Under these conditions, the increase in static friction coefficient (x7) enhanced the particles’ anti-sliding capability, thereby elevating the accumulation angle.
When JKR surface energy was at a high level (x5 = 0.8 J/m2), the effect of variations in static friction coefficient (x7) on accumulation angle became more moderate, and the enhanced interparticle adhesion promoted the formation of larger particle clusters, which reduced individual particles’ freedom to slide. In this scenario, the role of static friction coefficient was partially superseded by adhesion forces, diminishing the effect of a further-increasing static friction coefficient on the accumulation angle [25].
(2)
Interaction between JKR surface energy and rolling friction coefficient
As shown in Figure 8, when JKR surface energy was maintained at a low level (x5 = 0.2 J/m2), with the increase of the rolling friction coefficient the accumulation angle exhibited an increasing trend. This phenomenon was attributed to the relatively weak interparticle adhesion forces, rendering the system predominantly dependent on rolling friction to sustain particle accumulation stability. Under conditions of diminished rolling friction coefficient (x8), particles were more prone to rolling and rearrangement, consequently reducing the accumulation angle. Conversely, when the rolling friction coefficient (x8) was increased, particle rolling was effectively constrained, thereby enhancing overall stability and increasing the accumulation angle.
When JKR surface energy was increased to a high level (x5 = 0.8 J/m2), the impact of rolling friction coefficient (x8) was comparatively mitigated, with the accumulation angle stabilizing as the rolling friction coefficient was increased. This behavioral pattern was principally governed by substantially enhanced interparticle adhesion forces, which promoted particle agglomeration into clusters rather than relying on frictional mechanisms to maintain accumulation. Consequently, the effect of rolling friction coefficient (x8) was reduced, and its incremental augmentation yielded only marginal improvements in the accumulation angle [26].

3.2.2. Optimization and Validation of Optimal Contact Parameters Between Soil and Soil-Engaging Components

Through the physical experiments detailed in Section 2.2.2, the left and right boundary equations were derived as Equations (9) and (10), corresponding to inclination angles of 32.68° and 33.03°, respectively, with the final accumulation angle of black soil determined to be 32.9°. This measured value served as the optimization target for the regression model of the black soil accumulation angle, which was subsequently solved using Design-Expert software to generate multiple optimal solutions. Based on these solutions, the interfacial contact parameters between soil and implements were systematically configured and validated through discrete element method (DEM) simulations of soil accumulation.
y = 0.6409 x + 820.2882
y = 0.6095 x + 335.1461
The optimized contact parameters set exhibiting the closest agreement with physical tests results were identified as follows: a JKR surface energy of 0.29 J/m2, collision recovery coefficient of 0.55, static friction coefficient of 0.64, and rolling friction coefficient of 0.07. This parameter combination yielded a simulated accumulation angle of 32.9°, demonstrating exceptional consistency with experimental measurements. The comparative visualization of soil accumulation patterns between simulations and physical experiments are presented in Figure 9.

3.3. Analysis of Validation Test Results

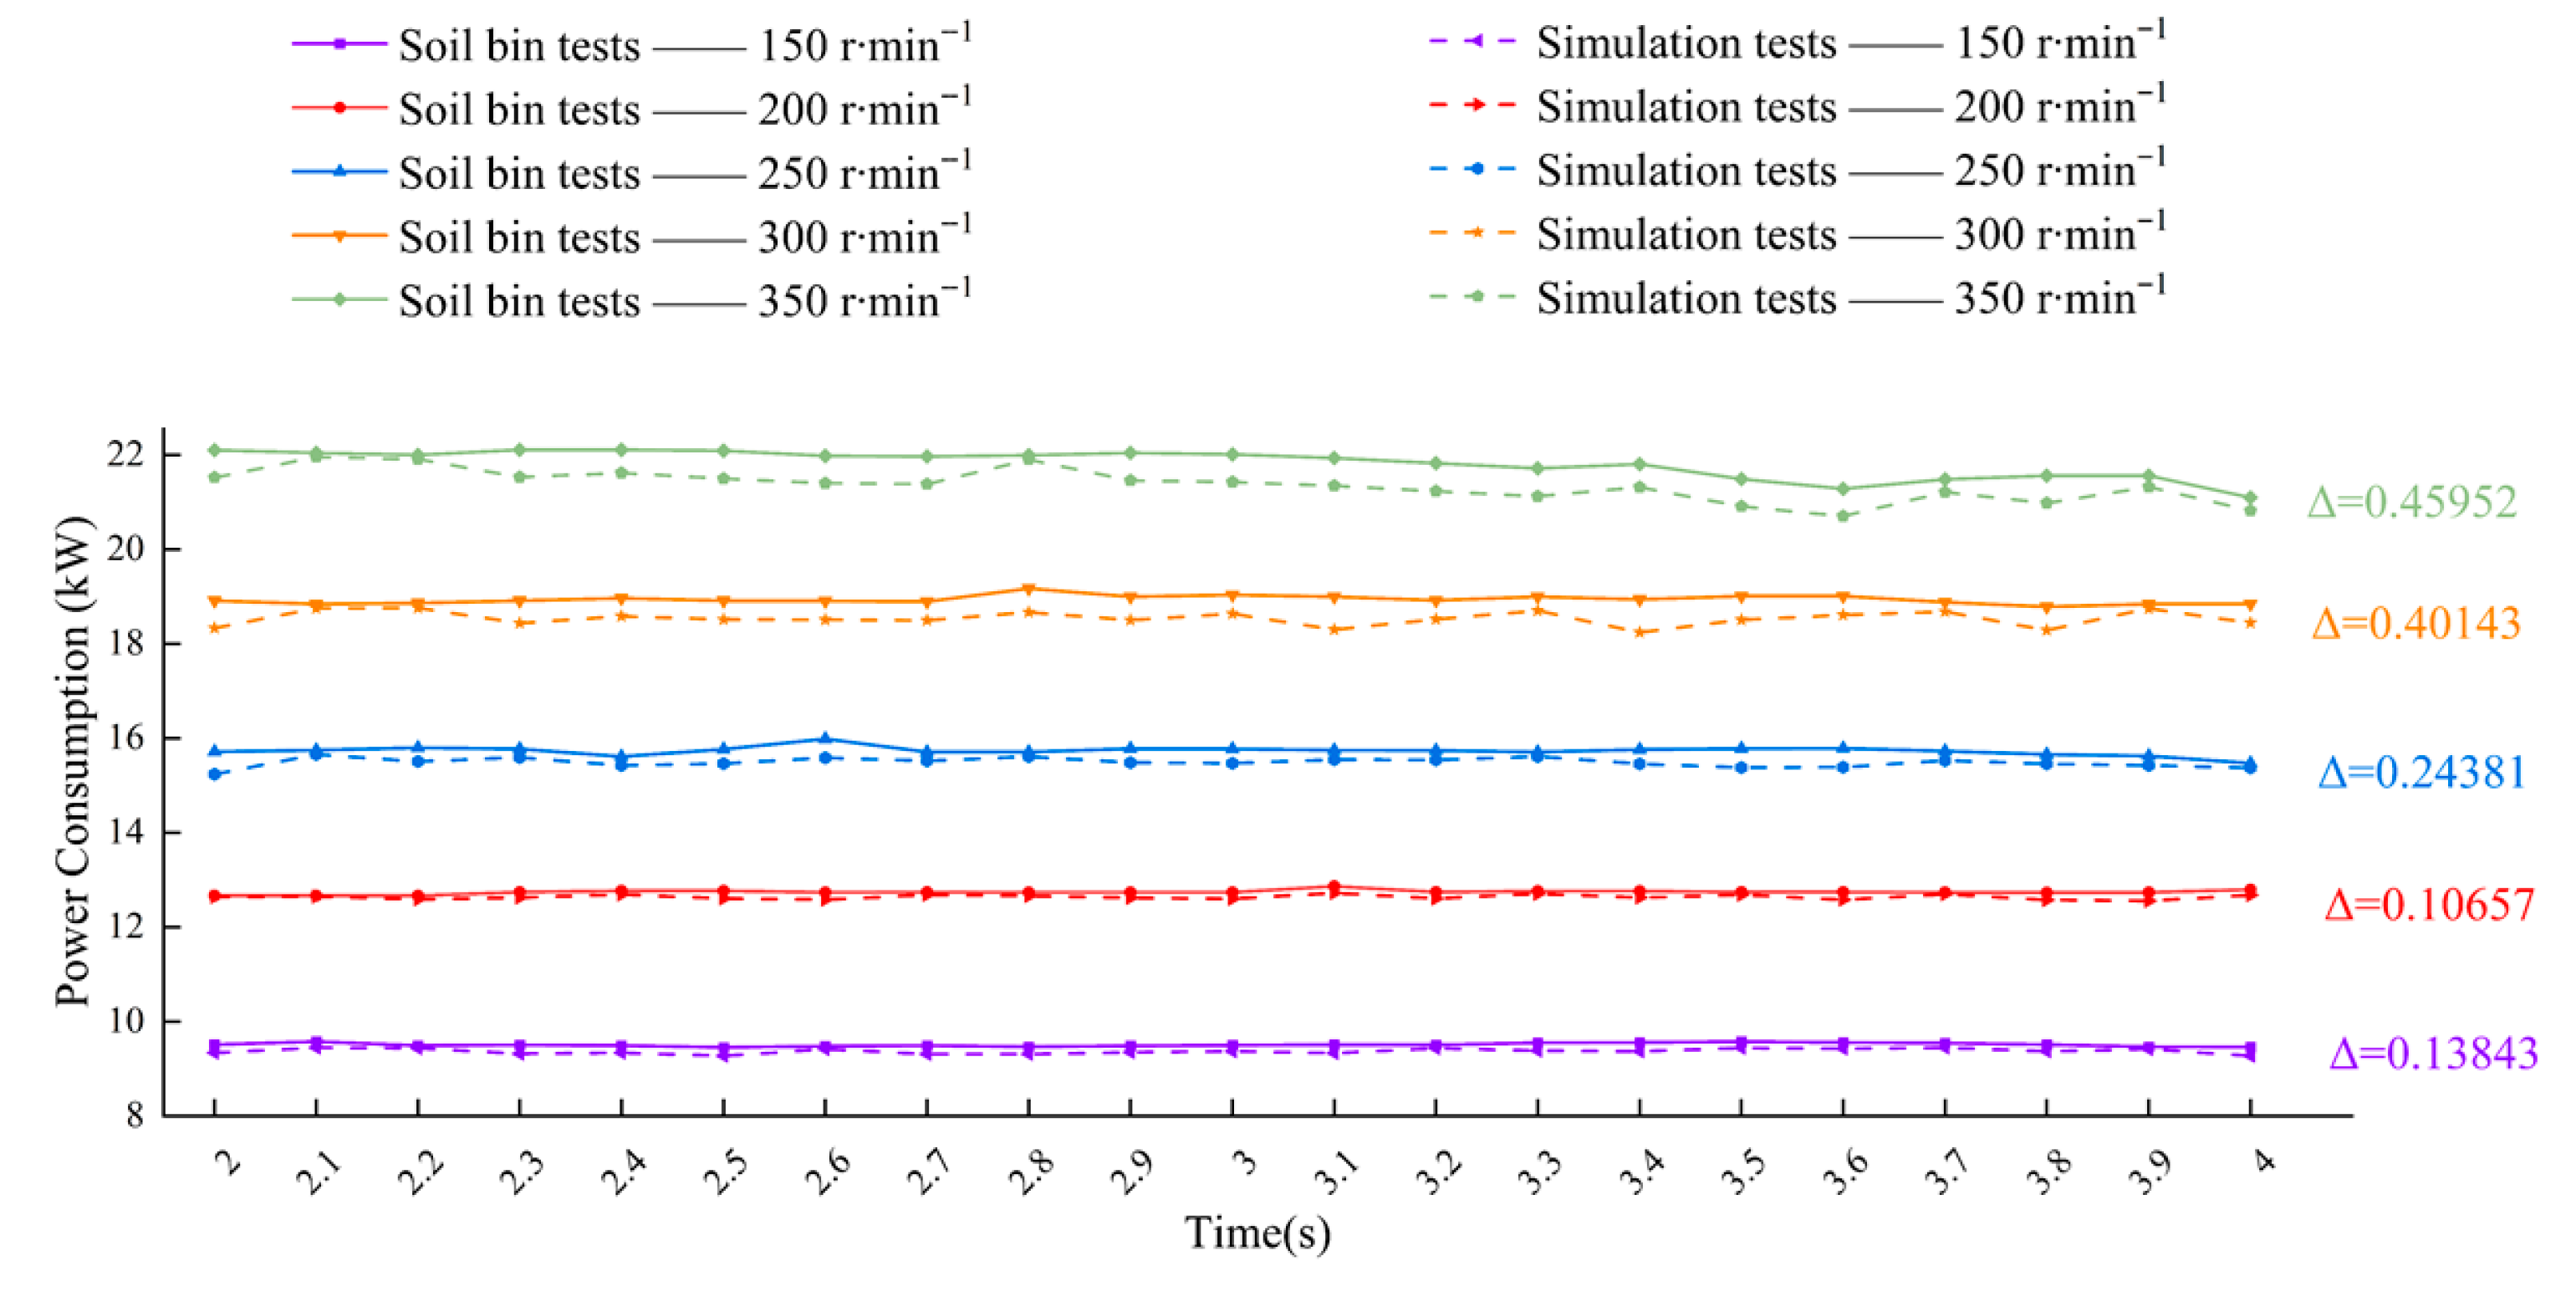
To thoroughly verify the accuracy of the calibrated parameters, rotary tillage tests were conducted at different rotational speeds (150, 200, 250, 300, and 350 rpm). The results showed that the power consumption differences between DEM simulations and physical experiments were 0.13843, 0.10657, 0.24381, 0.40143, and 0.45952 kW, respectively (Figure 10), all below 0.5 kW and accounting for a small proportion of the total power consumption, indicating that the discrepancies between simulated and measured power remained within an acceptable error range with no significant deviations. In addition, ground surface flatness was introduced as a supplementary validation indicator. At the respective rotational speeds of 150, 200, 250, 300, and 350 rpm, the measured flatness values were 159.2, 134.4, 120.6, 109.8, and 102.1 mm while the corresponding simulation results were 155, 132.9, 120.4, 111.2, and 105.3 mm (Figure 11), with differences of 4.2, 1.5, 0.2, 1.4, and 3.2 mm, all within the error range of 0.2–4.2 mm. Overall, the discrepancies between simulation and measurement decreased as rotational speed increased. The comparison of power consumption and surface flatness demonstrates that the established DEM model accurately captures soil–tool interaction characteristics and reliably predicts operational performance. This fully indicates that the segmented calibration method adopted in this study has high reliability, effectively improving the accuracy and applicability of DEM parameters and providing solid data support for subsequent virtual simulations and the optimization of agricultural machinery.

4. Discussion

4.1. Segmented Calibration Framework for Accurate Soil–Machine Modeling

Compared with previous studies that focused primarily on either soil–soil or soil–implement interactions [4,6,7,8,9], this work highlights the necessity of a systematic calibration framework considering both interactions in sequence. The results suggest that ignoring either stage may lead to deviations in simulating soil–machine processes, particularly in operations such as rotary tillage where soil fragmentation and particle rearrangement occur simultaneously. By adopting a segmented strategy, the present method ensures that calibrated parameters retain physical significance while capturing the comprehensive mechanical behavior of cohesive soils. This provides a practical framework for applying the DEM in diverse field conditions, thereby addressing one of the major challenges in soil–machine interaction modeling.

4.2. Advancing Sustainable Machinery Design Through Virtual Simulation

The calibration model developed in this study effectively captures the adhesive behavior between soil particles and at the soil–tool interface. Adhesion plays a critical role in field operations; for example, in pre-sowing furrow opening, excessive adhesion may reduce furrow quality and increase energy consumption. By enabling virtual simulation prior to physical prototyping and field testing, the model allows the prediction of operational performance and optimization of tool design to reduce adhesion, improve quality, and lower energy input. This approach shortens the development cycle, reduces costs, and supports green and efficient agricultural equipment design, thereby contributing to sustainable agricultural development.

4.3. Influence of Soil Moisture and Soil Type on Model Accuracy

In this study, the JKR model parameters were calibrated specifically for black soil with a moisture content of 18 ± 2%, and their accuracy was verified through the simulation of a typical tillage operation using a rotary cultivator. As a model capable of describing adhesion effects between soil particles and between soil and soil-engaging components, the JKR model had also been applied in previous studies [4,9,14] to calibrate parameters for sandy and loamy soils. However, these studies were mostly limited to specific moisture conditions, which are critical factors affecting soil behavior during implement operation. Extending calibration to wider moisture ranges (e.g., 10%, 15%, 20%) would further improve the robustness and generalizability of the model. Since soil moisture content is a precondition for the calibration process, repeated experiments under different moisture levels are necessary to evaluate the reliability of this method. Moreover, the soil type is another key factor influencing parameter applicability. Therefore, while the parameters obtained in this work are reliable for black soil under the tested condition, further investigations are required to systematically assess their applicability to different soil types and moisture contents, such as high-moisture sandy soil in pre-sowing furrow opening or loamy soil in subsoiling operations.

4.4. Comparison of the JKR Model with Other Contact Models

We further compared the Hertz–Mindlin with JKR cohesion model adopted in this study with other commonly used contact models. For example, Dai et al. [12] employed the Hertz–Mindlin (no slip) model to calibrate soil parameters for loess ridge–furrow mulching soil, using repose angle and soil–steel sliding friction angle tests for validation. Their results showed a relative error of only 1.07% between simulated and measured repose angles, indicating that this model provides high accuracy for non-cohesive or weakly cohesive soils. However, since the Hertz–Mindlin (no slip) model does not account for adhesion effects between soil particles or at the soil–tool interface, its applicability is limited under highly cohesive soil conditions such as black soil. In contrast, the Hertz–Mindlin with JKR cohesion model used in this study better captures the cohesive behavior of black soil particles, ensuring a more accurate simulation of soil–tool interactions under typical tillage operations.

5. Conclusions

(1)
Using the soil accumulation angle as the evaluation index, optimized soil particle parameters were obtained—a JKR surface energy of 0.46 J·m−2, collision restitution coefficient of 0.51, static friction coefficient of 0.65, and rolling friction coefficient of 0.13. Simulation results showed high consistency with experimental observations, confirming the accuracy and reliability of the soil–soil parameter calibration.
(2)
Based on the optimized soil–soil parameters, the interaction parameters between black soil and 65Mn steel were calibrated, yielding a JKR surface energy of 0.29 J·m−2, collision restitution coefficient of 0.55, static friction coefficient of 0.64, and rolling friction coefficient of 0.07. The comparison of simulated and experimental soil accumulation angles validated that these parameters accurately captured the mechanical behavior between soil and machine components.
(3)
Validation through rotary tillage tests showed that across blade rotation speeds of 150–350 r·min−1, the errors between DEM-simulated and measured power consumption remained below 0.5 kW, while the differences in ground surface flatness ranged from 0.2 to 4.2 mm, decreasing overall with increasing speed. These results demonstrate that the segmented calibration method is highly accurate and robust, reliably predicting soil–tool interactions and operational performance. The calibrated parameters provide a solid foundation for the virtual simulation and optimization of agricultural machinery, supporting efficient, high-quality, and sustainable field operations.

Author Contributions

Conceptualization, B.Q., S.G., Y.G., M.Y., C.X., A.Z., Y.W., and X.F.; methodology, B.Q., S.G., Y.G., M.Y., C.X., and X.F.; software, S.G., Y.G., M.Y., C.X., A.Z., and Y.W.; resources, Y.G.; writing—original draft, B.Q. and S.G.; writing—review and editing, B.Q., S.G., M.Y., C.X., and X.F. All authors have read and agreed to the published version of the manuscript.

Funding

This work was supported by the National Natural Science Foundation of China (Grant No. 52205253) and the National Natural Science Foundation of Heilongjiang Province of China (Grant No. LH2022E007).

Institutional Review Board Statement

Not applicable.

Data Availability Statement

The data presented in this study are available on request from the corresponding author.

Acknowledgments

We would like to thank all individuals and institutions who contributed to this work. All those acknowledged have given their consent.

Conflicts of Interest

The authors declare no conflicts of interest.

References

  1. Li, X.; Luo, Z.; Hao, Z.; Zheng, E.; Yao, H.; Zhu, Y.; Wang, X. Investigation on tillage resistance and soil disturbance in wet adhesive soil using discrete element method with three-layer soil-plough coupling model. Powder Technol. 2024, 436, 119463. [Google Scholar] [CrossRef]
  2. Long, S.; Xu, S.; Zhang, Y.; Li, B.; Sun, L.; Wang, Y.; Wang, J. Method of soil-elastoplastic DEM parameter calibration based on recurrent neural network. Powder Technol. 2023, 416, 118222. [Google Scholar] [CrossRef]
  3. Zhou, J.; Zhang, L.; Hu, C.; Li, Z.; Tang, J.; Mao, K.; Wang, X. Calibration of wet sand and gravel particles based on JKR contact model. Powder Technol. 2022, 397, 117005. [Google Scholar] [CrossRef]
  4. Li, J.; Tong, J.; Hu, B.; Wang, H.; Mao, C.; Ma, Y. Calibration of parameters of interaction between clayey black soil with different moisture content and soil-engaging component in northeast China. Trans. Chin. Soc. Agric. Eng. 2019, 35, 130–140. [Google Scholar]
  5. Tamás, K.; Jóri, I.J.; Mouazen, A.M. Modelling soil–sweep interaction with discrete element method. Soil Tillage Res. 2013, 134, 223–231. [Google Scholar] [CrossRef]
  6. Aikins, K.A.; Ucgul, M.; Barr, J.B.; Jensen, T.A.; Antille, D.L.; Desbiolles, J.M.A. Determination of discrete element model parameters for a cohesive soil and validation through narrow point opener performance analysis. Soil Tillage Res. 2021, 213, 105123. [Google Scholar] [CrossRef]
  7. Ucgul, M.; Fielke, J.M.; Saunders, C. Validation of a hysteretic spring (plastic) contact model for a sweep tool operating in a cohesionless soil. Soil Tillage Res. 2014, 144, 220–227. [Google Scholar] [CrossRef]
  8. Shi, L.; Zhao, W.; Sun, W. Parameter calibration of soil particles contact model of farmland soil in northwest arid region based on discrete element method. Trans. Chin. Soc. Agric. Eng. 2017, 33, 181–187. [Google Scholar]
  9. Wu, T.; Huang, W.; Chen, X.; Ma, X.; Han, Z.; Pan, T. Calibration of discrete element model parameters for cohesive soil considering the cohesion between particles. J. South China Agric. Univ. 2017, 38, 93–98. [Google Scholar]
  10. Wang, W.; Cai, D.; Xie, J.; Zhang, C.; Liu, L.; Chen, L. Parameters Calibration of discrete element model for corn stalk powder compression simulation. Trans. Chin. Soc. Agric. Mach. 2021, 52, 127–134. [Google Scholar]
  11. Wen, X.; Yuan, H.; Wang, G.; Jia, H. Calibration Method of Friction coefficient of granular fertilizer by discrete element simulation. Trans. Chin. Soc. Agric. Mach. 2020, 51, 115–122+142. [Google Scholar]
  12. Xiang, W.; Wu, M.; Lv, J.; Quan, W.; Ma, L.; Liu, J. Calibration of simulation physical parameters of clay loam based on soil accumulation test. Trans. Chin. Soc. Agric. Eng. 2019, 35, 116–123. [Google Scholar]
  13. Peng, F.; Wang, H.; Fang, F.; Liu, Y. Calibration of discrete element model parameters for pellet feed based on injected section method. Trans. Chin. Soc. Agric. Mach. 2018, 49, 140–147. [Google Scholar]
  14. Zhang, R.; Han, D.; Ji, Q.; He, Y.; Li, J. Calibration methods of sandy soil parameters in simulation of discrete element method. Trans. Chin. Soc. Agric. Mach. 2017, 48, 49–56. [Google Scholar]
  15. Xia, G.; Yang, X.; Wan, Z.; Liu, W.; Li, D. Research status of wear and surface modification of soil contact parts of agricultural machinery. Jiangsu Agric. Sci. 2020, 48, 46–51. [Google Scholar]
  16. ASTM D2216-19; Standard Test Methods for Laboratory Determination of Water (Moisture) Content of Soil and Rock by Mass. ASTM International: West Conshohocken, PA, USA, 2019.
  17. ASTM D3080/D3080M-11; Standard Test Method for Direct Shear Test of Soils Under Consolidated Drained Conditions. ASTM International: West Conshohocken, PA, USA, 2011.
  18. ISO 17892-2:2014; Geotechnical Investigation and Testing—Laboratory Testing of Soil—Part 2: Determination of Bulk Density. International Organization for Standardization: Geneva, Switzerland, 2014.
  19. ASTM D4767-11; Standard Test Method for Consolidated Undrained Triaxial Compression Test for Cohesive Soils. ASTM International: West Conshohocken, PA, USA, 2011.
  20. Sun, J.; Liu, Q.; Yang, F.; Liu, Z.; Wang, Z. Calibration of discrete element simulation parameters of sloping soil on loess plateau and its interaction with rotary tillage components. Trans. Chin. Soc. Agric. Mach. 2022, 53, 63–73. [Google Scholar]
  21. Tian, X.; Cong, X.; Qi, J.; Guo, H.; Li, M.; Fan, X. Parameter calibration of discrete element model for corn straw-soil mixture in black soil areas. Trans. Chin. Soc. Agric. Mach. 2021, 52, 100–108+242. [Google Scholar]
  22. Ma, Y.; Wang, Z.; Shi, L.; Zhao, W.; Sun, B.; Dai, F.; Li, H. Determination the intrinsic parameters and calibration of contact parameters for wheat seed particles. J. China Agric. Univ. 2025, 30, 175–184. [Google Scholar]
  23. GB/T 225-2006; Steel—Determination of Nitrogen Content—Stehlmann’s Reduction Method. Standardization Administration of China: Beijing, China, 2006.
  24. Wang, H.; Ding, K.; Xia, J.; Zhang, G.; Wang, Y.; Kang, Q. Calibration of disturbed-saturated paddy soil discrete element parameters based on slump test. Trans. Chin. Soc. Agric. Mach. 2024, 55, 222–230. [Google Scholar]
  25. Zhou, H.; Che, H.; Geng, D.; Chen, M.; Zhang, Y. Discrete element modeling and parameter calibration of typical soil in maize field tillage layer. Trans. Chin. Soc. Agric. Mach. 2023, 54, 49–60+113. [Google Scholar]
  26. Dai, F.; Song, X.; Zhao, W.; Zhang, F.; Ma, H.; Ma, M. Simulative Calibration on Contact Parameters of Discrete Elements for Covering Soil on Whole Plastic Film Mulching on Double Ridges. Trans. Chin. Soc. Agric. Mach. 2019, 50, 49–56+77. [Google Scholar]
Figure 1. Physical test device for accumulation angle of repose. Note: 1. Funnel. 2. Support column. 3. Size plate. 4. Base.
Sustainability 17 08126 g001
Figure 2. Model of interparticle JKR contact. Note: The yellow regions represent two spherical particles with radii R1 and R2. The contact region has a radius a (2a is the contact diameter). The shadowed zone between the particles illustrates the liquid film at the contact interface.
Sustainability 17 08126 g002
Figure 3. Physical experiments of soil accumulation angle: (a) black soil; (b) black soil with soil-engaging component.
Sustainability 17 08126 g003
Figure 4. Influence of the interaction between JKR surface energy and static friction coefficient on the soil accumulation angle. Note: The colored surface represents the fitted response surface of the accumulation angle, while the green contour lines on the base plane indicate the corresponding projection of the response surface.
Sustainability 17 08126 g004
Figure 5. The effect of the interaction between JKR surface energy and rolling friction coefficient on the accumulation angle between soil particles. Note: The colored surface represents the fitted response surface of the accumulation angle, while the green contour lines on the base plane indicate the corresponding projection of the response surface.
Sustainability 17 08126 g005
Figure 6. Comparative diagram of soil piling effects: DEM simulation vs. physical experiment.
Sustainability 17 08126 g006
Figure 7. The effect diagram of interaction between JKR surface energy and static friction coefficient on accumulation angle for soil–soil-engaging component interfaces was obtained. Note: The colored surface represents the fitted response surface of the accumulation angle, while the green contour lines on the base plane indicate the corresponding projection of the response surface.
Sustainability 17 08126 g007
Figure 8. Effects of JKR surface energy and rolling friction coefficient interaction on soil accumulation angle at soil–tool interface. Note: The colored surface represents the fitted response surface of the accumulation angle, while the green contour lines on the base plane indicate the corresponding projection of the response surface.
Sustainability 17 08126 g008
Figure 9. Comparative analysis of soil accumulation patterns between simulation and physical experiments for soil–implement interactions.
Sustainability 17 08126 g009
Figure 10. Comparative analysis of power consumption examining simulation and physical experiments for rotary tillage blades.
Sustainability 17 08126 g010
Figure 11. Comparative analysis of ground surface flatness examining simulation and physical experiments for rotary tillage blades.
Sustainability 17 08126 g011
Table 1. Parameters of 1 GKN-160 rotary tiller.
ParameterValue
Power44.1–55.1 kW
Dimensions (L × W × H)1850 × 800 × 850 mm
Number of blades installed36
Working width160 cm
Table 2. Factors and levels of soil accumulation angle simulation experiment.
LevelJKR
Surface Energy
x1/(J·m−2)
Collision
Recovery Coefficient
x2
Static Friction Coefficient
x3
Rolling Friction Coefficient
x4
High level (+1)10.91.00.50
Center level (0)0.70.60.60.28
Low level (−1)0.40.30.20.05
Table 3. Simulation factors and levels for calibrating soil–tool contact parameters in discrete element method.
LevelJKR
Surface Energy
x5/(J·m−2)
Collision
Recovery Coefficient
x6
Static Friction Coefficient
x7
Rolling Friction Coefficient
x8
High level (+1)0.80.900.800.05
Center level (0)0.50.550.550.15
Low level (−1)0.20.200.300.25
Table 4. Calibration test results of soil contact parameters.
Test No.JKR Surface Energy x1/(J·m−2)Collision Recovery Coefficient x2Static Friction Coefficient x3Rolling Friction Coefficient x4Accumulation Angle/(°)
10.400.300.600.2836.5 ± 0.2
21.000.300.600.2842.2 ± 0.3
30.400.900.600.2837.6 ± 0.1
41.000.900.600.2839.3 ± 0.4
50.700.600.200.0534.7 ± 0.2
60.700.601.000.0537.1 ± 0.3
70.700.600.200.5032.8 ± 0.3
80.700.601.000.5039.0 ± 0.2
90.400.600.600.0532.3 ± 0.2
101.000.600.600.0538.2 ± 0.3
110.400.600.600.5038.5 ± 0.1
121.000.600.600.5037.4 ± 0.4
130.700.300.200.2838.6 ± 0.4
140.700.900.200.2833.2 ± 0.2
150.700.301.000.2840.4 ± 0.3
160.700.901.000.2837.9 ± 0.2
170.400.600.200.2833.0 ± 0.2
181.000.600.200.2841.2 ± 0.1
190.400.601.000.2842.1 ± 0.4
201.000.601.000.2840.8 ± 0.2
210.700.300.600.0536.7 ± 0.2
220.700.900.600.0534.8 ± 0.3
230.700.300.600.5039.1 ± 0.3
240.700.900.600.5036.6 ± 0.4
250.700.600.600.2836.1 ± 0.2
260.700.600.600.2838.5 ± 0.2
270.700.600.600.2837.4 ± 0.3
280.700.600.600.2837.6 ± 0.2
290.700.600.600.2837.1 ± 0.3
Table 5. Normality test results of soil–soil repose angle data.
Kolmogorov–SmirnovShapiro–Wilk
StatisticDegree of FreedompStatisticDegree of Freedomp
black soil accumulation angle0.115290.2000.962290.376
Table 6. Variance analysis of the soil accumulation angle–soil contact parameter model.
Source of VarianceSum of SquaresDegree of FreedomMean SquareFp
Model178.541412.7510.28<0.0001
x130.4130.424.510.0002
x216.57116.5713.360.0026
x347.2147.238.06<0.0001
x47.6817.686.190.0260
x1  x24143.230.0941
x1  x322.56122.5618.190.0008
x1  x412.25112.259.880.0072
x2  x32.112.11.70.2139
x2  x40.0910.090.0730.7916
x3  x43.6113.612.910.1101
x 1 2 9.6119.617.750.0146
x 2 2 1.2711.271.020.3287
x 3 2 0.2110.210.170.6868
x 4 2 14.99114.9912.080.0037
Lack-of-fit term14.35101.441.910.2797
Pure error3.0140.75
Sum195.9028
(p < 0.01, extremely significant; p < 0.05, significant; p > 0.05, not significant.)
Table 7. Calibration test results of soil particle contact: contact parameters of soil contact components.
Test No.JKR Surface Energy
x5/(J·m−2)
Collision Recovery Coefficient x6Static Friction Coefficient x7Rolling Friction Coefficient x8Accumulation Angle/(°)
10.200.200.550.1534.3 ± 0.2
20.800.200.550.1540.0 ± 0.1
30.200.900.550.1535.4 ± 0.3
40.800.900.550.1537.2 ± 0.2
50.500.550.300.0532.2 ± 0.3
60.500.550.800.0534.5 ± 0.4
70.500.550.300.2530.6 ± 0.1
80.500.550.800.2536.9 ± 0.2
90.200.550.550.0530.1 ± 0.4
100.800.550.550.0536.1 ± 0.3
110.200.550.550.2536.3 ± 0.4
120.800.550.550.2535.2 ± 0.2
130.500.200.300.1536.4 ± 0.3
140.500.900.300.1531.1 ± 0.3
150.500.200.800.1538.2 ± 0.4
160.500.900.800.1535.8 ± 0.2
170.200.550.300.1530.9 ± 0.3
180.800.550.300.1539.1 ± 0.1
190.200.550.800.1539.9 ± 0.2
200.800.550.800.1538.7 ± 0.2
210.500.200.550.0533.1 ± 0.4
220.500.900.550.0531.6 ± 0.2
230.500.200.550.2537.7 ± 0.3
240.500.900.550.2533.8 ± 0.2
250.500.550.550.1533.9 ± 0.1
260.500.550.550.1536.4 ± 0.2
270.500.550.550.1535.2 ± 0.2
280.500.550.550.1535.4 ± 0.3
290.500.550.550.1534.9 ± 0.1
Table 8. Normality test results of soil–component repose angle data.
Kolmogorov–SmirnovShapiro–Wilk
StatisticDegree of FreedompStatisticDegree of Freedomp
black soil with soil-engaging accumulation angle0.086290.2000.969290.535
Table 9. Analysis of variance for the soil accumulation angle and soil–tool interface contact parameter model.
Source of VarianceSum of Squares Degree of FreedomMean SquareFp
Model197.531414.1112.03<0.0001
x531.36131.3626.740.0001
x618.25118.2515.560.0015
x746.81146.8139.9<0.0001
x813.87113.8711.820.004
x5  x63.813.83.240.0934
x5  x722.09122.0918.830.0007
x5  x812.6112.610.740.0055
x6  x72.112.11.790.202
x6  x81.4411.441.230.2866
x7  x84143.410.0861
x 5 2 11.95111.9510.190.0065
x 6 2 0.5210.520.440.5173
x 7 2 0.3910.390.330.5737
x 8 2 20.55120.5517.520.0009
Lack-of-Fit Term13.17 101.321.680.3392
Pure error3.2540.81
Sum213.9528
(p < 0.01, extremely significant; p < 0.05, significant; p > 0.05, not significant.)
Disclaimer/Publisher’s Note: The statements, opinions and data contained in all publications are solely those of the individual author(s) and contributor(s) and not of MDPI and/or the editor(s). MDPI and/or the editor(s) disclaim responsibility for any injury to people or property resulting from any ideas, methods, instructions or products referred to in the content.