Article

High-Residue and Reduced Tillage Enhances Soil Fertility, Weed Suppression, and Crop Yield in Organic Vegetable Systems

1
Rodale Institute Califronia Organic Center, 1014 W Ventura Blvd, Camarillo, CA 93010, USA
2
Rodale Institute Main Campus, 611 Siegfriedale Rd, Kutztown, PA 19530, USA
*
Author to whom correspondence should be addressed.
Sustainability 2025, 17(17), 8069; https://doi.org/10.3390/su17178069
Submission received: 22 July 2025 / Revised: 31 August 2025 / Accepted: 3 September 2025 / Published: 8 September 2025
(This article belongs to the Special Issue Sustainable Agriculture, Soil Erosion and Soil Conservation)

Abstract

Organic annual vegetable farming systems often rely on intensive tillage for weed management due to the prohibition of synthetic herbicides. Regenerative organic agriculture aims to improve soil health and reduce the frequency and intensity of soil tillage by using cover crops as high-residue mulches to suppress weeds. In southern coastal California, the moderate climate supports year-round vegetable production, discouraging many growers from integrating cover crops into their operation and leaving sustainability-minded growers with few strategies to produce organic vegetables outside of reliance on tillage. This study evaluates standard organic tillage practices versus high-residue cover-crop mulch system on squash, peppers, and eggplant over two seasons. We assessed treatment effects on soil health indicators, weed pressure, and crop production. Soil under the cover-crop system improved soil organic matter, organic carbon and nitrogen, microbially active carbon, and water infiltration compared to bare soil. Weed biomass was substantially lower under the high-residue mulch due to persistent surface cover. Crop yield was 82%, 169%, and 189% higher in the cover-crop plots for squash, pepper, and eggplant, respectively. These findings demonstrate that high-residue cover-crop systems can enhance soil health, reduce weed pressure, and substantially increase yields, providing evidence-based strategies for implementing regenerative organic practices in vegetable systems.

1. Introduction

Regenerative agriculture is a set of systems or practices that are defined by the conservation of soil and increasing biodiversity to enhance environmental, economic, and social dimensions of food production [1]. The term regenerative agriculture was popularized in the 1980s and developed in contrast to the conventional agricultural system’s reliant on synthetic pesticides and fertilizers along with frequent disturbance of the soil [2]. While the definition of the term “regenerative” has evolved and has been debated since the 1980s, post 2010, interest among both researchers and stakeholders has dramatically risen [3]. As the popularity of the term continues to increase, stakeholders will require a matching increase in applied research to understand what challenges exist around embracing regenerative practices on their farm. One challenge to the adoption of regenerative agriculture is not the advent of new technology or practices, but rather a system or set of practices that are often required to work in tandem with one another [4]. For example, reduction in soil disturbance is usually accomplished with chemical herbicides, which become an environmental and human contaminant, and they are precluded in organic management. Organic management reduces or eliminates the use of chemicals, but often relies on soil disturbance through primary and secondary tillage to manage weeds effectively. Therefore, a major challenge around adopting regenerative organic agriculture is the elimination of herbicides to meet certified organic requirements and the reduction or elimination of tillage to improve soil health.
Organic farming systems do not allow for the use of synthetic pesticide and fertilizer inputs; however, without chemical means of controlling weeds, tillage has become the most common and effective tool for organic growers to control weeds [5]. Disturbance of the soil with tillage is strategically applied to an agricultural area to manage soil structure, alter soil moisture, and remove weeds that compete with crops for moisture, nutrients, and space. However, frequent use of tillage can decrease soil organic matter [6] and increase soil compaction [7] and flooding due to poor water infiltration [8]. Degradation of soil structure through increased compaction and reduced aggregate stability increases the potential for erosion due to wind and rain [8]. Previous studies have explored cover-crop-based mulching systems, demonstrating improved soil health, enhanced moisture retention, reduced weed pressure, and increased profitability compared to full tillage systems [9,10,11]. Incorporating a reduced-tillage/cover-crop system increases available organic carbon and nitrogen to the subsequent vegetable crop, and, by reducing the disturbance of the soil and increasing soil organic matter, creates more of a food source available for microorganisms [12].
While high-residue cover-cropping has proven successful in some regions, its application in Mediterranean organic systems remains underexplored, particularly concerning nutrient availability and crop performance in annual vegetables (however, see [13,14]). Cover crops play a crucial role in regenerative agricultural systems by improving soil fertility, enhancing soil structure, increasing microbial diversity, and reducing weed pressure [15]. They are also critical in organic systems that typically utilize cover crops as green manures to improve soil fertility [16]. Traditionally, organic vegetable production relies on frequent tillage to manage weeds and prepare seedbeds, but this practice accelerates soil degradation by reducing soil organic matter, increasing erosion, and disrupting soil microbial communities [17]. Utilizing high-residue cover-cropping offers an alternative approach by leaving a thick mulch layer on the soil surface, which suppresses weeds, conserves soil moisture, and minimizes soil disturbance [18]. The roller crimper system provides an effective method to terminate mature cover crops without tillage, allowing for the establishment of cash crops into a high-residue mulched surface [3]. In the roller crimping system, a heavy implement knocks down the standing cover crop by applying heavy pressure where the cover-crop stems emerge from the soil surface, crimping them and laying them flat without disturbing the soil surface [12]. This implemented system can terminate the cover crop with minimal disturbance to the soil and no tillage of the soil, while maintaining below-ground root systems and their associated microbial community. The resulting cover-crop biomass can cover the soil surface.
Research in temperate climates, such as the northeastern and Mid-Atlantic United States, has demonstrated that this approach can significantly reduce weed pressure and improve soil health while maintaining or even increasing crop yields [18]. Costal California, due to its moderate climate and year-round growing season, is one of the most productive regions for crops in the United States [19]. Seasonal vegetable production makes the integration of sustainable practices, such as reduced tillage and cover-cropping, challenging for many growers [20]. High costs associated with farming in this area are a powerful motivator for decision-making by the region’s growers, and finding both economic and environmental benefits from these regenerative practices can mitigate the fertility, labor, and fuel costs associated with high-soil-disturbance weed management and crop inputs.
This study examines the use of roller-crimped cover-crop residue as a means of suppressing weeds and building soil health as part of a regenerative vegetable production system. Specifically, we compare the standard organic practice of tillage, used to create vegetable beds free of any non-crop vegetation, to high-residue cover-crop mulch treatments in several regionally relevant vegetables. We hypothesized that the benefits to crop development via weed suppression would be most dramatic in the short-developing vegetables, whilst being more limited to vegetables that reach maturity over a longer time; we also hypothesize that the cover-crop mulch will break down and limit our ability to suppress weeds and cover soil [21]. This evaluation of cover-crop-based organic no-tillage methods in a Mediterranean climate verifies that successful regenerative organic management that reduces tillage is a viable strategy to improve soil health without sacrificing crop production.

2. Materials and Methods

2.1. Experiment Design

This field experiment was conducted at the Rodale Institute California Organic Center in Camarillo, CA, USA, from 2023 to 2024 (34.219993, −119.108214) on certified organic farmland. The trial was a randomized complete block design with a spilt-plot structure. Each block contained two tillage treatments: (1) a bare soil organic control and (2) a cover-crop-based organic reduced tillage system. Each block (12.19 m × 8.23 m) contained nine raised beds (12.19 m long, 0.91 m center-to-center spacing). This design was repeated across 4 blocks for a total research area of 802.5 m2. The subplot factor was crop type, with each treatment containing three beds planted with zucchini squash (Cucurbita pepo cv. Yellowfin), bell pepper (Capsicum annuum cv. Olympus), or eggplant (Solanum melongena cv. Rosa Bianca). This design allowed for the evaluation of treatment effects and crop-specific responses across a total experimental area of 802.5 m2.

2.2. Cover Crop Establishment and Termination

Cover-crop treatments were prepared by broadcasting a combination of Merced cereal rye (Secale cereale; 100 kg/ha) and Magnus field peas (Pisum sativum; 33.6 kg/ha) in early spring (between 13 February 2023 and 16 February 2024) and covered with floating row covers to aid germination and prevent bird damage. Row covers were removed once seedlings were established. Cover crops were monitored until rye reached anthesis, and then were terminated with two passes (approx. 16 km/h. tractor speed) of a roller crimper (1.8 m long and 624 kg, I&J Manufacturing, Gap, Lancaster County, PA, USA). Immediately after crimping, all cover-crop beds were covered with a completely opaque 5 mm thick UV-treated polyethylene tarp (Farmers Friend, Centerville, Hickman County, TN, USA) using the occultation method, which maintains soil moisture and excludes light to suppress weed emergence prior to transplanting and ensure cover-crop termination. The tarps remained in place until vegetable transplanting. This process resulted in the cover-crop aboveground biomass forming a physical barrier that vegetable seedlings could be transplanted into. In the bare soil plots, small weeds were managed using a rotary mower, followed by soil preparation using a rototiller and bed shaper prior to transplanting.
Within each block three of the beds were dedicated to one of three vegetables, zucchini squash (Cucurbita pepo cv. Yellowfin), bell pepper (Capsicum annuum cv. Olympus), and eggplant (Solanum melongena cv. Rosa Bianca), in all blocks across both treatments. The transplant spacings were 60 cm, 45 cm, and 30 cm in-row distance for squash, pepper, and eggplant, respectively, based on the typical planting densities of these crops in the region. Upon transplanting into plots in either treatment, all other aspects of crop management were kept consistent throughout the duration of the experiment. Treatment block areas remained the same between the experimental years, with the placement of vegetables within each block rotated to reduce potential yield losses or soilborne diseases from repeated plantings. Following the 2023 growing season, all research plots were rototilled, and beds were reshaped immediately before the 2024 cover-crop planting. The reconditioning of this area was to eliminate any cover-crop residue and weeds that had emerged after the previous vegetable harvest. This preparation of the research plots created the best environment for cover crops to successfully establish and reduce any variability among our plot replicates from the previous season.

2.3. Soil Analysis

In each project year, soil samples were taken prior to planting cover crops in February and at the end of the growing season in December, for a total of four sampling events. Each sample was collected from all 3 crops found in each block (n = 36 per sampling date) by collecting 10 soil cores (30 cm deep, 1.9 cm diameter) and homogenizing them into a single composite sample. All samples were collected within a 2 hr period, and each composite sample was added to a previously labeled sealed plastic bag and placed in a cooler with dry ice to be immediately shipped to Ward Laboratories (Kearney, NE, USA) for formal analysis [22]. The parameters measured included the following: pH (1:1), soil organic matter (SOM) determined by the combustion method, water-extractable organic carbon (WEOC); water-extractable organic nitrogen (WEON); cation exchange capacity (CEC); soluble salts; phosphorus (Mehlich 3); potassium, calcium, magnesium, and sodium (extracted with ammonium acetate and analyzed using ICAP); and sulfur, zinc, iron, manganese, and copper (extracted with DTPA and analyzed using ICAP). Soil respiration (CO2) was measured as the amount of CO2 released in 24 h. Microbially active carbon (MAC) was calculated by dividing soil respiration by WEOC and expressing it as a percentage. A composite Soil Health Score is used to combine several of these different metrics to from soil samples (Ward Laboratories). This calculation is (CO2-C respiration/10) + (WEOC/50) + (WEON/10), and serves as a relative soil health among samples with a score range of 0–50. This score was modified from the previous Haney soil test metric to consider new sampling procedures for extracting soil carbon and nitrogen values while still creating a single value that incorporates multiple aspects of soil health [23].

2.4. Soil Moisture and Temperature

Soil moisture and temperature were measured weekly from May to November in both 2023 and 2024 from each bed in the experiment (n = 72 total beds) using an Acclima TDR-315L handheld soil probe (Meridian, ID, USA). Measurements were collected consistently 48 h after irrigation events to minimize diurnal variations and allow for the soil to reach field capacity [24]. The soil probe was inserted 10 cm into the soil for each measurement, and data on soil temperature and moisture content was recorded. Moisture was reported as Volumetric Water Content (VWC) or the percentage of the soil’s volume occupied by water within pores and voids in the soil structure. For statistical analysis, measurements were first averaged by 3-bed plot and then by month to compare soil moisture and temperature across treatments and crops.

2.5. Water Infiltration Rates

Water Infiltration tests were performed in August 2023 and 2024 to quantify water infiltration rates under each treatment. Measurements were taken from the center bed of each plot (n = 24) between two of the vegetable plants following NRCS protocol [25]. A 444 mL volume of water was poured into a sheet-metal ring (15.2 cm diam, 13.5 cm tall), which was driven 6.5 cm into the soil. This process simulates instantaneous 5 cm of rainfall, and the time taken for water to completely infiltrate into the soil was recorded to the nearest second. This procedure was repeated in the same location to assess infiltration under saturated conditions with a second measurement, which provides a more accurate estimate of the steady-state infiltration rate.

2.6. Transplant Survival

Plant establishment was assessed one month after transplanting by calculating the percentage of surviving plants relative to the initial transplant density.

2.7. Cover Crop and Weed Biomass

Aboveground cover-crop biomass was collected in both years prior to termination, at rye anthesis, to capture peak biomass accumulation. A 0.1 m2 quadrat (0.3 m × 0.3 m) was placed on each bed, all all plant material was clipped at the soil level, and the number of each plant species was counted and weighed. All samples were dried until a constant weight was achieved and weighed to determine total dry biomass. This procedure was repeated eight weeks post-transplanting and at the end of vegetable harvest period to assess weed biomass. Weeds were categorized into grasses or broadleaves.

2.8. Yield Assessment

All mature and marketable fruit along each bed was harvested from with both count and weight recorded. Zucchini squash was harvested for ten consecutive weeks, while both pepper and eggplant collection lasted eight weeks beginning when mature fruit began to develop. Yield results were collected along from all research plots and are expressed as number of fruit and crop weight per ha.

2.9. Crop Aboveground Biomass

At the end of the harvest period for each vegetable crop, a subset of plants was randomly selected from each row for measurement of aboveground crop biomass (n = 3 for squash, n = 6 for pepper and eggplant). Selected plants were cut at the soil surface and weighed (resolution ± 0.01 kg) for a fresh weight, and then stored in paper bags and dried to a constant weight to determine dry weight biomass.

2.10. Statistical Analysis

All statistical analysis were performed using SYSTAT 13 (Systat Software inc. Palo Alto, CA, USA) by creating general linear models for all datasets. All data was tested for normality and homogeneity of the residuals and transformed where appropriate. Experimental years (n = 2) and experimental treatments (n = 2) were fixed effects in all models. P hoc pairwise comparisons (Fisher’s least significant difference) were used to differentiate which factors were significant when appropriate. For all data collected during this experiment and used to create all figures can be found in the Supplementary Materials.

3. Results

3.1. Soil Fertility

Soil health measurements across all treatment blocks were uniform at the beginning of the experiment. There were no significant differences between the bare soil and cover-crop treatment for any of the soil health indicators measured (Figure 1). At the beginning of the experiment, there was no difference in SOM between tillage treatments (1.98% vs. 2.02% for bare and cover-cropped soil, respectively), but SOM was 15% higher at the end of the experiment in the cover-cropped (2.38%) compared to the bare soil treatments (2.05%) (Figure 1A). At the initial sampling of 2024, both treatments (1.62% vs. 1.64% for bare and cover-cropped soil, respectively) had decreased from the previous sample, likely due to the tillage required to re-shape beds and prepare for the subsequent season. At the final sampling date (December 2024), SOM from the bare treatments (1.93%) was significantly lower than cover-cropped beds at 2.78% SOM.
WEOC was similar between the two treatments during the initial sampling in February 2023 (153.67 ± 3.91 ppm vs. 161.93 ± 4.21 ppm in bare soil and cover-cropped beds, respectively), but at the end of the 2023 field season, WEOC from the bare treatments decreased 46% (96.08 ± 1.89 ppm), while cover-cropped treatment WEOC decreased only 27% (123.33 ± 5.91 ppm) and was significantly different (p = 0.02) (Figure 1B). Sampling in February 2024, before the second seeding of the cover crop, had similar WEOC (162.58 ± 3.54 ppm vs. 176.67 ± 2.62 ppm), which became significantly different (p = 0.015) at the end of the second experimental year, with significantly higher WSOC from cover-cropped treatments (141.08 ± 2.02 ppm) than bare treatments (109.17 ± 2.52 ppm).
WEON was similar at the initial February 2023 sampling (13.43 ± 0.39 ppm vs. 13.56 ± 0.42 ppm for bare and cover-cropped treatments, respectively) (Figure 1C). In December 2023 sampling at the end of the first season, WEON was significantly higher in the cover-cropped treatments (13.2 ± 1.02 ppm) than bare treatments (8.51 ± 0.33 ppm). WSON in February 2024 sampling increased for both cover-cropped treatments (39% increase to 19.70 ± 0.52 ppm) and bare treatments (68% increase to 17.33 ± 0.79 ppm) and were marginally significant from one another (p = 0.072). In the final sample, there was similarly a marginally significant difference (p = 0.067) between the bare (14.10 ± 0.63 ppm) and cover-cropped (16.62 ± 0.90 ppm) treatments.
Soil aggregate stability (SAS%) was not significantly different between the two treatments (25.00 ± 1.24% vs. 25.33 ± 1.41% for bare and cover-cropped treatments, respectively) (Figure 1D). At the end of the 2023 growing season, SAS was significantly higher in the cover-cropped treatments, 38.83 ± 1.21%, than in the bare soil treatments (25.75 ± 1.62%). SAS decreased for all treatments in the February 2024 sampling, but cover-cropped treatment (22.00 ± 0.97%) had significantly higher SAS than bare treatments (17.41 ± 0.72). Final sampling again had significantly higher SAS in the cover-cropped treatment (30.67 ± 0.85%) compared to the bare treatment (24.17 ± 2.10).
Microbially active carbon (MAC) was not significantly different prior to the first year of cover-crop seeding (38.30 ± 4.42% vs. 41.51 ± 3.92% for bare and cover-cropped treatments, respectively) (Figure 1E). MAC was significantly higher in the cover-cropped treatment (92.37 ± 4.74%) than the bare soil treatment (62.02 ± 3.41%). After preparing the soil for the second field season, both bare soil treatment (15.59 ± 0.89%) and cover-cropped treatment (19.73 ± 1.21%) decreased and were not significantly different from one another. Following a similar trend to 2023, the end of the 2024 season saw an increase to both bare soil (39% higher at 23.24 ± 3.67%) and cover-cropped soil (67% higher at 39.65 ± 2.47%), which were significantly different from one another.
Soil health score (range 0–50) is a metric derived from a combination of soil respiration, WEOC, WEON, and the C:N ratio to create an effective metric to serve as a proxy for the other qualities of soil health across treatments (Figure 1F). The soil health score of the two treatments before the first field season were not significantly different from one another (10.73 ± 0.72 vs. 11.65 ± 0.59 for bare and cover-cropped soil, respectively). At the end of the 2023 season, the soil health score of the cover-cropped treatment was 14.73 ± 0.73, significantly higher (p = 0.012) than the bare treatment at 9.23 ± 0.34. After soil preparation for 2024 field season, scores decreased for both bare soil (8.41 ± 0.19) and cover-cropped (11.91 ± 0.71) treatments, but remained significantly different from one another. The final soil health score for cover-cropped treatment increased from 17% to 14.2 ± 0.68 and was significantly higher (p ≤ 0.001) than the bare treatment, which decreased from 25% to 6.56 ± 0.33.
Across all replicates and months sampled in 2023 (May–November), there was 18.94% higher moisture in the cover-cropped soil (24.04%) than the bare soil (19.88%). Monthly averages (Table 1A) for soil moisture ranged from 15.23% (June) to 22.75 (November) in the bare soil treatment plots, while soil moisture ranged from 20.48% (June) to 27.83% (November) in the cover-crop treatment plots. Soil temperature across 2023 was relatively consistent between treatments, with (26.02 °C) only 2% cooler t (26.46 °C). For both soil moisture and temperature, there was no statistical difference among the replicates from either treatment.
Soil moisture in 2024 (Table 1B) was 18.09% higher (25.63%) than the bare soil treatment (21.38%). Soil temperature across all months between (26.77 °C) was 1.7% cooler than the bare soil treatment (27.23 °C), and these were not statistically significant from one another. Soil moisture in the cover-crop treatment ranged from 23.71 to 28.12%, with soil moisture ranging from 17.74 to 24.82% in the bare soil treatments.
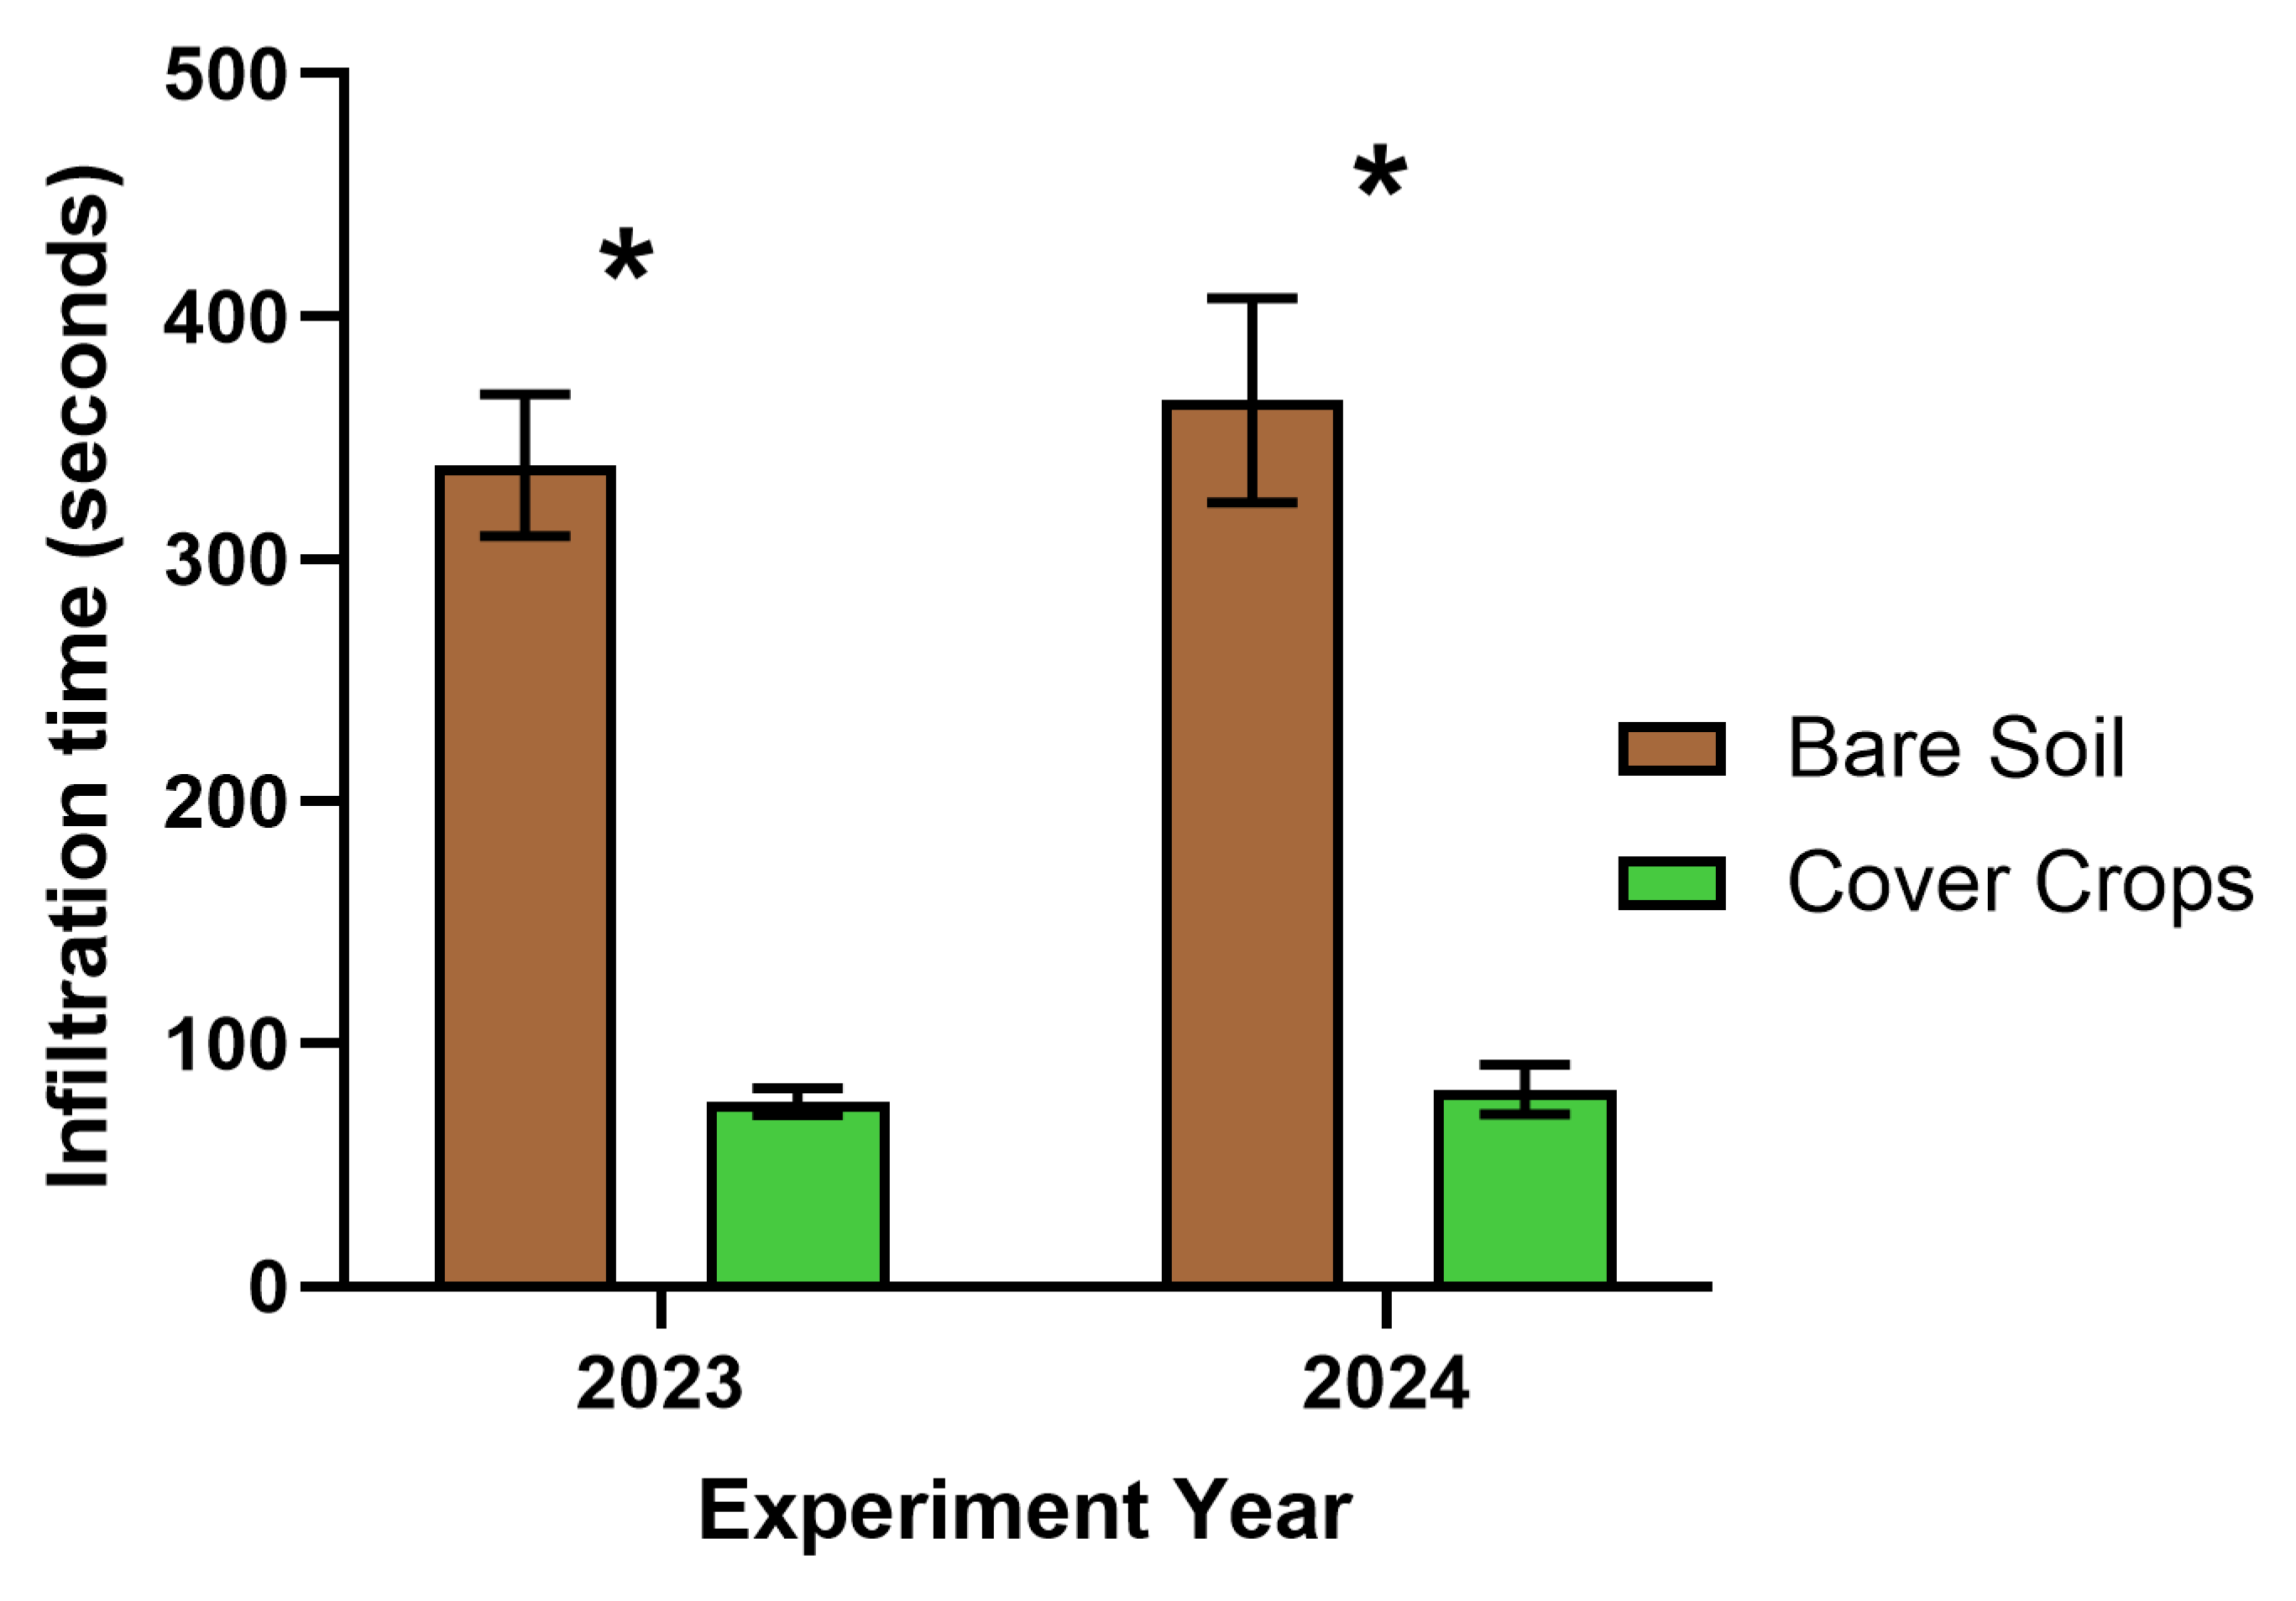
There were significant differences in water infiltration between treatments. Water infiltration rates in 2023 were 126% faster (p ≤ 0.001) in the cover-cropped soil treatments (76.22 ± 5.59 s) than the bare soil treatments (338.51 ± 29.11 s) (Figure 2). Similar trends persisted in 2024, with significantly faster water infiltration rates in the cover-cropped treatment (81.16 ± 10.16 s) than the bare soil treatments (365.26 ± 42.26 s).

3.2. Weed Suppression

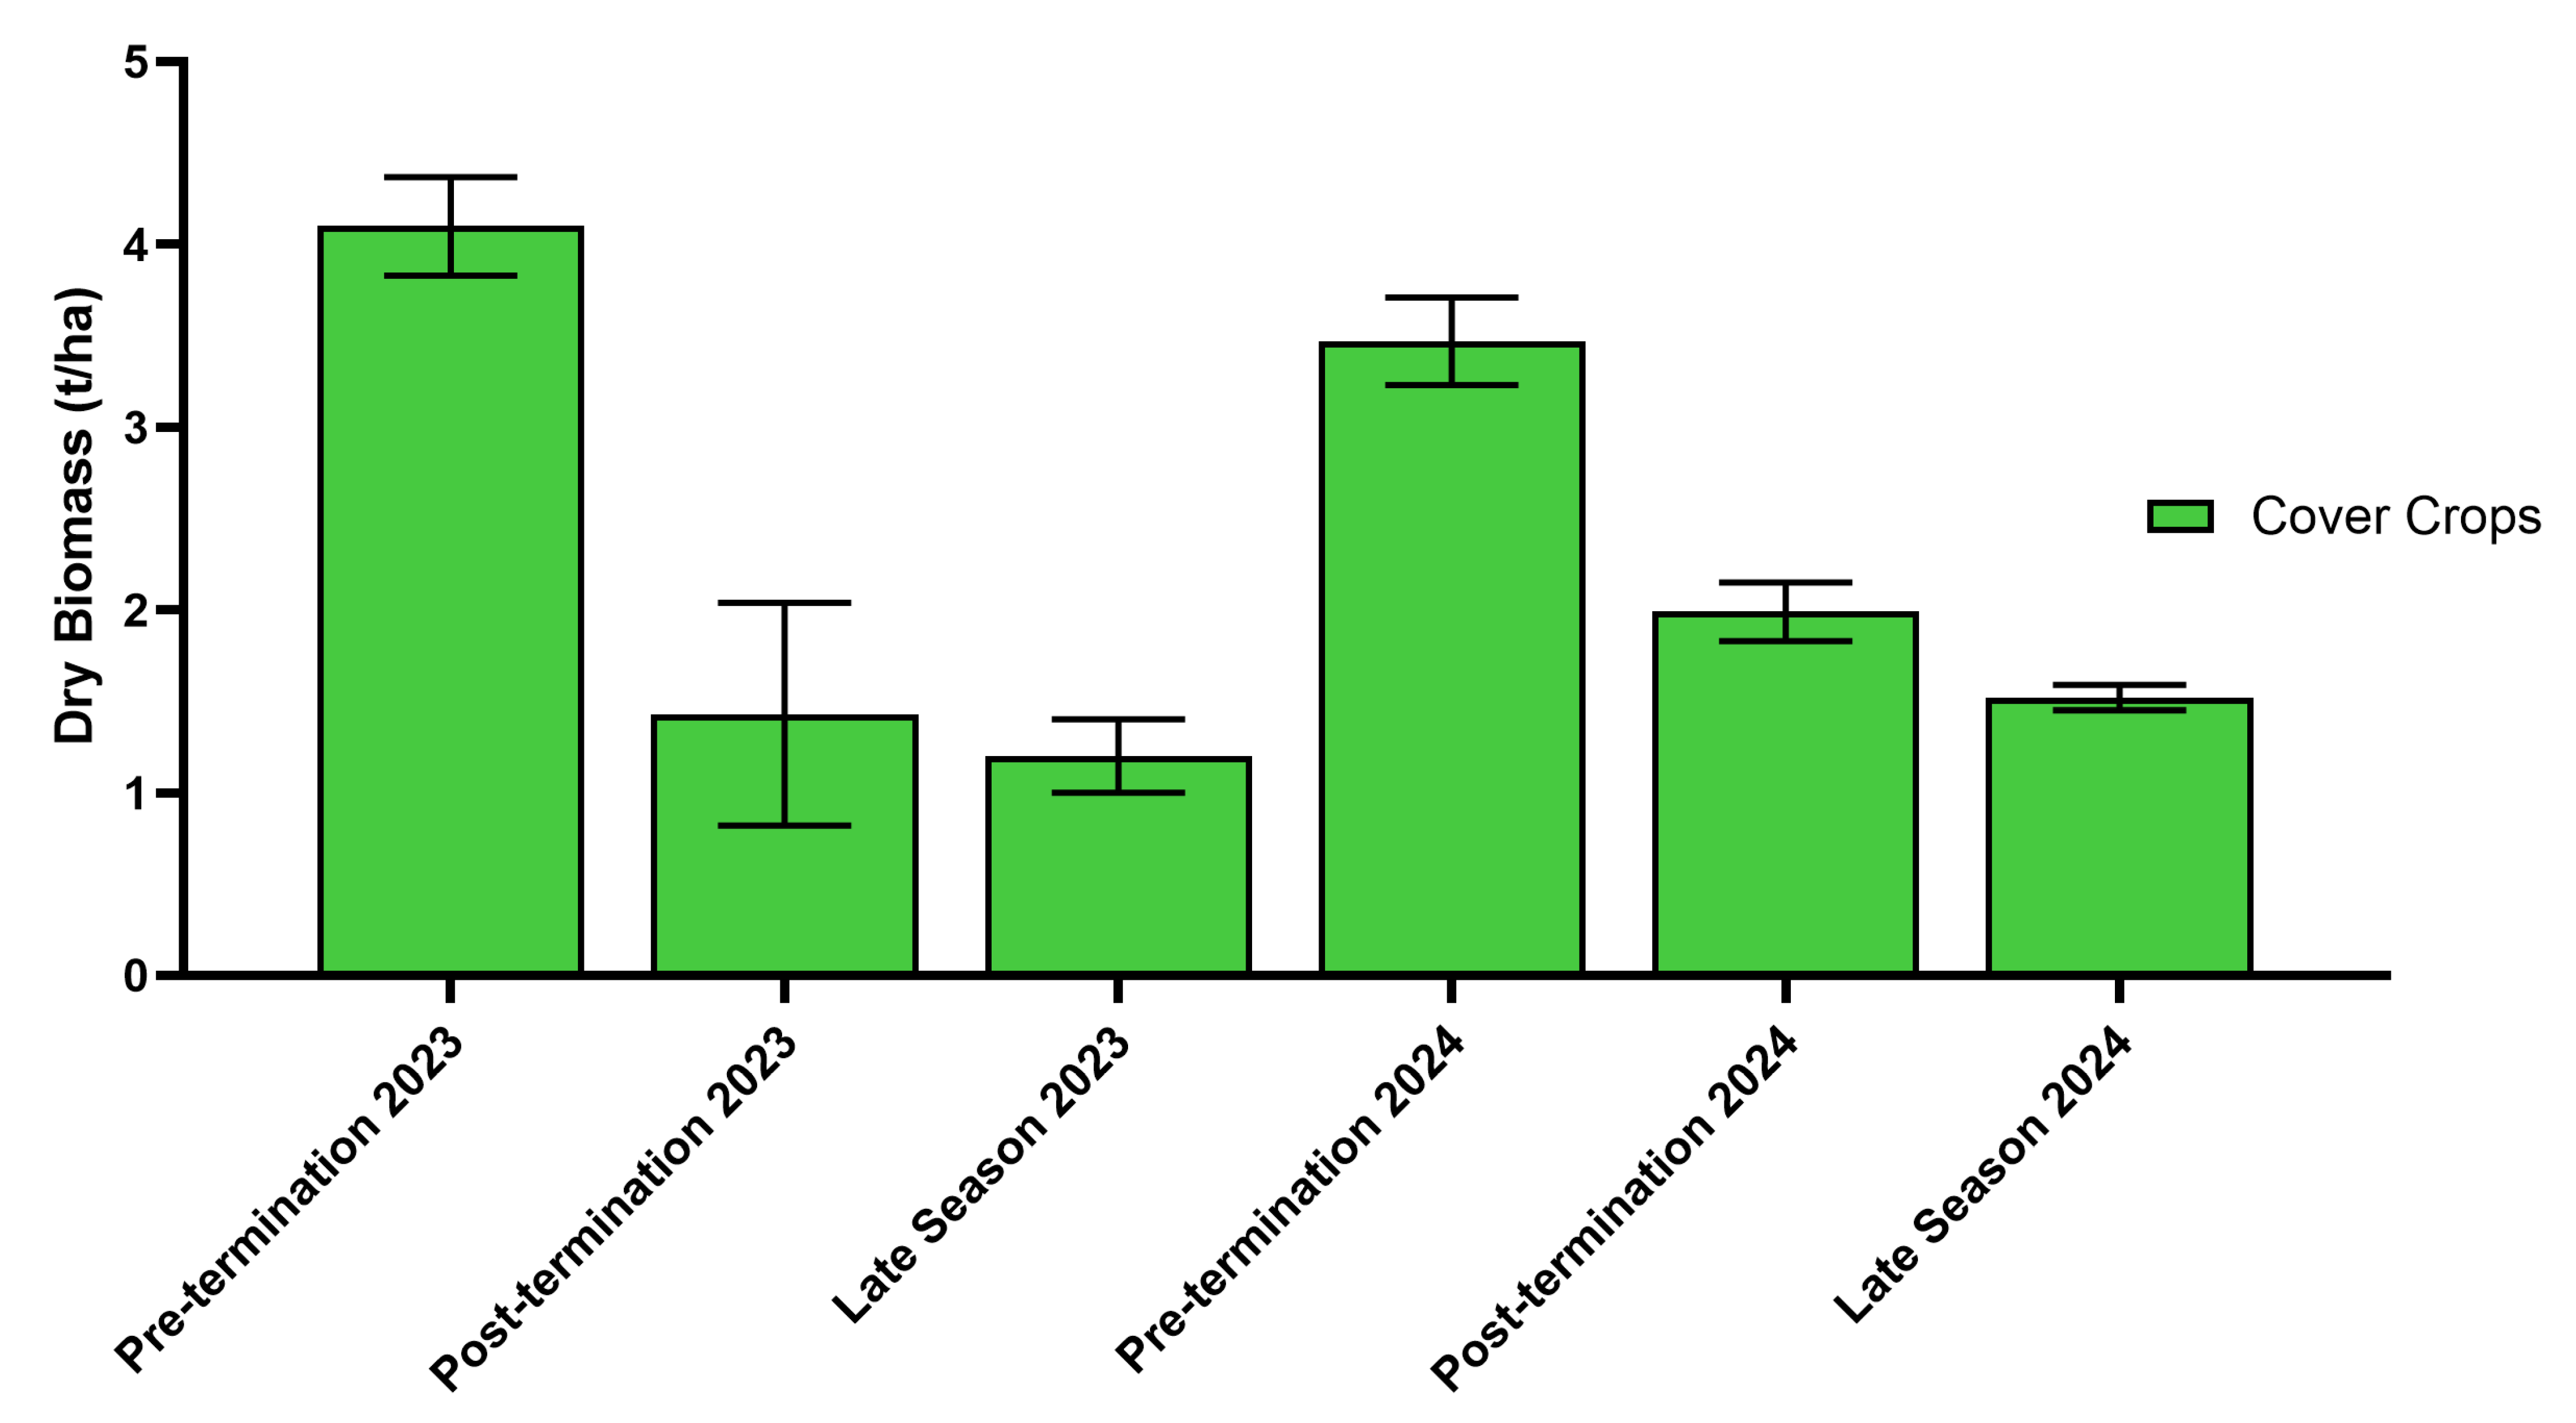
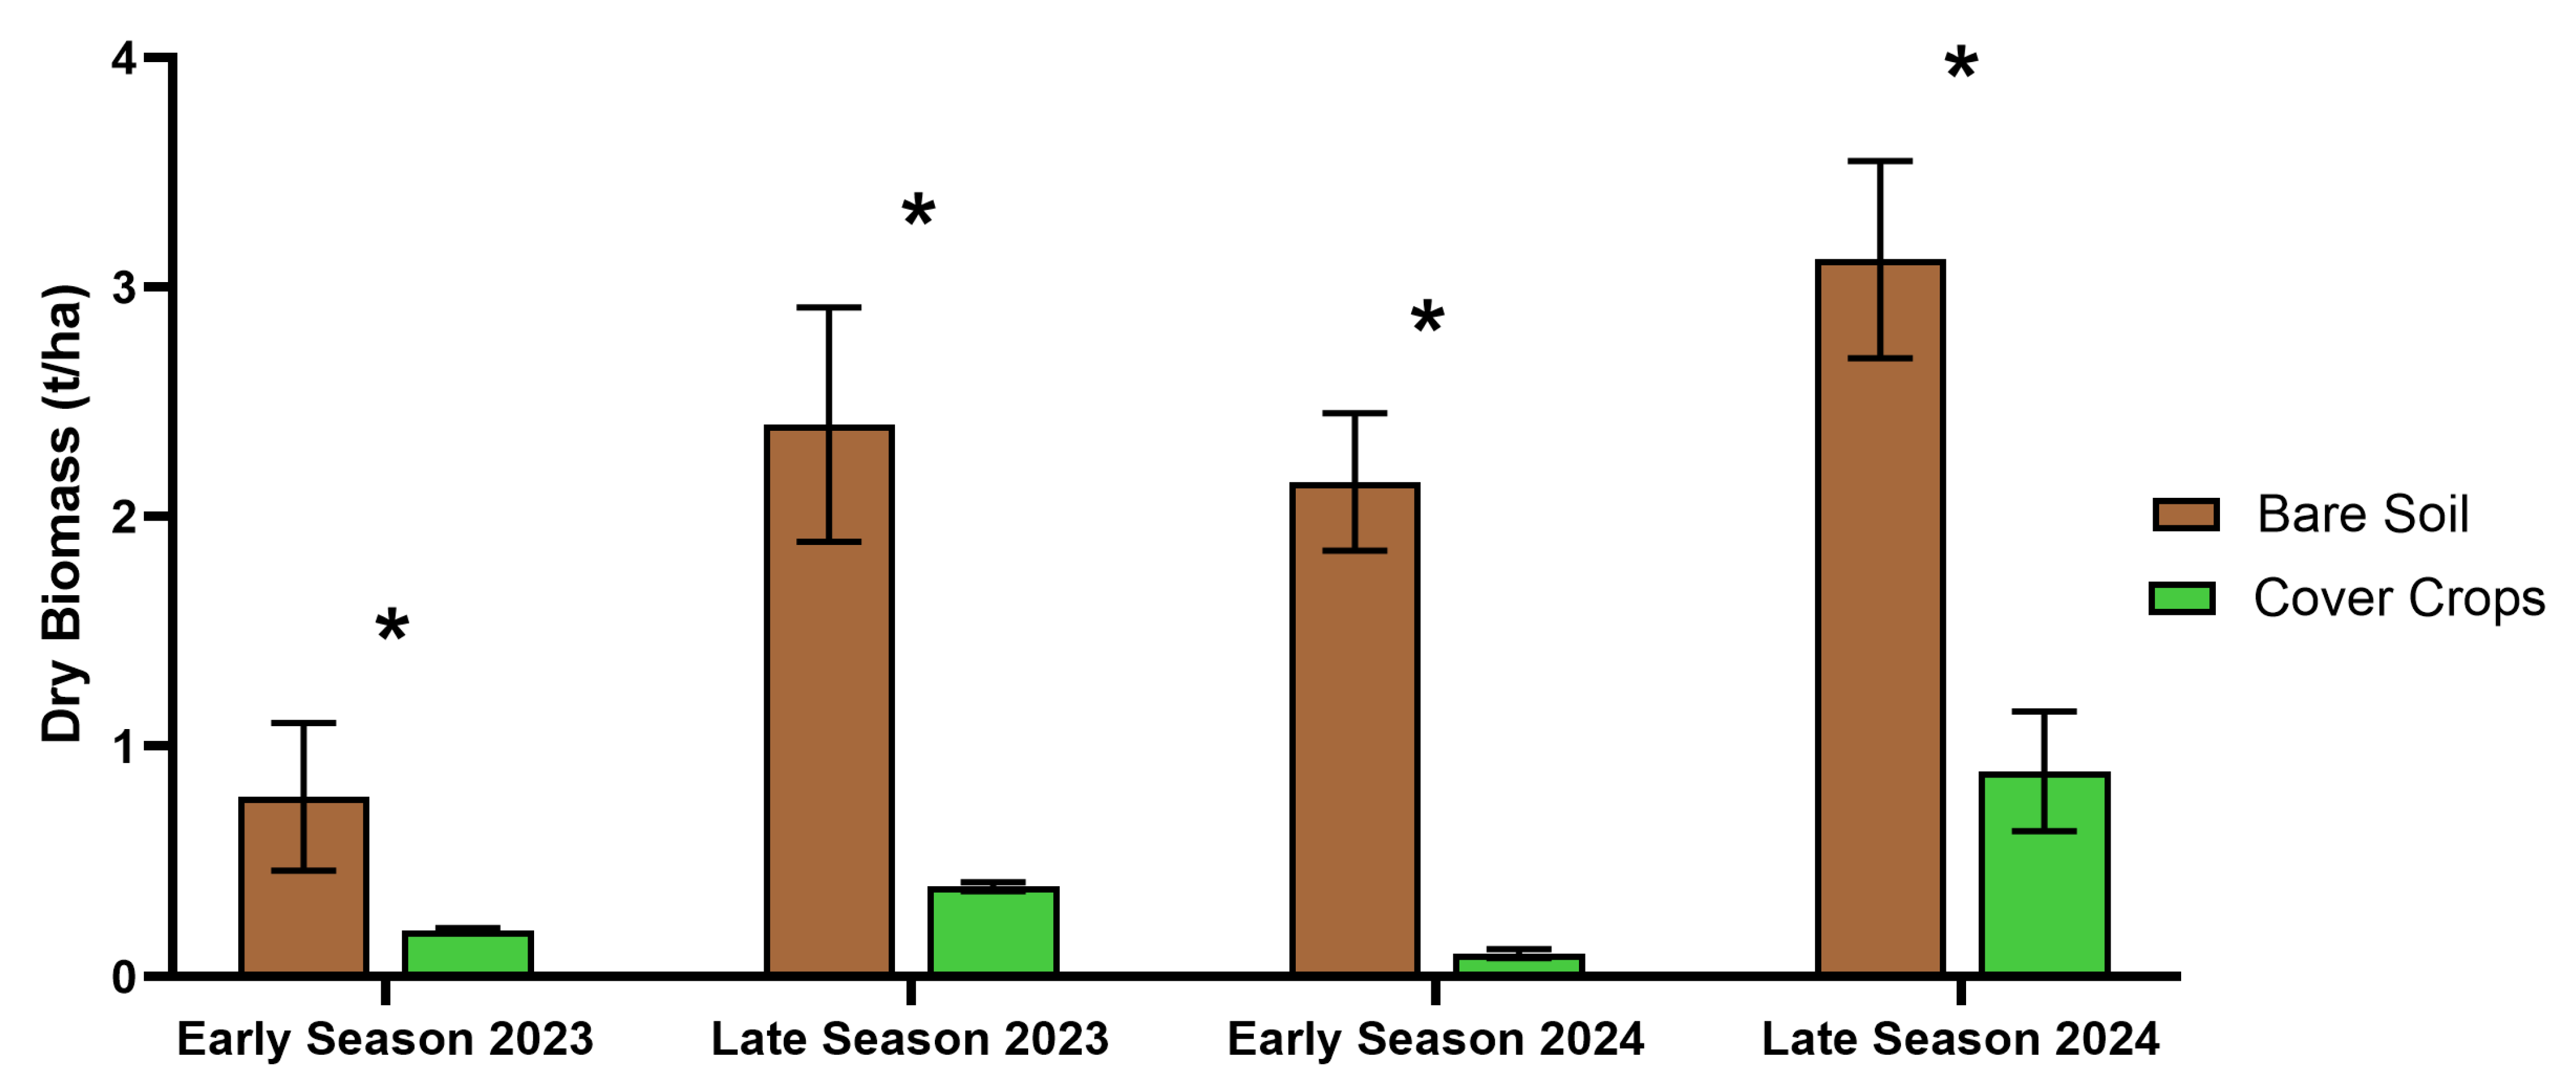
Prior to termination in May 2023, cover-crop dry biomass averaged 4.10 ± 0.27 t/ha across all research blocks (Figure 3). At 8 weeks after the vegetable transplanting date, there was significantly more overall weed biomass (p = 0.03) in the bare soil beds (0.78 ± 0.32 t/ha) than the cover-cropped beds (0.20 ± 0.01 t/ha), but no difference among replicates or different vegetables (Figure 4). Bare soil weed biomass was significantly higher for both broadleaf weeds (0.04 ± 0.03 t/ha vs. 0.02 ± 0.01 t/ha) and grass species (0.29 ± 0.03 t/ha vs. 0.01 ± 0.01 t/ha). Dry cover-crop residue on the cover-crop beds was not different among the vegetables or blocks, with an average biomass of 1.43 ± 0.61 t/ha. At the end of the 2023 season, there was significantly higher overall weed biomass (p ≤ 0.001) in the bare soil treatment, with an average of 2.40 ± 0.51 t/ha compared to 0.39 ± 0.02 t/ha on the cover-cropped treatments. Like the early-season sample, this trend was consistent for both broadleaf weed biomass (2.13 ± 0.04 vs. 0.29 ± 0.01 t/ha) and grass biomass (10.81 ± 1.82 t/ha vs. 3.32 ± 0.55 t/ha), with higher biomass in the bare soil treatment than cover-cropped treatment. Despite an additional several months, very little of the cover-crop residue broke down, with 1.2 ± 0.2 t/ha remaining on the soil surface at the end of the season.
In the 2024 field season, there was an average cover-crop biomass of 3.47 ± 0.24 t/ha before termination, with no statistical difference among replicates (Figure 3). For 2024, the 8-week post-transplant sample had significantly higher weed biomass (p ≤ 0.001) for the bare soil treatment (2.15 ± 0.30 t/ha) than the cover-crop treatment (0.10 ± 0.02 t/ha). For this sampling, there was no statistical difference among all replicates or crops for dry weed biomass. Both broadleaf weeds (0.71 ± 0.15 t/ha vs. 0.09 ± 0.01 t/ha) and grasses (1.45 ± 0.29 t/ha vs. 0.01 ± 0.00 t/ha) followed a trend of increased biomass in the bare soil treatment than the cover-cropped treatment. Cover-crop residue at the 8-week post-transplant sampling point averaged 1.99 ± 0.16 t/ha, and was not different among crops or replicates (Figure 3). At the end of the 2024 season, the overall weed dry biomass was significantly higher (p ≤ 0.001) in the bare soil treatments, with an average biomass of 3.12 ± 0.43 t/ha compared to 0.89 ± 0.26 t/ha in the cover-cropped treatments. The majority of this weed biomass consisted of broadleaf species for both bare soil (2.85 ± 0.39 t/ha) and cover-cropped (0.71 ± 0.25 t/ha) treatments compared to grasses (0.28 ± 0.12 t/ha and 0.19 ± 0.09 t/ha for bare soil and cover-cropped treatments, respectively). At the end of the season, cover-crop residue remained on the soil surface at a rate of 1.52 ± 0.07 t/ha and remained an effective mat to suppress weeds in the treatment where it was present.

3.3. Crio Yield

One month after transplanting vegetables in 2023, there was no difference (Figure 5A) in the percent of surviving transplants for squash (bare soil: 86.11%; cover-cropped soil: 78.89%) or pepper (bare soil: 88.06%; cover-cropped soil: 79.28%); however, eggplant success was significantly higher (p = 0.021) in cover-cropped soil (98.33% success) than bare soil treatments (66.67%). In 2024 (Figure 5B), there was, similarly, no difference between the transplant success of squash (bare soil: 94.44%; cover-cropped soil: 95.56%) or pepper (bare soil: 93.33%; cover-cropped soil: 97.41%), with significantly higher success in cover-cropped treatments (95.42%) than bare soil treatments (82.08%).

3.4. Yield Assessment

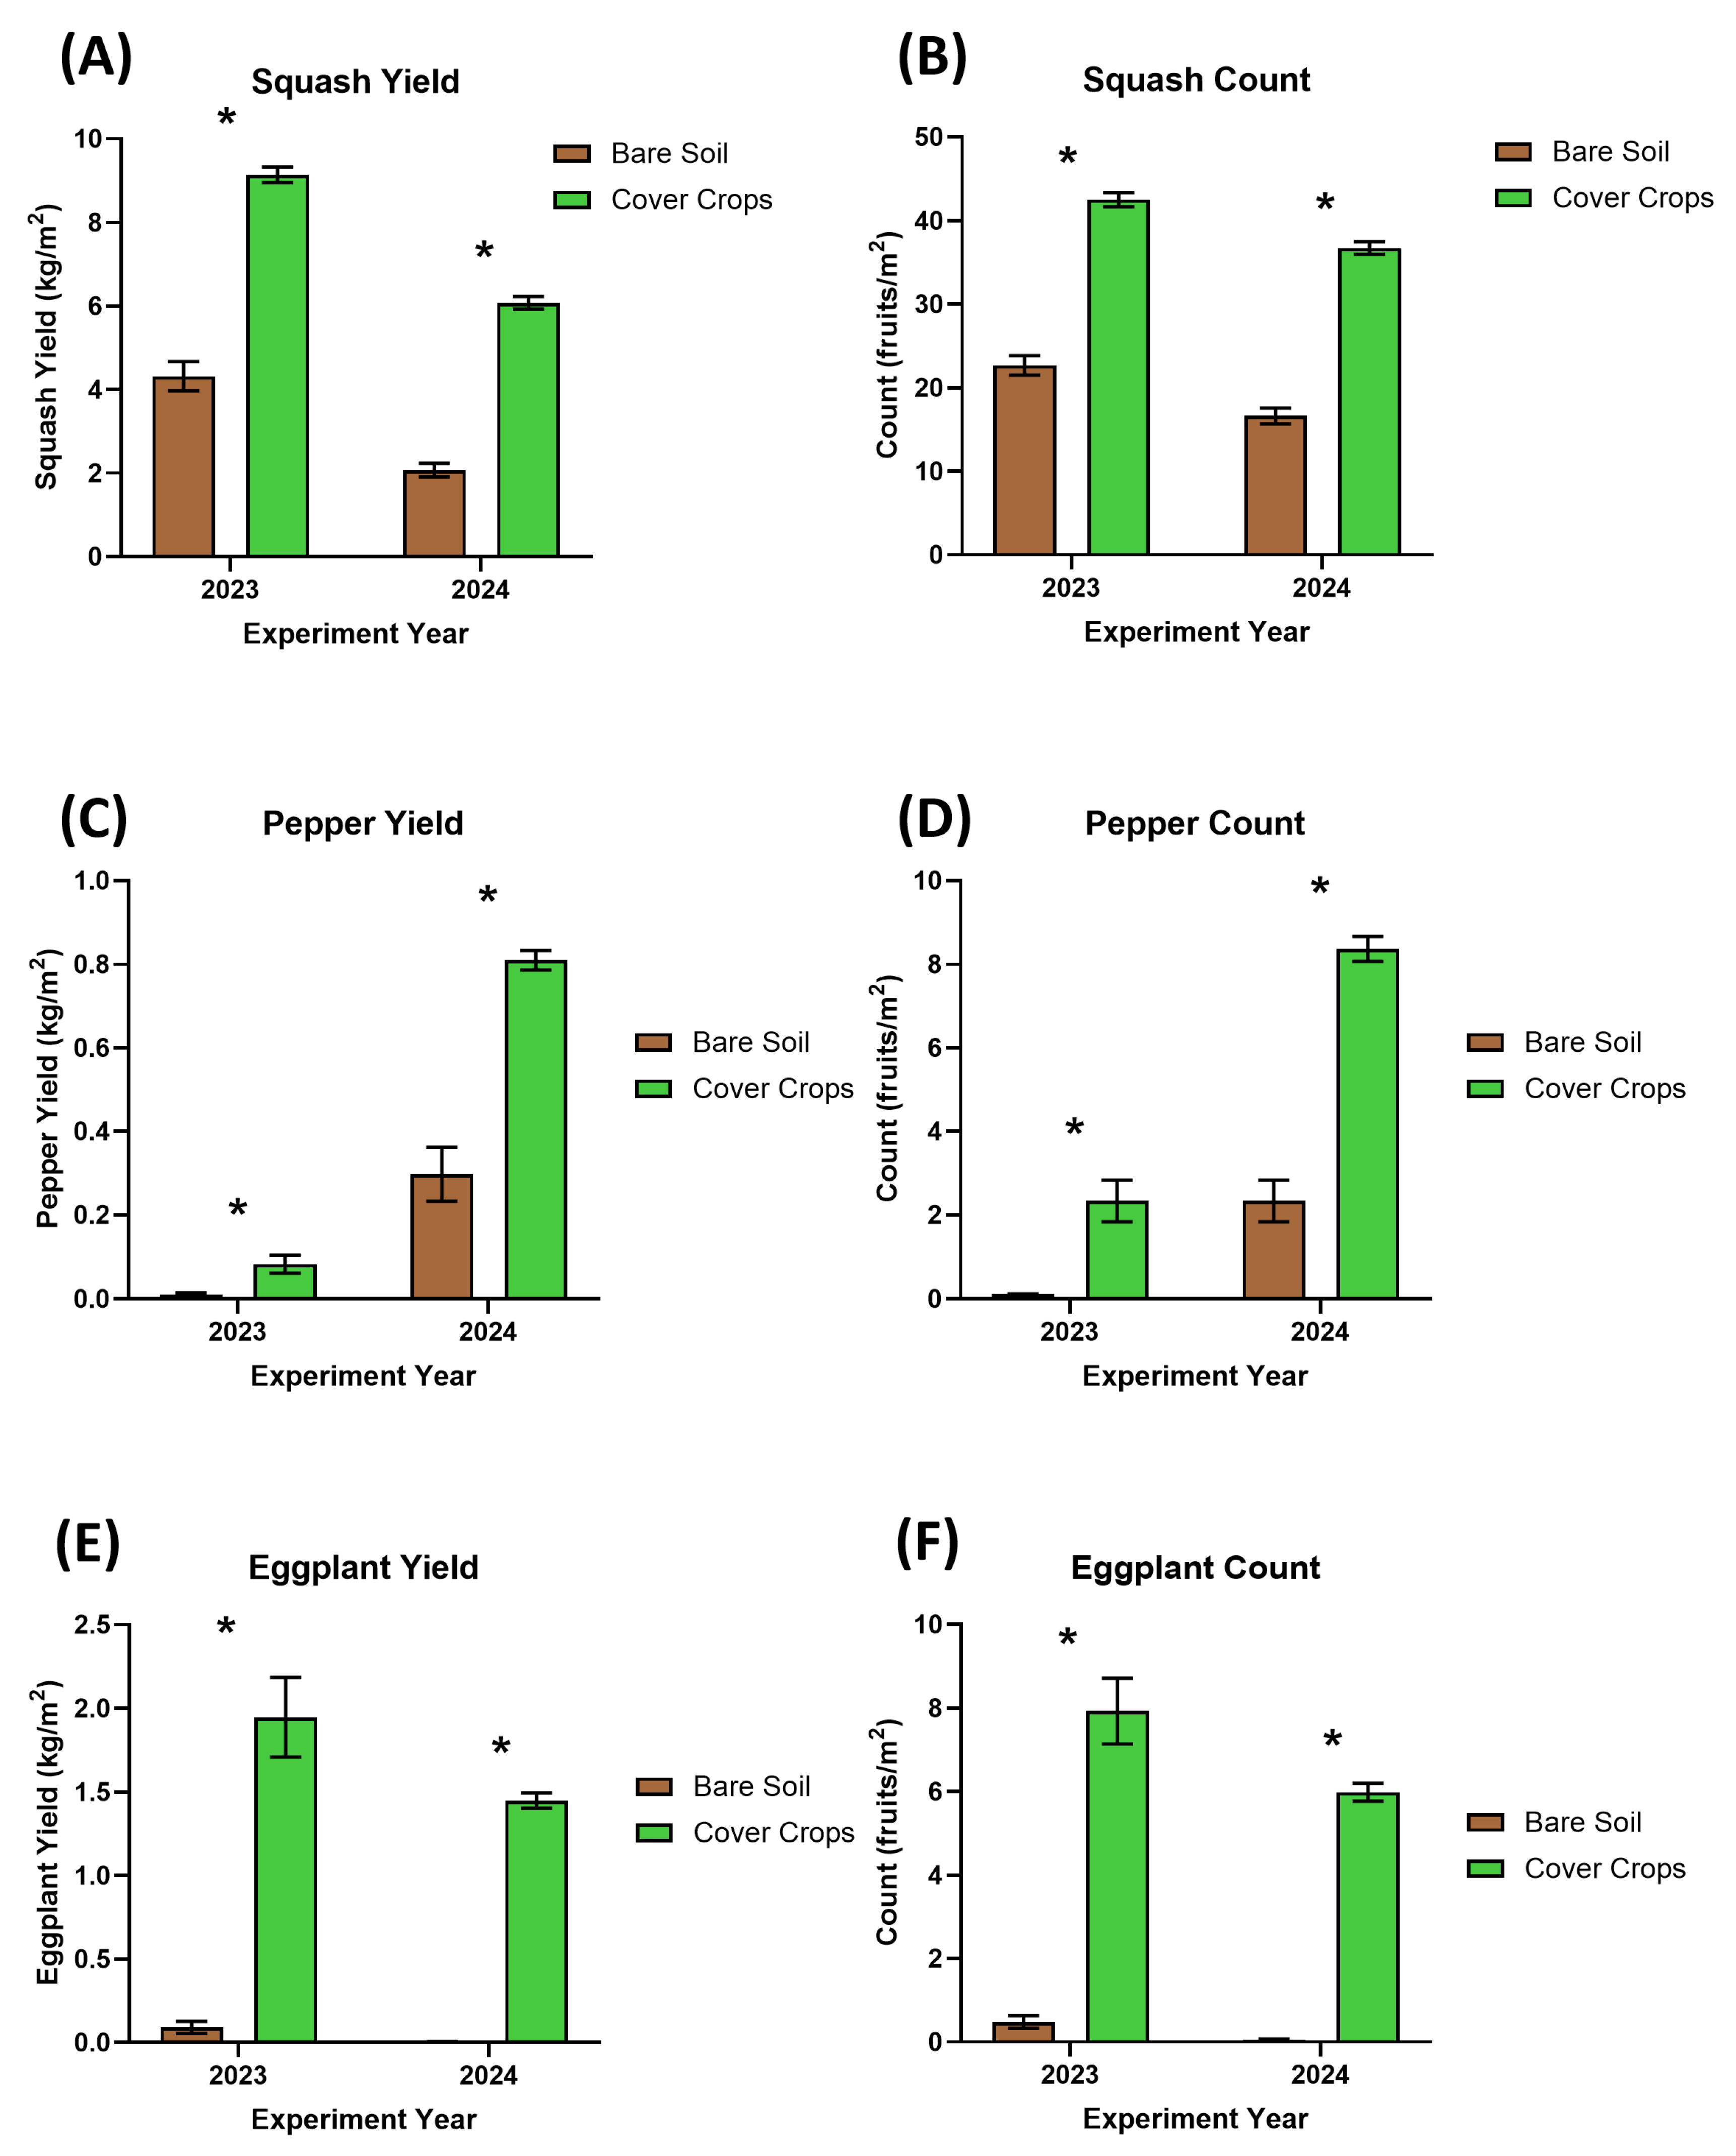
Fruit counts of marketable squash were 60.81% higher in cover-cropped beds, with 42.50 ± 0.85 fruit collected per m2 compared to only 22.68 ± 1.17 fruit/m2 (Figure 6A). Squash yield in 2023 was significantly higher (p = 0.024) in cover-cropped treatments with 9.14 ± 0.18 kg/m2 harvested across the entire season compared to 4.32 ± 0.18 kg/m2 in bare soil treatments. Fruit counts in 2024 were 36.72 ± 0.73 fruit/m2 in the cover-cropped treatment, 75.26% higher than 16.64 ± 0.15 fruit/m2 in bare soil treatments (Figure 6B). The 2024 squash yield decreased by 51.95% and 33.52% for bare soil and cover cropped treatments, respectively; however, cover-cropped treatment yield (6.07 ± 0.15 kg/m2) was significantly higher than bare soil treatment (2.08 ± 0.16 kg/m2).
Pepper yield was substantially affected by an infestation of pepper weevil (Anthonomus eugenii Cano, 1894), which resulted in low yields for both bare soil (0.01 ± 0.01 kg/m2) and cover-cropped treatments (0.08 ± 0.2 kg/m2). Through more intensive monitoring and the IPM program, significantly higher yields were harvested in 2024. Pepper yield was significantly lower in bare soil treatment (0.29 ± 0.06 kg/m2) than cover-cropped treatments (0.81 ± 0.03 kg/m2). In 2024, there was also a significantly higher number of peppers collected from cover-crop treatment (8.36 ± 0.30 fruit/m2) than bare soil treatment (2.33 ± 0.50 fruit/m2).
Eggplant yield was significantly higher (p ≤ 0.001) in cover-cropped beds (1.95 ± 0.24 kg/m2), with only 0.09 ± 0.04 kg/m2 from the bare soil treatment. Eggplant fruit counts were 177% higher in cover-cropped treatment (7.92 ± 0.79 fruit/m2) than bare soil treatment (0.48 ± 0.15 fruit/m2). In 2024, eggplant yield remained significantly lower for bare soil treatment (0.01 ± 0.01 kg/m2) than cover-cropped treatment (1.47 ± 0.01 kg/m2). Harvested eggplant counts were also significantly higher in cover-cropped treatments (7.92 ± 0.79 fruit/m2) than bare soil treatments (7.92 ± 0.79 fruit/m2).

3.5. Crop Aboveground Biomass

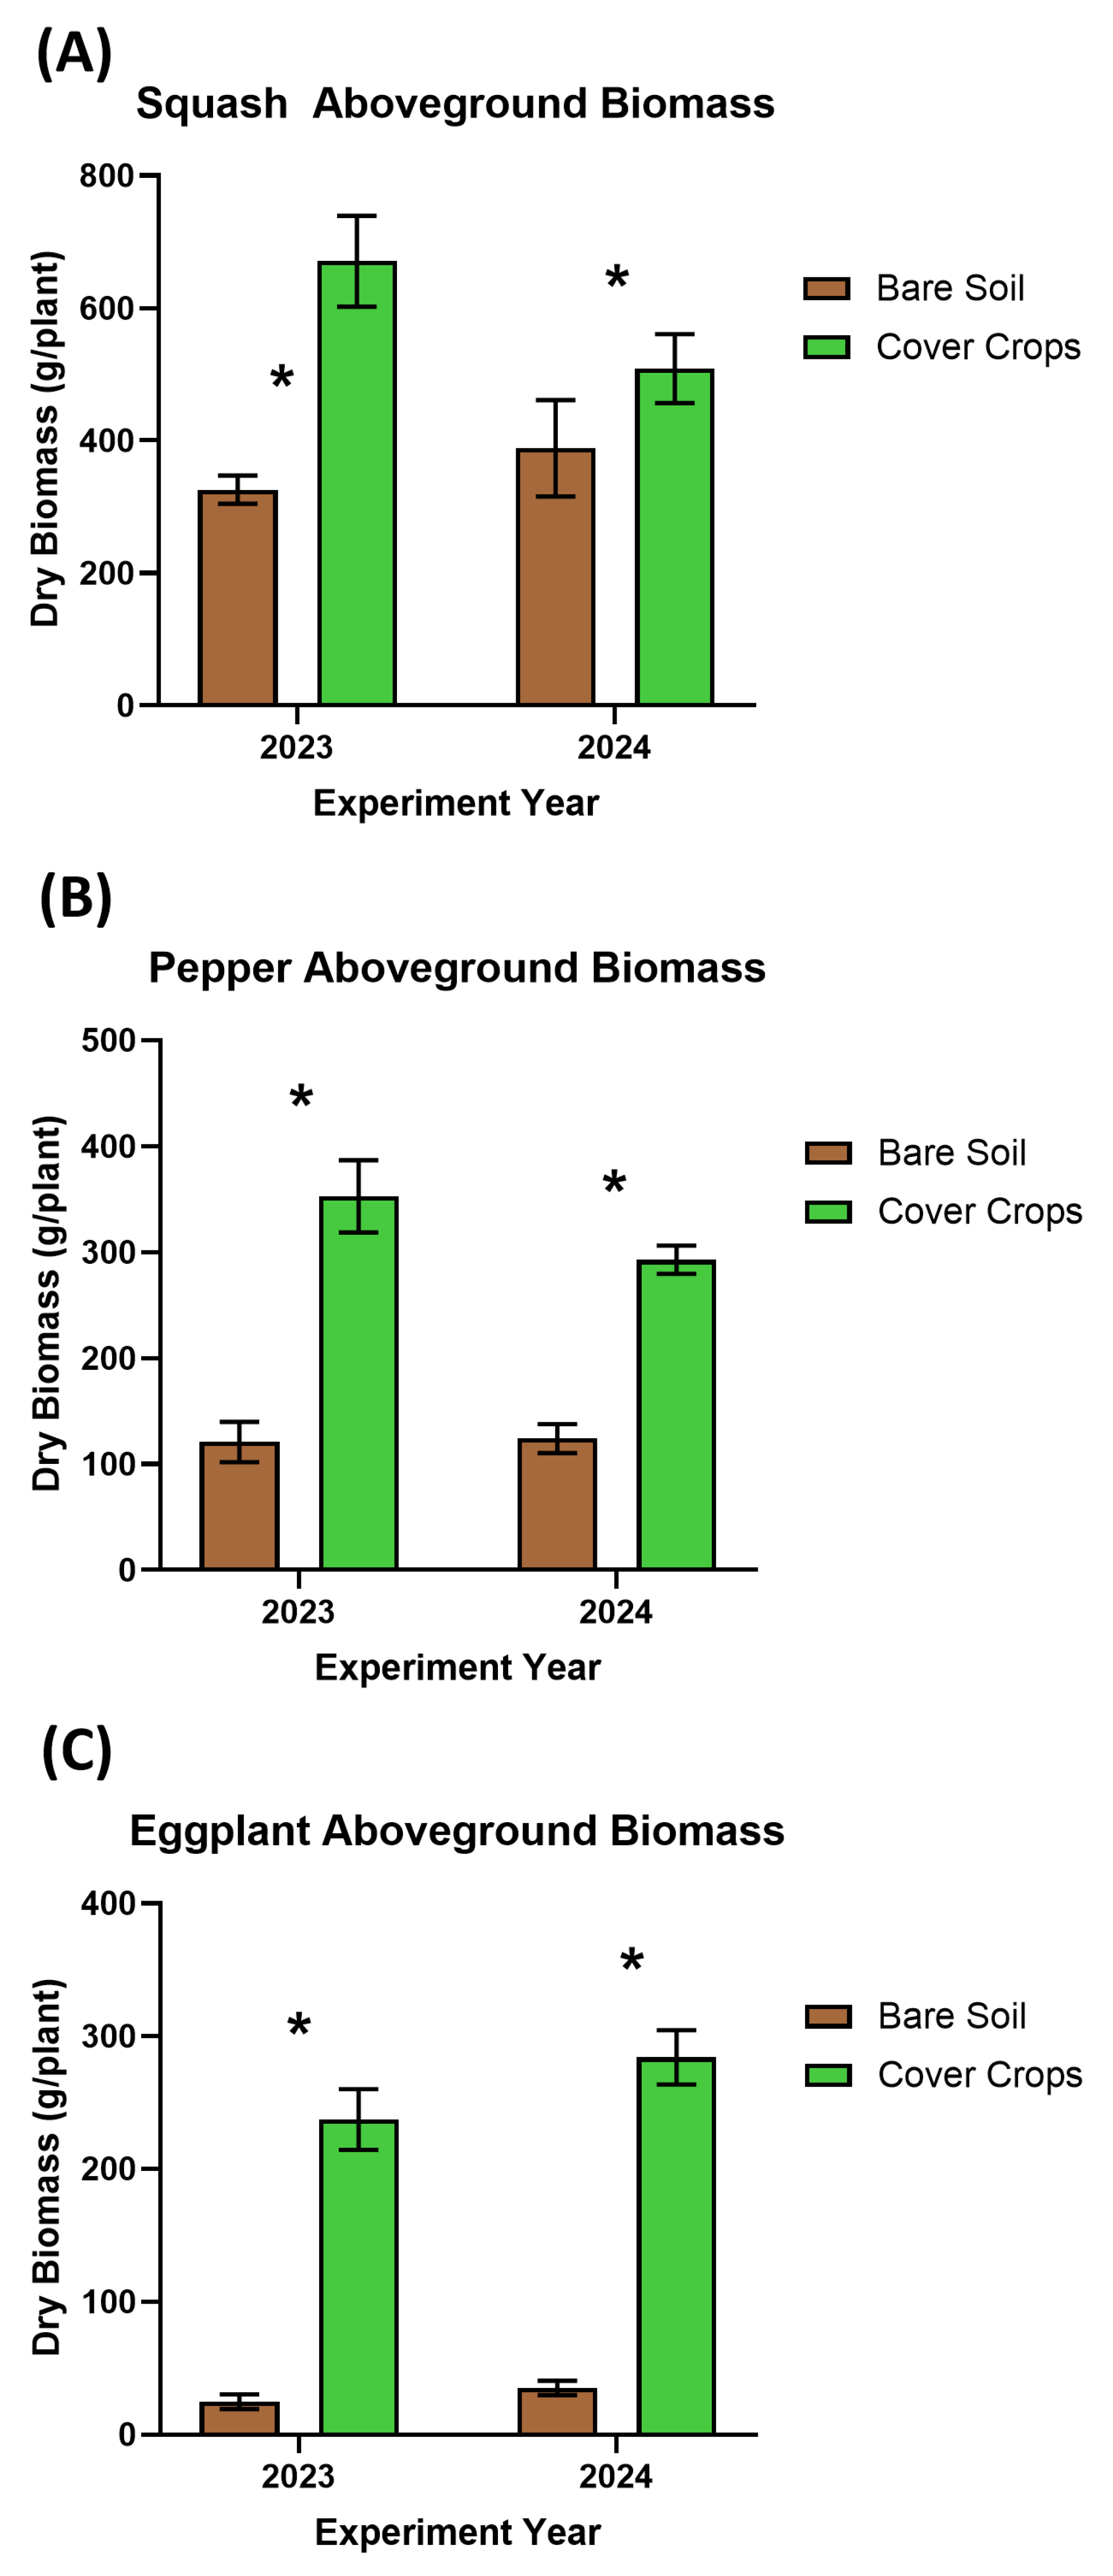
Squash dried aboveground biomass in 2023 was significantly higher (p ≤ 0.001) in the cover-cropped treatments (670.92 ± 68.67 g/plant), which was 69% higher than bare soil treatments (325.65 ± 21.27 g/plant). In 2024, squash dried aboveground biomass was again significantly higher (p = 0.013) in cover-cropped treatments (508.53 ± 52.08 g/plant) than in bare soil treatments (388.47 ± 72.67 g/plant). Pepper dried aboveground biomass in 2023 in bare soil treatment (120.81± 19.06 g/plant) was significantly lower than in the cover-cropped beds (352.58 ± 34.11 g/plant)—a 98% higher dried mass. In 2024, pepper aboveground biomass was slightly higher for bare soil plants (123.14 ± 13.74 g/plant), but was still significantly lower than cover-cropped plants at an average dried mass of 292.85 ± 12.33 g/plant. Eggplant aboveground biomass in 2023 was significantly higher (p ≤ 0.001) in cover-cropped treatment (237.12 ± 22.85 g/plant) than in bare soil (24.81 ± 5.59 g/plant). Aboveground biomass in 2024 was similarly significantly greater for cover-cropped treatment eggplants (284.03 ± 20.42 g/plant) than in bare soil treatments (35.18 ± 5.35 g/plant).

4. Discussion

Within organic vegetable production, there is an increased desire for effective systems that incorporate cover-crop/no-till practices to enhance soil health and suppress weeds [26]. Other studies have attempted similar experiments, but often with mixed success [27,28]. This experiment is one of the first to implement a reduced tillage/cover-cropping system for coastal southern California, and provides some promising findings for the wider adoption of these practices. Cereal rye/field pea cover-crop mixes were an effective combination that created high stands that, when crimped, effectively covered the soil surface across all beds throughout the vegetable production cycle (Figure 3). The residue from terminated cover crops proved to be an effective environment to transplant all of the vegetable species tested, with only minimal transplants failing to succeed without any significant differences (Figure 5). The layer of terminated cover crops was found to regulate the conditions of the soil in the top 10 cm of the soil (Table 1). While differences in temperature were non-significant, the readings included the entire length of the probe inserted in the soil. During the summer months the soil surface on the bare soil areas was noticeably hotter than below the cover-crop residue that also retained significantly higher moisture content. These differences created an environment with more favorable physical conditions for microorganisms, and soil from the cover-cropped beds contained significantly higher MAC, a source of nutrition for microorganisms in the soil [1,29]. The improvements to soil fertility (Figure 1) and favorable conditions for microorganisms in the cover-cropped beds can facilitate a more rapid uptake of nutrients via crop roots and allow for more rapid growth and larger overall plant size (Figure 7).
Weed pressure was significantly reduced throughout both vegetable growing seasons (Figure 4). Dense cover crops have been found to effectively reduce weed establishment [8], but the combination of roller crimper followed by covering with a silage tarp minimized early-season weed germination and regrowth of the cover crop that can limit potential benefits of these practices. Timing of the cover-crop termination is essential to reduce competition for subsequent vegetables while also maximizing the amount of aboveground biomass in high-residue systems [30]. This experiment chose to pair the roller crimper system with the immediate covering of the cover-crop residue with a silage tarp to ensure complete termination. While this may have served an additional role of suppressing weed emergence, the tillage in the bare soil control plots immediately before vegetable transplanting created similar conditions between the two treatments. In both field seasons, the high biomass that covered the soil surface led to more favorable conditions at the soil surface (Table 1). All replicates were irrigated along the same lines of drip tape and for the same duration, yet consistently had higher moisture content in the soil. To take the weekly readings with the probe, cover-crop residue was shifted away from the soil surface to ensure accurate readings at the correct soil depth and is illustrative of the protection from the cover-crop mulch. In addition to physical protection from sunlight and less rapid evapotranspiration, the less frequent disturbance in the cover-cropped beds and the improvements to soil structure led to higher aggregate stability and faster water infiltration rates. Previous studies have identified similar trends in Midwestern United States row cropping systems [31] and California almond orchards [4], where the use of regenerative practices (reduced tillage, routine cover cropping) led to similar improvements in the structure of the soil and ability of water to move through the soil.
All three crops saw significant improvements in crop yield during both experimental years in the cover-cropped treatments (Figure 6). In this experiment, to isolate the effect of the experimental treatments, there was no additional fertilization applied to any of the vegetables during the field duration of the experiment. Following a fertilization program of a typical operation in the region would have likely resulted in improvements to both treatments. However, the objective of this project was to determine whether cover crops preceding the vegetable crop could improve soil fertility and suppress weed abundance, leading to greater crop yield. While the benefits from the cover-crop mulch on the soil surface did benefit the plant size and fruit yield of the fast-growing zucchini squash, as hypothesized, there was an even greater difference in the slower growing peppers and eggplants that had 92.5% and 189% lower yields, respectively, in the bare treatments. In many cases, both of these vegetables produced very little vegetative material and failed to reach a reproductive stage of development. The soil conditions created from cover-cropping/reduced-tillage practices leading to yield improvements has been previously identified in cropping systems [3,32]. Increased soil fertility from cover crops can allow for the early-season development of root systems that can lead to a greater capacity for nutrient uptake which drive improvements in plant size and yield.
While these results demonstrate potential improvements to crop yield, widespread adoption of these systems cannot be based on crop yield alone. The time a grower would dedicate to growing and terminating a cover crop prior to vegetable production represents a potential loss in production from that field. In a coastal climate that allows for year-round production, a field can produce multiple crops to be harvested in a single year that would be reduced by instead producing a cover crop. Considerations of how these two systems would differentiate in labor, inputs, and number of harvestable products need further consideration to provide growers with the most accurate assessments. Calculating the total profitability of an operation can be difficult, but future work can provide growers with the necessary roadmap to lead to increased adoption [31]. In addition to these limitations, the use of silage tarp to ensure uniform termination of the cover crop, while effective for these relatively small research plots, would be difficult to implement for larger operations. It is important to consider that the purchasing of the tarp, labor dedicated to laying/removing the tarp, and the production time lost while this tarp is laid all are necessary to consider for any grower considering these practices of cover-crop occultation.
As in the case in any truly regenerative operation, there is a need to continuously adapt to new challenges in crop production. An infestation of pepper weevil in the 2023 field season was the cause of the minimal yield from all plants in both experimental treatments; however, because this insect pest targets the developing fruit, there was still a measurable difference in the aboveground biomass of the pepper plants at the end of the 2023 season (Figure 7C). To manage pepper weevil infestations in the following season, a series of integrated pest management (IPM) practices were put into effect. At the start of budding Trécé Pherocon Pepper Weevil Kits (Great Lakes IPM Vestaburg, MI, USA) were deployed to monitor the presence of adult weevils around the experiment plot. Once the first adults were observed, kaolin clay (Surround WP, Tessenderlo Kerley, Inc. Pheonix, AZ, USA) was applied to all plants to create a barrier that discouraged oviposition on the developing fruit. These practices successfully increased the crop yield for both treatments, while cover-cropped treatment pepper plants still produced greater yields relative to the bare soil treatments.

5. Conclusions

This experiment serves as an essential proof of concept that a high-residue cover-crop system can result in numerous benefits to soil fertility and crop growth and yield. While the methodology cannot be broadly applied to all farming operations, it provides evidence that a grower seeking to adopt regenerative practices to an organic system can do so without compromising yield. Compared to conventional tillage-based organic practices, the cover-crop-based reduced-tillage system significantly improved soil health indicators, including organic matter, microbially active carbon, aggregate stability, and infiltration capacity. Weed suppression was consistently greater in cover-crop plots across both seasons, confirming the efficacy of surface mulch in reducing weed pressure without synthetic inputs or mechanical disturbance. Sustainable practices will continue to evolve to meet the unique challenges growers face, such as climate change and economic uncertainty, that make food production systems even more challenging. Future work should focus on scaling these approaches, evaluating economic trade-offs, and optimizing system designs to facilitate broader implementation among diversified vegetable growers. The findings underscore the potential for high-residue cover-crop systems to serve as a foundational component of regenerative organic agriculture in intensive production regions.

Supplementary Materials

The following supporting information can be downloaded at: https://www.mdpi.com/article/10.3390/su17178069/s1.

Author Contributions

Conceptualization, J.P. and A.B.; methodology, J.P., A.B. and A.S.; validation, J.P., A.B. and A.S.; formal analysis, J.P.; investigation, J.P. and A.B.; data curation, J.P. and A.B.; writing—original draft preparation, J.P.; writing—review and editing, J.P., A.B. and A.S.; visualization, J.P., A.B. and A.S.; supervision, A.B.; project administration, A.B. and A.S.; funding acquisition, A.B. and A.S. All authors have read and agreed to the published version of the manuscript.

Funding

This work was funded by the California Department of Food and Agriculture Specialty Crop Block Grant program #22-0001-026-SF. We also acknowledge the generous support of the Holdfast Foundation for their contributions to field operations and applied research activities.

Conflicts of Interest

The authors declare no conflict of interest.

References

  1. Schreefel, L.; Schulte, R.P.O.; de Boer, I.J.M.; Schrijver, A.P.; van Zanten, H.H.E. Regenerative agriculture—The soil is the base. Glob. Food Secur. 2020, 26, 100404. [Google Scholar] [CrossRef]
  2. Rodale, R. Breaking new ground: The search for a sustainable agriculture. Futurist 1983, 17, 15–20. [Google Scholar]
  3. Giller, K.E.; Hikbeek, R.; Andersson, J.A.; Sumberg, J. Regenerative Agriculture: An agronomic perspective. Outlook Agric. 2021, 50, 13–25. [Google Scholar] [CrossRef] [PubMed]
  4. Fenster, T.L.; LaCanne, C.E.; Pecenka, J.R.; Schmid, R.B.; Bredeson, M.M.; Busenitz, K.M.; Michels, A.M.; Welch, K.D.; Lundgren, J.G. Defining and validating regenerative farm systems using a composite of ranked agricultural practices. F1000Research 2021, 10, 115. [Google Scholar] [CrossRef]
  5. Luna, J.M.; Mitchell, J.P.; Shrestha, A. Conservation tillage for organic agriculture. Renew. Agric. Food Syst. 2012, 21, 21–30. [Google Scholar] [CrossRef]
  6. Schuller, P.; Walling, D.E.; Sepúlveda, A.; Castillo, A.; Pino, I. Changes in soil erosion associated with the shift from conventional tillage to a no-tillage system, documented using 137Cs measurements. Soil Tillage Res. 2007, 94, 183–192. [Google Scholar] [CrossRef]
  7. Pearsons, K.A.; Omondi, E.C.; Zinati, G.; Smith, A.; Rui, Y. A tale of two systems: Does reducing tillage affect soil health differently in long-term, side-by-side conventional and organic agricultural systems? Soil Tillage Res. 2023, 226, 105562. [Google Scholar] [CrossRef]
  8. Brennan, E.B.; Smith, R.F. Mustard Cover Crop Growth and Weed Suppression in Organic, Strawberry Furrows in California. HortScience 2018, 53, 432–440. [Google Scholar] [CrossRef]
  9. Wallace, J.M.; Williams, A.; Liebery, J.A.; Ackroyd, V.J.; Vann, R.A.; Curran, W.S.; Keene, C.L.; VanGessel, M.J.; Ryan, M.R.; Mirsky, S.B. Cover crop-based, organic rotational no-till corn and soybean production systems in the mid-Atlantic United States. Agriculture 2017, 7, 34. [Google Scholar] [CrossRef]
  10. Wallace, J.M.; Keene, C.L.; Curran, W.; Mirsky, S.; Ryan, M.R.; VanGessel, M.J. Integrated weed management strategies in cover crop–based, organic rotational no-till corn and soybean in the mid-Atlantic region. Weed Sci. 2018, 66, 94–108. [Google Scholar] [CrossRef]
  11. Dhakal, M.; Rui, Y.; Benson, A.R.; Hinson, P.O.; Delate, K.; Afshar, R.K.; Luck, B.; Smith, A. Cover crop management strategies affect weeds and profitability of organic no-till soybean. Renew. Agric. Food Syst. 2024, 39, e3. [Google Scholar] [CrossRef]
  12. Moyer, J. Roller/Crimper No-Till; Acres U.S.A.: Greeley, CO, USA, 2021. [Google Scholar]
  13. Manici, L.M.; Caputo, F.; Nicoletti, F.; Leteo, F.; Campanelli, G. The impact of legume and cereal cover crops on rhizosphere microbial communities of subsequent vegetable crops for con-trasting crop decline. Biol. Control 2018, 120, 17–25. [Google Scholar] [CrossRef]
  14. Antichi, D.; Sbrana, M.; Martelloni, L.; Chehade, L.A.; Fontanelli, M.; Raffaelli, M.; Mazzoncini, M.; Peruzzi, A.; Frasconi, C. Agronomic performances of organic field vegetables managed with conservation agriculture techniques: A study from central Italy. Agronomy 2019, 9, 810. [Google Scholar] [CrossRef]
  15. Creamer, N.G.; Plassman, B.; Bennett, M.A.; Wood, R.K.; Stinner, B.R.; Cardina, J. A method for mechanically killing cover crops to optimize weed suppression. Am. J. Altern. Agric. 1995, 10, 157–162. [Google Scholar] [CrossRef]
  16. Fageria, N.K.; Baligar, V.C.; Bailey, B.A. Role of cover crops in improving soil and row crop productivity. Comm. Soil Sci. Plant Anal. 2005, 36, 2733–2757. [Google Scholar] [CrossRef]
  17. Teasdale, J.R.; Coffman, C.B.; Mangum, R.W. Potential long-term benefits of no-tillage and organic cropping systems for grain production and soil improvement. Agron. J. 2007, 99, 1297–1305. [Google Scholar] [CrossRef]
  18. Mirsky, S.B.; Ryan, M.R.; Curran, W.S.; Teasdale, J.R.; Maul, J.; Spargo, J.T.; Moyer, J.; Grantham, A.M.; Weber, D.; Way, T.R.; et al. Conservation tillage issues: Cover crop-based organic rotational no-till grain production in the mid-Atlantic region, USA. Renew. Agric. Food Syst. 2012, 27, 31–40. [Google Scholar] [CrossRef]
  19. United States Department of Agriculture, N.A.S.S. Census of Agriculture: Ventura County Profile. Available online: https://www.nass.usda.gov/Publications/AgCensus/2022/Online_Resources/County_Profiles/California/cp06111.pdf (accessed on 5 May 2025).
  20. Roesch-McNally, G.E.; Basche, A.D.; Arbuckle, J.G.; Tyndall, J.C.; Miguez, F.E.; Bowman, T.; Clay, R. The trouble with cover crops: Farmers’ experiences with overcoming barriers to adoption. Renew. Agric. Food Syst. 2018, 33, 322–333. [Google Scholar] [CrossRef]
  21. Osipitan, O.A.; Dille, J.A.; Assefa, Y.; Radicetti, E.; Ayeni, A.; Knezevic, S.Z. Impact of cover crop management on level of weed suppression: A meta-analysis. Crop Sci. 2019, 59, 833–842. [Google Scholar] [CrossRef]
  22. Franzluebbers, A.J.; Haney, R.L.; Honeycutt, C.W.; Schomberg, H.H.; Hons, F.M. Flush of carbon dioxide following rewetting of dried soil relates to active organic pools. Soil Sci. Soc. Am. J. 2000, 64, 613–623. [Google Scholar] [CrossRef]
  23. Haney, R.L.; Haney, E.B.; Smith, D.R.; Harmel, R.D.; White, M.J. The soil health tool- theory and initial broad-scale application. Appl. Soil Ecol. 2018, 125, 162–168. [Google Scholar] [CrossRef]
  24. Hillel, D. Introduction to Environmental Soil Physics; Elsevier Science: San Diego, CA, USA, 2004; p. 498. [Google Scholar]
  25. Doran, J.; Parkin, T.B. Quantitative Indicators of Soil Quality: A Minimum Data Set; Doran, J., Jones, A.J., Eds.; Soil Science Society of America: London, UK, 1997; pp. 25–37. [Google Scholar] [CrossRef]
  26. Quintarelli, V.; Radicetti, E.; Allevato, E.; Stazi, S.R.; Haider, G.; Abideen, Z.; Bibi, S.; Jamal, A.; Mancinelli, R. Cover Crops for Sustainable Cropping Systems: A Review. Agriculture 2022, 12, 2076. [Google Scholar] [CrossRef]
  27. Leavitt, M.J.; Sheaffer, C.C.; Wyse, D.L.; Allan, D.L. Rolled winter rye and hairy vetch cover crops lower weed density but reduce vegetable yields in no-tillage organic production. HortScience 2011, 46, 387–395. [Google Scholar] [CrossRef]
  28. Chen, G.; Kolb, L.; Leslie, A.; Hooks, C.R.R. Using reduced tillage and cover crop residue to manage weeds in organic vegetable production. Weed Technol. 2017, 31, 557–573. [Google Scholar] [CrossRef]
  29. Karuku, G.N.; Gachene, C.K.K.; Karanja, N.; Cornelis, W.; Verplacke, H. Effect of different cover crop residue management practices on soil moisture content under a tomato crop (Lycopersicon esculentum). Trop. Subtrop. Agroecost 2014, 17, 509–523. [Google Scholar] [CrossRef]
  30. Keene, C.L.; Curran, W.S.; Wallace, J.M.; Ryan, M.R.; Mirsky, S.B.; VanGessel, M.J.; Barbercheck, M.E. Cover crop termination timing is critical in organic rotational no-till systems. Agron. J. 2017, 109, 272–282. [Google Scholar] [CrossRef]
  31. LaCanne, C.E.; Lundgren, J.G. Regenerative agriculture: Merging food production and natural resource conservation in a profitable business model. PeerJ 2018, 6, e4428. [Google Scholar] [CrossRef]
  32. Muhammad, I.; Want, J.; Sainju, U.M.; Zhang, S.; Zhao, F.; Khan, A. Cover cropping enhances soil microbial biomass and affects microbial community structure: A meta-analysis. Geoderma 2021, 381, 114696. [Google Scholar] [CrossRef]
Figure 1. Metrics from the soil health analysis collected prior to seeding of cover crops and at the end of the vegetable season for each field season. (A) Soil organic matter determined by combustion; (B) Organic carbon as the pool of carbon determined through water-extractable methods (WEOC); (C) Organic nitrogen as the pool of nitrogen determined through water extraction (WEON); (D) Water stable aggregates as soil passed through sieves and dripped with water to determine the soil particle structure; (E) Microbially active carbon determined by the WEOC that was acted upon by microbes during soil respiration; (F) Soil health score determined by (CO2-C respiration/10) + (WEOC/50) + (WEON/10) as a single soil health assessment metric.
Sustainability 17 08069 g001
Figure 2. Water infiltration rate in pre-saturated bare soil and soil covered with cover-crop residue terminated via roller crimper. Samples were taken in both years at specialty crop harvest (22 August 2023, and 12 August 2024). Asterisk indicates significant difference between treatments (p ≤ 0.05).
Sustainability 17 08069 g002
Figure 3. Aboveground dry biomass of cover-crop residue (mean ± SEM) across experiment.
Sustainability 17 08069 g003
Figure 4. Aboveground dry biomass of weeds (mean ± SEM) across experiment. Asterisk indicates significant difference between treatments (p ≤ 0.05).
Sustainability 17 08069 g004
Figure 5. Percentage of transplanted vegetables that successfully established one month after transplanting, based on original planting density, for 2023 (A) and 2024 (B). Bars represent mean ± SEM for each crop within a single treatment and year.
Sustainability 17 08069 g005
Figure 6. Metrics for crop yield and fruit counts for zucchini squash (A,B), pepper (C,D), and eggplant (E,F) across all experimental blocks. Bars represent mean ± SEM for all yield metrics. Asterisk indicates significant differences between experimental treatments within a data collection year (p ≤ 0.05).
Sustainability 17 08069 g006
Figure 7. Aboveground biomass of zucchini squash (A), pepper (B) and eggplant (C) post-harvesting. Bars represent mean ± SEM for all yield metrics. Asterisk indicates significant differences between experimental treatments within a data collection year (p ≤ 0.05).
Sustainability 17 08069 g007
Table 1. Monthly averages of soil moisture and temperature during vegetable production in 2023 (A) and 2024 (B). Samples were taken. 48 h from the most recent irrigation event to ensure consistent moisture across all replicates. Soil moisture is expressed as volumetric water content (VWC%) and temperature expressed in degree Celsius (°C). Values represent the mean ± SEM from weekly sampling (12 samples per treatment per week across all beds).
(A) 2023 Soil Moisture and Temperature
MonthSoil Moisture VWC%Soil Temperature (°C)
Bare SoilCover CroppedBare SoilCover Cropped
May17.03 ± 0.32 22.86 ± 0.4022.27 ± 0.2921.17 ± 0.25
June15.23 ± 0.4220.48 ± 0.4621.22 ± 0.2220.65 ± 0.17
July 19.66 ± 0.3224.37 ± 0.3028.84 ± 0.1228.57 ± 0.15
August22.08 ± 0.4625.49 ± 0.5828.08 ± 0.0928.01± 0.08
September21.87 ± 0.4223.66 ± 0.4629.37 ± 0.1229.03 ± 0.11
October20.53 ± 0.3723.57 ± 0.4029.62 ± 0.0329.51 ± 0.05
November22.75 ± 0.5927.83 ± 0.6625.83 ± 0.1025.60 ± 0.05
(B) 2024 Soil Moisture and Temperature
MonthSoil Moisture (VWC%)Soil Temperature (°C)
Bare SoilCover CroppedBare SoilCover Cropped
May21.67 ± 0.4623.87 ± 0.4322.63 ± 0.2622.09 ± 0.30
June20.83 ± 0.5923.71 ± 0.6424.60 ± 0.2023.97 ± 0.26
July 20.76 ± 0.7723.36 ± 0.8630.91 ± 0.0830.08 ± 0.18
August24.82 ± 0.6025.35 ± 0.7727.51 ± 0.0527.46 ± 0.07
September21.55 ± 0.7228.12 ± 0.6327.89 ± 0.1127.58 ± 0.15
October17.74 ± 0.8227.41 ± 0.5730.44 ± 0.0729.58 ± 0.15
November22.27 ± 0.6727.55 ± 0.4923.61 ± 0.0923.63 ± 0.07
Disclaimer/Publisher’s Note: The statements, opinions and data contained in all publications are solely those of the individual author(s) and contributor(s) and not of MDPI and/or the editor(s). MDPI and/or the editor(s) disclaim responsibility for any injury to people or property resulting from any ideas, methods, instructions or products referred to in the content.