Article

Multi-Scenario Pumped Storage Capacity Timeline Configuration Method Adapted to New Energy Development

1
School of Electrical and Power Engineering, Hohai University, Nanjing 211100, China
2
State Grid Shandong Electric Power Research Institute, Jinan 250003, China
*
Author to whom correspondence should be addressed.
Sustainability 2025, 17(17), 7990; https://doi.org/10.3390/su17177990
Submission received: 24 July 2025 / Revised: 28 August 2025 / Accepted: 1 September 2025 / Published: 4 September 2025
(This article belongs to the Special Issue Advances in Sustainable Battery Energy Storage Systems)

Abstract

Traditional pumped storage capacity configuration uses static, year-targeted approaches, leading under-capacity in the early planning stages—wasting renewable energy—and over-capacity in later stages, thus wasting resources. In order to solve the above problems, this article innovatively proposes a dynamic, time-sequenced construction timeline and annual capacity configuration strategy, synchronized with new energy and load development, enhancing sustainability through optimized investment allocation and efficient resource utilization. It presents a two-layer model that considers multiple scenario operational dispatch. The upper layer aims to minimize the curtailment of wind and solar energy, providing a planning scheme to the lower layer, which focuses on multi-scenario economic dispatch, taking into account the peak-valley difference indicators. The models co-iterate: lower-layer operational outcomes feed back to refine the upper-layer’s capacity plan. This process continues until the predicted curtailment calculated by the upper layer aligns closely with that observed in the lower-layer operational simulations, or until capacity changes stabilize, ultimately determining the optimal time-phased capacity configuration. Simulations on a provincial power grid during three typical scenarios in winter, transitional seasons, and summer, as well as extreme weather scenarios, confirm that timely, dynamic configuration strategy significantly enhances renewable absorption, proving the model’s effectiveness.

1. Introduction

Against the backdrop of increasingly severe environmental challenges and the global transition in energy structure [1,2,3], vigorously developing wind and solar power has become an effective pathway to achieve the “dual carbon” goals. However, the large-scale integration of renewable energy into the grid introduces significant threats to power system stability due to the intermittency and volatility of wind and photovoltaic generation, necessitating additional balancing power capacity [4,5]. Notably, prioritizing the accommodation of wind and solar power may reduce the operational flexibility of conventional power sources (e.g., thermal power) within the grid and exacerbate output volatility in these sources [6,7,8,9].
As a technically mature and economical power source for safe regulation, pumped storage can effectively improve the anti-peak regulation characteristics generated by large-scale wind power grid connection, play a role in peak shaving and valley filling [10,11] and help large-scale renewable energy consumption and reduce wind and solar curtailment in addition to ensuring the safe and stable operation of the power system [12,13,14].
In the context of new energy consumption, scholars at home and abroad have carried out some research on the allocation and optimal scheduling of pumped storage. In Ref. [15], a multi-time scale iterative optimal allocation model of pumped storage capacity was established, and the optimal allocation of pumped storage capacity was obtained by taking into account the investment and system operation costs. In Ref. [16], a multi-objective optimization model was constructed to evaluate the joint operation benefits of different pumped storage capacity allocation schemes through the dual factors of maximizing economic benefits and minimizing output fluctuations, and finally selected the optimal scheduling strategy. From the perspectives of economy and environment, a capacity allocation model of pumped storage power station was established in Ref. [17], which maximized economic benefits and environmental value while reducing wind and solar curtailment. On the basis of the wind-solar hybrid power generation system, a pumped storage capacity optimization model with the goal of maximizing the annual comprehensive income was constructed in Ref. [18]. By introducing the swarm intelligence optimization algorithm of adaptive mutation mechanism, the optimal energy storage system configuration scheme is solved. In Ref. [19], in the capacity optimization of the wind-solar-pumped-storage hybrid system, the dynamic regulation characteristics of the pumped storage unit are investigated, and the decision-making model of the installed capacity of the system is established based on the matching degree analysis of the power output curve and the power load. The existing research mainly focuses on the synergistic effect of pumped storage and renewable energy, but thermal power still dominates the real power system, so the coordinated operation mechanism of pumped storage units and traditional thermal power units also needs to be included in the scope of research. Ref. [20] combines pumped storage and thermal power units, considers the invocation benefits of pumped storage and thermal power depth peak regulation, proposes an optimal scheduling model for pumped storage and thermal power peak regulation, and verifies that the scheme can greatly improve the economy.
Currently, there is still very little research on the capacity allocation of pumped storage power stations considering development timing. In Ref. [21], a balance analysis model of the power system with carbon constraints was established, and the annual time series simulation method (8760 h) was used to empirically evaluate the specific contribution of pumped storage power stations to improving the renewable energy acceptance capacity of regional power grids.
The traditional pumped storage capacity allocation adopts a static target year planning method, which leads to insufficient capacity in the early planning stage, resulting in a large amount of wind and solar abandonment, and excess capacity in the later stage of planning, resulting in idle and wasted resources. Although the existing literature has made progress in the collaborative optimization of pumped storage and renewable energy, there are still significant limitations, mainly because the current models predominantly employ single-layer optimization that fails to capture operational feedback loops. These defects are manifested in the actual system as high early abandonment rate and saturation of resource utilization in the later stage, and a dynamic timing configuration framework is urgently needed to match the gradual development of new energy and load. In order to solve the above problems, this paper proposes a two-layer dynamic timing configuration model, the core innovation of which lies in the timing synchronization mechanism and the two-layer optimization architecture. The upper model aims to minimize the amount of power abandoned and generates a pumped storage capacity plan. The lower model performs multi-scenario economic scheduling, considers the peak-valley difference index and the two-stage electricity price return, and uses the improved Logistic-Tent composite chaos mapping gray wolf optimization algorithm to solve the multi-objective problem. The two-layer model realizes collaborative optimization through iterative feedback: the lower layer feeds back the actual abandoned power to the upper layer for capacity correction until the predicted abandonment is basically the same as the actual abandonment, or the capacity change tends to be stable, and finally outputs the optimal temporal capacity scheme. The simulation analysis of a provincial power grid in three typical daily scenarios and extreme weather scenarios shows that the timing allocation scheme significantly improves the early renewable energy consumption rate and eliminates the risk of resource idle in the later stage. Compared with the traditional single-layer model, the optimization scheme reduces the investment cost by 10%, improves scheduling economy, and reduces the peak-to-valley difference. In extreme weather scenarios, the model maintains robustness, confirming its adaptability in high-volatility systems. The main contribution of this paper are as follows:
  • A dynamic configuration timeline mechanism is created to solve the dilemma of misallocation of pumped storage timing resources through a stepped capacity accumulation strategy, and achieve a leap in full-cycle investment efficiency;
  • A two-layer model is constructed to dynamically calibrate the configuration scheme with the power abandonment rate feedback closed-loop to achieve more accurate allocation of effective regulation capabilities, and the model can still generate a reasonable scheduling scheme in extreme weather scenarios, which has a certain degree of robustness.

2. Pumped Storage Capacity Configuration Method Considering Construction Timeline

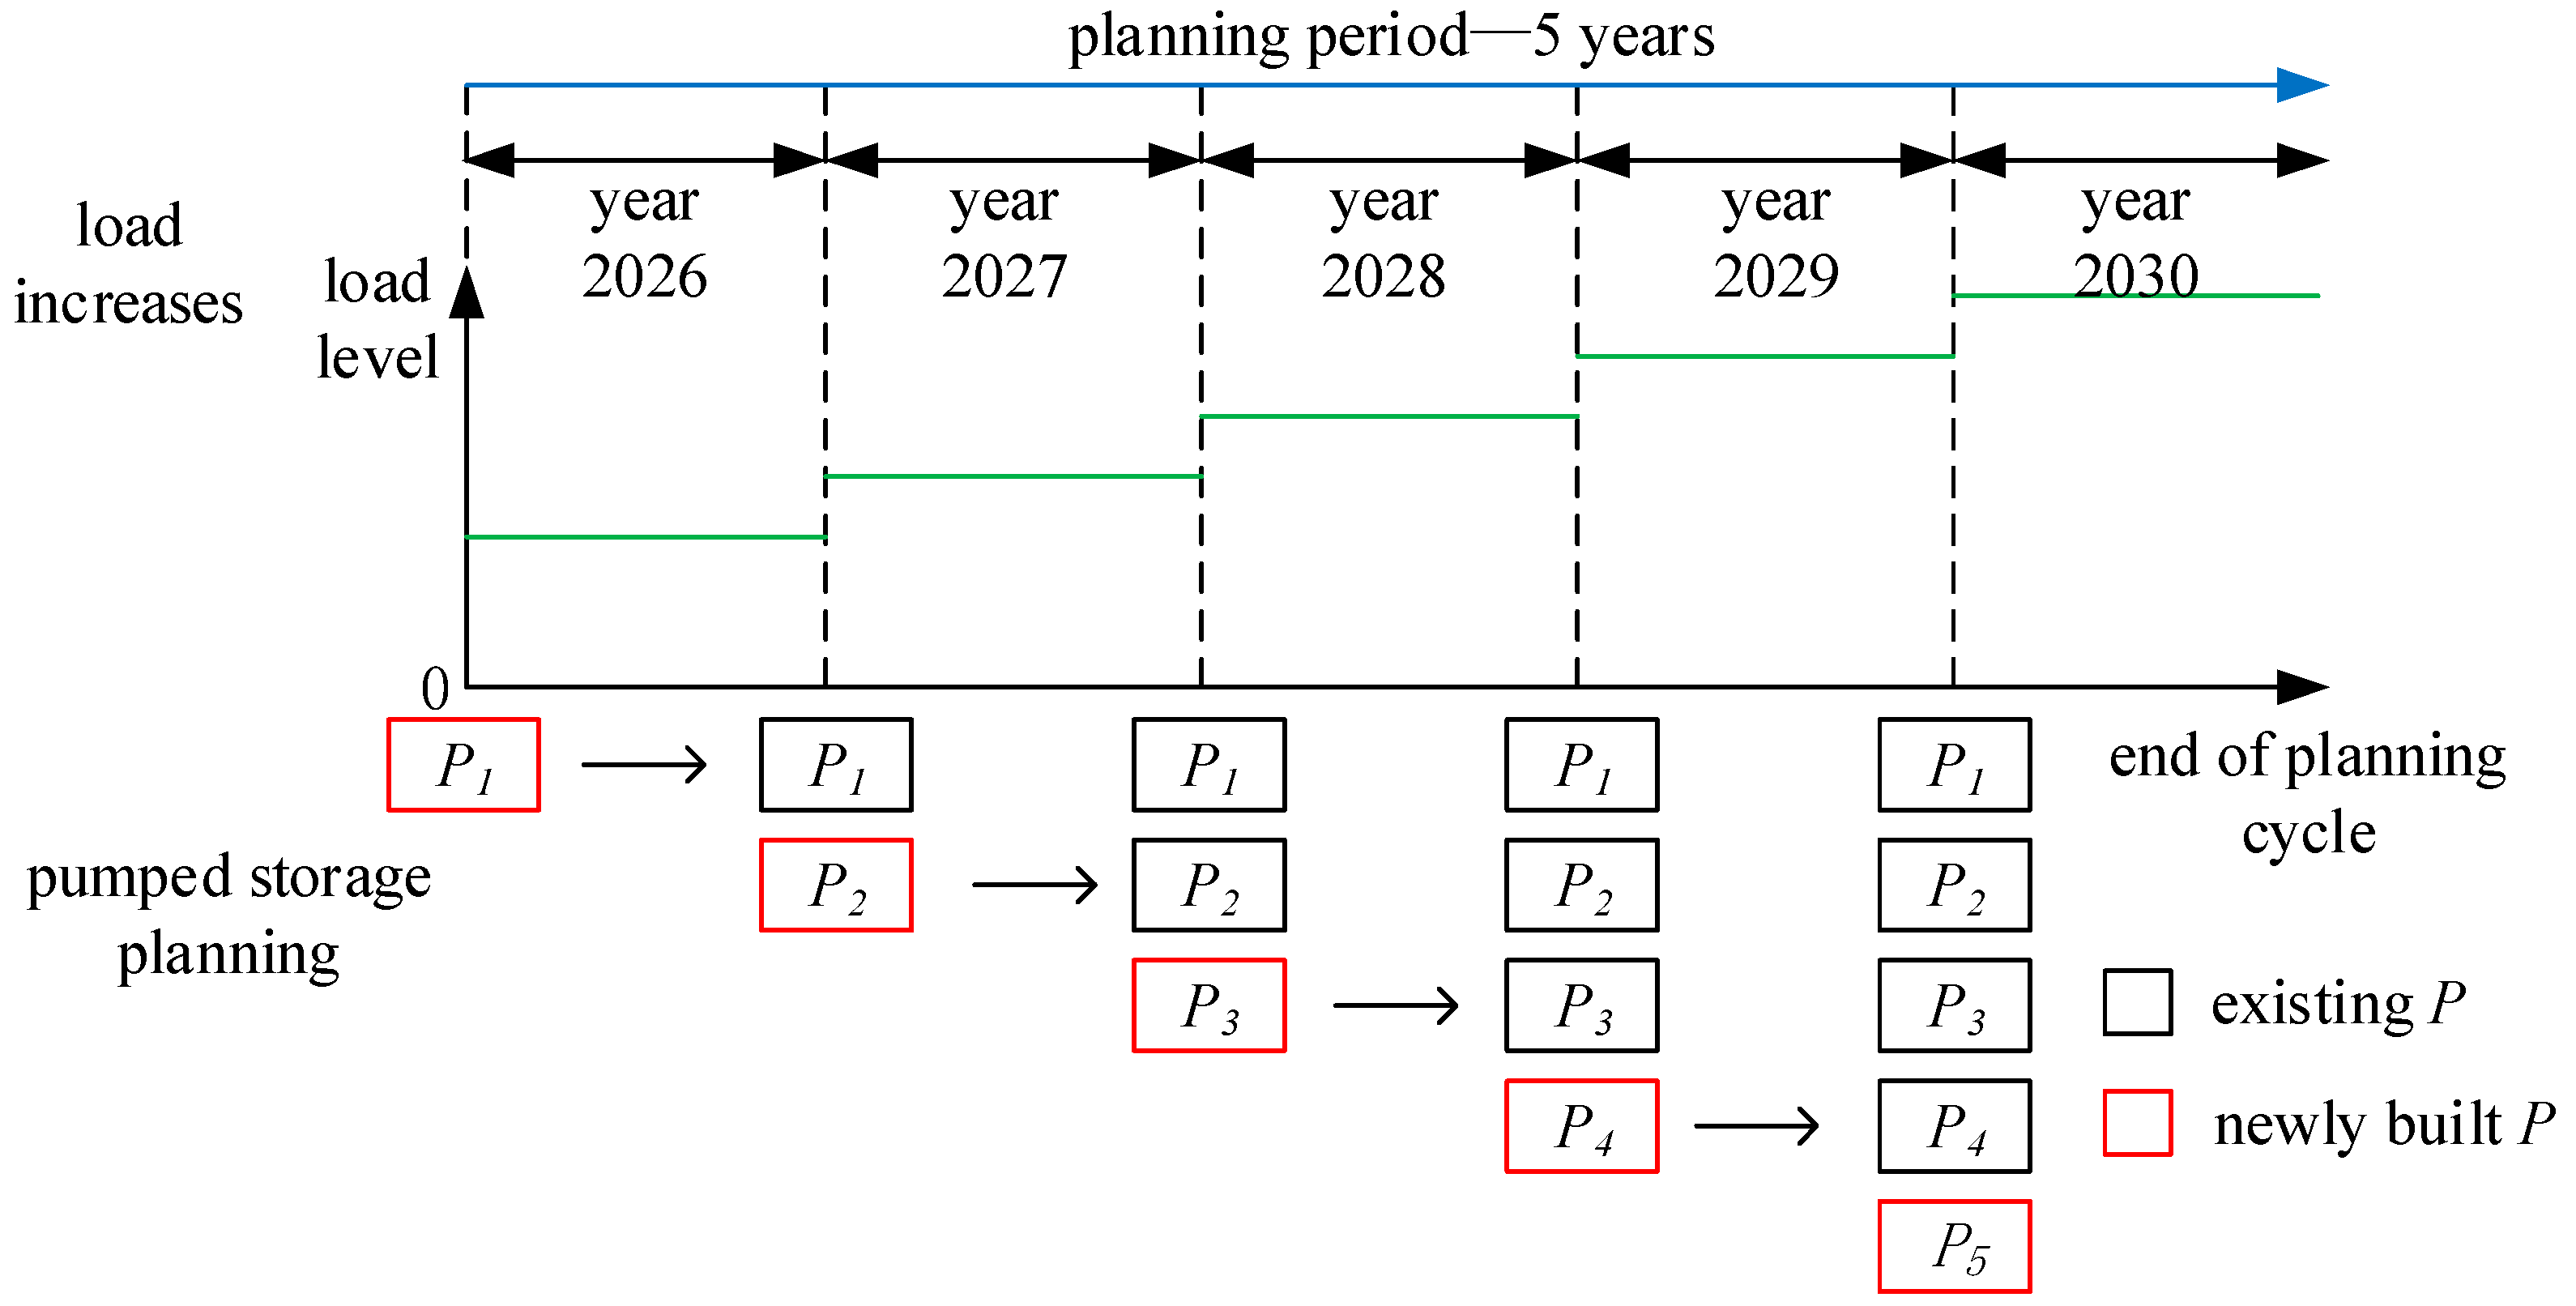
In this paper, the pumped storage capacity configuration and the load growth are carried out simultaneously, and the schematic diagram of the pumped storage capacity configuration, considering the construction timing, is shown in Figure 1.
This paper studies the annual configuration of pumped storage power stations in a provincial power grid from 2026 to 2030. The load level is the predicted peak load of the current year, as described in the green load curve in Figure 1.
The capacity configuration idea of pumped storage power station considering the construction timing is as follows:
The set P, a capacity timeline vector, represents the set of new capacity added year by year from 2026 to 2030:
P   =   [ P 1 , P 2 , , P i , , P 5 ] ,
where P i represents the incremental set of pumped storage capacity configured in the ith year of planning; while k = 1 i P i denotes the cumulative operational capacity.
As shown in the lower part of Figure 1, firstly, the configuration P 1 is planned to meet the load demand of the first year; in addition, the allocation P 2 is planned on the basis of P 1 to meet the demand of the second year under the load growth; and so on, the configuration P i is planned on the basis of the configured capacity set P 1 P 2 P i 1 to meet the load demand in year i, and the configuration P 5 is planned in year 5, i.e., in 2030.
Figure 1 reveals the core concept of the dynamic expansion mechanism proposed in this paper, which employs a ‘stepwise’ capacity accumulation strategy to ensure that the newly added capacity each year precisely matches the growth in load. Initially, a high cost-performance ratio capacity is prioritized to alleviate the bottleneck in renewable energy absorption; subsequently, a moderate slowdown is implemented to prevent overinvestment.

3. Two-Layer Optimal Configuration Model

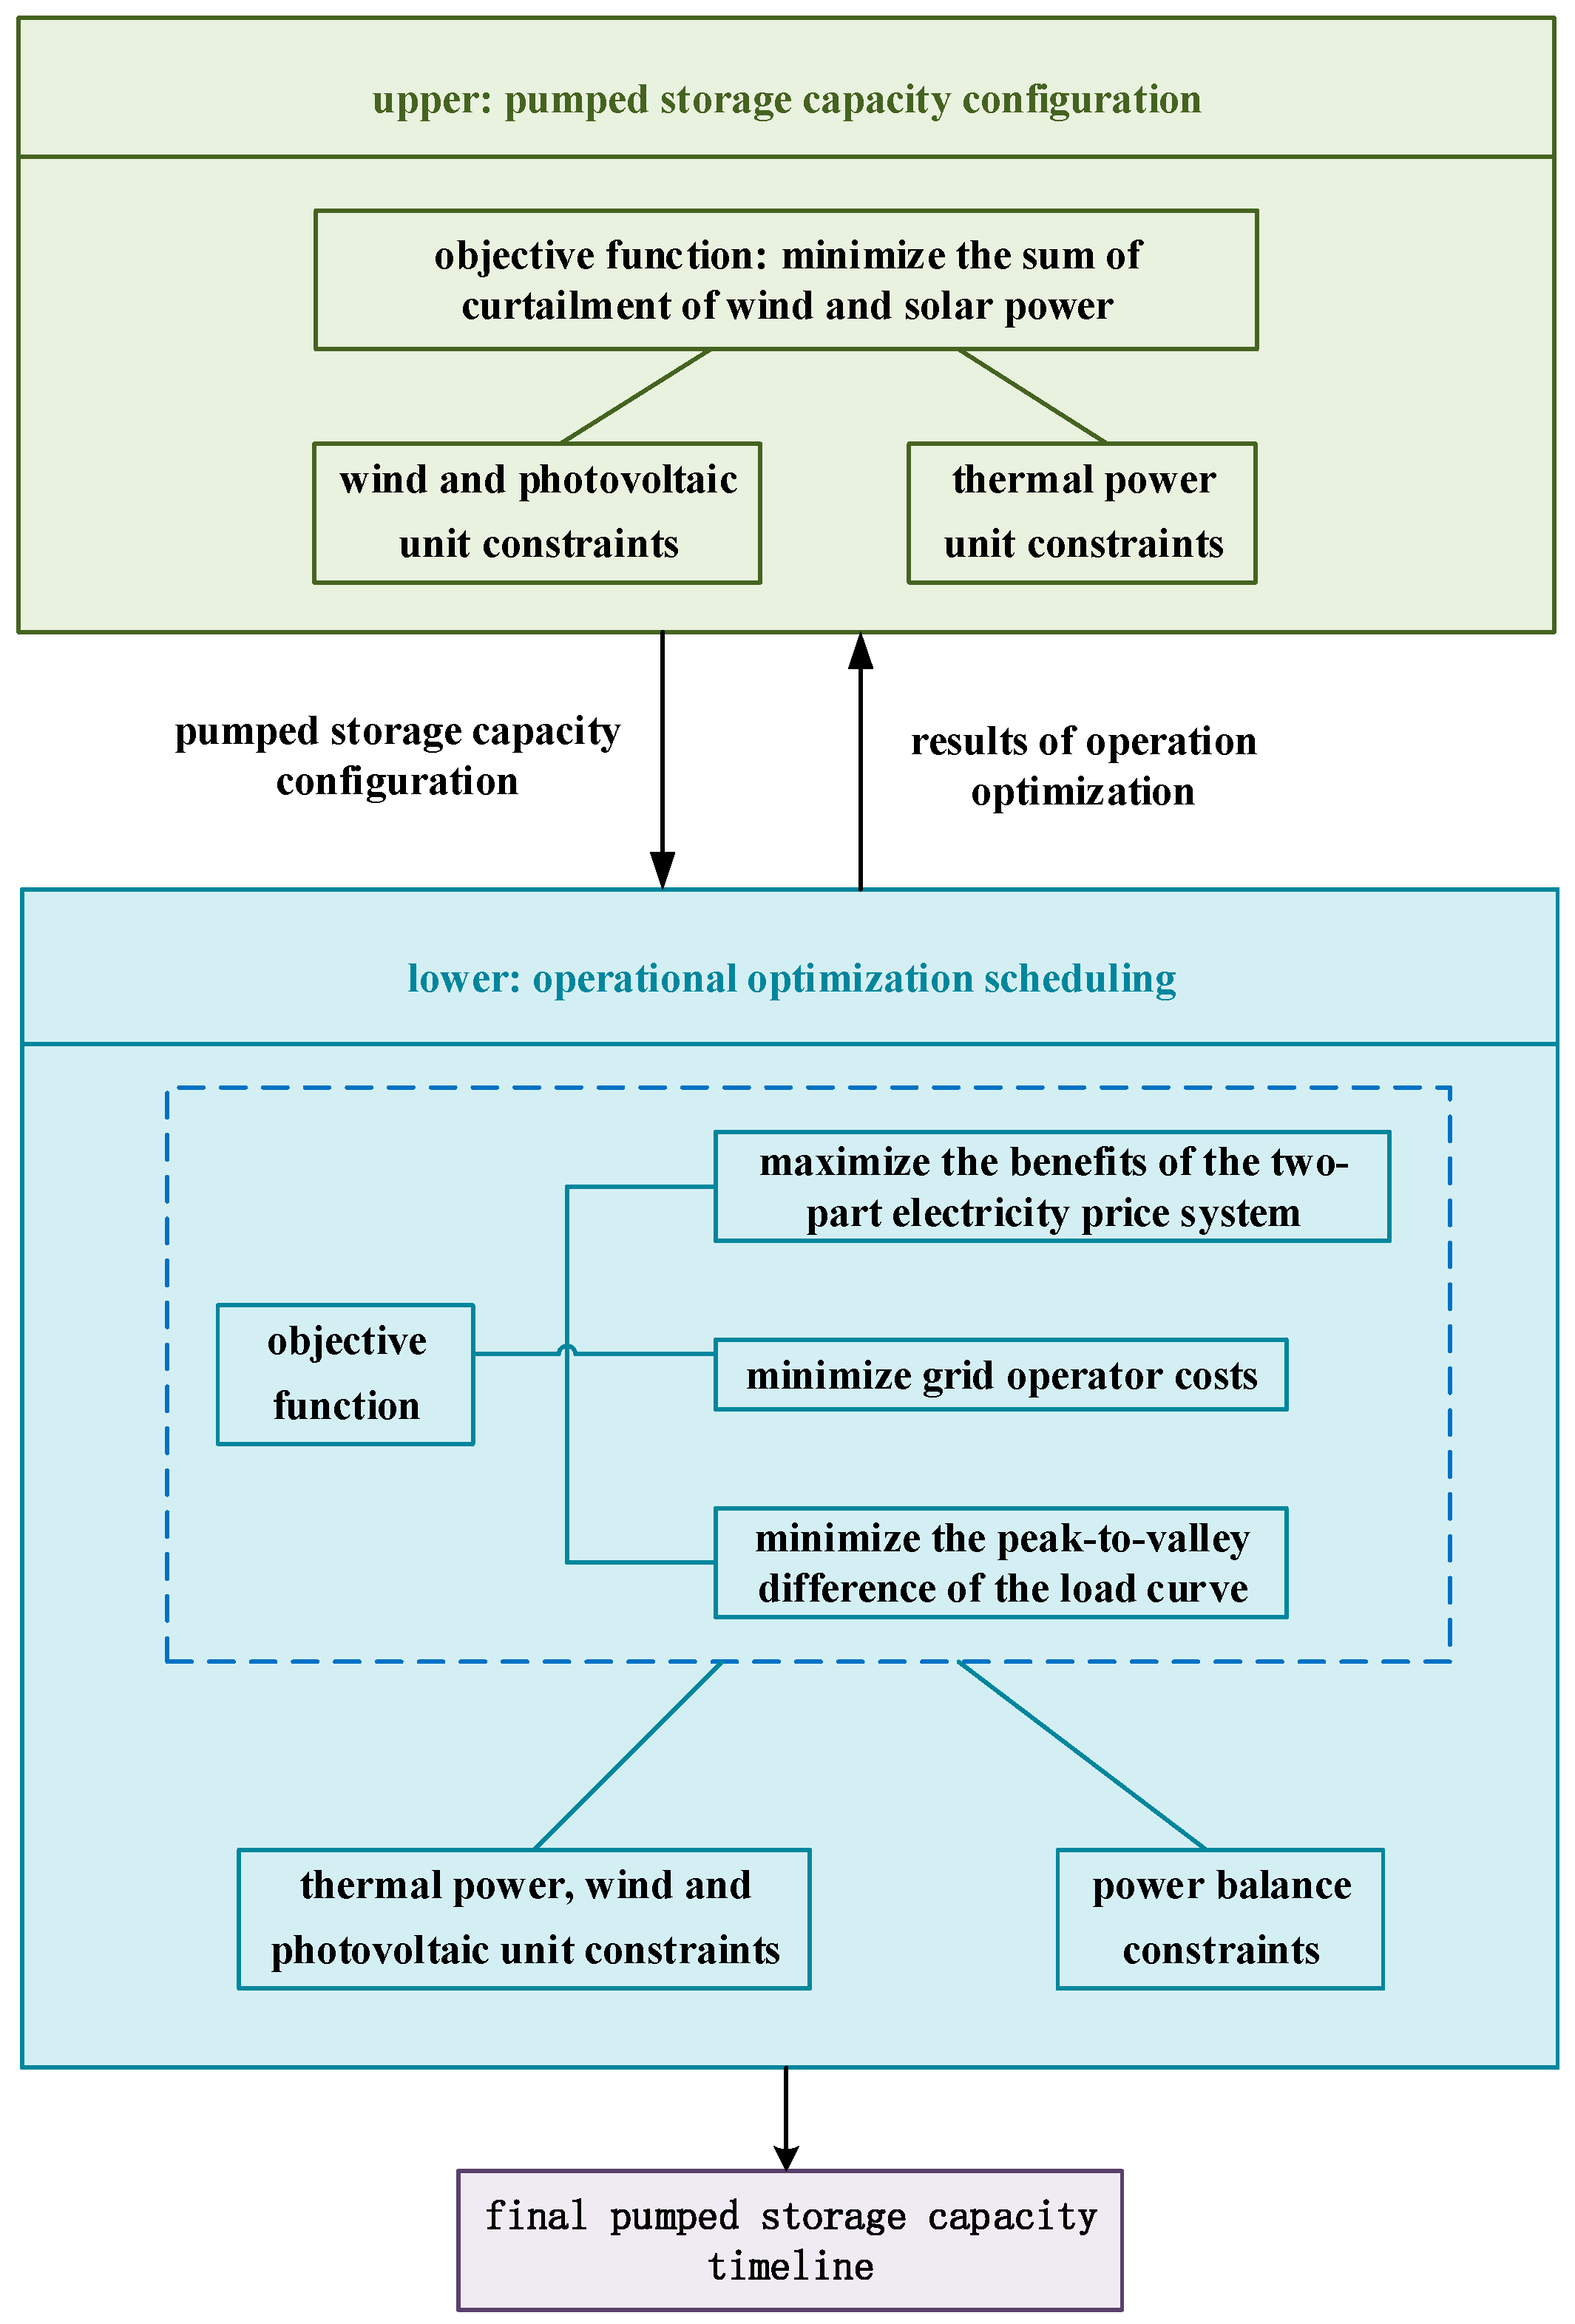
The basic idea of the dual-layer and layer-by-layer refinement optimization configuration algorithm is shown in Figure 2. The upper layer provides a plan for pumped storage capacity based on capacity balancing, while the lower layer optimizes and schedules the system’s operation, feeding back the actual amount of curtailed electricity to the upper layer for verification and correction. The upper layer verifies the feedback values according to preset criteria; if the actual curtailed electricity exceeds the upper layer’s forecast, it determines that there is insufficient capacity and increases the capacity configuration. Conversely, if the actual curtailed electricity is significantly lower than the upper layer’s forecast, it determines that there is surplus capacity and decreases the capacity configuration. This process continues until the curtailed electricity forecast calculated by the upper layer based on its capacity plan is essentially consistent with the actual curtailed electricity achieved in the lower layer’s operations, or until the changes in capacity corrected by the upper layer between two successive iterations are minimal, thus yielding the final pumped storage capacity timeline.
The outer layer outputs the energy storage capacity and power to the inner layer for solving, and the inner layer calculates the corresponding charge and discharge power according to the given parameters, calculates the adaptation value and returns to the outer layer. Since it is difficult for the model to obtain an absolute optimal solution, this paper considers that the optimal solution can be reached by setting a certain number of cycles of the double-layer model.

3.1. Upper-Layer Model

3.1.1. Objective Function

The objective function of the upper layer optimization model is the minimum sum of curtailment of wind and solar power in the system, so as to determine the pumped storage power station capacity required by the system. The objective function is expressed as follows:
m i n P g r e e n , t c u r   =   t   =   1 T P c w , t t +   t   =   1 T P c p v , t t ,
t = 1 T P c w , t t = t = 1 T P w i n d , t f t t = 1 T P w i n d , t t ,
t = 1 T P c p v , t t = t = 1 T P p v , t f t t = 1 T P p v , t t ,
where P g r e e n , t c u r represents the sum of curtailment power of wind and photovoltaic in the system; P c w , t and P c p v , t are the curtailment of wind and photovoltaic power; P w i n d , t f and P p v , t f are the available power of wind and photovoltaic; and P w i n d , t and P p v , t are the actual output power of wind and photovoltaic.
To maximize the regulation effect of pumped storage, pumped storage uses full power to pump water during low load periods. Therefore, the pumping power of pumped storage during low load periods is equal to its rated power, specifically expressed as follows:
P L , t   +   P t p s P   =   P G , t + P w i n d , t + P p v , t + P h e , t ,   t T l o w ,
where P L , t represents the load; P t p s P represents the pumping power of the pumped storage unit; and T l o w represents the low load period.

3.1.2. Constraint Condition

  • Constraints on the wind and photovoltaic power generation units:
    0   P w i n d , t P w i n d , t f ,
    0 P p v , t P p v , t f .
  • Constraints on thermal power units;
  • Output constraints:
P G , m i n u G , t P G , t P G , m a x u G , t ,
where P G , m a x and P G , m i n represent the upper and lower limits of the output power of the thermal power unit; u G , t is a Boolean variable that indicates whether the units of the thermal power plant are in working condition; P G , t represents the output power of the thermal power unit.
  • State constraints:
u s w i t c h , t = u G , t u G , t 1 ,
where u s w i t c h , t is a Boolean variable that indicates whether there is a change in the start-stop state of the thermal power unit; and u G , 0 represents the initial start-stop state of the thermal power unit.
  • Ramp constraints:
P G , t P G , t 1 r u p t + P G , m a x ( 1 u G , t 1 ) P G , t 1 P G , t r d o w n t + P G , m a x ( 1 u G , t ) ,
where r u p and r d o w n represent the ramp-up rate and ramp-down rate of the thermal power unit.

3.2. Lower-Layer Model

3.2.1. Objective Function

  • Minimize grid operator cost:
m i n c o s t d = c o s t G + c o s t g r e e n ,
where c o s t d represents the cost of the grid operator; c o s t G represents the operating cost of the thermal power plant; and c o s t g r e e n represents the curtailment cost of wind and solar power.
Specifically, the cost of each component includes
  • Thermal power plant cost.
In the grid optimization problem, the grid operator pays the thermal power plant the cost of power generation, including the cost of thermal power generation and the cost of starting and stopping.
c o s t G = c o s t G , P + c o s t G , s w i t c h ,
c o s t G , P = t = 1 T [ a P G , t 2 + b P G , t + c ] t · u G , t ,
c o s t G , s w i t c h = t = 1 T c s w i t c h · u s w i t c h , t ,
where c o s t G , P represents the cost of thermal power generation; c o s t G , s w i t c h represents the start-stop cost, and a, b, and c are the cost parameters, which are the cost of a single start-stop.
  • Wind and solar curtailment cost.
The cost of curtailment is directly proportional to the amount of curtailment in the grid.
c o s t g r e e n = s = 1 N s p s · P g r e e n , s , t c u r · c g r e e n s ,
where p s represents the probability of occurrence in scenario s; P g r e e n , s , t c u r represents the amount of curtailment of wind and solar power in scenario s; and c g r e e n s represents the curtailment penalty in scenario s.
2.
Maximize pumped storage two-part tariff revenue as follows:
m a x s h o u y i c = s h o u y i l + s h o u y i r ,
s h o u y i l = p s w t = 1 T u t p s G · P t p s G t p c s t = 1 T u t p s P · P t p s P t ,
s h o u y i r = p r o n g · P p s ,
where s h o u y i c represents the income of the two-part electricity price of pumped storage; s h o u y i l represents the income of the electricity price of pumped storage; s h o u y i r represents the income of pumped storage capacity tariff; p s w , p c s , and p r o n g indicate the pumped storage feed-in tariff, respectively, pumped hydro power price and capacity electricity price, of which the feed-in tariff is the benchmark electricity price for coal, and the pumped hydropower price is 75% of the benchmark electricity price; P t p s G represents the generation power of the pumped storage unit; and P p s is the total installed capacity of pumped storage power station.
3.
Minimize load curve peak-valley difference:
m i n f p l = p l m a x p l m i n ,
where f p l represents the peak-to-valley difference in the grid load curve is described; p l m a x represents the highest load of the power grid in a day; and p l m i n represents the lowest load of the power grid in a day.

3.2.2. Power Balance Constraints

P L , t = P G , t + P w i n d , t + P p v , t + P h e , t + P t p s G P t p s P ,
where P h e , t represents the nuclear power output.

3.2.3. Pumped Storage Unit Constraints

  • State constraints.
The same pumped storage unit can only operate in a single mode, that is, it cannot work in the pumped state and the power generation state at the same time:
u t p s G + u t p s P     1 ,
where u t p s G is a Boolean variable that indicates whether the pumped storage unit is in the power generation condition, and the Boolean variable u t p s P indicates whether the pumped storage unit is in the pumping condition.
2.
Storage capacity constraints.
V m i n u     V t u     V m a x u ,
V m i n d     V t d     V m a x d ,
V t u = V t 1 u Q t p s G + Q t p s P ,
V t d = V t 1 d + Q t p s G Q t p s P ,
where V m a x u and V m i n u represent the maximum and minimum values of the reservoir capacity of the upper reservoir of the pumped storage power station; V t u represents the reservoir capacity of the upper reservoir; V m a x d and V m i n d represent the maximum and minimum values of the reservoir capacity of the lower reservoir of the pumped storage power station; V t d represents the reservoir capacity of the lower reservoir; and Q t p s G and Q t p s P represent the water consumption of the pumped storage unit under the power generation and pumping conditions.
In addition, there are constraints regarding conventional units and wind-solar hybrid units, which have been mentioned earlier and will not be elaborated upon here.

3.3. Model Solving

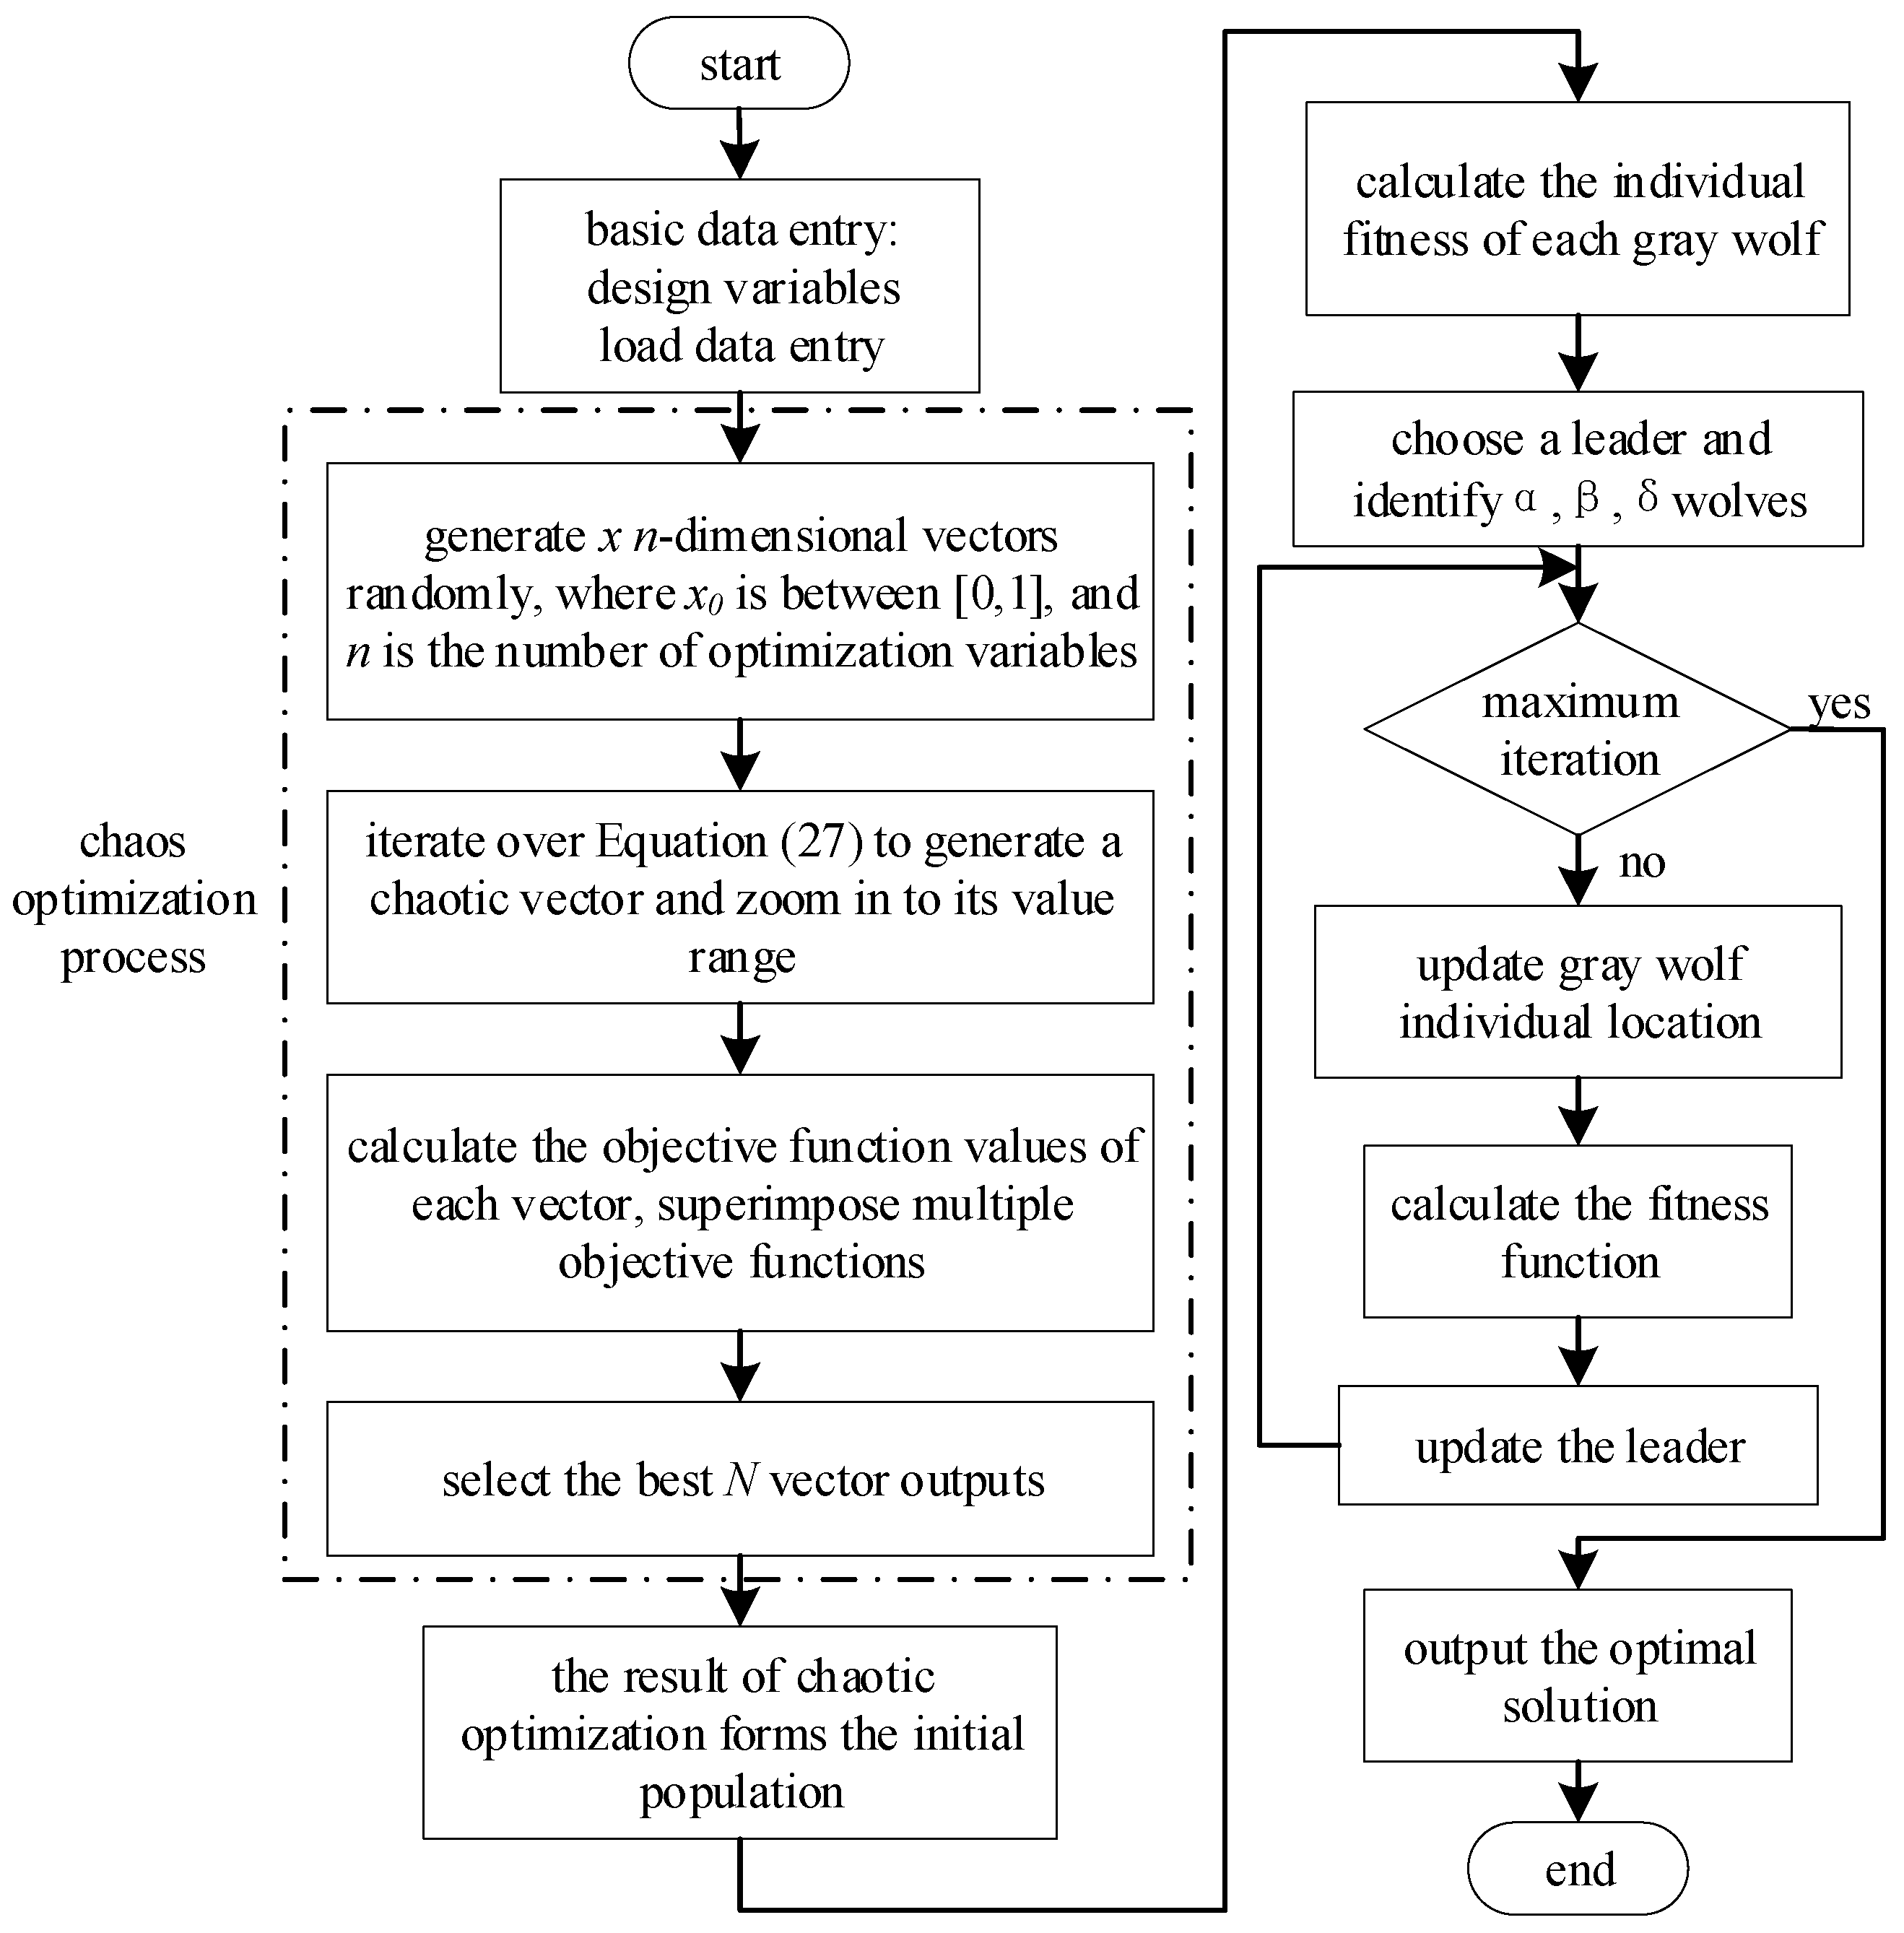
This article constructs a two-layer iterative optimization architecture, where the upper configuration layer addresses single-objective optimization problems with multiple constraints, utilizing the YALMIP toolbox to call the Gurobi solver. The Gurobi solver enables precise convergence control for the upper-layer model via its advanced branch-and-bound algorithm, delivering rapid convergence speed and enhanced robustness in linear problem solving. The lower execution layer resolves complex decision-making issues with multiple objective constraints. In order to effectively solve the hierarchical optimization problem, an improved grey wolf optimization algorithm with Logistic-Tent composite chaos mapping is innovatively proposed. In the field of multi-objective optimization, heuristic methods such as genetic algorithm and particle swarm optimization are commonly used, but these algorithms are easily troubled by local extremum. As an emerging swarm intelligence optimization technology, the Grey Wolf Optimization (GWO) algorithm has attracted much attention because of its concise parameters, no need for gradient information, and excellent global search capabilities [22]. The algorithm innovatively constructs a search mechanism based on social levels: the optimal, sub-optimal and third optimal solutions are mapped into three leadership levels: α, β and δ, respectively, and the rest of the search individuals are used as followers. By simulating the cooperative hunting strategy of wolves, GWO realizes an intelligent search mode guided by the leadership level and coordinated by followers, which significantly improves the global optimization performance.
The standard GWO algorithm has obvious random distribution characteristics in the initial population generation stage, and the solution space coverage is insufficient, which may lead to the reduction in search efficiency. Chaos mapping can generate a more uniformly distributed and regular initial population in the search space, so as to enhance the global search ability of the algorithm, avoid falling into local optimum, and improve the convergence speed and optimization accuracy. By combining chaotic optimization, the optimization performance of the GWO algorithm is significantly improved [18]. The more common chaotic maps include logistic mapping and tent mapping, which are relatively simple in mathematical form [23], have high stability in numerical calculation, and are not prone to computational errors, but are sensitive to parameters and prone to window effects. The tent map is evenly distributed and has strong ergodability, but it may be periodically degraded. Therefore, in this paper, the two are used together, and the improved Logistic-Tent composite chaos map is as follows:
x m + 1   =   4 x m 1     x m     2 1 x m ,
where x m is the position of the gray wolf after the mth iteration; ⨁ represents the XOR operations, improving the randomness and anti-truncation ability of sequences, and enhancing ergodability.
Map the initial decision variable x j m [ x j m i n , x j m a x ] to a chaotic variable x j l m between 0~1:
x j l m   =   x j m x j m i n x j m a x x j m i n , j   =   1 , 2 , , n ,
where x j m a x and x j m i n are the upper and lower limits of the search for the jth dimensional variable.
According to Equation (27), the next iteration chaotic variable x j l m + 1 is calculated, and it is transformed into a new decision variable x j m + 1 according to Equation (28):
x j m + 1 = x j m i n + x j l m + 1 ( x j m a x x j m i n ) .
The fitness value of the new solution is calculated based on the decision variable x j m + 1 .
Figure 3 shows the flow of the GWO algorithm based on Logistic mapping chaos optimization.

4. Case Analysis

In order to verify the rationality of the above model, this paper selects the data of an actual power grid for case analysis.

4.1. Case Data

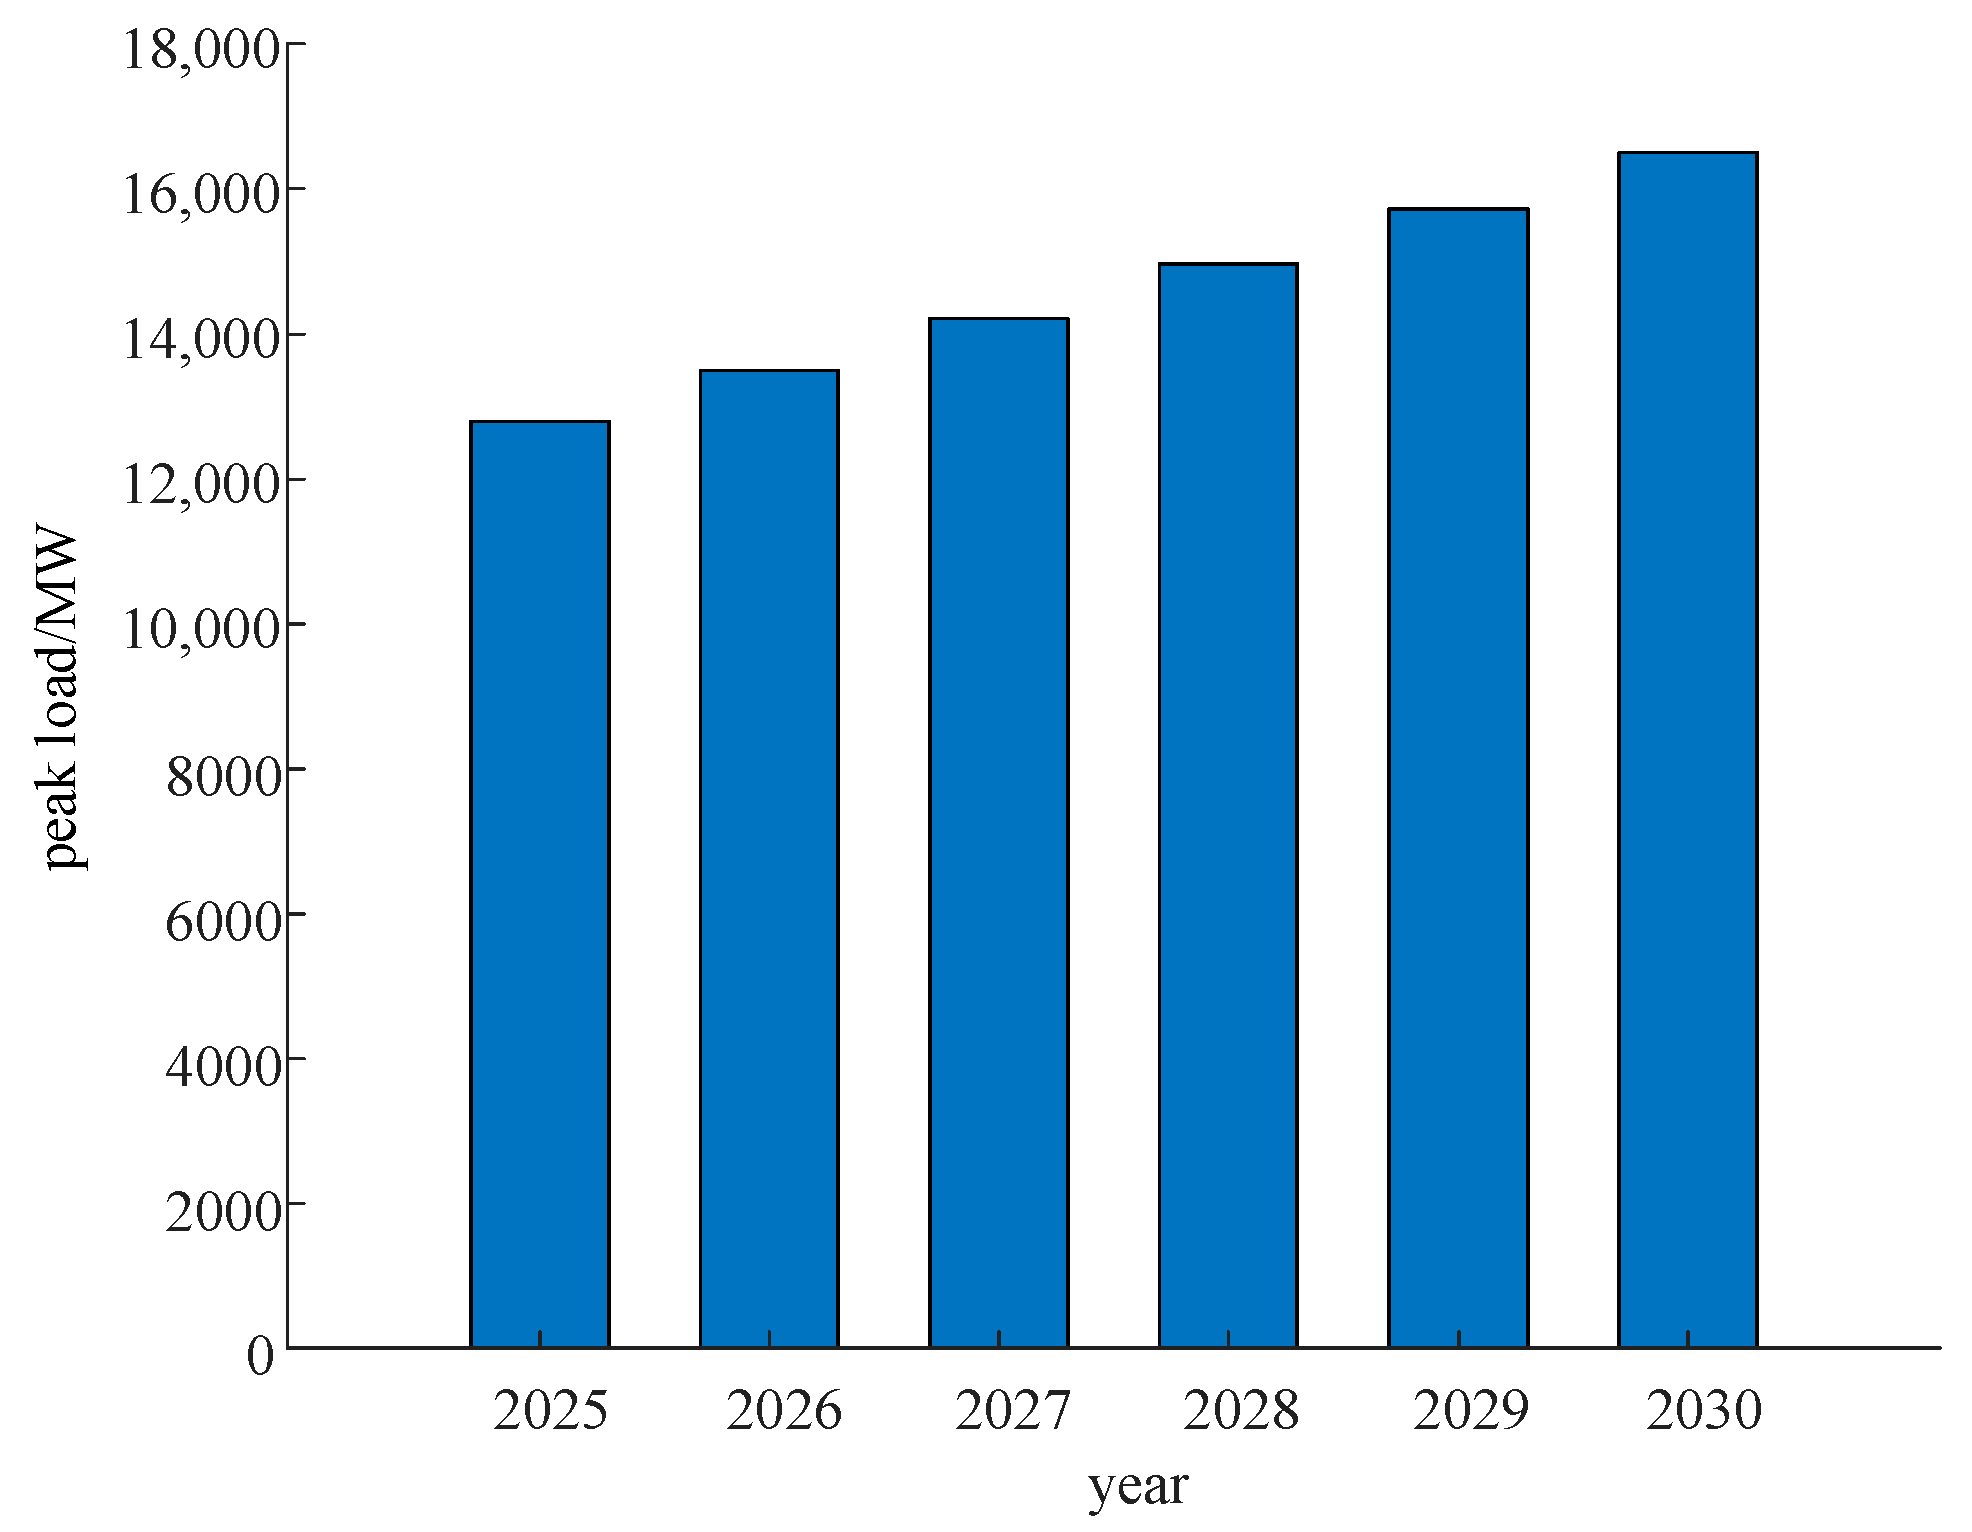
The optimization of capacity distribution for pumped storage will be conducted based on the load curve of the power grid, accompanied by case analyses. Additionally, the impact of load growth on capacity distribution results must be considered. The peak load data of the power grid during the planning period is illustrated in Figure 4, while the installed capacity of various power sources in the same period is shown in Table 1. It is evident that both load and new energy installed capacity show a significant upward trend, whereas the installed capacity of thermal power remains stable after 2027, and nuclear power experiences steady growth. This highlights the increasing demand for flexible adjustment resources in pumped storage within the system.
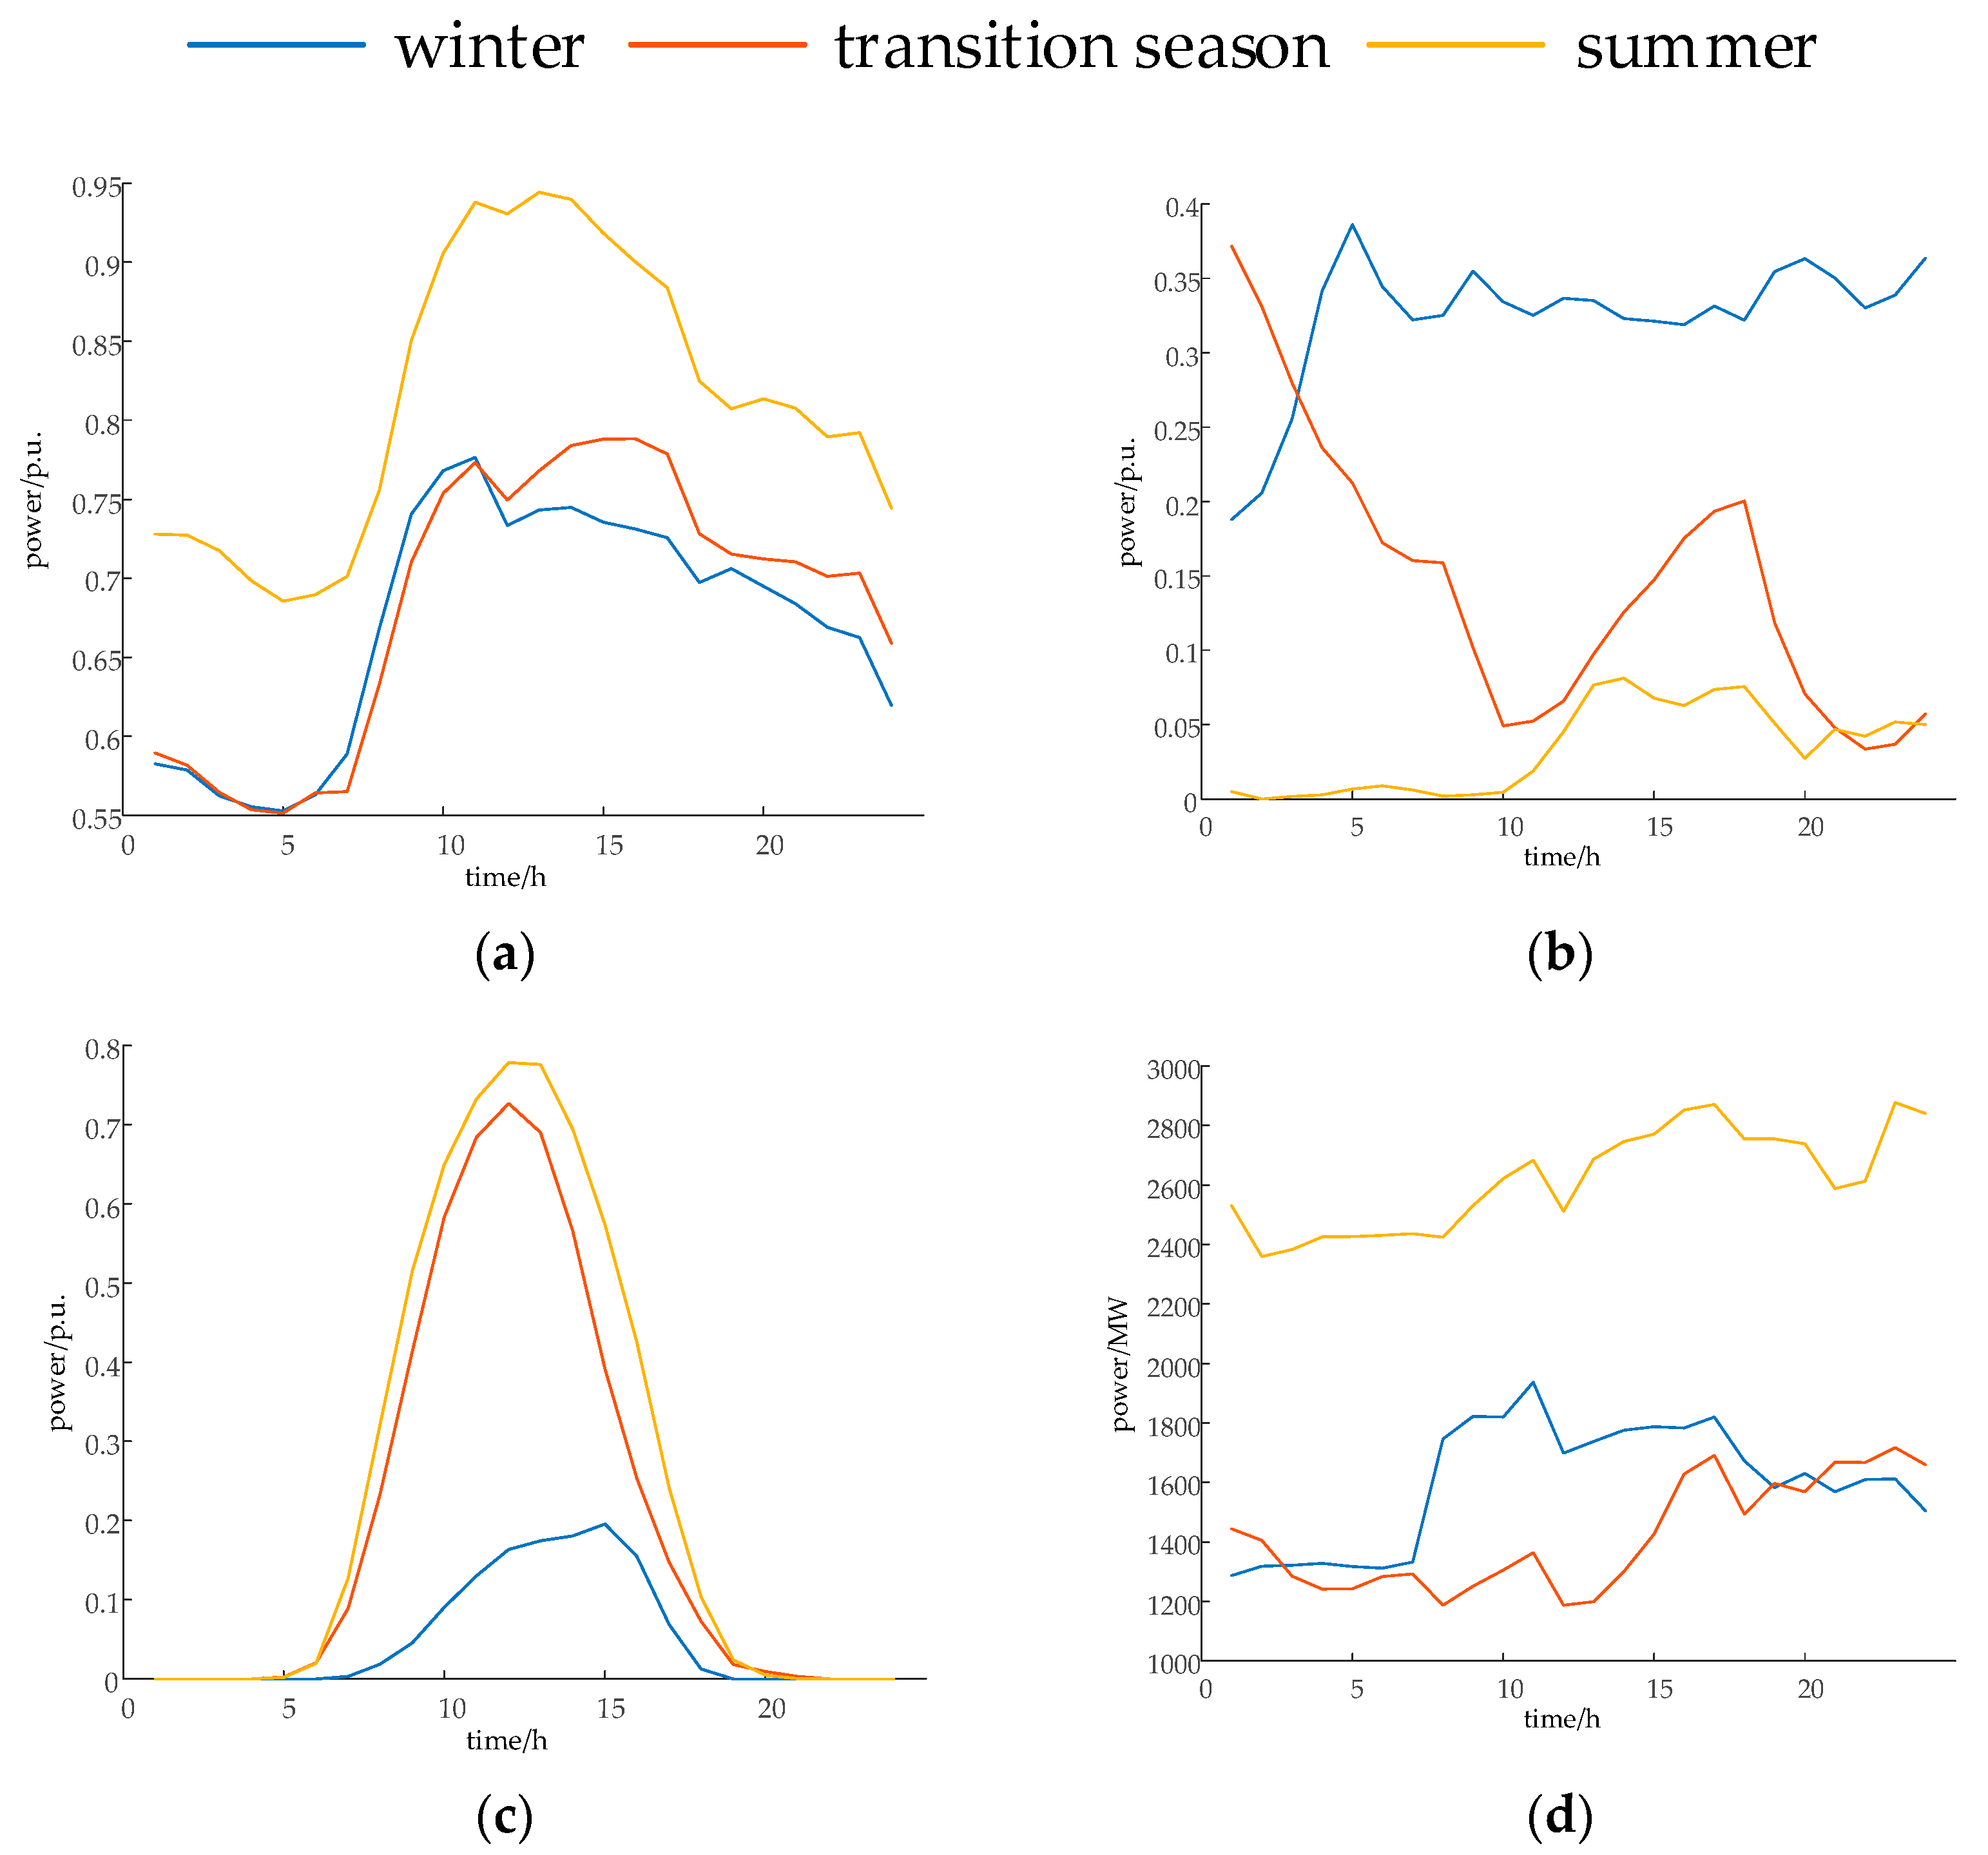
Select typical daily scenarios for winter, transitional seasons, and summer for optimization scheduling analysis. The optimization cycle for a typical day is T = 24 h, with typical daily load, wind power, and photovoltaic output normalized values, as well as external electricity illustrated in Appendix A.1.
As shown in the figure, there are significant differences in load and renewable energy output in different seasons, specifically as follows:
  • The electricity load shows seasonal changes, and the peak load in summer is significantly higher than that in winter and transitional season;
  • Wind energy resources and photovoltaic resources are complementary, with the greatest potential for wind power generation in winter and the greatest potential for photovoltaic power generation in summer;
  • There is a time mismatch between wind power output and load demand, and wind energy resources are more abundant during load trough hours, showing obvious reverse peak regulation characteristics;
  • The PV power generation curve is basically consistent with the daily load change trend, showing a synergistic peak regulation effect.

Analysis of the Trend in the Utilization Rate of Renewable Energy

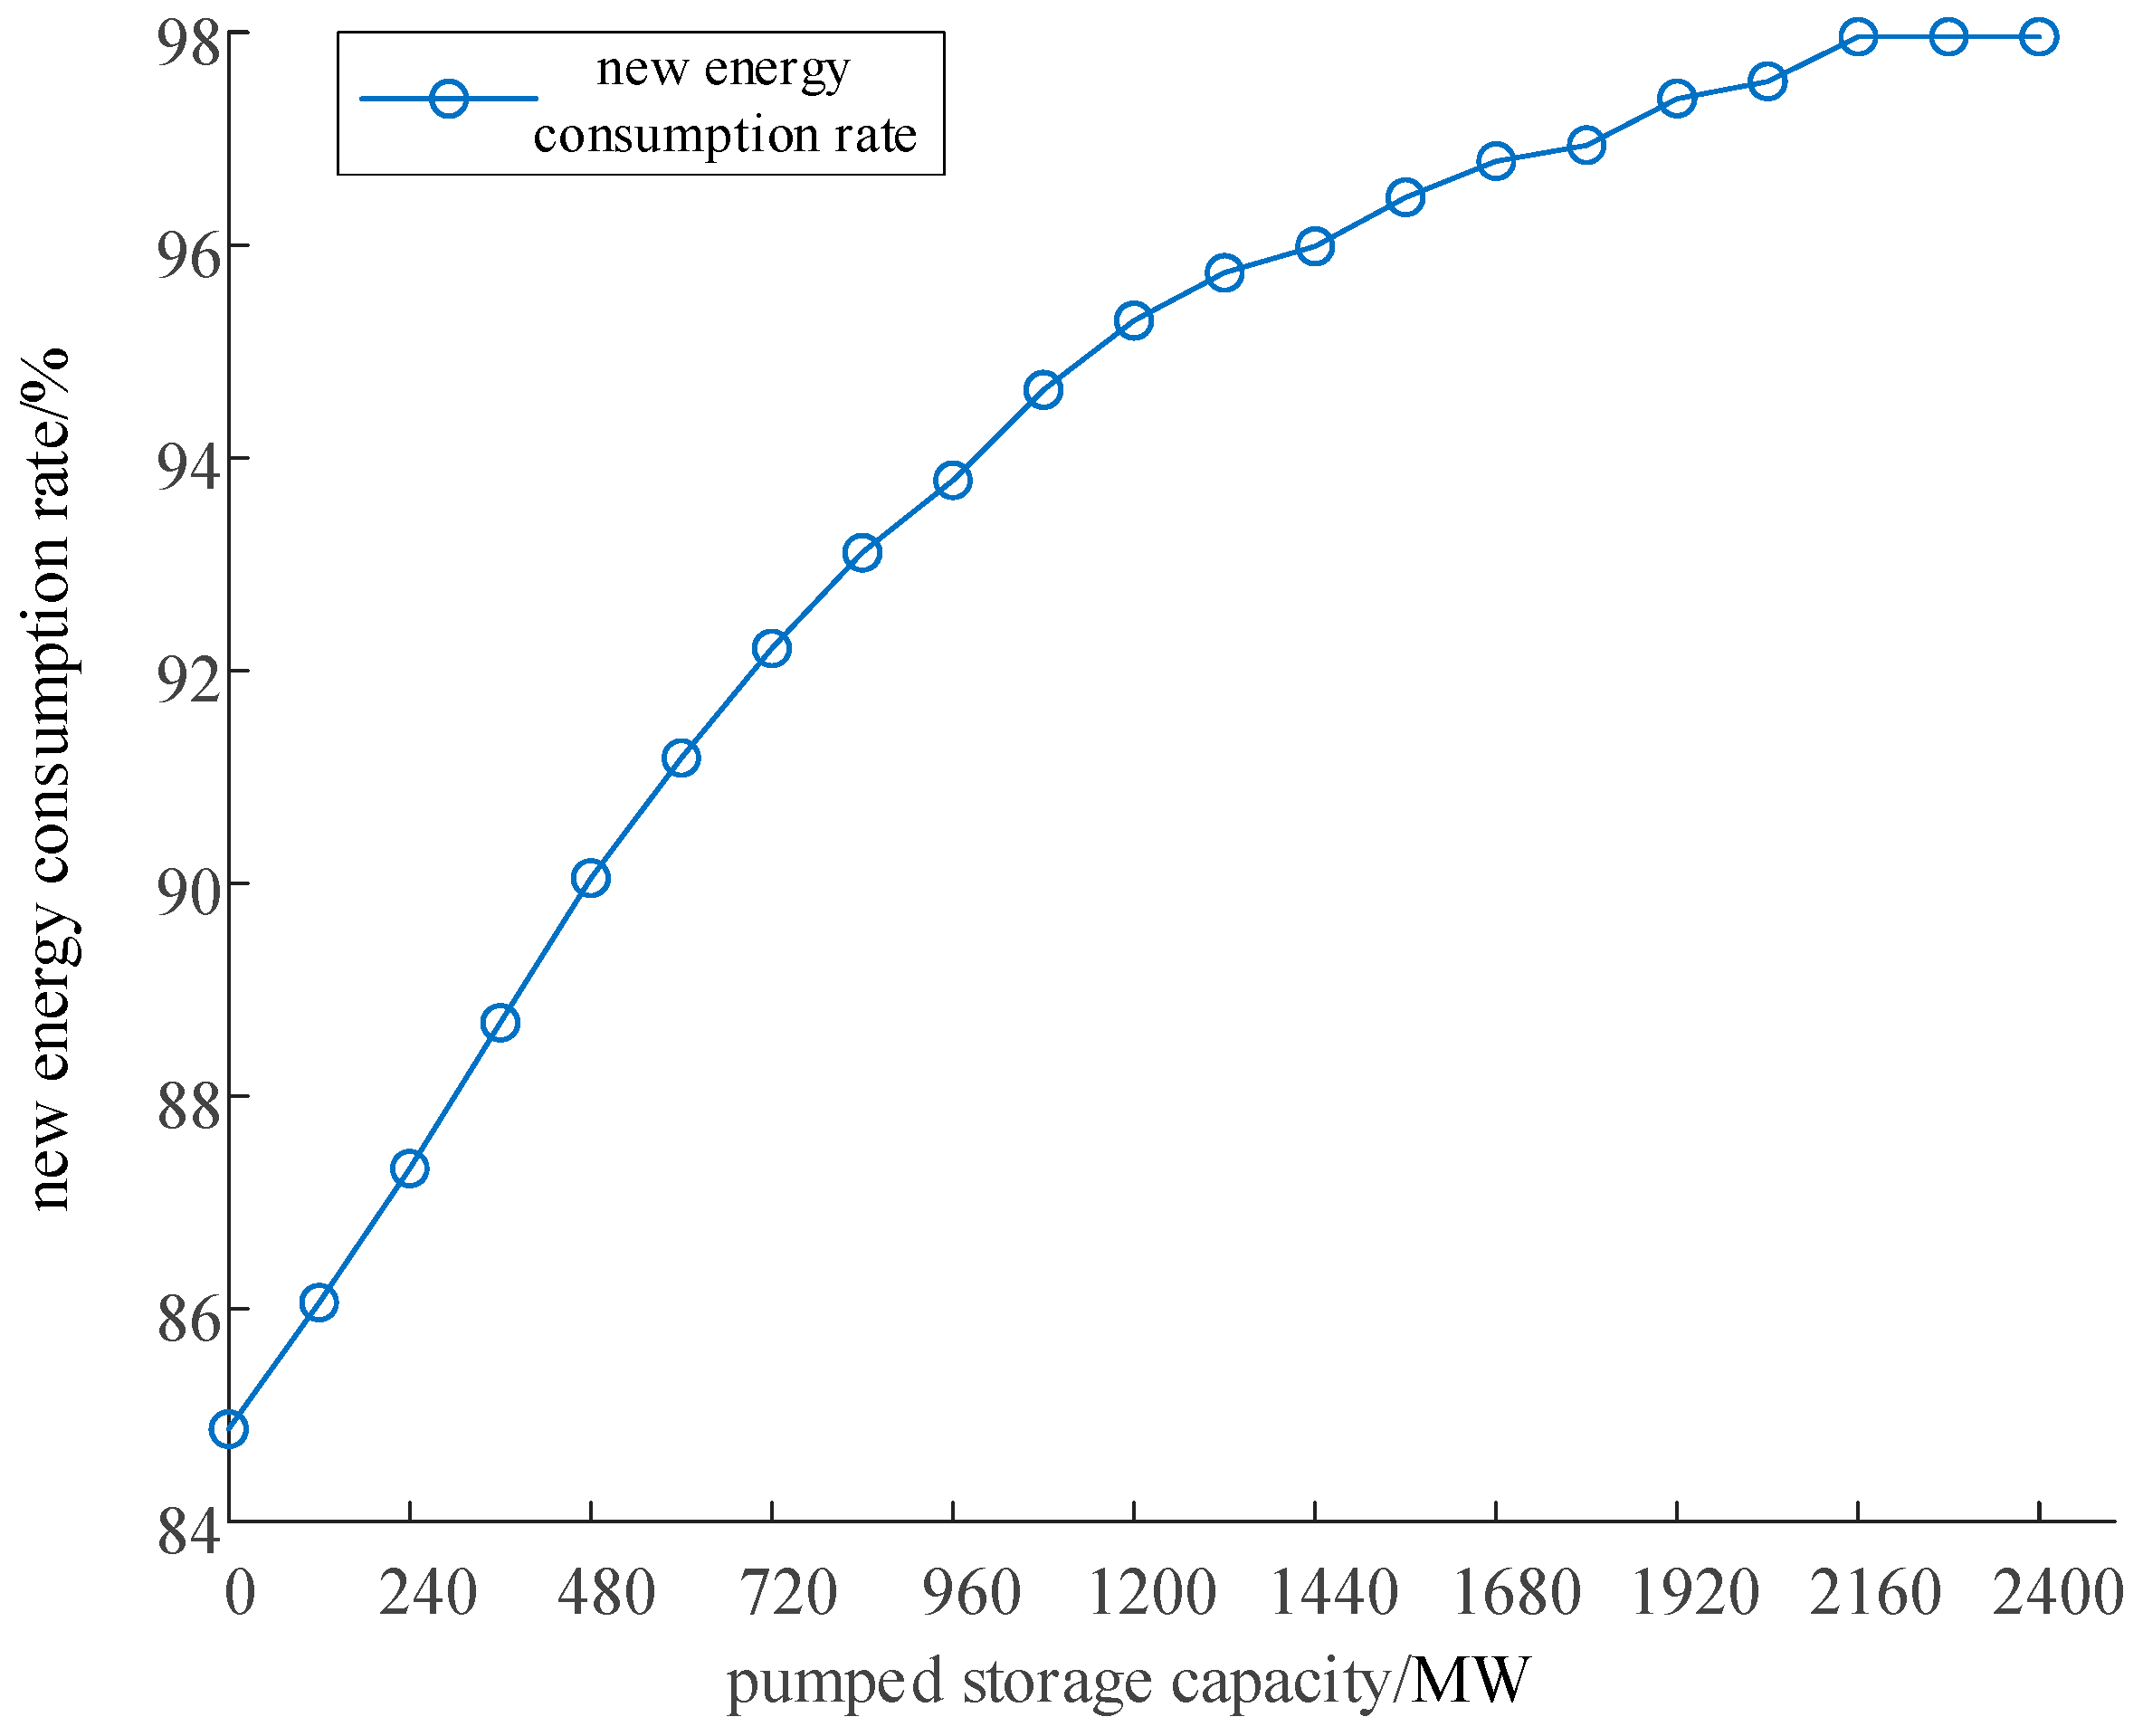
The renewable energy absorption rate of the system was calculated based on the simulation data presented above, as shown in Figure 5. Figure 5 demonstrates a consistent improvement in renewable energy absorption rates from 84.87% to 98.02% with increasing pumped storage capacity. The overall growth trend starts rapidly but gradually slows down and levels off, reaching a peak when the pumped storage capacity reaches 2160 MW. This saturation effect provides a crucial basis for the time-sequencing configuration strategy proposed in this paper. During the early stages of renewable energy and load growth, timely allocation of an appropriate amount of pumped storage capacity is vital; if capacity is blindly increased in the later stages, its absorption effect on renewable energy will saturate, potentially leading to wasted investments. Therefore, scientifically planning and constructing in a sequenced manner to achieve dynamic matching of capacity growth with the system demand curve is essential for enhancing investment efficiency and system performance.

4.2. Pumped Storage Power Station Capacity Configuration Results

By applying the dual-level temporal allocation model presented in this article, the final annual capacity allocation results for the pumped storage station are shown in Table 2. To highlight the value of the model, the table also lists the temporal capacity results obtained using the traditional single-layer model, which does not consider the detailed scheduling of the lower level.
As shown in Table 2, the refined plan can reduce the investment in pumped storage capacity by 10% compared to the unfined version, which is conductive to the sustainable utilization of resources. This difference arises because the lower-level model, during the detailed scheduling process, more accurately assesses the actual operational benefits and system demands of pumped storage, identifying and eliminating certain inefficient or redundant capacity configurations, thereby optimizing investment costs while ensuring system performance.
Table 3 shows the results of comparing the renewable energy consumption rate of the conventional pumped storage power station capacity according to the target year without considering the time series and the pumping and storage capacity timing configuration model in this paper.
As shown in Table 3, if we do not consider the timing of the capacity allocation for pumped storage stations according to the target year, during the early planning phase when the target year capacity has not yet been fully constructed, the allocation of pumped storage capacity lags behind actual demand, resulting in a significantly lower renewable energy absorption rate compared to the time-sequenced allocation plan, which leads to a large amount of wind and solar power curtailment. However, during the later planning phase, when the target year capacity is fully operational, the absorption rate reaches as high as 98.02%, but at this point, the capacity is nearing saturation, which may face issues of underutilization. The staggered annual allocation considering construction timing employed in this paper can effectively avoid these problems. Its core advantage lies in the annual matching of system demands, allocating necessary capacities early on to significantly enhance early renewable energy utilization rates, while in the later stages, appropriately increasing capacity according to actual growth demands. This approach not only ensures the achievement of the final absorption targets but also effectively prevents premature saturation of capacity and potential resource idling issues. This thoroughly demonstrates the superiority of time-sequenced allocation in balancing resource efficiency across the entire cycle and the goals of renewable energy absorption.

4.3. Analysis and Discussion of Scheduling Optimization Results

4.3.1. Analysis of Operation Scheduling Optimization Results of Typical Day

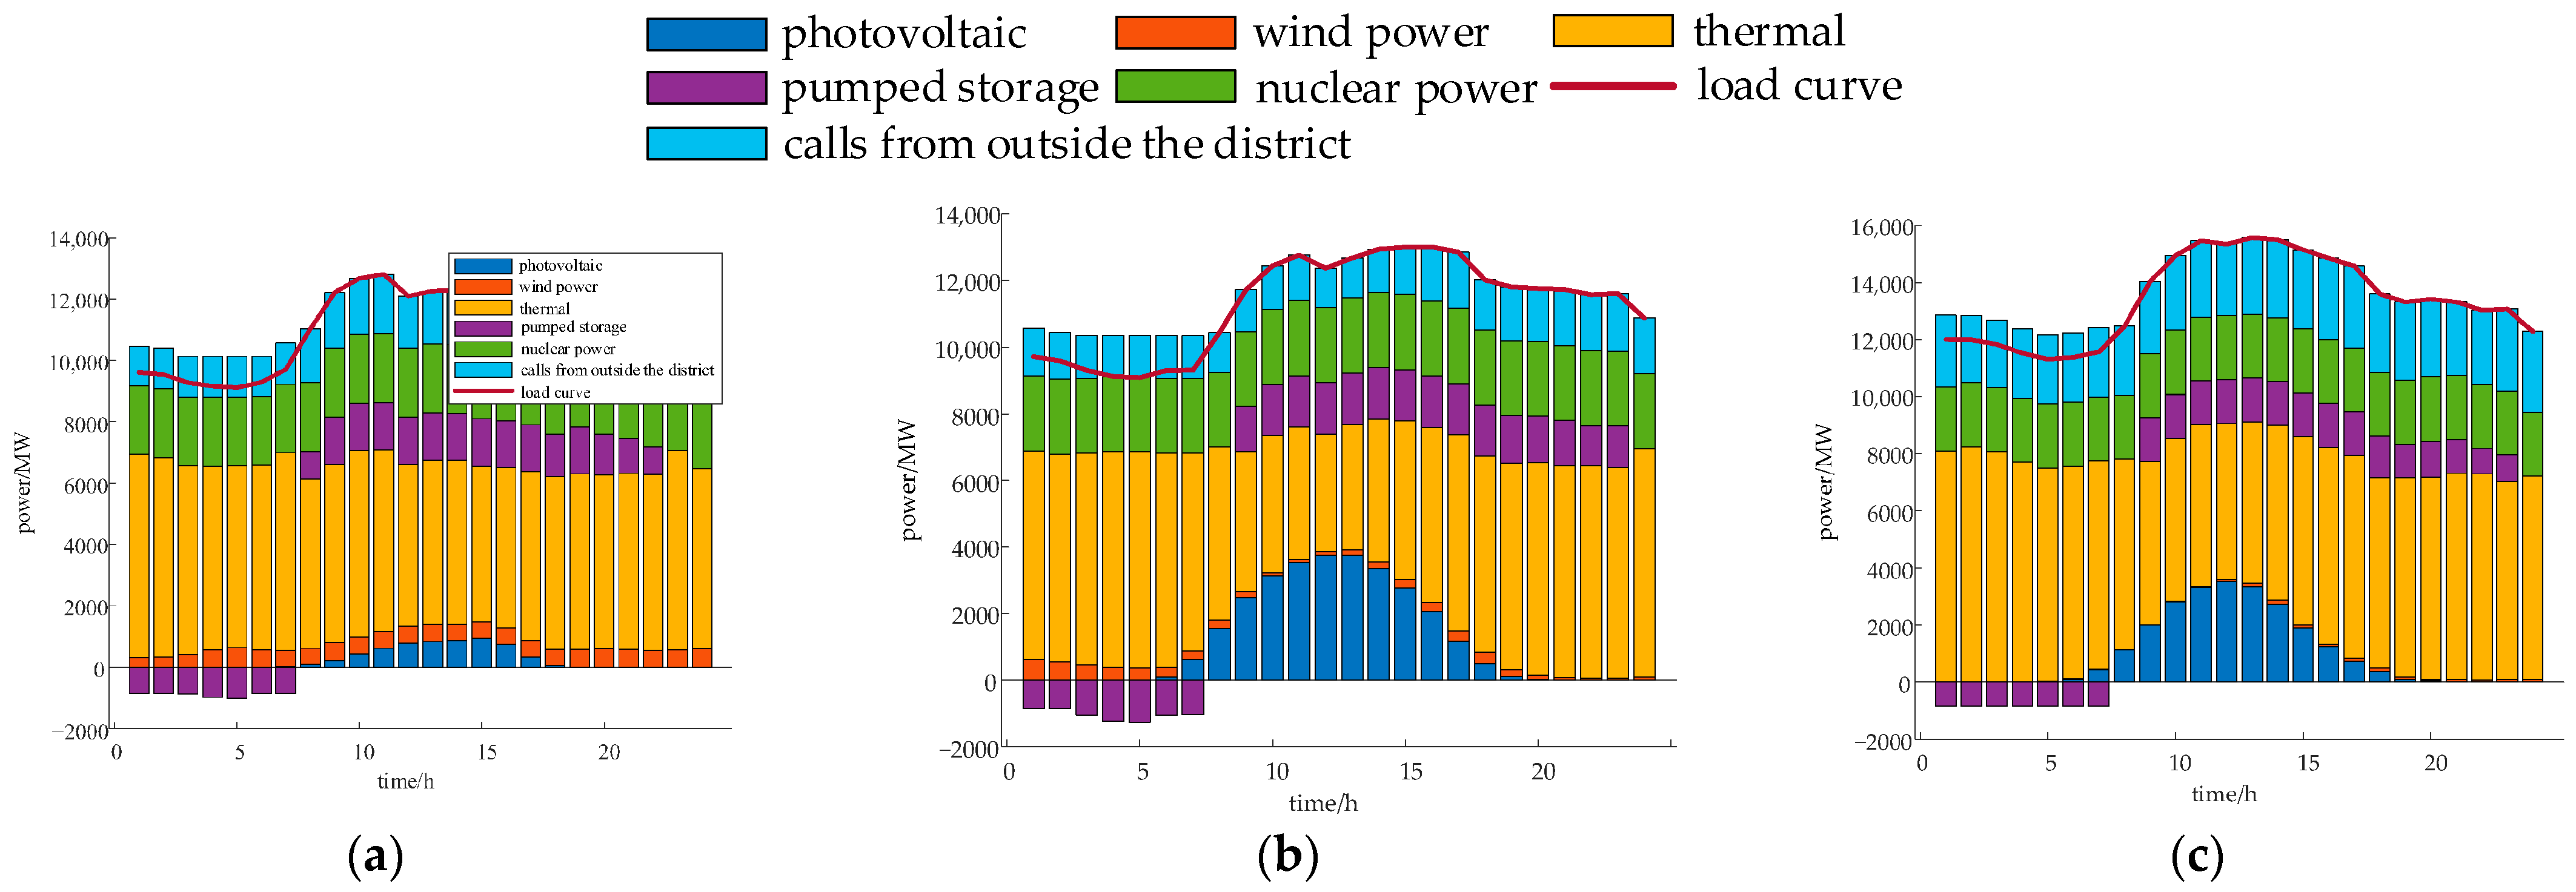
Taking the final pumped storage capacity of 1539 MW configured by 2030 as an example, Figure 6, Figure 7 and Figure 8, respectively, present the detailed operational scheduling optimization results for typical days in winter, transitional seasons, and summer.
As can be seen from Figure 6, during the winter nighttime when the load is low and wind power output is high, pumped storage mainly operates in the pumping mode. During the daytime peak load period, pumped storage transitions to the fully charged state, effectively supporting the peak demand of the power grid. The nighttime wind power output is high, which partially overlaps with the pumping period, helping to absorb wind power. The scheduling mode in the transition season is similar to that in winter, but the combination of wind and solar resources is different. Pump storage still operates in the pumping mode during the low load period and generates electricity during the peak load period. Photovoltaic contributes significantly during the daytime. The load level is highest in summer, and PV output reaches its peak during the midday hours. The operation strategy of pump storage remains unchanged, utilizing the low electricity price during the early morning low load period for pumping; during the continuous high load period caused by high temperatures during the day, especially from 10 am to 12 pm and from 2 pm to 7 pm, pump storage basically maintains a fully charged state, becoming an important force supporting peak demand.
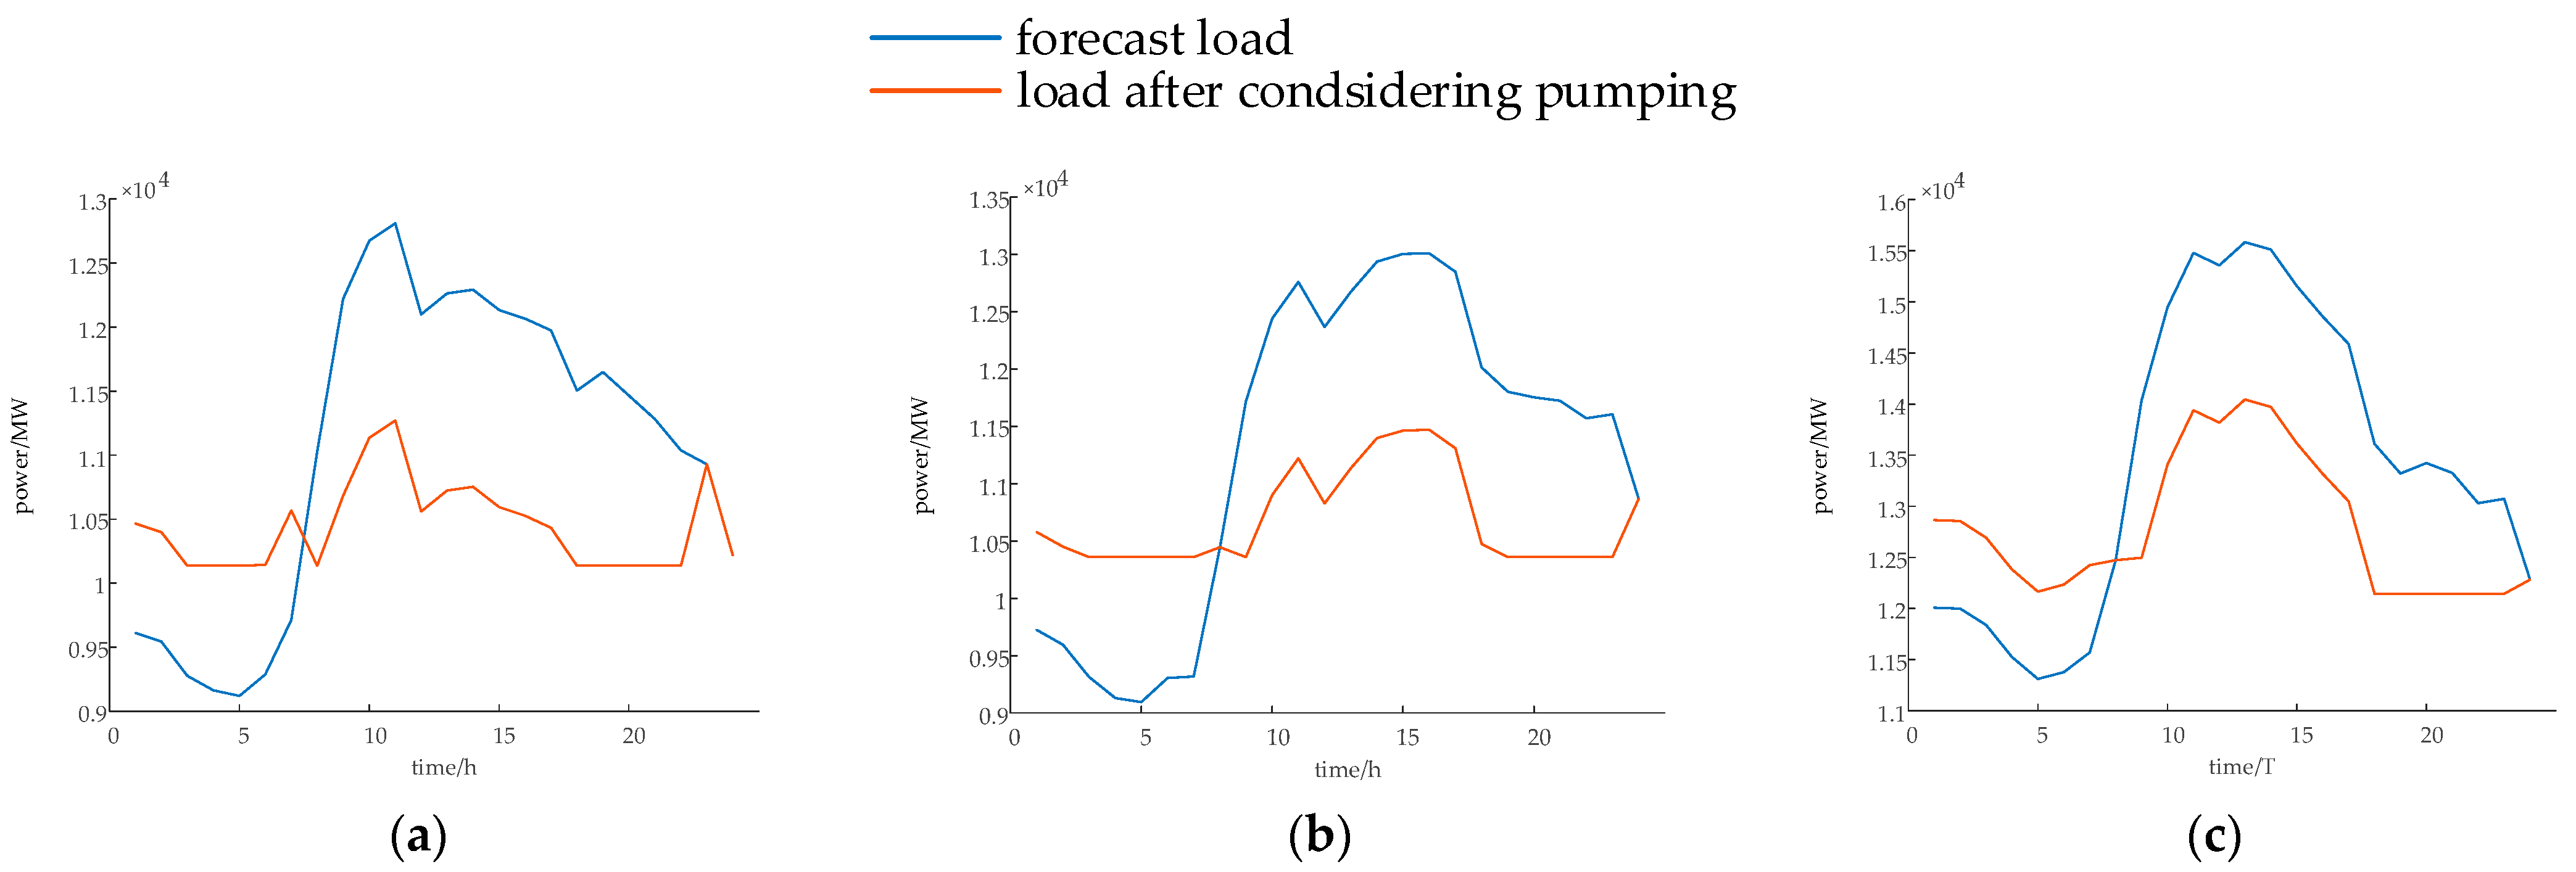
As can be seen from Figure 7, the regulating effect of pumped storage effectively reduces the peak-to-valley difference in the equivalent load of the power grid.
As can be seen from Figure 8, thermal power units operate with high stability in winter, maintaining high-efficiency output throughout the day, avoiding frequent start-ups and shutdowns, and exhibiting a smooth output curve with minimal fluctuations. This is attributed to the effective balancing of load fluctuations and the anti-peaking characteristics of wind power by pumped storage, significantly reducing the system’s demand for flexible adjustment of thermal power, thereby reducing operating costs and improving efficiency. Thermal power operation is also very stable during the transition season, with smooth changes in output and maintenance in the high-efficiency range. Despite high peak loads and long durations in summer, the output curve of thermal power units remains relatively stable, without experiencing severe ramp rates or frequent start-ups and shutdowns. This indicates that pumped storage plays a key role in bearing peak loads and alleviating the pressure on thermal power peaking. The continuous discharge of pumped storage effectively fills the gap between the decline in photovoltaic output and the peak load during the night.
A comprehensive analysis of the three typical daily scenarios shows that after applying the model optimized for scheduling, the system exhibits excellent operational characteristics. The pumped storage strictly follows the electricity price signals, storing energy during low-price periods and discharging during peak times to maximize revenue from its two-part tariff structure. Thanks to the regulatory role of pumped storage, thermal power units have largely avoided starting and stopping operations, continuously running within an efficient economic range, which significantly reduces system fuel costs and startup losses. The model successfully achieves the sub-goal of minimizing the peak-to-valley difference in the load curve; the peak-shaving and valley-filling effect of pumped storage has notably smoothed the system’s equivalent load, enhancing the operational safety and stability of the power grid.

4.3.2. Comparison and Analysis of the Scheduling Results of Single-Layer and Two-Layer Models

In order to verify the value of the optimization of lower-level operations on capacity configuration refinement, a comparison was made between the optimized dispatch results of the final capacity of 1539 MW determined by the two-layer model and the non-refined capacity of 1710 MW from the single-layer model under three typical daily scenarios, with key indicators shown in Table 4.
The comparison results in Table 4 indicate that:
  • The total cost of the system with refined capacity was 1.57 and 1.03 million CNY lower than the unrefined capacity scheme on typical days in winter and during the transition season. This is because the upper model does not consider the economics of actual operation and eliminates redundant capacity through lower scheduling optimization to avoid capacity saturation waste in winter and transition season. The cost on typical summer day increased slightly by 1.48 million CNY, but the difference remains within an acceptable range.
  • The revenue from the two-part tariff for pumped storage in the unrefined scheme was about 2 million higher than that in the refined scheme across all three seasons. This is due to the larger capacity, which naturally results in higher capacity charges; however, this increase in revenue comes at the expense of higher total costs for the operator.
  • In all three seasons, the equivalent load peak-valley difference in the system using the refined capacity scheme decreased by 18.3%, 23.2% and 10.7%, respectively. This indicates that the lower-layer operational optimization, when refining capacity, allocates effective regulation capabilities more precisely, thus avoiding inefficiencies where certain capacities are ineffectively utilized in peak shaving and valley filling.
  • The lower-layer refinement process based on operational optimization not only validates the feasibility of the upper-layer preliminary capacity scheme but also eliminates inefficient and redundant capacity configurations. Ultimately, it achieves a more optimal balance among consumption rate, economic efficiency, and stability in the capacity scheme, which fully reflects the synergistic optimization value of the dual-layer model presented in this paper.

4.3.3. Comparison of Scheduling Results in Extreme Weather Scenarios

Extreme weather affects the output of wind and solar renewable energy by directly impacting primary energy supply or indirectly limiting the operation of power generation equipment [24]. The output of wind and photovoltaic energy can decrease non-synchronously with changes in key meteorological factors such as wind speed, solar radiation intensity, and temperature. There are three scenarios: high wind and low sunlight (e.g., cold waves, thunderstorms with heavy rainfall, sandstorms), low wind and high sunlight (e.g., prolonged high temperatures), and low wind and low sunlight (e.g., typhoons, blizzards, and cold waves). The scenario of one being high and the other low is more common. The three typical extreme weather scenarios simulated in this study, along with their characteristics of wind and solar output, are presented in Table 5.
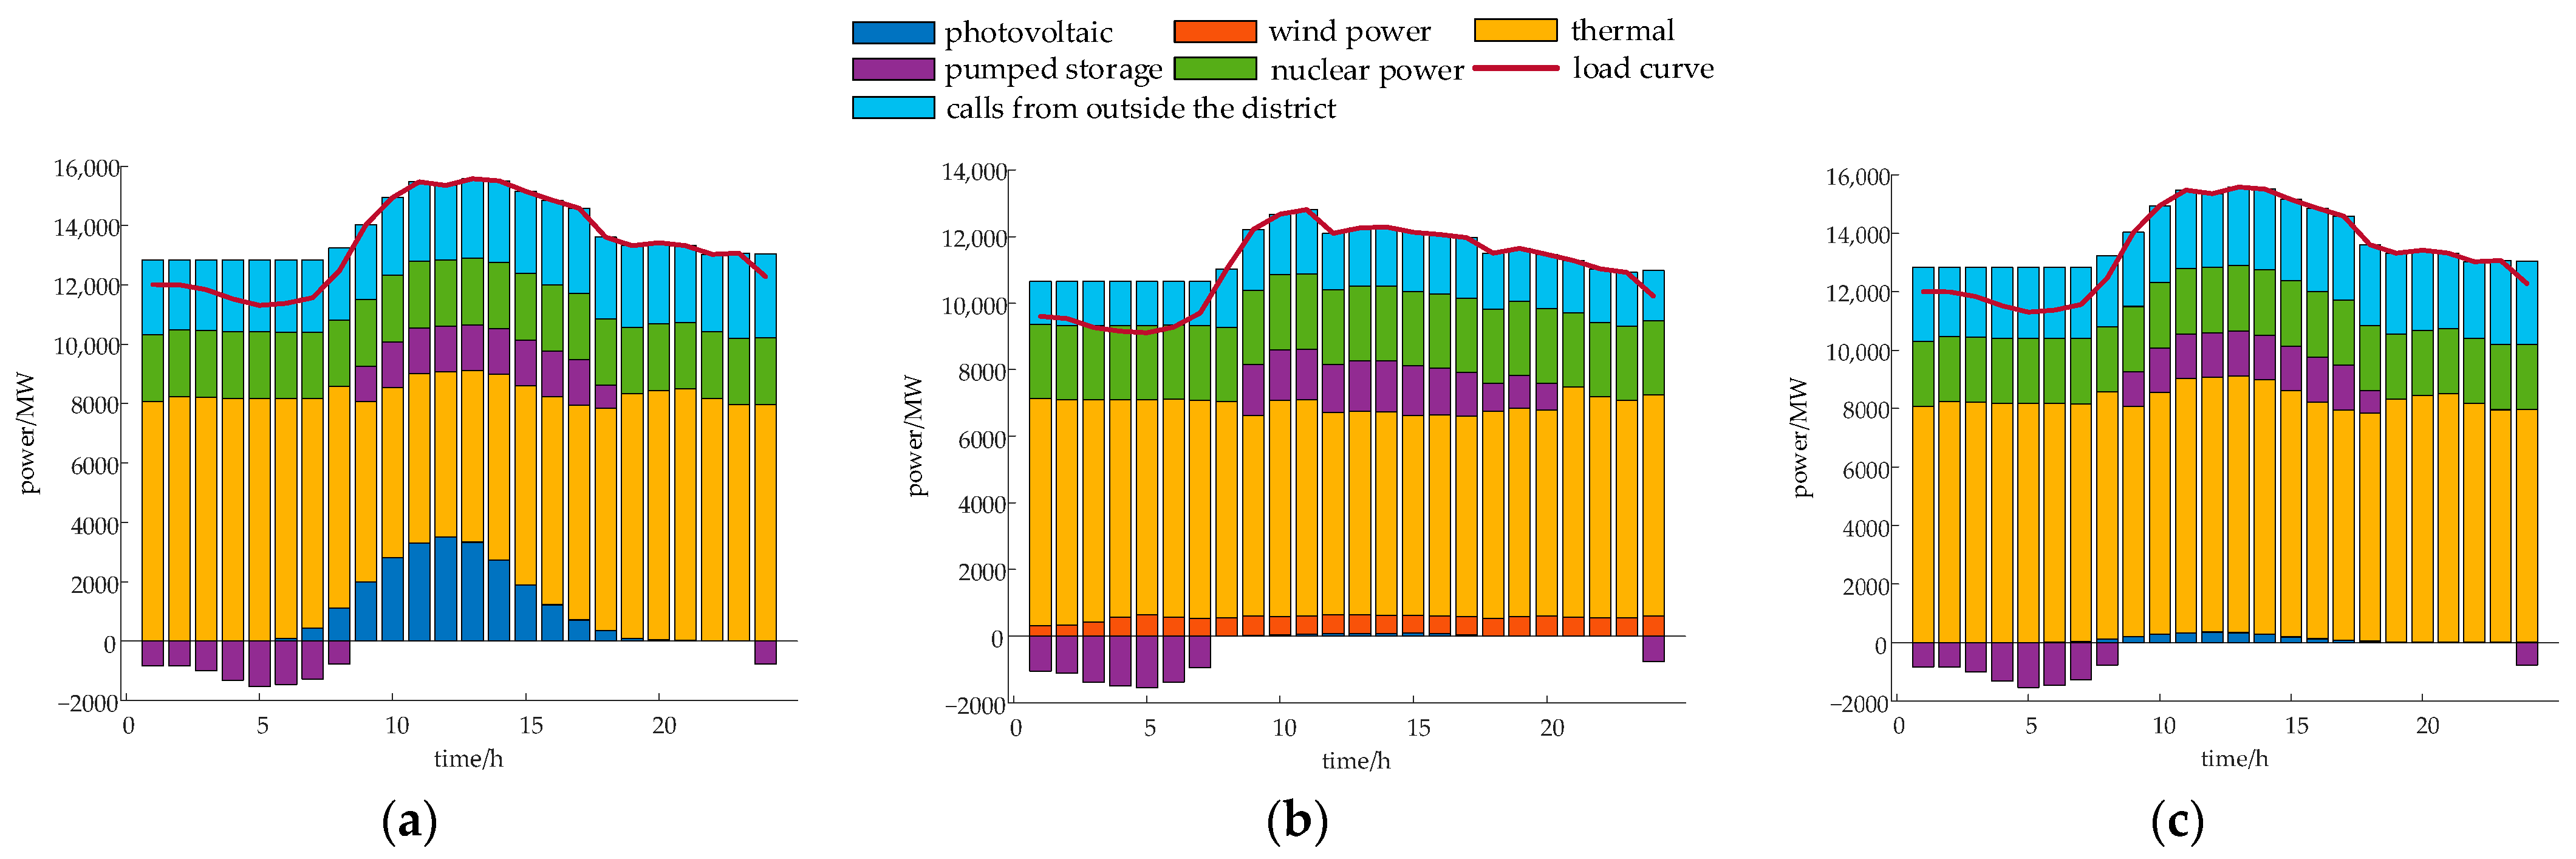
Based on the typical scenarios, this paper constructs the data of the above three extreme scenarios according to the typical impact of extreme weather on power generation. Figure 9 illustrates the grid dispatch results under extreme weather scenarios. Table 6 shows the results of the key indicators of optimal scheduling for extreme scenarios and typical days in the corresponding season.
The comparison from the charts indicates the following:
  • The costs of grid operators in all extreme scenarios presented in Table 6 are significantly higher than those on a typical day, highlighting the economic risks associated with the uncertainties of wind and solar power, with the highest costs occurring during typhoon events.
  • The insufficiency of wind and solar capacity results in a more frequent pumping process compared to typical days, leading to greater energy losses, while pumping revenues are lower than on typical days.
  • In extreme weather scenarios, the reduction in the sources of fluctuation from wind and solar results in a measured peak-to-valley difference that is smaller than on typical days, with the smallest peak-to-valley difference occurring during typhoon events. However, this does not imply that system operations are easier; rather, it reflects a more severe challenge to flexibility.
In order to verify the superiority of the improved GWO, this paper compares and analyzes the performance of different algorithms under the same convergence conditions, and the specific content is elaborated in Appendix A.2.

5. Conclusions

This article addresses the common issues of temporal resource misallocation caused by the static configuration methods of target year capacity planning in traditional pumped storage systems, which often lead to a shortage of capacity in the early stages and waste due to capacity saturation in later periods. An innovative two-level planning model for the temporal configuration of pumped storage capacity that considers operational scheduling is proposed. The upper model aims to minimize the abandonment of wind and solar power generation and determines an approximate pumped storage capacity. Based on this, the lower model seeks to optimize economic benefits while considering the peak-to-valley difference in the load curve, utilizing an improved grey wolf algorithm for scheduling optimization. The actual amount of curtailed electricity is fed back to the upper model for verification and dynamic adjustment until the predicted curtailed electricity calculated based on the upper model’s capacity scheme aligns closely with the amount curtailed in actual operation from the lower model, or the changes in capacity correction in the upper model between consecutive iterations are minimal, ultimately resulting in a temporal configuration scheme for pumped storage capacity. The effectiveness and advantages of this method are validated through numerical examples, leading to the following conclusions:
  • The configuration of pumped storage in the system shows a saturation effect in promoting the absorption of new energy, necessitating a reasonable arrangement of the construction schedule. Specifically, the renewable energy absorption rate plateaus at 98.02% when the pumped storage capacity reaches 2160 MW, indicating diminishing returns beyond this point.
  • With the development of new energy and load, the temporal allocation scheme proposed in this paper significantly improves the absorption rate of new energy in the early planning stage compared to traditional target-year configurations, effectively alleviating the issues caused by early wind and solar curtailment; in the later planning stage, it avoids premature saturation of capacity, achieving the same high absorption rate as traditional target-year configurations while mitigating the risk of resource idleness, thereby realizing an optimized balance of resource efficiency and absorption objectives throughout the entire planning cycle, and enhances sustainability through optimized investment allocation and efficient resource utilization. Specifically, in the early-stage year of 2026, the proposed timeline scheme will improve the consumption rate from 90.81% to 95.30%, reducing curtailment significantly; while in the later stage year of 2030, both scenarios will achieve 98.02% absorption rates, but the timeline scheme reduces cumulative capacity by 10%, avoiding overinvestment and idle resources.
  • The two-layer optimization planning method employed in this article demonstrates a higher solution efficiency compared to single-layer models, and the refined allocation of pumped storage capacity outperforms the single-layer model in terms of economic viability and system operational stability indicators. Concretely, the total cost of the two-layer model is 1.57 and 1.03 million CNY lower than that of the single-layer model on typical days in winter and transition season, respectively, and the peak-valley difference in the equivalent load of the two-layer model decreased by 18.3%, 23.2%, and 10.7%, respectively, under the three typical days.
  • In extreme weather scenarios, the model proposed in this paper is still capable of generating effective scheduling solutions, which verifies the robustness of the model in dealing with complex and uncertain situations.
The timing capacity allocation method established in this paper provides a generalizable implementation path for provincial energy decision-making: power grid planners can achieve precise investment and effectively solve the planning dilemma of “insufficient capacity in the early stage and idle resources in the later stage”. When it is promoted to areas with mature pumped storage regulation systems, it can effectively promote the cross-regional consumption of new energy by coordinating the mutual assistance between provincial peaks and valleys. In provinces with significant fluctuations in electricity consumption, the expansion rhythm can be customized based on local load characteristics, taking into account system safety and investment benefits.
In this stage, the impact of prediction errors such as load and wind and solar uncertainty has not been fully studied, and the sensitivity analysis of key factors such as wind speed will be quantified according to the research progress in the future. At the same time, a life-cycle cost–benefit framework that takes into account social and environmental indicators will be introduced to establish a more comprehensive evaluation system for pumped storage.
Author Contributions

Writing—original draft, D.H.; writing—review and editing, L.S. and D.H.; supervision, L.S.; conceptualization, L.Z.; formal analysis, Z.Z. and Z.G.; methodology, J.G.; validation, W.Z. All authors have read and agreed to the published version of the manuscript.

Funding

This research was funded by the Science and Technology Project of State Grid Shandong Electric Power Company (No. 52062624002X).

Institutional Review Board Statement

Not applicable.

Informed Consent Statement

Not applicable.

Data Availability Statement

No new data were created or analyzed in this study. Data sharing is not applicable to this article.

Conflicts of Interest

The authors declare no conflicts of interest.

Appendix A

Appendix A.1. Case Data Supplement

The typical daily load, wind power, and photovoltaic output normalized values, as well as external electricity are shown in Figure A1.
Figure A1. (a) Load per unit value. (b) Wind power output per unit value. (c) Photovoltaic output per unit value. (d) External electricity.
Sustainability 17 07990 g0a1

Appendix A.2. Algorithm Performance Comparison

Table A1 shows the key performance indicators of the four optimization algorithms in the same test scenario, indicating that the convergence speed of the improved GWO algorithm is 63% faster than that of PSO and 70% faster than that of GA, which is mainly due to the advantages of GWO described in Section 3.3 and the addition of chaotic mapping; and the solution accuracy of the improved GWO algorithm is more than 40% ahead, mainly because the Logistic-Tent composite chaotic mapping improves the diversity of the population.
Table A1. Algorithm performance comparison.
Algorithm *Iteration NumberCurtailment Deviation/%Total Time/Min
Improved GWO5020.07126
Traditional GWO7380.19183
PSO12850.32348
GA15630.41421
* The initial population is 100. PSO has an inertia weight of 0.8 and a learning factor of 1.5. GA had a crossover rate of 0.8 and a variation rate of 0.05.

References

  1. He, P.; Liu, X.; Gong, Z.J.; Wen, F.S.; Zhao, C.; Li, Q.Y. Hierarchical optimization operation model for joint peak-load regulation of source-load-storage in a high proportion of renewable energy power system. Power Syst. Prot. Control 2024, 52, 112–122. [Google Scholar] [CrossRef]
  2. Yang, H.; Liu, Q.; Xiao, K.; Guo, L.; Yang, L.; Zou, H. Scenario-driven optimization strategy for energy storage configuration in high-proportion renewable energy power systems. Processes 2024, 12, 1721. [Google Scholar] [CrossRef]
  3. Said, L.; El Mokhtar, E.H.; Abdelhadi, M.; El Ghaouti, C. Solar-powered single-stage distillation and complex conductivity analysis for sustainable domestic wastewater treatment. Environ. Sci. Pollut. Res. Int. 2024, 31, 29321–29333. [Google Scholar] [CrossRef]
  4. Zhang, J.W.; Huang, N.X.; Chen, B.K.; Jing, Z.X. Optimal operation strategy for pumped-storage power station in energy market under power market environment. Electr. Power Constr. 2020, 41, 45–52. [Google Scholar]
  5. Li, J.; Ma, H.T.; Song, T.Y. A day-ahead energy optimization method to smooth ramp events of combined wind storage systems. Proc. CSEE 2021, 41, 4153–4164. [Google Scholar] [CrossRef]
  6. Liu, K.; Zhang, L.M.; Meng, L.T.; Liu, E.S.; Wang, T.; Song, W.H. Optimal scheduling of power system with new energy high penetration and deep peak regulation of thermal power units. Shandong Electr. Power 2025, 52, 62–71. [Google Scholar] [CrossRef]
  7. Yang, C.; Sun, W.Q.; Han, D.; Tian, K.P. Distributionally-robust economic dispatch considering uncertain wind power output. Power Syst. Technol. 2020, 44, 3649–3655. [Google Scholar] [CrossRef]
  8. Hong, Q.; Ze, Y. Comparison of Dynamic Response Characteristics of Typical Energy Storage Technologies for Suppressing Wind Power Fluctuation. Sustainability 2023, 15, 2437. [Google Scholar] [CrossRef]
  9. Huang, H.Y.; Zhou, M.; Li, G.Y. An endogenous approach to quantifying the wind power reserve. IEEE Trans. Power Syst. 2020, 35, 2431–2442. [Google Scholar] [CrossRef]
  10. Chen, A.K.; Hu, J.Z.; Lu, Y.Q.; Xie, D.; Jiang, C.W. Research on correlation model of cascade hydro-photovoltaic-pumped storage hybrid generation planning. Proc. CSEE 2020, 40, 1106–1116+1403. [Google Scholar] [CrossRef]
  11. Zhu, Y.; Yao, S.Y.; Zhang, Y.N.; Cao, M.J. Environmental and economic scheduling for wind-pumped storage-thermal integrated energy system based on priority ranking. Electr. Power Syst. Res. 2024, 231, 110353. [Google Scholar] [CrossRef]
  12. Luo, Y.; Zhao, J.J.; Wang, K.; Liu, Y.H. The effect of pumped storage power station on maintaining the safety and stability of power grid and its economic evaluation considering new energy consumption. Hydropower New Energy 2023, 37, 1–5. [Google Scholar] [CrossRef]
  13. Singh, N.K.; Koley, C.; Gope, S.; Dawn, S.; Ustun, T.S. An Economic Risk Analysis in Wind and Pumped Hydro Energy Storage Integrated Power System Using Meta-Heuristic Algorithm. Sustainability 2021, 13, 13542. [Google Scholar] [CrossRef]
  14. Shi, L.J.; Yang, F.; Li, Y.; Zheng, T.; Wu, F.; Lee, K.Y. Optimal Configuration of Electrochemical Energy Storage for Renewable Energy Accommodation Based on Operation Strategy of Pumped Storage Hydro. Sustainability 2022, 14, 9713. [Google Scholar] [CrossRef]
  15. Lin, L.; Li, B.C.; Sun, Y.; Wei, M. Multi-Time-Scale Iterative Optimal Configuration Model of Pumped Storage Capacity Based on Accommodation of High Share New Energy. Power Syst. Clean Energy 2021, 37, 104–111. [Google Scholar]
  16. Fobes, D.M.; Claeys, S.; Geth, F.; Coffrin, C. An open-source framework for exploring distribution power flow formulations. Electr. Power Syst. Res. 2020, 189, 106664. [Google Scholar] [CrossRef]
  17. Cheng, M.Z.; Tang, Y.J.; Shang, W.Y.; Man, L.K.; Zhang, N.; Zhang, N.; Li, H.Z. Optimal Capacity Configuration of Pumped-Storage Power Station in Wind-PV-Fire-Pump Storage System. Electr. Power Constr. 2021, 42, 72–81. [Google Scholar] [CrossRef]
  18. Ma, Y.Z.; Li, C.S.; Zhou, J.Z.; Zhang, Y.C. Comprehensive stochastic optimal scheduling in residential micro energy grid considering pumped-storage unit and demand response. J. Energy Storage 2020, 32, 101968. [Google Scholar] [CrossRef]
  19. Gao, X.Q.; Liu, W.X.; Fu, M.D.; Zhang, S.T.; Zhang, S.; Huang, S. Strategy decision game approach of the combination generation system of wind and thermal power participating in the direct power purchase transaction of large consumer. Electr. Power Syst. Res. 2021, 200, 107463. [Google Scholar] [CrossRef]
  20. Lin, L.; Yue, X.Y.; Xu, B.Q.; Sun, Y.; Wei, M. Sequence and Strategy of Pumped Storage-thermal Combined Peak Shaving Considering Benefits of Pumped Storage and Deep Regulation of Thermal Power. Power Syst. Technol. 2021, 45, 20–32. [Google Scholar] [CrossRef]
  21. Ni, J.B.; Zhang, Y.F.; Shi, H.B.; Zhang, G.; Qin, X.H.; Ding, B.D. Pumped Storage Quantification in Promoting New Energy Consumption Based on Time Series Production Simulation. Power Syst. Technol. 2023, 47, 2799–2809. [Google Scholar] [CrossRef]
  22. Ayub, S.; Ayub, S.M.; Tan, C.W.; Arif, S.M.; Taimoor, M.; Aziz, L.; Bukar, A.L.; Al-Tashi, Q.; Ayop, R. Multi-Criteria Energy Management with Preference Induced Load Scheduling Using Grey Wolf Optimizer. Sustainability 2023, 15, 957. [Google Scholar] [CrossRef]
  23. Qian, F.R.; Fan, Y.F.; Liu, H.Z.; Lin, X.F. Study on Reactive Power Optimization of Adaptive Particle Swarm Based on Logistic Chaotic Mapping. Power Capacit. React. Power Compens. 2017, 38, 146–151. [Google Scholar] [CrossRef]
  24. Peng, Y.M.; Liu, D.X.; Wang, X.L.; Yang, Y.; Chen, M.; Zhong, H.W. Optimization scheduling of pumped-storage power stations under extreme weather scenarios considering reservoir operation constraints. J. Hydraul. Eng. 2023, 54, 1298–1308. [Google Scholar] [CrossRef]
Figure 1. Schematic diagram of pumped storage capacity configuration method considering construction timeline.
Sustainability 17 07990 g001
Figure 2. Line of thought of the two-layer optimization algorithm.
Sustainability 17 07990 g002
Figure 3. Solving process of GWO algorithm based on Logistic-Tent composite chaotic mapping.
Sustainability 17 07990 g003
Figure 4. Peak load.
Sustainability 17 07990 g004
Figure 5. New energy absorption rate of a provincial power grid in 2030.
Sustainability 17 07990 g005
Figure 6. Dispatch results. (a) A typical winter day. (b) A typical transition season day. (c) A typical summer day.
Sustainability 17 07990 g006
Figure 7. Load curve. (a) A typical winter day. (b) A typical transition season day. (c) A typical summer day.
Sustainability 17 07990 g007
Figure 8. Startup status of thermal power units. (a) A typical winter day. (b) A typical transition season day. (c) A typical summer day.
Sustainability 17 07990 g008
Figure 9. Dispatch results in extreme weather scenarios. (a) Extended period of hot and sunny weather. (b) Cold wave with frigid conditions. (c) Typhoon passage.
Sustainability 17 07990 g009
Table 1. The installed capacity of various power sources in the system.
Installed Capacity *20262027202820292030
Thermal power88839115911591159115
Photovoltaic40294229442946294829
Wind power8741054125414541654
Nuclear power11531278152318832243
* The units in the table are MW.
Table 2. Results of pumped storage capacity configuration timeline.
Year20262027202820292030
Configuration timeline *Single-layer model (unrefined)Additional——22045060460
Cumulative520740119012501710
Two-layer model (refined)Additional——14634651476
Cumulative520666101210631539
* The units in the table are MW.
Table 3. Comparison of new energy absorption rates between non-temporal and temporal scenarios.
Year20262027202820292030
Non-timeline90.81%93.26%95.78%97.92%98.02%
Timeline95.30%95.98%96.75%97.67%98.02%
Table 4. Comparison of optimal dispatch calculation results for pumped storage power station capacities of 1539 and 1710 MW.
IssueCost of Grid Operator (×100 Million CNY)Pumped Storage Income of the Two-Part Electricity Price (×10 Million CNY)Peak-to-Valley Difference in Load Curve (MW)
A capacity of 1539 MWA typical winter day5.55879.74152256
A typical transition season day5.32759.75372070
A typical summer day6.63829.73574130
A capacity of 1710 MWA typical winter day5.57449.52352760
A typical transition season day5.33789.54892697
A typical summer day6.62349.51684623
Table 5. Wind and solar power output under certain extreme weather conditions.
Extreme WeatherFeaturesWind and Photovoltaic Output
Extended period of hot and sunny weatherContinued high temperatures, low wind speeds, and strong sunlight for several daysThe output of wind power is small, and the output of photovoltaic power is large
Cold wave with frigid conditionsIt lasted for several days with low temperatures, high wind speeds, and weak lightThe output of wind power is large, and the output of photovoltaic power is small
Typhoon passageHigh wind speed, precipitationThe output of wind power is small, and the output of photovoltaic power is small
Table 6. The comparison between targets in extreme weather scenarios and typical days.
ScenarioCost of Grid Operator (×100 Million CNY)Pumped Storage Income of the Two-Part Electricity Price (×10 Million CNY)Peak-to-Valley Difference in Load Curve (MW)
A typical summer day6.61909.50684485
Extended period of hot and sunny weather7.10364.97132924
Typhoon passage7.98284.97132924
A typical winter day5.56529.54212703
Cold wave with frigid conditions6.12955.84921520
Disclaimer/Publisher’s Note: The statements, opinions and data contained in all publications are solely those of the individual author(s) and contributor(s) and not of MDPI and/or the editor(s). MDPI and/or the editor(s) disclaim responsibility for any injury to people or property resulting from any ideas, methods, instructions or products referred to in the content.