Article

Watershed-BIM Integration for Urban Flood Resilience: A Framework for Simulation, Assessment, and Planning

by
Panagiotis Tsikas
,
Athanasios Chassiakos
* and
Vasileios Papadimitropoulos
Department of Civil Engineering, University of Patras, 26500 Patras, Greece
*
Author to whom correspondence should be addressed.
Sustainability 2025, 17(17), 7687; https://doi.org/10.3390/su17177687
Submission received: 1 June 2025 / Revised: 8 August 2025 / Accepted: 20 August 2025 / Published: 26 August 2025
(This article belongs to the Special Issue Sustainable Project, Production and Service Operations Management)

Abstract

Urban flooding represents a growing global concern, especially in areas with rapid urbanization, unregulated urban sprawl and climate change conditions. Conventional flood modeling approaches do not effectively capture the complex dynamics between natural watershed behavior and urban infrastructure; they typically simulate these domains in isolation. This study introduces the Watershed-BIM methodology, a three-dimensional simulation framework that integrates Building and City Information Modeling (BIM/CIM), Geographic Information Systems (GIS), Flood Risk Assessment (FRA), and Flood Risk Management (FRM) into a single framework. Autodesk InfraWorks 2024, Civil 3D 2024, and RiverFlow2D v8.14 software are incorporated in the development. The methodology enhances interoperability and prediction accuracy by bridging hydrological processes with detailed urban-scale data. The framework was tested on a real-world flash flood event in Mandra, Greece, an area frequently exposed to extreme rainfall and runoff events. A specific comparison with observed flood characteristics indicates improved accuracy in comparison to other hydrological analyses (e.g., by HEC-RAS simulation). Beyond flood depth, the model offers additional insights into flow direction, duration, and localized water accumulation around buildings and infrastructure. In this context, integrated tools such as Watershed-BIM stand out as essential instruments for translating complex flood dynamics into actionable, city-scale resilience planning.

1. Introduction

Urban flooding introduces significant challenges regarding cities’ vulnerability and leads to substantial economic losses, infrastructure damage, and public safety threats. The increasing frequency and intensity of such events, intensified by climate change and rapid urbanization, necessitate advanced proactive resilience planning and management strategies (Dharmarathne et al. [1]). In recent years, several urban flood disasters have underscored the role of human activity—particularly unregulated or informal development—in amplifying flood risks. One such case is the 2017 flash flood in Mandra, Greece, which caused severe damage and loss of life. This event has been widely studied and serves as the case study of this research (Diakakis et al. [2]). It exemplifies a broader challenge observed in many flood-prone urban regions, the fact that integrated modeling frameworks capable of bridging watershed-scale and infrastructure-level analysis are not yet sufficiently developed. In Mandra, fragmented modeling practices hindered effective forecasting and preparedness, highlighting the need for unified approaches to urban flood modeling and decision support.
In parallel, the policy landscape has increasingly emphasized the role of integrated modeling in environmental risk management. The European Green Deal, the Sendai Framework for Disaster Risk Reduction, and the UN Sustainable Development Goals stress the importance of data-driven, systemic approaches to urban resilience. These frameworks promote the coupling of digital innovation with governance strategies to enhance preparedness, especially in the face of climate-related hazards. Watershed-BIM aligns with these objectives by fostering interoperability between engineering models and planning tools, enabling cross-sectoral collaboration and supporting evidence-based urban flood mitigation.
Urban flood modeling has emerged as a critical tool for understanding flood dynamics, assessing risks, and developing mitigation strategies. It simulates floodwater flow within urban environments to predict inundation extents, depths, and durations. Recent advancements in this field—driven by computational power, data availability, and modeling techniques—include the coupling of hydrodynamic models with Geographic Information Systems (GIS), the use of remote sensing and high-resolution topographic data, and the application of machine learning for predictive modeling (Khoshkonesh et al. [3]).
Despite advances in urban flood modeling, such approaches often require extensive calibration, and their reliability may be compromised by uncertainties in input data, model parameters, and future climate scenarios. In parallel, Building Information Modeling (BIM) has transformed the Architecture, Engineering, and Construction (AEC) industry by enabling digital twins of structures and facilitating spatially detailed modeling for both construction and operational analysis (Cepa et al. [4]). Beyond conventional uses, BIM applications have expanded to infrastructure systems and disaster management, offering tools to simulate hazards, support evacuation planning, and design resilient structures. For example, Ding et al. [5] integrated real-time data and crowd behavior models into a BIM-based fire evacuation system—demonstrating the potential of such frameworks, including Watershed-BIM, when adapted for flood-related or other hazard scenarios. The integration of BIM with urban flood models emerges as a promising approach for addressing the multifaceted challenges of urban flooding. By combining the predictive capabilities of hydrodynamic models with the rich spatial and structural information provided by BIM, stakeholders can develop more effective flood mitigation and adaptation strategies (Pelden et al. [6]). These include simulating floodwater interactions with buildings and infrastructure networks, performing detailed damage assessments, designing flood-resistant structures, and supporting emergency response planning.
Although several well-established simulation tools exist (e.g., HEC-RAS, SWMM, RiverFlow2D), their fragmented and standalone nature hinders comprehensive planning. While numerous tools exist for individual modeling tasks, the main challenge remains the integration of spatial, semantic, and hydraulic modeling into a cohesive and interoperable framework. This gap contributes to fragmented workflows, insufficient 3D representation, and limited support for decision-making. Watershed-BIM addresses this need by coupling BIM, GIS, and flood modeling into a unified digital workflow that supports streamlined data exchange and integrated scenario-based planning. For example, BIM can be used to assess the flood resilience of buildings by simulating how floodwater interacts with individual structures and infrastructure networks. The employment of BIM tools can model the impact of flooding on building interiors, allowing for detailed damage assessment. They can also be used for designing flood-resistant buildings and infrastructure or for emergency response planning.
This study introduces Watershed-BIM, an integrated methodological framework that bridges this gap by combining BIM/CIM, GIS, Flood Risk Assessment (FRA), and Flood Risk Management (FRM) tools into a unified, interoperable system. The approach supports fully 3D flood simulations using RiverFlow2D and Autodesk InfraWorks/Civil 3D, allowing for realistic modeling of floodwater behavior around infrastructure. The methodology is tested on the 2017 flash flood in Mandra, Greece, demonstrating improved accuracy compared to traditional models such as HEC-RAS. By enabling scenario-based planning, the Watershed-BIM framework facilitates more resilient infrastructure design and informed decision-making in urban flood risk contexts.

2. Background

The literature on urban flood risk management spans a broad spectrum of approaches, technologies, and interdisciplinary frameworks. Existing research has addressed diverse themes such as flood risk modeling, impact assessment, visualization, integration of geospatial tools, and strategic flood governance. This section synthesizes the major trends in the field, highlighting both established contributions and persistent research gaps.
In the realm of flood risk modeling and damage assessment, several contributions emphasize harmonization and scalability. Jongman et al. [7] examine disparities in flood damage models across Europe and propose harmonization to improve regional comparability. Bernhofen et al. [8] introduce a scalable methodology for national-level flood risk planning based on global datasets. Alabbad et al. [9] design a web-based flood damage estimation tool for rapid urban-scale assessments, while Cea and Costabile [10] review advanced simulation techniques and underscore the importance of resilience in adaptive flood management.
A growing body of research has explored the role of environmental, meteorological, and socio-economic factors in influencing flood risk. Soulios et al. [11] identify critical socio-environmental drivers behind catastrophic floods in Greece, emphasizing land use and urban morphology. Mitsopoulos et al. [12] investigate the role of infrastructure in flood damage mitigation, while Varlas et al. [13] analyze the interplay of rainfall intensity and watershed response to support early warning systems. Diakakis et al. [14] use the Mandra event to propose location-specific vulnerability frameworks, and Speis et al. [15] highlight the psychosocial dimension of disaster impacts. Further extending this international context, Khan et al. [16] assess climate-driven flooding trends in Pakistan and suggest mitigation priorities.
Regarding modeling typologies, the literature documents the application of various hydrological and hydrodynamic models. Devia et al. [17] offer a comparative analysis of urban-rural hydrology models and recommend hybrid approaches for improved fidelity. Yu and Duan [18] propose a hydrodynamic simulation tool for optimizing urban flood resilience. Teng et al. [19] provide a comprehensive review of inundation modeling techniques. Banks et al. [20] catalog a wide range of simulation software—such as HEC-RAS, Flo-2D, TUFLOW, XP-SWMM, MIKE FLOOD, SWMM, and Hazus-MH—employed in 1D/2D flood analysis and real-time flood management across various contexts.
Another area of increasing relevance is the integration of green and gray infrastructure in flood mitigation strategies. Zischg et al. [21] outline robustness pathways involving gray infrastructure, particularly drainage systems and engineered barriers. Chen et al. [22] argue for a balanced adoption of green-gray solutions that enhance urban resilience and sustainability. These perspectives are valuable for informing model input parameters and scenario testing.
Several case studies further contribute to understanding the dynamics of flood impacts. Bellos et al. [23] leverage open datasets to explore challenges in model calibration, especially in data-scarce settings. Kelesoglu et al. [24] assess the structural damage caused during the 2021 floods in Turkey’s Black Sea Basin, emphasizing the role of infrastructure in resilient design. Nkwunonwo et al. [25] highlight the modeling challenges in developing countries and call for simplified frameworks using open-source tools and minimal computational demand.
Visualization and communication are critical components of flood modeling. Salvadore et al. [26] illustrate the widespread use of Geographic Information Systems (GIS) in hydrological simulations for urban contexts. Rong et al. [27] critique traditional 2D modeling for failing to capture urban complexity and propose enhanced visualization using aerial photogrammetry. Rydvanskiy and Hedley [28] argue that 3D visualizations enable clearer communication of flood risks, especially for non-expert stakeholders.
At the intersection of flood modeling and digital infrastructure, GIS and Building Information Modeling (BIM) have gained traction for integrating spatial, structural, and environmental data. Amirebrahimi et al. [29] explore the use of BIM-GIS tools for structural damage estimation at the building scale. Kangwa and Mwiya [30] adopt GeoBIM in hazard mapping and emergency simulation. Jang et al. [31] utilize national CityGML datasets to model flood impacts on built assets. Wang et al. [32] apply 3D visualization to evaluate flood mitigation in sponge cities. Liu et al. [33] explore the potential of digital twins in watershed planning. Yang et al. [34] integrate BIM, GIS, and collaborative platforms for assessing infrastructure vulnerabilities, while Syed Abdul Rahman et al. [35] emphasize the added value of BIM-GIS coupling in high-resolution environmental simulation.
At the strategic level, institutional frameworks guide flood risk policy. The European Union’s Directive 2007/60/EC mandates risk assessment and management plans across member states. The Copernicus Emergency Management Service (CEMS) complements this by offering real-time flood mapping and early warning services. Ajmar et al. [36] document the utility of CEMS in disaster response and risk analysis using satellite imagery and analytics.
Despite these advances, key limitations remain. First, current simulation tools generally function within domain-specific boundaries, with interoperability across systems still evolving. Second, flood models often rely on 2D simplifications that inadequately capture complex hydrodynamics around urban infrastructure. Third, the integration of spatial analysis, structural modeling, and flood simulation remains limited and mostly experimental. Addressing urban flood risk requires frameworks that support data exchange between GIS, BIM, hydrodynamic engines, and decision-support systems.
This study contributes to bridging these gaps by introducing the Watershed-BIM framework—an integrated simulation environment that links watershed-scale modeling with infrastructure-scale analysis through BIM, GIS, and risk management tools. By enabling 3D flood simulations and scenario testing, the approach enhances planning, communication, and resilience. Unlike conventional tools, Watershed-BIM can support seamless interoperability, offering a step toward digitally integrated urban flood management.

3. Flood Risk Management

3.1. Overview of the Watershed-BIM Methodology

The Watershed-BIM methodology is a structured, sequential framework that integrates geospatial analysis and building information modeling to simulate flood behavior and support resilience-oriented decision-making. The main steps are as follows:
  • Geospatial, topographic, and climatic data are collected for the watershed and urban area, and the study region is georeferenced. Terrain features (e.g., elevation, land use) and surface types (streams, buildings, soil) are defined and analyzed.
  • Building and infrastructure models—typically with low to medium Level of Detail (LoD)—are imported, often in IFC format. These are integrated with GIS data through common spatial references.
  • The watershed boundaries and hydrographic network are delineated, slopes are analyzed, and the basin is subdivided into sub-catchments. Key parameters such as rainfall, runoff coefficients, and surface roughness are assigned.
  • GIS and BIM data are then used as inputs to hydrological-hydraulic models (e.g., RiverFlow2D) to simulate flow patterns and flood risk.
  • Results are visualized both in the BIM environment (for building-scale impacts) and in GIS (for regional-scale analysis). Scenario testing can be performed by altering site features (e.g., adding flood control structures).
Figure 1 presents a break-down structure of proposed flood management methodology.

3.2. Flood Risk Assessment

Flood risk is typically defined as a function of the flood occurrence probability and the respective anticipated consequences. In this context, flood risk is leveraged by three main parameters, hazard, exposure, and vulnerability. Hazard refers to the flood characteristics (e.g., intensity) and its potential contribution to harm, destruction, or disruption of the natural or built environment. Exposure concerns the presence of people, property, economic activities, or environmental elements that are likely to be affected by an extreme event hazard. Vulnerability is related to the degree of sensitivity or capability of a system to resist or adapt to hazard exposure. Risk expresses the actual impact of the extreme event in the natural or built environment or system. Risk is a function of hazard, vulnerability, and exposure, typically with a linear relationship of the form of Equation (1). The flood probability is signified by the hazard indicator, whilst the potential consequences by the product of exposure and vulnerability indicators.
Flood Risk = Hazard × Exposure × Vulnerability
The estimation of hydrological parameters is based on rainfall curves, with data coming from rainfall gauge locations and stations. Equation (2) provides an estimate of the rainfall intensity, expressing the Generalized Extreme Value (GEV) distribution. Accordingly, the concentration time (tc) of each basin is calculated using the Giandotti equation (Equation (3)). The calculation of peak flow for flood runoff (Q) in each basin is determined based on the rational formula (Equation (4)).
i = λ · T K Ψ 1 + t c θ η
t c = 4 · A d + 1.5 · L 0.8 · H m r e f H r e f
Q = 0.278 · C · i · A d
where
  • i: rainfall intensity (mm/h),
  • tc: concentration time (h),
  • T: return period (years),
  • K, θ, λ′, ψ′, η: scale, position, and shape parameters of the GEV distribution,
  • Ad: the hydrological basin area (km2),
  • L: maximum watercourse length in the basin (km),
  • Hmref: difference between the mean basin elevation upstream and the bottom of the basin (m),
  • Href: elevation at the bottom of basin (m),
  • Q: peak runoff flow (m3/s),
  • C: runoff coefficient, which mainly depends on the catchment characteristics.
The runoff coefficient C of Equation (4) is calculated by Equation (5) as the sum of discrete contributors related to relief slope Cr, soil infiltration Ci, vegetative cover Cv, and surface storage capacity Cs. These factors are determined based on basin characteristics and influence the overall runoff pattern. Table 1 presents indicative values of these coefficients and highlights the potential for flood intensity reduction when factors such as vegetation and surface storage capacity are increased. For instance, dense vegetation and greater surface water storage capacity can reduce the runoff coefficient, enhance infiltration, and decrease surface water flow.
C = C r + C i + C v + C s  
where
  • Cr: watershed relief,
  • Ci: soil infiltration,
  • Cv: vegetative cover,
  • Cs: land surface storage capacity.
Table 1. Runoff Coefficient for Rural Watersheds (Drainage Manual [37]).
Runoff Coefficient Values
ExtremeHighNormalLow
Watershed relief (Cr)0.28–0.350.20–0.280.14–0.200.08–0.14
Soil infiltration (Ci)0.12–0.160.08–0.120.06–0.080.04–0.06
Vegetative cover (Cv)0.12–0.160.08–0.120.04–0.080.04–0.06
Surface storage capacity (Cs)0.10–0.120.08–0.100.06–0.080.04–0.06
The Giandotti equation was applied solely to the rural upstream subcatchment to estimate the time of concentration and peak discharge generated by natural terrain. This flow constitutes the input to the downstream urban flood modeling. Within the urban domain, surface runoff mechanisms—such as infiltration, concentration pathways, and hydraulic response—are simulated using the integrated Watershed-BIM environment. InfraWorks and RiverFlow2D allow the incorporation of detailed 3D geometries, including buildings, streets, terrain, and drainage networks, enabling a realistic representation of the complex hydrodynamic processes occurring in urban settings.

3.3. Watershed-Building Information Modeling (W-BIM)

To assess flood risk, both the probability of occurrence and the potential consequences of flooding must be estimated. The process begins with watershed delineation, which is typically performed using a Digital Elevation Model (DEM) in a Geographic Information System (GIS) environment such as QGIS. A digital terrain model is developed using either open-source data (e.g., Google Earth profiles) or higher-accuracy sources such as LiDAR. Once the terrain model is constructed, flow direction and accumulation analysis are used to identify watershed boundaries and flood-prone areas. Hydraulic parameters (e.g., Manning’s roughness coefficients, boundary conditions) and hydrological data (e.g., rainfall intensity, soil infiltration) are then introduced into the flood model. The simulation results provide spatial outputs such as flood depth, flow velocity, and direction, highlighting critical urban exposure zones.
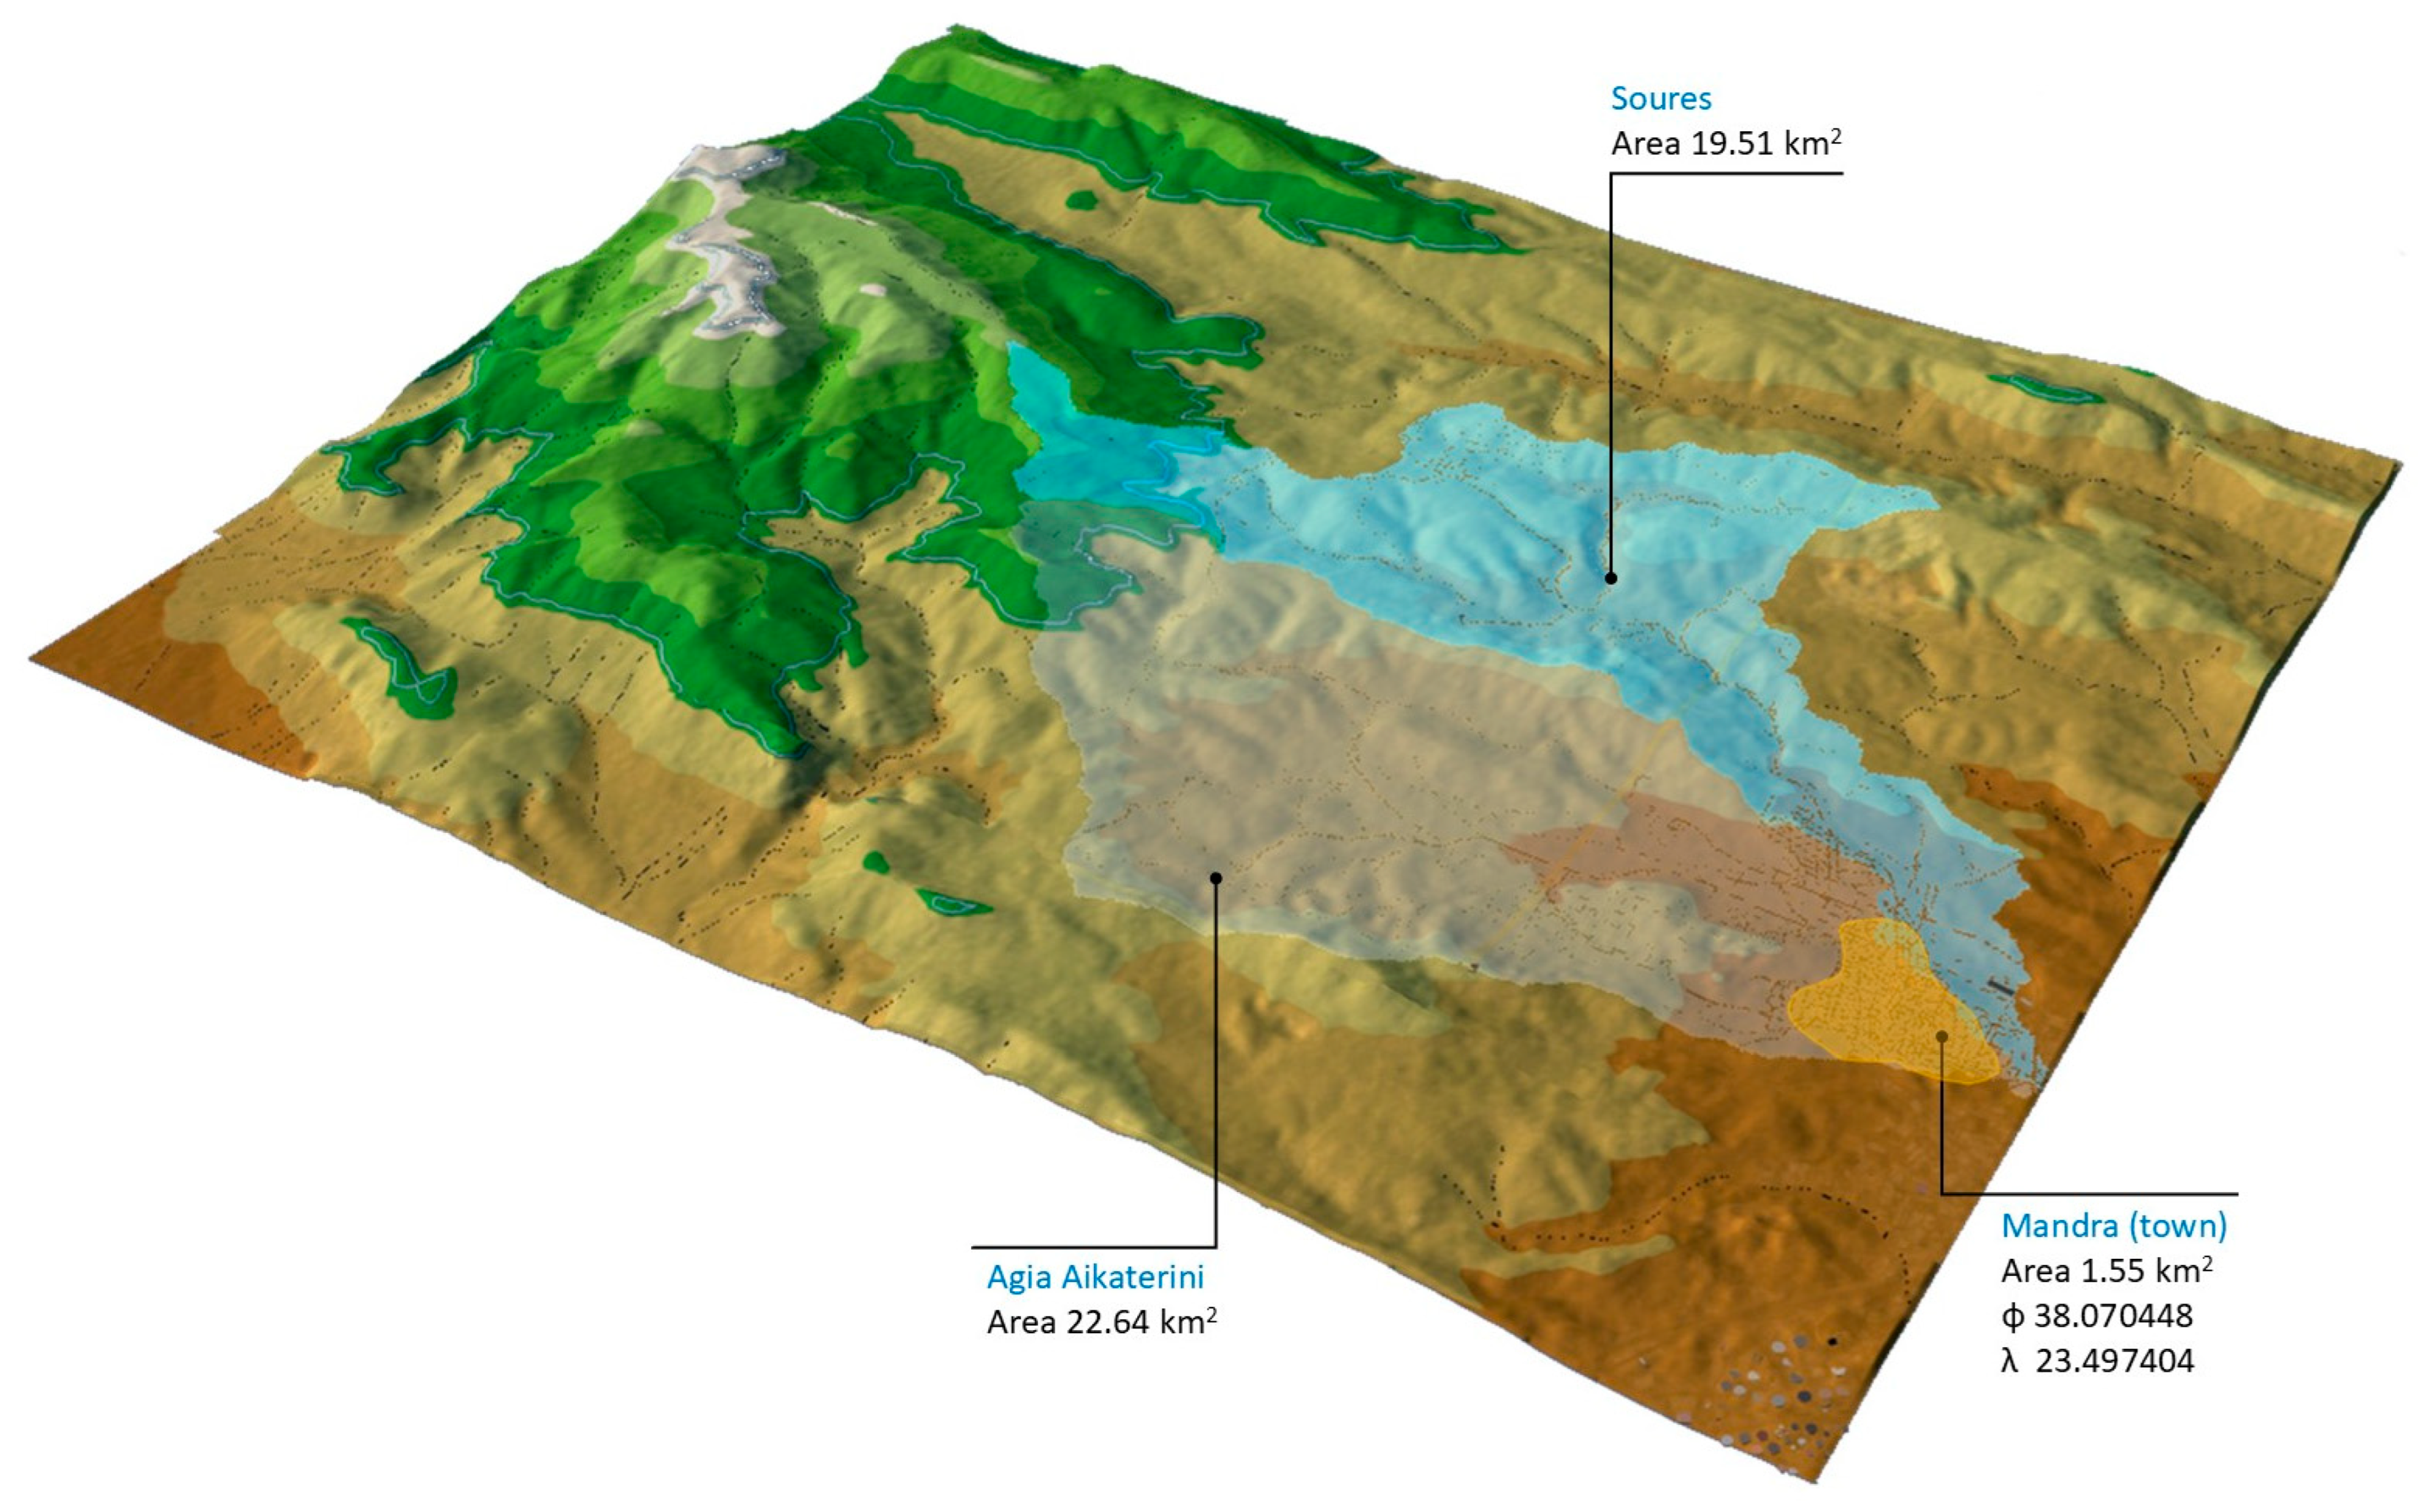
Figure 2 presents a 3D visualization of the upstream drainage basins and their discharge paths toward the urban area of Mandra, Greece, which has been utilized as the case study. The figure illustrates two distinct rural subcatchments and their relative contribution to downstream flood risk. While the figure is not fully georeferenced, spatial coverage is comprehensively illustrated later, as part of the case study analysis. Regarding the digital elevation model (DEM), terrain data can be acquired either via Google Earth-derived elevation profiles or LiDAR-based datasets. While the former offers easier access and faster processing, it is less precise. However, for the scope and scale of the present macroscopic flood analysis, the resolution used appears to be sufficient and does not critically affect the simulation outcomes.
Autodesk InfraWorks is utilized as a tool for model creation and analysis. Using GIS data (e.g., Google Earth, openstreetmap), a 3D model of the area is developed, encompassing geometric entities such as buildings, roads, bridges, and other urban elements. Intensity-Duration-Frequency (IDF) data are incorporated into InfraWorks to simulate various rainfall scenarios and period of return. Building structures, roads, and other urban features are included in the model to simulate the impacts of rainfall, with a focus on hydraulic flows around infrastructure elements. Hydraulic Grade Lines (HGL) and Energy Grade Lines (EGL) are generated in Infraworks to predict potential overflows, and identify critical elements for potential interventions (e.g., manholes).
The InfraWorks simulation results are imported into the flood analysis software (RiverFlow2D v8.14). This software is used to calculate flows within the model, including parameters such as water depth, velocity, and direction. Additionally, areas with potential overflow are identified, and flood extent maps are produced. Multiple flood scenarios, in terms of rainfall height, duration and intensity, period of return, etc., are assessed. The combined use of InfraWorks and RiverFlow2D ensures simulation and analysis accuracy while providing realistic 3D visualizations and precise maps for flood prediction and mitigation. As a result, the 3D/W-BIM model can act as a reference tool and be utilized for flood management planning and decision-making. The 3D/W-BIM model can further be integrated with Autodesk Civil 3D for pipeline design using the Storm and Sanitary Analysis (SSA) extension of it. This approach enables seamless integration of all model layers, ensuring accuracy in flood risk assessment and 3D visualization capabilities.
The integration of Autodesk InfraWorks and Civil 3D with RiverFlow2D is carried out through the Hydronia RiverFlow2D plugin. InfraWorks exports the remeshed terrain model, boundary conditions, and hydrographs in predefined file formats that are handled internally by the plugin (no direct API is used). Resolution alignment is achieved through automatic remeshing of the simulation area to meet the requirements of hydraulic modeling, preserving features of both the broader watershed and the urban-scale environment. Scale conflicts are addressed by embedding detailed topography (e.g., roads) within the wider watershed context.
Table 2 summarizes the main features of the proposed approach in comparison to the customary techniques for flood risk analysis. The comparison is carried out in the context of the case study implementation, using common hydrological inputs and site-specific data. While HEC-RAS offers extensive capabilities—particularly in riverine environments—Watershed-BIM is oriented toward multi-layer 3D modeling of complex urban environments. It is further noted that differences in tool configuration, user expertise, and project scope can lead to varying performance assessments. As such, Table 2 is not intended as an absolute ranking but rather as an illustrative benchmark for the studied application.
The comparative evaluation in Table 2 is based on the implementation context of the Mandra case study, using identical hydrological inputs (rainfall from local gauge data), terrain models, and simulation extents for both tools. While HEC-RAS supports GIS-based workflows and advanced riverine modeling, Watershed-BIM provides native integration of buildings, roads, and drainage networks in a 3D spatial environment, enabling city-scale flood analysis. The term ‘holistic approach’ refers to the combined modeling of natural terrain and urban infrastructure layers—including flood consequences and mitigation scenarios—within a single interoperable workflow. Interoperability was assessed based on native and open-standard formats (e.g., SHP, IFC, LandXML), with recognition that experienced HEC-RAS users can achieve similar exchange through manual data preparation or external GIS tools.
Several clarifications are necessary regarding the data sources, modeling assumptions, infrastructure representation, simulation parameters, and software interoperability underlying the Watershed-BIM framework.
The Watershed-BIM framework combines multiple data sources to model urban hydrology with high spatial and hydraulic fidelity. Geometric and land use data—including building footprints, street networks, and land cover—are acquired from open geospatial platforms (Google Maps, OpenStreetMap), official national datasets (e.g., from the Hellenic Ministry of Environment and Energy), and satellite imagery. Where available, high-resolution LiDAR-derived DEMs enhance the accuracy of terrain representation, particularly in complex urban settings. Hydraulic surfaces and parameters, such as the Hydraulic Grade Line (HGL) and Energy Grade Line (EGL), are computed internally within Autodesk InfraWorks and Civil 3D based on terrain, surface roughness, rainfall inputs, and urban infrastructure geometry. This integrated workflow ensures that simulation outputs are directly aligned with the physical characteristics of the study area.
Although the current version of the model does not explicitly represent the urban drainage system, this reflects both data availability constraints and the limited effectiveness of such infrastructure during extreme flood events, such as the 2017 Mandra case. Nevertheless, the Watershed-BIM framework is compatible with the integration of drainage network components—using tools such as Civil 3D’s Storm and Sanitary Analysis (SSA)—allowing for future simulations that incorporate pipe dimensions, inlet positions, and flow capacities. This enhancement would support more comprehensive assessments of urban flood behavior and mitigation design scenarios.
Flood intensity within the Watershed-BIM framework is primarily characterized by rainfall intensity values (mm/h), derived from regional Intensity–Duration–Frequency (IDF) curves typically modeled using the Generalized Extreme Value (GEV) distribution. These curves support the simulation of rainfall events corresponding to defined return periods (e.g., 50- or 100-year storms), facilitating robust and policy-relevant infrastructure assessment. Nevertheless, the model is capable of incorporating highly intense, short-duration rainfall events—such as those exceeding 300 mm in a few hours—using either historical records or synthetic climate scenarios. This flexibility enables planners to test infrastructure resilience not only under statistically expected but also under exceptional stress conditions.
While the Watershed-BIM methodology was implemented using proprietary tools such as Autodesk InfraWorks, Civil 3D, and RiverFlow2D, its structure remains compatible with open-source alternatives. The adoption of OpenBIM principles, particularly through Industry Foundation Classes (IFC), ensures interoperability and flexibility in software selection. Stakeholders can utilize tools such as QGIS for spatial analysis and watershed delineation, HEC-HMS for hydrologic modeling, and OpenFOAM or HEC-RAS for hydraulic simulations, depending on local needs and resource availability. This adaptability enables cost-effective implementation and supports collaborative workflows, making the methodology suitable even for regions with limited financial capacity. However, open-source solutions may entail higher technical complexity and longer learning curves, which should be considered during implementation planning.

4. Case Study: Flood Risk Analysis

The implementation process of Watershed-BIM analysis in an urban environment is illustrated in detail in the following case study example. Although the present application focuses on Mandra, a medium-sized town with a well-documented flood history, the Watershed-BIM framework has been designed with scalability in mind. Its modular architecture, reliance on open geospatial and BIM standards (e.g., IFC, GIS, DEMs), and compatibility with large datasets allow for deployment in more complex urban environments. This may include large metropolitan areas and coastal megacities, where challenges such as tidal influences, compound flooding, and high urban density require adaptable and interoperable modeling tools.

4.1. Case Description and Input Data

One of the most devastating flood events in recent Greek history occurred in Mandra, Attica, on 15 November 2017, resulting in 24 fatalities and widespread infrastructure damage. In response to the disaster, the European Copernicus Emergency Management Service (CEMS) activated EMSR257, providing satellite-based flood extent mapping and impact delineation for the affected area (Flood in Attika, Greece). While CEMS offers rapid assessments at a continental scale, it is not intended for detailed, urban-scale hydraulic modeling. Accordingly, CEMS data were not used as input for the simulations in this study, but are referenced to provide broader institutional context regarding European flood monitoring practices. Where relevant, CEMS flood maps are used as a coarse benchmark to verify the general spatial distribution of flood impacts, complementing but not substituting the high-resolution, model-based flood analysis applied at the urban level.
During the event, floodwaters in the urban area of Mandra originated primarily from the Agia Aikaterini watershed, which drains directly into the town’s residential core. In contrast, the Soures basin contributes mainly to the eastern industrial zone. However, its overflow and eventual convergence with Agia Aikaterini significantly amplified the overall flood severity. To quantify rainfall patterns associated with the event, this study utilized local rain gauge measurements to ensure higher spatial and temporal resolution compared to satellite-derived data. Over 140 mm of rainfall was recorded within a few hours, primarily between 6:00 and 9:00 a.m., that accounts for nearly 40% of the region’s average annual precipitation. These data align with broader observations from NASA’s IMERG dataset of the Global Precipitation Measurement (GPM) Mission, which reported approximately 150 mm of rainfall over the upstream basins during a seven-hour period (Soulios et al. [11]). The resulting hydrological response led to peak discharge estimates of 180 m3/s for the Agia Aikaterini basin and 140 m3/s for the Soures basin. Refined estimations by Mitsopoulos et al. [12], based on calibrated modeling and hydraulic evidence, yielded revised discharge values of 172.5 m3/s and 150.5 m3/s, respectively.
It is further mentioned that although rainfall and discharge measurements significantly enhance model accuracy, such data are not consistently available across all countries or urban areas. Many regions—particularly flood-prone or rapidly urbanizing ones—lack dense or publicly accessible hydrometric networks, especially for discharge monitoring. In the case of the 2017 flood event in Mandra, Greece, rainfall data were obtained from a local meteorological station. Discharge values were not directly measured during the event; instead, they were estimated retrospectively through hydrological modeling in prior studies. As such, a complete hydrograph derived from field measurements was not available. However, floodwater depths were recorded ex post in various locations based on visible high-water marks on buildings and infrastructure. These served as real field reference points for validating our simulated flood depths. This hybrid approach—combining observed rainfall, estimated discharge, and field-based flood depths—enabled a meaningful validation of the Watershed-BIM methodology within the limits of available data.
In the current implementation of the Watershed-BIM framework, urban infrastructure—including buildings, roads, pavements, and other impervious surfaces—is explicitly modeled within the BIM environment (InfraWorks) using actual geometry and spatial footprint data. These elements are hydrologically parameterized using high runoff coefficients (typically > 0.85), reflecting negligible infiltration capacity, in line with standard practices in urban flood modeling. Vegetated or permeable surfaces, where present, were assigned lower runoff coefficients (e.g., 0.3–0.5) to represent their relatively higher infiltration potential. A uniform Manning’s roughness coefficient of 0.02 was applied across the urban domain to simulate surface resistance.
Although the Watershed-BIM framework supports integrated spatial modeling of terrain, infrastructure, and hydrological processes, its implementation is inherently constrained by the availability and granularity of input data—a challenge commonly encountered in data-scarce urban environments. In the present case study, publicly accessible high-resolution datasets—such as subsurface utility layouts and gauging station records—were not available, limiting the development of fully consolidated spatial representations. Specifically, subsurface stormwater drainage infrastructure (e.g., pipes, manholes) was not incorporated into the simulation. However, field observations and post-event reports indicate that the existing drainage network was already overloaded during the early stages of the 2017 flood and did not significantly contribute to flow conveyance during the peak of the event. As such, its omission is not expected to compromise the validity of the flood propagation results. Nonetheless, the Watershed-BIM framework remains compatible with the integration of stormwater systems via Civil 3D’s Storm and Sanitary Analysis (SSA) module, allowing for future implementation of dual drainage simulations under varying infrastructural conditions.
The Watershed-BIM approach, despite its advantages in information flow and system integration, faces specific challenges. First, its accuracy strongly depends on the Level of Detail (LoD) of the BIM models used—lower LoD may result in simplified representations of critical infrastructure components. In this study, a moderate LoD (Level 3) was employed, which proved sufficient for hydrological applications such as identifying building footprints and elevations. Second, uncertainty in rainfall inputs (e.g., from the NASA IMERG dataset at ~10 km resolution) can affect storm characterization; however, in the present case, data from a local meteorological station were used, ensuring higher spatial and temporal resolution. Third, subsurface flow interactions—such as infiltration and groundwater contributions—were not explicitly modeled. Given the antecedent wet conditions in mid-November, the model indirectly accounted for elevated soil saturation through the assignment of increased runoff coefficients. While this assumption is reasonable for high-intensity urban floods dominated by surface runoff, future adaptations of the Watershed-BIM methodology may incorporate dynamic soil moisture modeling and time-series rainfall data to further enhance simulation fidelity.
Nevertheless, due to its adaptive nature, the methodology can progressively overcome these shortcomings as data quality and computational capabilities improve. It can then incorporate enhanced input from various sources, enabling continuous refinement of flood risk analysis. Ultimately, the integrated framework represents a paradigm shift from fragmented analyses to holistic flood risk management, where the integration platform itself becomes the foundation for ongoing improvement and optimization.
Figure 3 illustrates the watershed boundaries and stream network derived using GIS techniques. GIS tools are well-suited for mapping hydromorphological features and representing land profiles; however, their role in hydrological and hydraulic modeling is typically limited to the preprocessing stage. In particular, conventional GIS environments do not natively support the detailed simulation of flood behavior or the dynamic interactions between water flow and urban infrastructure. Such interactions—especially involving buildings, roads, and bridges—are critical for accurate flood risk assessment. Building Information Modeling (BIM) complements GIS by providing parametric, infrastructure-specific representations and by supporting the integration of structural elements into simulation workflows. Through this integration, BIM enhances the accuracy and relevance of flood analysis, particularly in complex urban settings. The combined use of GIS and BIM thus contributes to a more holistic understanding of flood dynamics and infrastructure vulnerability.
By utilizing actual hydrological, topographical, and geophysical data of the area, the proposed W-BIM methodology is applied, and the flood assessment results are evaluated (qualitatively and quantitatively) in terms of alignment with the field observations following the actual disaster. Figure 4 presents the two hydrological basins (Agia Aikaterini and Soures) upstream of Mandra, with the city being mapped at the east. Each watershed is developed by composing smaller basins using InfraWorks.
Figure 5 provides a closer city view based on InfraWorks modeling outputs. In particular, Figure 5a presents the entire urban extent of Mandra, allowing for an overview of the spatial relationship between the contributing watersheds and the built environment. In this visualization, the white lines indicate the watershed boundaries and the blue ones the corresponding streams. Both streams contribute to city flooding, with the Agia Aikaterini stream in particular flowing directly through the urban area. This, coupled with the significant influx of flood runoff and the inadequacy of the drainage system to absorb a significant part of the flowing water, contributed to severe flooding and large impacts alike. Figure 5b shows a smaller portion of the city at higher spatial resolution, depicting the building footprints, road network, and other surface infrastructure elements with greater detail. Both images were produced within the InfraWorks environment. The mesh triangle size was set to 10 m, ensuring a balance between hydraulic accuracy and computational efficiency.
An important aspect of the Watershed-BIM implementation concerns the integration of soil sealing effects into the hydrological simulation process. In this framework, impervious surfaces—such as buildings, roads, and pavements—are explicitly modeled within the BIM environment and designated as non-infiltrating areas. This treatment aligns with methodologies adopted in several European studies on urban impermeability and flood risk (e.g., [38]). By doing so, the framework enables a more accurate representation of surface runoff in densely built environments and supports alignment with European directives on flood risk management and land use planning.

4.2. Results and Validation

The hydrological risk parameters of Equations (2)–(4) are presented in Table 3 and Table 4 for the two upstream catchments of Mandra. These parameters include the concentration time (tc), rainfall intensity (i), and peak flood discharge (Q). The model coefficients for the Mandra region were obtained from the technical report [IDF_Report_V4 (in Greek)], and are as follows: K = 0.125, Θ = 0.124, λ′ = 213.4, ψ′ = 0.641, and η = 0.622. The results indicate that the estimated peak discharge Q, assuming a 50-year return period, is in close agreement with the observed values.
The urban morphology of Mandra significantly contributed to the flood’s destructive impact. The city’s layout is approximately perpendicular to the natural flow direction of the Agia Aikaterini stream, forming continuous barriers to surface runoff. Major roads are also oriented across the streamflow path, obstructing natural drainage corridors and creating artificial impoundments that exacerbated local inundation. Some streets, particularly those aligned parallel to the stream, temporarily acted as conveyance channels, accelerating localized flooding.
Still, these spatial obstructions—typical of vertical city layouts—intensify flooding by disrupting flow continuity and concentrating water in low-lying zones. While a formal obstruction index was not computed due to the lack of detailed spatial and hydraulic data, the effects of such built-environment constraints were clearly reflected in observed flood patterns and areas of entrapment. Studies suggest that vertical urban configurations can reduce effective drainage width and increase flow depth, particularly when street canyons and building walls form channel-like bottlenecks. These effects may lead to localized increases in flood height by 20–50%, depending on building density and elevation gradients (e.g., Yu & Duan, 2017 [18]). Although not quantitatively modeled in the current study, these observations highlight the need for refined analyses of urban geometry impacts. Future research could incorporate spatially distributed obstruction metrics or apply computational fluid dynamics (CFD) simulations to quantify blockage effects and simulate complex flow–structure interactions more accurately. Such extensions would support more nuanced assessments of urban flood risk and inform mitigation strategies that account for geometric constraints imposed by the built environment.
Figure 6 illustrates the simulated flood extent along the Agia Aikaterini stream, generated using InfraWorks. In the general overview (Figure 6a), flood zones are visualized through color gradations representing water depth. Figure 6b zooms into two critical locations, with Spot 1 indicating a school complex in the northern part of the city, where depth variations are depicted using line shading. The green arrows indicate waterflow direction while, when the user points out to a specific point, the system indicates the flood depth.
As said before, to maintain visual clarity and methodological correspondence, the spatial elements are instead presented across Figure 2, Figure 3, Figure 4, Figure 5 and Figure 6: watershed extents and topography (Figure 2), hydrographic network (Figure 3), urban morphology (Figure 4 and Figure 5), and validation points (Figure 6). Together, these provide a complete spatial understanding of the study area and demonstrate the multi-layer integration enabled by the methodology, even if full consolidation into a single high-resolution map was not feasible for this application.
By adopting a holistic and interoperable approach, the proposed methodology enables the direct incorporation of local terrain, infrastructure, and hydrologic conditions into flood risk assessment and mitigation planning. This integration facilitates a more nuanced understanding of flood dynamics in complex urban environments and supports data-driven, scenario-based decision-making. The adaptability of the Watershed-BIM model further ensures the long-term relevance and effectiveness of flood management strategies, making it a valuable tool for enhancing urban resilience.
To evaluate model performance, Watershed-BIM results were compared against real-world observations and simulations from HEC-RAS and the Copernicus EMS. HEC-RAS was selected as a baseline model due to its widespread use, GIS compatibility, and proven capability for 1D unsteady flow simulation in open-channel systems. It provides a reliable and well-established reference for flood extent and depth estimation, particularly in riverine or semi-urban environments. While not specifically developed for detailed urban modeling, its use supports methodological transparency and aligns with common practice in hydrodynamic validation.
Simulations used the same inflow hydrographs and terrain data as RiverFlow2D, serving as a benchmark for evaluating the performance of the BIM-integrated approach. Estimated rainfall intensities align with values reported in the literature (e.g., Mitsopoulos et al. [12]; Diakakis et al. [14]), while high-risk zones predicted by the model correspond closely to historically affected areas. The Soures and Agia Aikaterini floodplains exhibit strong spatial overlap between simulated and observed impact zones.
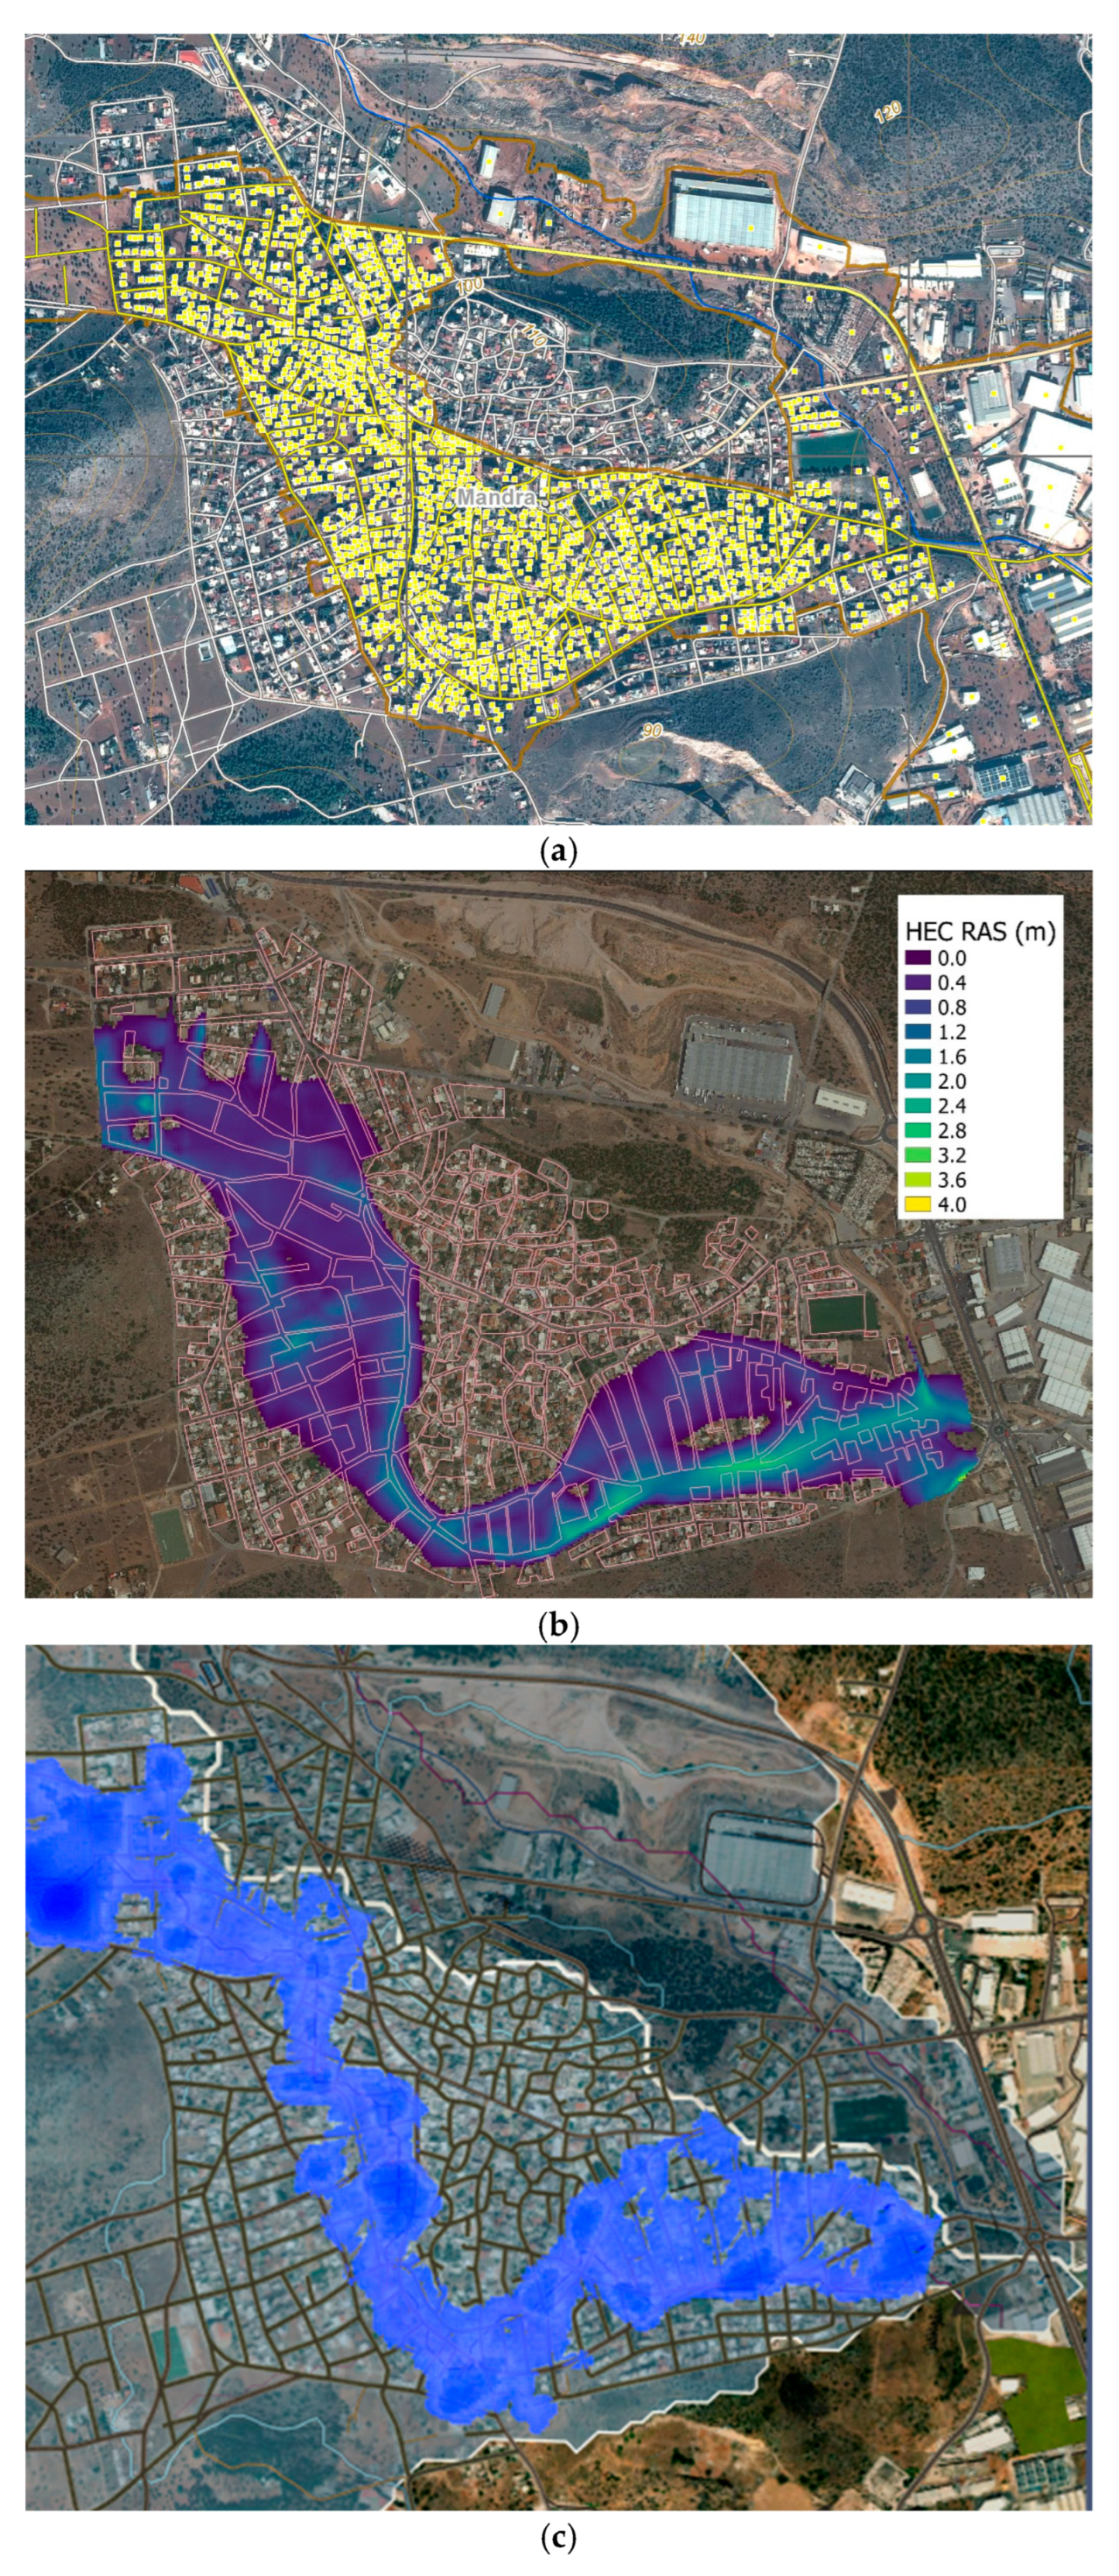
Figure 7 presents a comparative overview of flood extent simulations. More specifically, Figure 7a shows the Copernicus Emergency Management Service (EMS) output with the yellow area to indicate the flooded part of the city. Figure 7b presents the flooded area provided by HEC-RAS software [23]. Figure 7c exhibits the flood simulation output provided by Watershed-BIM. The comparison shows that all three processes generated broadly similar inundation patterns in terms of depth and velocity, though variations in accuracy were observed. Indicatively, at location 2 of Figure 6a, the observed flood depth was 2.60 m [23], while HEC-RAS predicted 2.02 m and Watershed-BIM estimated 2.30 m—indicating improved alignment with real conditions.
It should be noted that all three visualizations in Figure 7 (Copernicus EMS, HEC-RAS, and Watershed-BIM) serve primarily as qualitative illustrations of flood extent and severity. The CEMS product delineates general zones of potential damage without providing depth values. HEC-RAS includes a standardized depth annotation bar, and although its visualization does not allow for precise visual estimation of depth, exact values can be accessed through result tables or queried within the RAS Mapper environment. In the case of Watershed-BIM, no static color scale is displayed by default; instead, water depths are accessed interactively by pointing to specific locations within the model interface. This allows for high spatial accuracy during user interaction, even though the visualization itself offers only a rough visual impression of flood depth.
Further assessment of model accuracy is presented in Table 5, which summarizes results at eight reference locations using three standard metrics: Mean Absolute Error (MAE), Root Mean Squared Error (RMSE), and Mean Relative Error (MRE). The results indicate that Watershed-BIM consistently outperforms HEC-RAS in terms of error metrics across all eight reference locations. More specifically, the Mean Absolute Error (MAE) for Watershed-BIM was 0.250 m (with all values remaining below 0.30 m) compared to 0.374 m for HEC-RAS, while similar improvements were observed in RMSE and MRE values. These results suggest that the integrated modeling of terrain, infrastructure, and hydrology supports improved predictive performance—particularly in urban environments where built structures influence flow dynamics. Although the sample size does not support formal statistical significance testing, the spatial consistency of error reduction lends credibility to the method.
Regarding computational requirements, the simulations carried out using Autodesk tools (InfraWorks with RiverFlow2D) were performed on a workstation equipped with an Intel i5 processor and 16 GB RAM, with runtimes ranging between 20 and 45 min, depending on the rainfall duration and mesh resolution. Comparable runtimes can be expected when using open-source hydraulic software, although performance depends on model configuration and boundary condition complexity.
As part of the interpretation of the simulation results, the following remarks are presented to contextualize the quality of input data, assess model validation performance, and highlight the practical utility of the outputs for decision-making in urban flood risk management.
Although continuous discharge measurements were not available for the studied event, rainfall inputs were obtained from a combination of local meteorological stations and satellite-derived datasets (e.g., GPM IMERG). Field-based high-water mark observations served as critical reference points for model validation. This multi-source data strategy enabled a meaningful evaluation of simulation performance, particularly with respect to flood extent and water depth. Nevertheless, future applications of the Watershed-BIM framework could be further enhanced through the integration of continuous flow data, which would improve the temporal resolution and physical realism of the simulations.
The output of the Watershed-BIM simulations provides only descriptive flood characteristics and actionable insights for targeted mitigation planning. For example, the visualization of flow direction and velocity around critical facilities—such as the school shown in Figure 6b—allows urban planners to identify optimal locations for installing temporary or permanent flood barriers. Additionally, these flow paths inform the prioritization of drainage upgrades and the definition of safe evacuation routes, enhancing emergency preparedness. Thus, the integration of hydrodynamic simulation with spatial infrastructure modeling offers direct guidance for adaptive, site-specific interventions.
Further, although velocity and duration measurements were not available for direct comparison, qualitative validation through flow vector visualizations (Figure 6) supports the internal consistency and hydrodynamic realism of the model outputs. The improved accuracy is attributed to the integration of spatially distributed hydrologic inputs, refined terrain representation, and infrastructure-level detail.
Efforts to integrate Building Information Modeling (BIM) with hydrological and hydraulic simulation have led to the development of several complementary approaches, each emphasizing different aspects of the urban flood modeling process. For instance, the CityGML + TUFLOW methodology leverages rich 3D city models and geospatial analytics to deliver high spatial accuracy, particularly in surface flow simulations. However, it often requires advanced GIS expertise and involves relatively complex setup procedures, making it more suitable for research or high-resolution studies. On the other hand, combinations such as InfraWorks with RiverFlow2D emphasize rapid design, intuitive visualization, and integration within commercial platforms—offering accessible workflows but sometimes at the cost of flexibility or open-data compatibility.
In this landscape, Watershed-BIM introduces a balanced, application-oriented alternative that bridges precision and usability. Unlike approaches that focus solely on either surface or subsurface systems, it supports both domains through cohesive integration of terrain data, drainage networks, and infrastructure models within a BIM-native environment. Its interoperability with open standards such as IFC and 700 facilitates data consistency, while its use of tools like Civil 3D and InfraWorks streamlines the entire process from model setup to simulation and visualization. Importantly, it avoids raster-based simplifications, maintaining geometric fidelity and enabling direct interaction with design data.
Rather than competing with established tools on singular technical features, Watershed-BIM adds value by synthesizing them into a reproducible and adaptable workflow tailored to urban flood resilience. Its practical implementation in the Mandra flood case study demonstrates how such integration can lead to scenario-specific insights and inform adaptive planning decisions. As integrated flood modeling continues to mature, approaches like Watershed-BIM show potential to democratize access to detailed simulations, enabling broader use by municipalities and engineering teams beyond highly specialized research environments.
The practical deployment of the Watershed-BIM methodology reveals a number of technical, institutional, and standardization-related challenges. The following section outlines key implementation challenges and proposes directions for future deployment based on the observed weaknesses and opportunities:
One of the primary technical hurdles relates to the limited interoperability between design and analysis platforms, especially when handling large-scale BIM models or customized geospatial data. While the use of open formats (e.g., IFC, SHP) facilitates exchange, the absence of widely adopted conventions for terrain modeling and drainage infrastructure still poses integration issues. For instance, while IFC specifications support many aspects of built infrastructure, they provide only partial coverage of topographic features and hydraulic elements, necessitating ad hoc extensions or manual processing.
At the institutional level, smaller municipalities often face limited technical capacity or insufficient personnel training to adopt and maintain BIM- or GIS-enabled workflows. The transition from static 2D flood mapping to dynamic, infrastructure-aware modeling entails not only software upgrades but also rethinking coordination protocols between urban planning, civil engineering, and emergency response teams. This systemic shift is further complicated by data availability constraints, regulatory fragmentation, and unclear mandates regarding digital infrastructure management.
From a deployment perspective, the development of semi-automated workflows and the adoption of streamlined data exchange protocols are critical to scaling the methodology. Future directions may include the incorporation of standardized domain extensions (e.g., IFC for terrain and hydrology), cloud-based interfaces for collaborative scenario analysis, and training resources tailored for local authorities. These developments can help bridge the gap between research prototypes and operational adoption, making the framework more accessible to a broader range of urban and regional stakeholders.

5. Discussion

5.1. Methodological Contributions and Comparative Insights

Effective urban flood management increasingly requires integrative tools capable of capturing the dynamic interactions between hydrological processes and built infrastructure. Traditional methods—such as HEC-RAS for riverine modeling or GIS/BIM platforms for spatial representation—are often used in isolation, limiting their capacity to simulate runoff behavior in dense urban environments.
Within this context, Watershed-BIM proved especially effective in simulating localized flow patterns around critical infrastructure. The integration of terrain variability, building geometry, and drainage connectivity allows the model to capture flow dynamics with high spatial fidelity. Visual outputs—such as those presented for the school complex in Figure 6b—facilitate actionable planning decisions by indicating vulnerable areas and supporting the strategic placement of flood barriers, identification of critical drainage nodes, and definition of safe evacuation routes.
Model validation was conducted using a mixed-data strategy that combined rainfall inputs from local meteorological stations and satellite-based datasets (e.g., GPM IMERG) with high-water mark observations from the 2017 Mandra flood. Although continuous discharge records were not available, peak discharge estimates from the literature (e.g., Mitsopoulos et al. [12]) were used to support quantitative comparisons. This approach enabled a consistent evaluation of flood extent and depth, while future implementations could benefit from the incorporation of real-time flow monitoring for enhanced calibration and temporal resolution.
The proposed methodology contributes to current research by circumventing structural constraints encountered in conventional flood modeling tools. Compared to widely used platforms such as HEC-RAS or SWMM, which are effective for 1D/2D hydraulic simulations but do not natively support 3D infrastructure modeling or realistic urban geometry, Watershed-BIM integrates hydrodynamic simulation with three-dimensional representations of roads, buildings, and drainage networks. This allows for a more faithful representation of flow behavior in complex urban environments, where built structures play an active role in redirecting or obstructing floodwaters.
Unlike HEC-RAS, where infrastructure is introduced indirectly through terrain manipulation or classified land use, Watershed-BIM enables direct geometric modeling of critical features, facilitating the simulation of infrastructure-scale interactions—such as water accumulation around buildings or overtopping of curbs. Similarly, TNTmips, while well suited for terrain modeling and raster analysis, is not typically used for dynamic hydraulic simulations or infrastructure-level visualization.
What sets Watershed-BIM apart is its ability to couple 2D flood dynamics with infrastructure-aware modeling in a seamless workflow, using open-standard formats (e.g., IFC, SHP, DWG) that promote interoperability across platforms and disciplines. In this way, it not only enhances modeling realism but also improves the communicability of flood risks, supporting decision-making across technical and non-technical audiences. The method does not aim to replace existing tools but rather complements them in applications where detailed urban representation, multi-scale integration, and visual clarity are essential, especially for planning, stakeholder engagement, and resilience strategy design.
Although applied in a medium-scale urban setting, the framework was designed with scalability in mind. Its modular architecture supports deployment in larger and more complex environments, including coastal or densely populated megacities. These contexts introduce additional modeling challenges—such as multi-hazard exposure, infrastructure interdependence, and tidal influences—that will be the focus of future research.
Building on this point, the integration of real-time sensor networks is a key direction for future development. Rainfall gauges, water level sensors, and IoT-connected flow meters can be incorporated to enable dynamic model updates and transition the framework from static scenario analysis to real-time flood forecasting and early warning applications.
Looking further ahead, the framework also lends itself to long-term scenario testing under changing climatic conditions. Hydrological inputs derived from Representative Concentration Pathways (RCPs) and regional climate models (RCMs) can be incorporated to simulate extreme rainfall events under future climate regimes. This enables the assessment of infrastructure resilience and the planning of adaptive interventions under increased uncertainty.
In parallel, the accessibility and broader deployment of the methodology—particularly in cost-sensitive settings—can be enhanced by integrating open-source tools. Simulation engines such as SWMM and LISFLOOD offer transparent, community-supported platforms that can be combined with Watershed-BIM’s spatial capabilities. While these tools may offer lower spatial resolution or reduced 3D integration, they enable flexible and affordable hybrid configurations.
To ensure that simulation results inform actionable decision-making, participatory co-design processes will be incorporated in future implementations. The 3D visualization features of Watershed-BIM facilitate stakeholder engagement by offering intuitive representations of flood risk. Through workshops and feedback sessions with planners, emergency responders, and community representatives, model assumptions can be refined, and mitigation strategies can be collaboratively developed.
Harmonization of modeling workflows across regions also remains a relevant objective. While urban floods are inherently local in nature, standardizing simulation protocols and data structures enables comparability across cities and fosters the development of consistent risk assessment methodologies. Importantly, this does not imply uniform national strategies, but rather a flexible framework that accommodates local conditions while supporting regional coordination.
Institutional integration is equally critical. Embedding such frameworks into local governance mechanisms—such as urban planning departments or municipal risk management offices—can facilitate the operationalization of model outputs into strategic actions. The role of local authorities, particularly at the level of municipal leadership, is central to mobilizing resources, coordinating stakeholders, and implementing risk mitigation measures.
At a broader level, the methodology aligns with ongoing transitions toward sustainability and digital innovation. As emphasized in recent policy reports (e.g., EEA, 2016 [38]), climate resilience requires the convergence of technological, institutional, and social dimensions. Watershed-BIM supports this transition by providing a technical basis for more inclusive, locally informed, and forward-looking urban planning strategies.
Finally, while legacy tools such as HEC-RAS have reached a high level of maturity, BIM-based flood modeling remains in a relatively early stage of development. Nonetheless, its potential to transform how flood risk is simulated, visualized, and operationalized is notable. As research advances and technical maturity improves, frameworks like Watershed-BIM can serve as important testbeds for the integration of hydrodynamics, infrastructure design, and adaptive planning. This trajectory underscores their value not only as analytical tools but also as enablers of resilient and sustainable urban transformation.

5.2. Pathways for Further Development

While the Watershed-BIM methodology offers notable advantages for urban flood simulation, certain methodological considerations warrant further attention. First, the validation of simulation outputs was constrained by data availability. Continuous discharge measurements were not accessible, and peak flow estimates relied on secondary literature and post-event documentation. Although high-water marks and satellite-based rainfall data (e.g., GPM IMERG) provided robust support for model calibration, future implementations would benefit from real-time flow monitoring to enhance temporal accuracy and validation robustness.
Second, infiltration processes were parameterized using runoff coefficients rather than derived directly from soil or land use data. While this is a common approach in urban hydrology, it introduces simplifications that may not fully capture spatial heterogeneity in infiltration capacity, particularly in peri-urban or vegetated zones.
Third, the current implementation is best suited for highly urbanized environments with available BIM/GIS datasets. Its applicability in rural areas or in regions with limited infrastructure representation may be limited. Similarly, the framework assumes a certain degree of urban regularity (e.g., delineated road networks and building parcels), which may not exist in informal settlements or heterogeneous morphologies.
Lastly, while the framework is extensible in principle, further development is needed to accommodate additional hydraulic processes such as sediment transport or groundwater interaction. Addressing these aspects would support more comprehensive flood risk analysis across scales and typologies.
Future research could further extend the Watershed-BIM framework by integrating flood loss estimation tools (e.g., HAZUS-MH). Linking hydraulic outputs with building-level vulnerability and asset data would enable direct estimation of economic losses and support cost–benefit analyses of mitigation measures, enhancing the practical value of the methodology for policy and emergency planning.

6. Conclusions

The Watershed-BIM methodology introduces an integrated, multi-scalar framework that bridges watershed-scale hydrology, infrastructure-level modeling, and three-dimensional visualization. By addressing specific shortcomings of conventional flood modeling—such as fragmented workflows, simplified terrain representation, and lack of infrastructure awareness—it enhances the accuracy and applicability of urban flood risk analysis.
Applied to the flood-prone area of Mandra, Greece, the methodology demonstrated improved predictive performance, with validation results showing a Mean Absolute Error (MAE) below 0.30 m (at an average flood depth of 2.20 m) and consistent spatial agreement with field-observed high-water marks. The ability to capture localized flow behavior around buildings, roads, and critical facilities—such as schools—offers valuable insights for scenario-based planning, infrastructure resilience assessment, and emergency preparedness.
The framework leverages the combined capabilities of InfraWorks, Civil 3D, and RiverFlow2D, enabling seamless integration of GIS layers, hydrologic modeling, and 3D infrastructure representation. Compared to traditional 1D/2D tools, Watershed-BIM improves spatial resolution and supports building-level analysis within an interoperable, design-aware environment. Its reliance on open standards (e.g., IFC, SHP) and compatibility with open-source tools such as QGIS, HEC-HMS, or SWMM, further enhance its adaptability across institutional contexts and budgetary constraints.
Despite its strengths, certain challenges remain that merit further refinement. These include dependency on data availability (e.g., high-resolution DEMs, continuous flow records), potential simplifications in hydrological parameterization, and the need for interdisciplinary expertise to operate hybrid BIM-GIS workflows. Furthermore, the current implementation does not incorporate processes such as sediment transport, subsurface flow, or dynamic soil moisture modeling—components that could enhance realism under specific conditions.
Future directions include the automation of data preparation pipelines (e.g., mesh generation from IFC/SHP), incorporation of sensor-based inputs for real-time analysis, and integration with standardized loss estimation models such as HAZUS-MH to quantify economic impacts. Additionally, participatory co-design processes and stakeholder-driven visualization could increase the framework’s practical utility in decision-making.
Overall, Watershed-BIM offers a robust and scalable platform for infrastructure-aware flood modeling, with strong potential to inform adaptive strategies for urban resilience under evolving climatic, hydrologic, and urban development conditions.

Author Contributions

Conceptualization, P.T. and A.C.; methodology, P.T. and A.C.; software, P.T.; validation, P.T. and V.P.; formal analysis, P.T., A.C., and V.P.; investigation, P.T., and V.P.; resources, A.C.; data curation, P.T., and V.P.; writing—original draft preparation, P.T., and V.P.; writing—review and editing, P.T., A.C., and V.P.; visualization, P.T., A.C., and V.P.; supervision, A.C.; project administration, P.T. and A.C.; funding acquisition, N/A. All authors have read and agreed to the published version of the manuscript.

Funding

This research received no external funding.

Institutional Review Board Statement

Not applicable.

Informed Consent Statement

Not applicable.

Data Availability Statement

The data that were developed and used in this study will be made available by the authors upon request.

Conflicts of Interest

The authors declare no conflicts of interest.

References

  1. Dharmarathne, G.; Waduge, A.O.; Bogahawaththa, M.; Rathnayake, U.; Meddage, D.P.P. Adapting Cities to the Surge: A Comprehensive Review of Climate-Induced Urban Flooding. Results Eng. 2024, 22, 102123. [Google Scholar] [CrossRef]
  2. Diakakis, M.; Boufidis, N.; Salanova Grau, J.M.; Andreadakis, E.; Stamos, I. A Systematic Assessment of the Effects of Extreme Flash Floods on Transportation Infrastructure and Circulation: The Example of the 2017 Mandra Flood. Int. J. Disaster Risk Reduct. 2020, 47, 101542. [Google Scholar] [CrossRef]
  3. Khoshkonesh, A.; Nazari, R.; Nikoo, M.R.; Karimi, M. Enhancing Flood Risk Assessment in Urban Areas by Integrating Hydrodynamic Models and Machine Learning Techniques. Sci. Total Environ. 2024, 952, 175859. [Google Scholar] [CrossRef]
  4. Cepa, J.J.; Pavón, R.M.; Alberti, M.G.; Ciccone, A.; Asprone, D. A Review on the Implementation of the BIM Methodology in the Operation Maintenance and Transport Infrastructure. Appl. Sci. 2023, 13, 3176. [Google Scholar] [CrossRef]
  5. Ding, Z.; Xu, S.; Xie, X.; Zheng, K.; Wang, D.; Fan, J.; Li, H.; Liao, L. A Building Information Modeling-Based Fire Emergency Evacuation Simulation System for Large Infrastructures. Reliab. Eng. Syst. Saf. 2024, 244, 109917. [Google Scholar] [CrossRef]
  6. Pelden, S.; Banihashemi, S.; Mohandes, S.R.; Arashpour, M.; Kalantari, M. Enhancing Infrastructure Planning and Design through BIM-GIS Integration. Struct. Infrastruct. Eng. 2025, 1–20. [Google Scholar] [CrossRef]
  7. Jongman, B.; Kreibich, H.; Apel, H.; Barredo, J.I.; Bates, P.D.; Feyen, L.; Gericke, A.; Neal, J.; Aerts, J.C.J.H.; Ward, P.J. Comparative Flood Damage Model Assessment: Towards a European Approach. Nat. Hazards Earth Syst. Sci. 2012, 12, 3733–3752. [Google Scholar] [CrossRef]
  8. Bernhofen, M.V.; Cooper, S.; Trigg, M.; Mdee, A.; Carr, A.; Bhave, A.; Solano-Correa, Y.T.; Pencue-Fierro, E.L.; Teferi, E.; Haile, A.T.; et al. The Role of Global Data Sets for Riverine Flood Risk Management at National Scales. Water Resour. Res. 2022, 58, e2021WR031555. [Google Scholar] [CrossRef]
  9. Alabbad, Y.; Yildirim, E.; Demir, I. A Web-Based Analytical Urban Flood Damage and Loss Estimation Framework. Environ. Model. Softw. 2023, 163, 105670. [Google Scholar] [CrossRef]
  10. Cea, L.; Costabile, P. Flood Risk in Urban Areas: Modelling, Management and Adaptation to Climate Change: A Review. Hydrology 2022, 9, 50. [Google Scholar] [CrossRef]
  11. Soulios, G.; Stournaras, G.; Nikas, K.; Mattas, C. The Floods in Greece: The Case of Mandra in Attica. Bull. Geol. Soc. Greece 2018, 52, 131. [Google Scholar] [CrossRef]
  12. Mitsopoulos, G.; Diakakis, M.; Panagiotatou, E.; Sant, V.; Bloutsos, A.; Lekkas, E.; Baltas, E.; Stamou, A.I. ‘How Would an Extreme Flood Have Behaved If Flood Protection Works Were Built?’ The Case of the Disastrous Flash Flood of November 2017 in Mandra, Attica, Greece. Urban Water J. 2022, 19, 911–921. [Google Scholar] [CrossRef]
  13. Varlas, G.; Anagnostou, M.N.; Spyrou, C.; Papadopoulos, A.; Kalogiros, J.; Mentzafou, A.; Michaelides, S.; Baltas, E.; Karymbalis, E.; Katsafados, P. A Multi-Platform Hydrometeorological Analysis of the Flash Flood Event of 15 November 2017 in Attica, Greece. Remote Sens. 2019, 11, 45. [Google Scholar] [CrossRef]
  14. Diakakis, M.; Deligiannakis, G.; Andreadakis, E.; Katsetsiadou, K.N.; Spyrou, N.I.; Gogou, M.E. How Different Surrounding Environments Influence the Characteristics of Flash Flood-Mortality: The Case of the 2017 Extreme Flood in Mandra, Greece. J. Flood Risk Manag. 2020, 13, e12613. [Google Scholar] [CrossRef]
  15. Speis, P.D.; Andreadakis, E.; Diakakis, M.; Daidassi, E.; Sarigiannis, G. Psychosocial Vulnerability and Demographic Characteristics in Extreme Flash Floods: The Case of Mandra 2017 Flood in Greece. Int. J. Disaster Risk Reduct. 2019, 41, 101285. [Google Scholar] [CrossRef]
  16. Khan, I.; Lei, H.; Shah, A.A.; Khan, I.; Muhammad, I. Climate Change Impact Assessment, Flood Management, and Mitigation Strategies in Pakistan for Sustainable Future. Environ. Sci. Pollut. Res. 2021, 28, 29720–29731. [Google Scholar] [CrossRef]
  17. Devia, G.K.; Ganasri, B.P.; Dwarakish, G.S. A Review on Hydrological Models. Aquat. Procedia 2015, 4, 1001–1007. [Google Scholar] [CrossRef]
  18. Yu, C.; Duan, J. Simulation of Surface Runoff Using Hydrodynamic Model. J. Hydrol. Eng. 2017, 22, 04017006. [Google Scholar] [CrossRef]
  19. Teng, J.; Jakeman, A.J.; Vaze, J.; Croke, B.F.W.; Dutta, D.; Kim, S. Flood Inundation Modelling: A Review of Methods, Recent Advances and Uncertainty Analysis. Environ. Model. Softw. 2017, 90, 201–216. [Google Scholar] [CrossRef]
  20. Banks, J.C.; Camp, J.V.; Abkowitz, M.D. Adaptation Planning for Floods: A Review of Available Tools. Nat. Hazards 2014, 70, 1327–1337. [Google Scholar] [CrossRef]
  21. Zischg, J.; Goncalves, M.L.R.; Bacchin, T.K.; Leonhardt, G.; Viklander, M.; Van Timmeren, A.; Rauch, W.; Sitzenfrei, R. Info-Gap Robustness Pathway Method for Transitioning of Urban Drainage Systems under Deep Uncertainties. Water Sci. Technol. 2017, 76, 1272–1281. [Google Scholar] [CrossRef]
  22. Chen, W.; Wang, W.; Huang, G.; Wang, Z.; Lai, C.; Yang, Z. The Capacity of Grey Infrastructure in Urban Flood Management: A Comprehensive Analysis of Grey Infrastructure and the Green-Grey Approach. Int. J. Disaster Risk Reduct. 2021, 54, 102045. [Google Scholar] [CrossRef]
  23. Bellos, V.; Kourtis, I.; Raptaki, E.; Handrinos, S.; Kalogiros, J.; Sibetheros, I.A.; Tsihrintzis, V.A. Identifying Modelling Issues through the Use of an Open Real-World Flood Dataset. Hydrology 2022, 9, 194. [Google Scholar] [CrossRef]
  24. Kelesoglu, M.K.; Temur, R.; Gülbaz, S.; Memisoglu Apaydin, N.; Kazezyılmaz-Alhan, C.M.; Bozbey, I. Site Assessment and Evaluation of the Structural Damages after the Flood Disaster in the Western Black Sea Basin on August 11, 2021. Nat. Hazards 2023, 116, 587–618. [Google Scholar] [CrossRef]
  25. Nkwunonwo, U.C.; Whitworth, M.; Baily, B. A Review of the Current Status of Flood Modelling for Urban Flood Risk Management in the Developing Countries. Sci. Afr. 2020, 7, e00269. [Google Scholar] [CrossRef]
  26. Salvadore, E.; Bronders, J.; Batelaan, O. Hydrological Modelling of Urbanized Catchments: A Review and Future Directions. J. Hydrol. 2015, 529, 62–81. [Google Scholar] [CrossRef]
  27. Rong, Y.; Zhang, T.; Zheng, Y.; Hu, C.; Peng, L.; Feng, P. Three-Dimensional Urban Flood Inundation Simulation Based on Digital Aerial Photogrammetry. J. Hydrol. 2020, 584, 124308. [Google Scholar] [CrossRef]
  28. Rydvanskiy, R.; Hedley, N. 3d Geovisualization Interfaces as Flood Risk Management Platforms: Capability, Potential, and Implications for Practice. Cartographica 2020, 55, 281–290. [Google Scholar] [CrossRef]
  29. Amirebrahimi, S.; Rajabifard, A.; Mendis, P.; Ngo, T. A BIM-GIS Integration Method in Support of the Assessment and 3D Visualisation of Flood Damage to a Building. J. Spat. Sci. 2016, 61, 317–350. [Google Scholar] [CrossRef]
  30. Kangwa, K.; Mwiya, B. Flood Simulation with GeoBIM. In Smart and Resilient Infrastructure for Emerging Economies: Perspectives on Building Better; CRC Press: Boca Raton, FL, USA, 2023; pp. 90–98. [Google Scholar] [CrossRef]
  31. Jang, Y.H.; Park, S.I.; Kwon, T.H.; Lee, S.H. CityGML Urban Model Generation Using National Public Datasets for Flood Damage Simulations: A Case Study in Korea. J. Environ. Manag. 2021, 297, 113236. [Google Scholar] [CrossRef]
  32. Wang, C.; Hou, J.; Miller, D.; Brown, I.; Jiang, Y. Flood Risk Management in Sponge Cities: The Role of Integrated Simulation and 3D Visualization. Int. J. Disaster Risk Reduct. 2019, 39, 101139. [Google Scholar] [CrossRef]
  33. Liu, H.; Su, H.; Li, H. Study on Digital Twin Technologies for Watershed Information Modeling (WIM): A Systematic Literature Review and Bibliometric Analysis. Arch. Comput. Methods Eng. 2024, 31, 263–289. [Google Scholar] [CrossRef]
  34. Yang, Y.; Ng, S.T.; Dao, J.; Zhou, S.; Xu, F.J.; Xu, X.; Zhou, Z. BIM-GIS-DCEs Enabled Vulnerability Assessment of Interdependent Infrastructures—A Case of Stormwater Drainage-Building-Road Transport Nexus in Urban Flooding. Autom. Constr. 2021, 125, 103626. [Google Scholar] [CrossRef]
  35. Syed Abdul Rahman, S.A.F.; Abdul Maulud, K.N.; Wan Mohd Jaafar, W.S. BIM-GIS in Catalyzing 3D Environmental Simulation. In Advances in Geoinformatics Technologies: Facilities and Utilities Optimization and Management for Smart City Applications; Springer: Berlin/Heidelberg, Germany, 2024; pp. 183–200. [Google Scholar]
  36. Ajmar, A.; Boccardo, P.; Broglia, M.; Kucera, J.; Giulio-Tonolo, F.; Wania, A. Response to Flood Events: The Role of Satellite-based Emergency Mapping and the Experience of the Copernicus Emergency Management Service. In Flood Damage Survey and Assessment: New Insights from Research and Practice; Wiley: Hoboken, NJ, USA, 2017; pp. 211–228. [Google Scholar]
  37. Pennsylvania Department of Transportation. PennDOT Drainage Manual; Pennsylvania Department of Transportation: Harrisburg, PA, USA, 2008. [Google Scholar]
  38. European Environment Agency. Urban Adaptation to Climate Change in Europe 2016: Transforming Cities in a Changing Climate; EEA Report No. 12/2016; Publications Office of the European Union: Luxembourg, 2016; Available online: https://www.eea.europa.eu/publications/urban-adaptation-2016 (accessed on 1 June 2025).
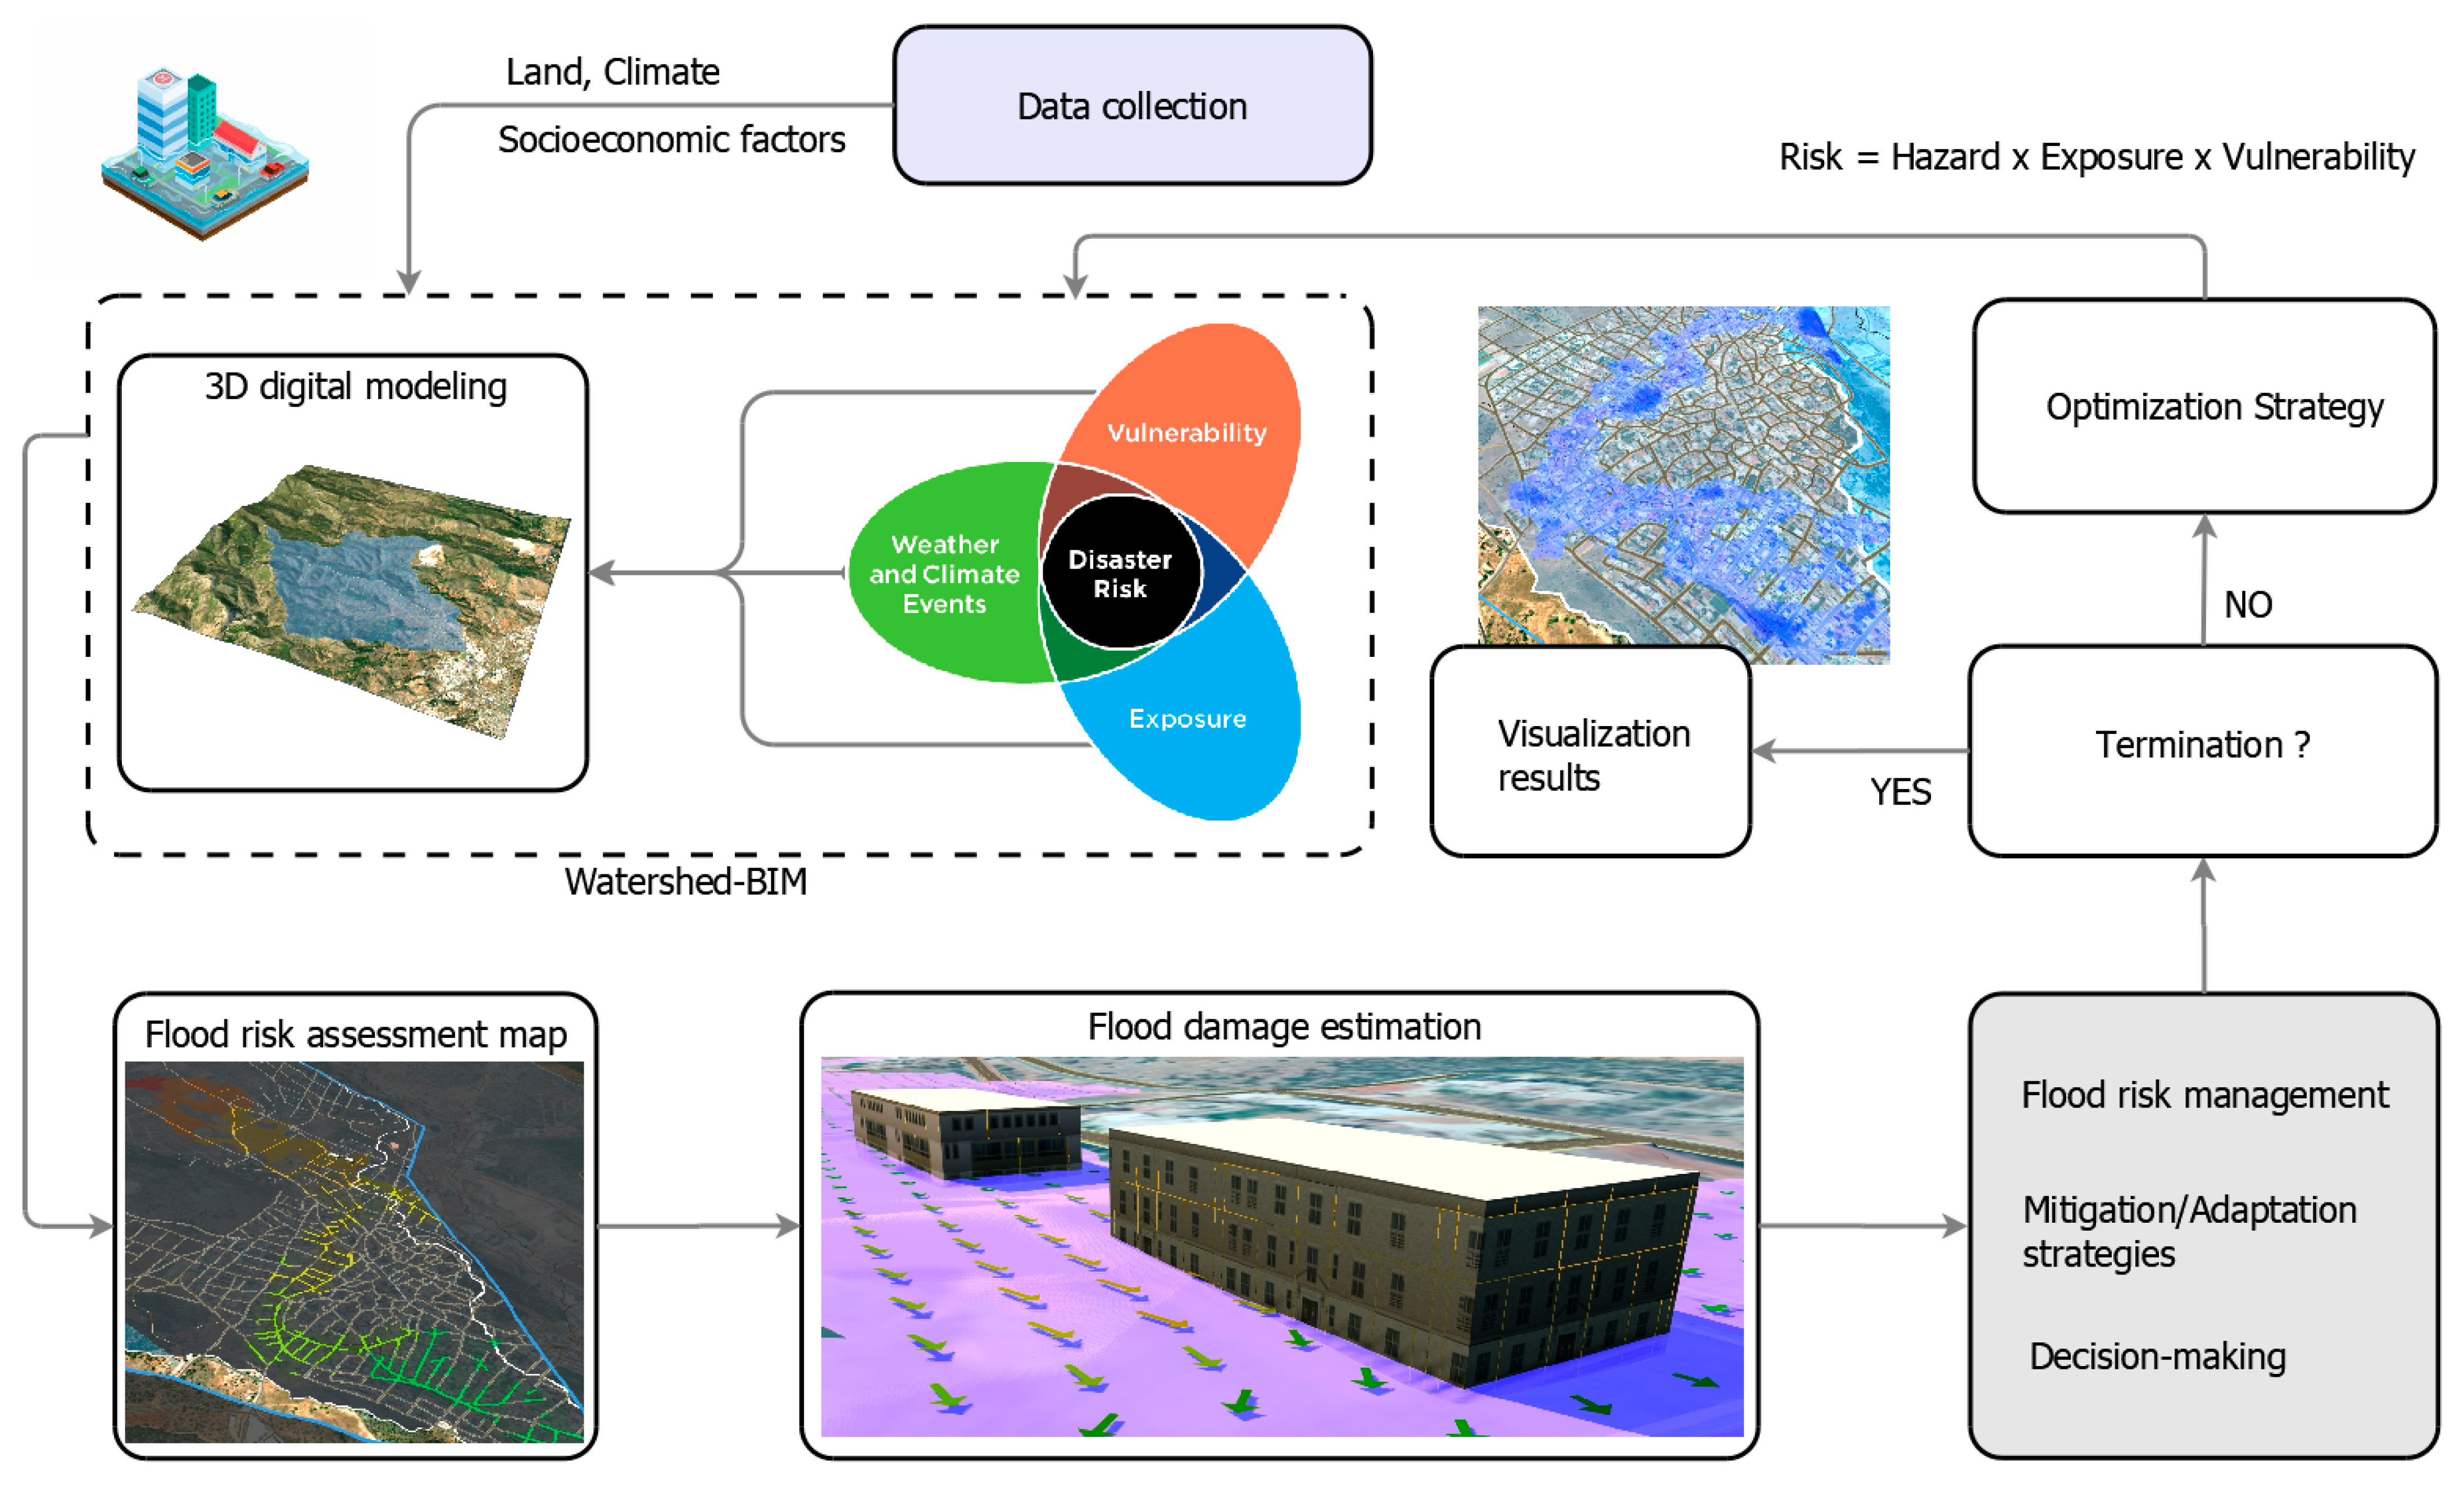
Figure 1. Flood risk management framework.
Sustainability 17 07687 g001
Figure 2. Watershed-BIM 3D modeling of an area.
Sustainability 17 07687 g002
Figure 3. Flood analysis using GIS (a) watershed areas, (b) watershed streams.
Sustainability 17 07687 g003
Figure 4. Watershed-BIM plan view modeling of the study area.
Sustainability 17 07687 g004
Figure 5. (a) The Mandra region developed in BIM software (InfraWorks 2024). (b) Triangulated Irregular Network (TIN) mesh of the urban layout (location 38.072646, 23.496687).
Sustainability 17 07687 g005
Figure 6. Flood simulation output: (a) general view of Mandra, (b) close-ups at selected locations, indicated by numbers 1 and 2 in the whole city view.
Sustainability 17 07687 g006
Figure 7. Flood simulation results via (a) Copernicus Emergency Management Service (EMS) (b) HEC-RAS flood results [23], (c) Watershed-BIM flood results.
Sustainability 17 07687 g007
Table 2. Comparative evaluation of traditional flood modeling (HEC-RAS) and Watershed-BIM (WIM) characteristics.
CharacteristicHEC-RAS WIM (InfraWorks/Civil 3D/RiverFlow2D)
Digital terrain model2D with limited 3D visualization3D with detailed topography integration
Built environment simulationIndirect (via terrain or land use classification)Explicit modeling of buildings and infrastructure
Road network simulationIndirect (through terrain modifications)Yes
Hydraulic network simulationOpen-channel systems; limited for closed drainageYes (drainage, pipelines via SSA)
Watershed delineationManual or GIS-based pre-processingSemi-automatic (GIS + BIM integration)
Hydrological characteristicsYes (requires external data input, HEC-HMS)Yes (integrated with spatial layers)
Flood simulation robustnessRobust for riverine flooding; limited urban detailHolistic (terrain, buildings, infrastructure, costs)
InteroperabilityHigh (SHP, GeoTIFF, RAS Mapper, GIS tools)High (BIM, GIS, DEM, IFC)
Impact assessment on infrastructureApproximate (based on land use, depth maps)Multi-scenario, building-level and infrastructure-aware
Measurement capabilitiesStandard hydraulic outputsEnhanced spatial and structural detail
City-level analysisLimited urban infrastructure interactionFull integration with city-scale models
Overall analysis accuracyModerate to high (depends on input quality)High (multi-layer parameter integration)
Big data managementTerrain and hydro datasetsMulti-dimensional (terrain, hydrology, BIM data)
Result visualizationMainly 2D (basic 3D via GIS)Advanced 3D visualization and animation
Ease of useModerate (user-friendly interface)Moderate to complex (requires BIM/GIS expertise)
Software costFreeHigh (commercial licenses)
Table 3. Calculation of rainfall duration for Mandra flood.
WatershedAd [km2]L [km]Hmref [m]Href [m]tc [h]
Agia Aikaterini22.6412.35431.8457.002.43
Soures19.5112.56571.5659.102.02
Table 4. Rainfall intensity and flood discharge at different return periods.
WatershedT= 50 YearsT= 100 YearsT= 500 Years
i [mm/h]Q [m3/s]i [mm/h]Q [m3/s]i [mm/h]Q [m3/s]
Agia Aikaterini79.70175.5791.59201.76123.50272.06
Soures87.13165.41100.13190.07135.02256.30
Table 5. Comparison of observed and simulated flood depths with validation metrics.
φλObserved [m]HEC-RAS [m]W-BIM [m]
38.0738487123.496790882.402.062.11
38.0731002923.496729091.902.202.04
38.0725501923.496838422.602.022.30
38.0711917723.496448632.442.922.76
38.0708746123.496925172.802.352.41
38.0701673223.497959082.432.542.45
38.0709588123.501752451.562.081.97
38.0711889623.502854091.551.341.42
Mean Absolute Error—MAE0.3740.250
Root Mean Squared Error—RMSE0.4030.281
Mean Relative Error—MRE0.1720.115
Disclaimer/Publisher’s Note: The statements, opinions and data contained in all publications are solely those of the individual author(s) and contributor(s) and not of MDPI and/or the editor(s). MDPI and/or the editor(s) disclaim responsibility for any injury to people or property resulting from any ideas, methods, instructions or products referred to in the content.